
Submitted:
18 December 2023
Posted:
19 December 2023
You are already at the latest version
Abstract
The presence of the mite, Varroa destructor, requires the use of acaricide treatments in most honeybee colonies. Amitraz is one of the most common acaricide substances used by beekeepers. Some Varroa mite populations have developed resistance to amitraz leading to a loss of efficacy of amitraz-based treatments. Two products, Apivar and Supatraz were applied in the same apiary. Both treatments are amitraz-based but have a different galenics. Thanks to field data, a dynamic model was used to simulate the action of Apivar and Supatraz on the mite population. We consider two parameters to compare the products: daily mortality rate and treatment duration. In the field, the percentage of efficacy between the two products was not significantly different but Supatraz kills mite faster and decreases 90% of the mite infestation in 28.4 days compared to 50.9 days for Apivar. Thanks to modelling, we showed the daily impact of the two different products on mite population. Supatraz has a higher daily mortality rate during the first two weeks than Apivar. Supatraz requires a lower efficacy to stabilize the varroa mite population due to its faster release of active ingredient than Apivar, needing a shorter period to achieve the same result. Depending on the model, Supatraz conserve a good efficacy for low resistant mites but not for high resistant mites. These results show that the comparison of the efficacy of two products with different characteristics (duration of treatment and daily mortality rate) should be analyzed with caution.
Keywords:
Apis mellifera
; beekeeping
; Apivar
; Supatraz
; Modeling
; Resistance
; Efficacy
; Treatment
1. Introduction
Varroa destructor is an ectoparasite mite of the honeybee (Anderson and Trueman 2000). It is responsible for varroosis in honeybee colonies via virus spread (Beaurepaire et al. 2020; Traynor et al. 2020). Today, beekeepers must integrate varroa management to limit colony collapses. The control methods are acaricides or zootechnical methods (Rosenkranz et al. 2010). Treatments should be sufficiently effective to significantly reduce varroa infestation from year to year. However, a result of the frequent use of synthetic acaricide is the development of resistance to the acaricide substance by varroa mites (Roth et al. 2020). Resistance to tau-fluvalinate, flumethrin, coumaphos and amitraz was detected in the laboratory (Almecija et al. 2020; Elzen et al. 2000; Kamler et al. 2016; Maggi et al. 2008; Milani 1995; Trouiller 1998) or in the field (Adjlane & Haddad. 2017; Rinkevich 2020; Trouiller 1998). For the moment, the synthetic acaricides are the most prone to resistances. Currently, no resistance to acaricides used in organic beekeeping has been demonstrated (Roth et al. 2020). Resistance development can come from different mechanisms: protein resistance or molecular resistance. For resistance to tau-fluvalinate, protein changes have been demonstrated through increases in detoxifying enzymes (Hillesheim et al. 1996). More recently, molecular resistance, such as target mutation, is also believed to be involved in the development of resistance to tau-fluvalinate (González-Cabrera et al. 2016; Millán-Leiva et al. 2021). The detection of amitraz resistance was demonstrated in the laboratory and in the field (Almecija et al. 2020; Kamler et al. 2016; Maggi et al. 2008; Rinkevich 2020). Metabolic resistance was the most discussed and although a mutation-type resistance of the target was not ruled out. Several studies on other mites are working on these hypotheses (Baron et al. 2018; Chen et al. 2007; Sungirai et al. 2018). But recently, target mutation resistance has been also discovered to explain varroa mite resistance to amitraz (Hernandez et al. 2021). Mutations were different between population from France (N87S) and United-States (Y215H). This discovery demonstrates the ability of the varroa mite to adapt according to its geographical area, as has been shown for tau-fluvalinate (Millan-Leiva et al. 2021a, Millan-Leiva et al. 2021b).
Beekeepers must therefore put in place control strategies to limit the development of resistance and maintain high treatment efficacy (Roth et al. 2020). Among these strategies, we find alternating control (alternation of acaricide substance over several years). Because of the loss efficacy, beekeepers are advised to let the treatment in the beehives for longer period. This practice could increase the risk of resistance. So, the struggle against resistance can be improved by the treatment efficacy to reduce treatment duration. For amitraz, several pharmaceutical treatments are available all around the world (Rosenkranz et al. 2010). Each treatment has different characteristics that influence the varroa population and its resistance to the acaricide substance: duration of treatment, amount of acaricide and galenic formulation. Long-term treatments increase the risk of developing resistance (FAO 2013). However, for varroa management, long-term treatments are most used due to varroa biology (brood breeding cycle) (Rosenkranz et al. 2010). In addition, the release of the active ingredient varies according to the galenic presentation. This variation in release could explain a different treatment action on the varroa population between treatments. The choice of products in addition to the choice of active ingredient may influence the efficacy and the development of resistance. A recent modelling study shows the influence of resistance on the loss of efficacy with Apivar® treatment (Almecija et al. 2021). However, the model will depend of the characteristic of the treatment used. So, the model has to be adapted to each product. Mechanistic model could allow to understand how treatment kill mites and the impact of loss efficacy on each type of treatment. From a mechanistic model, we will try to assess whether different products with the same active ingredient have different interactions in varroa mite management. Two points will be studied: 1) Duration of treatment and 2) Rate of falling dead mites. Two products will be compared in the same environment, Apivar® and Supatraz®. Modelling the action of treatments may help explain the differences in action between these two products and proposed a treatment action that would be optimal for reducing infestation by reducing treatment time.
2. Materials and methods
2.1. Mathematical modelling
The natural mite population dynamics model is derived from the model developed by Calis et al. (1999). The action of Apivar® treatment was added according to the model developed by Almecija et al. 2021. The R software was used for simulations and statistical analysis. The natural population dynamics of varroa is defined by Equation 1 (Almecija et al. 2021). The number of phoretic mites are represented by P(t). The variable I(t) corresponds to the number of mites infesting worker brood and E(t) corresponds to the number of mites emerging with young mature females. The number of individuals mites which died from natural mortality is given by M(t). Treatment effect on honeybee population dynamics is represented by an additional daily mortality. MT(t) is the global number of deaths (died from natural mortality and from mortality induced by the treatment. The treatment starts on the 7th of August for all simulations.
The action of the treatment depends on 3 parameters: duration of treatment, dT, daily mortality, kT and the level of initial infestations in the colony, Pi. The action of Apivar® treatment on the population can be simulated by a daily mortality rate, kT constant for the duration of treatment, kTAPIVAR (Almecija et al. 2021). The Apivar® treatment duration is 10 weeks (70 days) (as in MAID). The model had to be readjusted for the Supatraz® (amitraz) treatment which has different pharmacokinetic characteristics from Apivar®. Supatraz® is an 8-week treatment (56 days).
2.2. Efficacy determination
2.2. a. In the field
The efficacy monitoring methods is the standard European method. Efficacy monitoring was carried out in 2019 and 2020 on Apivar® and Supatraz® in an apiary of 30 beehives located in Nieul-sur-mer, France. Before treatment, mite infestation level was monitored to homogenize groups. In 2020, the efficacies of Apivar® and Supatraz® were followed respectively on 7 and 5 beehives. The colonies used were 6 frames nucs, so only one strip per colony was used. The strips were introduced into the colonies on August 26 and July 8, respectively, for the year 2019 and 2020. The characteristics of each treatment are presented in Table 1. During treatment, the number of dead mites which drop to the floor of the beehive are counted with sticky board every three days (Vtreatment).
At the end of the treatment, a control treatment is applied (Apistan® (Tau-fluvalinate)), killing the remaining mites (Vremaining). From this data a percentage of field treatment efficacy, EffFIELD is evaluated according to equation 2.
2.2. b. With the model
Our model replicates the protocol applied in the field to determine treatment efficacy (including control treatment). The model estimates the number of cumulative dead mites, McumMODEL(t) during treatment and control treatment (Equation 3). The treatment starts at day pT. The model simulates the efficacy of the treatment using the same protocol as in the field (Equation 4). The number of remaining mites according to the model, VremainingMODEL is evaluated through a simulation of a control treatment (with a daily efficiency of 90%). Efffield MODEL represents a simulation of the efficacy reproducing the protocol used in the field.
2.3. Validation of Supatraz® modelling
The Apivar® model was validated using data from efficacy monitoring in 2020 by the ADA AURA (Almecija et al. 2021). The model showed that Apivar® presents a constant daily mortality rate, kT, during treatment duration. Here, the model had to be adjusted to match the action of the Supatraz® treatment. Indeed, Supatraz® presents a daily mortality rate, kTSUPATRAZ, of 0.342 for the first week of treatment, and a variable value between 0.03 and 1 after one week of treatment.
The validation of the Supatraz modelling is based on efficacy monitoring conducted in 2019 and 2020 in Nieul-sur-mer (France). Two parameters were set: start of treatment (pT = August 7) and duration of treatment (dT = 8 weeks). The initial infestation, Pi is adjusted according to the number of dead mites during treatment (McumMODEL). The model is validated by comparing the slope of cumulative number of dead mites over the total duration of treatment between the field and the model. The slopes of cumulative dead mites during treatment are defined in the field as well as by the model. They are evaluated over the duration of treatment of 70 days for Apivar® and 56 days for Supatraz®.
2.4. Time to kill 90% of the mite population: L90.
Lethal time of 90% (LT90) represents the time required to kill 90% of the total varroa population. This period is evaluated from data from the field. It is evaluated by the ECOTOX package and the simulation of a GLM model tracing varroa mortality during treatment. LT90s are evaluated for Apivar® and Supatraz® in 2019 and 2020.
2.5. Influence of the proportion of resistant mites on the treatment efficacy.
The resistance in the mite population is modelized by a decrease of the daily mortality rate, kT. The decrease of kT corresponds to the proportion of resistant mites which are insensitive to treatment. The proportion of resistant mites remains stable and do not increase during the treatment. The percentage of efficacy is evaluated for 0%, 20%, 40%, 60% and 80% of resistant mites in the population for both treatments.
The amitraz resistance has different impact depending treatments: Apivar® or Supatraz®. Apivar® kills mites with a similar kT during all treatment. For Supatraz®, the resistance simulation is more complicated because of the inconstant kT. The reduction of kT to simulate resistance is not enough. The influence of resistance on the Supatraz® efficacy differs depending on two hypotheses: 1) The resistant mites are killed the first week with stable kT, 0.394. 2) The resistant mites are not killed the first week of treatment due to a high resistance ratio. In this hypothesis, the proportion of kT decrease in the same proportion than resistant mites.
3. Results
3.1. Field efficacy
The percentage of field efficacy is not significantly different between both treatments. (Mann-Whitney test, W=19, p=0.3 (2019) and W=12, p=0.43 (2020)). In 2019, the cumulative number of dead mites during treatment was not significantly different between the two treatments (Mann-Whitney test, W=35, n=11, p=0.35). The time required to kill 90% of the varroa population was significantly shorter for the Supatraz® treatment than for the Apivar® one in 2019 (Wilcoxon test, W=79, p=7.e-4) and in 2020 (Wilcoxon test, W=35, p=2.5e-3) (Table 1). Supatraz® acts faster than Apivar® (Figure 1 and Figure 2). Residual varroa counts are significantly lower for Supatraz® treated colonies (Mann-Whitney test, W=21, n=11, p=0.04). The same observations are made for the year 2020 (Table 2). The percentage of efficacy alone is not enough to explain the real field efficacy of the treatment.
3.2. Modelling efficacy
3.2. a Validation of Apivar® and Supatraz®
The model must represent the kinetics of mite drop during treatment to match reality. The action of Apivar® treatment was modelled in 2019 and 2020 on beehives followed by the ADA AURA (France) and APINOV in Nieul-sur-Mer (France). Maintaining the same parameter values, we represent the curve of the cumulative dead mites from the apiary in Nieul-sur-Mer (Figure 3).
The Figure 3 shows the number of mites that fell during treatment with Supatraz® in the field and with the model. The cumulative dead mites from the model corresponds to mites count in the field. Also, the 56-days slope is not significantly different between field and model data (Wilcoxon test, p=0.37).
3.2. b Stabilization of the mite population with Supatraz® and Apivar®.
Table 3 presents the different parameters to stabilize the varroa mite population for both products. The initial daily mortality rate kT is higher for Supatraz® than for Apivar®. According to the model, a percentage of 97.0% for Supatraz® is enough to stabilize the varroa population from year to year while Apivar® must have an efficacy of 98.77% (Almecija et al. 2021). The model shows that the number of dead mites during treatment would be lower for Supatraz® and the number of residual varroa would be higher. The model, free of all environmental factors, shows a less of a difference in the cumulative dead mites between Apivar® and Supatraz® than the mortalities observed in the field (Figure 1, Figure 2 and Figure 4). In this condition, both treatments present identical results on mite population: efficacy, LT90, number of dead mites.
3.3. Influence of decreasing efficacy on mite population
The Figure 5 presents the mite population curve during treatments application Apivar® and Supatraz® for a theoretical efficacy equal to 95% for both treatments. Supatraz® has a faster rate of action on the varroa population than Apivar® treatment, allowing to reduce the reproduction rate of varroa early in treatment. The mite population decreases faster with Supatraz® than Apivar® and the number of remaining mites is lower with Supatraz®. For a same percentage of efficacy, the products have different impacts on mite population.
The Table 4 presents the influence of both products on mite population depending on the percentage of efficacy. The LT90 is identical to values observed on the field (Table 2). For the same efficacy, the model shows that Supatraz® has fewer remaining mites, moreover the LT90s are shorter for Supatraz®.
3.4. Influence of resistant mites on the treatment efficacy
The Figure 6 and Figure 7 present the decrease of the efficacy when resistance increases in the mite population. With Apivar®, efficacy decreases from 98.77% to 48.9% (Figure 6). With Supatraz® and the hypothesis 1, the efficacy decreases from 97.17 to 70.13% (Figure 7). With the hypothesis 2, the efficacy decreases from 97.17% to 56.4%. In both cases, the efficacy is low when the resistance is high (>40%).
When the proportion of resistant mites is under 40%, the efficacy decreased but is higher than 90% for both Apivar® and Supatraz®. The mite population is not stabilized but is sufficiently decreased for beekeepers. However, when the proportion of resistant mites is higher than 40%, the efficacy is all cases decreased quickly conducting to honeybee colony collapse.
4. Discussion
Products galenic and formulation may present variation in the efficacy to control mite infestation. Long term treatments can present higher efficacy than short treatment (Roth et al. 2020). However, in the field, Supatraz® has higher efficacy than Apivar®. The number of the cumulative dead mites was lower with Supatraz® than Apivar® describing a fast acting with Supatraz® (Almecija et al. 2021).
Each product have different characteristics that affect the impact on the varroa population. The amount of active ingredient but also galenic changes the amount or speed of active ingredient released. Without dissociating the origin of this variation, the modeling daily mortality rate of Apivar® and Supatraz® (kTAPIVAR and kTSUPATRAZ) allows to analyze the performance of the products. This could be consistent with the Supatraz® galenic, due to the support matrix which contains oil (Figure 5). The product galenic and formulation plays an important role in action of the treatment. The same observation was evaluated with different based-thymol treatment (Gracia et al. 2017).
The action model depends on several parameters. The active ingredient release is not well understood however the model can show how product influences the mite population reduction. The model is a mechanistic model of the action of different treatments on the varroa population in the same conditions. We cannot modelized the quantity of amitraz released in the colony per day but only the daily mortality of mites. The risk to develop resistance to amitraz may not be modelized depending on the treatment. It should be noted that our model has the same limitations described in the model developed for Apivar® (Almecija et al. 2021) : a population dynamic of bees with a total and long winter break-up, and no reinfestation. Any changes in bee dynamics would alter these observations as they would affect varroa population dynamics (Lodesani et al. 2002). In addition, the virus quantity was not included in the model. Our model cannot explain the influence of mite’s number on the honeybee colony.
The population stabilization point between treatments shows that the comparison of efficacy between treatments is subtle. To stabilize the mite population, the model shows that Supatraz® requires lower efficacy (Table 3). Moreover, in a theoretical same percentage of efficacy, Supatraz® presents fewer remaining mites and a shorter LT90 due to a faster action (Table 4). In the field, to achieve the LT90, Apivar® needed 50 days in 2019 and 65 days in 2020, while Supatraz® needed 28 and 37 days, respectively. Supatraz® will be useful to quickly reduce the infestation and the virus spread (Locke and Fries. 2011; Martin 2001) probably due to higher amitraz concentration. However, Apivar® kills fewer mites per day than Supatraz® but its longer treatment duration allows to the treatment to be efficient.
Resistance to amitraz has been described with bioassay by several studies (Almecija et al. 2020; Kamler et al. 2016; Maggi et al. 2010) and on the field (Rinkevich. 2020). Our model explained how resistance influences the efficacy of the different treatment. For Supatraz®, the consequence of the resistance depends of the resistance ratio because the kT differs for the first week. In both cases, the resistance of varroa mite has a high impact on the population when more than 40% of the mite are considered resistant to amitraz. Even if the product presents a different action on the varroa mite population, the impact of the resistance is quite similar. Depending on the treatment action, the risk of resistance development may vary as it was shown with other mites (Bianchi et al. 2003). The amitraz concentration can modify the resistance management. In fact, resistance development of mites and insects depends on many parameters such as dose, pattern of application, timing and sequence of insecticide used (Brattsten et al. 1986). Sensitive mites do not need high doses of active ingredient however low doses can fix the resistance rapidly. A too long treatment duration increases the risk of developing resistance. At the same time, a too high or too low concentration of active ingredient increases the risk of developing resistance (FAO 2013). To prevent resistance, treatment duration has to be as short as possible and amitraz concentration adapted. At the moment, no information is available on resistance trigger threshold for amitraz concentration and treatment duration for varroa mite. The amitraz application could influence the resistance development however more information is needed on the resistance to modelize the impact on the efficacy.
5. Conclusion
In the field, Supatraz® presents a faster action on mite population than Apivar®. By comparing the action of Apivar® and Supatraz® treatments, we have shown that pharmacokinetic characteristics influence the global efficacy of the treatment. Supatraz® presents faster acting than Apivar® to reduce mite population. The model showed that comparing the efficacy of different products with different treatment times is not reliable. Also, even a low resistance will affect probably in the same way the both products even if a fast acting can conduct to an increase of efficacy and reduce duration treatment. The trade-off between treatment duration and quantity of active ingredient could allow the medications to decrease the risk of resistant development in mite population.
Author Contributions
Gabrielle Almecija has contributed to the field protocol and model analysis. She has also written the manuscript. Benjamin Poirot, Paulo Mielgo and Max Watkins contribute to the interpretation of the results and the writing of the manuscript. Christelle Suppo contributed to the model analysis and the writing of the manuscript.
Acknowledgments
The authors thank Robin Azemar for his help in the apiary and for the counting of dead mites
Conflicts of Interest
VitaBeeHealth financed a part of this research.
References
- Adjlane, N., Haddad, N. (2017). Evaluation of the resistance of the mite Varroa destructor to the amitraz in colonies of honeybees (Apis mellifera) in Algeria. Uludağ Arıcılık Derg. 17, 1–6. [CrossRef]
- Almecija, G., Poirot, B., Cochard, P., Suppo, C., (2020). Inventory of Varroa destructor susceptibility to amitraz and tau-fluvalinate in France. Exp. Appl. Acarol. 82, 1–16. [CrossRef]
- Almecija, G., Poirot, B., Ventelon, M., Suppo, C., (2021). Modelling the impact of Apivar® treatment on a Varroa mite population and the influence of resistance. Pest Manag. Sci. ps.6698. [CrossRef]
- Anderson, D.L., Trueman, J.W.H., (2000). Varroa jacobsoni (Acari: Varroidae) is more than one species. Exp. Appl. Acarol. 24, 165–189. [CrossRef]
- Baron, S., Barrero, R.A., Black, M., Bellgard, M.I., van Dalen, E.M.S., Fourie, J., Maritz-Olivier, C., (2018). Differentially expressed genes in response to amitraz treatment suggests a proposed model of resistance to amitraz in R. decoloratus ticks. Int. J. Parasitol. Drugs Drug Resist., 8, 361–371. [CrossRef]
- Beaurepaire, A., Piot, N., Doublet, V., Antunez, K., Campbell, E., Chantawannakul, P., Chejanovsky, N., Gajda, A., Heerman, M., Panziera, D., Smagghe, G., Yañez, O., de Miranda, J.R., Dalmon, A., (2020). Diversity and Global Distribution of Viruses of the Western Honey Bee, Apis mellifera. Insects, 11, 239-265. [CrossRef]
- Bianchi, M.W., Barré, N., Messad, S., (2003). Factors related to cattle infestation level and resistance to acaricides in Boophilus microplus tick populations in New Caledonia. Vet. Parasitol. 112, 75–89. [CrossRef]
- Brattsten, L.B., Holyoke, C.W., Leeper, J.R., Raffa, K.F., (1986). Insecticide Resistance: Challenge to Pest Management and Basic Research. Science, 231, 1255–1260. [CrossRef]
- Calis, J.N.M., Fries, I., Ryrie, S.C., (1999). Population modelling of Varroa jacobsoni Oud. Apidologie, 30, 111–124. [CrossRef]
- Chen, A.C., He, H., Davey, R.B., (2007). Mutations in a putative octopamine receptor gene in amitraz-resistant cattle ticks. Vet. Parasitol. 148, 379–383. [CrossRef]
- Elzen, P.J., Baxter, J.R., Spivak, M., Wilson, W.T., (2000). Control of Varroa jacobsoni Oud. resistant to fluvalinate and amitraz using coumaphos. Apidologie 31, 437–441. [CrossRef]
- FAO, 2013. Code international de conduite pour la distribution et l’utilisation des pesticides. Directives pour la prévention et la gestion de la résistance aux pesticides. Organisation des Nations Unies pour l’Alimentation et l’Agriculture. E-ISBN 978-92-5-207348-2.
- González-Cabrera, J., Rodríguez-Vargas, S., Davies, T.G.E., Field, L.M., Schmehl, D., Ellis, J.D., Krieger, K., Williamson, M.S., (2016). Novel Mutations in the Voltage-Gated Sodium Channel of Pyrethroid-Resistant Varroa destructor Populations from the Southeastern USA. PLOS ONE, 11, e0155332. [CrossRef]
- Gracia, M.J., Moreno, C., Ferrer, M., Sanz, A., Peribáñez, M.Á., Estrada, R., (2017). Field efficacy of acaricides against Varroa destructor. PLOS ONE, 12, e0171633. [CrossRef]
- Hernandez-Rodriguez, C.S, Moreno-Marti, S., Almecija, G., Christmon, K., Jonhson, J.D, Ventelon, M., VanEngeksdorp, D, Cook, S.C, Gonzalez-Cabrera, J., (2021). Resistance to amitraz in the parasitic honey bee mite Varroa destructor is associated with mutations in the -adrenergic-like octopamine recpetor. Journal of Pest Science. [CrossRef]
- Hillesheim, E., Ritter, W., Bassand, D., (1996). First data on resistance mechanisms of Varroa jacobsoni (OUD.) against tau-fluvalinate. Exp. Appl. Acarol. 20, 283–296. [CrossRef]
- Kamler, M., Nesvorna, M., Stara, J., Erban, T., Hubert, J., (2016). Comparison of tau-fluvalinate, acrinathrin, and amitraz effects on susceptible and resistant populations of Varroa destructor in a vial test. Exp. Appl. Acarol. 69, 1–9. [CrossRef]
- Locke, B., Fries, I., (2011). Characteristics of honey bee colonies (Apis mellifera) in Sweden surviving Varroa destructor infestation. Apidologie, 42, 533–542. [CrossRef]
- Lodesani, M., Crailsheim, K., Moritz, R.F.A., (2002). Effect of some characters on the population growth of mite Varroa jacobsoni in Apis mellifera L colonies and results of a bi-directional selection. J. Appl. Entomol. 126, 130–137. [CrossRef]
- Maggi, M.D., Ruffinengo, S.R., Gende, L.B., Eguaras, M.J., Sardella, N.H., (2008). LC50 baseline levels of amitraz, coumaphos, fluvalinate and flumethrin in populations of Varroa destructor from Buenos Aires Province, Argentina. J. Apic. Res. 47, 292–295. [CrossRef]
- Maggi, M.D., Ruffinengo, S.R., Negri, P., Eguaras, M.J., (2010). Resistance phenomena to amitraz from populations of the ectoparasitic mite Varroa destructor of Argentina. Parasitol. Res. 107, 1189–1192. [CrossRef]
- Martin, S.J., (2001). The role of Varroa and viral pathogens in the collapse of honeybee colonies: a modelling approach. J. Appl. Ecol. 38, 1082–1093. [CrossRef]
- Milani, N., (1995). The resistance of Varroa jacobsoni Oud to pyrethroids: a laboratory assay. Apidologie 26, 415–429. [CrossRef]
- Millán-Leiva, A., Marín, Ó., De la Rúa, P., Muñoz, I., Tsagkarakou, A., Eversol, H., Christmon, K., vanEngelsdorp, D., González-Cabrera, J., (2021). Mutations associated with pyrethroid resistance in the honey bee parasite Varroa destructor evolved as a series of parallel and sequential events. J. Pest Sci. 94, 1505-1517. [CrossRef]
- Rinkevich, F.D., (2020). Detection of amitraz resistance and reduced treatment efficacy in the Varroa Mite, Varroa destructor, within commercial beekeeping operations. PLOS ONE 15, e0227264. [CrossRef]
- Rosenkranz, P., Aumeier, P., Ziegelmann, B., (2010). Biology and control of Varroa destructor. J. Invertebr. Pathol. 103, 96–119. [CrossRef]
- Roth, M.A., Wilson, J.M., Tignor, K.R., Gross, A.D., 2020. Biology and Management of Varroa destructor (Mesostigmata: Varroidae) in Apis mellifera (Hymenoptera: Apidae) Colonies. J. Integr. Pest Manag. 11.1-8. [CrossRef]
- Sungirai, M., Baron, S., Moyo, D.Z., De Clercq, P., Maritz-Olivier, C., Madder, M., (2018). Genotyping acaricide resistance profiles of Rhipicephalus microplus tick populations from communal land areas of Zimbabwe. Ticks Tick-Borne Dis. 9, 2–9. [CrossRef]
- Traynor, K.S., Mondet, F., de Miranda, J.R., Techer, M., Kowallik, V., Oddie, M.A.Y., Chantawannakul, P., McAfee, A., (2020). Varroa destructor: A Complex Parasite, Crippling Honey Bees Worldwide. Trends Parasitol. 36, 592–606. [CrossRef]
- Trouiller, J., (1998). Monitoring Varroa jacobsoni resistance to pyrethroids in western Europe. Apidologie 29, 537–546. [CrossRef]
Figure 1.
Percentage of cumulative dead mites during treatment for Apivar® (solid line) and Supatraz® (dotted line) in 2019.
Figure 1.
Percentage of cumulative dead mites during treatment for Apivar® (solid line) and Supatraz® (dotted line) in 2019.
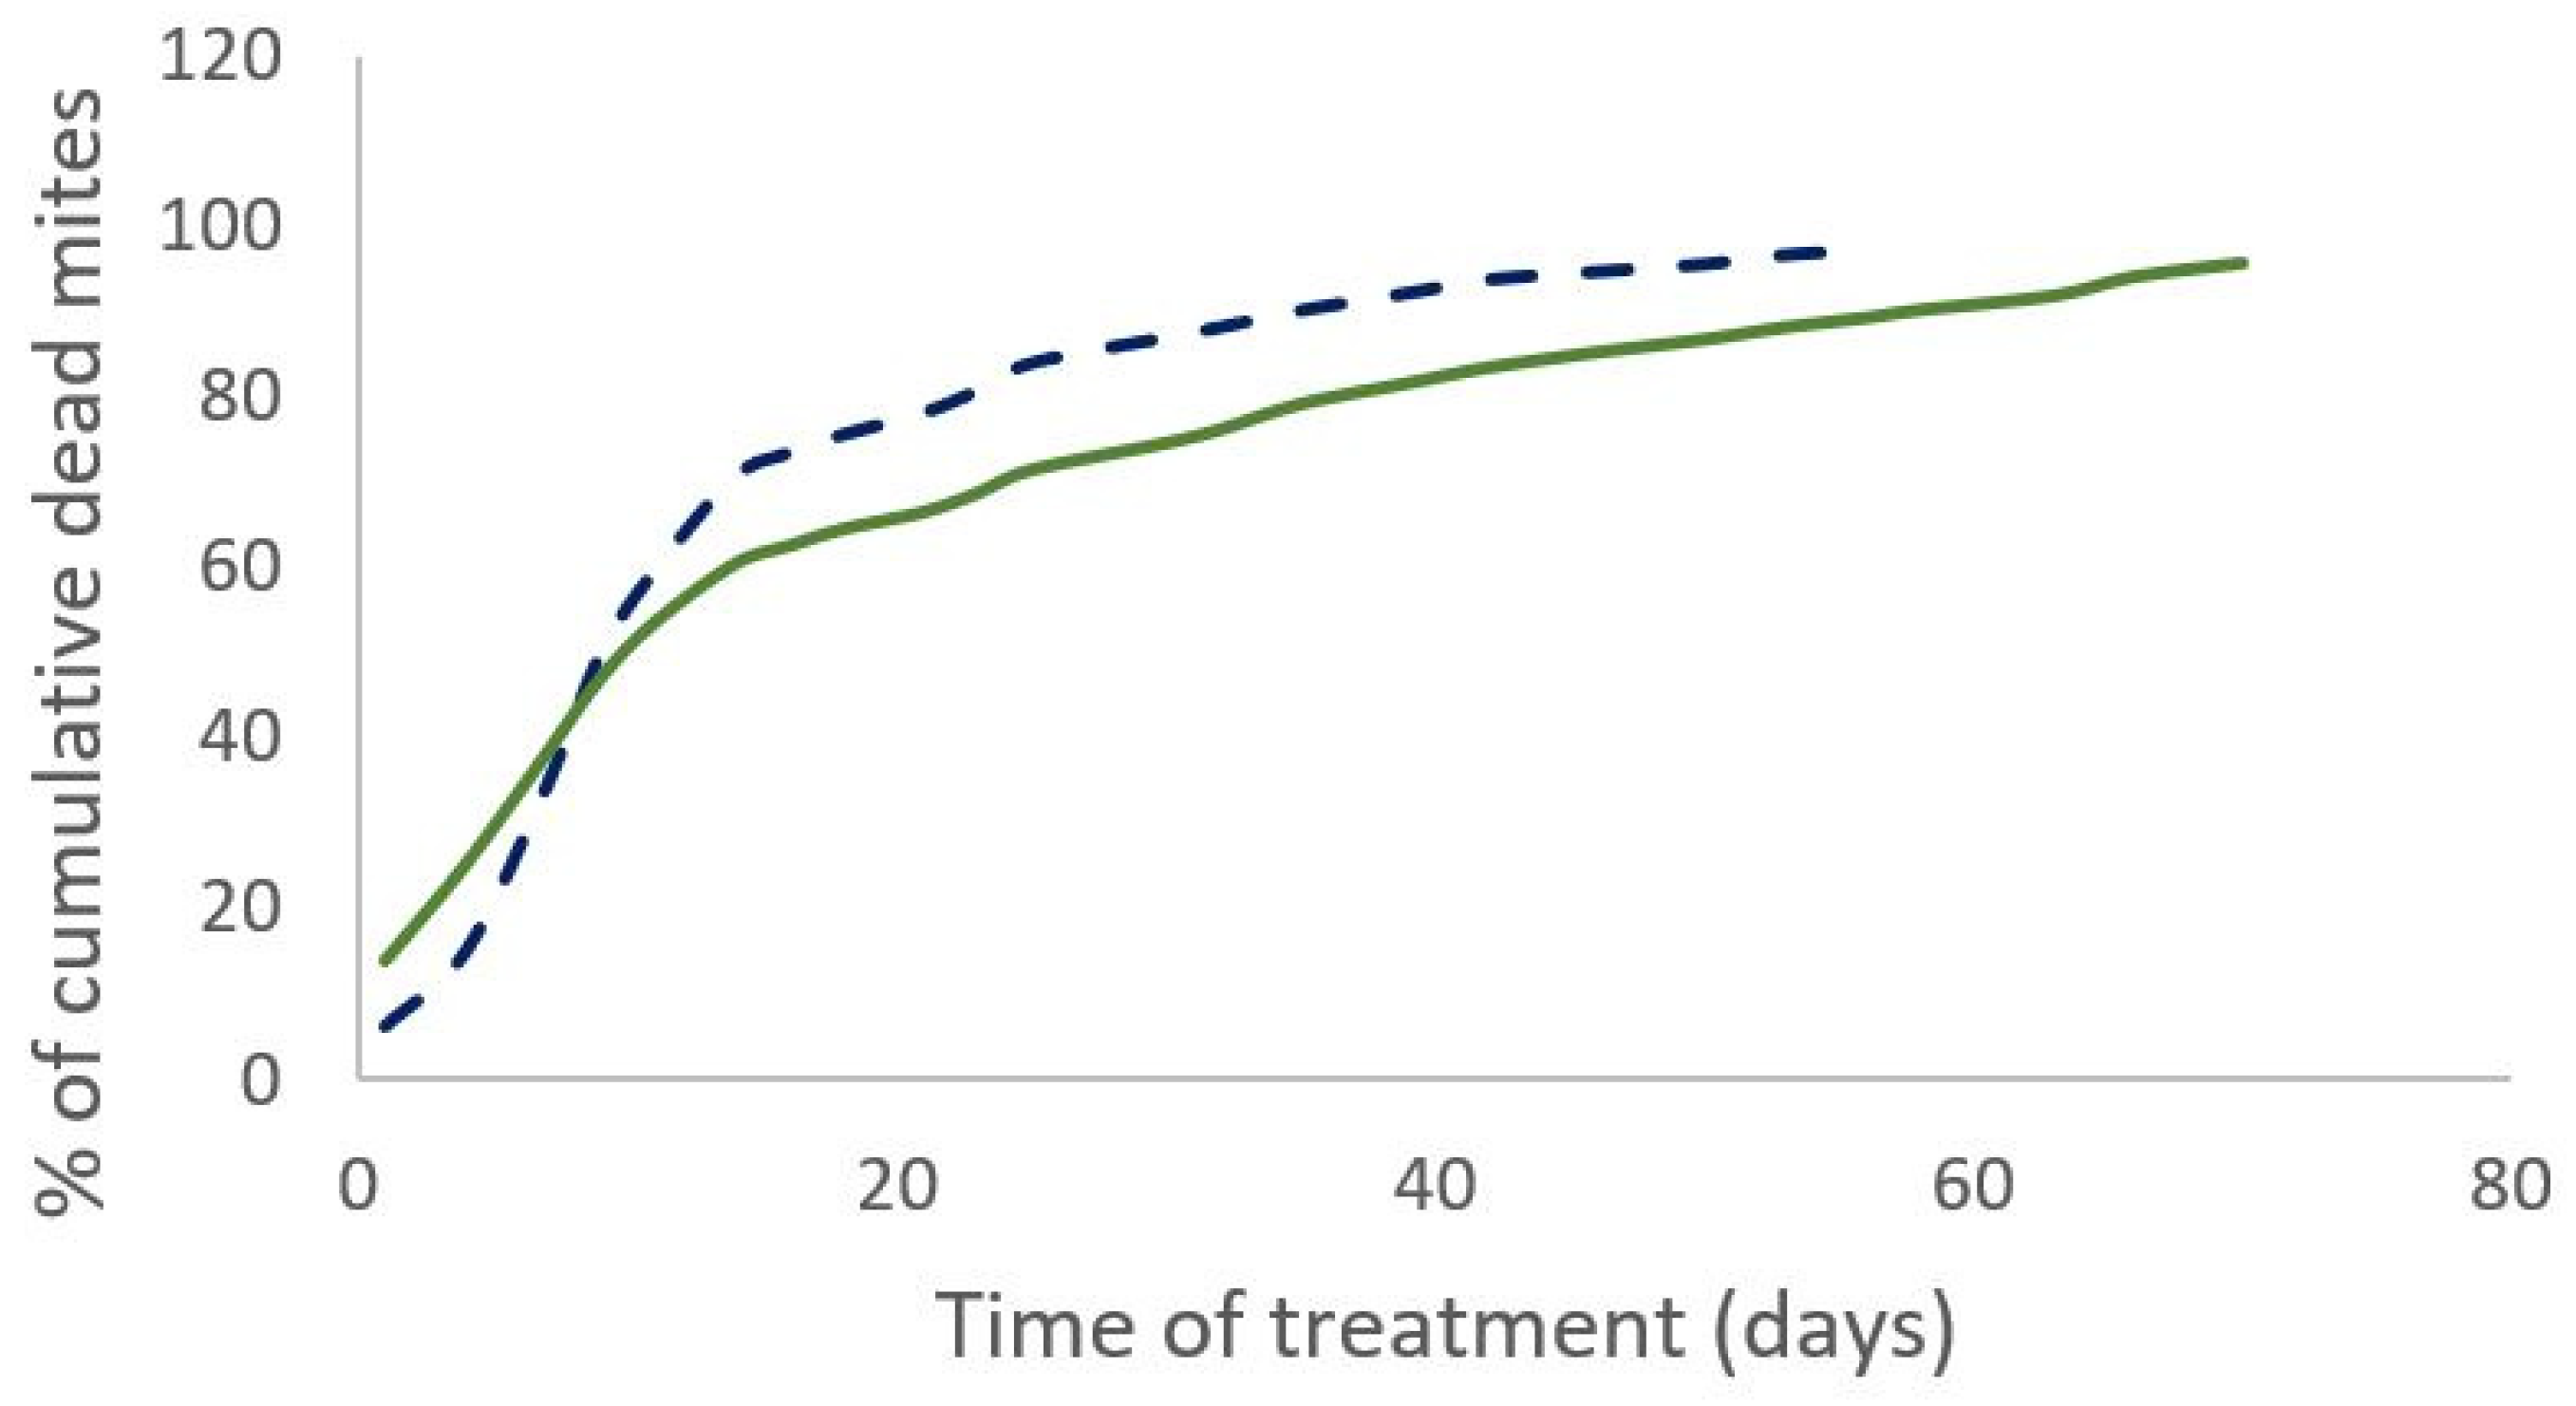
Figure 2.
Percentage of cumulative dead mites during treatment for Apivar® (solid line) and Supatraz® (dotted line) in 2020.
Figure 2.
Percentage of cumulative dead mites during treatment for Apivar® (solid line) and Supatraz® (dotted line) in 2020.
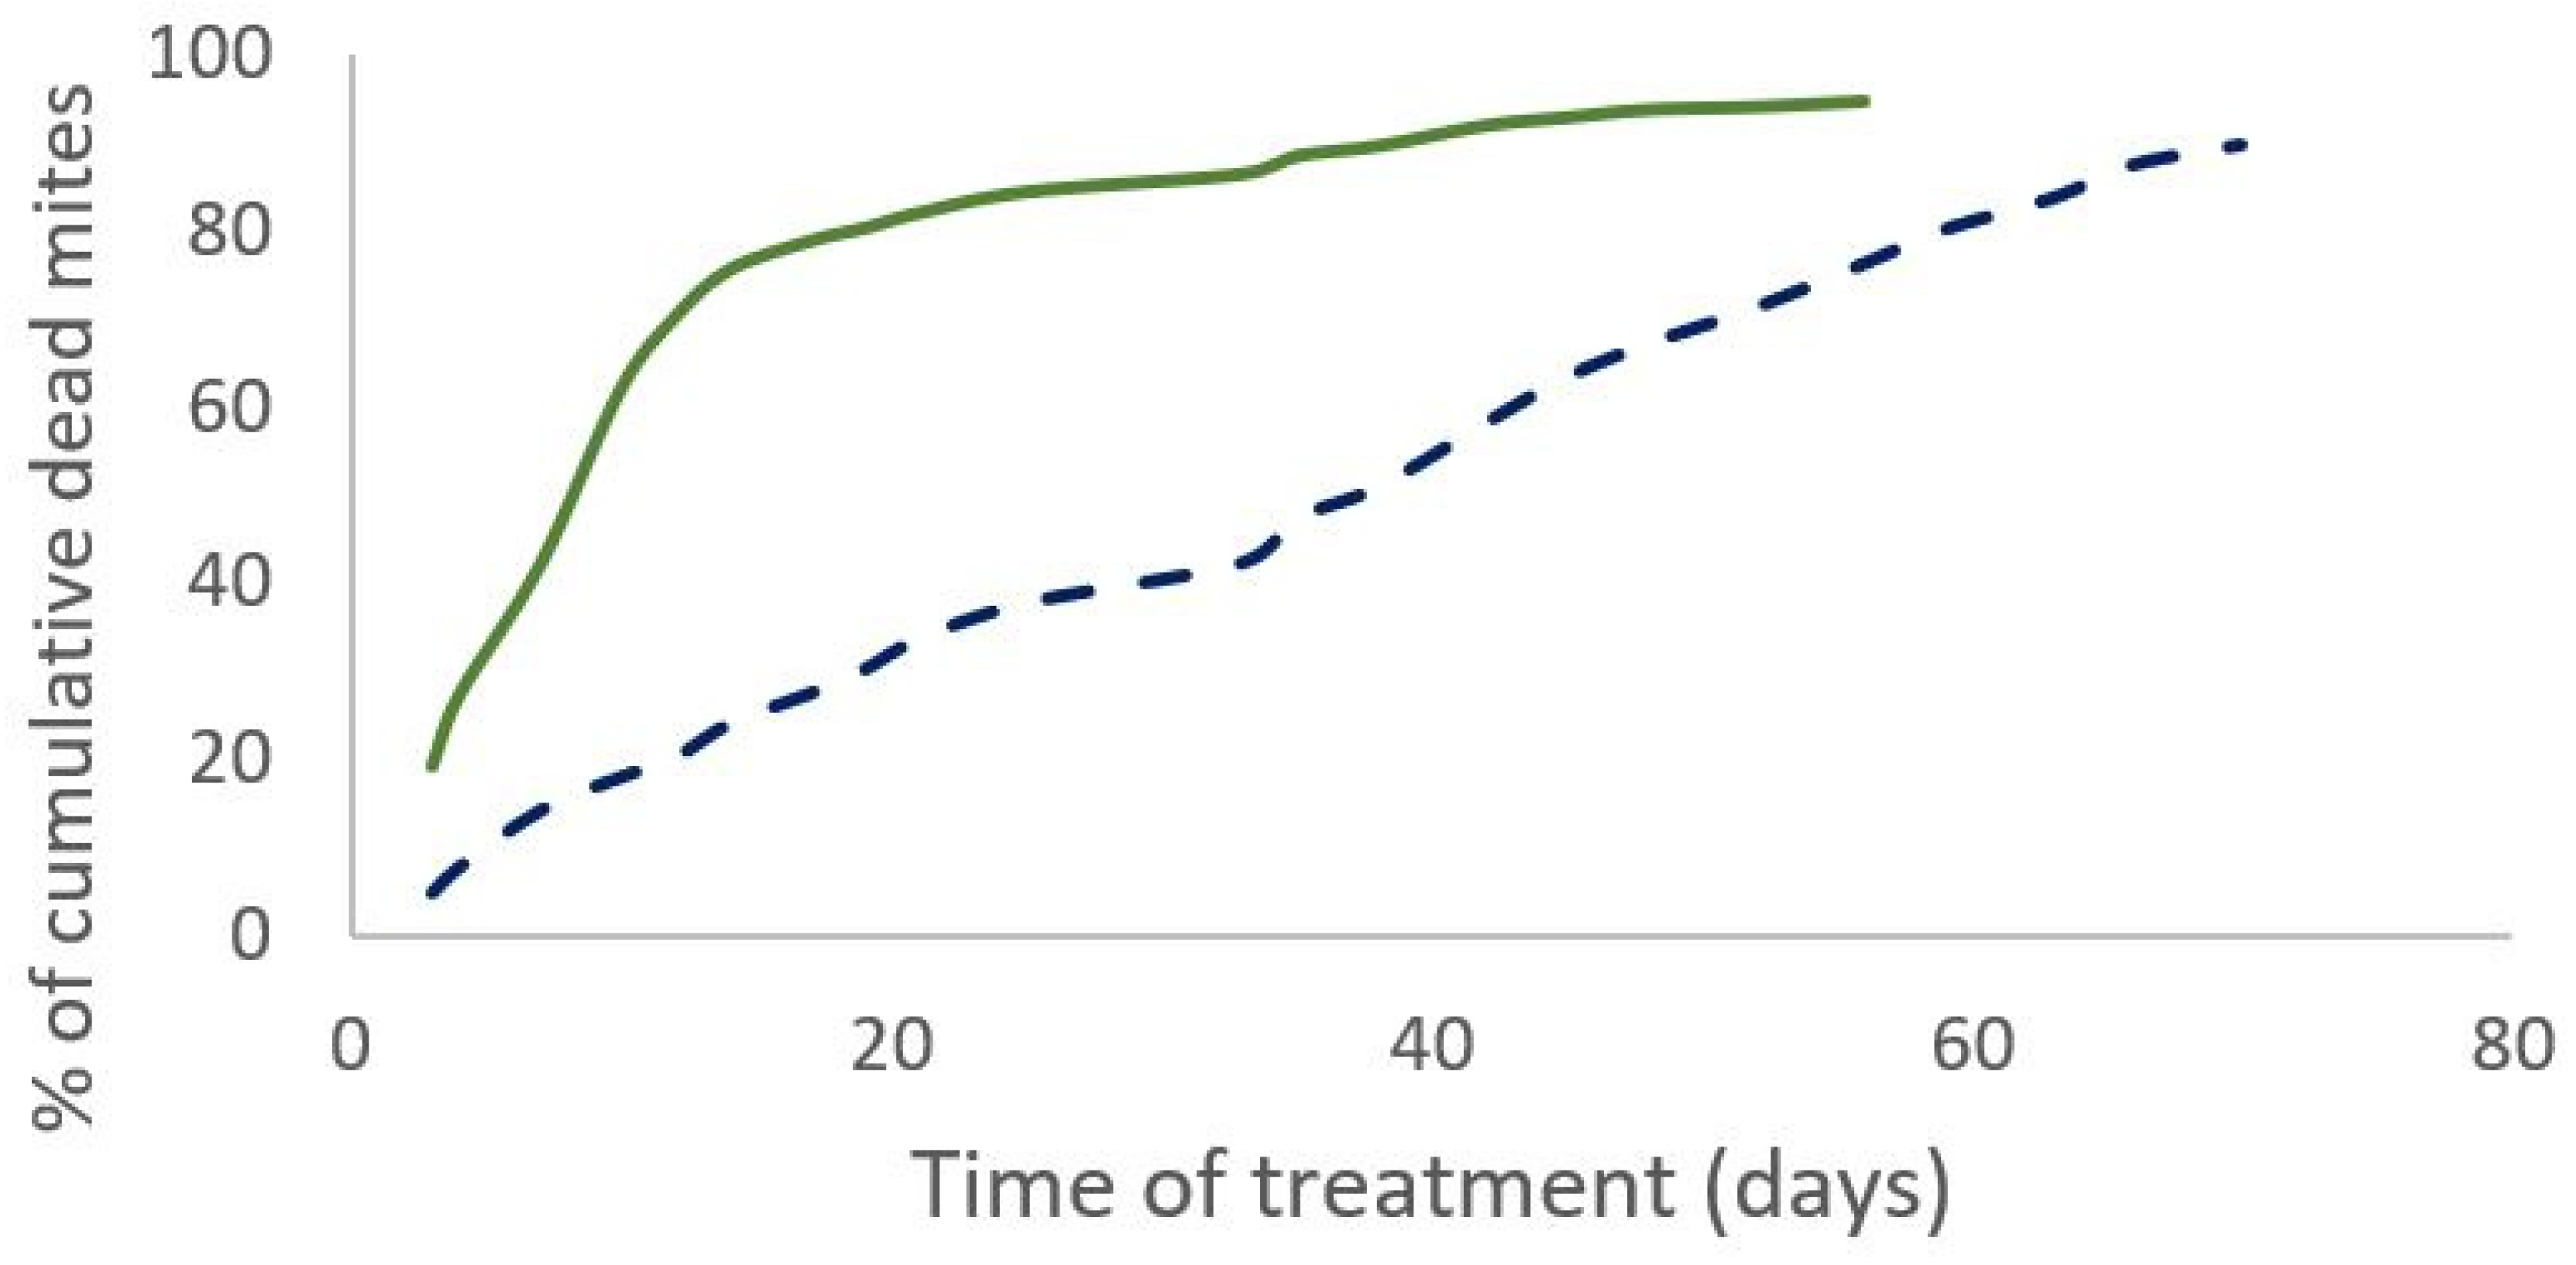
Figure 3.
Cumulative dead mites in the field (solid line) and with the model (dotted line) for Apivar (a) and for Supatraz (b). Field data come from one beehive in Nieul-sur-Mer in 2019 trial.
Figure 3.
Cumulative dead mites in the field (solid line) and with the model (dotted line) for Apivar (a) and for Supatraz (b). Field data come from one beehive in Nieul-sur-Mer in 2019 trial.
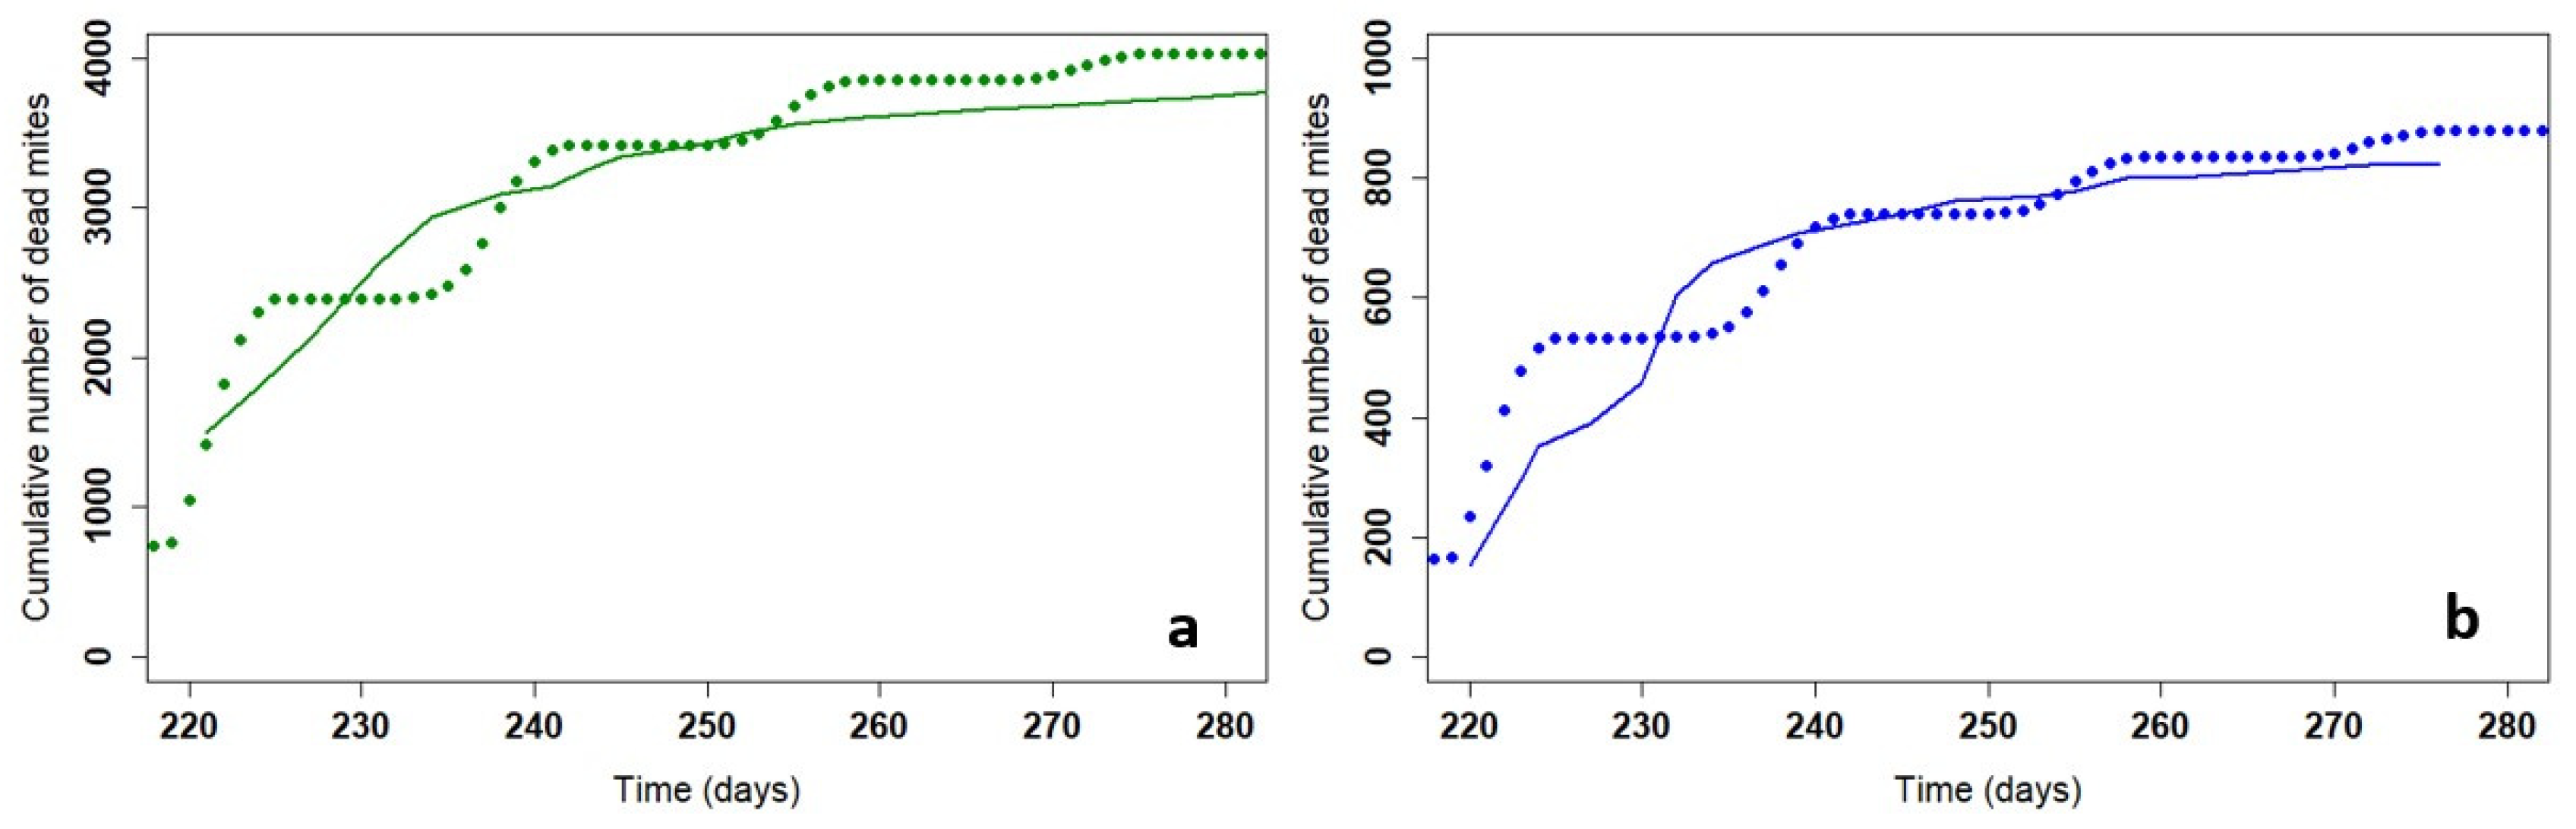
Figure 4.
Cumulative mite mortality with the model for Apivar® (solid line) and Supatraz® (dotted line) (Pi=50) for stabilized the mite population year to year.
Figure 4.
Cumulative mite mortality with the model for Apivar® (solid line) and Supatraz® (dotted line) (Pi=50) for stabilized the mite population year to year.
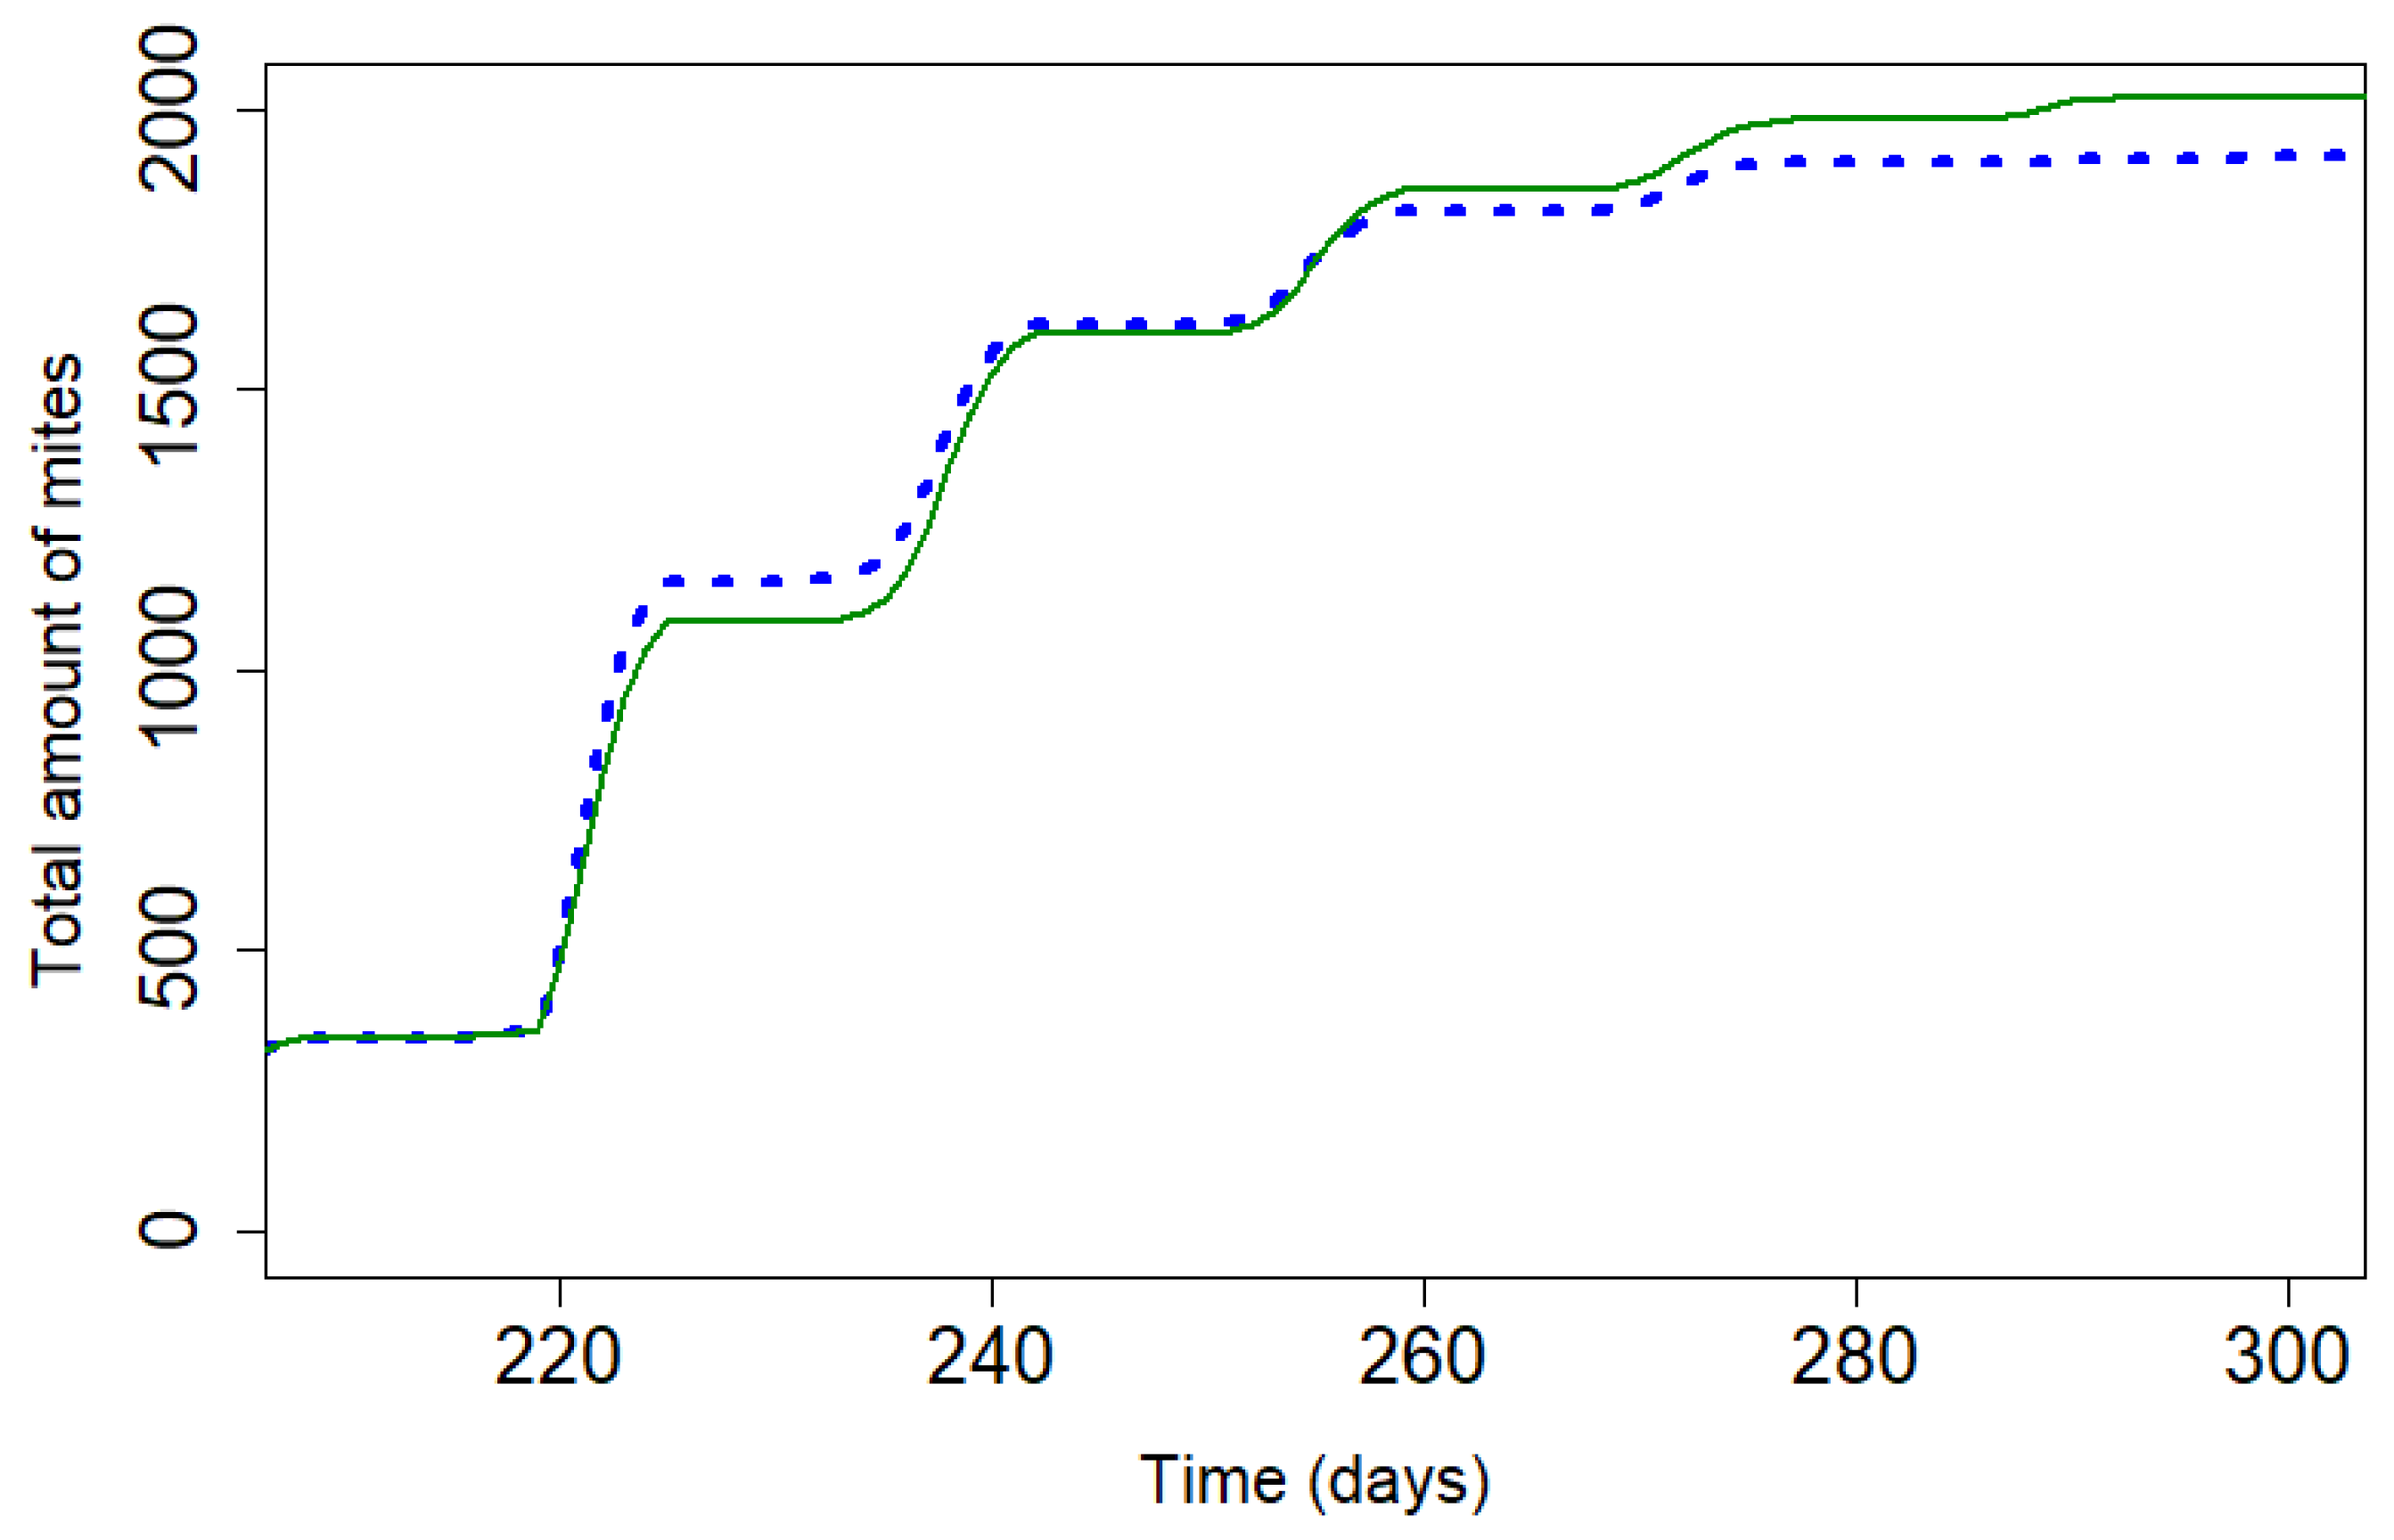
Figure 5.
Mite population during treatment with Apivar® (solid line) and Supatraz® (dotted line) for both 95% efficacy (Pi=50). (kTAPIVAR=0.178 and kTSUPATRAZ=0.24).
Figure 5.
Mite population during treatment with Apivar® (solid line) and Supatraz® (dotted line) for both 95% efficacy (Pi=50). (kTAPIVAR=0.178 and kTSUPATRAZ=0.24).
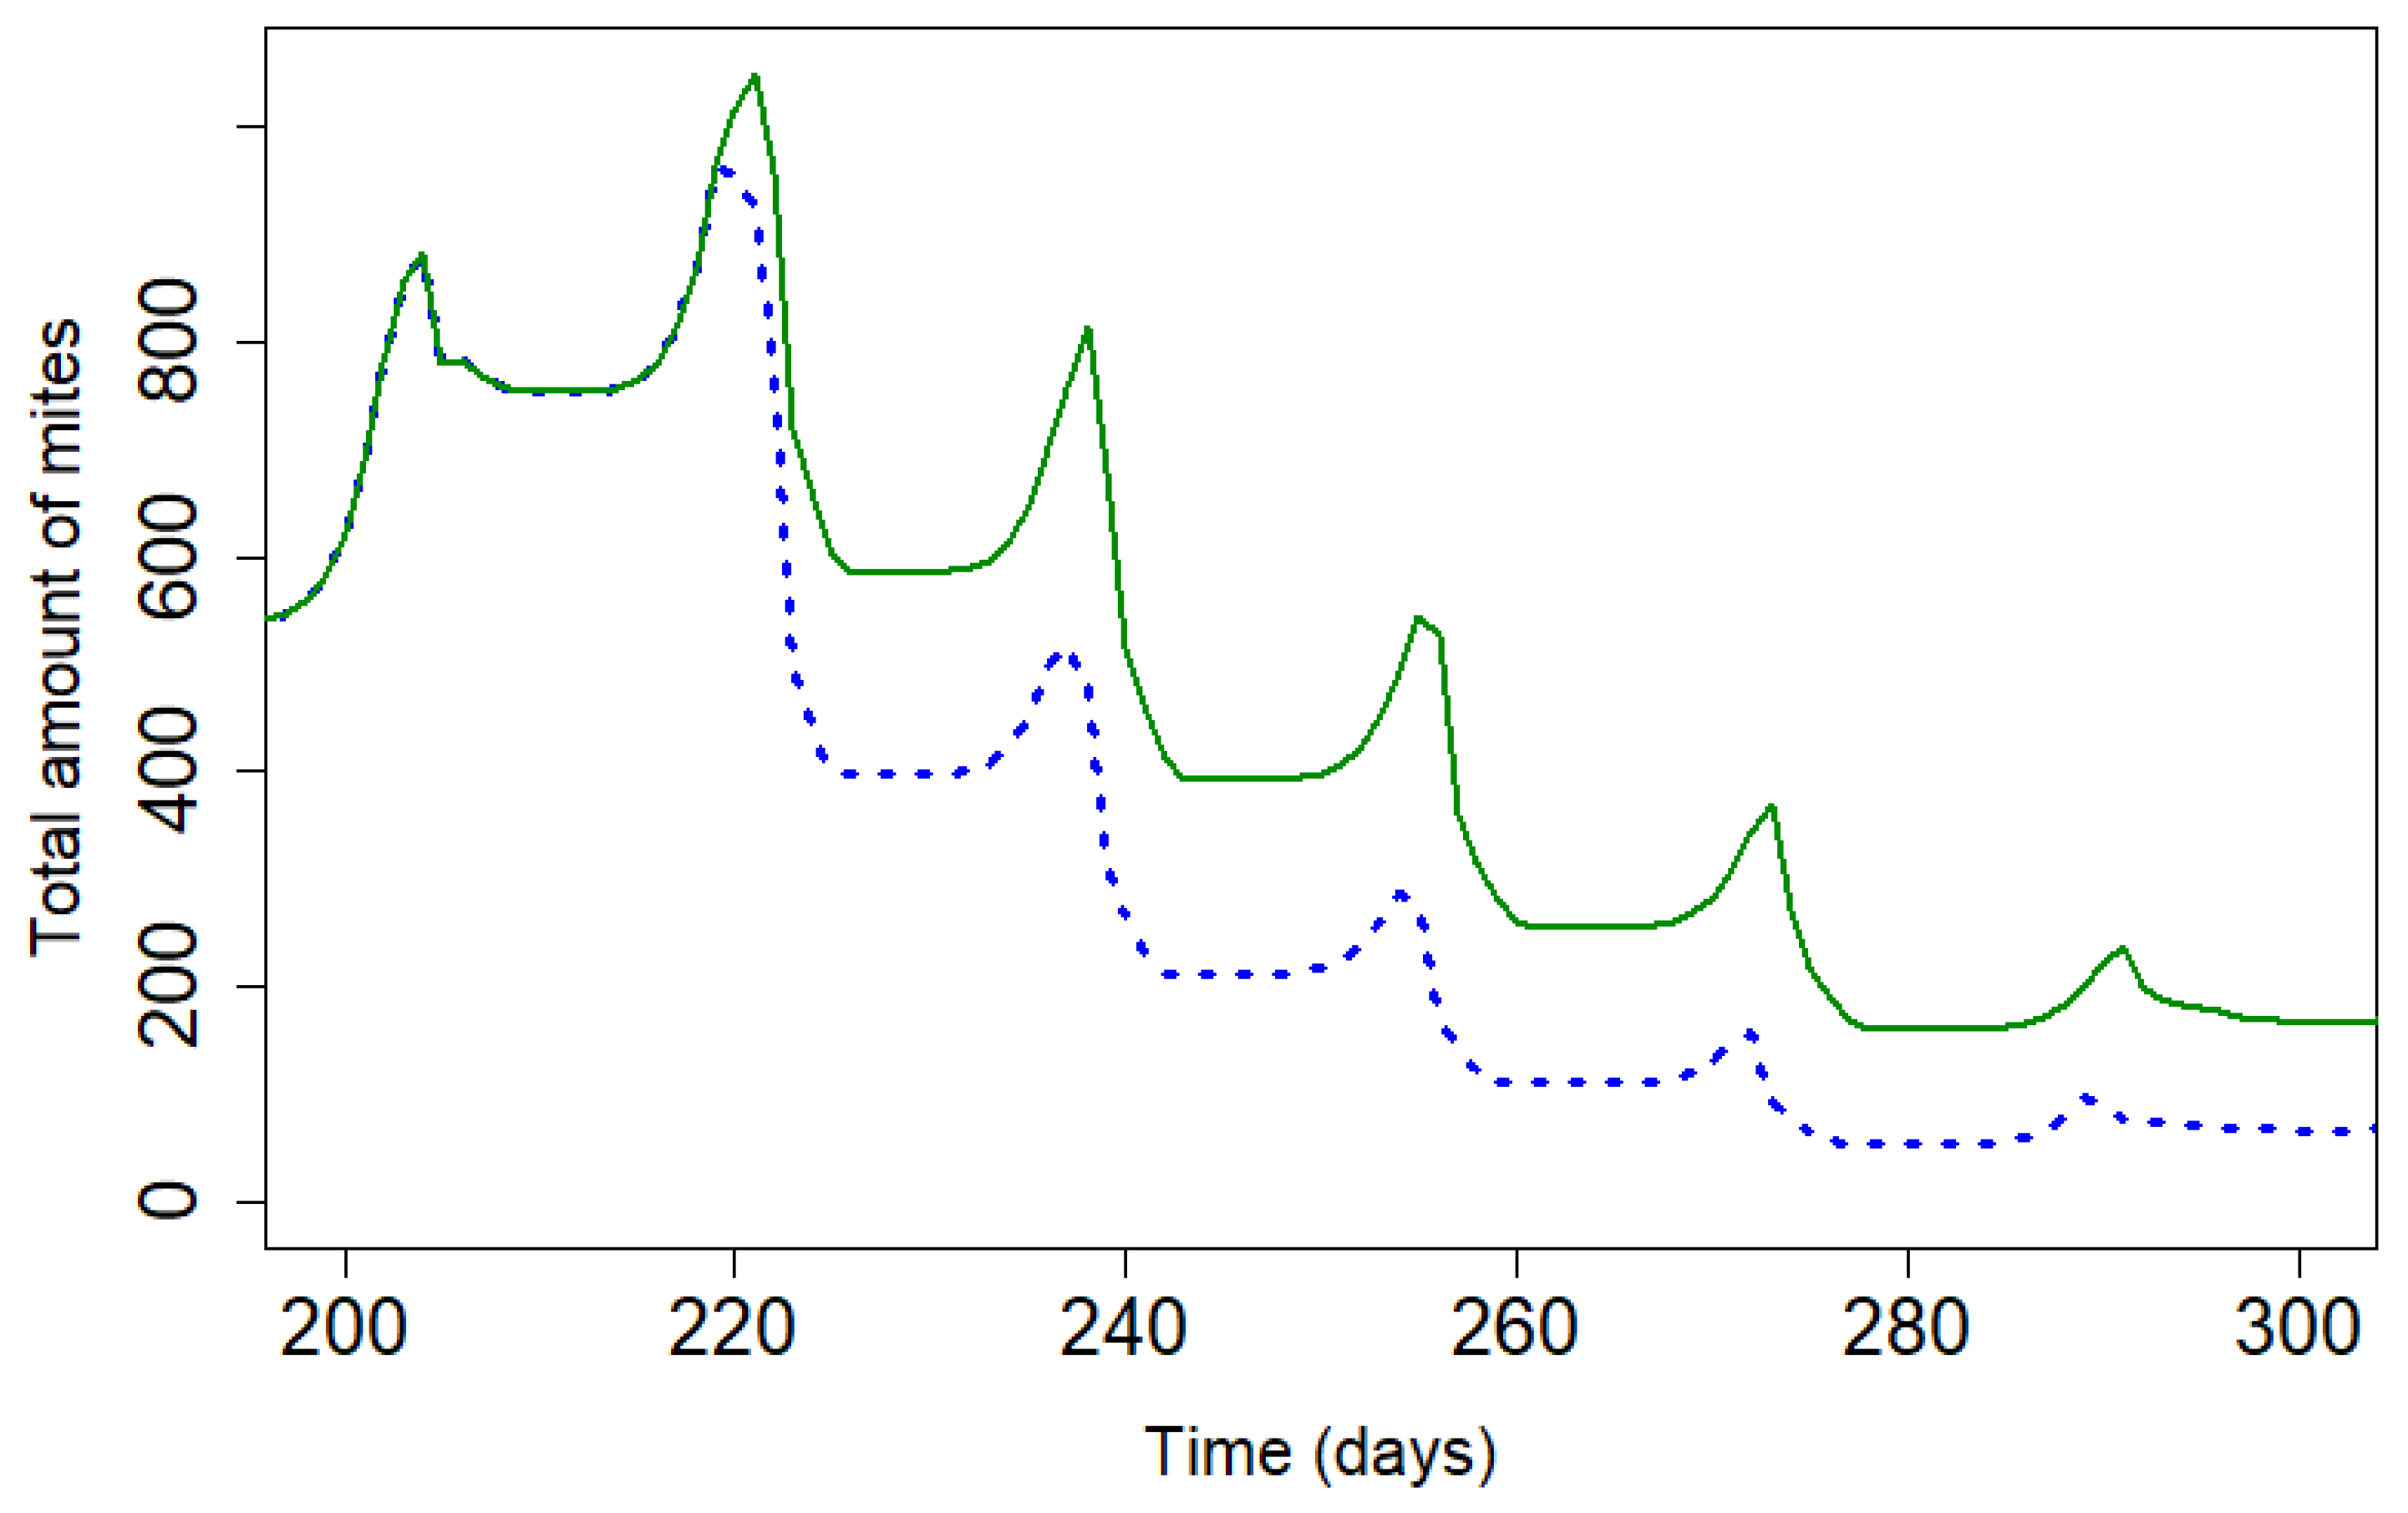
Figure 6.
: Modelling of loss efficacy depending on the percentage of resistance (Apivar,:Pi=50,dT=10 ; Supatraz : Pi=50, dT=8). For Supatraz, the hypothesis 1 was applied for this simulation. The varroa mites were not enough resistant to be safe the first week.
Figure 6.
: Modelling of loss efficacy depending on the percentage of resistance (Apivar,:Pi=50,dT=10 ; Supatraz : Pi=50, dT=8). For Supatraz, the hypothesis 1 was applied for this simulation. The varroa mites were not enough resistant to be safe the first week.
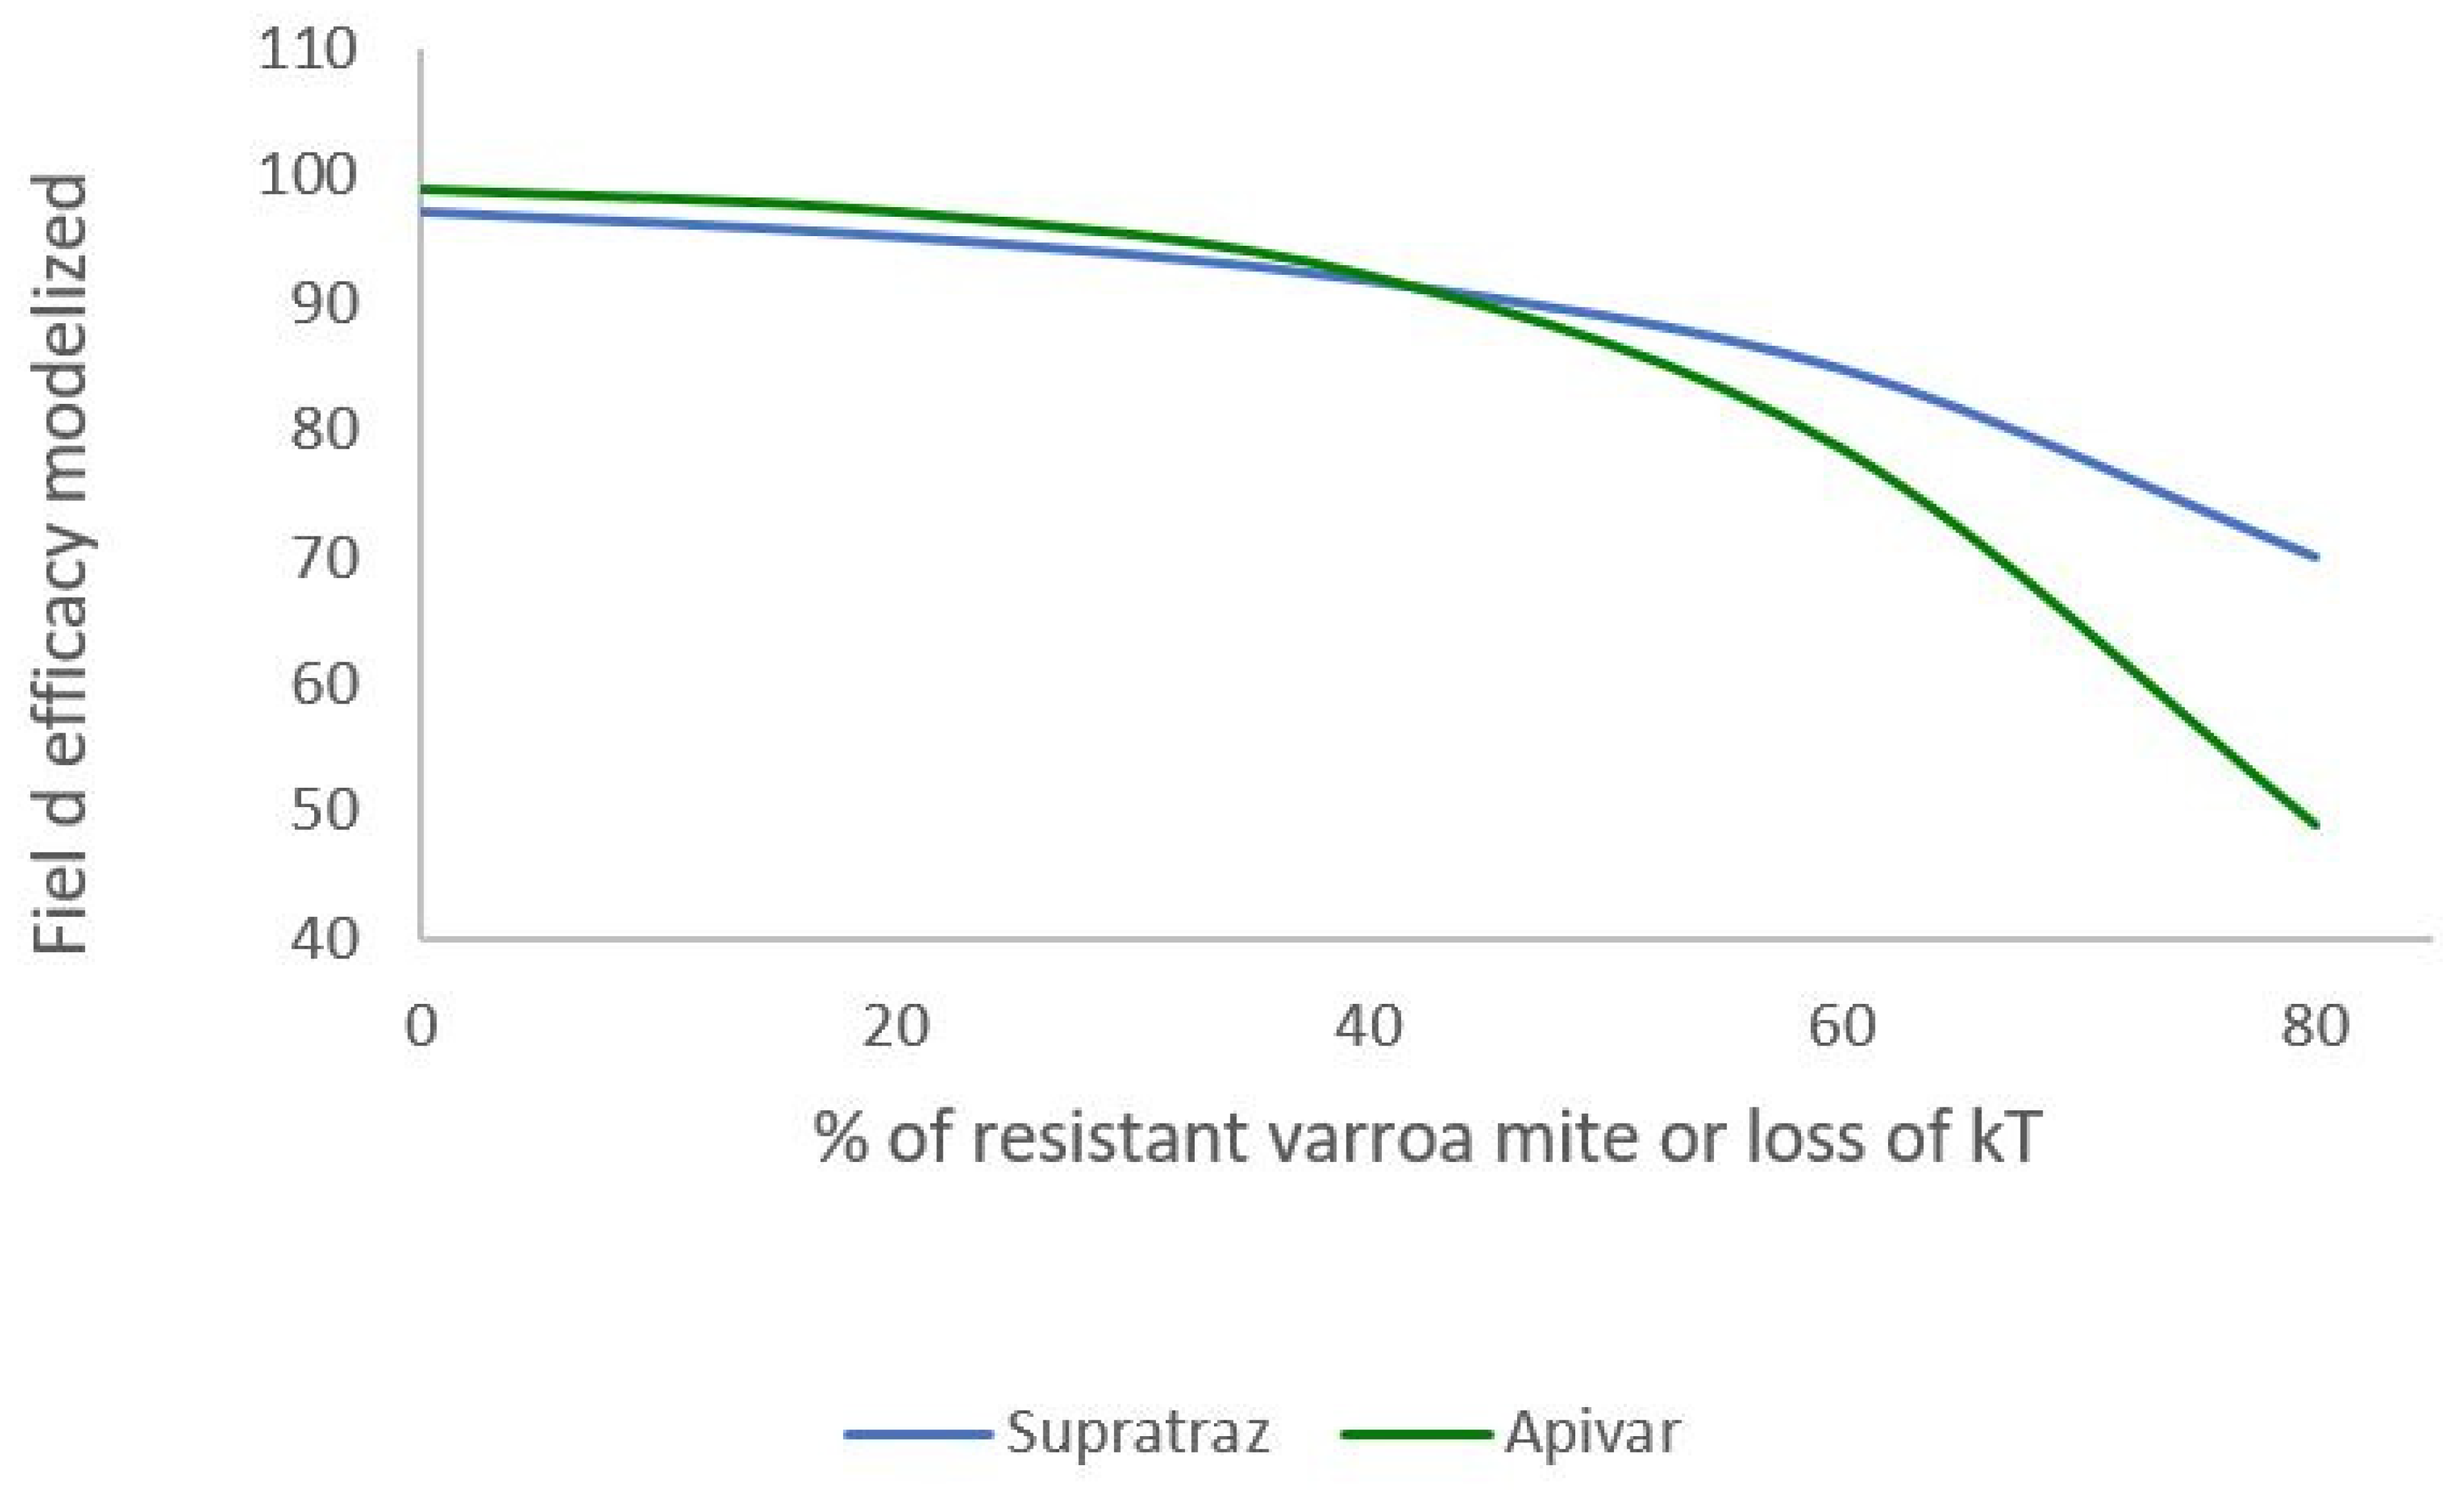
Figure 7.
: Modelling of loss efficacy depending on the percentage of resistance (Apivar,:Pi=50,dT=10 ; Supatraz : Pi=50, dT=8). For Supatraz, the hypothesis 2 was applied for this simulation. The varroa mites were sufficiently resistant to be safe the first week of treatment.
Figure 7.
: Modelling of loss efficacy depending on the percentage of resistance (Apivar,:Pi=50,dT=10 ; Supatraz : Pi=50, dT=8). For Supatraz, the hypothesis 2 was applied for this simulation. The varroa mites were sufficiently resistant to be safe the first week of treatment.
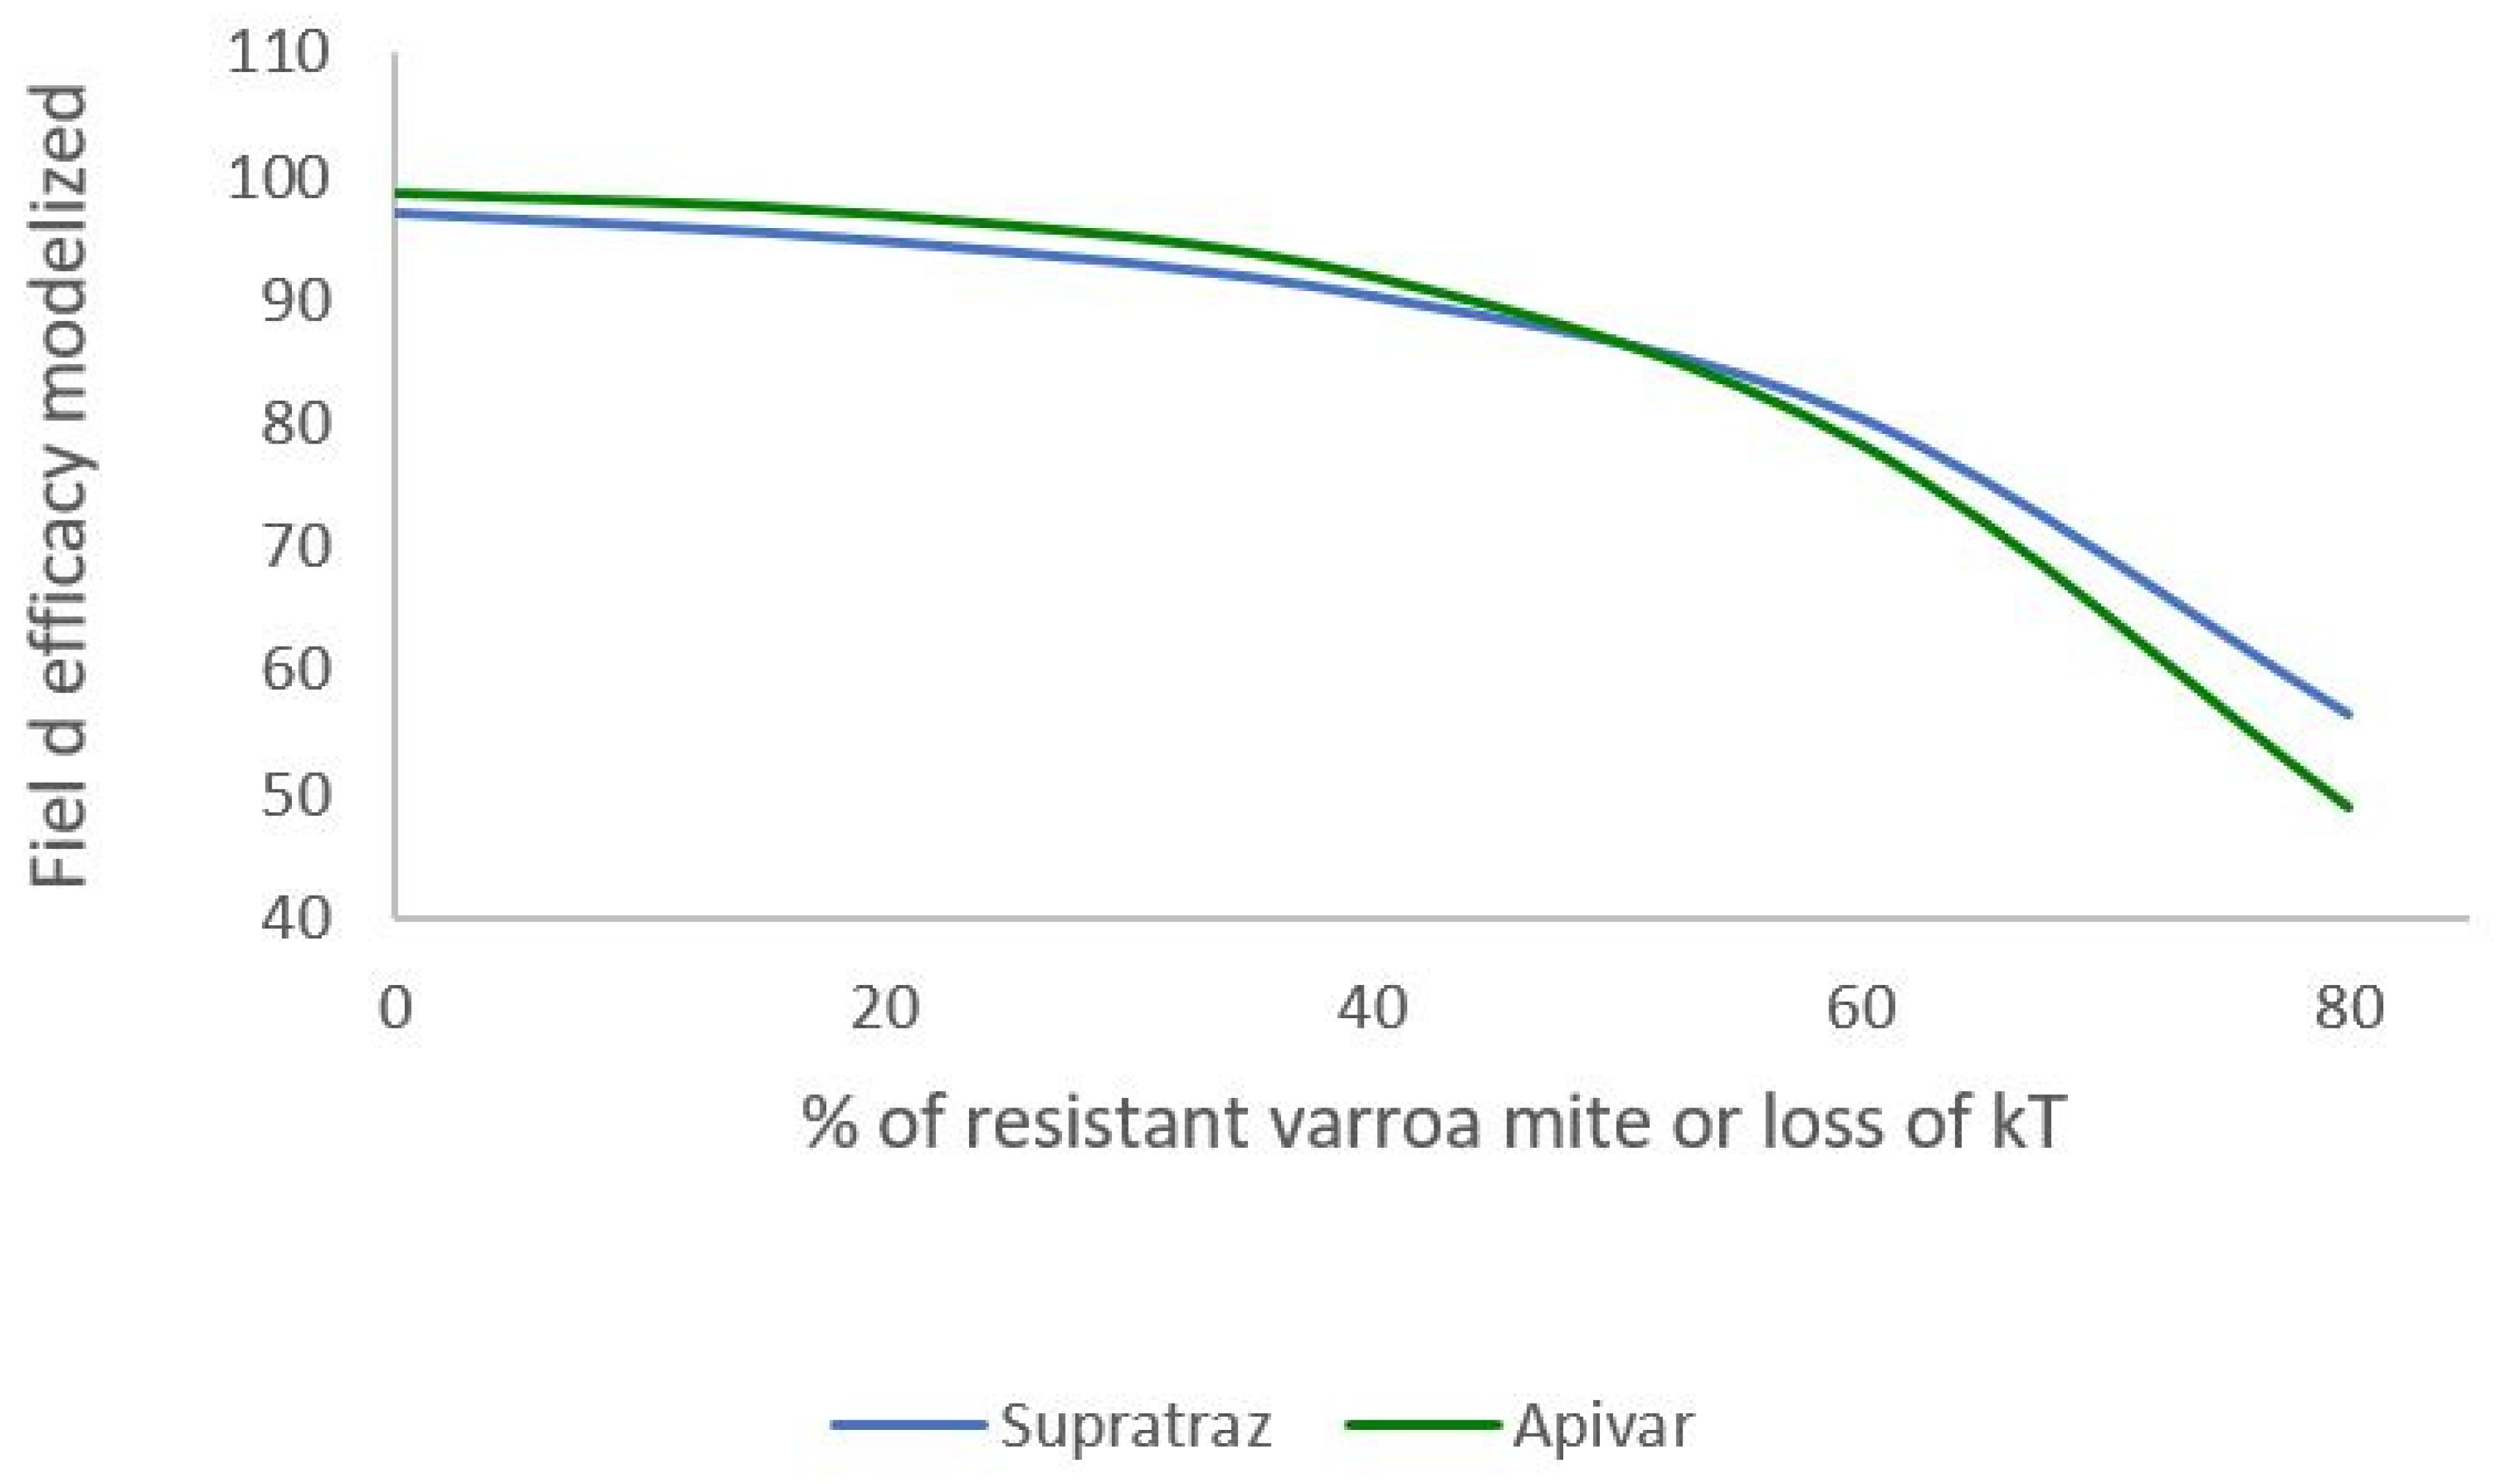

Table 1.
Characteristics of Apivar® and Supatraz®.
| Apivar® | Supatraz® | |
| Active substance | Amitraz | Amitraz |
| Amitraz quantity per strip (mg) | 500 | 700 |
| Weight per strip (g) | 15g | 12.52g |
| Treatment duration | 10 weeks (70 days) | 6 to 8 weeks (42-56 days) |
Table 2.
Comparison of results obtained in the field in 2019 and 2020 between Apivar® and Supatraz® in Nieul-sur-Mer.
Table 2.
Comparison of results obtained in the field in 2019 and 2020 between Apivar® and Supatraz® in Nieul-sur-Mer.
| 2019 | 2020 | |||
| Apivar® | Supatraz® | Apivar® | Supatraz® | |
| Number of beehives | 8 | 12 | 7 | 5 |
| Efficacy (%)±SE | 95.44±1.19a | 97.36±0.61a | 91.35±2.83a | 94.62±1.45a |
| Average of drop mites±SE | 2222±438a | 1636±324a | 4324±1256a | 1759±605b |
| Average of remaining mites±SE | 91±41a | 40±14b | 203±41a | 57.4±8.71b |
| LT90 (days)±SE | 50.97±4.69a | 28.49±2.14b | 65.27±4.39a | 37.68±4.1b |
Table 3.
Modelling values needed to stabilize the varroa population for Apivar® (10 weeks of treatment) and Supatraz® (8 weeks of treatment) (Pi=50).
Table 3.
Modelling values needed to stabilize the varroa population for Apivar® (10 weeks of treatment) and Supatraz® (8 weeks of treatment) (Pi=50).
| Apivar® | Supatraz® | |
| Treatment duration | 10 | 8 |
| Start of treatment | 220 | 220 |
| Pi | 50 | 50 |
| kTAPIVAR and kTSUPATRAZ | 0.265 | 0.3 |
| Percentage of efficacy (to stabilize population) | 98.77 | 97.17 |
| Slope of cumulative mite mortality curve (total treatment) | 43 | 25.76 |
| LT90 | 37 | 34 |
| Number of cumulative dead mites | 1534 | 1397 |
| Varroas remaining | 19 | 39 |
| Maximum number of mites in the year | 963 | 963 |
Table 4.
Number of cumulative dead mites and remaining mites with Apivar® and Supatraz® for different efficacies (with Pi=50).
Table 4.
Number of cumulative dead mites and remaining mites with Apivar® and Supatraz® for different efficacies (with Pi=50).
| Efficacy | Apivar® | Supatraz® | ||||
| Dead mites | Remaining mites | LT90 (days) | Dead mites | Remaining mites | LT90 (days) | |
| 99% | 1505 | 15 | 37 | 1363 | 13 | 33 |
| 95% | 1704 | 88 | 57 | 1529 | 80 | 35 |
| 90% | 1776 | 196 | 70 | 1653 | 183 | 38 |
Disclaimer/Publisher’s Note: The statements, opinions and data contained in all publications are solely those of the individual author(s) and contributor(s) and not of MDPI and/or the editor(s). MDPI and/or the editor(s) disclaim responsibility for any injury to people or property resulting from any ideas, methods, instructions or products referred to in the content. |
© 2023 by the authors. Licensee MDPI, Basel, Switzerland. This article is an open access article distributed under the terms and conditions of the Creative Commons Attribution (CC BY) license (http://creativecommons.org/licenses/by/4.0/).
Copyright: This open access article is published under a Creative Commons CC BY 4.0 license, which permit the free download, distribution, and reuse, provided that the author and preprint are cited in any reuse.


