

Submitted:
15 December 2023
Posted:
18 December 2023
You are already at the latest version
Abstract
The aim of the research presented here is to assess the impact of depressive disorders on the potential of the labour markets in the countries of the European Union, with particular reference to the disparities between the 'old' and 'new' EU countries. The initial hypothesis of persistent inequalities in the system under study was verified by analysing the process of convergence in the burden of depressive disorders among people aged 20-54 that occurred in the EU-27 group of countries between 1990 and 2019. The study used data from the Global Burden of Disease Study 2019 (IHME, 2020), which examined the number of years lived with disability (YLD) due to depression in the working age population. The analysis showed that the high burden of the consequences of depressive disorders is particularly true for the highly developed economies of the EU-14. The results of the convergence assessment did not confirm the real effect of catching up over time with economies in a more favourable situation, and the inequalities observed at the beginning of the analysis period deepened..
Keywords:
indirect costs of depression
; burden of disease
; lost productivity
; inequality in the EU
1. Introduction
Depressive disorders are now common in both developed and developing countries. Chronic depressive conditions are also increasingly observed in the working age population and are threatening to become a serious and costly problem, both at the level of individual households and the economy as a whole. The World Health Organization [1] estimates that depressive disorders currently affect 3.8% of the population, including 5% of adults (4% of men and 6% of women). According to data from the Institute for Health Metrics and Evaluation [2] from the resulting Global Burden of Disease Study in 2019, depression was found to be the fourth leading cause of disability worldwide. The contribution of depressive disorders to total years lived with disability (YLD) due to all chronic diseases was 6.1% for men and 7.3% for women. Over the past three decades, the number of years lived with disability due to depressive disorders per 100,000 people has increased from 409.3 to 468.3 for men and from 536.2 to 551.0 for women. In 2019, depressive disorders accounted for 32.0% of the burden of mental illness for men and 41.9% for women. Worldwide, they are estimated to have accounted for more than 46.9 million years of disability over this period, of which 61.2% were attributable to women.
Mental disorders, such as depression, are a common problem that also affects people of working age [3]. In many highly developed countries, they are the most common cause of long-term sickness absence and loss of working capacity [4]. These disorders reduce the productivity of workers who continue to work despite their illness (a phenomenon known as presenteeism). The high burden of depressive disorders in highly developed economies is particularly evident in the very young population, which is an important determinant of labour resource potential. In the United States, the group with the highest burden is 20-24 year olds, which is reflected in high rates of years of disability (YLDs) per 100 000 people, i.e., 1759.4 for women and 993.2 for men. In this age group, depression accounts for 9.7% of YLDs from all causes for women and 7.6% for men. Among people of working age, both the burden rates and the contribution of depressive disorders to the total burden of disability from all causes, decrease with age.
In contrast, a different pattern of burden of depressive disorders among people of working age can be observed in the countries of the European Union. The highest burden, measured in years of disability per 100 000 people of that age, is observed in older populations entering the labour market. For women, the highest burden was observed in the 45-49 age group, with a burden rate of 1172.8. Among the working age male population, the most affected group is the 50-54 age group, with a burden rate of 703.6 years of disability due to depressive disorders per 100 000 persons in this group. In the EU27, the lowest burden of depressive disorders in the working age population is generally observed among young people. The above dimension of the burden of depressive disorders in working age people translates into measurable economic and social costs, estimated in terms of lost productivity of affected workers. According to the OECD [5], more than 30% of these costs are due to the lower employment rate and lower productivity at work of people with mental health problems.
The aim of the research presented here is to assess the impact of depressive disorders on the potential of labour markets in European Union countries, with a particular focus on the inequalities between 'old' and 'new' EU countries. The study attempts to assess the convergence that is taking place in this area, assuming a process of levelling out possible initial differences in the level of this phenomenon, determined by the socio-economic integration of the EU-27 area. The long-term consequences of the impact of depressive disorders on the burden of individual EU economies were expressed in terms of years of disability (YLDs) lost due to this condition in the working age population. The analysis used data from the Institute for Health Metrics and Evaluation [2] from the Global Burden of Disease Study 2019.
2. Mental illness and labour market outcomes - a review of the evidence
The impact of mental illness, including depressive disorders in particular, on labour market outcomes has been the subject of much well-documented research. There is strong evidence that mental illness, measured mainly as depression and/or anxiety, is associated with productivity losses due to absenteeism or presenteeism of the sufferer [6]. These studies provide empirical evidence that mental disorders are associated with a higher risk of unemployment and lower earnings [7], increased absenteeism and reduced labour supply of those affected [8,9,10]. At the same time, these studies show a strong impact of mental illness on employment and clear evidence of reduced levels of work skills. According to Cornwell et al. [11], each mental disorder reduces the likelihood of labour market participation by 1.3 percentage points, which is significant given that most people with mental disorders have several categories of disorders at the same time. Frijters et al. [12] found strong evidence from Australian panel data that a deterioration in mental health leads to a significant reduction in employment. They showed that a one standard deviation deterioration in mental health leads to a 30 percentage point reduction in the probability of employment. This effect holds for both men and women. Banerjee et al. [13] estimate an increase in the probability of employment of 18 and 11 percentage points for men and women, respectively, when their mental health improves to the level of those who do not meet the criteria for any mental illness.
Research into the impact of mental disorders on labour market outcomes is also paying increasing attention to the problem of presenteeism, which results in reduced productivity of those who are ill at work. Research by Marlowe [14] specifically identifies mental health problems such as depression and stress as the main causes of acute presenteeism, followed by musculoskeletal and respiratory disorders. The results of Johnston et al. [15] confirm the existence of a significant association between depression severity and absenteeism and presenteeism, indicating an increase in absenteeism and a decrease in productivity as the severity of illness increases. The relationship between decreasing levels of mental well-being (MWB) and increasing loss of productivity was demonstrated in the study by Santini et al. [16]. The results of a study by Stewart et al. [17] showed that employees suffering from depression reported significantly more total health-related LTP (lost productive time) than employees without depression - an average of 5.6 hrs/week compared with the expected 1.5 hrs/week. According to the researchers, as much as 81% of the cost of LTP could be explained by reduced productivity at work due to depressive illness.
Vigo et al. [18] argue that the global burden of mental illness is underestimated in terms of the economic cost of illness. These researchers identified five main reasons for this, pointing to factors such as (1) the overlap between psychiatric and neurological disorders, (2) the grouping of suicide and self-harm as a separate outcome category, (3) the combination of all chronic pain syndromes with musculoskeletal disorders, (4) the exclusion of personality disorders from the calculation of the burden of mental illness, and (5) the insufficient consideration of the impact of severe mental illness on all-cause mortality. Using published data, they estimated the global burden of mental illness and found that it accounted for 32.4% of total years lived with disability (YLDs) and 13.0% of disability-adjusted life years (DALYs).
In the case of mental disorders, additional mechanisms determining the labour market performance of people with disabilities should also be identified. These stem both from employers' attitudes towards people with mental disorders and from discrimination in the workplace. A study conducted by Sander et al. [19] on a group of more than 5,000 German employees found that the risk of presenteeism worsens with increasing levels of mental health stigma. The results obtained by these researchers showed that 55% of respondents experienced a current deterioration in mental wellbeing and 65% of respondents would feel at least some shame if they suffered from a mental illness. In the case of experiencing a mental illness, 54% of respondents indicated probable presenteeism, and the same number of people with mental illness would go to work without informing their managers and colleagues.. Brouwers [20] suggests in his research that the high unemployment of people with mental illness and mental health problems is largely due to the stigma they experience at work. Employers and immediate supervisors have negative attitudes towards people with mental health problems, which significantly reduces their chances of employment. Bonaccio et al. [21] point out that a common concern of employers is the low productivity of employees with chronic diseases. Economic, institutional and cultural determinants influence employers' attitudes towards the recruitment and employment of people with health limitations, especially when these limitations are due to mental disorders. Cybula-Fujiwara et al. [22], who conducted research in this area, confirmed that there is a prevailing view among employers that people with mental illness have a limited ability to work, and that social attitudes towards these people tend to be marked and stigmatised. As a result, employers avoid hiring employees with disabilities resulting from mental disorders by trying to overlook this segment of the labour market [23].
Interactions resulting from the endogeneity of the relationship between the level of mental disorders observed in the working-age population and the work efficiency of sick people are the subject of detailed research. Their results suggest that work stress affects a range of health outcomes for workers, including the impact on their mental health. Brunner et al. [24], using representative cross-sectional data for Swiss workers, provide evidence that work resources buffer the negative impact of stressors on productivity losses. They show that a 1% increase in work stressors has a greater impact on health-related productivity losses than a 1% decrease in work resources over the same period. Sørensen et al. [25], based on an 18-year follow-up of the Danish workforce, found that work stress, measured as a combination of job strain and an imbalance between effort and reward, was associated with a higher future incidence of chronic disease. Studies by Burns et al. [26] and Limmer & Schütz [27] also confirmed that time pressure, job insecurity and conflict were negative predictors of employees' mental health. On the one hand, mental health should be seen as a component of an individual's health capital stock that determines his or her productivity [28], while on the other hand, a relationship can be found between the conditions of the work environment and the level of employees' exposure to mental disorders [29].
Researchers on the issue of measuring the burden of chronic diseases in terms of labour market outcomes point out that there is still a need for research on how to measure the value of lost productivity caused by long-term health limitations in workers. Indeed, standardised methods for measuring this phenomenon have not yet been developed in this area [30,31]. The most widely used approach to assessing productivity losses from an employer's perspective derives from human capital theory, according to which the loss of healthy life years represents a loss of productivity, the value of which in competitive markets can be assessed on the basis of the amount of wages lost or the value of the potentially producible product during this period [32,33,34]. The findings of Zhang et al. [35], on the other hand, provide convincing evidence that productivity losses due to employee absenteeism exceed the wages of team workers, especially in small firms. Given the shortcomings of the human capital method, an alternative approach to the valuation of lost output based on the so-called frictional cost theory has been proposed in the literature. This approach limits the productivity costs resulting from the absence of a sick employee to those associated with the time needed to hire and train a replacement employee [36,37,38]. Similarly, with regard to presenteeism caused by the effects of illness, most studies focus on the possibility of measuring it, identifying this issue as a necessary step in establishing the link between health and productivity [39]. Brouwer et al. [40] emphasise that the cost of lost productivity can be an important component of total costs in the economic assessment of the burden of illness, and that estimating productivity losses is a key element in calculating productivity costs.
3. Materials and Methods
The analysis of the burden on the EU economy of the consequences of depressive disorders in people of working age was carried out using indicators of years lived with disability (YLD) due to the illness. The choice of variables analysed was based on a review of methodologies proposed in the literature to assess the phenomenon under study [41,42]. Selected indicators allow to illustrate the lost time of healthy life, including the potential lost time of effective work of people of working age, which also indicates the level of burden on national economies caused by selected diseases. Comparability of data between EU Member States has been achieved by using intensity indicators, which relate the number of observed cases to a given population size.
The analysis used an indicator measuring the number of potentially disabling life years (YLD) due to depressive disorders (DD) per 100 000 people, i.e., the YLD(DD)rate observed in the population aged 20-54. The choice of the population in this age group was determined both by the assumption that this population represents the potential workforce with the highest productivity (including a lower burden of other chronic diseases) and by the availability of aggregated data for a population of high labour market relevance. For the purpose of the planned assessment of inequalities in the burden of depressive illness observed for the 'old' and 'new' EU economies, two groups were distinguished: (1) EU-14 countries, representing highly developed economies with market traditions, which joined the EU before 2004, and (2) EU-Central and Eastern European countries, which joined the EU structures after 2004 and have experience of systemic transformation. Statistical measures were used to determine the degree of dispersion of the parameters analysed at the level of the EU-27 countries and in relation to the groups of countries analysed. Due to the strong gender differentiation of the phenomenon under study, the analysis was carried out separately for women and men.
The assessment of the level of inequality in the process analysed was based on the use of the relative health gap (RHG) indicator, which makes it possible to determine the statistical level of the 'chance' of experiencing the negative consequences of depressive disorders (loss of health) observed in the EU-14 compared to the EU-CEE. The estimation of the relative health gap (RHG) in the level of burden of chronic disease consequences, which defines the level of inequality between the study groups, was done according to the following formula:
where: h(A) is the health burden measure for group A, while h(B) is the corresponding measure for group B.
Prior to a substantive assessment of the inequalities studied, a statistical assessment of the significance of the observed differences in the parameters analysed between the different groups of EU-27 countries was carried out. For the purposes of the study, it was hypothesised that belonging to certain groups of EU countries has a significant impact on the level of health burden of depressive disorders. As a result, there are statistically significant differences between the EU-14 and EU-CEE study groups in terms of the average number of healthy years lost to depressive disorders, but the ongoing socio-economic integration processes in the EU-27 have reduced the observed differences over time. The expected effect of the reduction in inequalities in the burden of depressive illness in the EU-27 economies will be an apparent process of convergence, involving a reduction in the average level of the indicators studied over time, together with a reduction in their dispersion. In order to show the basis of the phenomenon under study, data on the level of severity of depressive symptoms in the EU27 have been collected. The data presented are based on Eurostat data [43].
The statistical significance of differences among the mean values of the variables studied in select EU groups were assessed using the adopted testing scheme. Based on the assessment of the normality of the distribution of the studied variables (Shapiro-Wilk test), a scheme for testing the significance of the differences was selected, assuming that if the normality of the distribution of the variables was confirmed, the Brownian-Forsyth test would be used to assess the homogeneity of the distribution of the variances for the independent samples studied. If the homogeneity of the variances was confirmed, the Student's t-test was used, while in the case of significant differences in the variances of the variables analysed, the Welch test was used. In the absence of confirmation of the normality of the distribution, the non-parametric Mann-Whitney test was used to assess differences in the mean level of the variables between the groups of countries studied. The null hypothesis was rejected if the probability of the p-test was below the assumed significance level of the test α=0.05. Calculations were carried out using Statistica 13 software.
The expected effect of decreasing inequalities in the burden of disease on EU economies will be a visible process of convergence, consisting of a decrease over time in the average level of the indicators studied as their dispersion decreases. The assessment of the system under review has used the concept of unconditional beta (β) convergence, which takes into account different initial conditions and predicts that outliers will catch up more quickly with the target, and the concept of sigma (σ) convergence, defined as a reduction in the dispersion of performance.
In order to test the beta convergence hypothesis using cross-sectional data, an explanatory model was used to model the growth of the trait under consideration in each EU27 country (i=1....N) between period t0 and t0+T, using the initial value of the trait in each Member State according to the formula:
where: yit – value of the characteristic y in area i in period t; uit – random biases.
The existence of beta convergence is confirmed by the negative and statistically significant value of the estimator b:
A negative sign of the parameter b indicates the presence of beta convergence between Member States.
The analysis assumes that beta convergence takes place in the study area when countries with an initially worse value of a given variable (the highest level of the YLD(DD)rate) catch up by showing a faster rate of transition to the expected state, i.e., the ratio of the parameters yit0+T/yit0 tends towards the lowest possible value. The inclusion of absolute (unconditional) convergence in the study implies the assumption that all countries move towards the same long-run equilibrium state and reach it at the same time. However, countries with a worse initial position have a longer way to go.
The occurrence of sigma convergence means the achievement of the expected reduction in the level of dispersion (scatter) of the studied trait over time. In order to verify the hypothesis of the occurrence of sigma-convergence in the studied system, the amount of variance from the population in period t(σt2) was used as a measure of the dispersion of the given characteristic according to the formula:
where: yit – value of characteristic y in area i, in period t; ȳt – arithmetic mean of characteristic yi (for i=1,...N countries) in period .
In order to verify the sigma convergence hypothesis, the variances of the analysed variables were compared in extreme periods: t0 and t0+T. It was assumed that sigma convergence will occur if the value of the assumed dispersion index at the end of the analysed period (t0+T) is significantly lower than at the beginning (t0). Taking into account the specificity of the studied process (the burden of the EU countries with the consequences of depressive diseases), the expected positive effect of the convergence process in the conditions of economic development of the European Community area is a decrease in the average level of the studied parameters ( in time, along with a simultaneous decrease in the level of their dispersion (). The obtained results will allow to evaluate the convergence pattern in the studied system. Beta convergence is therefore a necessary but not sufficient condition for sigma convergence to occur.
4. The problem of the burden of depressive disorders in developed economies
Preliminary analysis of the data suggests that the level of socio-economic development of a region varies to some extent the magnitude of the burden of health impairment caused by depressive disorders (DD). According to data from the Institute for Health Metrics and Evaluation [2] on the burden of disease in global economies, depending on the level of socio-economic development (SDI measure), the YLD(DD)rate (i.e., YLDs per 100,000 people) varied in 2019 between 669.2 (low SDI countries) and 855.0 (high SDI countries) for women and between 433.2 (medium SDI countries) and 530.8 (high SDI countries) for men. Therefore, there is no significant difference in the exposure level observed among the groups, with a slight inclination to decline with the decreasing SDI. For both women and men, the highest levels of YLD(DD) were found in countries with the highest level of development (Table 1).
On average, depressive disorders account for 6% of the total number of years of disability due to health impairments for women and 5% for men. The contribution of these diseases to the total burden of disability is estimated to be highest in countries with low levels of development (6.5% of total years of disability for women and 5.3% for men) and lowest in the most developed countries (5.4% of total years of disability for women and 4.2% for men).
Over the period 1990-2019, an increase in the burden of depressive disorders was observed in all groups of countries, with the average rate of increase being highest in the group of medium SDI countries and lowest in the group of low SDI countries. It is also characteristic that the share of depressive disorders in the total burden of disease decreased in the group of high SDI countries over the period studied, while it increased significantly in the group of low SDI countries (see Table 1).
A characteristic feature of the approach to estimating the burden of depressive disorders used in the GBD study is that it focuses exclusively on the impact of the disease on years lived with disability (YLD). Due to methodological problems in attributing deaths to a specific mental disorder, GBD estimates of the burden of depressive disorders in terms of years of life lost (YLL) - as is the case with these statistics for most chronic diseases - are not available. Therefore, in the case of the data presented, the problem of the burden of depressive disorders is represented only by the degree of disability of those affected, and this effect is particularly severe in the case of women.
For EU countries, the total number of years of healthy life lost due to depressive disorders in 2019 was more than 3.8 million. The observed levels and trends in the burden of depressive disorders allow the EU27 to fit into the patterns observed in the group of countries with the highest level of development, but with a higher YLD(DD) index than this group (and consequently much higher than the levels observed in the other SDI groups). In 2019, the average YLD(DD) in the EU27 was 934.3 for women and 551.0 for men. These rates increased slightly between 1990 and 2019, by 1.8% for women and 2.8% for men (Figure 1).
The patterns of the share of depressive disorders in the total burden of disease are also similar to those in the most developed countries. In the group of EU-27 countries in 2019, this share was 6.0% for women and 4.5% for men of the total number of years lived with disability (YLD) due to all diseases. Over the period 1990-2019 in the EU-27, a decrease in this share is also observed at the level of the burden studied (a decrease of 8.0% for the group of women and 9.4% for the group of men). The decrease over time in the share of depressive disorders in the total burden of disease is a constant feature of the most developed economies. In economies with low levels of development (low SDI, low-middle SDI), the share of depressive disorders in the total burden of disease, estimated in terms of years of disability, is increasing (see Table 1).
Analysis of the spatial distribution of depressive symptom intensity across the EU-27 reveals a high degree of variation in the phenomenon. A significantly higher intensity of depressive symptoms is observed in the group of Northern European and Western European EU countries (Figure 2).
The evaluation of the relationship between the level of socio-economic development of a country and the level of burden of depressive disorders does not indicate the existence of a significant relationship between these parameters observed in the group of EU-27 countries (Table 2). The results indicate that for EU countries there is no clear correlation between the level of economic development of a country, measured by the value of the Gross Domestic Product per capita (GDP per capita), and the number of years of health lost due to depressive disorders (YLD(DD)rate). No significant relationship was also found when assessing the association between the level of economic development of the country and the direction and rate of change in the level of the YLDrate parameter over time. Weak (-0.2<r<0.1) and statistically insignificant correlation levels were obtained for both variables analysed (Table 2, Figure 3).
5. Results
Estimated at the level of national economies, the burden of depressive disorders on the working-age population, expressed in terms of years of disability due to the disease, shows that there are significant differences in the magnitude of this phenomenon between the EU-27 Member States. Taking into account the population of 20-54 year olds included in the study, in 2019 the level of burden of these diseases ending in disability (YLDrate) in the group of EU Member States was on average 1043 (women) and 594 (men) years of healthy life lost per 100 000 people of this age. For women, the YLD(DD) rate ranged from 560 (Poland) to 1579 (Greece). For men, it ranged from 373 (Slovakia) to 941 (Greece). Between 1990 and 2019, in the group of EU-27 countries, the level of the YLD rate in the population aged 20-54 decreased on average by 7.4% in the group of women and by 6.6% in the group of men. The downward trend in the level of this indicator was observed in most EU-27 countries (Table 3), with the largest reductions in the burden of long-term disability due to depressive disorders for women in Denmark (-29%) and for men in Finland (-26%). Significant increases in the YLD(DD) rate were recorded in, among others, Spain (31% increase - women and 11% increase - men) and Belgium (14% increase - women and 16% increase - men).
Analysis of the spatial distribution of the burden of depressive disorders among the working-age population in the Member States shows that the risk of negative consequences is much lower in the Central and Eastern European EU countries, for both women and men (Figure 4). In this group of countries, the observed rates of years of life lost due to disability as a result of depressive disorders are generally lower than in the rest of the EU-27. A notable exception is Lithuania, Latvia and Estonia, whose YLD(DD) rates for both women and men are in line with the average levels observed in the group of EU-14 countries. At the same time, the results of the analysis show a wide variation in both the direction and the rate of change in the level of the burden of disability due to depressive disorders in the working age population.
In order to verify the hypothesis assuming the existence of beta convergence in the area of equalisation of disparities in the burden of depressive disorders on labour resources in the EU-27 area, an explanatory model of the growth of the studied characteristic in individual EU-27 countries according to formula (2) was used. Assuming different initial conditions for individual EU countries, determined by the level of the variable YLD(DD) rate in 1990, the rate of change of the analysed parameters in individual countries in the period 1990-2019 (relation 2019/1990) was determined. It was assumed that in the case of Member States with worse initial conditions (high initial levels of the variable), this ratio should be as small as possible, indicating a rapid rate of decline of the analysed parameter, giving the effect of catching up with the group (beta convergence).
The regression models estimated from formula (2), explaining the growth of the indicators examined that determine the level of disability burden (YLDrate) following depressive disorders in the group of EU-27 countries, were as follows:
- a)
- variable YLD (DD)rateF:
, R2=0,099;
- b)
- variable YLD (DD)rateM:
, R2=0,085;
where: i=1, …, 27.
The resulting linear regression results of the studied parameters are shown in Figure 5.
The beta convergence results obtained indicate that for the parameters studied (YLD(DD) rate in the female population and in the male population aged 20-54) the value of the b-estimator is negative, which may indicate slow convergence processes in the group. However, the low level of fit of the regression models (R2) to the observed variables indicates that the process of equalisation of the health burden in the EU-27 group cannot be adequately explained by the process of convergence. The obtained results of the statistical significance of the estimators determined by the regression equations (Figure 5) indicate that in the case of the variables YLD(DD)rateF and YLD(DD)rateM there is no possibility of using them for further inference (statistically insignificant parameters assuming α=0.05). This indicates that it is not possible to confirm the existence of beta convergence in the EU-27 group with regard to the burden of disability on labour resources due to depressive disorders.
In addition, the assessment of the level of dispersion of the studied variable in the extreme periods of analysis t0 (year 1990) and t0+T (year 2019) shows that the level of dispersion of the parameter YLD(DD)rate has decreased over time both in the group of women and men, which indicates the effect of the reduction of disparities between the EU-27 countries. The statistical test of the hypothesis, which assumes the existence of sigma convergence in the group studied, showed that the variances of the variables studied in the initial and final periods are not statistically significantly different (for α=0.05). This indicates that the hypothesised condition for the existence of sigma convergence is not met for both study populations (Table 4).
Taking into account the disparities between the EU-27 economies identified in the study, as well as the indicated lack of real convergence effects in the level of burden on national labour resources due to health impairment caused by depressive disorders in the working-age population, an analysis of the extent of existing inequalities was carried out for the separate countries of the 'old' and 'new' Union. The observations presented confirm that the average burden of depressive disorders in the EU-14 economies is significantly higher than the average level recorded in the EU-CEE group countries for both the female and male population. The gap that existed in this respect in 1990 did not decrease significantly during the period under review. The observed decreasing trends of the parameters in both groups over time have a positive impact on the overall level of the burden of the health effects of depressive disorders in the European Union, but the too low rate of decline of the parameters studied in the group of EU-14 countries (which were already in a worse position to begin with) compared to the EU-CEE countries causes the observed disparities to persist over time (see Figure 6).
To confirm the measurability of the differences observed between the study groups, their statistical significance was assessed using the difference significance test scheme described above. When the normality of the distribution of the variables was confirmed (for α=0.05) for both study groups (parameters YLD(DD)rateF, 1990 and YLD(DD)rateF, 2019), the Forsyth-Brownian test was applied to confirm the equality of variance, followed by the Student's t-test. For variables for which normality of distribution was not confirmed for both study groups (parameters YLD(DD)rateM, 1990 and YLD(DD)rateM, 2019). The test probability p-values obtained (for α=0.05) allowed us to reject the null hypothesis in all cases, which means that the differences in the mean values of all the parameters studied are statistically significant. The test results obtained are presented in Table 5.
The degree of variation in the magnitude of the burden of the consequences of depressive disorders on the economies of the EU-27 is illustrated by the estimated relative health gap (RHG) in the context of the old and new EU countries. Its estimation made it possible to determine the extent of existing inequalities in this respect. The obtained results of the RHG(YLD(DD)) index indicate that the so-called "chance" of a resident of the EU-14 area being burdened with the negative effects of depressive disorders (long-term disability) is relatively higher than for a resident of the EU-CEE area. In 2019, the RHG(YLD(DD)) index was 1.37 for women and 1.34 for men. At the same time, the results show that the level of inequality has increased in the analysed period 1990-2019. In 1990, the RHG(YLD(DD)) index was 1.24 for women and 1.27 for men.
6. Conclusions
The relatively high burden of depressive disorders appears to be a particularly significant problem for the highly developed EU-14 countries. The analysis of the catching-up process of the less advantaged countries (i.e., with a high burden of depressive disorders) in the EU-27 group showed no positive convergence effect in this respect. In all the systems studied, there was no real catching-up effect over time for the more advantaged economies, and the inequalities observed at the beginning of the analysis period worsened. The differences diagnosed between the countries of the EU-14 group (the "old EU" countries) and the countries of the EU-CEE group (the EU countries of Central and Eastern Europe) indicate the existence of permanent and statistically significant differences in the area studied.
7. Discussion
The problem of the burden of mental disorders on national economies highlights a number of challenges in the process of achieving health equity in societies. Depressive disorders are a serious health problem for sufferers, disrupting work and family life, and can be life-threatening due to the risk of suicide. Maintaining a healthy and productive workforce is becoming increasingly challenging due to ongoing structural changes in the work environment, an ageing workforce and a growing number of workers suffering from work-related stress. Major Depressive Disorder (MDD) is one of the most common mental disorders in the world and one of the most disabling.
The economic consequences of societal health constraints have now become one of the key areas of research in health economics and pharmacoeconomics, and studies of the costs of chronic disease clearly show that mental disorders in working age people are associated with significant costs in terms of disability, sickness absence and lost productivity at work. Symptoms of depression cause significant distress and/or impairment in social, work and other important areas of life, but many people may be reluctant to seek treatment because of stigma and fear of repercussions such as losing their job or not being promoted. Results from the Survey of U.S. Workers Reveals Impact on Productivity from Depression [45] found that 64% of survey participants diagnosed with depression reported that cognitive challenges, such as difficulty concentrating, indecisiveness and/or forgetfulness, had the greatest impact on their ability to perform normal tasks at work. At the same time, presenteeism was found to be exacerbated by cognitive challenges. More than half (58%) of those diagnosed with depression did not inform their employer, mainly because of the risk of losing their job. Of all respondents, 24% confirmed that they felt it was risky to disclose this type of information to their employer in the current economic climate.
The results of the analysis of the burden of depressive disorders on the economies of the EU-27 countries indicate that, despite the need to take preventive measures in the field of mental health, this disease currently represents a significant limitation to the health of the EU population. Differences in the burden of depressive disorders among the working age population in the EU-27 make it necessary to recognise the specificity of this phenomenon in relation to national conditions. The results obtained indicate a disproportionate burden in countries with a high level of socio-economic development, suggesting the need to seek alternative methods to other chronic diseases in order to reduce both the incidence and the long-term negative effects of depressive disorders. In the case of chronic non-communicable diseases (NCDs), which manifest themselves in physical health limitations, there is a positive correlation in the EU-27 group of countries between the level of wealth of citizens and effective policies to reduce long-term health consequences [46]. The diagnosed inequalities between 'old' and 'new' EU countries in the level of burden of depressive disorders suggest that the severity of risk factors increases with the level of economic development of the country. At the same time, the results presented here are in line with studies on interregional differences in the prevalence of depressive disorders and their sociodemographic determinants (e.g., studies by Gutiérrez-Rojas et al. [47]; Huijts et al. [48]; Lim et al. [49]). Arias-de la Torre et al. [50] show that depressive disorders are common in Europe, but their prevalence varies widely between countries. Rai et al. [51] show that individual-level factors explain most of the international variation in depression prevalence, but country-level factors also contribute.
The material presented here is based on pre-2020 data, determined by the availability of NTS-1 comparisons and enforced by the specificity of behavioural, social and economic mental disorders. The Covid-19 pandemic and its associated disruptions to personal and professional life, unlike anything seen in developed countries in recent decades, have exacerbated many of the risk factors associated with poor mental health, leading to an unprecedented decline in mental health [52]. According to the OECD, the incidence of anxiety and depression doubled in some European countries in 2020 compared with the previous year [5]. Available data suggest that depressive symptoms in the first half of 2022 were lower than during the peaks in 2020 and 2021, but still higher than before the pandemic [53]. In France, depressive symptoms among adults peaked during the isolation period (over 20%) and fell to 15% in May 2022, a rate still higher than before the pandemic (13.5%). Similarly, in Belgium, where less than 10% of adults had depressive symptoms in 2018, the rate reached at least 20% during the peak of the pandemic in 2020 and 2021. The significant increase in the prevalence and burden of major depressive and anxiety disorders as a result of the COVID-19 pandemic was confirmed in the studies by Santomauro et al. [54] and Twenge & Joiner [55]. The results of Ettman et al. [56] suggest that the prevalence of depressive symptoms in the USA during Covid-19 was more than three times higher than before the pandemic. The results of Zolnierczyk-Zreda [57] suggest a significant increase in the level of depression among working Poles between 2019 and 2022, as well as an increase in the severity of their symptoms, probably due to the pandemic outbreak. This situation requires separate research in the area of estimating the costs of economic and social disruption associated with the COVID-19 pandemic.
The results of this study go beyond the framework presented so far in the literature on the consequences of mental illness, including depressive disorders in particular, from the perspective of lost productivity of labour resources. They introduce the perspective of existing inequalities in the area under study, observed among the EU-27 economies. The presented approach to the burden of depression on the working age population, in the context of limitations on the number of potentially productive years of life, also provides a basis for estimating the measurable economic effects of implementing effective interventions to improve the mental health of the population.
Funding
This research received no external funding.
Institutional Review Board Statement
Not applicable.
Informed Consent Statement
Not applicable.
Data Availability Statement
Global Burden of Disease Collaborative Network. Global Burden of Disease Study 2019 (GBD 2019) Results. Seattle, United States: Institute for Health Metrics and Evaluation (IHME), 2020. Available from https://vizhub.healthdata.org/gbd-results/ (accessed on 12 October 2023); Global Burden of Disease Health Financing Collaborator Network produced estimates for Gross Domestic Product (GDP) from 1960–2050. Estimates are reported as GDP per person in constant 2021 purchasing-power parity-adjusted (PPP) dollars. https://ghdx.healthdata.org/record/ihme-data/global-gdp-per-capita-1960-2050-fgh-2021 (accessed on 12 October 2023). Eurostat. (2023). Eurostat date: https://ec.europa.eu/eurostat/data/database [HLTH_EHIS_MH1E__custom_7368796] (accessed on 10 October 2023).
Conflicts of Interest
The authors declare no conflict of interest.
References
- Depressive disorder (depression), Fact sheets, WHO. https://www.who.int/news-room/fact-sheets/detail/depression (accessed on 10 October 2023).
- Global Burden of Disease Collaborative Network. Global Burden of Disease Study 2019 (GBD 2019) Results. Seattle, United States: Institute for Health Metrics and Evaluation (IHME), 2020. Available from https://vizhub.healthdata.org/gbd-results/ (accessed on 12 October 2023).
- Hasin, D.S., Sarvet, A.L., Meyers, J.L., Saha, T.D., Ruan, W.J., Stohl, M., Grant, B.F.. Epidemiology of adult DSM-5 major depressive disorder and its specifiers in the United States. JAMA psychiatry 2018, 75, 336–346. [CrossRef]
- Liu, Q., He, H., Yang, J., Feng, X., Zhao, F., Lyu, J. Changes in the global burden of depression from 1990 to 2017: Findings from the Global Burden of Disease study. Journal of psychiatric research 2020, 126, 134–140. [CrossRef]
- 5. A New Benchmark for Mental Health Systems: Tackling the Social and Economic Costs of Mental Ill-Health, OECD Health Policy Studies, OECD Publishing, Paris, 2021. [CrossRef]
- de Oliveira, C., Saka, M., Bone, L., Jacobs, R. The role of mental health on workplace productivity: A critical review of the literature. Applied health economics and health policy 2023, 21, 167–193. [CrossRef]
- Hakulinen, C., Elovainio, M., Arffman, M., Lumme, S., Pirkola, S., Keskimäki, I., ... Böckerman, P. Mental disorders and long-term labour market outcomes: Nationwide cohort study of 2 055 720 individuals. Acta Psychiatrica Scandinavica 2019, 140, 371–381. [CrossRef]
- Harvey, S.B., Henderson, M., Lelliott, P., Hotopf, M. Mental health and employment: Much work still to be done. The British Journal of Psychiatry 2009, 194, 201–203. [CrossRef]
- Banerjee, S., Chatterji, P., Lahiri, K. Identifying the mechanisms for workplace burden of psychiatric illness. Medical care 2014, 112-120. [CrossRef]
- Maske, U.E., Buttery, A.K., Beesdo-Baum, K., Riedel-Heller, S., Hapke, U., Busch, M.A. Prevalence and correlates of DSM-IV-TR major depressive disorder, self-reported diagnosed depression and current depressive symptoms among adults in Germany. Journal of affective disorders 2016, 190, 167–177. [CrossRef]
- Cornwell, K., Forbes, C., Inder, B., Meadows, G. Mental illness and its effects on labour market outcomes. The journal of mental health policy and economics 2009, 12, 107–118.
- Frijters, P., Johnston, D.W., Shields, M.A. The effect of mental health on employment: Evidence from Australian panel data. Health economics 2014, 23, 1058–1071. [CrossRef]
- Banerjee, S., Chatterji, P., Lahiri, K. Effects of psychiatric disorders on labor market outcomes: A latent variable approach using multiple clinical indicators. Health economics 2017, 26, 184–205. [CrossRef]
- Marlowe, J.F. Depression's surprising toll on worker productivity. Employee benefits journa 2002, 27, 16–21.
- Johnston, D.A., Harvey, S.B., Glozier, N., Calvo, R.A., Christensen, H., Deady, M. The relationship between depression symptoms, absenteeism and presenteeism. Journal of affective disorders 2019, 256, 536–540. [CrossRef]
- Santini, Z.I., Thygesen, L.C., Koyanagi, A., Stewart-Brown, S., Meilstrup, C., Nielsen, L., ... Ekholm, O. Economics of mental wellbeing: A prospective study estimating associated productivity costs due to sickness absence from the workplace in Denmark. Mental Health & Prevention 2022, 28, 200247. [CrossRef]
- Stewart, W.F., Ricci, J.A., Chee, E., Hahn, S. R., Morganstein, D. Cost of lost productive work time among US workers with depression. Jama 2003, 289, 3135–3144. [CrossRef]
- Vigo, D., Thornicroft, G., Atun, R. Estimating the true global burden of mental illness. The Lancet Psychiatry 2016, 3, 171–178. [CrossRef]
- Sander, C., Dogan-Sander, E., Fischer, J.E., Schomerus, G. Mental health shame and presenteeism: Results from a German online survey. Psychiatry Research Communications 2023, 3, 100102. [CrossRef]
- Brouwers, E.P. Social stigma is an underestimated contributing factor to unemployment in people with mental illness or mental health issues: Position paper and future directions. BMC psychology 2020, 8, 1–7. [CrossRef]
- Bonaccio, S., Connelly, C.E., Gellatly, I.R., Jetha, A., Martin Ginis, K.A. The participation of people with disabilities in the workplace across the employment cycle: Employer concerns and research evidence. Journal of Business and Psychology 2020, 35, 135–158. [CrossRef]
- Cybula-Fujiwara, A., Merecz-Kot, D., Walusiak-Skorupa, J., Marcinkiewicz, A., Wiszniewska, M. Pracownik z chorobą psychiczną–możliwości i bariery w pracy zawodowej. Medycyna Pracy 2015, 66, 57–69. [CrossRef]
- Giermanowska, E. Niepełnosprawni. Ukryty segment polskiego rynku pracy. Prakseologia 2016, 158, 275–298.
- Brunner, B., Igic, I., Keller, A.C., Wieser, S. Who gains the most from improving working conditions? Health-related absenteeism and presenteeism due to stress at work. The European Journal of Health Economics 2019, 20, 1165–1180. [CrossRef]
- Sørensen, J.K., Framke, E., Pedersen, J., Alexanderson, K., Bonde, J.P., Farrants, K., ... Rugulies, R. Work stress and loss of years lived without chronic disease: An 18-year follow-up of 1.5 million employees in Denmark. European Journal of Epidemiology 2022, 37, 389–400. [CrossRef]
- Burns, R.A., Butterworth, P., Anstey, K.J. An examination of the long-term impact of job strain on mental health and wellbeing over a 12-year period. Social psychiatry and psychiatric epidemiology 2016, 51, 725–733=. [CrossRef]
- Limmer, A., Schütz, A. Interactive effects of personal resources and job characteristics on mental health: A population-based panel study. International archives of occupational and environmental health 2021, 94, 43–53. [CrossRef]
- Grossman, M. The Demand for Health: A Theoretical and Empirical Investigation. National Bureau of Economay Research and Columbia University Press: New York, NY, USA, 1972, 1-111.
- Nikunlaakso, R., Reuna, K., Oksanen, T., Laitinen, J. Associations between accumulating job stressors, workplace social capital, and psychological distress on work-unit level: A cross-sectional study. BMC Public Health 2023, 23, 1–9. [CrossRef]
- Luppa, M., Heinrich, S., Angermeyer, M.C., König, H.H., Riedel-Heller, S.G. Cost-of-illness studies of depression: A systematic review. Journal of affective disorders 2007, 98(1-2), 29-43. [CrossRef]
- Koopmanschap, M., Burdorf, A., Lötters, F. Work absenteeism and productivity loss at work. In: Loisel, P., Anema, J. (eds) Handbook of Work Disability. Springer, New York, NY, 2013. [CrossRef]
- Rost, K.M., Meng, H., Xu, S. Work productivity loss from depression: Evidence from an employer survey. BMC health services research 2014, 14, 1–9. [CrossRef]
- Van den Hout, W.B. The value of productivity: Human-capital versus friction-cost method. Annals of the rheumatic diseases 2010, 69(Suppl 1), i89-i91. [CrossRef]
- Zhang, W., Bansback, N., Anis, A.H. Measuring and valuing productivity loss due to poor health: A critical review. Social science & medicine 2011, 72, 185–192. [CrossRef]
- Zhang, W., Sun, H., Woodcock, S., Anis, A.H. Valuing productivity loss due to absenteeism: Firm-level evidence from a Canadian linked employer-employee survey. Health economics review 2017, 7, 1–14. [CrossRef]
- Koopmanschap, M.A., Rutten, F.F., Van Ineveld, B.M., Van Roijen, L. The friction cost method for measuring indirect costs of disease. Journal of health economics 1995, 14, 171–189. [CrossRef]
- Krol, M., Brouwer, W. How to estimate productivity costs in economic evaluations. Pharmacoeconomics 2014, 32, 335–344. [CrossRef]
- Hanly, P., Ortega Ortega, M., Pearce, A., de Camargo Cancela, M., Soerjomataram, I., Sharp, L. Estimating Global Friction Periods for Economic Evaluation: A Case Study of Selected OECD Member Countries. PharmacoEconomics 2023, 1-9. [CrossRef]
- Schultz, A. B., Chen, C. Y., & Edington, D. W. The cost and impact of health conditions on presenteeism to employers: A review of the literature. Pharmacoeconomics 2009, 27, 365–378. [CrossRef]
- Brouwer, W., Verbooy, K., Hoefman, R., van Exel, J. Production Losses due to Absenteeism and Presenteeism: The Influence of Compensation Mechanisms and Multiplier Effects. PharmacoEconomics 2023, 41, 1103–1115. [CrossRef]
- Łyszczarz, B., Sowa, K. Production losses due to mortality associated with modifiable health risk factors in Poland. The European Journal of Health Economics 2022, 1-13. [CrossRef]
- Murray, C.J., Lopez, A.D. Measuring the global burden of disease. New England Journal of Medicine 2013, 369, 448–457. [CrossRef]
- (accessed on 10 October 2023).
- Global Burden of Disease Health Financing Collaborator Network Produced Estimates for Gross Domestic Product (GDP) from 1960–2050. Estimates Are Reported as GDP Per Person in Constant 2021 Purchasing-Power Parity-Adjusted (PPP) Dollars. Available online: https://ghdx.healthdata.org/record/ihme-data/global-gdp-per-capita-1960-2050-fgh-2021 (accessed on 12 October 2023).
- Survey of U.S. Workers Reveals Impact on Productivity from Depression, The Center for Workplace Mental Health. https://workplacementalhealth.org/mental-health-topics/depression/survey-of-u-s-workers-reveals-impact-on-productivi (accessed on 10 October 2023).
- Jakubowska, A., Bilan, S., Werbiński, J. Chronic diseases and labour resources:" Old and new" European Union member states. Journal of International Studies 2021, 14. [CrossRef]
- Gutiérrez-Rojas, L., Porras-Segovia, A., Dunne, H., Andrade-González, N., Cervilla, J.A. Prevalence and correlates of major depressive disorder: A systematic review. Brazilian Journal of Psychiatry 2020, 42, 657–672. [CrossRef]
- Huijts, T., Stornes, P., Eikemo, T.A., Bambra, C., HiNews Consortium. Prevalence of physical and mental non-communicable diseases in Europe: Findings from the European Social Survey (2014) special module on the social determinants of health. The European Journal of Public Health 2017, 27(suppl_1), 8-13. [CrossRef]
- Lim, G.Y., Tam, W.W., Lu, Y., Ho, C.S., Zhang, M.W., Ho, R.C. Prevalence of depression in the community from 30 countries between 1994 and 2014. Scientific reports 2018, 8, 2861. [CrossRef]
- Arias-de la Torre, J., Vilagut, G., Ronaldson, A., Serrano-Blanco, A., Martín, V., Peters, M., ... Alonso, J. Prevalence and variability of current depressive disorder in 27 European countries: A population-based study. The Lancet Public Health 2021, 6, e729–e738. [CrossRef]
- Rai, D., Zitko, P., Jones, K., Lynch, J., Araya, R. Country- and individual-level socioeconomic determinants of depression: Multilevel cross-national comparison. The British Journal of Psychiatry 2013, 202, 195–203. [CrossRef]
- Nikunlaakso, R., Reuna, K., Selander, K., Oksanen, T., Laitinen, J. Synergistic Interaction between Job Stressors and Psychological Distress during the COVID-19 Pandemic: A Cross-Sectional Study. International Journal of Environmental Research and Public Health 2022, 19, 13991. [CrossRef]
- . [CrossRef]
- Santomauro, D.F., Herrera, A.M.M., Shadid, J., Zheng, P., Ashbaugh, C., Pigott, D.M., ... Ferrari, A.J. Global prevalence and burden of depressive and anxiety disorders in 204 countries and territories in 2020 due to the COVID-19 pandemic. The Lancet 2021, 398, 1700–1712. [CrossRef]
- Twenge, J.M., Joiner, T.E. US Census Bureau-assessed prevalence of anxiety and depressive symptoms in 2019 and during the 2020 COVID-19 pandemic. Depression and anxiety 2020, 37, 954–956. [CrossRef]
- Ettman, C.K., Abdalla, S.M., Cohen, G.H., Sampson, L., Vivier, P.M., Galea, S. Prevalence of depression symptoms in US adults before and during the COVID-19 pandemic. JAMA network open 2020, 3, e2019686–e2019686. [CrossRef]
- Żołnierczyk-Zreda, D. Zaburzenia depresyjne pracujących Polaków w okresie pandemii COVID-19 (lata 2019–2022). Medycyna Pracy 2023, 74, 41–51. [CrossRef]
Figure 1.
Burden of depressive disorders (DD): YLDrate, EU area, in 1990 and 2019, all ages. Source: own elaboration based on: [2].
Figure 1.
Burden of depressive disorders (DD): YLDrate, EU area, in 1990 and 2019, all ages. Source: own elaboration based on: [2].
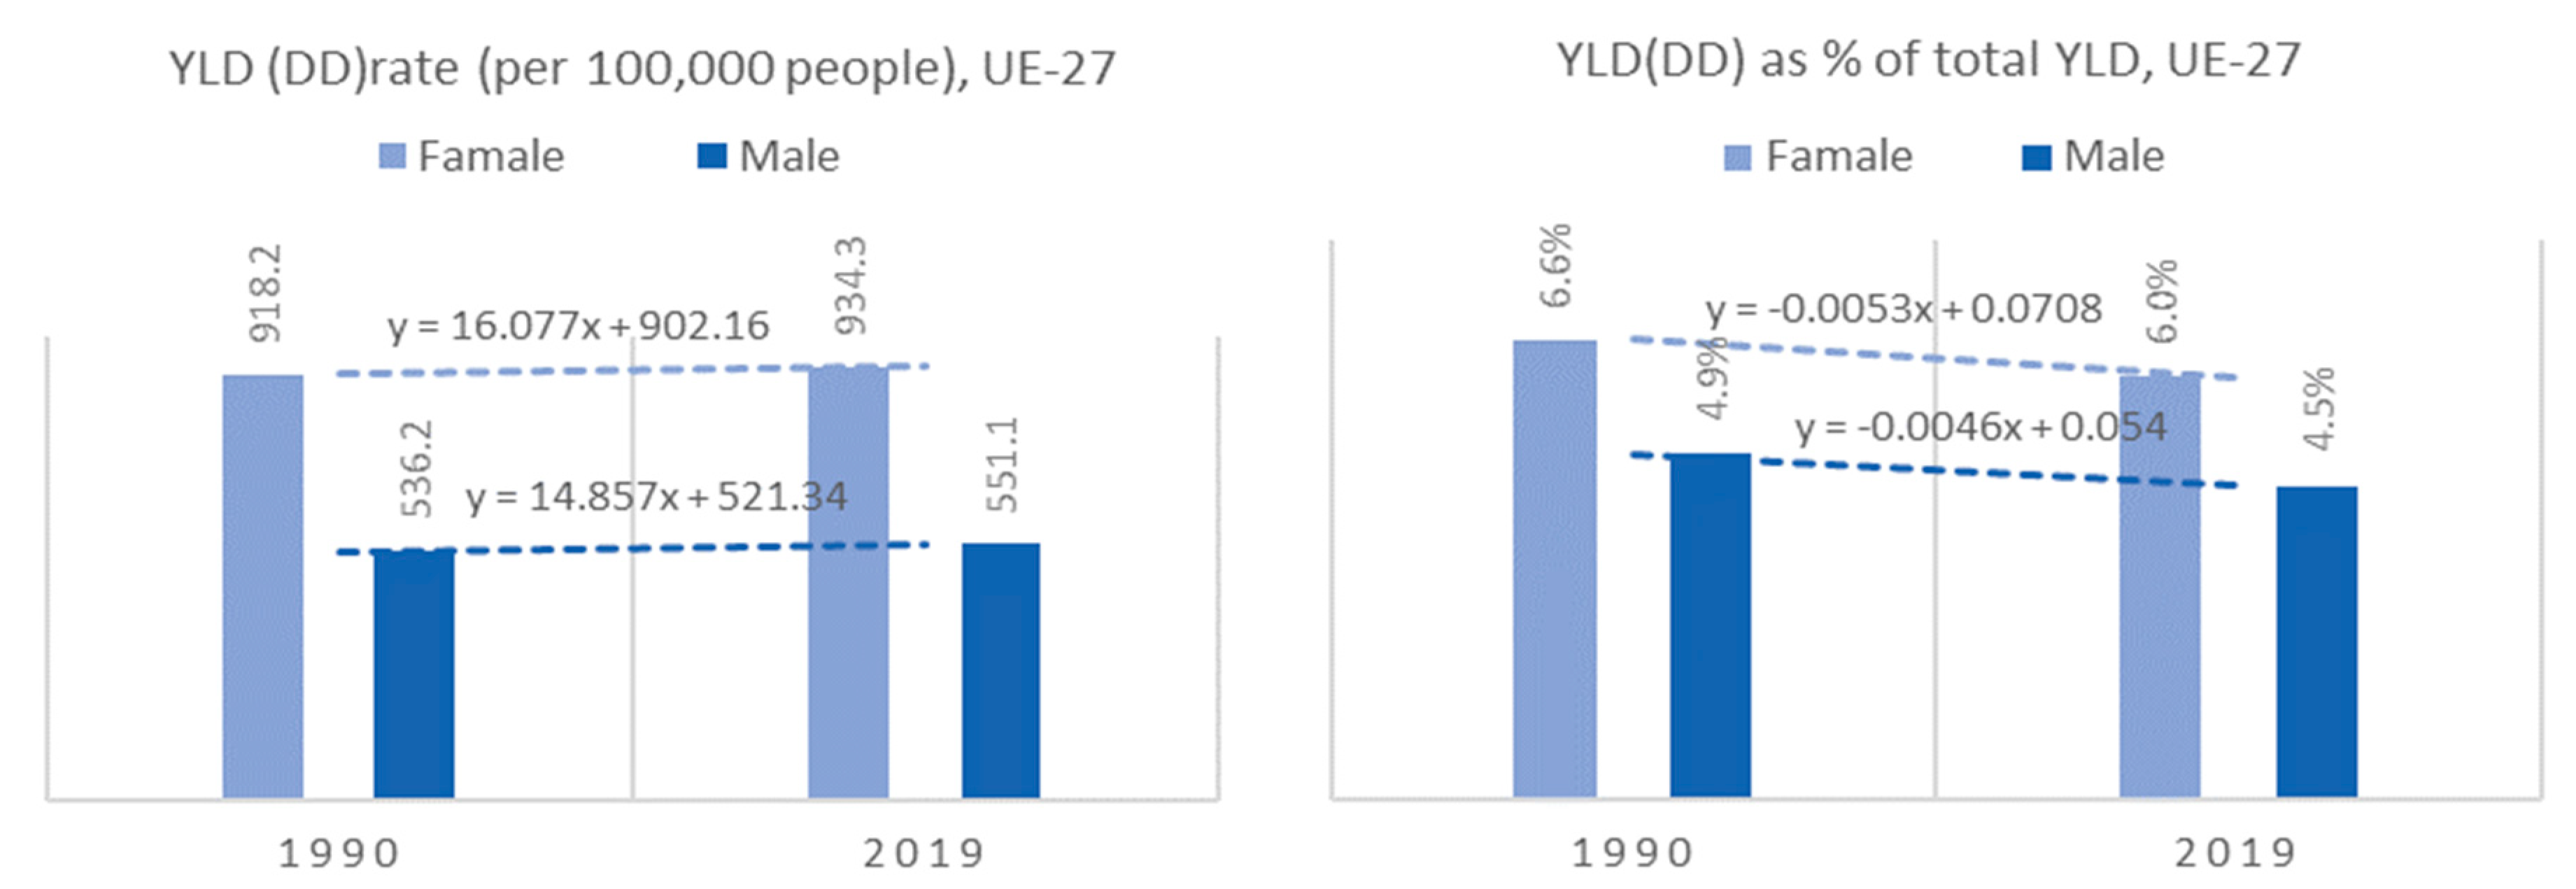
Figure 2.
Intensity of depressive symptoms, by sex, 2019, all age. Source: own elaboration based on: [43].
Figure 2.
Intensity of depressive symptoms, by sex, 2019, all age. Source: own elaboration based on: [43].
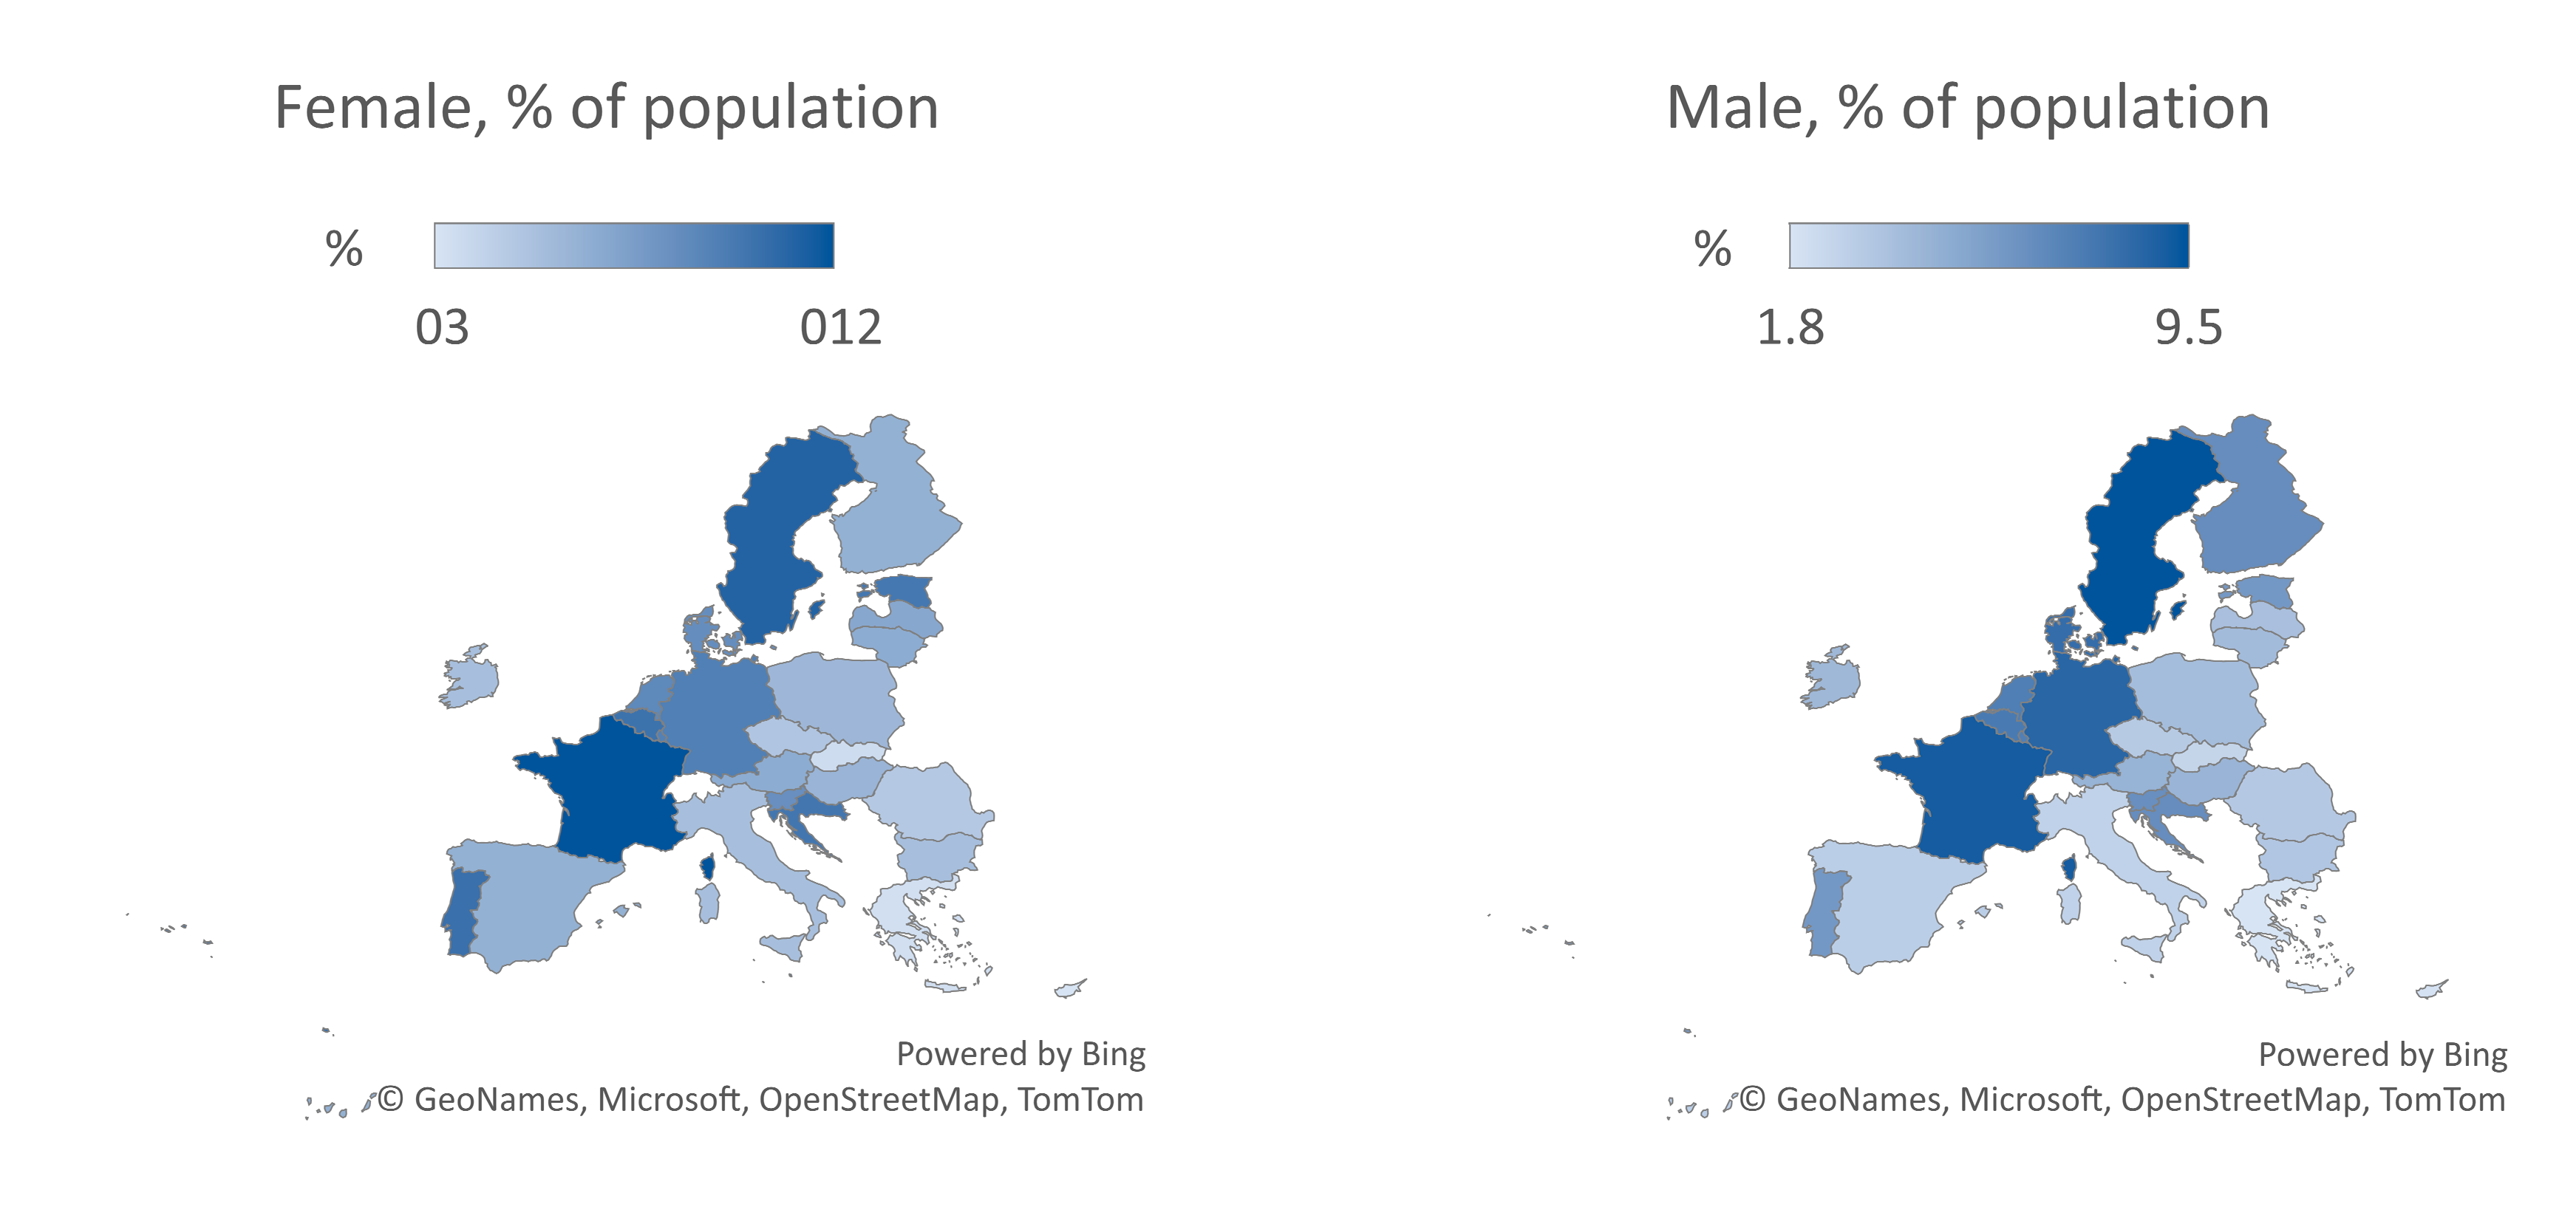
Figure 3.
Correlation matrix: GDP per cap., YLD(DD)rate, %ΔYLD(DD)rate, EU-27 countries, 2019.
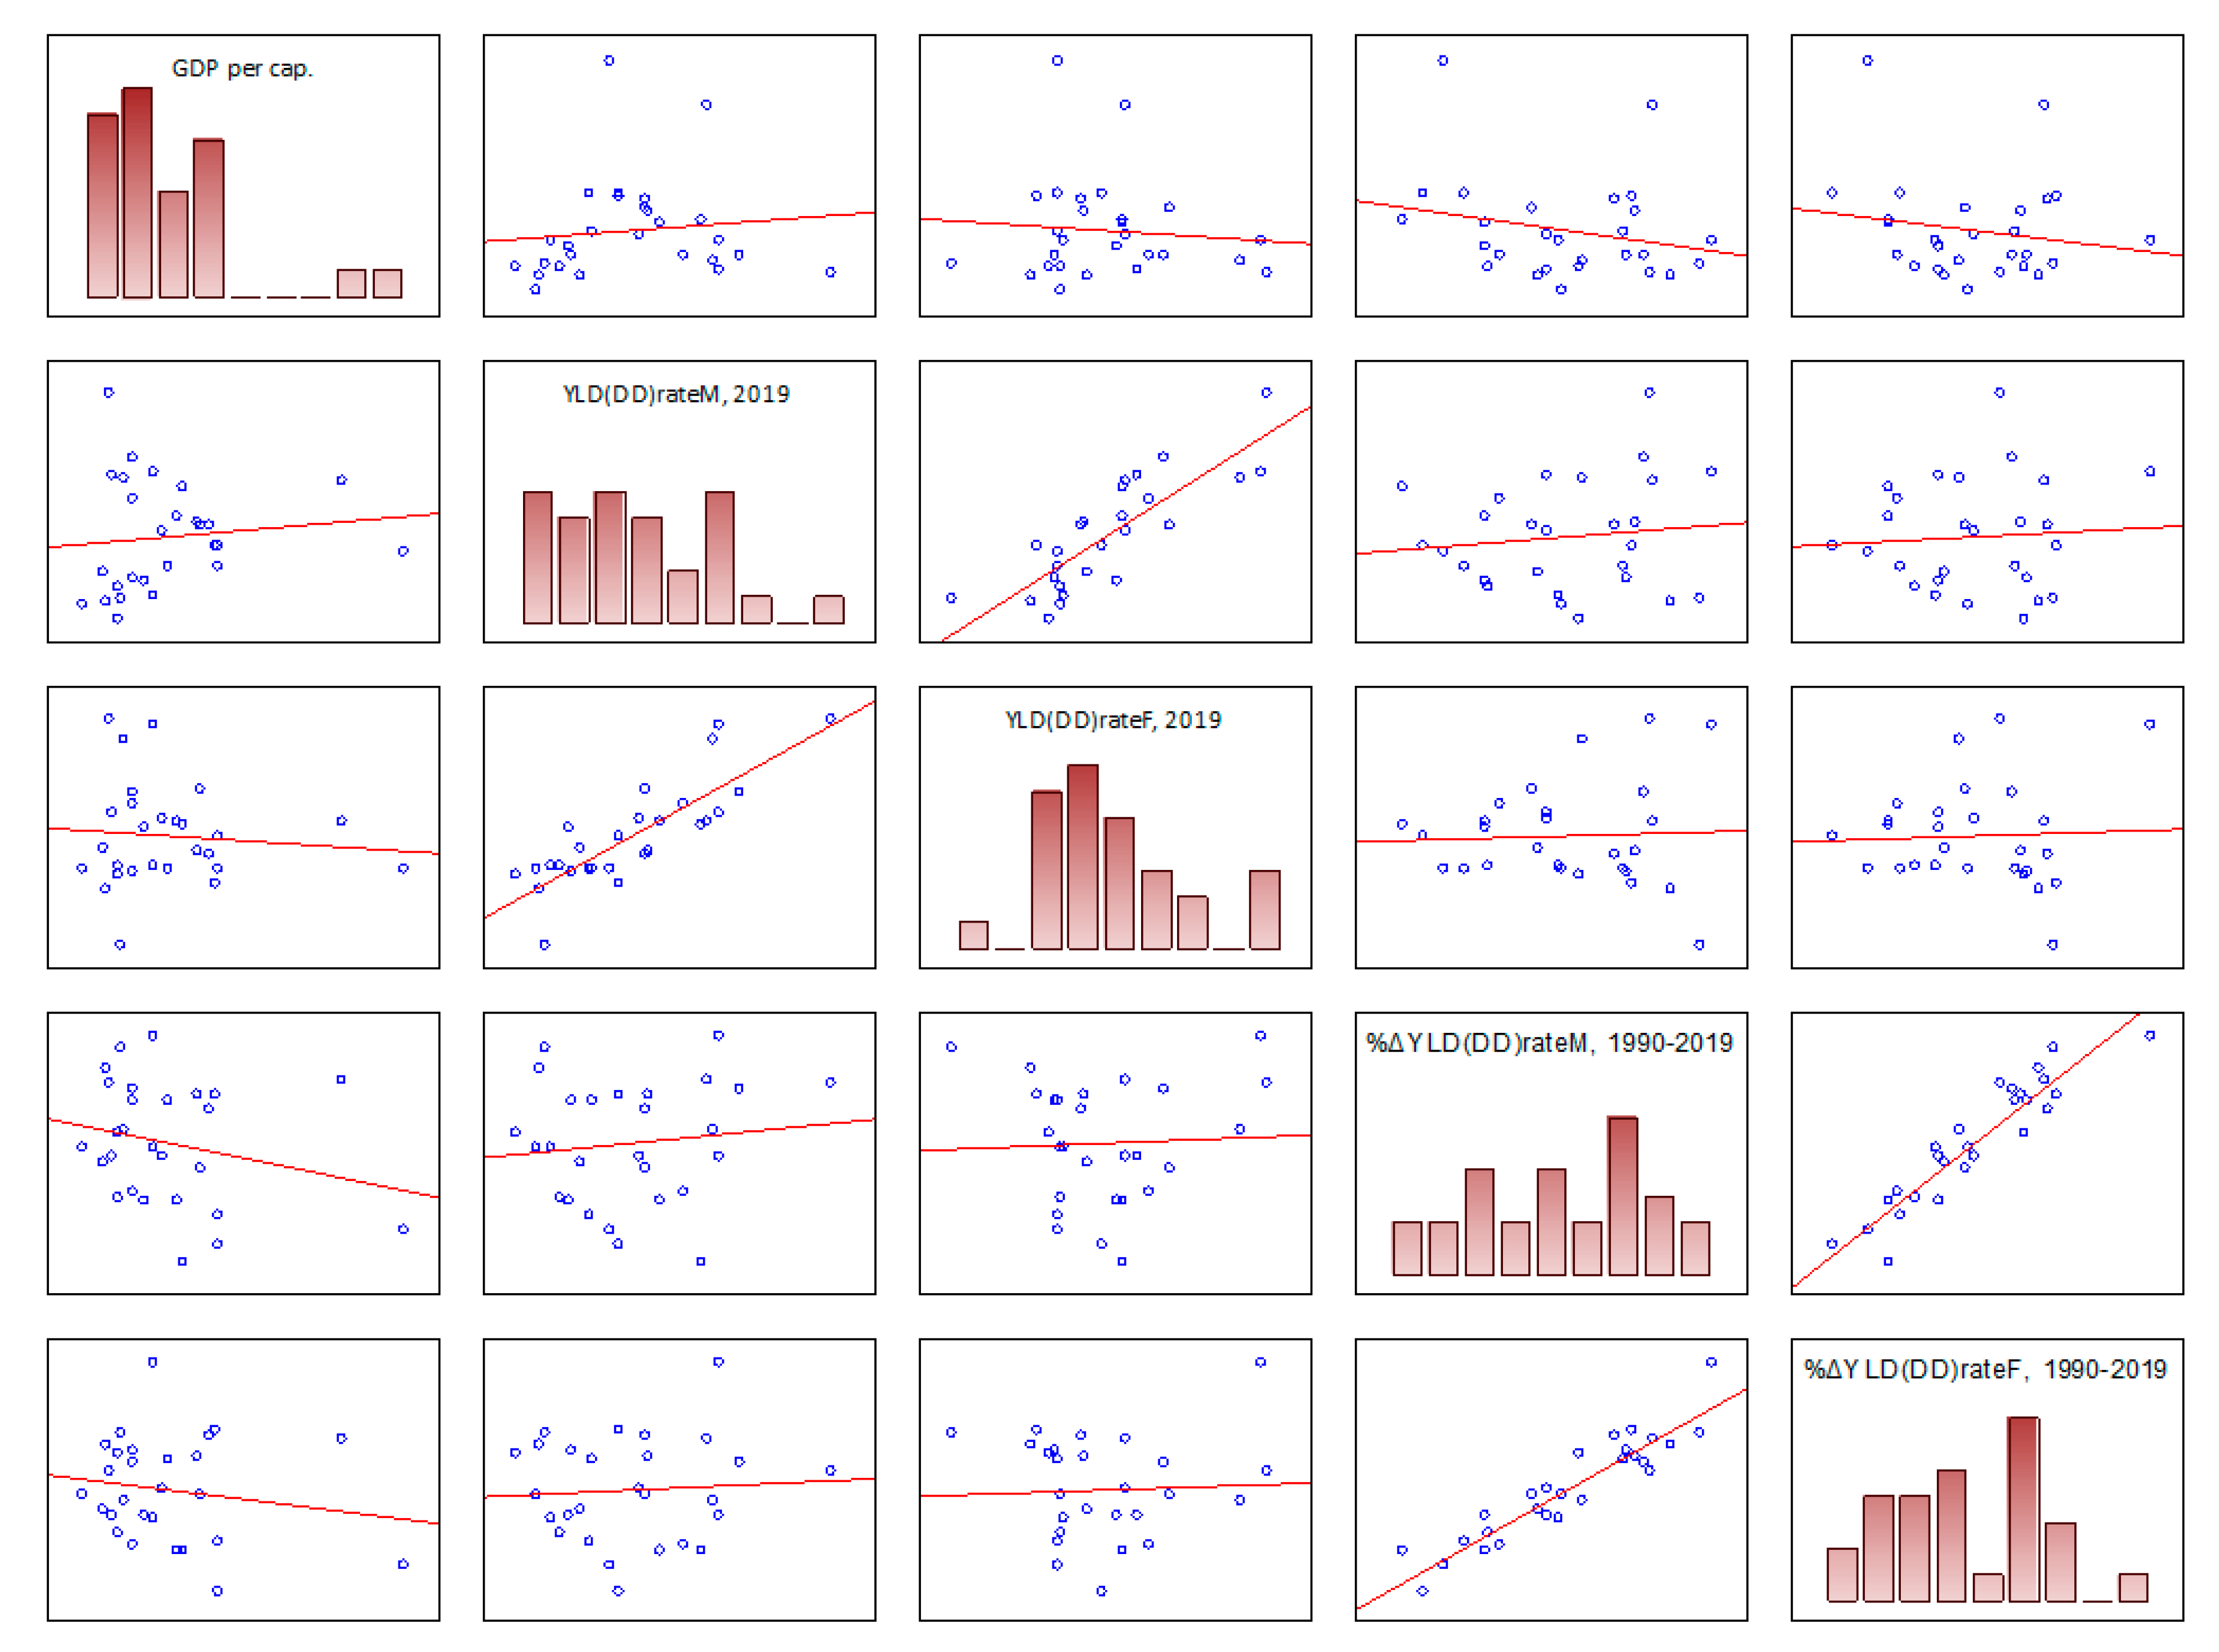
Figure 4.
Spatial distribution of YLD(DD)rate parameters, EU-27 countries, in 2019 and changes from 1990 to 2019), population aged 20-54 years. Source: own elaboration based on: [2].
Figure 4.
Spatial distribution of YLD(DD)rate parameters, EU-27 countries, in 2019 and changes from 1990 to 2019), population aged 20-54 years. Source: own elaboration based on: [2].
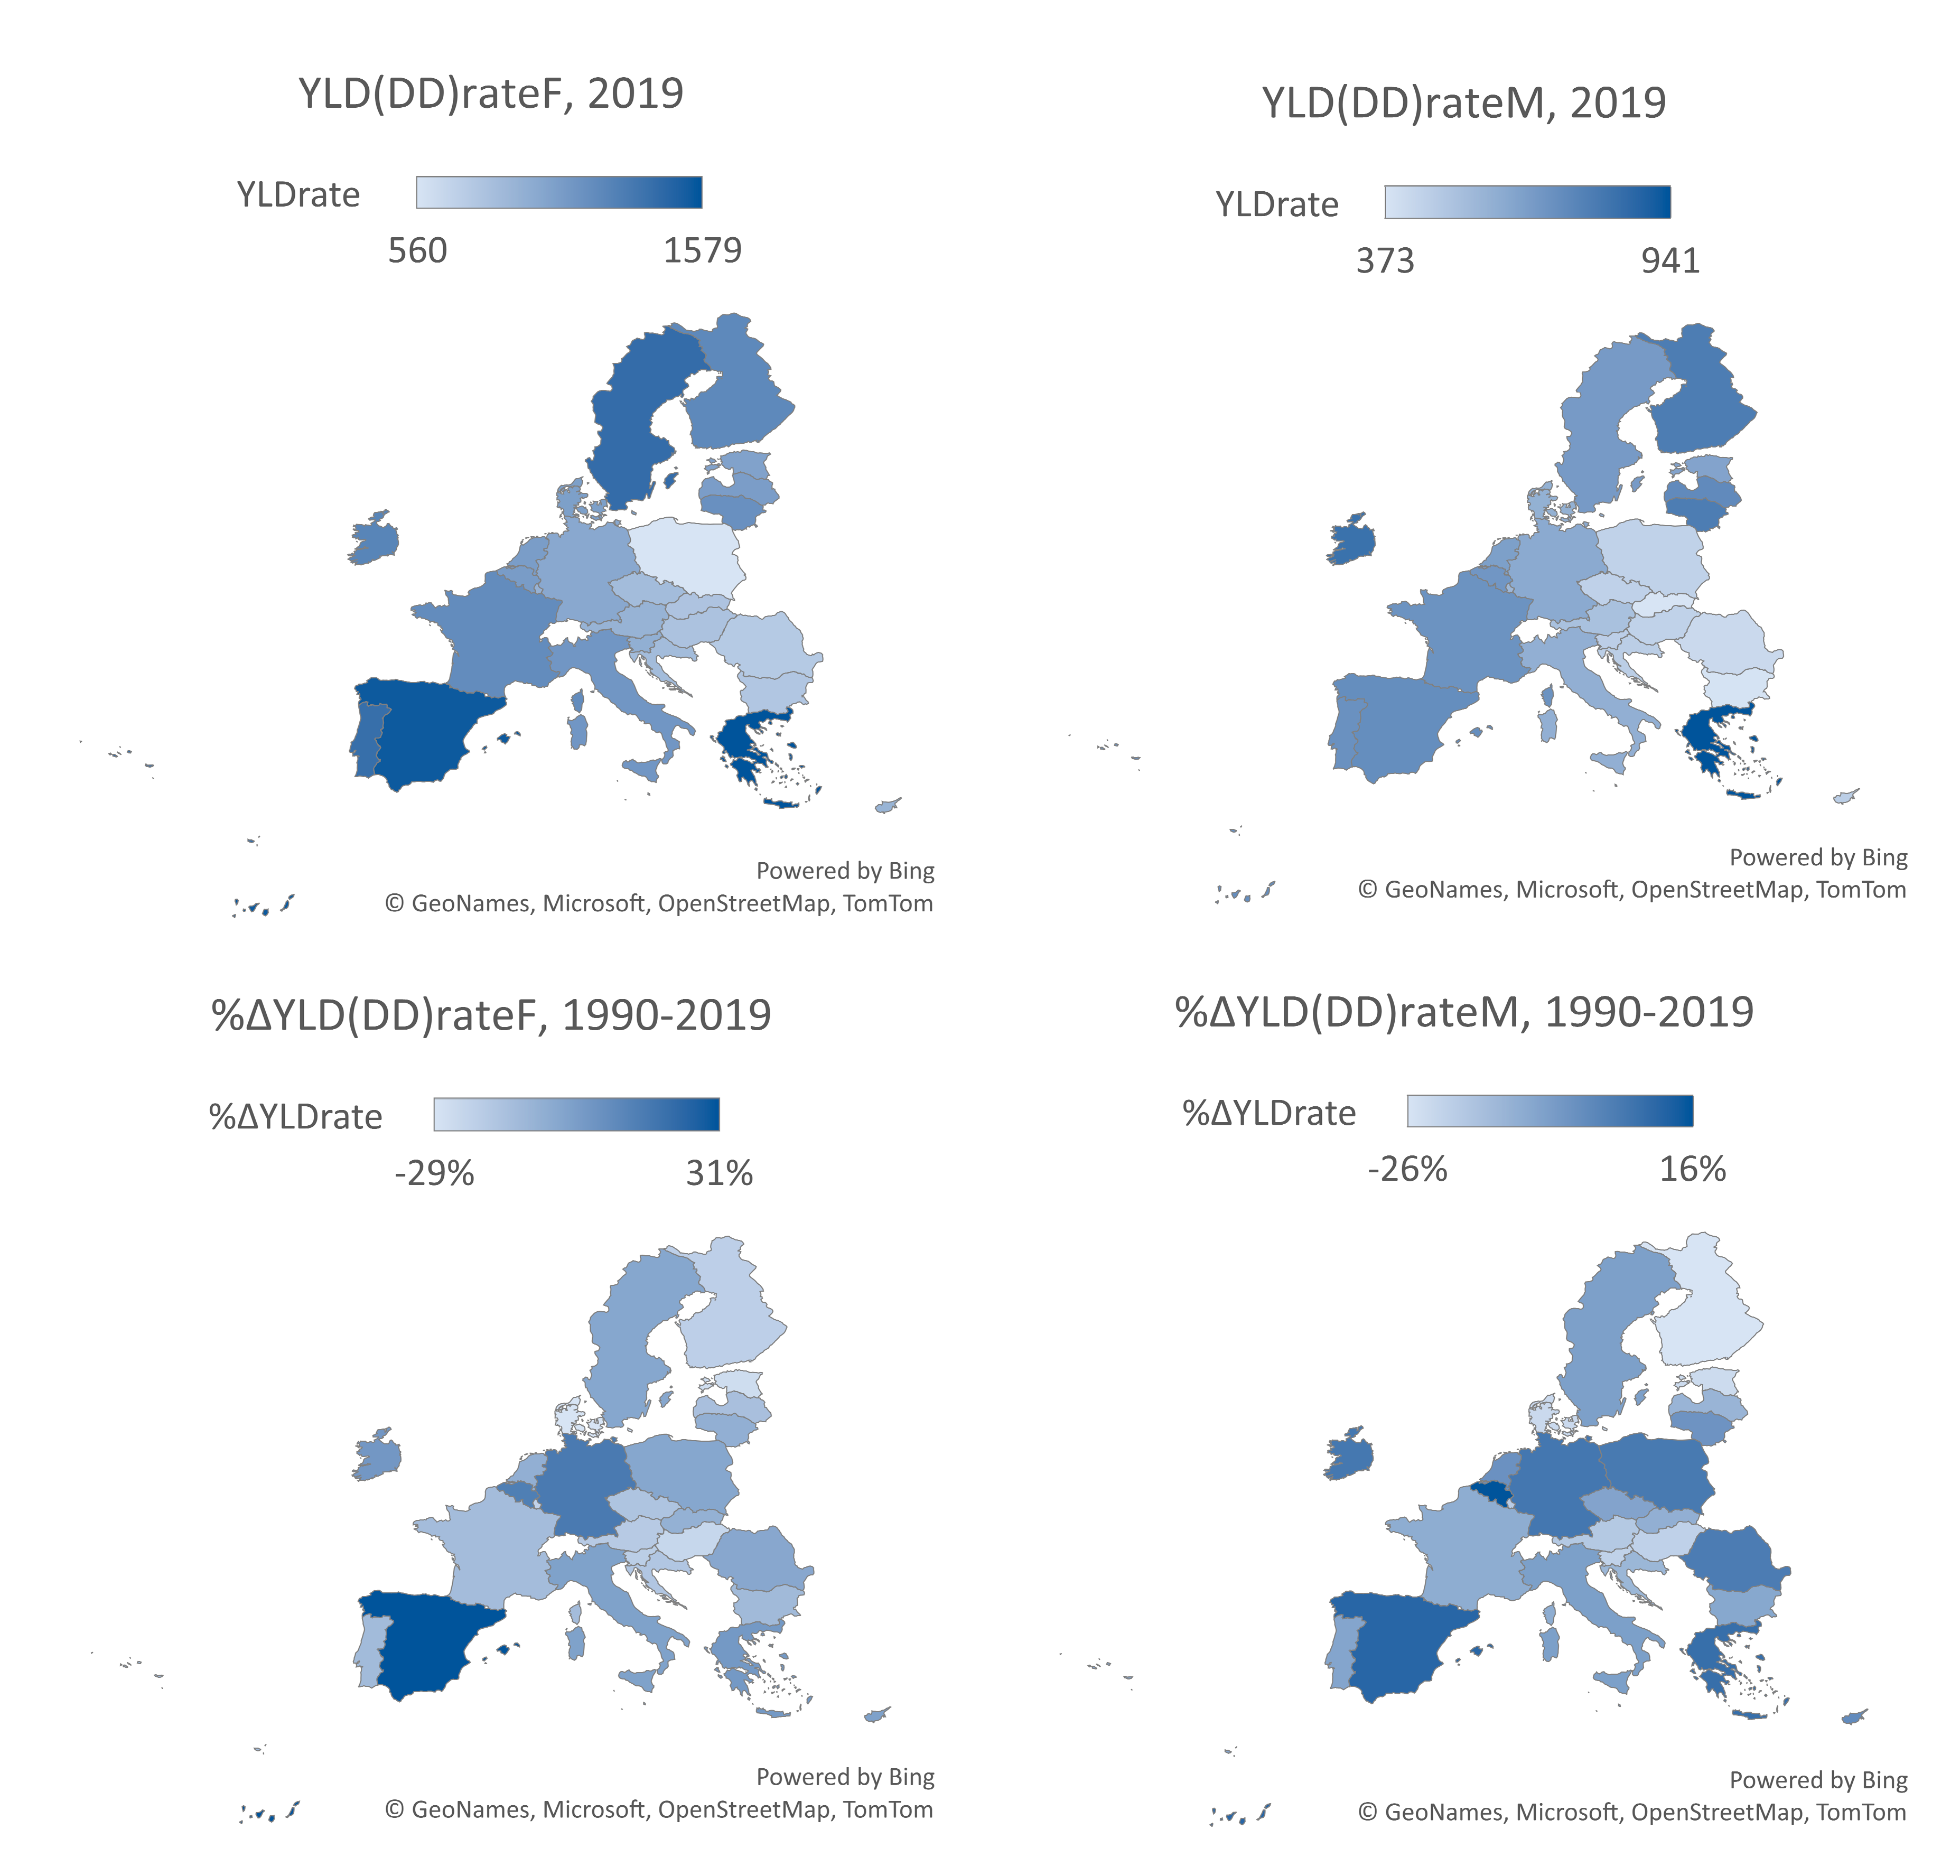
Figure 5.
Patterns of convergence in the group of EU-27 countries over the period 1990-2019, burden of depressive disorders YLD(DD) rate, population aged 20-54 - beta/sigma convergence.
Figure 5.
Patterns of convergence in the group of EU-27 countries over the period 1990-2019, burden of depressive disorders YLD(DD) rate, population aged 20-54 - beta/sigma convergence.
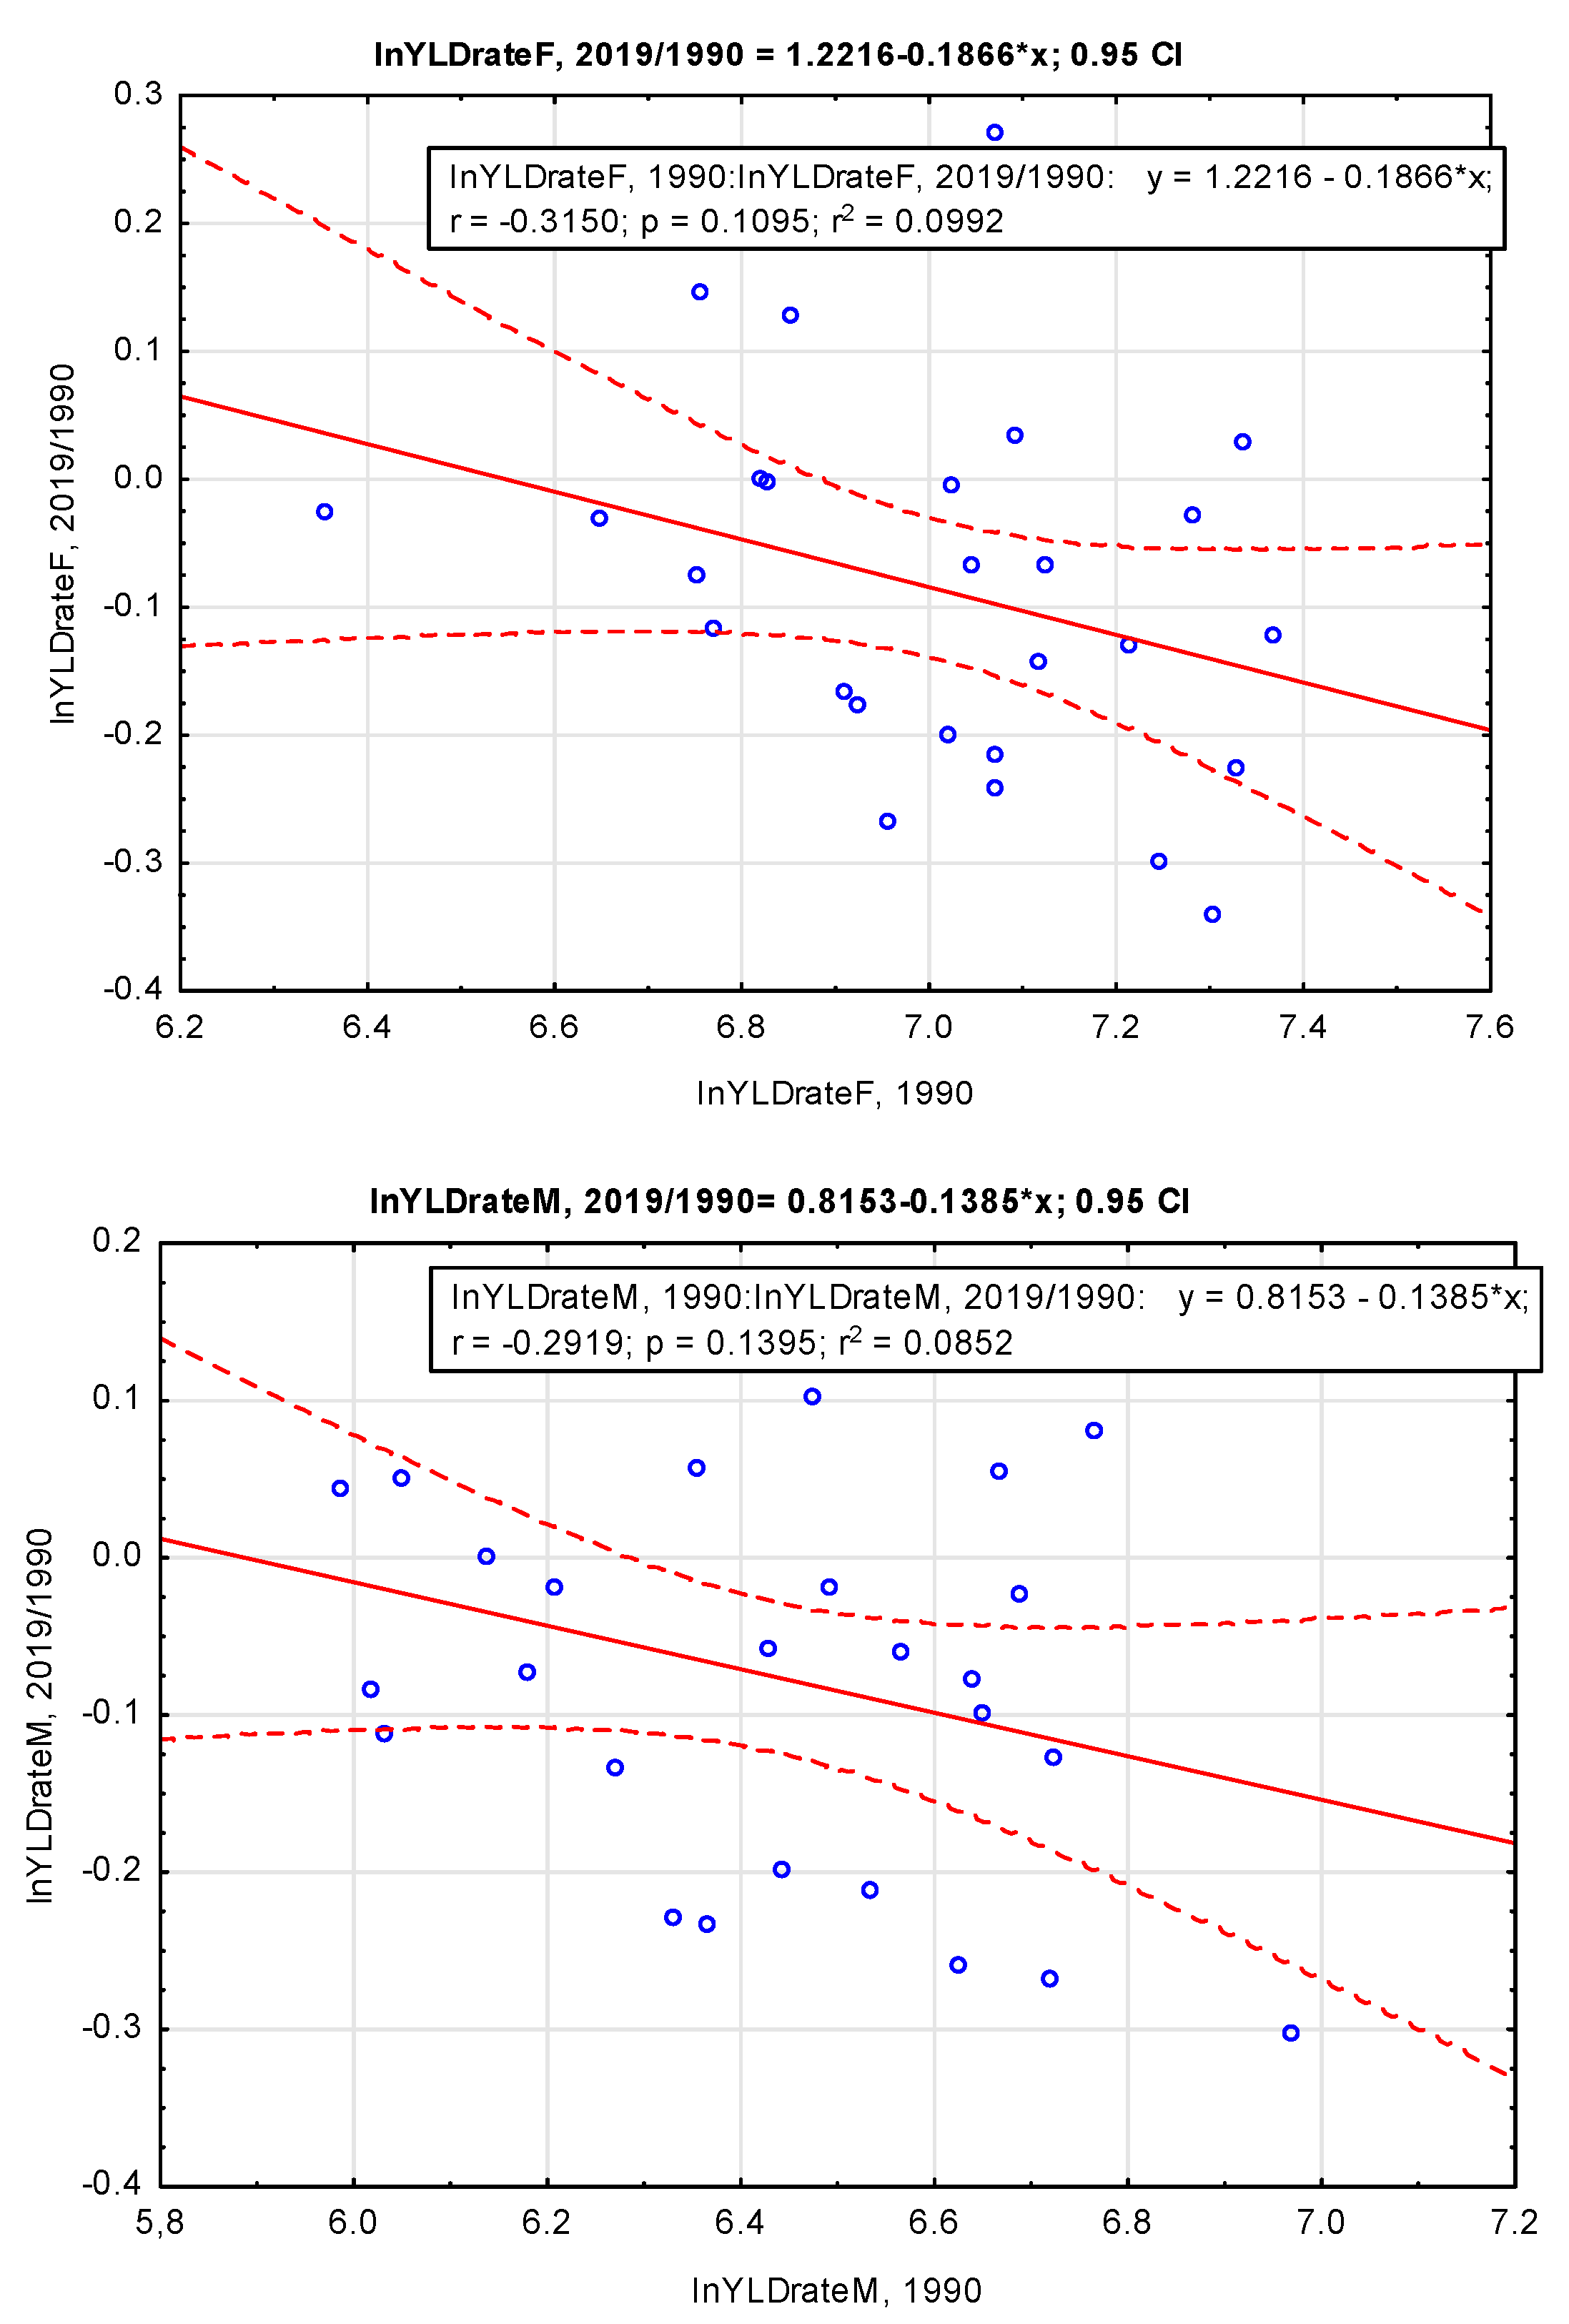
Figure 6.
Histograms of the YLD(DD) rate parameters (EU-27, in 1990 and 2019).
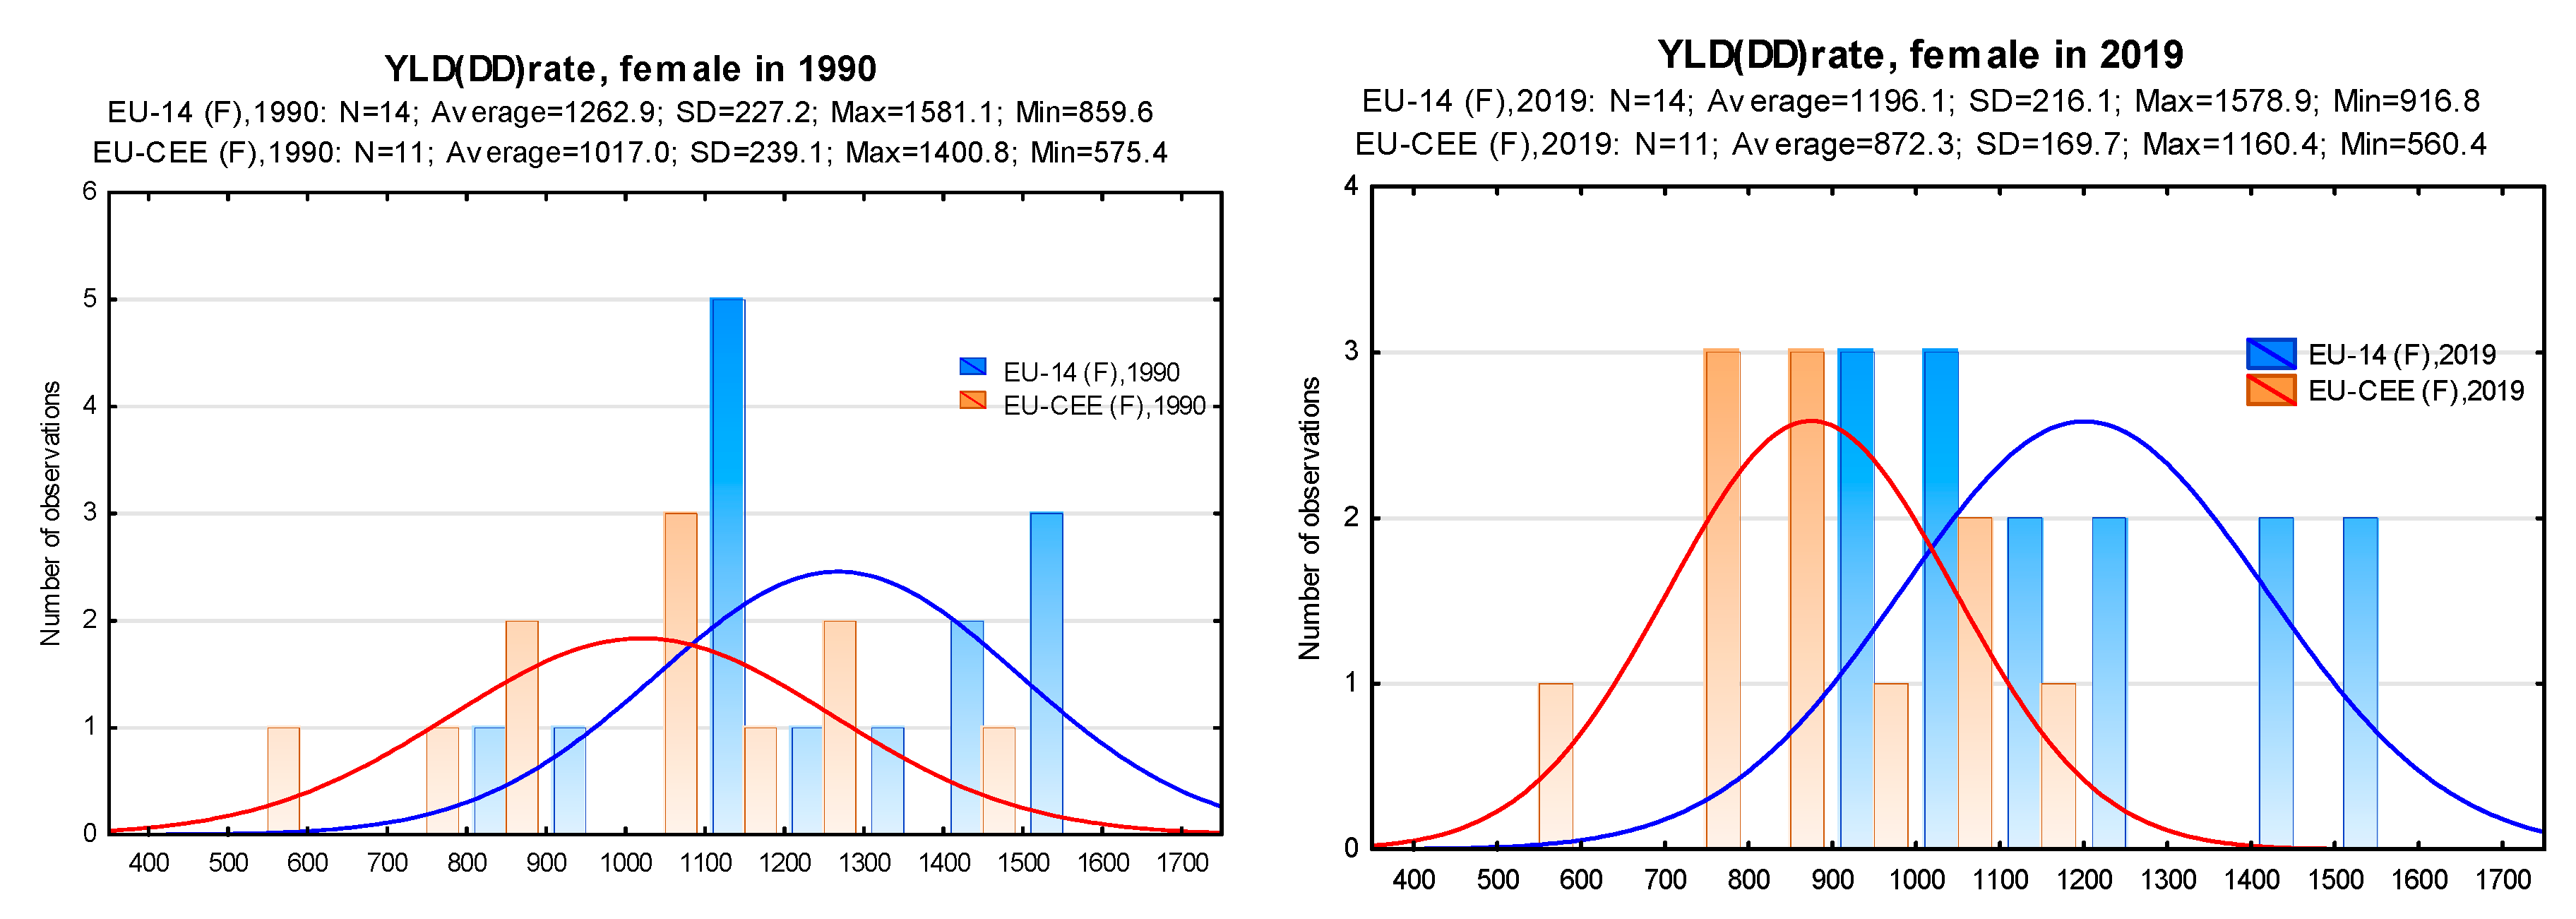
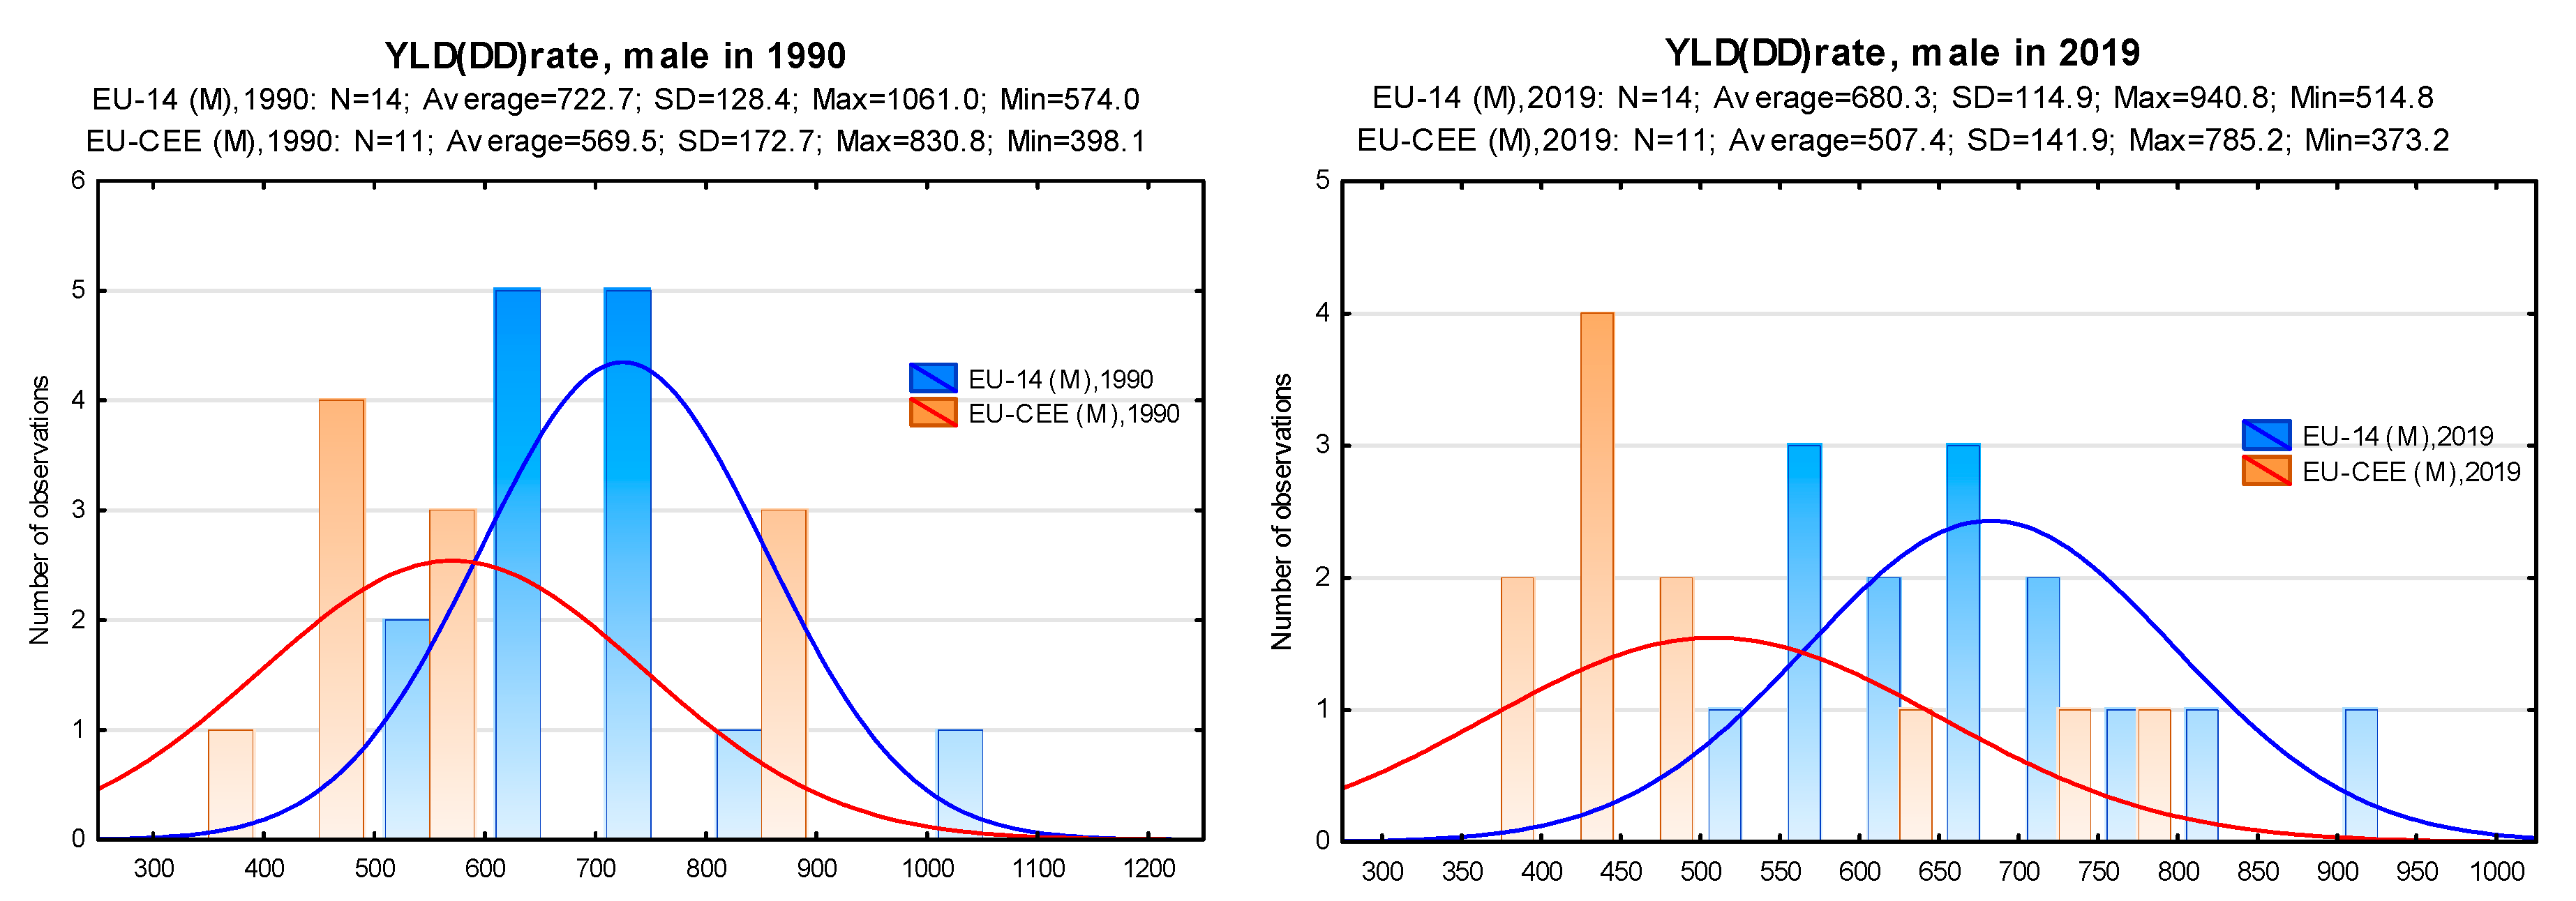

Table 1.
Burden of depressive disorders (DD) - YLDrate, by country group (SDI breakdown), in 2019 and change over the period 1990-2019.
Table 1.
Burden of depressive disorders (DD) - YLDrate, by country group (SDI breakdown), in 2019 and change over the period 1990-2019.
| Location name | YLD (DD) 2019 | Change in the period 1990-2019 (in %) | ||||||
| Rate* | % of total YLD | Rate* | % of total YLD | |||||
| F | M | F | M | F | M | F | M | |
| High SDI | 855,0 | 530,8 | 5,4% | 4,2% | 9,3% | 9,8% | -4,4% | -7,4% |
| High-middle SDI | 783,5 | 460,2 | 6,0% | 4,4% | 7,4% | 12,5% | -6,3% | -2,3% |
| Middle SDI | 698,6 | 433,2 | 5,9% | 4,6% | 17,2% | 23,1% | -2,0% | 3,5% |
| Low-middle SDI | 755,8 | 495,7 | 6,5% | 5,3% | 9,8% | 15,3% | 1,7% | 10,2% |
| Low SDI | 669,2 | 456,0 | 6,5% | 5,3% | 1,2% | 3,4% | 6,7% | 12,5% |
* YLDs per 100,000 persons. Source: own elaboration based on: [2].
Table 2.
Correlation coefficients.
| Average | SD | GDP per cap., 20191 | YLD(DD) rateM, 20193 | YLD(DD) rateF, 20193 | %ΔYLD(DD) rateM, 1990-2019 | %ΔYLD(DD) rateF, 1990-2019 | |
| GDP per cap., 2019 | 47389 | 19147 | 1,000 | 0,111 | -0,090 | -0,234 | -0,170 |
| YLD(DD)rateM, 2019 | 514,8 | 136,6 | 0,111 | 1,000 | 0,826* | 0,123 | 0,069 |
| YLD(DD)rateF, 2019 | 920,8 | 200,4 | -0,090 | 0,826* | 1,000 | 0,047 | 0,046 |
| %ΔYLD(DD)rateM, 1990-2019 | 2,2% | 12,2% | -0,234 | 0,123 | 0,047 | 1,000 | 0,929* |
| %ΔYLD(DD)rateF, 1990-2019 | -0,2% | 12,5% | -0,170 | 0,069 | 0,046 | 0,929* | 1,000 |
Table 3.
Years lived with disability (YLDs) due to depressive disorders (DD), per 100 000 population, EU-27 countries, in 2019 and change from 1990 to 2019), population aged 20-54 years.
Table 3.
Years lived with disability (YLDs) due to depressive disorders (DD), per 100 000 population, EU-27 countries, in 2019 and change from 1990 to 2019), population aged 20-54 years.
| EU Member States | Groups of EU |
YLD(DD)rate, Female |
EU Member States | Groups of EU | YLD(DD)rate, Male | ||||
| 2019 | Change. 1990-2019. in % | 2019 | Change. 1990-2019. in % | ||||||
| 1 | Greece | EU-14 | 1578.9 | 3.0% | 1 | Greece | EU-14 | 940.8 | 8.5% |
| 2 | Spain | EU-14 | 1543.6 | 31.1% | 2 | Ireland | EU-14 | 830.0 | 5.7% |
| 3 | Sweden | EU-14 | 1413.6 | -2.7% | 3 | Lithuania | EU-CEE | 785.2 | -2.3% |
| 4 | Portugal | EU-14 | 1401.0 | -11.4% | 4 | Finland | EU-14 | 784.3 | -26.1% |
| 5 | Ireland | EU-14 | 1244.2 | 3.4% | 5 | Latvia | EU-CEE | 731.6 | -11.9% |
| 6 | Finland | EU-14 | 1215.6 | -20.1% | 6 | Spain | EU-14 | 717.6 | 10.8% |
| 7 | France | EU-14 | 1191.5 | -12.1% | 7 | Portugal | EU-14 | 706.8 | -7.3% |
| 8 | Lithuania | EU-CEE | 1160.4 | -6.5% | 8 | France | EU-14 | 698.5 | -9.4% |
| 9 | Italy | EU-14 | 1118.1 | -0.4% | 9 | Belgium | EU-14 | 684.1 | 15.8% |
| 10 | Belgium | EU-14 | 1076.8 | 13.8% | 10 | Sweden | EU-14 | 668.3 | -5.7% |
| 11 | Netherlands | EU-14 | 1069.9 | -6.6% | 11 | Netherlands | EU-14 | 648.3 | -1.8% |
| 12 | Latvia | EU-CEE | 1066.4 | -13.3% | 12 | Estonia | EU-CEE | 633.1 | -23.5% |
| 13 | Denmark | EU-14 | 1057.6 | -28.9% | 13 | Germany | EU-14 | 608.4 | 6.0% |
| 14 | Estonia | EU-CEE | 1039.2 | -25.8% | 14 | Italy | EU-14 | 584.2 | -5.6% |
| 15 | Germany | EU-14 | 995.3 | 15.8% | 15 | Denmark | EU-14 | 581.8 | -22.8% |
| 16 | Slovenia | EU-CEE | 948.2 | -19.4% | 16 | Luxembourg | EU-14 | 556.7 | -19.1% |
| 17 | Luxembourg | EU-14 | 923.2 | -21.5% | 17 | Austria | EU-14 | 514.8 | -18.0% |
| 18 | Malta | - | 918.4 | -0.2% | 18 | Malta | - | 486.8 | -1.8% |
| 19 | Austria | EU-14 | 916.9 | -18.1% | 19 | Croatia | EU-CEE | 462.9 | -12.4% |
| 20 | Cyprus | - | 914.6 | 0.0% | 20 | Cyprus | - | 462.7 | 0.1% |
| 21 | Croatia | EU-CEE | 849.7 | -16.2% | 21 | Slovenia | EU-CEE | 460.5 | -20.7% |
| 22 | Czechia | EU-CEE | 849.7 | -15.2% | 22 | Czechia | EU-CEE | 449.5 | -6.9% |
| 23 | Hungary | EU-CEE | 802.6 | -23.4% | 23 | Hungary | EU-CEE | 446.2 | -20.5% |
| 24 | Slovakia | EU-CEE | 794.2 | -7.3% | 24 | Poland | EU-CEE | 445 | 5.2% |
| 25 | Bulgaria | EU-CEE | 775.2 | -10.9% | 25 | Romania | EU-CEE | 416.2 | 4.6% |
| 26 | Romania | EU-CEE | 749.7 | -2.9% | 26 | Bulgaria | EU-CEE | 378.3 | -8.0% |
| 27 | Poland | EU-CEE | 560.4 | -2.6% | 27 | Slovakia | EU-CEE | 373.2 | -10.5% |
Source: own elaboration based on: [2].
Table 4.
Assessment of sigma convergence parameters, EU-27 countries in the period 1990-2019.
| Variable | Variance (σt2) | F-Snedecor test |
H0 - homogeneity of variances |
|
| 1990 | 2019 | p-value | ||
| YLD(DD)rate, F | 66144,5 | 60622,7 | 0,8258 | confirmed |
| YLD(DD)rate, M | 27504,9 | 22628,1 | 0,6224 | confirmed |
Table 5.
Results of the tests of significance of the differences.
| Parameters of a normal distribution | ||||||||
| Parameters | Mean EU-14 | Mean EU-CEE | Test t | Brown–Forsythe test | ||||
| t | df | p | Brn-Fors F(1.df) | df Brn-Fors | p Brn-Fors | |||
| YLD(DD)rate F, 1990 | 1262,9 | 1017,0 | 2,625 | 23 | 0,0151 | 0,000 | 23 | 0,9838 |
| YLD(DD)rate F, 2019 | 1196,2 | 872,3 | 4,073 | 23 | 0,0005 | 0,991 | 23 | 0,3299 |
| Parameters of a non-normal distribution | ||||||||
| Mann-Whitney U test | ||||||||
| Sum.rangyasnyiEU-14 | Sum.rangyasnyiEU-CEE | U | Z | p | ||||
| YLD(DD)rate M, 1990 | 722,7 | 569,5 | 222,0000 | 103,0000 | 37,00000 | 2,162423 | 0,030586 | |
| YLD(DD)rate M, 2019 | 680,3 | 507,4 | 231,0000 | 94,0000 | 28,00000 | 2,655127 | 0,007928 | |
Disclaimer/Publisher’s Note: The statements, opinions and data contained in all publications are solely those of the individual author(s) and contributor(s) and not of MDPI and/or the editor(s). MDPI and/or the editor(s) disclaim responsibility for any injury to people or property resulting from any ideas, methods, instructions or products referred to in the content. |
© 2023 by the authors. Licensee MDPI, Basel, Switzerland. This article is an open access article distributed under the terms and conditions of the Creative Commons Attribution (CC BY) license (http://creativecommons.org/licenses/by/4.0/).
Copyright: This open access article is published under a Creative Commons CC BY 4.0 license, which permit the free download, distribution, and reuse, provided that the author and preprint are cited in any reuse.


