Submitted:
15 December 2023
Posted:
18 December 2023
You are already at the latest version
Abstract
In this study, an analysis was conducted on 16 durum wheat genotypes cultivated under seven different crop management systems. The purpose was to investigate the influence of Genotype (G), Environment (E), and Genotype by Environment interactions (GxE) on the content of total free phenolic compounds (TPC) and the antioxidant capacity (AC) of durum wheat in Mediterranean environments and identify their adaptability in climatic change. Additionally, possible correlations between TPC and AC with protein content (PC), and vitreous-kernel percentage (VKP) of the samples were examined. The results indicated significant impacts from E, G, and GxE on both TPC and AC. Among the E, the mean values for TPC, ABTS, DPPH, and FRAP values were recorded at 48.8 mg TE/100 g dw, 121.3 mg TE/100 g dw, 23.0 mg TE/100 g dw, and 88.4 mg TE/100 g dw, respectively. Environments subjected to splitting topdressing N fertilization consistently showed low values, while the late sowing ones possessed high values. The Organic environment maintained a stable position in the middle across all measurements. The predominant influence was attributed to GxE, as indicated by the order GxE >E>G for ABTS, DPPH, and FRAP while for TPC was E>GxE>G. A comprehensive exploration of GxE interaction holds the potential to improve the total free phenolics content and antioxidant capacity of durum wheat within wheat farming systems. Achieving this enhancement involves the meticulous selection of cultivars that not only display high values but also exhibit stability across diverse conditions. Noteworthy genotypes for TPC include G5, G7 and G10, for ABTS include G3, G5 and G7, and for protein include G1, G9, and G16. G7 and G5 had high presence of frequency with G7 being the closest genotype to the ideal for both TPC and ABTS. These results suggest that the cultivation period as well as the nitrogen fertilization and its application method have a significant impact on the various antioxidant properties of durum wheat. This study holds significant importance as it represents the first comprehensive exploration of the impact of various E on the TPC and AC in durum wheat, with a special emphasis on the crop management. Notably, the significance of several statistical tools is also highlighted, such as the GGE biplot, Pi, and KR, in identifying superior genotypes, with the GGE biplot being highly valuable since it offers a visual representation of the study's outcomes.
Keywords:
Cultivars
; antioxidant properties
; phenolic compounds
; protein
; GGE biplot
; stability indices
; cultivation practices
; adaptation to climate change
1. Introduction
A total of 219 million hectares worldwide are cultivated with wheat [1]. Among the countries in the Mediterranean basin, Greece, Italy, Algeria, and Tunisia stand out, having the highest proportions of durum wheat to bread wheat acreage, reaching up to 85% and showing an excellent adaptability in the climatic conditions of the Mediterranean area [2,3]. In 2020, durum wheat production globally represented 6.2% of the total wheat production [2].
The durum wheat kernel, which consists of three parts (bran, endosperm, and embryo), is typically fractionated and, due to its vitreous nature, which differs from the bread wheat kernel, is referred to as semolina [4,5,6]. Bread, couscous, bulgur, frekeh, noodles, and, most importantly, pasta are the most renowned products made from durum wheat [5].
Currently, consumer awareness of health-promoting foods has increased [7]. Many human degenerative diseases are linked to reactive oxygen species and oxidative stress, and the antioxidant activity significantly impacts many of these diseases [8]. Polyphenols play a broader role in the human body by regulating antioxidant enzyme gene transcription and being involved in cell growth regulation, inflammation, and more [9]. Furthermore, the activity of transcription factors or microRNA modulation could be influenced by polyphenols [10].
Many plants with significant antioxidant activity are cultivated in the Mediterranean basin, contributing to healthy living. These plants include Sideritis scardica, Melissa officinalis L, Cannabis sativa L., Lamiaceae family, and others. Nevertheless, these plants are consumed much in much smaller quantities than wheat [11,12,13,14,15,16,17]. Durum wheat contains significant amounts of antioxidants, with whole wheat flours exhibiting higher antioxidant activity than their corresponding white flours, primarily because the phenolic compounds are mainly found in the bran [18,19,20,21]. Some by-product fractions of durum wheat have shown antioxidant activity comparable to that of fruits and vegetables, likely due to fiber-bound phenolic compounds [22,23]. Thus, the consumption of whole wheat flour may be beneficial for health.
Significant differences have been observed among different wheat genotypes (G) in the amounts of phenolic acids, with trans-ferulic acid being the most abundant in all of them [7,18,24]. Beta et al. [25] noted an influence of the environment (E)on total phenolics and antioxidant activity. G, E, GxE, and year all have an impact on the TPC and the AC of durum wheat. Most notably, the year affects the free phenolic acids, the environment by year interactions affects the conjugated phenolic acids, and the G affects the bound phenolic acids [26,27].
The interaction between genotype and performance, which varies across different environments (GxE interaction), adds complexity to the task of identifying superior genotypes. This complexity is referred to as the crossover concept [28]. The primary goal is to obtain genotypes that consistently had high and stable values for seed yield or qualitative characteristics across a diverse range of tested environments. Only then can it be asserted that a genotype is a superior selection with high adaptability [26,29]. Various statistical tools have been developed to address GEI interpretation and crop stability. Commonly used parametric models helping in the identification of superior genotypes [30] are the stability measure [31] from AMMI analysis [32], the genotype superiority index [33], the stability variance () [34], the variance of deviations from regression ()[35] and the Kang's rank-sum method KR index [36]. The GGE biplot analysis visualizes the interaction outcomes between genotypes and environments. In its pursuit, the analysis has a dual objective: firstly, to pinpoint varieties that surpass the average performance and demonstrate stability across multiple environments, and secondly, to recommend the utilization of varieties exhibiting stability in specific environments [28]. Utilizing the GGE biplot model [28,37], a comprehensive visual representation of the entire genotype-environment interaction is offered. This involves a biplot that encapsulates both the average yield performance and stability. GGE adeptly filters out noise originating from the environmental main effect (E) and emphasizes two crucial components: genotype effects (G) and GxE interactions. The genotype's value is visually represented using scores derived from principal component analysis. Genotypes positioned closer to the performance line are considered more stable, while those located farther away are deemed less stable. Furthermore, the model quantifies a genotype's distance from the "ideal genotype," which, though rarely found in practice, serves as a reference point for evaluation. This ideal genotype occupies the central position within a series of concentric cycles. The concentric circles, centered on the ideal genotype, facilitate the visualization of relative distances between all and ideal genotypes. The plot distance between any given genotype and the ideal genotype can be utilized to measure its desirability [28,37]. Several studies have indicated that the content of carotenoids and tocopherols in wheat may be influenced by the interactions of genetic (G) and environmental (E) factors. This implies these factors' potential effects or interactions on the specified chemical compositions, as reported [38]. Nevertheless, there is a gap in existing research, as no prior study has examined the impact of genetic, environmental factors, and their interaction on the antioxidant properties of durum wheat.
In our ongoing commitment to improve the health-related aspects of wheat, this study was undertaken to assess the impact of G, E, and GxE on the total free phenolics content (TPC) and the antioxidant capacity (AC) (DPPH, ABTS, FRAP) of durum wheat in Mediterranean environments for the first time. Specifically, the study investigates the TPC and AC of different durum wheat genotypes cultivated under various cultivation practices, including high/low input environment and biological conditions in Mediterranean farming systems. Furthermore, the study examines the correlations between TPC and AC, as well as their relationships with total protein content, and vitreous kernel percentages. Moreover, this study aimed to identify the genotypes with the higher and more stable free phenolics content and antioxidant capacity across Mediterranean farming systems, including biological, low/high productivity farming systems, through a comparative examination of the yield and GGE biplot analysis, alongside with five parametric stability models.
2. Materials and Methods
2.1. Plant material and experimental design
Experiments were conducted in the 2020-21 growing season, evaluating sixteen commercially available genotypes (Table 1) across seven different environments (Table 2). These genotypes were selected considering their popularity among Greek growers, their potential for high yields, and a comprehensive assessment of commercial factors to determine their adaptability.
The seven environments (Table 2) that were evaluated include:
- Thermi-Typical fertilization/Typical date of sowing (Mindle November). In typical fertilization (total N amount of 180 kg ha−1), one-third of which was applied (ammonium phosphate 20-10-0) before sowing and two-thirds (ammonium nitrate 33.5-0-0) at full tillering (Zadok 29). (Higher productivity environment)
- Thermi-Organic field (No fertilization)/Typical date of sowing (Lower productivity environment)
- Thermi-Typical fertilization/Late date of sowing i.e. January 25. All the other agronomic treatments were identically applied to all plots. (Lower productivity environment)
- Thermi- Splitting topdressing N fertilization/Typical date of sowing. Splitting topdressing N fertilization: splitting one-third (ammonium phosphate 20-10-0) before sowing, one-third (ammonium nitrate 33.5-0-0) at full tillering (Zadok 29), and one-third during the first node (Zadok 31) (Higher productivity environment).
- Thermi-Spitting topdressing N fertilization/Late date of sowing (as described above) (Higher productivity environment)
- Nea Gonia (Typical fertilization and date of sowing) In typical fertilization (total N amount of 150 kg ha−1), one-third of which was applied (ammonium phosphate 20-10-0) before sowing and two-thirds (ammonium nitrate 33.5-0-0) at full tillering (Zadok 29). (Higher productivity)
- Sindos -Typical fertilization/Late date of sowing. (Lower productivity environment).
The genotypes were arranged in plots across the trials using a randomized complete block design (RCBD) with four replicates. Each plot covered an area of 12 square meters and consisted of six rows, each measuring 8 meters in length with a 0.25-meter spacing between them. Specifics regarding soil/climatic data and agronomic practices, such as the date of sowing and fertilization, are provided in Table 2. The grain yield for each plot, expressed in metric tons per hectare (t/ha), was standardized to a moisture content of 14%.
Each sample was milled in a laboratory mill (ZM-100; Retsch, Haan, Germany) to pass through a 0.5 mm sieve. All other chemicals and solvents used were of analytical grade.
2.2. Vitreous-Kernel percentage
Visual estimation was applied to separate three sets of 100 kernels into vitreous and non-vitreous kernels. Those with a dark translucent appearance were considered vitreous kernels, while non-vitreous kernels appeared starchy and opaque. The results were expressed as percent (%) vitreous kernels (VKP). The method was applied only to the central environment for a brief qualification of the genotypes.
2.3. Protein Content
The protein content of the grounded samples was determined using a Near-InfraRed (NIR) analyser (PerCon Inframatic 8620, Perten Instruments, Hamburg, Germany) after a calibration curve was set using the Kjeldahl method.
2.4. Free Phenolic Extraction
0.25 g of durum wheat flours were dissolved in 2 mL 70% aqueous methanol (MeOH/H2O), were vortexed for 1 min and then incubated for 10 min in an ultrasound bath (frequency 37 kHz, model FB 15051, Thermo Fisher Scientific Inc., Lounghborough, England (Thermo Fisher Scientific Loughborough, England) at room temperature. Then, the extracts were centrifuged (Universal 320R, Hettich, Germany) at 4000 rpm for 10 min, the supernatant were collected, and the residue was re-extractedone more time. . Finally, the clear supernatant were mixed and stored at -20 °C until analysis. Three replications were conducted for each sample.
2.5. Total Phenolic Content (TPC)
The TCP determination was carried out based on the Folin-Ciocalteu method according to Singleton et al. [41]. Briefly, 0.2 mL of the free extracts were mixed with 0.8 mL of diluted Folin-Ciocalteu reagent (1:10 v/v dilution with water), vortexed and allowed to rest for 2 min. Then, 2.0 mL of sodium carbonate ((7.5% w/v) solution and distilled water up to 10 mL were added and incubated for one hour under dark conditions. The absorbance was recorded in a spectrophotometer (HITACHI U-1900, Tokyo, Japan) at 725 nm and the results were expressed as mg of gallic acid equivalents (GAE) per 100 g of dry weight (dw).
2.6. Antioxidant capacity
2.6.1. Radical Scavenging Activity (ABTS)
The activity of radical scavenging of the durum wheat extracts against ABTS (2,2- azinobis-(3-ethylbenzthiazoline-6-sulphonic acid) radical cation was determined according to Re et al. [42]. For the ABTS●+ preparation 2 mM ABTS were mixed with 0.73 mM potassium persulfate (K2S2O8) and dissolved in distilled water. After the mixture was stored under dark and ambient temperature, , its absorbance was adjusted at 0.70 (± 0.02) at 734 nm.
A volume of 3.9 mL of the ABTS●+ solution, were mixed with 0.1 mL of the durum wheat extract and after 4 min, its absorbance was recorded at 734 nm. For the percent inhibition of the ABTS radical cation the following equation was used:
Where Ao: the blank’s absorbance, As: the sample’s absorbance.
Trolox was used for the calibration curve, as a standard compound, and the results were expressed as mg of Trolox equivalents (TE) per 100 g dw.
2.6.2. Ferric Reducing/Antioxidant Power (FRAP)
The reducing power of the durum wheat extracts was determined according to the method of Benzie and Strain [43]. The FRAP assay was prepared by mixing the following solutions: a) a 20 mM ferric chloride solution (FeCl3●6H2O), b) a 10 mM TPTZ (2-4-6-tripyridyl-s-triazine) in 40 mM HCl, and c) a 0.3 mM (pH 3.6) acetate buffer, in a proportion 1:1:10 (a:b:c respectively).
A volume of 3.0 mL of the FRAP solution was mixed with 0.1 mL of the durum wheat extract and, after 4 min of incubation at 37oC under dark, its absorbance was recorded at 593 nm, against a blank. The results were expressed as mg of Trolox equivalents (TE) per 100 g dw.
2.6.3. Radical Scavenging capacity activity (DPPH)
Radical scavenging capacity activity was determined according to the method Yen and Chen [44]. A 0.1 mM DPPH (2,2-diphenyl-1-picryhydrazyl) solution in methanol was prepared (DPPH●). A volume of 2.85 mL of DPPH● were mixed with 0.15 mL of the durum wheat extracts and the absorbance was recorded at 516 nm after 5 min of incubation. The results were expressed as mg of Trolox equivalents (ET) per 100 g dw.
2.7. Statistical analysis
A two-factor analysis of variance (Genotypes, Environments) was applied , with genotypes (G) as fixed and environments (E) as random treatment effects. The Shapiro–Wilk test was employed to assess the normal distribution of variable, whereas Levene’s test checked the ANOVA’s assumptions for the equality of the error variances and residual normality [45]. Differences between either genotypes or environments were identified with a post hoc Tukey HSD test. Pearson and Spearman's rank correlation coefficients were calculated and evaluated for their significance at three probability levels: 0.001 (indicating a strong correlation), 0.01 (indicating a moderate correlation), and 0.05 (indicating a weak correlation). All the statistical analyses were performed using an IBM SPSS Statistics 28.0.0.0 (190) software.
2.8. Data analysis
The AMMI models [32] were executed utilizing the GenStat (13th edition) statistical software. It relies on the calculation of the first and second principal component (PC) scores, denoted as PC1 (indicative of the first PCA's interaction) and PC2 (indicative of the second PCA's interaction), as outlined in Purchase's study [31]. The computation process is detailed by the following equation:
where SS is the sum of squares. The genotype with the smallest value was regarded the most stable.
Genotype superiority, ,
The computation of genotype superiority[46], labeled as , entailed the assessment of the mean square distance between the genotype and the maximum response:
In this equation, signifies the maximum response observed across all genotypes in the specified environment (j). The crucial insight is that a smaller value signifies a superior genotype.
In this equation, represents the maximum response observed among all genotypes in the given environment (j). The key takeaway is that the smallest value indicates the better genotype.
Shukla’s stability variance, σ2i
In 1972, Shukla [34] proposed the stability variance of genotype i, defined as its variance across environments after accounting for the main effects of environmental means. According to this statistic, genotypes with the lowest values are more stable.
Deviation from regression, S2di
The utilization of the variance of deviations from the regression (S2di) has been proposed as one of the prominent parameters in the selection of stable genotypes. Genotypes with an S2di = 0 are considered to be the most stable, whereas an S2di > 0 would indicate lower stability across all environments. Hence, genotypes with lower values are the most desirable.
Kang’s Genotypes with a rank-sum KR
Kang's rank-sum method [47] utilizes yield and σ2i (variance) as selection criteria. This approach assigns equal weight to yield and stability statistics in the identification of high-yielding and stable genotypes. The genotype achieving the highest yield and the lowest σ2i is given a rank of one. Subsequently, the ranks for yield and stability variance are combined for each genotype. Genotypes with the lowest rank-sum are regarded as the most desirable.
The GGE biplot model is grounded in the singular value decomposition of the first two principal components [28]:
where is the measured mean of genotype i in environment j, μ is the grand mean, is the main effect of environment j, and are the singular values for the first and second principal component (PC1 and PC2, respectively), and are eigenvectors of genotype i for PC1 and PC2, and are eigenvectors of environment j for PC1 and PC2, is the residual associated with genotype i in environment j.
3. Results and Discussion
The study investigated the effect of G, E, and GxE on the TPC and the AC of durum wheat. It also examined the correlations among TPC, AC, PC and VKP percentages.
3.1. Effect of Genotype, Environment and Genotype by Environment
Analysis of variance showed that all sources of variation were highly significant in all antioxidant-related studied traits (table 3). GxE had the greatest effect on all the analyses referred to AC. For ABTS, DPPH, and FRAP, the contributions of GxE to the variation were 45.3, 49.9, and 64.9%, respectively (Table 3). Regarding TPC, E contributed a large portion (42.4%) and it was followed by GxE (42.2%). Genotype showed only low contribution (from 6.7 to 12.7) to the variation for all the traits while E, for the AC had a moderate contribution varied from 20.7 to 33.1%. In accordance with these results, other studies reported a high contribution by the E for TPC [48,49]. A high contribution by GxE for TPC is also reported by Martini et al. [50]. Regarding AC byDPPH test, other studies reported a higher contribution to the variation by either E or G [48,49]. However, Irakli et al, reported higher contribution by GxE to the total variation of ABTS values for lens culinaris L. [51]. In hemp seeds, the cultivation Year had the higher effect for TPC, ABTS and FRAP [12]. Other studies exploring the impact of genotype and environment on soft winter wheat reported a very significant effect on ABTS by E followed by GxE [50,52].
3.2. Total Phenolic Compounds
In Table 4, the mean values of TPC, ABTS, DPPH, and FRAP for different E and G are displayed, and they are grouped using the Tukey HSD a, b test (α=0.05). The mean TPC value was 48.8 mg GAE/100g dw. Generally, E4 and E5 had significant lower TPC values than the rest of the E, while the significant highest values were observed in the E3, followed by E7 where the same cultivation practices (late sowing) were applied in a different region. E1, E2 and E6 had medium TPC values. This suggests that using a splitting-fertilization approach over conventional practices negatively affected the TPC content of durum wheat. The G with the highest mean TPC content was G9, but no significant differences were observed with other varieties (G1, G4, G5, G5, G6 G7, G10 and G15), while the lowest was observed in G2.
Regarding cv. Simeto (G8 in this study), Laus et al. [53] reported a similar range of TPC, ranging from 14.6 ± 0.60 to 74.5 ± 2.40 mg GAE/100g dw. The lowest value was observed in an irrigated field fertilized with 33 kg/ha of sulfur, while the highest value was found in a non-irrigated, no-sulfur field, which was the only one exceeding the values presented in this report LAUS . TPC for whole meals of durum wheat in cvs. Duilio, Sant’Agata, and Simeto, for the extractable phenolic compounds, were 192.3 ± 0.5, 144.5 ± 1.8, and 181.9 ± 3.2 mg GAE/100g dw, more than double the values reported here. Similar values have been reported for both old and modern varieties [19,54,55,56]. These differences are likely attributable to the extraction method and the fact that bound phenolic compounds were not extracted [21].
In the present study, organic crop management did not show significant differences in TPC compared to the two conventional methods (E1 and E6). However, in one of the two years studied by Nocente et al. [57] ), there was a significant difference between conventional and organic crop management, with organic practices resulting in higher TPC values. Similar findings with significantly higher TPC amounts have also been reported in other studies [49,58]. In the case of kohlrabi, significantly higher TPC values were reported under organic cultivation compared to conventional practices, while no significant differences were observed for other vegetables and fruits [59,60]. On the other hand, nitrogen fertilization had a positive and analogous effect on the TPC of winter wheat grains in Ma et al. [61].
3.3. Antioxidant’s capacity
The mean value of the ABTS scavenging activity among the different E was 121.3 ± 18.3 mg TE/100 g dw. Like TPC, the significant lowest mean values were observed for E4 and E5, while the highest values were found in E3, possessing a significant difference from the other E (Table 4). Among the different G, no significant differences were observed, and only two groups were created according to the Tukey HSDa, b test, with all cultivars but G8 to be placed in the highest group.
For the DPPH values, different observations were made. The E with the highest mean value was E5, followed by E7 (both late sowing), while E1 and E4 had the lowest values, with E4 not possessing significant differences to E4 (Table 4). Regarding the genotype, there were significant variations among them, with G9 giving the highest value and showing a significant difference from the rest.
Di Loreto et al. [7] in their analysis of 22 old and modern durum wheat varieties, reported DPPH values of 186.2 mg TE/100g dw (7.4 ± 0.3 μmol/g) for the old durum wheat cv. Inglesa and 101.6 mg TE/100g dw (4.1 ± 0.2 μmol/g) for the modern durum wheat cv. Claudio [7]. Similar results have been reported by Truzzi et al. [56].
In accordance with the results presented in this study, Fares et al. (2019) [58] reported no significant differences between ABTS values for conventional and organic crop management. However, in one of the two years studied in Nocente et al. [57], there was a significant difference between conventional and organic crop management, with conventional practices resulting in higher total antioxidant capacity, as measured by the "Direct method" using the ABTS radical solution.
Consistent with our findings, other studies mentioned that organic cultivation possessed higher DPPH values than the conventional one [49]. For Broccoli, Cauliflower, and red cabbage, DPPH values were significantly higher in organically cultivated vegetables, and the same trend was observed for ABTS values in Kohlrabi. In contrast, Broccoli showed higher ABTS values under conventional cultivation [60]. For other crops, there were no significant differences in AC between organic and conventional cultivation methods [59]. On the other hand, nitrogen fertilization had a positive and analogous effect on the AC of winter wheat grains, as reported by Ma et al. [61].
For FRAP, E5 had a significantly lower mean value than the rest of the E, while E7 and E3 had the highest mean values, with a significant difference from the rest (Table 3). G15, G6 and G4 had the highest mean values among the G. Di Loreto et al. [7] reported a mean value of 357.9 mg TE/100g dw for 22 durum wheat varieties (1.4 ± 0.05 mmol/100g). Truzzi et al. [56] reported values that were almost one-third of those, both for old and modern durum wheat varieties, even though the opposite was observed for TPC and DPPH values. Significantly higher FRAP values were reported for Broccoli and Kohlrabi cultivated under organic crop management in comparison with conventional conditions [60].
3.4. Organic and late sowing Environments
An interesting observation is that in almost all the E but E2 (Organic), even when high values were observed in one analysis, low values were observed in another when they were compared with the rest. In all the analyses (TPC, ABTS, DPPH, FRAP), E2 consistently yielded values falling between those of the other E (Table 3). This provides evidence that nitrogen fertilization and its application method have a significant impact on the various antioxidant properties of durum wheat. A detailed examination of the specific compounds, their quantities, and their activity in different environments would shed more light on this observation.
In the case of late sowing Es, particularly E7, high values were observed significantly in all the antioxidant analyses. This could be attributed to the harsh or non-optimal conditions that the plants faced, leading them to produce higher levels of antioxidants for protection. Further research is needed to gather clear evidence. However, this could also be related to the dilution effect, as late sowing environments had lower productivity.
3.5. Vitreous-Kernel and Protein
The PC, as well as the VKP (only for E1), of the samples were determined to extract possible correlations with their antioxidant properties. NIR spectroscopy was used for the former, while visual observation was employed for the latter.
Regarding the VKP results, only one repetition was conducted in the E1, and the results are presented in Table 5. G2, G4, G9, and G10 possessed high VKP percentages; however, no significant differences could be calculated.
The mean protein content of the samples was 12.6 ± 2.0%, which is slightly lower than the value reported by Žilić et al. (2010) for durum wheat (13.89%) and slightly higher than that reported for bread wheat (11.7%) (Table 6) [62]. The highest protein percentages, significantly different from the rest, were found in E4, not significantly higher though than in E7. E6 had the lowest content, which was not significantly different from E2 one. Both environments with splitting fertilization (i.e. E4 and E5) had higher protein content than their conventionally fertilized counterparts. Among the G, no significant differences were observed.
3.6. Correlation
Due to the large quantity of samples, making it easier for correlations to emerge among the data, a correlation was considered significant only if it exceeded 0.4 (Table 6). A highly significant positive correlation was observed between FRAP and TPC, while a moderate correlation was observed between FRAP and each ABTS and DPPH values. A strong significant correlation was also observed between TPC and ABTS (Table 6). No significant correlations were found among vitreous-kernel percentages with TPC, DPPH and ABTS values.,. However, FRAP had a weak negative correlation with VKP (-0.351). VKP showed a high correlation with protein content. A significant correlation between TPC and DPPH is also reported by Pandino et al. [49]. Furthermore, TPC and the AC were strongly correlated in other studies as well [25,63].

Table 7.
Pearson correlations for TPC (total phenolic compound), ABTS scavenging activity, DPPH scavenging activity, and Ferric Reducing/Antioxidant Power (FRAP), Protein content (PC) and Vitreous Kernel Percentage (VKP) of durum wheat for sixteen DW genotypes cultivated under seven environments.
Table 7.
Pearson correlations for TPC (total phenolic compound), ABTS scavenging activity, DPPH scavenging activity, and Ferric Reducing/Antioxidant Power (FRAP), Protein content (PC) and Vitreous Kernel Percentage (VKP) of durum wheat for sixteen DW genotypes cultivated under seven environments.
| TPC | ABTS | DPPH | FRAP | Protein | Vitreous % | |
|---|---|---|---|---|---|---|
| TPC | 1 | ,676** | ,273** | ,525** | -,333** | -0,052 |
| ABTS | 1 | 0,110 | ,452** | -,313** | 0,097 | |
| DPPH | 1 | ,443** | 0,077 | -0,112 | ||
| FRAP | 1 | 0,113 | -,351* | |||
| Protein | 1 | ,706** | ||||
| Virteous | 1 |
*, **=significance at 0.05 and 0.01.
3.7. G×E interaction analysis
As GxE possessed a high contribution for all the analyses, the results were further analyzed by a GGE biplot analysis to visualize the interaction outcomes between genotypes and environments. Thus, varieties that surpass the average performance and demonstrate stability across multiple environments should be pinpointed. The GxE biplot analysis was specifically applied to TPC, indicating the antioxidant profile of the durum wheat samples. Notably, in section 3.5, ABTS exhibited the highest correlation with TPC, leading to its selection as an indicator of antioxidant activity. The objective was to pinpoint genotypes with higher and more stable phenolic profiles and antioxidant activity across Mediterranean farming systems as well as with a high protein content.
To assess genotypes for their suitability across diverse environments, both parametric and non-parametric indices were computed. Table 8 illustrates the genotypes occupying the first and last five positions based on rankings derived from each statistical measure. In the overall evaluation across all environments, G5, G7 and G10 consistently secured top-5 rankings with a presence frequency of 4/6, 3/6 and 5/6, respectively, establishing them as the most stable genotypes for TPC. Conversely, G2 and G8 occupied the least favorable positions in the bottom-5 rankings, with frequencies of 3/6 and 5/6, respectively.
Regarding ABTS, the most stable genotypes were appeared to be G3, G5, G7 and G13 consistently secured top-5 rankings with a presence frequency of 4/6, 3/6, 4/6 and 4/6, respectively. On the other hand, G8 and G12 occupied the least favorable positions in the bottom-5 rankings, with frequencies of 3/7 and 3/7, respectively. G1, G9 and G16, possessing 3/7, 4/7 and 5/7 frequency of presence, were the most stable genotypes for protein content.
According to the GGE biplot, for TPC the total comparison of all environments, genotype G7 was the only relatively close to the ideal genotype, followed by G10, G9 and G5. Similarly, the GGE biplot analysis revealed that for the total evaluation of ABTS in all environments, G7 was the only relatively close to the ideal genotype, followed by G4, G13 and G5. While for protein, G1 was the only relatively close to the ideal genotype, followed by G9 and G16. GGE biplot analysis explained 61.02%, 46.58% and 67.14% of the total variability, for TPC, ABTS and protein, respectively.
G7 and G5 had high presence of frequency with G7 being the closest genotype to the ideal for both TPC and ABTS. However, this trend was not observed for protein. This aligns with the strong positive correlation found between TPC and ABTS, and their weak negative correlation with protein.
Figure 1.
Genotype and genotype by environment (GGE) biplot of sixteen genotypes evaluated in seven environments for TPC (left), ABTS (center) and protein (right). The “x” sign corresponds to genotypes, and the “+” sign corresponds to environments.
Figure 1.
Genotype and genotype by environment (GGE) biplot of sixteen genotypes evaluated in seven environments for TPC (left), ABTS (center) and protein (right). The “x” sign corresponds to genotypes, and the “+” sign corresponds to environments.
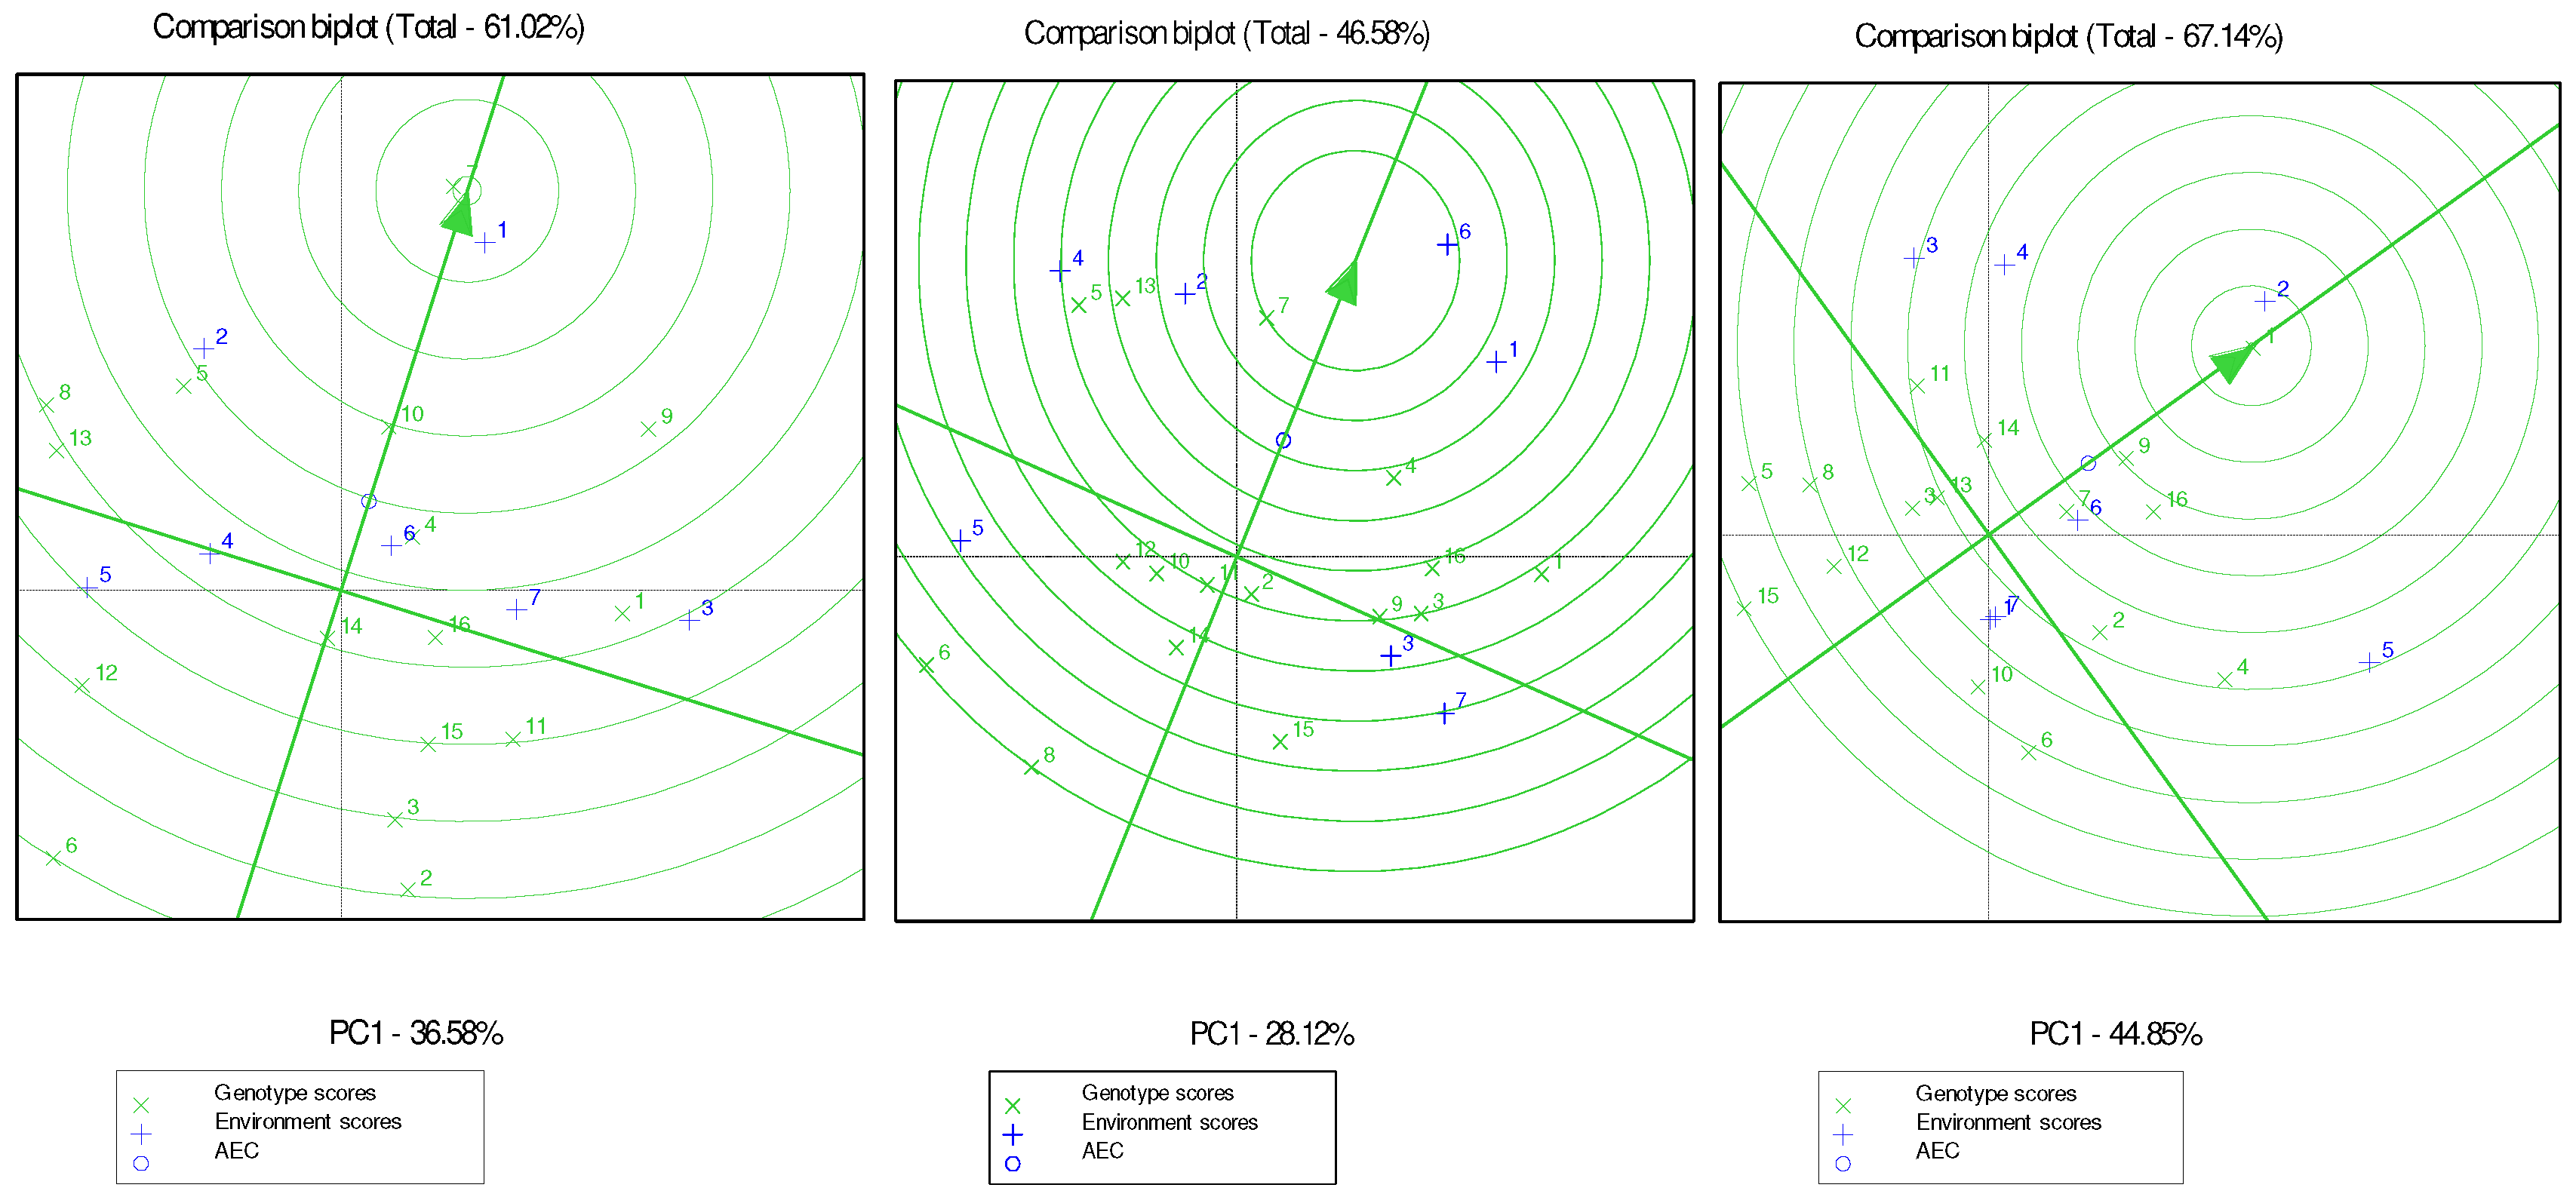
Table 9 displays the rank correlations among the statistical measures assessed across six environments. For TPC, the mean demonstrates a weak positive correlation with the measures of GGE. Among the statistical measures that had been estimated, strong positive correlations were recorded for σ2i with s2di and a weak positive correlation between 𝘒R and both σ2i and s2di. More correlations have been found among the metrics for ABTS. The mean had a moderate correlation with the measures of GGE, a strong correlation with Pi and a weak one with σ2i. GGE was positive correlated weakly with Pi and moderately with 𝘒R, which was moderately positive correlated with Pi. A moderate correlation was also observed between σ2i and s2di.
On the other hand, GGE was strongly positive correlated with the mean and Pi for protein and moderately correlated with 𝘒R. Pi possessed a positive correlation with mean and ASVi strong positive correlations with σ2i and s2di and a weak positive correlation with 𝘒R. Moderate positive correlations were also observed between σ2i and both s2di and 𝘒R which were also correlated between them.
From statistic tools that consider both G and GxE, mean (TPC, ABTS, and Protein) were positively correlated with GGE biplot analysis. Pi was positively correlated with the mean of ABTS and protein, while 𝘒R only with the mean of protein. Similar results about the effectiveness of the GGE biplot, Pi, and 𝘒R in handling G×E interaction, were found by other researchers for wheat yield [30,64,65].
4. Conclusions
This research endeavor was initiated to evaluate how genotype (G), environment (E), and their interaction (GxE) affect the total free phenolics content (TPC) and antioxidant capacity (AC) (DPPH, ABTS, FRAP) of durum wheat in Mediterranean environments. This marks the first such assessment in this context. It was observed that organic cultivation consistently yielded values falling between those of the other environments, while high values were observed in both TPC and AC for the late sowing environments. It was confirmed that GxE interaction standed out as the most influential factor, significantly impacting all analyses. Consequently, a thorough investigation into the intricacies of GxE interaction can potentially enhance both the total free phenolics content and antioxidant capacity of durum wheat produced in wheat farming systems. This improvement can be achieved by carefully selecting cultivars that demonstrate high values and exhibit stability across diverse conditions. Such genotypes are G5, G7 and G10 for TPC, G3, G5, G7, and G13 for ABTS and G1, G9 and G16 for protein. G7 and G5 had high presence of frequency with G7 being the closest genotype to the ideal for both TPC and ABTS.
Applying stability models in this study resulted in diverse rankings of genotypes. `The significance of several statistical tools, such as GGE biplot, Pi, and KR, which consider both genotype (G) and genotype-environment interaction (G×E), in identifying superior genotypes was highlighted. Ultimately, the GGE biplot emerged as an exceptionally effective tool for assessing the superior wheat genotypes in both high and stable values for examined characteristics. Moreover, this tool proved valuable since it offered a visual representation of the study's outcomes.
Overall, these findings are significant as they mark the first comprehensive exploration of the effects of various cultivation methods, particularly late sowing, organic farming, and differentiated fertilization, on TPC and AC in durum wheat. The genotypes that surpass the average performance and demonstrate stability across those environments were also explored. Understanding these influences provides valuable insights into the factors that impact durum wheat's nutritional and antioxidant quality, with potential implications for the agricultural industry and the production of healthier durum wheat -based products.
Author Contributions
For research articles with several authors, a short paragraph specifying their individual contributions must be provided. The following statements should be used “Conceptualization, E.N., I.M.; methodology, S.M., E.N., M.I., N.T., I.S., F.P., S.D., K.Z., H.C.K., A.A. and I.M. ; validation, S.M., E.N., M.I., N.T., and I.M. ; formal analysis, S.M., E.N., M.I., I.M.; investigation, S.M., E.N., I.S., K.Z., M.I., N.T., and I.M. ; resources, E.N., A.A. and I.M. .; data curation, S.M, E.N., M.I., N.T., I.S., S.D., H.C.K. and I.M.; writing—original draft preparation S.M., E.N., M.I., N.T., I.S., F.P., S.D., K.Z., H.C.K., A.A. and I.M.; writing—review and editing, S.M., E.N., M.I., N.T., I.S., F.P., S.D., K.Z., H.C.K., A.A. and I.M. ; visualization, S.M., E.N., M.I. and I.M. ; supervision, M.I., E.N.; project administration, I.M. and A.A.; funding acquisition, I.M. and A.A. All authors have read and agreed to the published version of the manuscript.
Funding
This research is implemented in the framework of the GrWheat research project (project code MIS 5072523), which was co-funded by the European Union and Greek National Funds through the Operational Program Competitiveness, Entrepreneurship and Innovation, under the call Research-Create-Innovate
Data Availability Statement
Data are only available on request due to privacy restrictions.
Conflicts of Interest
The authors declare no conflict of interest.
References
- Royo, C.; Soriano, J.M.; Alvaro, F. Wheat: A Crop in the Bottom of the Mediterranean Diet Pyramid. In Mediterranean Identities - Environment, Society, Culture; Fuerst-Bjeliš, B., Ed.; London, 2017; pp. 381–399. [Google Scholar]
- Martinez-Moreno, F.; Solis, I.; Noguero, D.; Blanco, A.; Ozberk, I.; Nsarellah, N.; Elias, E.; Mylonas, I.; Soriano, J.M. Durum Wheat in the Mediterranean Rim : Historical Evolution and Genetic Resources. Genet Resour Crop Evol 2020, 8, 1415–1436. [Google Scholar] [CrossRef]
- Xynias, I.N.; Mylonas, I.; Korpetis, E.G.; Ninou, E.; Tsaballa, A.; Avdikos, I.D.; Mavromatis, A.G. Durum Wheat Breeding in the Mediterranean Region: Current Status and Future Prospects. Agronomy 2020, 10, 432. [Google Scholar] [CrossRef]
- Head, L.; Atchison, J.; Gates, A. Wheat Becomes Quality Food: Bread, Pasta and More. In Ingrained : A Human Bio-Geography of Wheat; Head, L., Atchison, J., Gates, A., Eds.; ASHGATE: Farnham, 2012; p. 137. [Google Scholar]
- Arendt, E.K.; Zannini, E. Wheat and Other Triticum Grains. In Cereal Grains for the Food and Beverage Industries; Arendt, E.K., Zannini, E., Eds.; WOODHEAD Publishing: Cambridge, 2013; pp. 1–67. [Google Scholar]
- Turnbull, K. Basic Semolina Requirements, Advances in Durum Milling. In Pasta and Semolina Technology; Kill, R., Turnbull, K., Eds.; Blackwell Science: Oxford, 2001; pp. 43–45. [Google Scholar]
- Loreto, A. Di; Bosi, S.; Montero, L.; Bregola, V.; Marotti, I.; Sferrazza, R.E.; Dinelli, G.; Herrero, M.; Cifuentes, A. Determination of Phenolic Compounds in Ancient and Modern Durum Wheat Genotypes. 2018, 2001–2010. [Google Scholar] [CrossRef]
- Rajendran, P.; Nandakumar, N.; Rengarajan, T.; Palaniswami, R.; Nesamony, E.; Lakshminarasaiah, U.; Gopas, J.; Nishigaki, I. Antioxidants and Human Diseases. Clin. Chim. Acta 2014, 436, 332–347. [Google Scholar] [CrossRef] [PubMed]
- Stevenson, D.E.; Hurst, R.D. Review Polyphenolic Phytochemicals – Just Antioxidants or Much More ? 2007, 64, 2900–2916. [Google Scholar] [CrossRef]
- Cione, E.; Torre, C. La; Cannataro, R.; Caroleo, M.C.; Plastina, P.; Gallelli, L. Quercetin, Epigallocatechin Gallate, Curcumin, and Resveratrol : From Dietary Sources to Human MicroRNA Modulation. Molecules 2022, 25, 1–21. [Google Scholar] [CrossRef] [PubMed]
- Papoti, V.T.; Totomis, N.; Atmatzidou, A.; Zinoviadou, K.; Androulaki, A.; Petridis, D.; Ritzoulis, C. Phytochemical Content of Melissa Officinalis L. Herbal Preparations Appropriate for Consumption. Processes 2019, 7. [Google Scholar] [CrossRef]
- Irakli, M.; Tsaliki, E.; Kalivas, A.; Kleisiaris, F.; Sarrou, E. Effect of Genotype and Growing Year on the Nutritional, Phytochemical, and Antioxidant Properties of Industrial Hemp (Cannabis Sativa L.) Seeds. antioxidants 2019, 8, 20–25. [Google Scholar] [CrossRef] [PubMed]
- Skendi, A.; Irakli, M.; Chatzopoulou, P.; Papageorgiou, M. Aromatic Plants of Lamiaceae Family in a Traditional Bread Recipe : Effects on Quality and Phytochemical Content. Food Biochem. 2019, 43, 1–11. [Google Scholar] [CrossRef]
- Tsivelika, N.; Irakli, M.; Mavromatis, A.; Chatzopoulou, P.; Karioti, A. Phenolic Profile by HPLC-PDA-MS of Greek Chamomile Populations and Commercial Varieties and Their Antioxidant Activity. foods 2021, 10, 1–16. [Google Scholar] [CrossRef]
- Irakli, M.; Tsifodimou, K.; Sarrou, E.; Chatzopoulou, P. Optimization Infusions Conditions for Improving Phenolic Content and Antioxidant Activity in Sideritis Scardica Tea Using Response Surface Methodology. J. Appl. Res. Med. Aromat. Plants 2018, 8, 67–74. [Google Scholar] [CrossRef]
- Skendi, A.; Irakli, M.; Chatzopoulou, P. Analysis of Phenolic Compounds in Greek Plants of Lamiaceae Family by HPLC. J. Appl. Res. Med. Aromat. Plants 2017, 6, 62–69. [Google Scholar] [CrossRef]
- Adamidis, T.; Papageorgiou, M.; Zinoviadou, K.G. Food, Nutrition, and Health in Greece. In Nutritional and Health Aspects of Food in the Balkans; Gostin, A.-I., Bogueva, D., Kakurinov, V., Eds.; Elsevier, 2021; pp. 107–124. ISBN 9780128207826. [Google Scholar]
- Marecek, J.; Francakova, H.; Liskova, M.; Mendonça, A.; Ivanisova, E.; Mocko, K. EVALUATION OF TECHNOLOGICAL AND ANTIOXIDANT PROPERTIES OF TRITICUM AESTIVUM L. AND TRITICUM DURUM L. VARIETIES Ján Mareček *, Helena Frančáková, Miriam Líšková, Andrea Mendelová, Eva Ivanišová, Karolina Mocko. J Microbiol Biotech Food Sci 2014, 3, 253–255. [Google Scholar]
- Ciudad-Mulero, M.; Barros, L.; Fernandes, Â.; Ferreira, I.C.F.R.; Jesus Callejo, M.; Matallana-Gonnzalez, C.M.; Fernandez-Ruiz, V.; Morales, P.; Carrillo, J.M. Potential Health Claims of Durum and Bread Wheat Flours as Functional Ingredients. Nutrients 2020, 12, 1–15. [Google Scholar] [CrossRef] [PubMed]
- Liyana-Pathirana, C.M.; Shahidi, F. Antioxidant and Free Radical Scavenging Activities of Whole Wheat and Milling Fractions. Food Chem. 2007, 101, 1151–1157. [Google Scholar] [CrossRef]
- Fardet, A.; Rock, E.; Re, C. Is the in Vitro Antioxidant Potential of Whole-Grain Cereals and Cereal Products Well Reflected in Vivo ? 2008, 48. [Google Scholar] [CrossRef]
- Esposito, F.; Arlotti, G.; Maria, A.; Napolitano, A.; Vitale, D.; Fogliano, V. Antioxidant Activity and Dietary W Bre in Durum Wheat Bran. 2005, 38, 1167–1173. [Google Scholar] [CrossRef]
- Liyana-Pathirana, C.M.; Shahidi, F. The Antioxidant Potential of Milling Fractions from Breadwheat and Durum. J. Cereal Sci. 2007, 45, 238–247. [Google Scholar] [CrossRef]
- Acquistucci, R.; Melini, V.; Carbonaro, M.; Finotti, E.; Acquistucci, R.; Melini, V.; Carbonaro, M.; Finotti, E.; Acquistucci, R.; Melini, V.; et al. Bioactive Molecules and Antioxidant Activity in Durum Wheat Grains and Related Millstream Fractions and Related Millstream Fractions. 2013, 7486. [Google Scholar] [CrossRef]
- Beta, T.; Nam, S.; Dexter, Jim.E.; Sapirstein, H.D. Phenolic Content and Antioxidant Activity of Pearled Wheat and Roller-Milled Fractions. Cereal Chem 2005, 82, 390–393. [Google Scholar] [CrossRef]
- Martini, D.; Taddei, F.; Nicoletti, I.; Ciccoritti, R.; Corradini, D.; Egidio, M.G.D. Effects of Genotype and Environment on Phenolic Acids Content and Total Antioxidant Capacity in Durum Wheat. 2010, 310–317. [Google Scholar] [CrossRef]
- di Silvestro, R.; Marotti, I.; Bosi, S.; Bregola, V.; Carretero, A.S.; Sedej, I.; Mandic, A.; Sakac, M.; Benedettelli, S.; Dinelli, G. Health-Promoting Phytochemicals of Italian Common Wheat Varieties Grown under Low-Input Agricultural Management. J. Sci. Food Agric. 2012, 92, 2800–2810. [Google Scholar] [CrossRef] [PubMed]
- Yan, W. Singular-Value Partitioning in Biplot Analysis of Multienvironment Trial Data. Agron. J. 2002, 94, 990–996. [Google Scholar] [CrossRef]
- Crossa, J.; Fox, P.N.; Pfeiffer, W.H.; Rajaram, S.; Gauch, H.G. AMMI Adjustment for Statistical Analysis of an International Wheat Yield Trial. Theor. Appl. Genet. 1991, 81, 27–37. [Google Scholar] [CrossRef] [PubMed]
- Smutná, P.; Mylonas, I.; Tokatlidis, I.S. The Use of Stability Statistics to Analyze Genotype × Environments Interaction in Rainfed Wheat Under Diverse Agroecosystems. Int. J. Plant Prod. 2021, 15, 261–271. [Google Scholar] [CrossRef]
- Purchase, J.L.; Hatting, H.; van Deventer, C.S. Genotype × Environment Interaction of Winter Wheat (Triticum Aestivum L.) in South Africa: II. Stability Analysis of Yield Performance. South Afr. J. Plant Soil 2000, 17, 101–107. [Google Scholar] [CrossRef]
- Gauch, H.G. Model Selection and Validation for Yield Trials with Interaction. Biometrics 1988, 44, 705–715. [Google Scholar] [CrossRef]
- Nassar, R.; Hühn, M. Studies on Estimation of Phenotypic Stability: Tests of Significance for Nonparametric Measures of Phenotypic Stability. Biometrics 1987, 43, 45–53. [Google Scholar] [CrossRef]
- Shukla, G.K. Some Statistical Aspects of Partitioning Genotype-Environmental Components of Variability. Heredity 1972, 29, 237–245. [Google Scholar] [CrossRef] [PubMed]
- Eberhart, S.A.; Russell, W.A. Stability Parameters for Comparing Varieties1. Crop Sci. 1966, 6, cropsci1966.0011183X000600010011x. [Google Scholar] [CrossRef]
- Kang, M.S. A Rank-Sum Method for Selecting High-Yielding, Stable Corn Genotypes. Cereal Res. Commun. 1988, 16, 113–115. [Google Scholar]
- Yan, W.; Kang, M.S.; Ma, B.; Woods, S.; Cornelius, P.L. GGE Biplot vs. AMMI Analysis of Genotype-by-Environment Data. Crop Sci. 2007, 47, 643–653. [Google Scholar] [CrossRef]
- Lv, J.; Lu, Y.; Niu, Y.; Whent, M.; Ramadan, M.F.; Costa, J.; Yu, L.L. Effect of Genotype, Environment, and Their Interaction on Phytochemical Compositions and Antioxidant Properties of Soft Winter Wheat Flour. Food Chem. 2013, 138, 454–462. [Google Scholar] [CrossRef] [PubMed]
- Beck, H.E.; Zimmermann, N.E.; McVicar, T.R.; Vergopolan, N.; Berg, A.; Wood, E.F. Present and Future Köppen-Geiger Climate Classification Maps at 1-Km Resolution. Sci. Data 2018, 5, 1–12. [Google Scholar] [CrossRef] [PubMed]
- Peel, M.C.; Finlayson, B.L. McMahon Updated World Map of the K¨oppen-Geiger Climate Classification. Hydrol. Earth Syst. Sci. 2007, 11, 16–1644. [Google Scholar] [CrossRef]
- Singleton, V.L.; Orthofer, R.; Lamuela-Raventos, R.M. Analysis of Total Phenols and Other Oxidation Substrates and Antioxidants by Means of Folin-ciocalteu Reagent. In Methods in Enzymology; Packer, L., Ed.; Academic Press, 1999; Volume 299, pp. 152–178. [Google Scholar]
- Re, R.; Pellegrini, N.; Proteggente, A.; Pannala, A.; Yang, M.; Rice-Evans, C. Antioxidant activity applying an improved ABTS radical cation decolorization assay. Free Radic. Biol. Med. 1999, 26, 1231–1237. [Google Scholar] [CrossRef]
- Benzie, I.F.F.; Strain, J.J. The Ferric Reducing Ability of Plasma (FRAP) as a Measure of ‘“Antioxidant Power”’: The FRAP Assay. Anal. Biochem. 1996, 239, 70–76. [Google Scholar] [CrossRef]
- Yen, G.C.; Chen, H.Y. Antioxidant Activity of Various Tea Extracts in Relation to Their Antimutagenicity. J. Agric. Food Chem. 1995, 43, 27–32. [Google Scholar] [CrossRef]
- Kozak, M.; Piepho, H.-P. What’s Normal Anyway? Residual Plots Are More Telling than Significance Tests When Checking ANOVA Assumptions. J. Agron. Crop Sci. 2018, 204, 86–98. [Google Scholar] [CrossRef]
- Lin, C.S.; Binns, M.R. A Method of Analyzing Cultivar x Location x Year Experiments: A New Stability Parameter. Theor. Appl. Genet. 1988, 76, 425–430. [Google Scholar] [CrossRef]
- Kang, M.S. A Rank-sum method for selecting high-yielding, stable corn genotypes. Cereal Res. Commun. 1988, 16, 113–115. [Google Scholar]
- Šukalović, V.H.-T.; Dodig, D.; Žilić, S.; Basic, Z.; Kandic, V.; Delic, N.; Miritescu, M. Genotypic and Environmental Variation of Bread and Durum Wheat Proteins and Antioxidant Compounds. ROMANIAN Agric. Res. 2013, 30, 1–10. [Google Scholar]
- Pandino, G.; Mattiolo, E.; Lombardo, S.; Lombardo, G.M.; Mauromicale, G. Organic Cropping System Affects Grain Chemical Composition, Rheological and Agronomic Performance of Durum Wheat. Agriculture 2020, 10, 1–14. [Google Scholar] [CrossRef]
- Martini, D.; Taddei, F.; Ciccoritti, R.; Pasquini, M.; Nicoletti, I.; Corradini, D.; Grazia, M.; Egidio, D. Variation of Total Antioxidant Activity and of Phenolic Acid, Total Phenolics and Yellow Coloured Pigments in Durum Wheat ( Triticum Turgidum L. Var. Durum ) as a Function of Genotype, Crop Year and Growing Area. J. Cereal Sci. 2015, 65, 175–185. [Google Scholar] [CrossRef]
- Irakli, M.; Kargiotidou, A.; Tigka, E.; Beslemes, D.; Fournomiti, M.; Pankou, C.; Stavroula, K.; Tsivelika, N.; Vlachostergios, D.N. Genotypic and Environmental Effect on the Concentration of Phytochemical Contents of Lentil (Lens Culinaris l.). Agronomy 2021, 11, 1–18. [Google Scholar] [CrossRef]
- Lv, J.; Lu, Y.; Niu, Y.; Whent, M.; Ramadan, M.F.; Costa, J.; Yu, L. Effect of Genotype, Environment, and Their Interaction on Phytochemical Compositions and Antioxidant Properties of Soft Winter Wheat Flour. Food Chem. 2013, 138, 454–462. [Google Scholar] [CrossRef]
- Laus, M.N.; Tozzi, D.; Soccio, M.; Fratianni, A.; Panfili, G.; Pastore, D. Dissection of Antioxidant Activity of Durum Wheat (Triticum Durum Desf.) Grains as Evaluated by the New LOX/RNO Method. J. Cereal Sci. 2012, 56, 214–222. [Google Scholar] [CrossRef]
- Acquistucci, R.; Melini, V.; Garaguso, I.; Nobili, F. Effect of Bread Making Process on Bioactive Molecules in Durum Wheat Bread and Assessment of Antioxidant Properties by Caco-2 cell Culture Model. J. Cereal Sci. 2018, 83, 188–195. [Google Scholar] [CrossRef]
- Boukid, F.; Dall’Asta, M.; Bresciani, L.; Mena, P.; Del Rio, D.; Calani, L.; Sayar, R.; Yong Seo, W.; Yacoubi, I.; Mejri, M. Phenolic Profile and Antioxidant Capacity of Landraces, Old and Modern Tunisian Durum Wheat. Eur. Food Res. Technol. 2018, 245, 73–82. [Google Scholar] [CrossRef]
- Truzzi, F.; Dinelli, G.; Spisni, E.; Simonetti, E.; Trebbi, G.; Marotti, I. Phenolic Acids of Modern and Ancient Grains : Effect on in Vitro Cell Model. 2019. [Google Scholar] [CrossRef]
- Nocente, F.; Stefanis, E. De; Ciccoritti, R.; Pucciarmati, S.; Taddei, F.; Campiglia, E.; Radicetti, E.; Mancinelli, R. How Do Conventional and Organic Management a Ff Ect the Healthy Potential of Durum Wheat Grain and Semolina Pasta Traits ? Food Chem. 2019, 297, 124884. [Google Scholar] [CrossRef]
- Fares, C.; Menga, V.; Codianni, P.; Russo, M.; Perrone, D.; Suriano, S.; Rascio, A. Phenolic Acids Variability and Grain Quality of Organically and Conventionally Fertilised Old Wheats under a Warm Climate. 2019. [Google Scholar] [CrossRef]
- Pinto, T.; Vilela, A.; Pinto, A.; Nunes, F.M.; Anjos, R. Influence of Cultivar and of Conventional and Organic Agricultural Practices on Phenolic and Sensory Profile of Blackberries ( Rubus Fruticosus ). 2018. [Google Scholar] [CrossRef]
- Vicas, S.I.; Teusdea, A.C.; Carbunar, M.; Socaci, S.A.; Socaciu, C. Glucosinolates Profile and Antioxidant Capacity of Romanian Brassica Vegetables Obtained by Organic and Conventional Agricultural Practices. 2013, 313–321. [Google Scholar] [CrossRef]
- Ma, D.; Sun, D.; Li, Y.; Wang, C.; Xie, Y.; Guo, T. Effect of Nitrogen Fertilisation and Irrigation on Phenolic Content, Phenolic Acid Composition, and Antioxidant Activity of Winter Wheat Grain. 2014. [Google Scholar] [CrossRef]
- Žilić, S.; Dodig, D.; Šukalović, V.; Maksimovic, M.; Saratlić, G.; Skrbic, B. Bread and Durum Wheat Compared for Antioxidants Contents, and Lipoxygenase and Peroxidase Activities. Int. J. Food Sci. Technol. 2010, 45, 1360–1367. [Google Scholar] [CrossRef]
- Fu, B.X.; Chiremba, C.; Pozniak, C.J.; Wang, K.; Nam, S. Total Phenolic and Yellow Pigment Contents and Antioxidant Activities of Durum Wheat Milling Fractions. 2017. [Google Scholar] [CrossRef]
- Mohammadi, R.; Amri, A. Comparison of Parametric and Non-Parametric Methods for Selecting Stable and Adapted Durum Wheat Genotypes in Variable Environments. Euphytica 2008, 159, 419–432. [Google Scholar] [CrossRef]
- Kebede, A.; Getahun, A. Adaptability and Stability Analysis of Groundnut Genotypes Using AMMI Model and GGE-Biplot. J. Crop Sci. Biotechnol. 2017, 20, 343–349. [Google Scholar] [CrossRef]
Table 1.
Origin, genealogy, and release date of the 16 genotypes.
| Genotype | Name of variety | Country of Origin | Genealogy | Year released |
|---|---|---|---|---|
| G1 | Pigreco | Italy | NA | NA |
| G2 | Canavaro | Italy | Coloseo/Simeto | 2008 |
| G3 | Maestrale | Italy | Iride/Svevo | 2004 |
| G4 | M. Aurelio | Italy | D95241/Arcobaleno/ Svevo | NA |
| G5 | Meridiano | Italy | Simeto / WB881 / Duilio / F21 | 1999 |
| G6 | Mexicali-81 | Greece | Selection from Mexicali 75 | 1981 |
| G7 | Monastir | France | Not Available (NA) | NA |
| G8 | Simeto | Italy | Capeiti 8 /Valnova | 1988 |
| G9 | Svevo | Italy | Linea Cimmyt/Zenith | 1996 |
| G10 | Vendeta | Italy | Creso/Ofanto (LAUSE ET AL 2015 | 2003 |
| G11 | Egeo | Italy | Claudio/v80 | |
| G12 | Elpida | Greece | Sifnos/Mexicali-81 | 2010 |
| G13 | Zoi | Greece | Simeto /Mexicali-81 | 2011 |
| G14 | Secolo | Italy | NA | NA |
| G15 | Grecale | Italy | NA | NA |
| G16 | Zeta E. | Greece | NA | NA |
Table 2.
Soil and climatic characteristics of seven evaluation environments.
| Code | Location | Latitude/ Longitude |
Climate type |
PrA2 (mm) |
PrA-M 3 (mm) |
T4 (oC) |
Prod.5 | Fertiliz.6 | Planting Date | Soil Texture7 |
pH (1:1) | EC8 | SOM % |
POlsen mg kg-1 |
|---|---|---|---|---|---|---|---|---|---|---|---|---|---|---|
| E1 |
Thermi/Typical Fertilization/typical sowing date | 40o54´N/ 23o00´E |
BSk1 | 343.6 | 45.4 | 12.8 | HP | Typical | Typical | L | 7.89 | 0.516 | 1.8 | 12.28 |
| E2 | Thermi-Organic/typical sowing date | 40o54´N/ 23o00´E |
BSk | 343.6 | 45.4 | 12.8 | LP | Organic | Typical | L | 7.67 | 0.585 | 2.5 | 22.47 |
| E3 | Thermi-Typical fertilization/Late sowing | 40o54´N/ 23o00´E |
BSk | 343.6 | 45.4 | 12.8 | LP | Typical | Late sowing | L | 7.84 | 0.681 | 1.8 | 18.29 |
| E4 | Thermi-splitting fertilization/Typical sowing date | 40o54´N/ 23o00´E |
BSk | 343.6 | 45.4 | 12.8 | HP | Splitting topdressing applicattion | Typical | L | 8.14 | 0.564 | 1.7 | 20.63 |
| E5 | Thermi-Late Splitting fertilization/Late sowing date | 40o54´N/ 23o00´E |
BSk | 343.6 | 45.4 | 12.8 | LP | Splitting topdressing application | Late sowing | L | 7.99 | 0.497 | 1.8 | 23.21 |
| E6 | Nea Gonia/Typical Fertilization/ Typical sowing date | 40o35´N/ 23o08´E |
BSk | 335.5 | 57.6 | 12.4 | HP | Typical |
Mindle November |
CL | 7.05 | 0.525 | 1.8 | 30.10 |
| E7 | Sindos/Typical Fertilization/Late sowing date |
40o68´N/ 22o80´E |
BSk | 376.2 | 41.6 | 12.7 | LP | Typical | Late sowing | SL | 7.85 | 0.485 | 1.7 | 28.50 |
1Köppen-Geiger climate type BSk = arid, steppe, cold [39,40]; 2PrA = precipitation during all growing season (November to June), 3PrA-M = precipitation of grain filling period i.e. April–May (this period mainly represents the beginning of flowering to grain filling); 4T (oC) = the average temperature in the growing season (November to June), 5In typical fertilization (total N amount of 180 kg ha−1) one-third of which was applied (ammonium phosphate 20-10-0) before sowing and two-third (ammonium nitrate 33.5-0-0) at full tillering (Zadok 29), in splitting top-dress N fertilization, one-third of which was applied (ammonium phosphate 20-10-0) before sowing, one-third ((ammonium nitrate 33.5-0-0) at full tillering (Zadok 29) and one-third during the first node (Zadok 31). All the other agronomic treatments were identically applied to all plots to study; 6 Soil texture, L=loam, CL=clay loam, SL=sandy lam; 7EC = electrical conductivity (Ms cm-1); 7SOM = soil organic matter. In each location, the trial daily mean air temperature and precipitation during the growing seasons were recorded by a wireless automatic weather station (Pessl iMetos OEM Model-1) installed and supported by the software DSS Legumini.net for better microclimate illustration.
Table 3.
Two-way ANOVA for total phenolic compound (TPC), ABTS scavenging activity, DPPH scavenging activity and Ferric Reducing/Antioxidant Power (FRAP) determined for sixteen durum wheat genotypes cultivated under seven environments.
Table 3.
Two-way ANOVA for total phenolic compound (TPC), ABTS scavenging activity, DPPH scavenging activity and Ferric Reducing/Antioxidant Power (FRAP) determined for sixteen durum wheat genotypes cultivated under seven environments.
| TPC | ABTS | DPPH | FRAP | ||||||||||||
| df | MS | SS | SS% | MS | SS | SS% | MS | SS | SS% | MS | SS | SS % | |||
| Environment | 6 | 1787.6*** | 10725.5 | 42.4 | 7348.9*** | 44093.6 | 33.1 | 2664.9*** | 3992.1 | 38.3 | 25886.9*** | 155321.4 | 20.7 | ||
| Genotype | 15 | 154.7*** | 2320.2 | 9.2 | 594.0*** | 8910.0 | 6.7 | 266.1*** | 3992.1 | 9.6 | 6325.1*** | 94876.7 | 12.7 | ||
| G×E | 90 | 118.6*** | 10670.6 | 42.2 | 671.0*** | 60389.3 | 45.3 | 231.6*** | 20844.8 | 49.9 | 5403.5*** | 486314.2 | 64.9 | ||
| Error | 224 | 6.9 | 1551.4 | 6.2 | 89.4 | 20016.5 | 15.0 | 4.1 | 926.3 | 2.2 | 56.9 | 12746.9 | 1.7 | ||
df: degrees of freedom, MS: Mean Square, SS: Sum of Squares. ***: P<0.001.
Table 4.
Mean values, for 16 durum wheat genotypes and 7 environments of total phenolic compounds (TPC), ABTS and DPPH radical scavenging activity, and Ferric Reducing/Antioxidant Power (FRAP).
Table 4.
Mean values, for 16 durum wheat genotypes and 7 environments of total phenolic compounds (TPC), ABTS and DPPH radical scavenging activity, and Ferric Reducing/Antioxidant Power (FRAP).
| TPC* | ABTS | DPPH | FRAP | |
|---|---|---|---|---|
| Environment | ||||
| Ε1 | 48.8±7.7d** | 118.3±15.3c, d | 14.4±5.0f | 75.7±32.1d |
| Ε2 | 49.5±7.4c, d | 122.2±15.2b, c | 18.7±12.7e | 91.2±66.5d |
| Ε3 | 57.3±8.2a | 142.6±19.1a | 21.5±16.3d | 106.7±69.1b |
| Ε4 | 42.0±7.0e | 110.8±18.2e, d | 16.6±6.0f, e | 88.7±17.0c |
| Ε5 | 39.8±5.1 d | 104.8±16.1e | 34.4±4.1a | 52.4±20.9e |
| Ε6 | 51.7±4.7b, c | 128.4±16.6b | 24.5±3.2c | 79.2±11.1d |
| Ε7 | 52.8±5.5b | 122.4±14.3b, c | 31.1±5.8b | 125.1±39.6a |
| Average | 48.8±8.7 | 121.3±20 | 23.0±11.2 | 88.4±47.3 |
| Genotype | ||||
| G1 | 49.9±11.0a, b** | 122.8±23.5a, b | 26.1±9.8b, c | 106.6±44.3b |
| G2 | 43.8±8.5c | 112.8±15.7a, b | 20.0±10.4e, f, g | 77.1±38.0c, d, e, f |
| G3 | 46.5±9.6b, c | 124.7±22.8a | 22.7±7.3c, d, e | 80.0±25.6c, d, e |
| G4 | 49.4±7.8a, c | 124.0±18.2a, b | 23.6±8.4b, c, d, e | 109.2±56.2b, a |
| G5 | 52.4±4.7a | 129.0±18.9a | 22.7±6.9c, d, e | 72.9±22.3d, e, f |
| G6 | 49.0±10.1a, b | 121.1±24.1a, b | 27.0±19.2b | 112.0±90.2a, b |
| G7 | 52.4±7.7a | 125.5±14.8a | 23.9±9.1b, c, d | 108.0±39.5b |
| G8 | 46.9±5.3b, c | 107.0±15.8b | 20.3±9.6d, e, f, g | 69.9±25.1f, e |
| G9 | 53.1±11.7a | 122.4±23.1a, b | 31.7±18.8a | 90.4±45c |
| G10 | 50.4±8.0a, b | 120.2±15.4a, b | 20.9±11.4d, e, f, g | 86.3±27.4c. d |
| G11 | 47.0±9.2b, c | 121.3±16.2a, b | 18.9±9.3f, g | 81.0±24.1c, d, e |
| G12 | 46.9±5.4b, c | 116.714.2a, b | 17.8±9.3g | 72.9±18.7d, e, f |
| G13 | 49.6±6.4a, b | 125.4±13.3a | 22.9±6.8c, d, e | 65.8±12.1f |
| G14 | 45.7±7.7b, c | 120.1±16.8a, b | 20.1±5.8e, f, g | 80.0±20.5c, d, e |
| G15 | 52.0±10.7a | 124.2±28.1a | 27.2±13.1b | 122.1±96.7f |
| G16 | 46.5±7.6b, c | 124.2±26.1a | 22.4±7.7c, d, e, f | 80.5±32.4c, d, e |
| Average | 48.8±8.7 | 121.2±20.0 | 23.0±11.2 | 88.4±47.3 |
*TPC: total phenolic compound (expressed as mg GAE/100 g dw), ABTS: ABTS+ scavenging activity (expressed as TE/100 g dw), DPPH: DPPH scavenging activity (expressed as TE/100 g dw) and FRAP: Ferric Reducing/Antioxidant Power (expressed as TE/100 g dw). **Different letters within a column indicate significant differences (among environments or genotypes) according to the Tukey HSD test (p < 0.05).
Table 5.
Percentages of Vitreous-Kernel of 16 durum wheat genotypes under seven environments.
| Genotype | Vitreous % |
| G1 | 62.25 |
| G2 | 87.5 |
| G3 | 74.8 |
| G4 | 86.7 |
| G5 | 69.3 |
| G6 | 66.6 |
| G7 | 55.1 |
| G8 | 73.1 |
| G9 | 83.5 |
| G10 | 92.2 |
| G11 | 63.6 |
| G12 | 56.6 |
| G13 | 77.4 |
| G14 | 45.6 |
| G15 | 72.7 |
| G16 | 76.9 |
| Average | 71.5±12.4 |
Table 6.
Mean protein percentages of sixteen durum wheat genotypes cultivated under seven environments.
Table 6.
Mean protein percentages of sixteen durum wheat genotypes cultivated under seven environments.
| Mean Protein % | |
| Environment | |
| E1 | 13.3 ± 0.8c* |
| E2 | 10.7 ± 1.9d, e |
| E3 | 11.6 ± 1.1d |
| E4 | 15.1 ± 1.6a |
| E5 | 13.1 ± 1.2c |
| E6 | 10.3 ± 0.6e |
| E7 | 14.1 ± 0.9a, b |
| Genotype | |
| G1 | 13.9 ± 2.5a |
| G2 | 12.9 ± 1.8 a |
| G3 | 12.2 ± 2.2 a |
| G4 | 13.1 ± 2.0 a |
| G5 | 12.2 ± 2.0 a |
| G6 | 11.8 ± 1.6 a |
| G7 | 12.7 ± 1.9 a |
| G8 | 12.1 ± 2.4 a |
| G9 | 13.0 ± 2.3 a |
| G10 | 12.6 ± 2.2 a |
| G11 | 12.7 ± 2.3 a |
| G12 | 11,9 ± 1.6 a |
| G13 | 12.5 ± 1.8 a |
| G14 | 12.5 ± 2.1 a |
| G15 | 12.1 ± 1.9 a |
| G16 | 13.3 ± 1.9 a |
*Different letters within a column indicate significant differences according to the Tukey HSD test (p < 0.05).
Table 8.
Genotypes were categorized into top-5 and bottom-5 groups based on both mean yield and stability measures of genotype superiority in the GGE biplot and parametric measures (ASVi, Pi, σ2i, s2di, and KR).
Table 8.
Genotypes were categorized into top-5 and bottom-5 groups based on both mean yield and stability measures of genotype superiority in the GGE biplot and parametric measures (ASVi, Pi, σ2i, s2di, and KR).
| TPC | ABTS | Protein | ||||||||||||||||||||||
|---|---|---|---|---|---|---|---|---|---|---|---|---|---|---|---|---|---|---|---|---|---|---|---|---|
| All | Mean | GGE | ASVi | Pi | σ2i | s2di | 𝘒R | Mean | GGE | ASVi | Pi | σ2i | s2di | 𝘒R | Mean | GGE | ASVi | Pi | σ2i | s2di | 𝘒R | |||
| top-5 | G9 | G7 | G14 | G5 | G16 | G3 | G10 | G53 | G7 | G23 | G5 | G2 | G3 | G3 | G13 | G1 | G134 | G1 | G13 | G13 | G16 | |||
| G54* | G10 | G4 | G33 | G10 | G16 | G5 | G74 | G43 | G7 | G3 | G11 | G2 | G4 | G165 | G94 | G34 | G16 | G16 | G3 | G9 | ||||
| G73 | G9 | G10 | G13 | G4 | G10 | G4 | G134 | G13 | G113 | G13 | G12 | G12 | G11 | G4 | G16 | G7 | G4 | G3 | G16 | G2 | ||||
| G15 | G5 | G163 | G4 | G3 | G5 | G15 | G34 | G5 | G14 | G4 | G10 | G11 | G13 | G94 | G72 | G123 | G9 | G12 | G12 | G13 | ||||
| G105 | G46 | G2 | G7 | G14 | G4 | G9 | G16 | G16 | G10 | G7 | G4 | G13 | G7 | G2 | G14 | G14 | G101 | G2 | G9 | G3 | ||||
| bottom-5 | G85 | G152 | G1 | G6 | G91 | G15 | G11 | G10 | G12 | G6 | G6 | G15 | G16 | G14 | G55 | G6 | G6 | G14 | G6 | G102 | G10 | |||
| G3 | G12 | G73 | G16 | G13 | G13 | G2 | G14 | G14 | G16 | G9 | G16 | G1 | G15 | G84 | G8 | G13 | G3 | G5 | G5 | G8 | ||||
| G16 | G3 | G134 | G13 | G7 | G11 | G12 | G123 | G153 | G1 | G12 | G9 | G5 | G9 | G155 | G12 | G5 | G8 | G1 | G1 | G5 | ||||
| G14 | G2 | G8 | G8 | G8 | G7 | G6 | G2 | G66 | G6 | G2 | G5 | G9 | G8 | G123 | G5 | G15 | G12 | G4 | G4 | G6 | ||||
| G23 | G66 | G6 | G2 | G6 | G6 | G8 | G83 | G8 | G95 | G8 | G6 | G6 | G6 | G66 | G15 | G43 | G6 | G15 | G15 | G15 | ||||
* Denotes the frequency of the genotype in the group that is ≥3.
Table 9.
Spearman’s rank correlation coefficients were computed between the statistics of mean TPC, ABTS, and protein with cultivar superiority, the GGE biplot rank and parametric measures (ASVi, Pi, σ2i, s2di, and KR).
Table 9.
Spearman’s rank correlation coefficients were computed between the statistics of mean TPC, ABTS, and protein with cultivar superiority, the GGE biplot rank and parametric measures (ASVi, Pi, σ2i, s2di, and KR).
| TPC | ABTS | Protein | |||||||||||||||||
|---|---|---|---|---|---|---|---|---|---|---|---|---|---|---|---|---|---|---|---|
| GGE | ASVi | Pi | σ2i | s2di | 𝘒R | GGE | ASVi | Pi | σ2i | s2di | 𝘒R | GGE | ASVi | Pi | σ2i | s2di | 𝘒R | ||
| Mean | 0.609* | ns | ns | ns | ns | ns | 0.712** | ns | 0.785*** | -0.506* | ns | ns | 0.865*** | ns | 0.915*** | ns | ns | 0.703** | |
| GGE | 1 | ns | ns | ns | ns | ns | 1 | ns | 0.559* | ns | ns | 0.714** | 1 | ns | 0.659** | ns | ns | 0.773** | |
| ASVi | 1 | ns | ns | ns | ns | 1 | ns | ns | ns | ns | 1 | ns | 0.903*** | 0.888*** | 0.582* | ||||
| Pi | 1 | ns | ns | ns | 1 | ns | ns | 0.677** | 1 | ns | ns | ns | |||||||
| σ2i | 1 | 0.815** | 0.599* | 1 | 0.865** | ns | 1 | 0.988** | 0.718** | ||||||||||
| s2di | 1 | 0.587* | 1 | 0.685** | 1 | 0.696** |
*, **, *** significant at the p < 0.05, p < 0.01 and p < 0.001 levels of probability, respectively.
Disclaimer/Publisher’s Note: The statements, opinions and data contained in all publications are solely those of the individual author(s) and contributor(s) and not of MDPI and/or the editor(s). MDPI and/or the editor(s) disclaim responsibility for any injury to people or property resulting from any ideas, methods, instructions or products referred to in the content. |
© 2023 by the authors. Licensee MDPI, Basel, Switzerland. This article is an open access article distributed under the terms and conditions of the Creative Commons Attribution (CC BY) license (http://creativecommons.org/licenses/by/4.0/).
Copyright: This open access article is published under a Creative Commons CC BY 4.0 license, which permit the free download, distribution, and reuse, provided that the author and preprint are cited in any reuse.


