Submitted:
15 December 2023
Posted:
15 December 2023
You are already at the latest version
Abstract
We discuss slip bonds, catch bonds and the tug-of-war mechanism using
mathematical arguments. We propose simple 2-dimensional surface models
to demonstrate how the potential energy surface of a molecule under an
external force behaves. Examples are selectines.
Catch bonds in particular are explained in more detail.
We demonstrate that Newton trajectories are a powerful tool
to describe these phenomena.
Newton trajectories form the theoretical background of Mechanochemistry.
Keywords:
Slip bonds
; catch bonds
; tug-of-war-mechanism
; selectines
; Newton trajectories
1. Introduction
Catch bonds were discovered 35 years ago [1], and they are observed in many biochemical molecules [2,3]. As a molecule deforms, the rate of dissociation decreases. The stabilization of a complex by an external force in the catch bond model is an exciting phenomenon. To our knowledge, there are two proposals for suitable free energy surfaces for modeling catch bond behavior [4,5]. We will discuss these models, as well as our own modifications.
We are convinced that the theory of Newton trajectories (NT) [6,7] is a tool to rationalize the biochemical phenomena of slip- and catch-bonds. To understand this mathematical theory, we assume that under an external force, the effective mechanochemical potential must be taken into account
where is the potential energy surface (PES) of a molecular system under consideration, or its free energy surface. is the normalized direction of an external force vector acting on the molecule, and F is the magnitude of the force. The superscript T means the transpose. Note that force is a vector quantity, where both, direction and size are important. By x we depict the molecule in arbitrary coordinates. The approach of Eq. (1) is the simplest possible approach with a linear external force. Sometimes a nonlinear force of the form [8,9] is used which we will not treat further here.
The stationary points of the PES move under the force. The new barrier of the effective PES changes with, but the barrier is a sum of two differences
The two parts can play together, or they can act against each other. This complicates the overall picture. The second part for in Eq. (2) has already been discussed in refs. [2,10], for example. We discuss the first summand below. Its solution curve is usually curvilinear. This contradicts the theory of Bell, as it is also discussed recently in ref. [5].
The gradient of the effective PES for the stationary points, , has to be zero to describe this movement of the stationary points, . It means that it has to apply
where is the gradient of the original PES. The value F changes like a parameter along the solution curve. Given a new value, say , a new point is found, , in the manner for which Eq. (3) is satisfied for the new parameter value, . At each point the parameter value, F, coincides with the root square of the gradient norm
For the movement of any critical point, , one creates a differential equation [6,11] by
where is the inverse of the Hessian matrix of the original PES, and is the determinant of this Hessian matrix. A curve length variable, t, is also used. Solutions of Eqs. (3)/(4) are called Newton trajectories (NTs). Eq. (4) was created a long time ago by Branin [12], see also the text book [13], where one uses the so-called adjunct Hessian. It is the desingularized matrix
The study by Barkan and Bruinsma [14] also introduces parts of the theory of NTs, however, note that Eq.(4) is used in a probably misleading form in refs. [5,14]. They only get partly correct results.
Each solution of Eqs. (3)/(4) to different directions connects a minimum to a saddle point (SP) of index one, SP1. In chemistry it is called a transition state (TS). More generally, an NT connects stationary points of an index difference of one [15,16,17]. A solution curve has to cross a point on its path where it holds . The force in the direction with the magnitude to reach the point with forces the former minimum and former saddle SP1 to coincide. This event is called the bond breaking point (BBP) [7]. Each local point on the manifold determines one solution curve of Eq.(3), though its corresponding gradient direction there. The reason is that along every solution curve of Eq.(3) the gradient direction is fixed, and it is equal to . The manifold crosses anywhere on the PES the manifold of valley-ridge inflection points (VRI) [16,18,19,20,21].
The mathematical theory of Newton trajectories (NT) can be used to study several types of reaction paths viz the standard reaction model [22], as well as a reaction path under an external mechanical force [7,23] and under an external electric field [24,25], the latter with a generalization of this theory. Some kinds of solutions of Eq.(3) can themselves serve as reaction pathway models, besides the well-known steepest descent model of the so-called intrinsic reaction coordinate (IRC) [26,27,28,29], or the gradient extremals [17,30,31,32,33,34,35,36,37], or the gentlest ascent dynamics [38,39], or many other models [40,41].
The aim of this paper is the foundation of molecular potential energy surfaces for catch - and slip bonds. For this we propose simple 2-dimensional surface models. Special examples are selectins [14].
The article is organized in the following way. In Section 2 we show the utility of the mathematical theory of NTs for the description of slip- and catch-bonds. Section 3 describes the tug-of-war mechanism based on the NT theory. We numerate different models with capital letters, A-G. Section 4 is a discussion. In Section 5 there is a glossary reported of definitions of bio-mechano-chemistry. Finally, in Section 6 a set of conclusions is reported based on the present model.
2. Slip- and catch-bonds
2.1. Slip Bonds
There are different types of bonds: one type is the ideal bond [42,43] being insensitive against tensile forces. It has been suggested to play a role in enabling the receptor-ligand pair to withstand tensile force, but it has not yet been reported in experiments.
Usually bonds weaken under the action of mechanical load. Such chemical bonds, whose dissociation rate grows with increasing external force, are called slip bonds. The name was coined by Bell in 1978 for biological adhesive bonds [44]. An example are B cells which apply forces to segregate and rupture clusters, and individual antibody-antigen interactions which exhibit a slip-bond character [45]. Thus they show lifetime reduction under force. Unbinding forces of single antibody-antigen complexes correlate with their thermal dissociation rates. The same TS must be crossed in spontaneous and in forced unbinding. The unbinding path under load cannot be too different from the one at zero force.
Let us assume the simplified 2-dimensional landscape, , of a molecular system [5] constituted for the receptor of endothelial selectin (E-selectin) and the ligand sLex [46] linked by a non-covalent bond. It is a challenge to select special coordinates when dealing with protein-ligand interactions. We find a high dimensionality and a great flexibility. Here [5] one uses two length coordinates, in nm, to describe the movement of the ligand. L is the protein extension, but d is the distance to the ligand. Forces are given in pN. The bound state corresponds to a minimum of the PES named reactant, R, in Figure 1. (All drawings and calculations are done with Mathematica 13.3.1.0 for platform Linux x86 (64-bit).) The TS is the final level of a Morse ascent at large d and nm.
The application of Eqs.(3) and (4) for a tensile mechanical force, , along the dashed NT, decreases the height of the barrier if F increases from zero to some value. It needs here a very large force up to pN. But it continuously decreases the barrier, and at least the TS and the former minimum, R, coalesce at the BBP, the crossing of the NT and the right line. As a result, the life time of the slip bond decreases when it is stressed by the tensile force [47,48]. When the external force is applied then the effective PES, , describes the evolution of the bound state to the unbound state, and is given by Eq. (1). Note that the dashed NT has a turning point (TP) at . This does not disturb the slip character, see also an extreme case in ref. [6]. However, it is in a contradiction to a statement that catch bond character holds behind so-called points [5,14]. Concluding this example we have to state that the putative model surface for E-selectin with ligand sLex [5] is not appropriated to the slip-catch-slip behavior of this molecular complex.
Slip bonds depict directions where the corresponding NT to leads more or less directly from a minimum to a transition state. In Figure 1, seen from R, we can assume that here all directions to above are good directions. Note that the NT describes the pathways of the stationary points under the external force. Here only two stationary points emerge, the minimum, R, and the of the dissociation.
2.2. Catch Bonds
Seen from the TS the slip direction is the natural direction of the SP valley, compare the TS on the red line in Figure 2. Of course, one can deviate to both sides up to a certain degree, and one still goes downhill the reaction valley. It would still hold the slip bond character. However, if the external excitation direction becomes more or less orthogonal to the col then one goes uphill. Such a case was then named catch bond direction if the barrier increases under the external force.
Note that for an N-dimensional PES we have a one-dimensional valley path over the SP1, the slip direction, however, we have directions orthogonally uphill into the PES mountains.
An early work [1] describes the occurrence of states in which adhesion cannot be reversed by application of tension. Such states occur only if the adhesion molecules have certain constitutive properties thus having catch-bond character. Often catch bond behavior is connected to sheer forces in proteins [49]. Another example is dynein’s interaction with micro tubules which behaves like a catch bond [50]. The dependence on the force direction to modulate the multistep process of translation is reported in refs. [51,52]. The calculated forces alter the transition state barrier of the peptidyl transfer reaction catalyzed by the ribosome for two alanine residues in the peptidyl transfer center as a function of the direction of the force applied to the P-site residue. In a current discussion [53] vinculin is a load-bearing linker protein that exhibits directional catch bonding due to interactions between the tail domain and the filamentous F-actin, see also refs. [54,55]. There is a large amount of reports to catch bonds, see for example [2,3,56,57,58,59,60,61,62,63,64,65,66].
A) Molecular example
First we report a current example of a catch bond behavior in leucocyte selectin (L-selectin), see Figure 2. For the chemical details see ref. [3,5,67,68], as well as for the representation of the molecule. The formula of the 2D model PES is given in the appendix by Eq. (7). There are used two length coordinates, in nm to describe the movement of a ligand. L is the protein extension, but d is the distance to the ligand. Forces are given in pN.
On the L-axis we have two minima and one TS. This axis is also an NT to direction (-1, 0) drawn in red. It is a slip direction. The right minimum, R at (5.58, 0), is the global minimum but the left one at (4.48, 0) is a flat intermediate. Along increasing d on the line with we have a dissociation channel of the ligand. Thin lines of the figure are level lines with steps of 5.2 pN. The green lines are the lines of the PES.
Of interest also is the gray-black NT to direction (-1,1) from R over through to dissociation. It should be the usual direction of the process of interest: globally, L decreases, but d increases along (-1,1), if the ligand moves away. It has slip bond character because along this NT, under increasing force, F, the barrier decreases. Along the NT, under force, the minimum, R, and the TS move towards each other, and this causes a decrease of the barrier. If one exites the system up to pN then minimum R and TS coalesce at a barrier breking point (BBP), see Figure 3. It is the crossing of the NT and the green line in Figure 2.
On the PES of Figure 2, through a VRI point at (4.65, 0.17) is calculated a singular NT which is drawn in blue. The VRI point marks the border between the two (orthogonal) valleys to R, or to the dissociation TS, and the singular NT separates the two thickly dashed branches of the NT of special interest here. It goes to an orthogonal direction, (1, 1), a pulling of the molecule along both coordinates. The NT to this direction is shown by black dashes. The pulling along L seems to be counterproductive for the process. Seen from R, the pulling points into a dead valley at the right hand side of the figure. The right closed branch of the dashed NT connects only R and the . Its upper arc is disrupted from the left branch through by the blue, the singular NT. This NT acts as a separatrix [5].
It is a central condition of the catch bond behavior: The main exit to the dissociation, and the NT of interest through the minimum, R, are divided by a singular NT.
If one excites the molecule along direction (1, 1) then one moves the stationary points R and along the upper arc of the dashed NT. Here we find catch bond behavior, see Table 1 in the appendix. Why? The minimum bowl is deep, thus has strong curvatures. Its eigenvalues in L- and d-directions are but the eigenvalues at the are . Thus any movement along the given excitation for F up to pN will move more the TS than the minimum. That is why the second part of Eq. (2) does play here the main part. The change of is only 1/5 of the change of the barrier. For higher F values, however, the arc over and R closes, and we go back to slip behavior, to a decreasing height of the barrier. And at the end, if F is so large that the BBP on the green line is reached from both sides then the molecule finally slides to dissociation, compare Figure 3. We guess that the 2D example of Figure 2 will be a main pattern for catch bonds. It is already anticipated by a schematic picture by Figure 2 B in ref. [3].
Of course, by drawing a comparison of the catch bond NT, the thickly dashed upper arc to direction (1, 1), its slip bond counter part below to direction (-1, -1), and another usual slip bond NT to orthogonal direction (-1, 1), the gray-black one, this shows that one has an ’asymmetry’ for the catch bond [69]. This needs no further reasoning. One cannot expect that the catch bond property holds for any direction of the external force. Thus, it does not exist ’the catch bond’, but a bond can have ’catch bond character’.
In the following we discuss further different scenarios for the force-induced change of the TS of simple two-dimensional (2D) PES, especially for an inversion of the relations between the curvatures in minimum and TS, in comparison to the former example. This approach was proposed by Suzuki and Dudko [4].
B) Linear reaction valley
A very simple abstract model PES with one minimum and one TS on a linear reaction channel is obtained by Eq.(8) given in the appendix, see Figure 4. On the right hand side we have a dissociation exit. We have in Figure 4 the level lines (thin black), and some NTs. The red one is a typical case of a slip bond depicted by an NT to x-direction. The application of a tensile mechanical force, , in the direction of the red NT to direction decreases the height of the barrier if F increases from zero to some value implying an increase of the dissociation rate. At the same time it also decreases the coordinate x of the TS. As a result, the life time of the slip bond decreases when it is stressed by a tensile force [47,48].
If one uses an excitation in pure y-direction, (0, 1), then one obtains two branches of the bold dashed NT. Some values for the force F in this direction are given in Table 2. A typical increase of the barrier with force takes place at the left hand panel of Figure 5.
A second condition for an increase of the barrier is here that the curvature at the TS across the reaction channel is larger than the curvature in the reactant into the same direction. The eigenvalue in y-direction in the minimum, R, is 2 but in the TS it is 10.
Again the first condition is that the NT is indeed more or less orthogonal to the reaction valley, to go outside the blue separatrix. It is secured here because additionally the dashed NT is ruptured into two branches; one goes through the minimum but the other one goes through the TS. The border cases are the singular NTs (blue curves) through the VRI points. They depict excitation directions (±1.315, 1), and they form the separatrix. There are two such NTs in our example. Inside the region of these singular NTs between the VRIs are only directions for excitations with slip bond character, like the trivial red NT. The situation changes for the other side of the singular NTs, for the dashed NTs. They are disrupted by the VRI points.
However, if the excitation direction of an NT is too near to the valley direction, though the NT is above the VRI points, then also a slip behavior can be observed; at least for low F values, see Figure 5 at the right hand side. The used thinly dashed NT depicts an excitation direction (0.75, 0.64). Additionally here acts the shortening of x for the thin dashed NT, and the extension of x for the thick dashed NT, if we leave the TS. This is again the action of the right part of Eq. (2).
One important observation, however, concerns both dashed NTs: they are divided into two branches and go uphill to infinity on the abstract PES. Therefore the moving minimum and the moving TS can never coalesce under the excitation force. It means that they can never end in the usual finale of a slip bond that the barrier disappears. Belyaev and Fedotova [3] name this an ideal catch bond, in contrast to the realistic catch-slip bond of real molecules.
We have to notice that though the dashed NTs show (from the beginning, or later) an increase in barrier height, they do not show the true character of the realistic catch-slip bond. The possible increase of the barrier in a one-valley model was already reported by Suzuki and Dudko in 2010 [4]. (We did not understand this in our 2016 paper [6] where we treated only a slip NT.) However that the possible catch bond NTs in this one-valley model will not come back to a final decrease of the barrier, this means a disturbing insight. It later leads us to the next Section 3, the two-valley model.
C) Curvilinear reaction valley
This example, Figure 6, is quite similar to the linear case above. We treat a nonlinear case of the dissociation valley, with a PES model proposed by Suzuki and Dudko [4], see Eq. (9) in the Appendix. Coordinates are . (We have adapted some parameters.) The reactant R is separated from the unbound state by an SP1, an SP of index one, located on top of the PES barrier depicted by TS. The long flat minimum valley ends at both sides by dead valleys, but the dissociation exit comes over a side valley, see Figure 6. The situation is similar to the global minimum of the Müller-Brown surface [70,71].
Shown in Figure 6 are also two (blue) singular NTs which cross two VRI points. They are again the border lines for NTs with slip bond character. All the directions between the two singular NTs are allowed for slip bonds, where the more central NTs, which are like a steepest descent from TS, are of course the better ones. Such `good’ slip NTs do not have a turning point (TP) on their energy profile [7,14], however, a TP does not disturb the slip character in the region between the VRI points, see an extreme case in ref. [6]. This remark contradicts the treatment [14] where the border for slip bonds is the NT with the first TP.
In Figure 6 a candidate for a catch bond NT is shown by the black, dashed NT. Its direction is f=. It is divided by the singular NTs into two branches. One branch leads from R along the minimum valley in the upper parts of the Figure, but the other part crosses the TS and connects the right ridge with the exit valley to the lower right corner. These branches of this NT describe the movement of the two stationary points, minimum and TS, on the corresponding effective PES if the external force F f is applied. One branch describes the movement of the minimum, but the other branch describes the movement of the TS. The external force now increases the difference of the energy between minimum and SP1. The reaction rate will decrease. In this example the effect is dramatic, see Figure 7.
Although we have a dramatic increase of the barrier height of the example of Figure 6 and Figure 7 we cannot say that it shows true realistic catch bond character, because it does not turn back after a certain amount of force, F. The two branches of the dashed NT never cross. They cannot allow the minimum and the TS to coalesce. It seems that the character of a one-valley minimum with one exit to dissociate, is too little to allow a true catch bond behavior. Different cases of the effective PES are shown in Figure 8.
D) Curvilinear reaction valley with an emerging shoulder
We use a PES, Figure 9, along Eq.(10). Now we find a reactant, R, an SP, and a product minimum, P. The key for our treatment is again the narrowness of the col. The red curve is again an NT leading from the reactant, R, over the SP to the product, P. Its direction is . The blue NT is a singular NT through the VRI point, with the direction , and the black dashed NT is a putative catch bond NT. The force for this NT is assumed in x-direction. The green curve is the line of points with condition for the Hessian matrix. It crosses the reaction valley from the minimum to the TS three times. This property will lead to an interesting behavior of the PES under external force in x-direction: in the long, gently rising valley of the reactant, R, emerges under units of force a further minimum. It replaces the former shoulder, before the TS. So to say, a population of states of the former global minimum splits into a bimodal population for some time, as it is reported in ref. [72].
At the beginning of such a force we get a slip bond behavior between the reactant and the TS. But at F=12 units the new minimum becomes the global one, and its relation to the TS now turns to catch bond behavior. The corresponding stationary points of the effective surfaces are given in Table 4.
In Figure 10 we report the barrier height between the two minima and the TS under different forces, F. The dark yellow line concerns the original minimum, but the blue curve of points shows the difference to the new one.
In Figure 11 we report the two effective PES under different forces, F. The emergence of the new minimum is to detect.
A condition for the catch bond character was that the corresponding curvatures in NT direction are both positive, but the one at the TS should be larger than that one of the minimum. Here we have the eigenvalues of the Hessian in the minimum by (80, 402) and at the TS by (307, -157). In a contrary case the difference of both energies will decrease and the catch bond character does not appear.
In all three cases B) to D) of different mathematical test PES we obtain a desirable increase of the barrier under a corresponding external force. However, it happens along disrupted NTs (the dashed ones) which go up to infinity on the simple PES, so that a final decrease of the barrier can never take place. These NTs cannot be correct models for the observed behavior in Mechano-Bio-Chemistry namely the final catch-to-slip behavior of the reported experiments [73].
E) Platelet selectin
The proposed 2D surface [5] for platelet selectin (P-selectin) [46,68,74,75] has in the F=0-case already a flat shoulder, see Figure 12. It is the former Int-minimum of the L-selectin case of Figure 2. However, there is now no additional minimum to R, and there is only one main valley from R to dissociation, like in the case of E-selectin in Fugure 1. The situation is characterized by a disappearance of the VRI points on the PES. The (blue) quasi-singular NT to direction (0, 1) does not cross the axis at the shoulder. The dashed NT leads from R to the TS of the dissociation, and it depicts like in the E-selectin case a pure slip bond. Because from the beginning for any small F-value, the shoulder disappears. This PES model cannot represent catch bond behavior.
Summary of subsection 2.2
In this subsection we studied different models:
The case A) of L-selectin, Figure 2 and Figure 3, allows a true catch bond property. The next cases B) to D) show the catch bond behavior, however, they do not come back finally to the chemical slip behavior. So they can be seen for abstract models where for real molecules the border properties have still to be changed. The case E) reports a putative catch bond from the literature which is, however, only a slip bond.
2.3. A pure one-dimensional path model
There is another one-dimensional path model to explain catch bonds [76]. However, we assume an inappropriate use of a rate formula. One uses a Kramers’ rate. This approach does not apply to a disappearing barrier [77]. The error also concerns the rate formula Eq.(41) of [78]. The inadequacy of the formula used was already reported in 2006 [79], but it is currently in use again [80,81].
From the beginning of the treatment of the catch bond problem a 2-pathway model was proposed for it [57,69,82,83,84,85,86,87,88,89]. We propose to accept such an explanation. The catch bonding appears to be an important phenomenon which can occur when multiple valleys are present. Slip bonds then work together collectively [65,90], see below the situation in the tug-of-war mechanism where we use the case of two reaction valleys.
3. Tug-of-war mechanism with a catch bond
The jump from one given reaction valley to another one is a central task for the application of external forces. There is a long list of experimental results concerning this tug-of-war mechanism [50,72,91,92,93,94] to name a few. It also concerns the stereo selectivity of reactions [73,95]. Further examples for the tug-of-war mechanism are unifying mechanosensing and affinity discrimination. T cells employ multiple modes of mechanical proofreading to stabilize receptor binding and achieve a specificity of discriminations. These include catch-bond behavior during activation [96] and negative selection [97], or conformation changes of adhesion molecules [98]. In contrast, B cells apply forces which exhibit a slip-bond character [45]. Catch bonds drive stator mechanosensitivity in the bacterial flagellar motor [99]. For another molecular motor model a ‘tug-of-war’ solution was proposed in ref. [100]. Molecular motor proteins use the energy released from ATP hydrolysis to generate force and transport cargoes along cytoskeletal filaments. This suggests that dynein’s interaction with micro tubules behaves like a catch bond [50]. We note that the expression ‘tug-of-war’ may be coming from the molecular motor problem for dyneins.
If there are two competing TSs for two possible reactions from one reactant, then a valley-ridge inflection point (VRI) [6,7,16,19,22,101,102,103,104,105] is always in between, compare deeper Figure 2 to 9 of ref. [7]. The VRI point divides the two valleys of the PES [106,107,108,109,110]. It is characterized by a special kind of an NT, the so-called singular NT which bifurcates at the VRI point. The bifurcation then has four branches. From minimum one has a branch to the VRI point, from there two branches to the two next , and one branch usually goes further uphill to an , an SP of index two. For the 2D toy surface it is usually a maximum. Again families of regular NTs connect an with an , stationary points with an index difference of one. Seen from the minimum, a slip direction for one of the both TSs of index one on the PES cannot be the slip direction for the other one, because no two NTs of the two families can start from the minimum with a same direction. To every family belongs a separate region of directions. In a minimum of a 2D surface, all ’360o-directions’ are possible, however, the full range is divided by special singular NTs through the corresponding VRI points.
F) A simple example
Figure 13 demonstrates the tug-of-war mechanism. The PES is described by Eq. (11) in the appendix. It is similar to Figure 4 but here the y direction is replaced by a Morse potential. The PES is a simple model because the directions to different SPs are orthogonal from the beginning, like in ref. [94]. Left below may be the reactant structure, R. The second dissociation channel goes along the y axis. On the right hand side emerges a ridge. The curvatures at the minimum, R, are represented by the eigenvalues (6, 20) but they are (-6, 27) at the TS, thus they are again different, and across the TS the curvature is larger than across the minimum.
If one selects the direction (-0.24, 0.97) for an excitation, and one goes uphill from , then the bold dashed NT again describes the pathway of the moving stationary points, R, TS1, and new TS2, the Morse finale level at (0, ∞). Coordinates, energies, and barriers for different forces, F, are given in Table 5. This direction still will be the catch direction for the former SP at (2, 0), however, it will be a slip direction for the dissociation for the Morse direction along the y axis. Quickly, near force F=2, the former Morse exit level becomes lower than the former TS on the x axis, thus the y-dissociation becomes the reaction coordinate.
The red NT in Figure 13 along the x-axis describes the typical slip bond direction, however, also the inverse direction of the bold dashed NT becomes a slip direction.
G) PES with 4 minima: Slip-Catch-Slip case
In early papers to selectin catch-slip kinetics [111,112] a slip-catch-slip behavior has been reported. It concerns the protein E-selectin. However, the corresponding proposed PES of ref. [5] shows only one valley from bound state to dissociation, as in the example of Figure 1. The behavior is slip, and we did not find any kind of slip-catch-slip on this PES.
We propose an abstract 2D model PES to enforce slip-catch-slip behavior. For a better understanding, we have first to notice that the condition of a strong curvature difference between reactant and catch bond TS is not sufficient. To demonstrate this we have chosen a modified Wolfe-Quapp surface, see Figure 14. The formula Eq. (12) is given in the appendix. Between the former maximum, M2, of the Wolfe-Quapp PES, and the TS1 an additional strong hill M1 is included. A further TS5 emerges between the hills. There are shown three NTs in Figure 14. The dashed one points in y-direction, (0.075, 0.997), the black one in x-direction (1, 0), but the red NT betwixt and between, in direction (0.74, 0.67). The red NT is used for comparison for certain skew NT directions. It could provide a slip direction for both reaction paths starting in R. As above, the green lines are the curves of BBPs. The solid black NT would depict an excitation into -x-direction, where this actually the usual reaction valley is from the reactant minimum, R over TS1 to P1. However, we will excite the system into y-direction and thereby force the reaction via TS2.
The eigenvalues of the Hessian at stationary points of interest point along the axes and they are at the reactant minimum, R, (12.99, 21.71) and at the TS1 they are . So in the y-direction they are quite different, and the one at the TS is much larger. The curvature is chosen larger by a factor of . Nevertheless, at the beginning the excitation to the dashed direction works at the TS1 like a slip bond. The barrier between R and TS1 decreases up to a force of , see Table 6 and the left panel of Figure 15. The reason is the action of the second part of Eq.(2). However, the strong hill of the maximum, M1, enforces at least a catch bond character for the barrier of TS1, for further growing F, see Table 6. Because with increasing F beginning from the barrier increases, compare Figure 15.
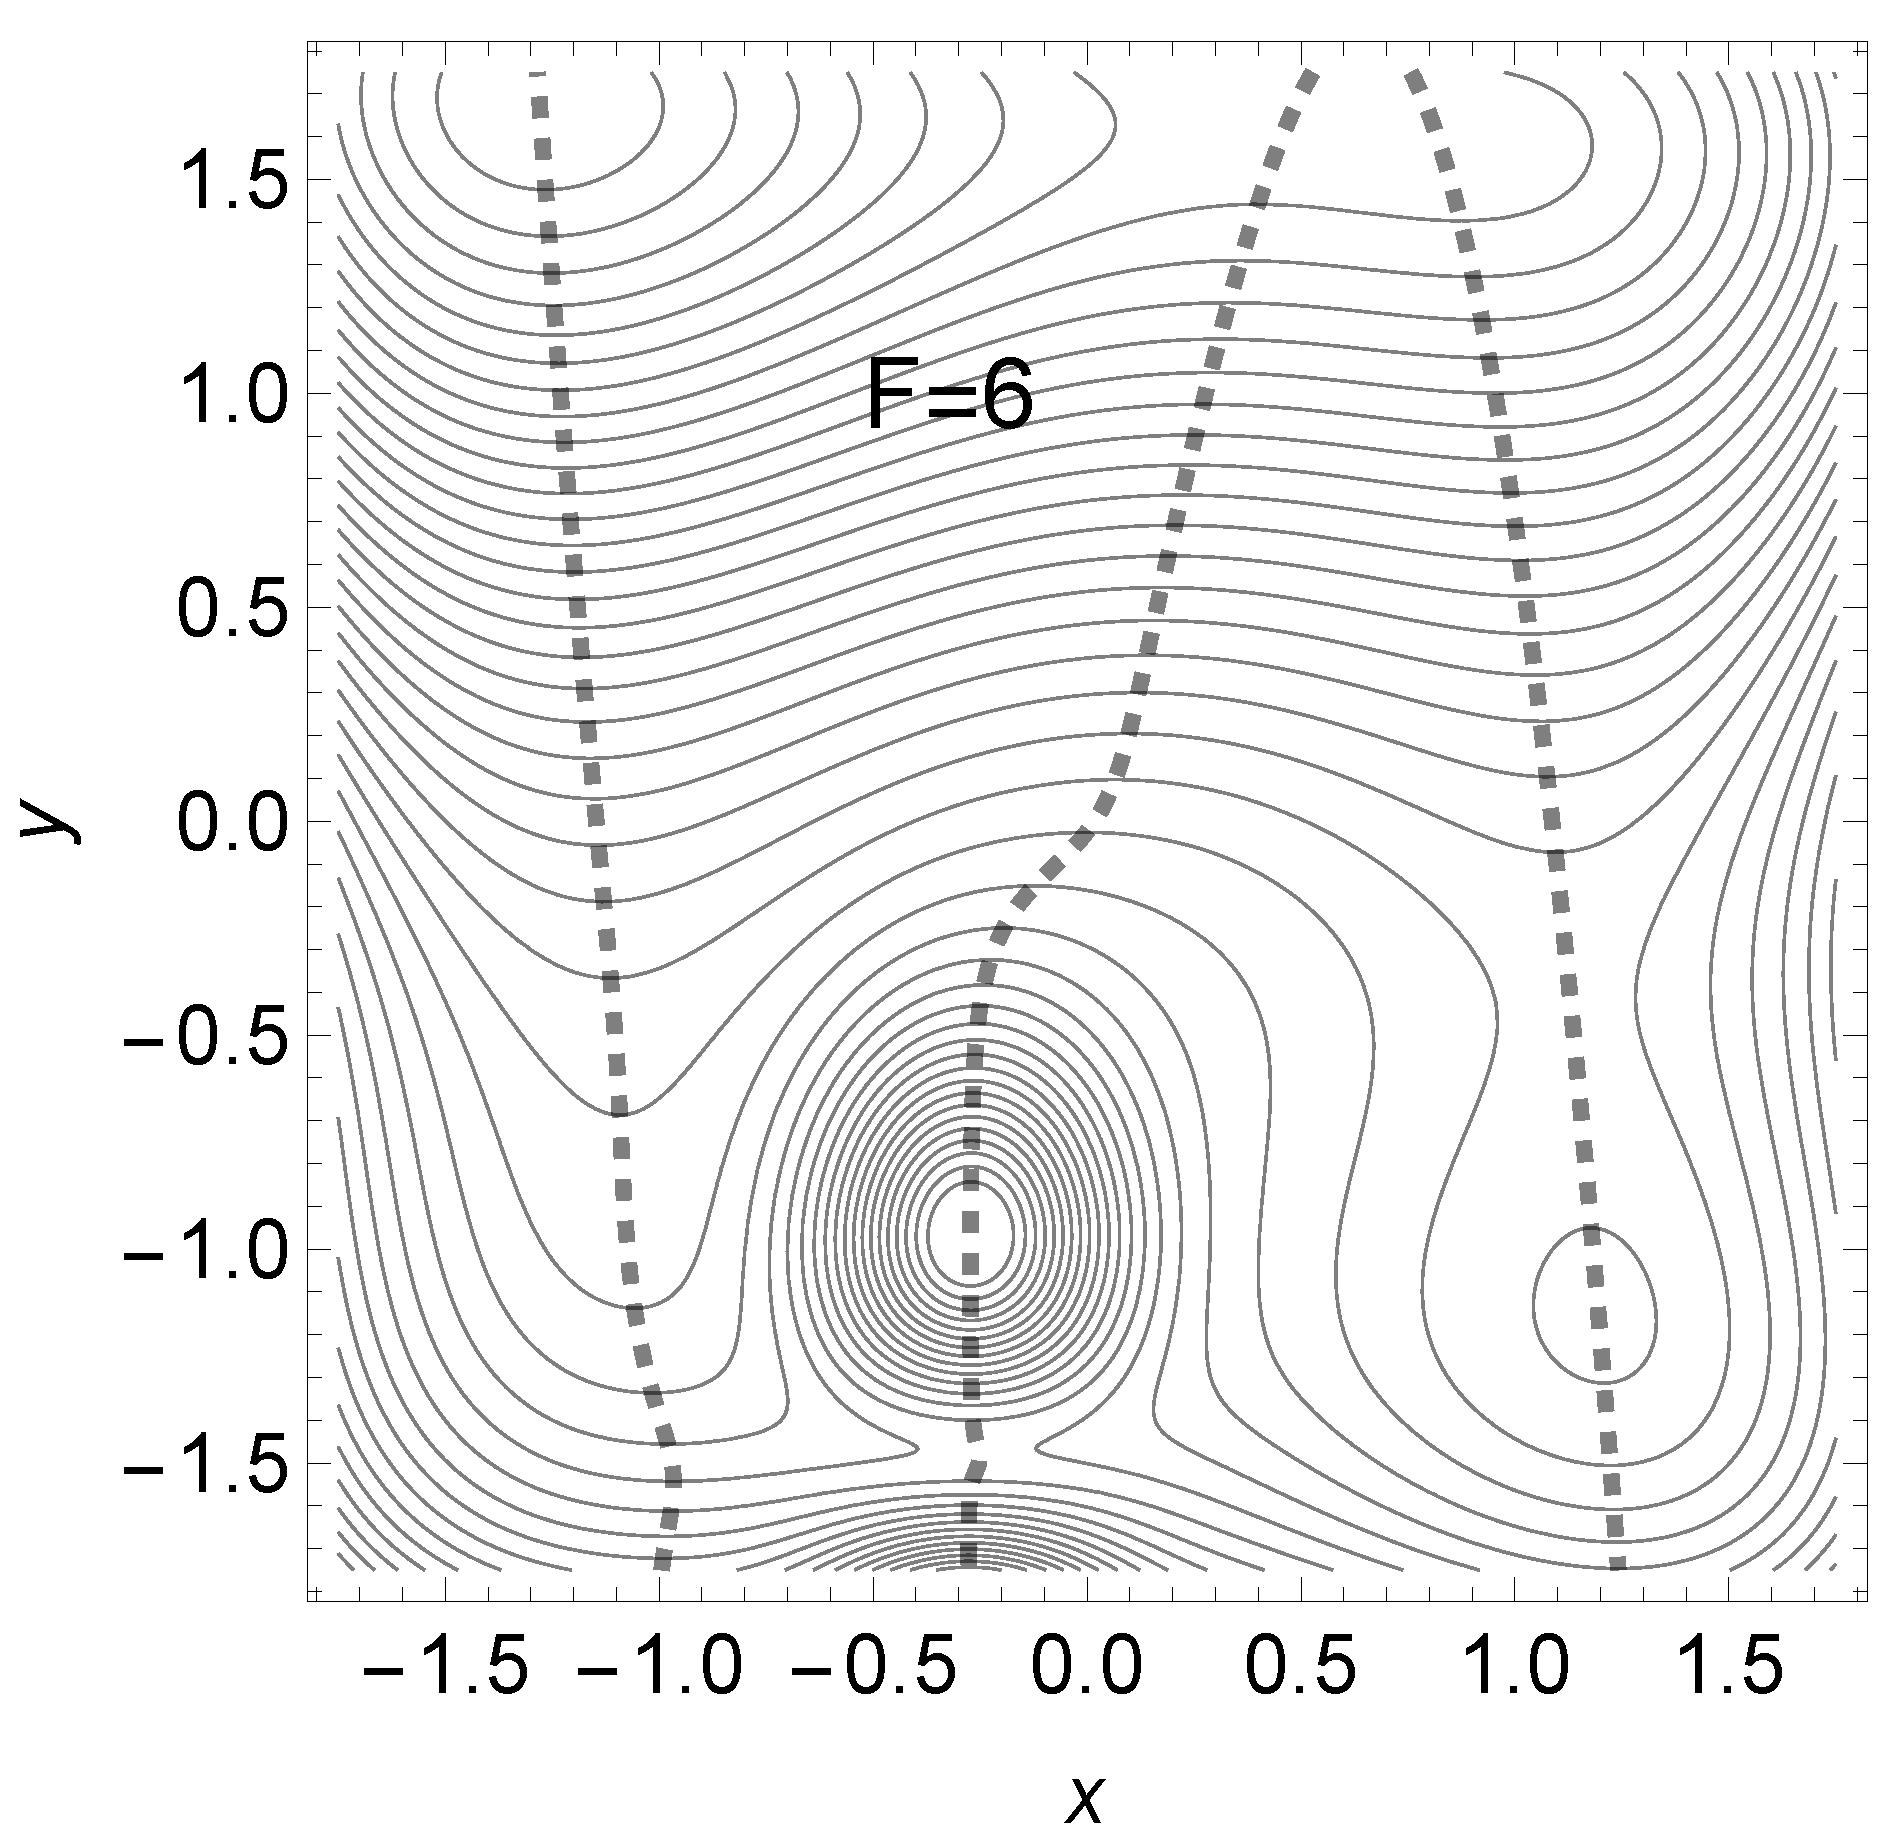
Later, for the direction to TS2 opens for a main reaction, and the barrier TS2 disappears. We still give the effective PES in the case in Figure 16.
4. Discussion
There are some interesting conceptual models for catch bonds in Figure 2 of [2], see also Figure 7 of [113] and Figure 1 of ref. [9]. We should note that the connection to our abstract mathematical models of PESs is still open, in the general case. A next treatment should try to find appropriate coordinates for the conceptual models of ref. [2], as it is done in a recent preprint [5] to L-selectin. However, as far as other selectins are concernd, this last work has errors in its execution.
Another problem remains open, viz how our theoretical findings could be translated into the practical mechanochemical process, for example by hydrodynamic forces [114], or in a ball mill [115,116]? In which direction does a ball mill, or a grinding work? They are an intrinsically isotropic technique.
The addition of further outer excitations becomes even more complicated: thermo-mechanochemistry, sono-mechanochemistry, electro-mechanochemistry and photo-mechanochemistry [117]. A possible clue could be the principle of Le Chatelier: Any vibrational excitation of the molecule by a random external force, like ball milling, may probably excite the energetically lowest normal modes first [118]. One could therefore tend to the result of ref. [119] that the reaction mechanism for the process under ball milling conditions is the same as in solution.
5. Glossar: Mechano-Bio-Chem to NT theory
- -
-
“Slip bond” is a bond that shortens its lifetime in response to tensile force [113]
- –
- It is represented by a direct NT from the minimum to SP1 (without or with a TP).
- -
-
“Catch bond” is a bond that prolongs its lifetime in response to tensile force [113]
- –
- It is represented by a divided NT, whose division is conveyed by a VRI point between the minimum well and the dissociation channel, for example. The corresponding separatrix is a singular NT. The direction of the external force does not point along the TS valley. The curvature at SP1 across the col direction is often larger than the curvature at the minimum well in the same direction.
- -
-
“-switch point” [14]
- –
- marks the special NT at the border where the lowest TP occurs first. It is very often a slip direction as well as NTs with a TP but below the separatrix.
- -
- “Ideal bond” [42] should depict the step from slip to catch direction. We question its possibility – or at least its probability.
- -
-
“ -switch point” [14]
- -
-
“Crossing of an NT with ”
- -
-
“Tug-of-war problem”
- –
- two competing TSs with a VRI point in between. An external force can select one reaction direction. Of course, a slip can occur in both reaction valleys, as well as catch directions for an excitation with their corresponding NTs.
6. Conclusion
Applying the NT theory would make probably easier to understand the tug-of-war problem. By jumping back and forth between slip and catch bond directions one could change the corresponding reaction direction, especially when one works with a directed force [92].
We observe in this paper direct or delayed catch bond behavior where we only count for the barrier height of the effective PES after an external excitation. In our opinion, this indicator is the most important of the catch bond behavior. Note that we use for the models simple 2-dimensional toy surfaces. They are good enough to represent some interesting observations to catch bonds in the experiments of the last 35 years.
However, one should note that the model of Eq. (1) is only a linear approach for the force, so it is the simplest possible model. In refs. [24,25] we start to treat a nonlinear approach to an external force.
Of course, the definition of the difference is very important between slip and catch regions for the influence of an external force. However, note that another central intention for the slip-force is to find an optimal direction, to achieve a BBP with a least amount of force. This is discussed in the articles [25,120,121].
7. Appendix: PES formulas and tables
7.1. PES of a slip bond in Sect.2
We treat the PES of E-selectin [5]. We use the constants , , use an angle and set
with
and build the PES
The last summand means force direction f=(1, 1) for the dashed NT. This is changed for other NTs.
7.2. PES for catch bond candidates in Section 3
A) PES of L-selectin [5]. We use the constants , and use the same formula like above for E-selectin
Stationary points on the surface under external excitation in direction (1, 1) are given in Table 1, together with the corresponding energies. (Compare Figure 2A of [5] which we can confirm.)

Table 1.
Stationary points to PES of V by Eq. (7).
Table 1.
Stationary points to PES of V by Eq. (7).
| F | Min (L,d) | SP (L,d) | Barrier | ||
|---|---|---|---|---|---|
| 0 | (5.570, 0.0) | -39.24 | (5.151, 0.0) | 10.96 | 50.194 |
| 10 | (5.571, 0.002) | -94.95 | (5.113, 0.024) | -40.47 | 54.480 |
| 20 | (5.571, 0.004) | -150.69 | (5.078, 0.075) | -91.87 | 58.823 |
| 30 | (5.572, 0.006) | -206.47 | (5.093, 0.161) | -143.84 | 62.629 |
| 40 | (5.573, 0.009) | -262.26 | (5.147, 0.242) | -197.06 | 65.207 |
| 50 | (5.573, 0.011) | -318.09 | (5.205, 0.302) | -251.55 | 66.535 |
| 60 | (5.574, 0.013) | -373.94 | (5.225, 0.345) | -307.11 | 66.836 |
| 70 | (5.574, 0.015) | -429.82 | (5.298, 0.377) | -363.50 | 66.324 |
| 80 | (5.575, 0.018) | -485.73 | (5.334, 0.400) | -420.55 | 65.178 |
| 90 | (5.575, 0.020) | -541.67 | (5.364, 0.416) | -478.13 | 63.537 |
| 100 | (5.575, 0.023) | -597.63 | (5.390, 0.426) | -536.12 | 61.513 |
B) The PES for the linear one-channel approach for a catch bond is
Its minimum is at (0,0) and its SP at (2,0). The eigenvalues there are (6,2) and (-6,10) thus the curvature across the reaction valley is stronger at the TS than at the reactant. The stationary points on the surface under external excitation in y direction are given in Table 2, together with the corresponding energies.
Table 2.
Stationary points to PES of V by Eq. (8).
Table 2.
Stationary points to PES of V by Eq. (8).
| F | Min (x,y) | SP (x,y) | Barrier | ||
|---|---|---|---|---|---|
| 0 | (0, 0) | 0.0 | (2, 0) | 4.0 | 4.0 |
| 1 | (0, 0.5) | -0.25 | (2.01, 0.1 ) | 3.83 | 4.08 |
| 2 | (0, 1.0) | -1.0 | (2.03, 0.2 ) | 3.8 | 4.8 |
| 3 | (0, 1.5) | -2.25 | (2.05, 0.29) | 3.56 | 5.81 |
| 4 | (0, 2.0) | -4.0 | (2.09, 0.37) | 3.23 | 7.23 |
C) The PES for a curvilinear one-channel approach for a catch bond is
It is used along a proposal of ref.[4]. The stationary points on this surface are given in Table 3, together with the corresponding energies.
Table 3.
Stationary points to PES of V by Eq. (9).
Table 3.
Stationary points to PES of V by Eq. (9).
| F | Min (x,Q) | SP (x,Q) | Barrier | ||
|---|---|---|---|---|---|
| 0 | ( 2.01, 2.25) | -60.0 | (2.81, -1.75) | 60.0 | 120.0 |
| 10 | ( 4.76, 311) | -133.2 | (3.15, -1.54) | 54.91 | 188.1 |
| 20 | ( 8.43, 4.02) | -251.7 | (3.63, -1.38) | 42.94 | 294.6 |
| 30 | (13.08, 4.96) | -425.6 | (4.18, -1.26) | 23.72 | 449.4 |
| 40 | (18.76, 5.92) | -665.5 | (4.77, -1.15) | -2.93 | 662.6 |
| 50 | (25.47, 6.90) | -981.9 | (5.39, -1.06) | -37.09 | 944.8 |
D) Case of an emerging new minimum for the PES of Figure 13 under force. For the quite skew 2D PES with we use a product of two quadratic forms similar to refs. [6,23].
The last expression in the definition is used to tighten the col through the TS, because we need it for a putative catch bond. Table 4 reports the stationary points of this toy PES.
Table 4.
Stationary points to PES of V by Eq.(10).
Table 4.
Stationary points to PES of V by Eq.(10).
| F | Min (x,y) | Min2 (x,y) | SP (x,y) | Barrier |
|---|---|---|---|---|
| 0 | (-1.00,-1) | – | (0.59, 0.04) | 27.92 |
| 1 | (-0.99,-1) | – | (0.59, 0.04) | 26.34 |
| 2 | (-0.97,-1) | – | (0.59, 0.04) | 24.77 |
| 3 | (-0.96,-1) | – | (0.59, 0.03) | 23.21 |
| 4 | (-0.95,-1) | – | (0.59, 0.03) | 21.66 |
| 5 | (-0.93,-1) | (0.49,-0.81) | (0.60, 0.03) | 20.13 |
| 6 | (-0.92,-1) | (0.58,-0.73) | (0.60, 0.03) | 18.61 |
| 7 | (-0.90,-1) | (0.63,-0.69) | (0.60, 0.03) | 17.10 |
| 8 | (-0.88,-1) | (0.66,-0.69) | (0.61, 0.02) | 15.60 |
| 9 | (-0.86,-1) | (0.69,-0.66) | (0.61, 0.02) | 14.12 |
| 10 | (-0.84,-1) | (0.71,-0.64) | (0.61, 0.02) | 12.66 |
| 11 | (-0.82,-1) | (0.72,-0.64) | (0.61, 0.02) | 11.21 |
| 12 | (-0.80,-1) | (0.74,-0.63) | (0.62, 0.02) | 9.89 |
| 13 | (-0.77,-1) | (0.76,-0.63) | (0.62, 0.01) | 9.81 |
| 14 | (-0.75,-1) | (0.77,-0.63) | (0.62, 0.01) | 9.81 |
| 15 | (-0.71,-1) | (0.78,-0.62) | (0.63, 0.01) | 9.86 |
| 16 | (-0.67,-1) | (0.79,-0.62) | (0.63, 0.01) | 9.93 |
| 17 | (-0.62,-1) | (0.80,-0.62) | (0.63, 0.01) | 10.02 |
| 18 | – | (0.82,-0.62) | (0.64, 0.01) | 10.12 |
| 19 | – | (0.83,-0.61) | (0.64, 0.0) | 10.23 |
| 20 | – | (0.84,-0.61) | (0.64, 0.0) | 10.36 |
| 30 | – | (0.93,-0.61) | (0.68,-0.01) | 13.81 |
| 50 | – | (1.08,-0.62) | (0.74,-0.02) | 19.79 |
E) P-selectin. The putative PES of the P-selectin with ligand PSGL1 [5] goes also with Eq. (6) with the values: , and .
F) The example for a Tug-of-War mechanism
The formula of the PES of the example B) is changed by a Morse ascent to positive y-direction. Thus the one-channel approach is turned into a two-channel one because now at (0,∞) emerges a second TS.
The former minimum is again at (0,0) and its SP at (2,0). The eigenvalues are (6,20) and (-6,27) thus the curvature across the reaction valley is still stronger at the TS than at the reactant. The stationary points on the surface under external excitation in direction (0.24, 0.97) along the fat dashed NT are given in Table 5, together with the corresponding energies. Note that the left upper part of the table is similar to Table 2.
Table 5.
Stationary points to PES of V by Eq. (11).
Table 5.
Stationary points to PES of V by Eq. (11).
| F | Min (x,y) | SP (x,y) | Barr | P2 (x,y) | Barr2 |
|---|---|---|---|---|---|
| 0 | (0, 0) | (2.0, 0) | 4.0 | (0, ∞) | 10.0 |
| 1 | (0, 0.05) | (2.0, 0.038 ) | 4.001 | (0, 2.94) | 6.03 |
| 2 | (0, 0.11) | (2.01, 0.082 ) | 4.033 | (0, 2.18) | 3.62 |
| 3 | (0, 0.20) | (2.02, 0.132) | 4.086 | (0, 1.69) | 1.85 |
| 4 | (0, 0.32) | (2.04, 0.190) | 4.184 | (0, 1.29) | 0.62 |
G) The PES with four minima for a Tug-of-War mechanism
We use a modified Wolfe-Quapp surface [122].
Table 6.
Stationary points to PES of Eq. (12). With the barrier increases.
Table 6.
Stationary points to PES of Eq. (12). With the barrier increases.
| F | Min (x,y) | SP1 (x,y) | Barrier |
|---|---|---|---|
| 0 | (1.23, -1.57) | (-0.25, -1.50) | 3.169 |
| 1 | (1.22, -1.52) | (-0.25, -1.49) | 3.120 |
| 2 | (1.22, -1.47) | (-0.25, -1.49) | 3.117 |
| 3 | (1.22, -1.41) | (-0.25, -1.48) | 3.166 |
| 4 | (1.21, -1.34) | (-0.25, -1.48) | 3.274 |
| 5 | (1.20, -1.26) | (-0.25, -1.47) | 3.452 |
| 6 | (1.19, -1.15) | (-0.25, -1.47) | 3.718 |
Author Contributions
Conceptualization, W.Q. and J.M.B; software, W.Q.; validation, J.M.B; writing original draft preparation, W.Q.; writing review and editing, J.M.B; funding acquisition, J.M.B. All authors have read and agreed to the published version of the manuscript.
Funding
The authors thank for the financial support from the Spanish Structures of Excellence María de Maeztu program, through Grant No. CEX2021-001202-M. Agència de Gestió d’Ajuts Univeristaris i de Recerca of Generalitat de Catalunya, Project No. Projecte 2021 SGR 00354.
Data Availability Statement
All data and Mathematica files are available by e-mail from WQ.
Conflicts of Interest
The authors declare no conflicts of interest. We did not use AI tools to analyse and draw insights.
Abbreviations
| MDPI | Multidisciplinary Digital Publishing Institute |
| NT | Newton trajectory |
| PES | Potential energy surface |
| SP,TS | Saddle point, transition state |
| TP | Turning point |
| VRI | Valley ridge inflection point |
References
- Dembo, M.; Torney, D.C.; Hammer, D. The reaction-limited kinetics of membrane-to-surface adhesion and detachment. Proc. R. Soc. Lond. B Biol. Sci. 1988, 234, 55–83. [CrossRef]
- Thomas, W.E.; Vogel, V.; Sokurenko, E. Understanding the Counterintuitive Phenomenon of Catch Bonds. Annu. Rev. Biophys. 2008, 37, 399–416.
- Belyaev, A.V.; Fedotova, I.V. Molecular mechanisms of catch bonds and their implications for platelet hemostasis. Biophys. Rev. 2023. [CrossRef]
- Suzuki, Y.; Dudko, O.K. Single-Molecule Rupture Dynamics on Multidimensional Landscapes. Phys. Rev. Lett. 2010, 104, 048101. [CrossRef]
- Barkan, C.O.; Bruinsma, R.F. Topology of molecular deformations induces triphasic catch bonding in selectin-ligand bonds, 2023, [bioRxiv-2209.08.556954].
- Quapp, W.; Bofill, J.M. Reaction Rates in a Theory of Mechanochemical Pathways. J. Comput. Chem. 2016, 37, 2467–2478. [CrossRef]
- Quapp, W.; Bofill, J.M.; Ribas-Ariño, J. Analysis of the Acting Forces in a Theory of Catalysis and Mechanochemistry. J. Phys. Chem. A 2017, 121, 2820–2838.
- Chakrabarti, S.; Hinczewski, M.; Thirumalai, D. Plasticity of hydrogen bond networks regulates mechanochemistry of cell adhesion complexes. Proc. Natl. Acad. Sci. 2014, 111, 9048–9053.
- Adhikari, S.; Moran, J.; Weddle, C.; Hinczewski, M. Unraveling the mechanism of the cadherin-catenin-actin catch bond. PLoS Computat. Biol. 2018, 14, e1006399.
- Evans, E.; Ritchie, K. Dynamic Strength of Molecular Adhesion Bonds. Biophys. J. 1997, 72, 1541–1555.
- Diener, I.; Schaback, R. An Extended continuous Newton Method. J Optimiz Theory Appl 1990, 67, 57–77.
- Branin, F.H. Widely Convergent Methods for Finding Multiple Solutions of Simultaneous Nonlinear Equations. IBM J. Res. Develop. 1972, 16, 504–522. [CrossRef]
- Jongen, H.; Jonker, P.; Twilt, F. Nonlinear Optimization in Finite Dimensions; Kluwer Academic Publ., Dordrecht Boston London, 2000.
- Barkan, C.O.; Bruinsma, R.F. Geometric Signatures of Switching Behavior in Mechanobiology. Phys. Rev. Res. 2023, 5, 023161.
- Quapp, W.; Hirsch, M.; Imig, O.; Heidrich, D. Searching for Saddle Points of Potential Energy Surfaces by Following a Reduced Gradient. J. Comput. Chem. 1998, 19, 1087–1100.
- Quapp, W.; Hirsch, M.; Heidrich, D. Bifurcation of Reaction Pathways: the Set of Valley Ridge Inflection Points of a Simple Three-dimensional Potential Energy Surface. Theor. Chem. Acc. 1998, 100, 285–299. [CrossRef]
- Hirsch, M.; Quapp, W. The reaction pathway of a Potential Energy surface as curve with induced tangent. Chem. Phys. Lett. 2004, 395, 150–156. [CrossRef]
- Hirsch, M.; Quapp, W.; Heidrich, D. The set of valley-ridge inflection points on the Potential Energy surface of water. Phys. Chem. Chem. Phys. 1999, 1, 5291–5299.
- Quapp, W.; Hirsch, M.; Heidrich, D. An approch to reaction path branching using valley-ridge-inflection points of Potential Energy surfaces. Theor. Chem. Acc. 2004, 112, 40–51.
- Quapp, W. Can We Understand the Branching of Reaction Valleys for more than two Degrees of Freedom? J. Math. Chem. 2015, 54, 137–148.
- García-Garrido, V.J.; Wiggins, S. The dynamical significance of valley-ridge inflection points. Chem. Phys. Lett. 2021, 781, 138970.
- Quapp, W.; Bofill, J.; Aguilar-Mogas, A. Exploration of Cyclopropyl Radical Ring Opening to Allyl Radical by Newton Trajectories: Importance of Valley-ridge Inflection Points to Understand the Topography. Theor. Chem. Acc. 2011, 129, 803–821. [CrossRef]
- Quapp, W.; Bofill, J.M. A contribution to a theory of mechanochemical pathways by means of Newton trajectories. Theoret. Chem. Acc. 2016, 135, 113. [CrossRef]
- Bofill, J.M.; Quapp, W.; Albareda, G.; de P. R. Moreira, I.; Ribas-Ariño, J. A model for an Optimally Oriented External Electric Field to Control the Chemical Reaction Path: A Generalisation of the Newton Trajectory. J. Chem. Theor. Comput. 2022, 18, 935–952.
- Bofill, J.M.; Quapp, W.; Albareda, G.; Moreira, I.d.; Ribas-Ariño, J.; Severi, M. A catastrophe theory-based model for optimal control of chemical reactions by means of oriented electric fields. Theor. Chem. Acc. 2023, 142, 22–35. [CrossRef]
- Fukui, K. A Formulation of the Reaction Coordinate. J. Phys. Chem. 1970, 74, 4161–4163. [CrossRef]
- Tachibana, A.; Fukui, K. Differential geometry of chemically reacting systems. Theor. Chem. Acc. 1978, 49, 321–347.
- Tachibana, A.; Fukui, K. Intrinsic dynamism in chemically reacting systems. Theor. Chem. Acc. 1979, 51, 189–206.
- Quapp, W.; Heidrich, D. Analysis of the Concept of Minimum Energy Path on the Potential Energy Surface of Chemically Reacting Systems. Theor. Chim. Acta 1984, 66, 245–260.
- Pancir, J. Calculation of the least energy path on the energy hypersurface. Collection Czechoslov Chem Commun 1975, 40, 1112–1118.
- Basilevsky, M.V.; Shamov, A.G. The local definition of the optimum ascent path on a multi-dimensional Potential Energy surface and its practical application for the location of saddle points. Chemical Physics 1981, 60, 347–358. [CrossRef]
- Sun, J.Q.; Ruedenberg, K. Gradient Extremals and Steepest Descent Lines on Potential Energy Surfaces. J. Chem. Phys. 1993, 98, 9707–9714. [CrossRef]
- Hoffmann, D.K.; Nord, R.S.; Ruedenberg, K. Gradient Extremals. Theor. Chim. Acta 1986, 69, 265–280.
- Quapp, W. Gradient Extremals and Valley Floor Bifurcation on Potential Energy Surfaces. Theoret. Chim. Acta 1989, 75, 447–460.
- Schlegel, H.B. Following Gradient Extremal Paths. Theor. Chim. Acta 1992, 83, 15–20.
- Bofill, J.M.; Quapp, W.; Caballero, M. The Variational Structure of Gradient Extremals. J. Chem. Theory Comput. 2012, 8, 927–935.
- Georgiou, A.; Vandecasteele, H.; Bello-Rivas, J.M.; Kevrekidis, I. Locating saddle points using gradient extremals on manifolds adaptively revealed as point clouds. Caos 2023, 33, 123108.
- E, W.; Zhou, X. The gentlest ascent dynamics. Nonlinearity 2011, 24, 1831–1842.
- Bofill, J.M.; Quapp, W.; Caballero, M. Locating Transition States on Potential Energy Surfaces by the Gentlest Ascent Dynamics. Chem. Phys. Lett. 2013, 583, 203–208. [CrossRef]
- Dietschreit, J.C.B.; Diestler, D.J.; Gomez-Bombarelli, R. Entropy and Energy Profiles of Chemical Reactions. J. Chem. Theory Comput. 2023, xx, xx. [CrossRef]
- Zhang, Y.; Xu, C.; Lan, Z. Automated Exploration of Reaction Networks and Mechanisms Based on Metadynamics Nanoreactor Simulations. J. Chem. Theory Comput. 2023. [CrossRef]
- Rakshit, S.; Zhang, Y.; Manibog, K.; Shafraz, O.; Sivasankar, S. Ideal, catch, and slip bonds in cadherin adhesion. Proc. Nat. Acad. Sci. 2012, 109, 18815–18820.
- Rakshit, S.; Sivasankar, S. Biomechanics of cell adhesion: how force regulates the lifetime of adhesive bonds at the single molecule level. Phys. Chem. Chem. Phys. 2014, 16, 2211–2223.
- Bell, G.I. Models for the specific adhesion of cells to cells. Science 1978, 200, 618–627.
- Schwesinger, F.; Ros, R.; Strunz, T.; Anselmetti, D.; Guentherodt, H.J.; Honegger, A.; Jermutus, L.; Tiefenauer, L.; Plueckthun, A. Unbinding forces of single antibody-antigen complexes correlate with their thermal dissociation rates. Proc. Natl. Acad. Sci. 2000, 97, 9972–9977.
- Somers, W.S.; Tang, J.; Shaw, G.D.; Camphausen, R.T. Insights into the Molecular Basis of Leukocyte Tethering and Rolling Revealed by Structures of P- and E-Selectin Bound to SLex and PSGL-1. Cell 2000, 103, 467–479.
- Thomas, W.E.; Vogel, V.; Sokurenko, E. Biophysics of Catch Bonds. Annu. Rev. Biophys. 2008, 37, 399–416.
- Helms, G.; Dasanna, A.K.; Schwarz, U.S.; Lanzer, M. Modeling cytoadhesion of Plasmodium falciparum-infected erythrocytes and leukocytes - common principles and distinctive feature. FEBS Lett. 2016, 590, 1955–1971. [CrossRef]
- Thomas, W.E.; Trintchina, E.; Forero, M.; Vogel, V.; Sokurenko, E.V. Bacterial Adhesion to Target Cells Enhanced by Shear Force. Cell 2002, 109, 913–923.
- Leidel, C.; Longoria, R.A.; Gutierrez, F.M.; Shubeita, G.T. Measuring Molecular Motor Forces In Vivo: Implications for Tug-of-War Models of Bidirectional Transport. Biophys. J. 2012, 103, 492–500.
- Yan, J.; Yao, M.; Gould, B.T.G.; Sheetz, M.P. Talin Dependent Mechanosensitivity of Cell Focal Adhesions. Cellular and Molecular Bioengineering 2015, 8, 151–159.
- Jiang, Y.; O’Brien, E.P. Mechanical Forces Have a Range of Effects on the Rate of Ribosome Catalyzed Peptidyl Transfer Depending on Direction. J. Phys. Chem. B 2021, 125, 7128–7136.
- Campbell, S.; Chirasani, V.; Khan, M.; Malavade, J.; Dokholyan, N.; Hoffman, B. Elucidation of the Molecular Basis and Cellular Functions of Vinculin-Actin Directional Catch Bonding, Res. Sq. Jan 12 2023, rs.3.rs-2334490. [CrossRef] [PubMed] [PubMed Central]
- Izard, T.; Vonrhein, C. Structural Basis for Amplifying Vinculin Activation by Talin. J. Bio. Chem. 2004, 279, 27667–27678.
- Kim, L.Y.; Thompson, P.M.; Lee, H.T.; Pershad, M.; Campbell, S.L.; Alushin, G.M. The Structural Basis of Actin Organization by Vinculin and Metavinculin. J. Mol. Bio. 2016, 428, 10–25. [CrossRef]
- Marshall, B.; Long, M.; Piper, J.; Yago, T.; McEver, R.; Zhu, C. Direct observation of catch bonds involving cell-adhesion molecules. Nature (London) 2003, 423, 190–193.
- Barsegov, V.; Thirumalai, D. Dynamics of unbinding of cell adhesion molecules: Transition from catch to slip bonds. Proc. Natl. Acad. Sci. 2005, 102, 1835–1839.
- Prezhod, O.V.; Prezhdo, O.V.; Forero, M.; Sokurenko, E.V.; Thomas, W.E. The Two-Pathway Model for the Catch-Slip Transition in Biological Adhesion. Biophys. J. 2005, 89, 1446–1454.
- Zhu, C.; Lou, J.; McEver, R.P. Catch bonds: Physical models, structural bases, biological function and rheological relevance. Biorheology 2005, 42, 443–462.
- Zhu, C.; McEver, R.P. Catch Bonds: Physical Models and Biological Functions. Molec. Cell. Biomech. 2005, 2, 91–104.
- Thomas, W.E. Understanding the Counterintuitive Phenomenon of Catch Bonds. Curr. Nanosci. 2007, 3, 63–77.
- Konda, S.S.M.; Brantley, J.M.; Varghese, B.T.; Wiggins, K.M.; Bielawski, C.W.; Makarov, D.E. Molecular Catch Bonds and the Anti-Hammond Effect in Polymer Mechanochemistry. J. Am. Chem. Soc. 2013, 135, 12722–12729.
- Kreuzer, S.M.; Moon, T.J.; Elber, R. Catch bond-like kinetics of helix cracking: Network analysis by molecular dynamics and Milestoning. J. Chem. Phys. 2013, 139, 121902. [CrossRef]
- Thomas, W.E.; Carlucci, L.; Yakovenko, O.; Interlandi, G.; Trong, I.L.; Aprikian, P.; Magala, P.; Larson, L.; Sledneva, Y.; Tchesnokova, V.; et al. Recombinant FimH Adhesin Demonstrates How the Allosteric Catch Bond Mechanism Can Support Fast and Strong Bacterial Attachment in the Absence of Shear. J. Molec. Bio. 2022, 434, 167681. [CrossRef]
- Stirnemann, G. Recent Advances and Emerging Challenges in the Molecular Modeling of Mechanobiological Processes. J. Phys. Chem. B 2022, 126, 1365–1374. [CrossRef]
- Du, R.; Li, L.; Ji, J.; Fan, Y. Receptor-Ligand Binding: Effect of Mechanical Factors. Int. J. Mol. Sci. 2023, 24, 9062. [CrossRef]
- Lou, J.; Yago, T.; Klopocki, A.G.; Mehta, P.; Chen, W.; Zarnitsyna, V.I.; Bovin, N.V.; Zhu, C.; McEver, R.P. Flow-enhanced adhesion regulated by a selectin interdomain hinge. J. Cell Biol. 2006, 174, 1107–1117.
- Phan, U.T.; Waldron, T.T.; Springer, T.A. Remodeling of the lectin-EGF-like domain interface in P- and L-selectin increases adhesiveness and shear resistance under hydrodynamic force. Nat. Immunol. 2006, 7, 883–889.
- Huang, D.L.; Bax, N.A.; Buckley, C.D.; Weis, W.I.; Dunn, A.R. Vinculin forms a directionally asymmetric catch bond with F-actin. Science 2017, 357, 703–706.
- Muller, K.; Brown, L.D. Location of Saddle Points and Minimum Energy Paths by a Constrained Simplex Optimisation Procedure. Theor. Chim. Acta 1979, 53, 75–93.
- Quapp, W.; J.M.Bofill. Mechanochemistry on the Müller-Brown Surface by Newton Trajectories. Int. J. Quant. Chem. 2018, 118, e25522. [CrossRef]
- Jiang, H.; Wang, S. Molecular Tug of War Reveals Adaptive Potential of an Immune Cell Repertoire. Phys. Rev. X 2023, 13, 021022. [CrossRef]
- Evans, E.; Leung, A.; Volkmar, H.; Zhu, C. Mechanical Switching and Coupling between two Dissociation Pathways in a P-selectin Adhesion Bond. Proc. Natl. Acad. Sci. 2004, 101, 11281–11286.
- Waldron, T.T.; Springer, T.A. Transmission of allostery through the lectin domain in selectin-mediated cell adhesion. Proc. Natl. Acad. Sci. 2009, 106, 85–90.
- Pereverzev, Y.V.; Prezhdo, O.V.; Sokurenko, E.V. Allosteric role of the large-scale domain opening in biological catch-binding. Phys. Rev. E 2009, 79, 051913.
- Guo, S.; Efremov, A.K.; Yan, J. Understanding the catch-bond kinetics of biomolecules on a one-dimensional energy landscape. Comm. Chem. 2019, 9, 1–8. [CrossRef]
- Kramers, H.A. Brownian motion in a field of force and the diffusion model of chemical reactions. Physica 1940, 7, 284–304. [CrossRef]
- Hyeon, C.; Thirumalai, D. Measuring the energy landscape roughness and the transition state location of biomolecules using single molecule mechanical unfolding experiments. J. Phys.: Condens. Matter 2007, 19, 113101.
- Dudko, O.K.; Hummer, G.; Szabo, A. Intrinsic Rates and Activation Free Energies from Single-molecule Pulling Experiments. Phys. Rev. Let. 2006, 96, 108101. [CrossRef]
- Dansuk, K.; Keten, S. A Simple Mechanical Model for Synthetic Catch Bonds. Matter 2019, 1, 911–925.
- Choi, H.K.; Cong, P.; Ge, C.; Natarajan, A.; Liu, B.; Zhang, Y.; Li, K.; Rushdi, M.N.; Chen, W.; Lou, J.; et al. Catch bond models may explain how force amplifies TCR signaling and antigen discrimination. Nat. Comm. 2023, 14, 2616.
- Bartolo, D.; Derenyi, I.; Ajdari, A. Dynamical response of adhesion complexes: beyond the single-path picture. Phys. Rev. E 2002, 65, 051910.
- Prezhod, O.V.; Prezhdo, O.V.; Thomas, W.E.; Sokurenko, E.V. Distinctive features of the biological catch bond in the jump-ramp force regime predicted by the two-pathway model. Phys. Rev. E 2005, 72, 010903.
- West, D.; Olmsted, P.; Paci, E. Mechanical unfolding revisited through a simple but realistic model. J. Chem. Phys. 2006, 124, 154909.
- Best, R.; Paci, E.; Hummer, G.; Dudko, O. Pulling Direction as a Reaction Coordinate for the Mechanical Unfolding of Single Molecules. J. Phys. Chem. B 2008, 112, 5968.
- Prezhdo, O.V.; Pereverzev, Y.V. Theoritical Aspects of the Biological Catch Bond. Acc. Chem. Res. 2009, 42, 693–703.
- Pereverzev, Y.V.; Prezhdo, E.; Sokurenko, E.V. The Two Pathway Model of the Biological Catch Bond as a Limit of the Allosteric Model. Biophys. J. 2011, 101, 2026–2036.
- Krupicka, M.; Marx, D. Disfavoring Mechanochemical Reactions by Stress-Induced Steric Hindrance. J. Chem. Theory Comput. 2015, 11, 841–846.
- Pierse, C.A.; Dudko, O.K. Distinguishing signatures of multipathway conformational transitions. Phys. Rev. Lett. 2017, 118, 088101.
- van Galen, M.; van der Gucht, J.; Sprakel, J. Chemical design model for emergent synthetic catch bonds. Front. Phys. 2020, 8, 361.
- Jagannathan, B.; Elms, P.J.; Bustamante, C.; Marqusee, S. Direct observation of a force-induced switch in the anisotropic mechanical unfolding pathway of a protein. Proc. Nat. Acad. Sci. 2012, 109, 17820–17825.
- Akbulatov, S.; Tian, Y.; Huang, Z.; Kucharski, T.J.; Yang, Q.Z.; Boulatov, R. Experimentally realized mechanochemistry distinct from forceaccelerated scission of loaded bonds. Science 2017, 357, 299–303.
- Liu, H.; Chen, Y.; Wang, J.; Yang, Y.; Ju, H. Tug-of-war: molecular dynamometers against living cells for analyzing sub-piconewton interaction of a specific protein with the cell membrane. Chem. Sci. 2021, 12, 14389–14395.
- Jiang, H.; Wang, S. Immune cells use active tugging forces to distinguish affinity and accelerate evolution. Proc. Nat. Acad. Sci. 2023, 120, e2213067120.
- Hernandez, J.G.; Bolm, C. Altering Product Selectivity by Mechanochemistry. J. Org. Chem. 2017, 82, 4007–4019. [CrossRef]
- Liu, B.; Chen, W.; Evavold, B.D.; Zhu, C. Accumulation of dynamic catch bonds between TCR and agonist peptide-MHC triggers T cell signaling. Cell 2014, 157, 357–368. [CrossRef]
- Hong, J.; Ge, C.; Jothikumar, P.; Yuan, Z.; Liu, B.; Bai, K.; Li, K.; Rittase, W.; Shinzawa, M.; Zhang, Y.; et al. A TCR mechanotransduction signaling loop induces negative selection in the thymus. Nature Immunol. 2018, 19, 1379–1390.
- Comrie, W.A.; Li, S.; Boyle, S.; Burkhardt, J.K. The dendritic cell cytoskeleton promotes T cell adhesion and activation by constraining ICAM-1 mobility. J. Cell Biol. 2015, 208, 457–473.
- Nord, A.L.; Gachon, E.; Perez-Carrasco, R.; Nirody, J.A.; Barducci, A.; Berry, R.M.; Pedaci, F. Catch bond drives stator mechanosensitivity in the bacterial flagellar motor. PNAS 2017, 114, 12952–12957.
- Quapp, W. A Minimal 2D Model of the Free Energy Surface for a Unidirectional Natural Molecular Motor. J. Math. Chem. 2018, 56, 1339–1347.
- Hirsch, M.; Quapp, W.; Heidrich, D. The Set of Valley-Ridge Inflection Points on the Potential Energy Surface of the Water Molecule. Phys. Chem. Chem. Phys. 1999, 1, 5291–5299.
- Quapp, W.; Melnikov, V. The Set of Valley Ridge Inflection Points on the Potential Energy Surfaces of H2S, H2Se and H2CO. Phys. Chem. Chem. Phys. 2001, 3, 2735–2741. [CrossRef]
- Quapp, W.; Schmidt, B. An Empirical, Variational Method of Approach to Unsymmetric Valley-ridge Inflection Points. Theor. Chem. Acc. 2011, 128, 47–61.
- Schmidt, B.; Quapp, W. Search of Manifolds of Nonsymmetric Valley-Ridge Inflection Points on the Potential Energy Surface of HCN. Theor. Chem. Acc. 2012, 132, 1305–1313.
- Bofill, J.; Quapp, W. Analysis of the Valley-Ridge Inflection Points through the Partitioning Technique ofthe Hessian Eigenvalue Equation. J. Math. Chem. 2013, 51, 1099–1115.
- Valtazanos, P.; Ruedenberg, K. Bifurcations and Transition States. Theor. Chim. Acta 1986, 69, 281–307.
- Quadrelli, P.; Romano, S.; Toma, L.; Caramella, P. Merging and bifurcation of 4+2 and 2+4 cycloaddition modes in the archetypal dimerization of butadiene. A case of competing bispericyclic, pericyclic and diradical paths. Tetrahedron Letters 2002, 43, 8785–8789.
- Ess, D.H.; Wheeler, S.E.; Iafe, R.G.; Xu, L.; Celebic, N.; Houk, K.N. Bifurcations on Potential Energy Surfaces of Organic Reactions. Angew Chem Int Ed 2008, 47, 7592–7601. [CrossRef]
- Mauguiere, F.A.; Collins, P.; Ezra, G.S.; Wiggins, S. Bifurcations of normally hyperbolic invariant manifolds in analytically tractable models and consequences for reaction dynamics. Int. J. Bif. Chaos 2013, 23, 1330043. [CrossRef]
- Harabuchi, Y.; Ono, Y.; Maeda, S.; Taketsugu, T. Analysis of bifurcation of Reaction Pathways on a global reaction route map: A case study of gold cluster Au5. J. Chem. Phys. 2015, 143, 014301.
- Beste, M.T.; Hammer, D.A. Selectin catch-slip kinetics encode shear threshold adhesive behavior of rolling leukocytes. Proc. Nat. Acad. Sci. 2008, 105, 20716–20721.
- Wayman, A.M.; Chen, W.; McEver, R.P.; Zhu, C. Triphasic Force Dependence of E-Selectin/Ligand Dissociation Governs Cell Rolling under Flow. Biophys. J. 2010, 99, 1166–1174.
- McEver, R.P.; Zhu, C. Rolling cell adhesion. Ann. Rev. Cell Develop. Biol. 2010, 26, 363.
- Doggett, T.A.; Girdhar, G.; Lawshe, A.; Schmidtke, D.W.; Laurenzi, I.J.; Diamond, S.L.; Diacovo, T.G. Selectin-like kinetics and biomechanics promote rapid platelet adhesion in flow. Biophys. J. 2002, 83, 194–205.
- Andersen, J.M.; Mack, J. Decoupling the Arrhenius equation via mechanochemistry. Chem. Sci. 2017, 8, 5447–5453.
- Lukin, S.; Germann, L.S.; Friščić, T.; Halasz, I. Toward Mechanistic Understanding of Mechanochemical Reactions Using Real-Time In Situ Monitoring. Acc. Chem. Res. 2022, 55, 1262–1277.
- Martinez, V.; Stolar, T.; Karadeniz, B.; Brekalo, I.; Užarevic, K. Advancing mechanochemical synthesis by combining milling with different energy sources. Nat. Rev. Chem. 2023, 7, 51–65.
- Boocock, D.; Hino, N.; Ruzickova, N.; Hirashima, T.; Hannezo, E. Theory of mechanochemical patterning and optimal migration in cell monolayers. Nat. Phys. 2021, 17, 267–274.
- Pladevall, B.S.; de Aguirre, A.; Maseras, F. Understanding Ball Milling Mechanochemical Processes with DFT Calculations and Microkinetic Modeling. Chem. Sus. Chem. 2021, 14, 2763–2768.
- Bofill, J.M.; Ribas-Ariño, J.; Garcia, S.P.; Quapp, W. An Algorithm to Locate Optimal Bond Breaking Points on a Potential Energy Surface. J.Chem.Phys. 2017, 147, 152710–152719.
- Dittner, M.; Hartke, B. Globally optimal catalytic fields for a Diels-Alder reaction. J. Chem. Phys. 2020, 152, 114106–114121. [CrossRef]
- Quapp, W. A growing String Method for the reaction pathway defined by a Newton Trajectory. J. Chem. Phys. 2005, 122, 174106. [CrossRef]
Figure 1.
Proposed 2D PES of E-selectin with Eq. (6) in the appendix, in the forceless limit, F=0, depicted by thin equipotential lines by steps of 7.4 pN. R is the global minimum. The TS of the dissociation limit is far outside the scale. The thickly dashed NT to direction (1, 1) is a putative slip-catch-slip bond NT in ref. [5], see text for a contradiction. The green curves are the lines of the PES.
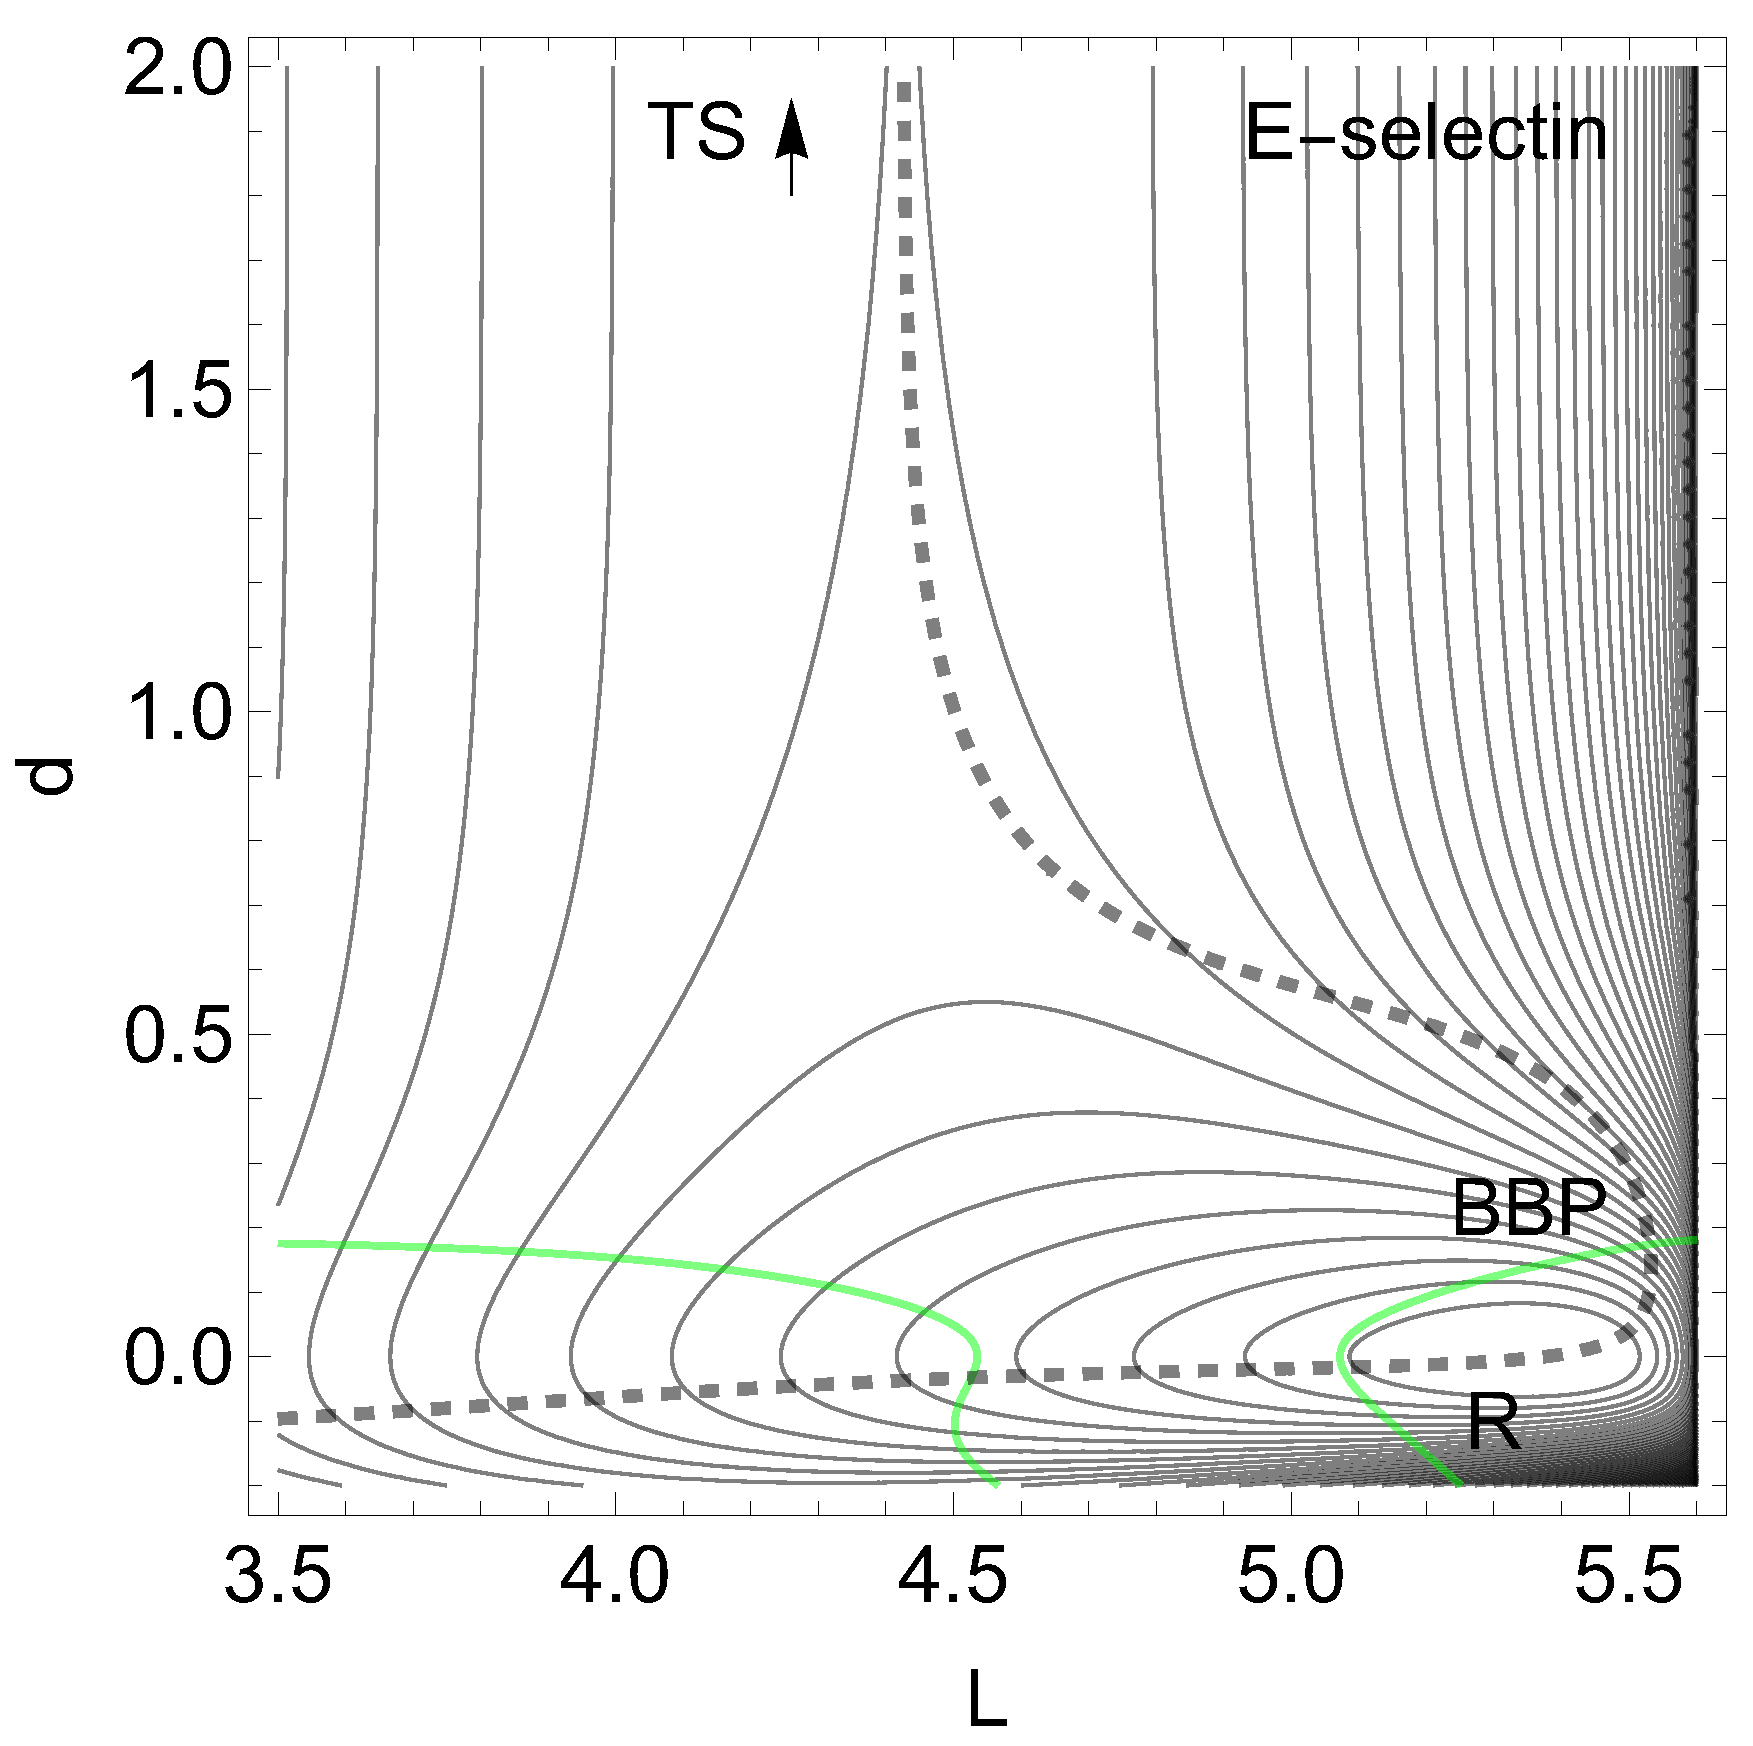
Figure 2.
PES of L-selectin [5]. The TS of the dissociation limit is far outside the panel. The thickly dashed NT to direction (1, 1) is the NT with catch bond behavior. The red line is the NT to direction (-1, 0), and the gray-black NT goes to direction (-1, 1). Both are slip directions. The blue NT goes through the VRI point; it is the separatrix for the catch bond NT. The green curves are the lines of the PES.
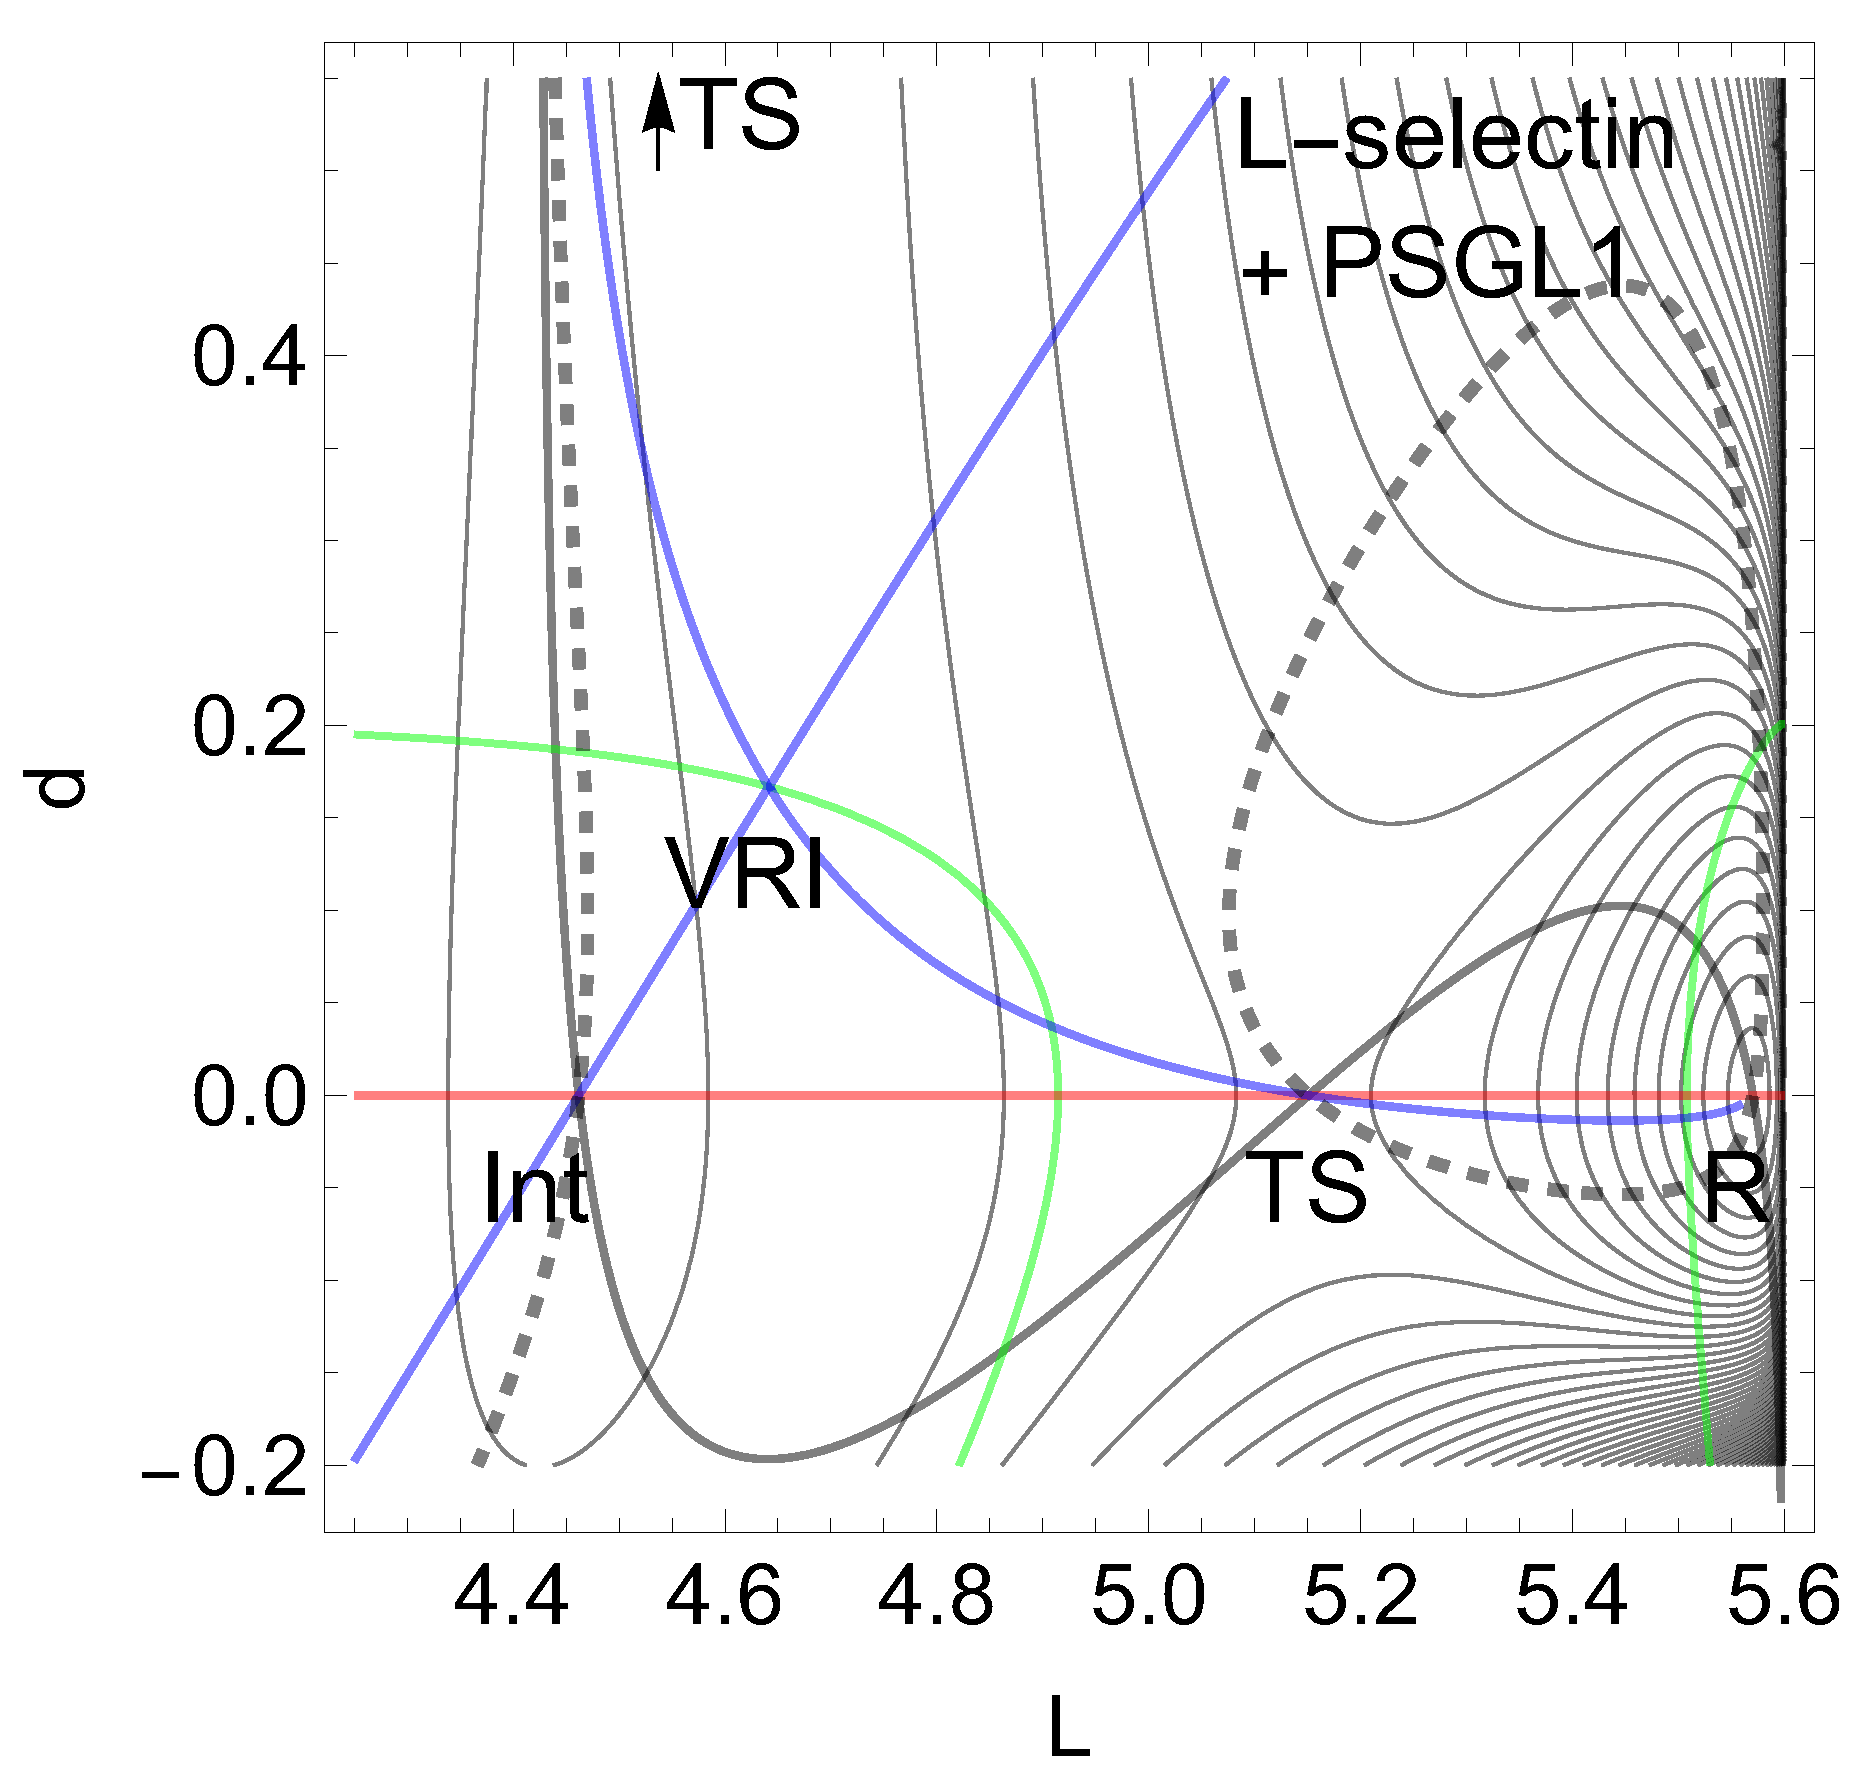
Figure 3.
Effective PES of L-selectin [5] for the gray NT to direction (-1, 1) of Figure 2, for force pN. The former TS and the former minimum, R, now form a shoulder. The barrier disappears.
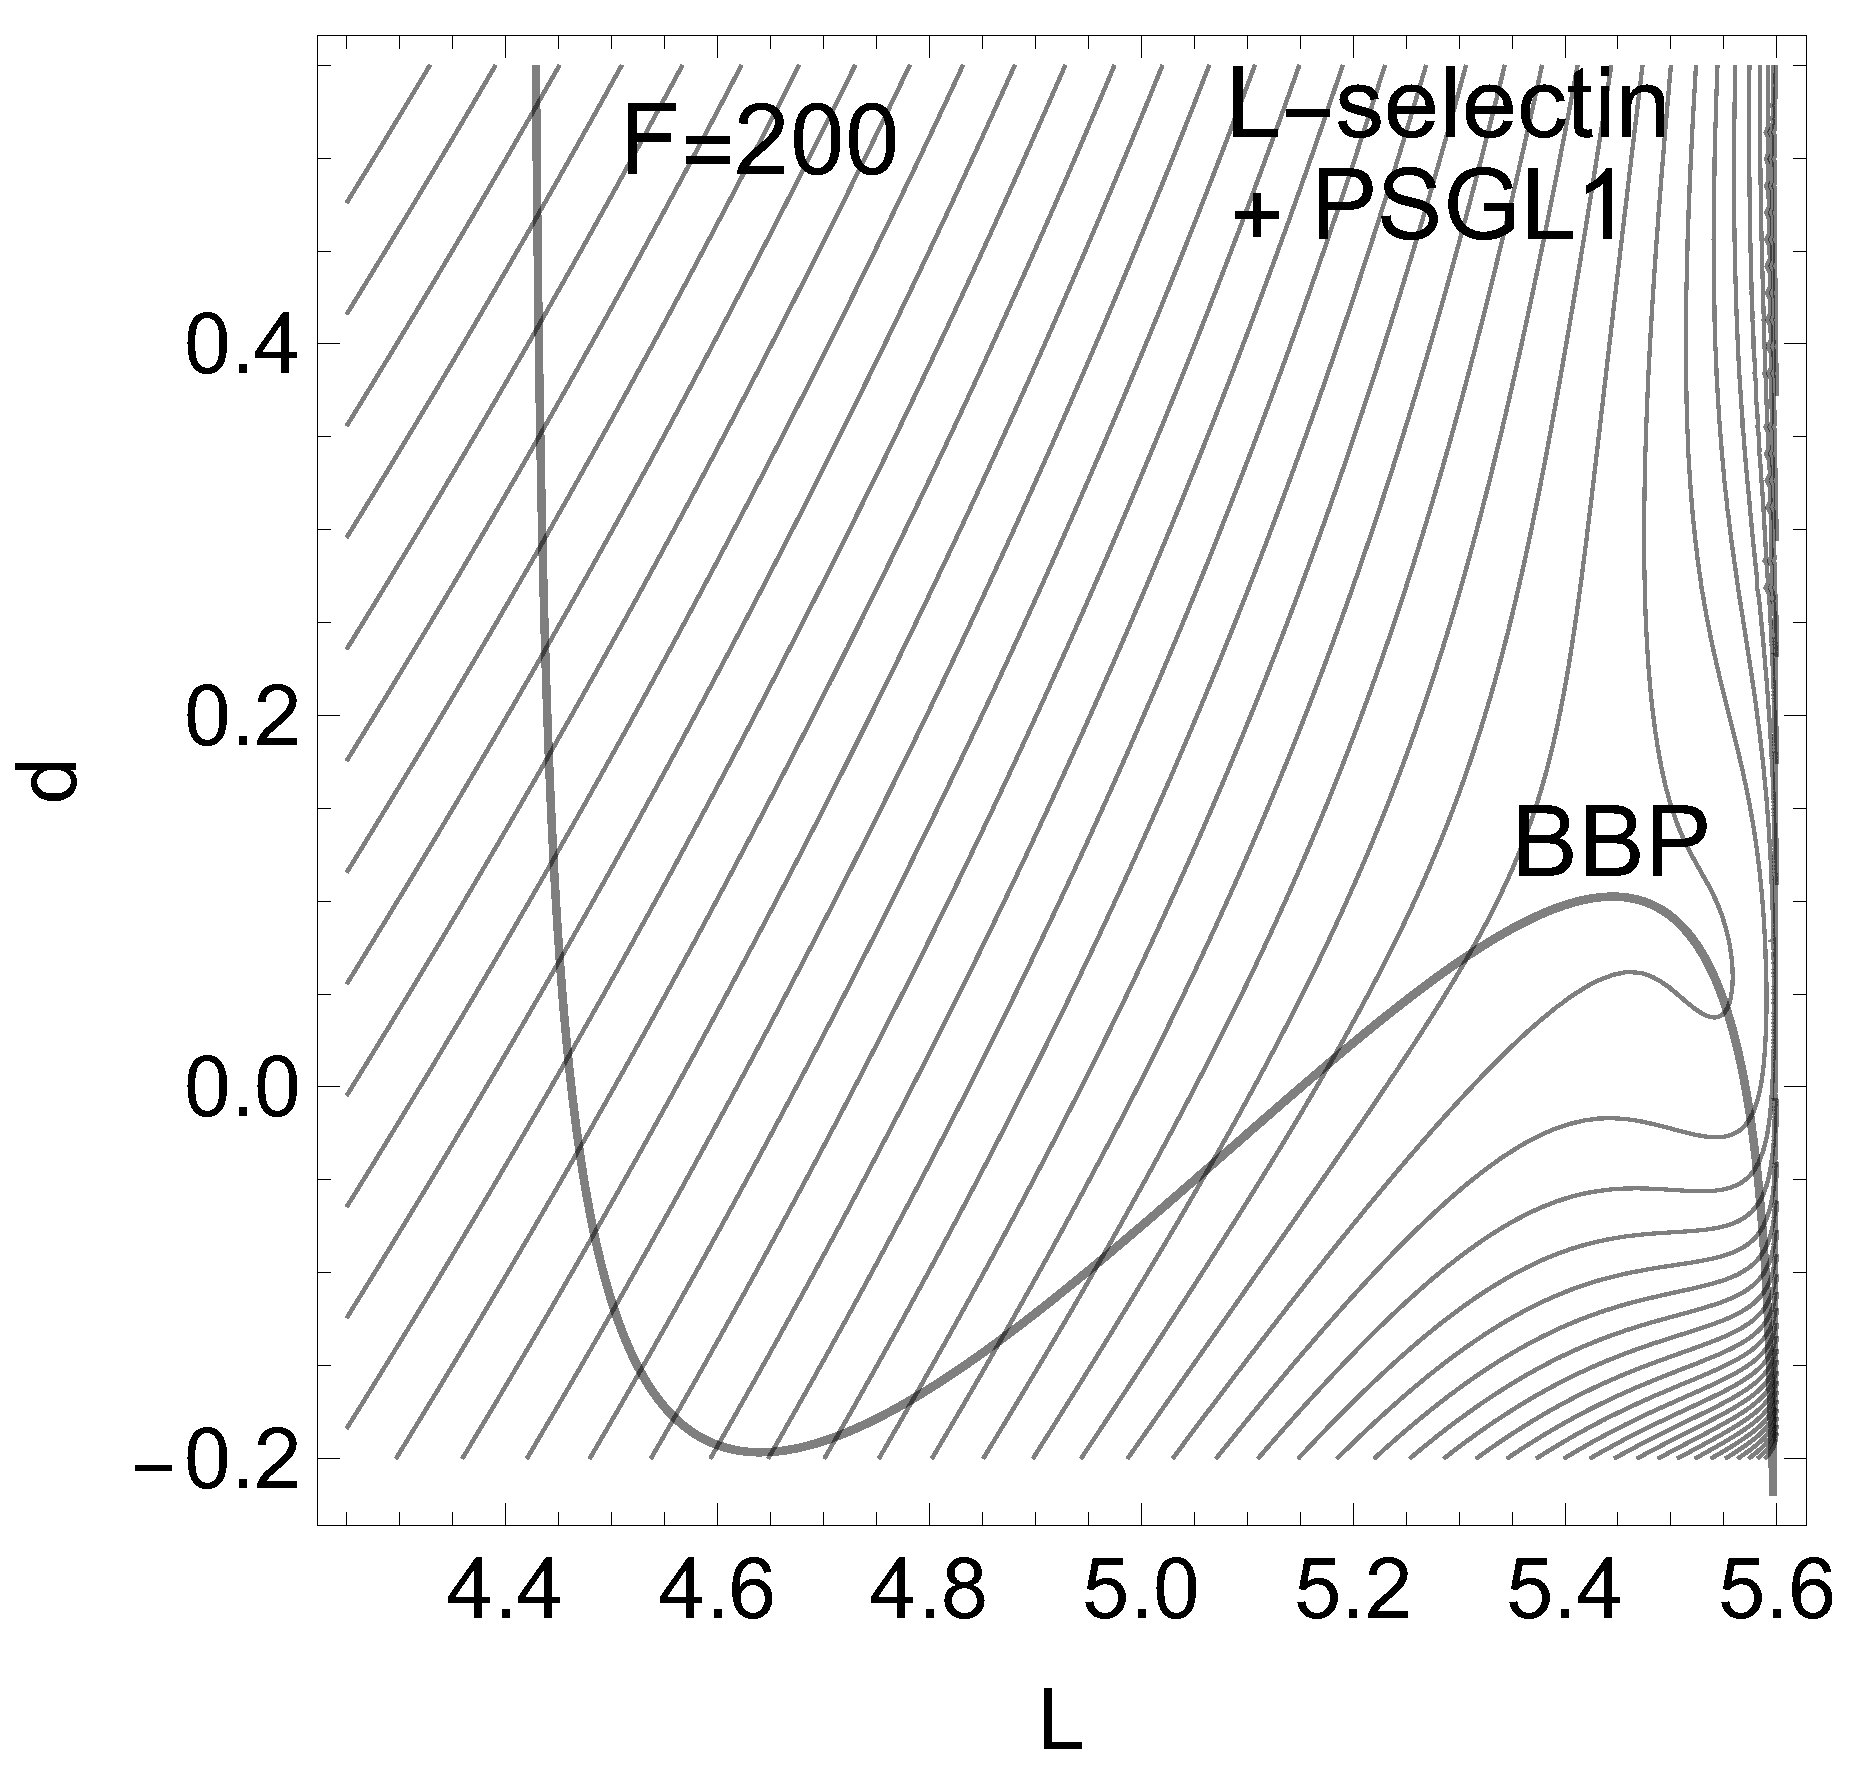
Figure 4.
The 2D PES of Eq. (8) in the forceless limit, F=0, depicted by thin equipotential lines. R is at zero level, but the SP is at 4 energy units. The red curve is a typical slip bond NT, the thickly dashed one is a putative catch bond NT, the thinly dashed one is no direct catch bond NT, and the blue curves are singular NTs through the two VRI points. The green curve is the line of the PES which also crosses the VRI points.
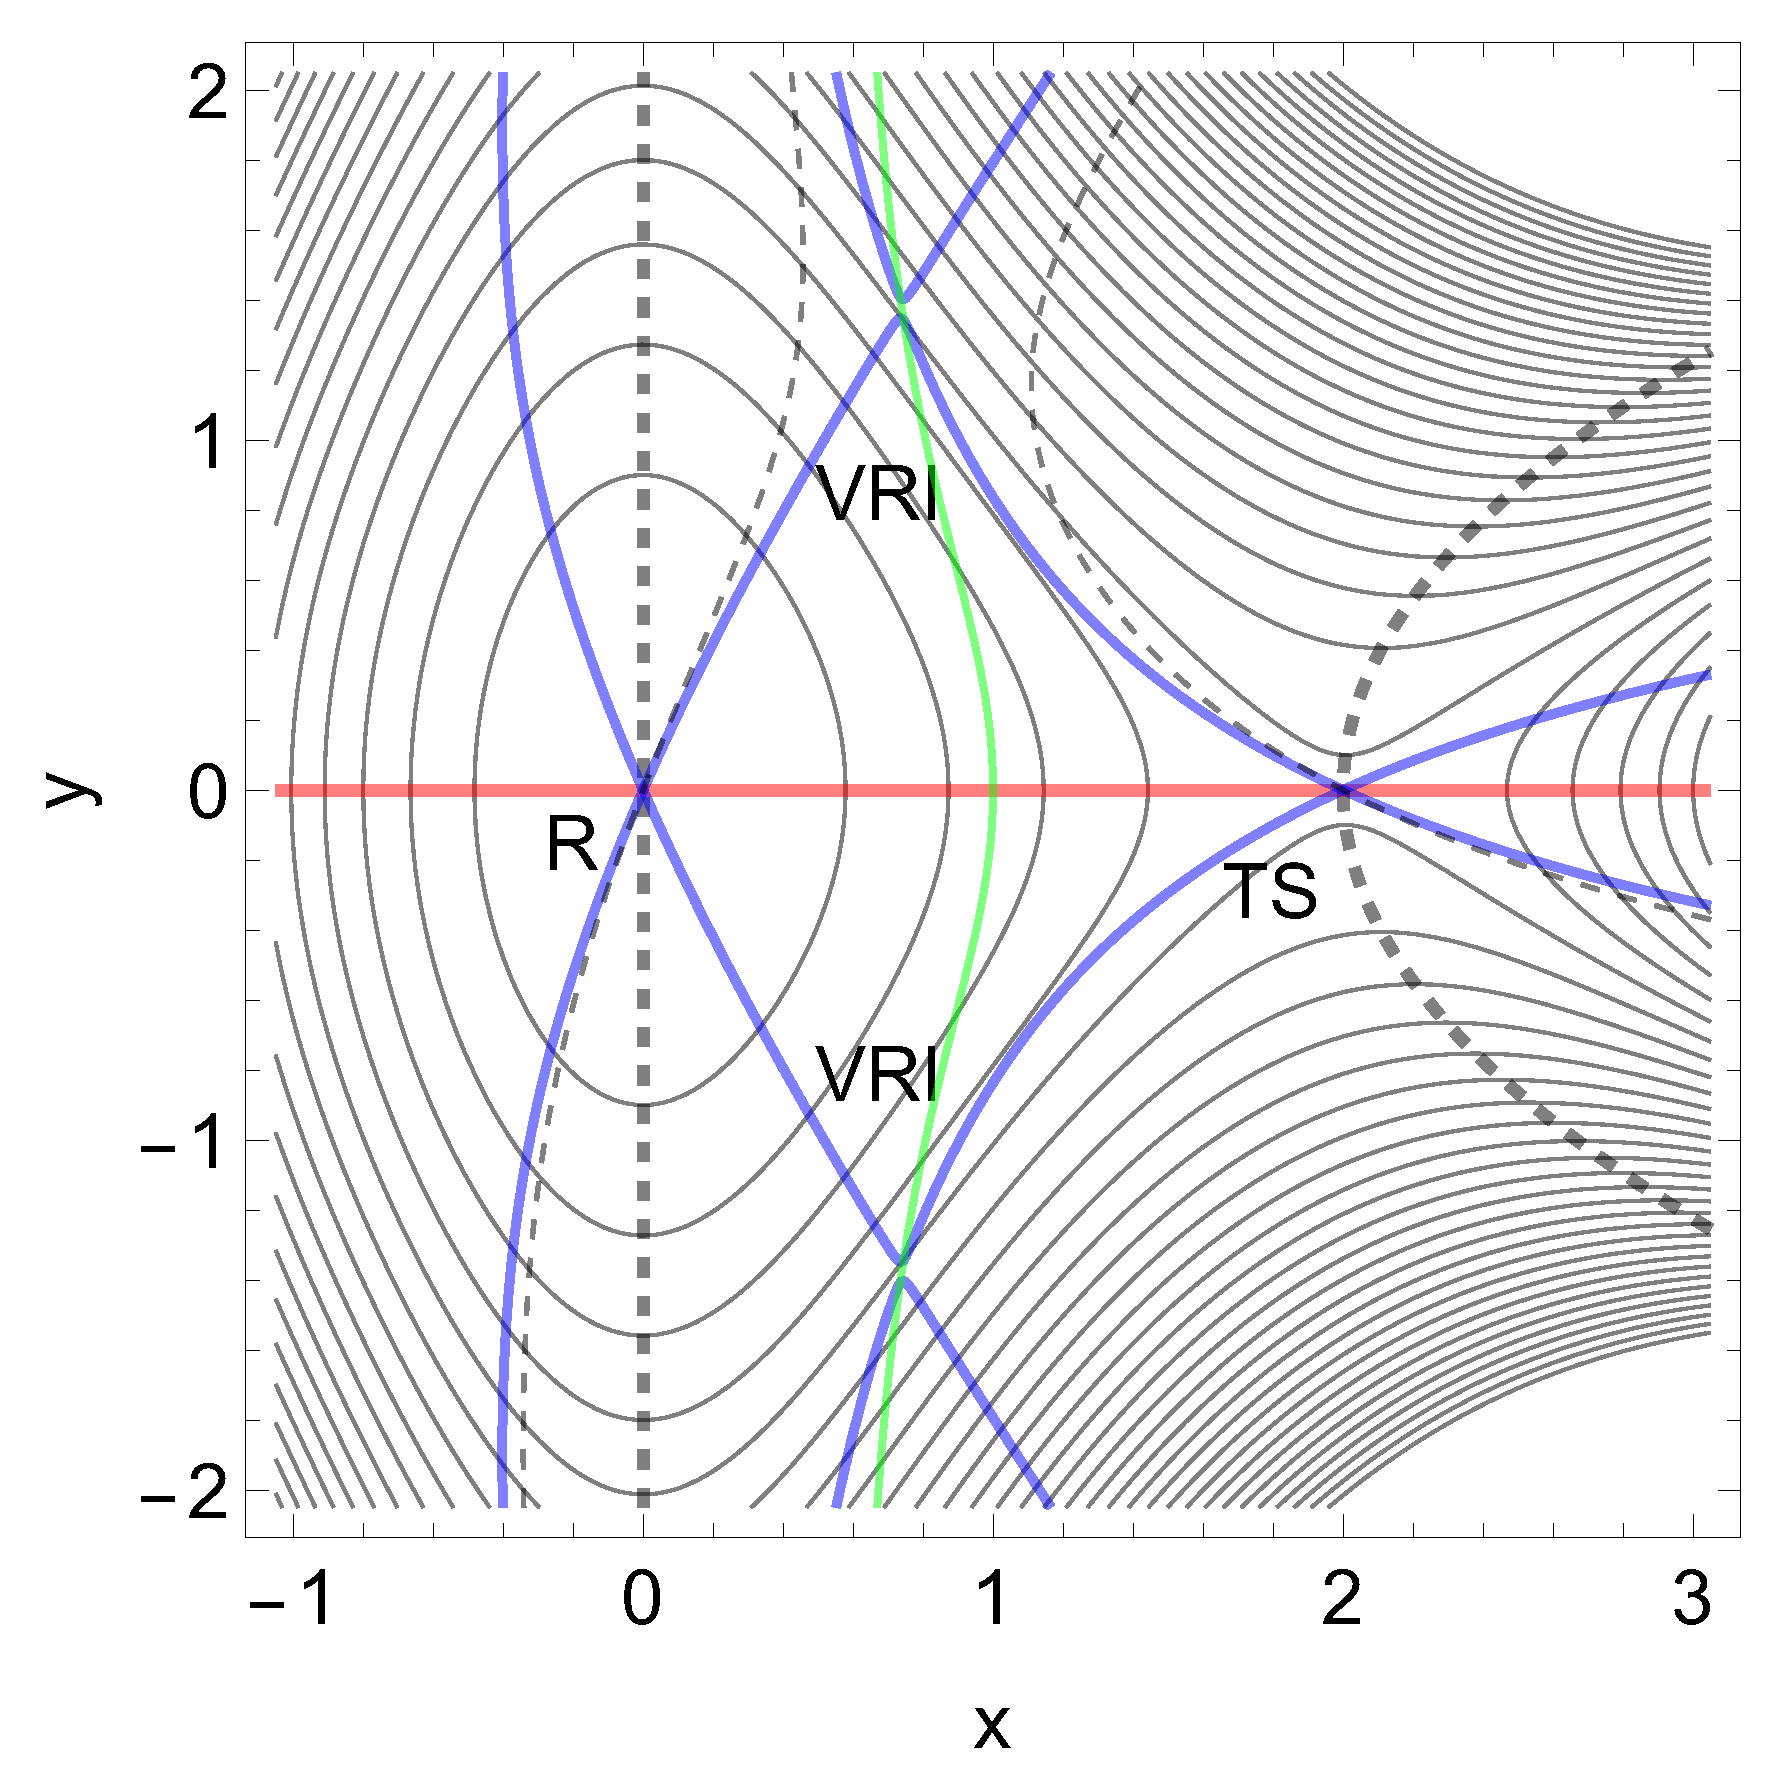
Figure 5.
Barriers along the two dashed NTs of Figure 4 with increasing force, F. Left the thick NT, but with the right panel the thin one.
Figure 5.
Barriers along the two dashed NTs of Figure 4 with increasing force, F. Left the thick NT, but with the right panel the thin one.
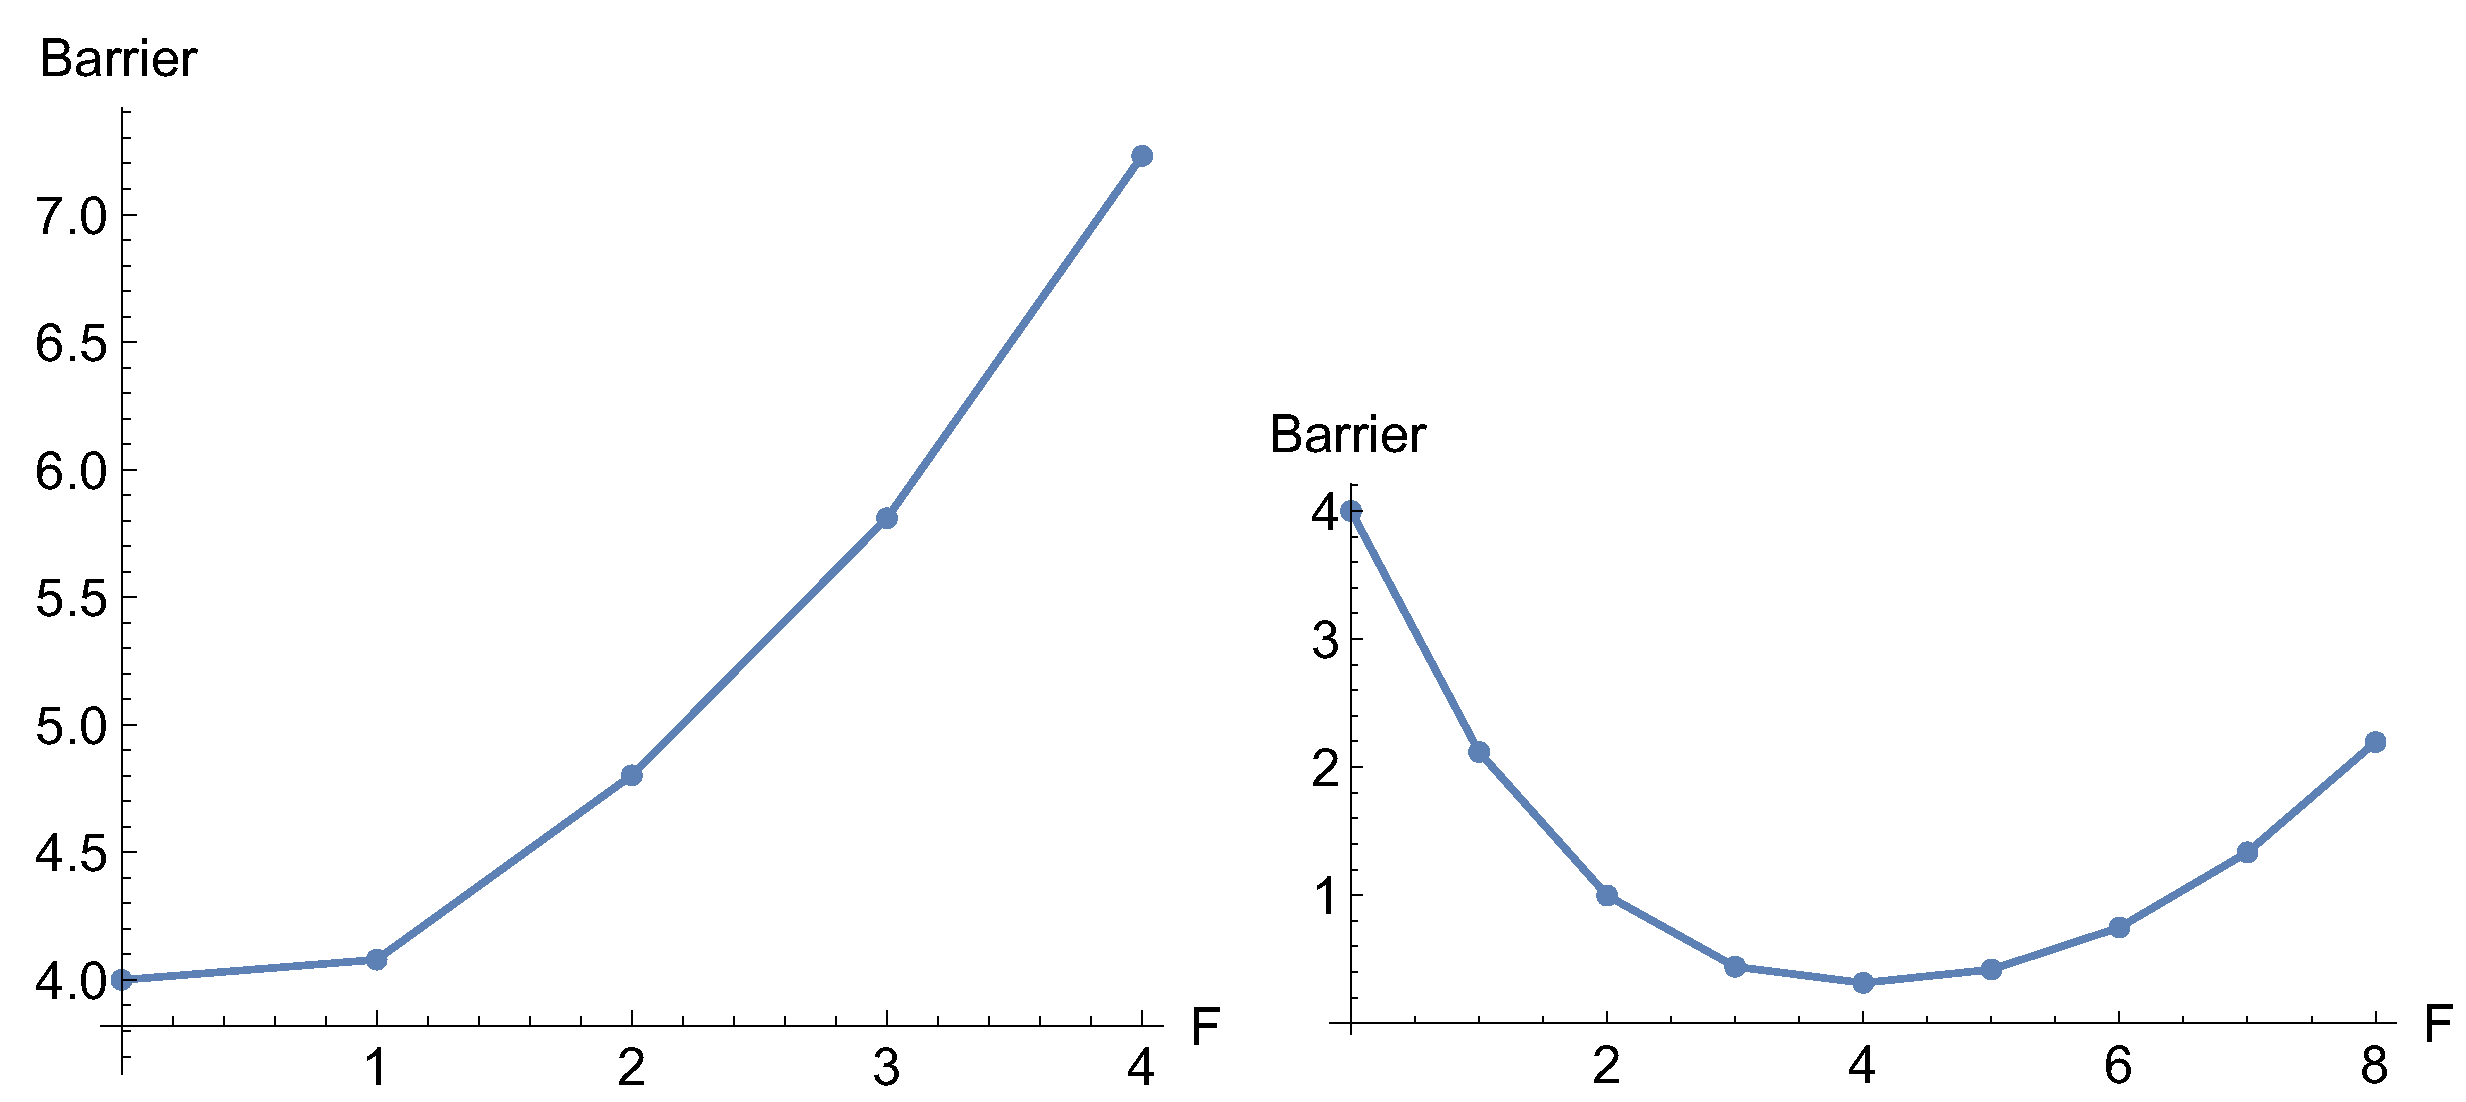
Figure 6.
The 2D PES of Eq. (9) in the forceless limit, F=0, depicted by thin equipotential lines. R is at -60 energy units, but the SP is at +60 energy units. The red curve is a typical slip bond NT, but the two blue curves are singular NTs through the two VRI points. The dashed curve is an NT divided into two branches which are of interest for a catch bond behavior. The green curve is the line of the PES.
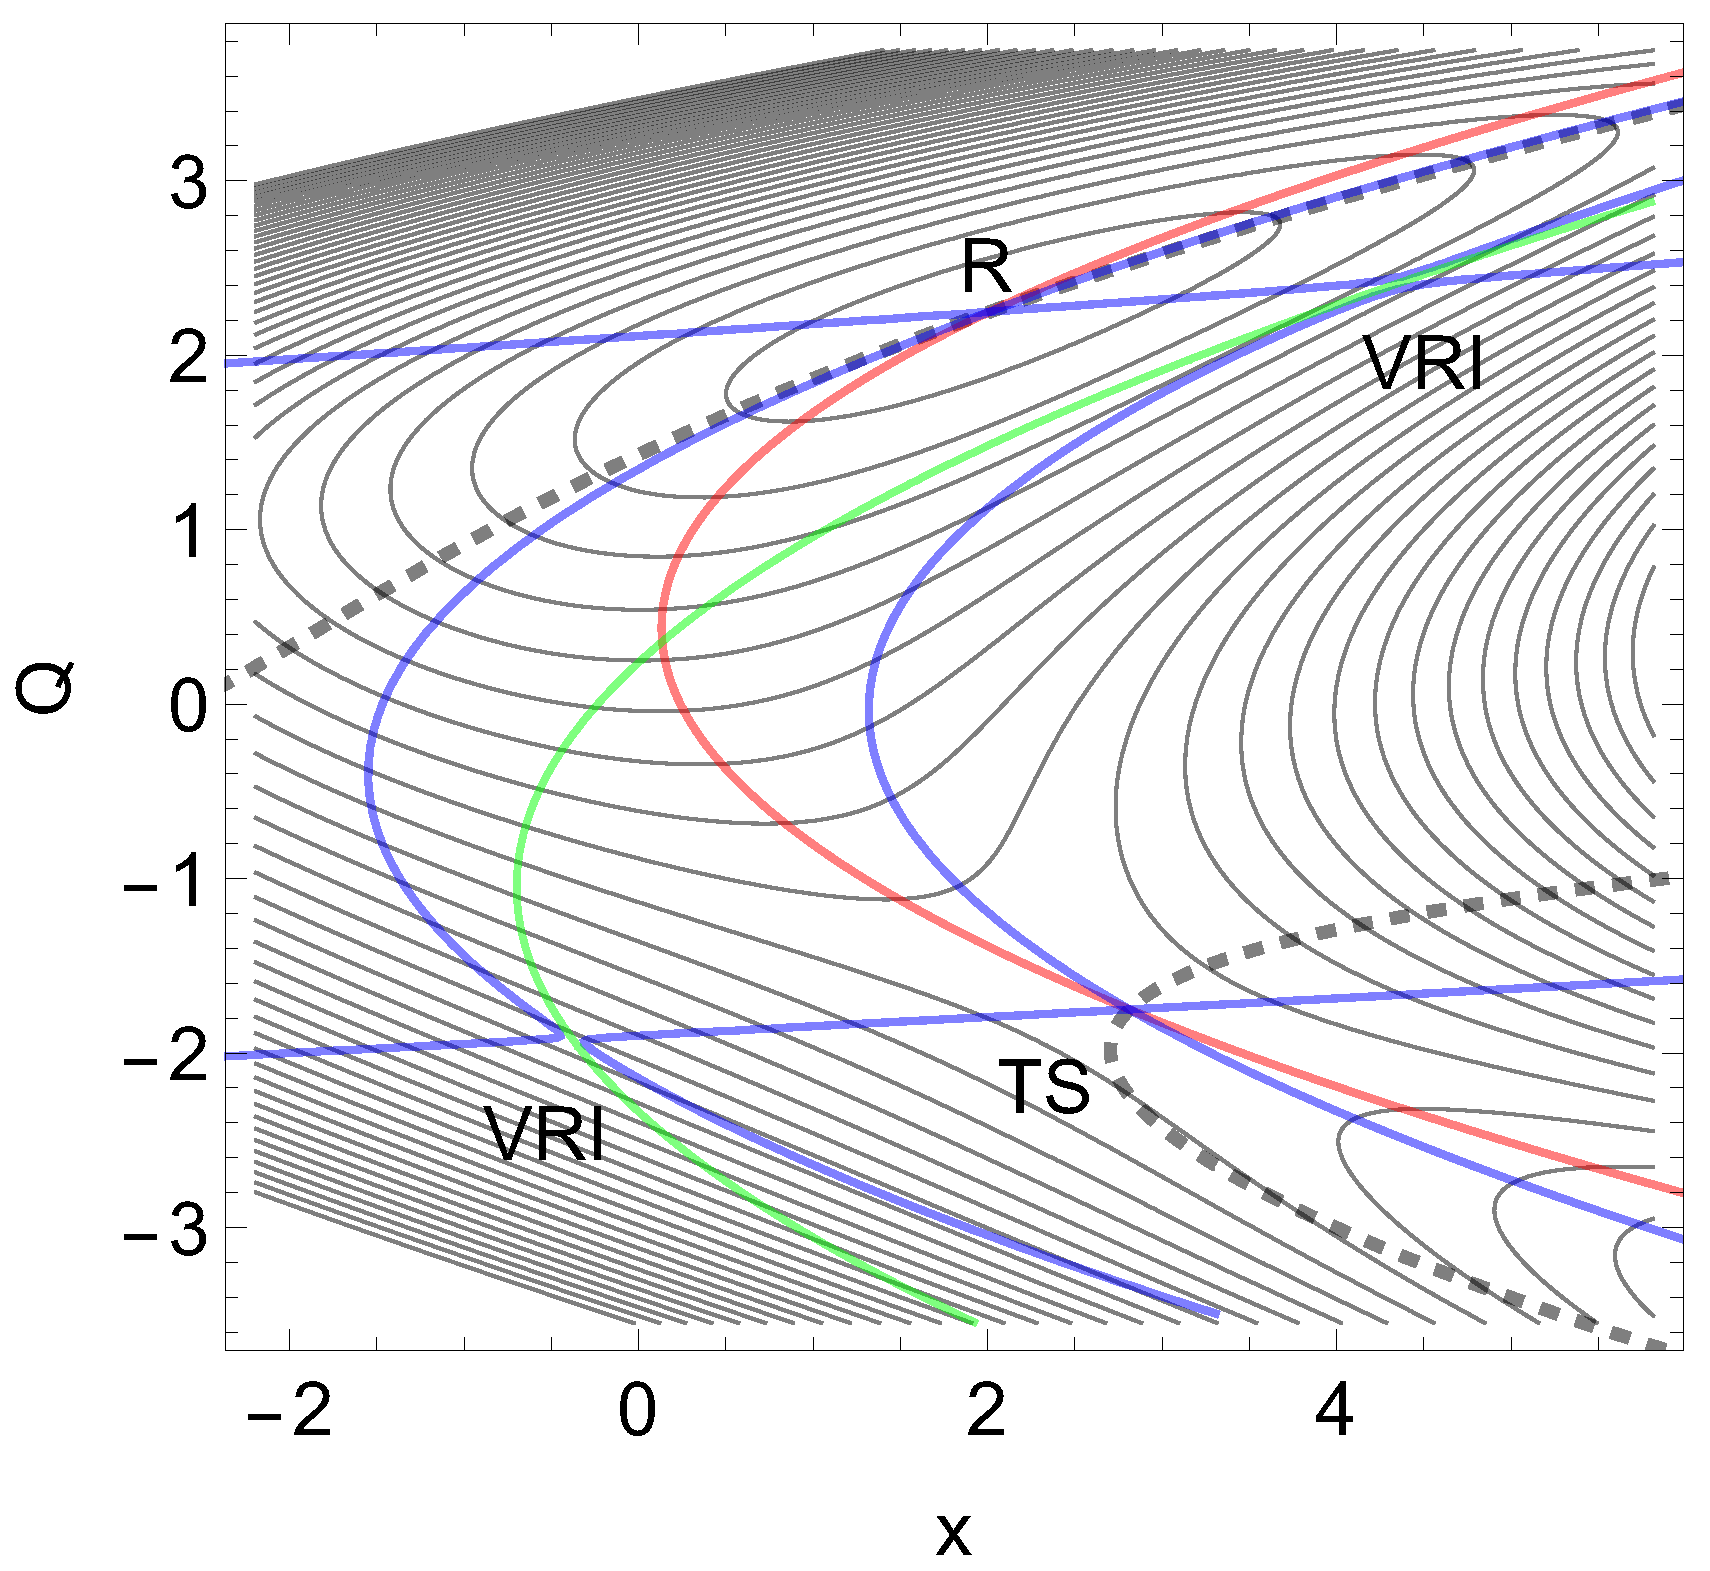
Figure 7.
Increase of the barrier for the dashed NT of Figure 6 with increasing force, F.
Figure 7.
Increase of the barrier for the dashed NT of Figure 6 with increasing force, F.
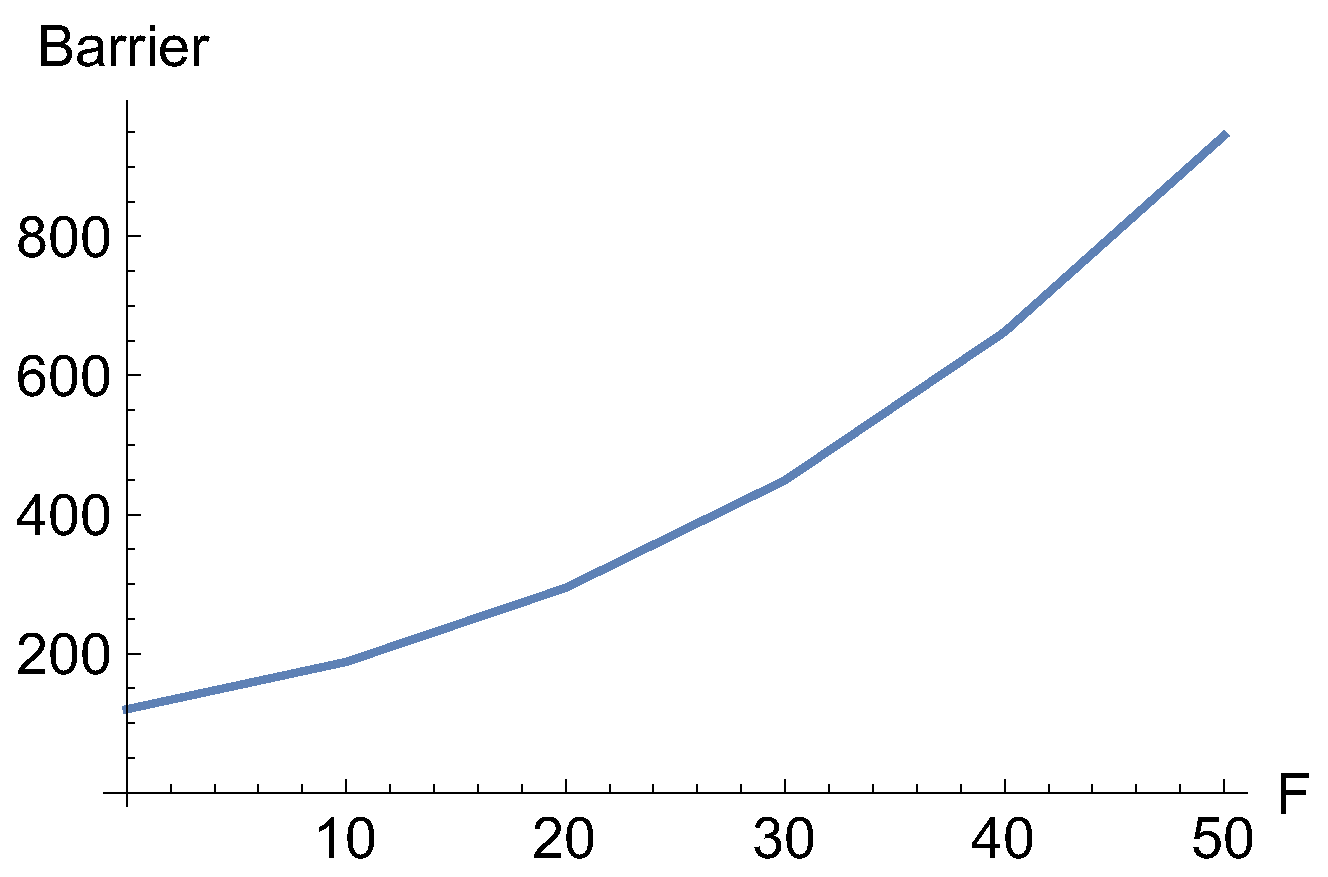
Figure 8.
Three cases of an effective PES to Eq.(9) with external force along Eq.(1). The direction of the force is that to the dashed NT of Figure 6, and the amounts are F=10, 50, 100 force units. Note the movement of the shown sections along the x axis. The stationary points move on the corresponding NT; the minima in the last two cases are far out off the figure, see Table 3.
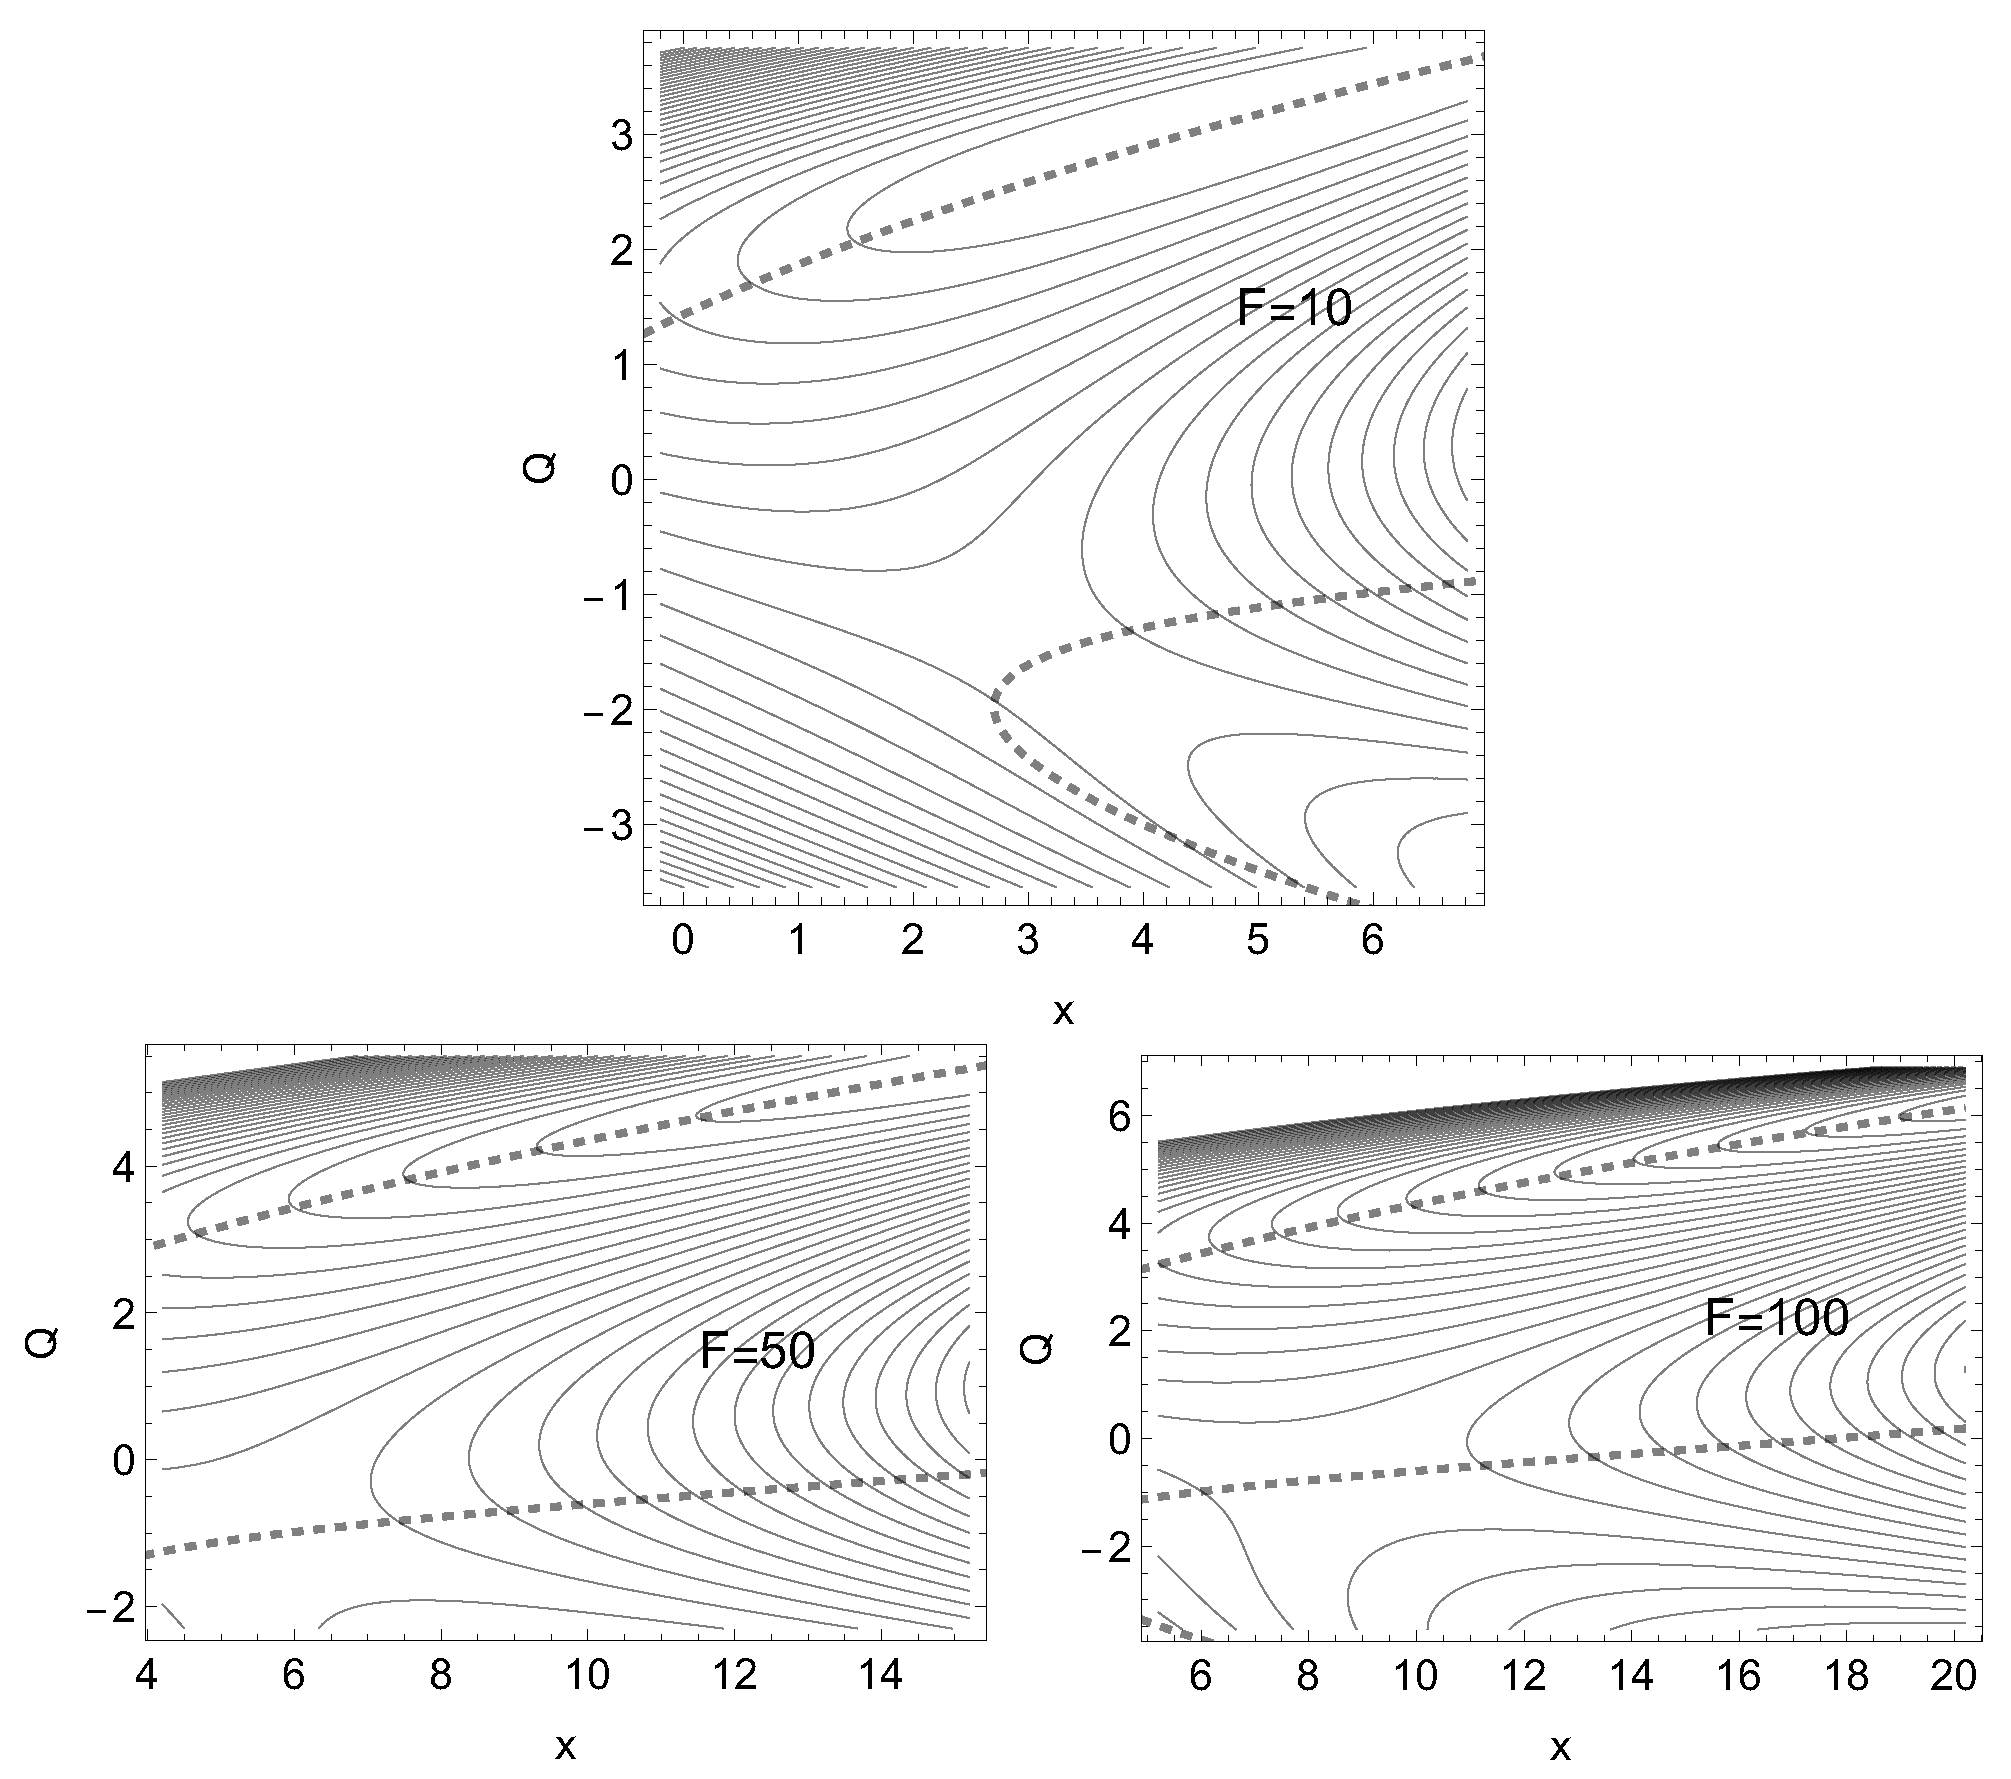
Figure 9.
PES to Eq.(10) with two minima and a TS in between. A disrupted black dashed NT for the catch direction (1,0) is shown. Further NTs are with directions red (0.15, 0.99) for a slip bond character, and blue (0.67, 0.74) for the singular NT. The TP of the singular NT is the VRI point of the PES. It again divides the two branches of the dashed NT.
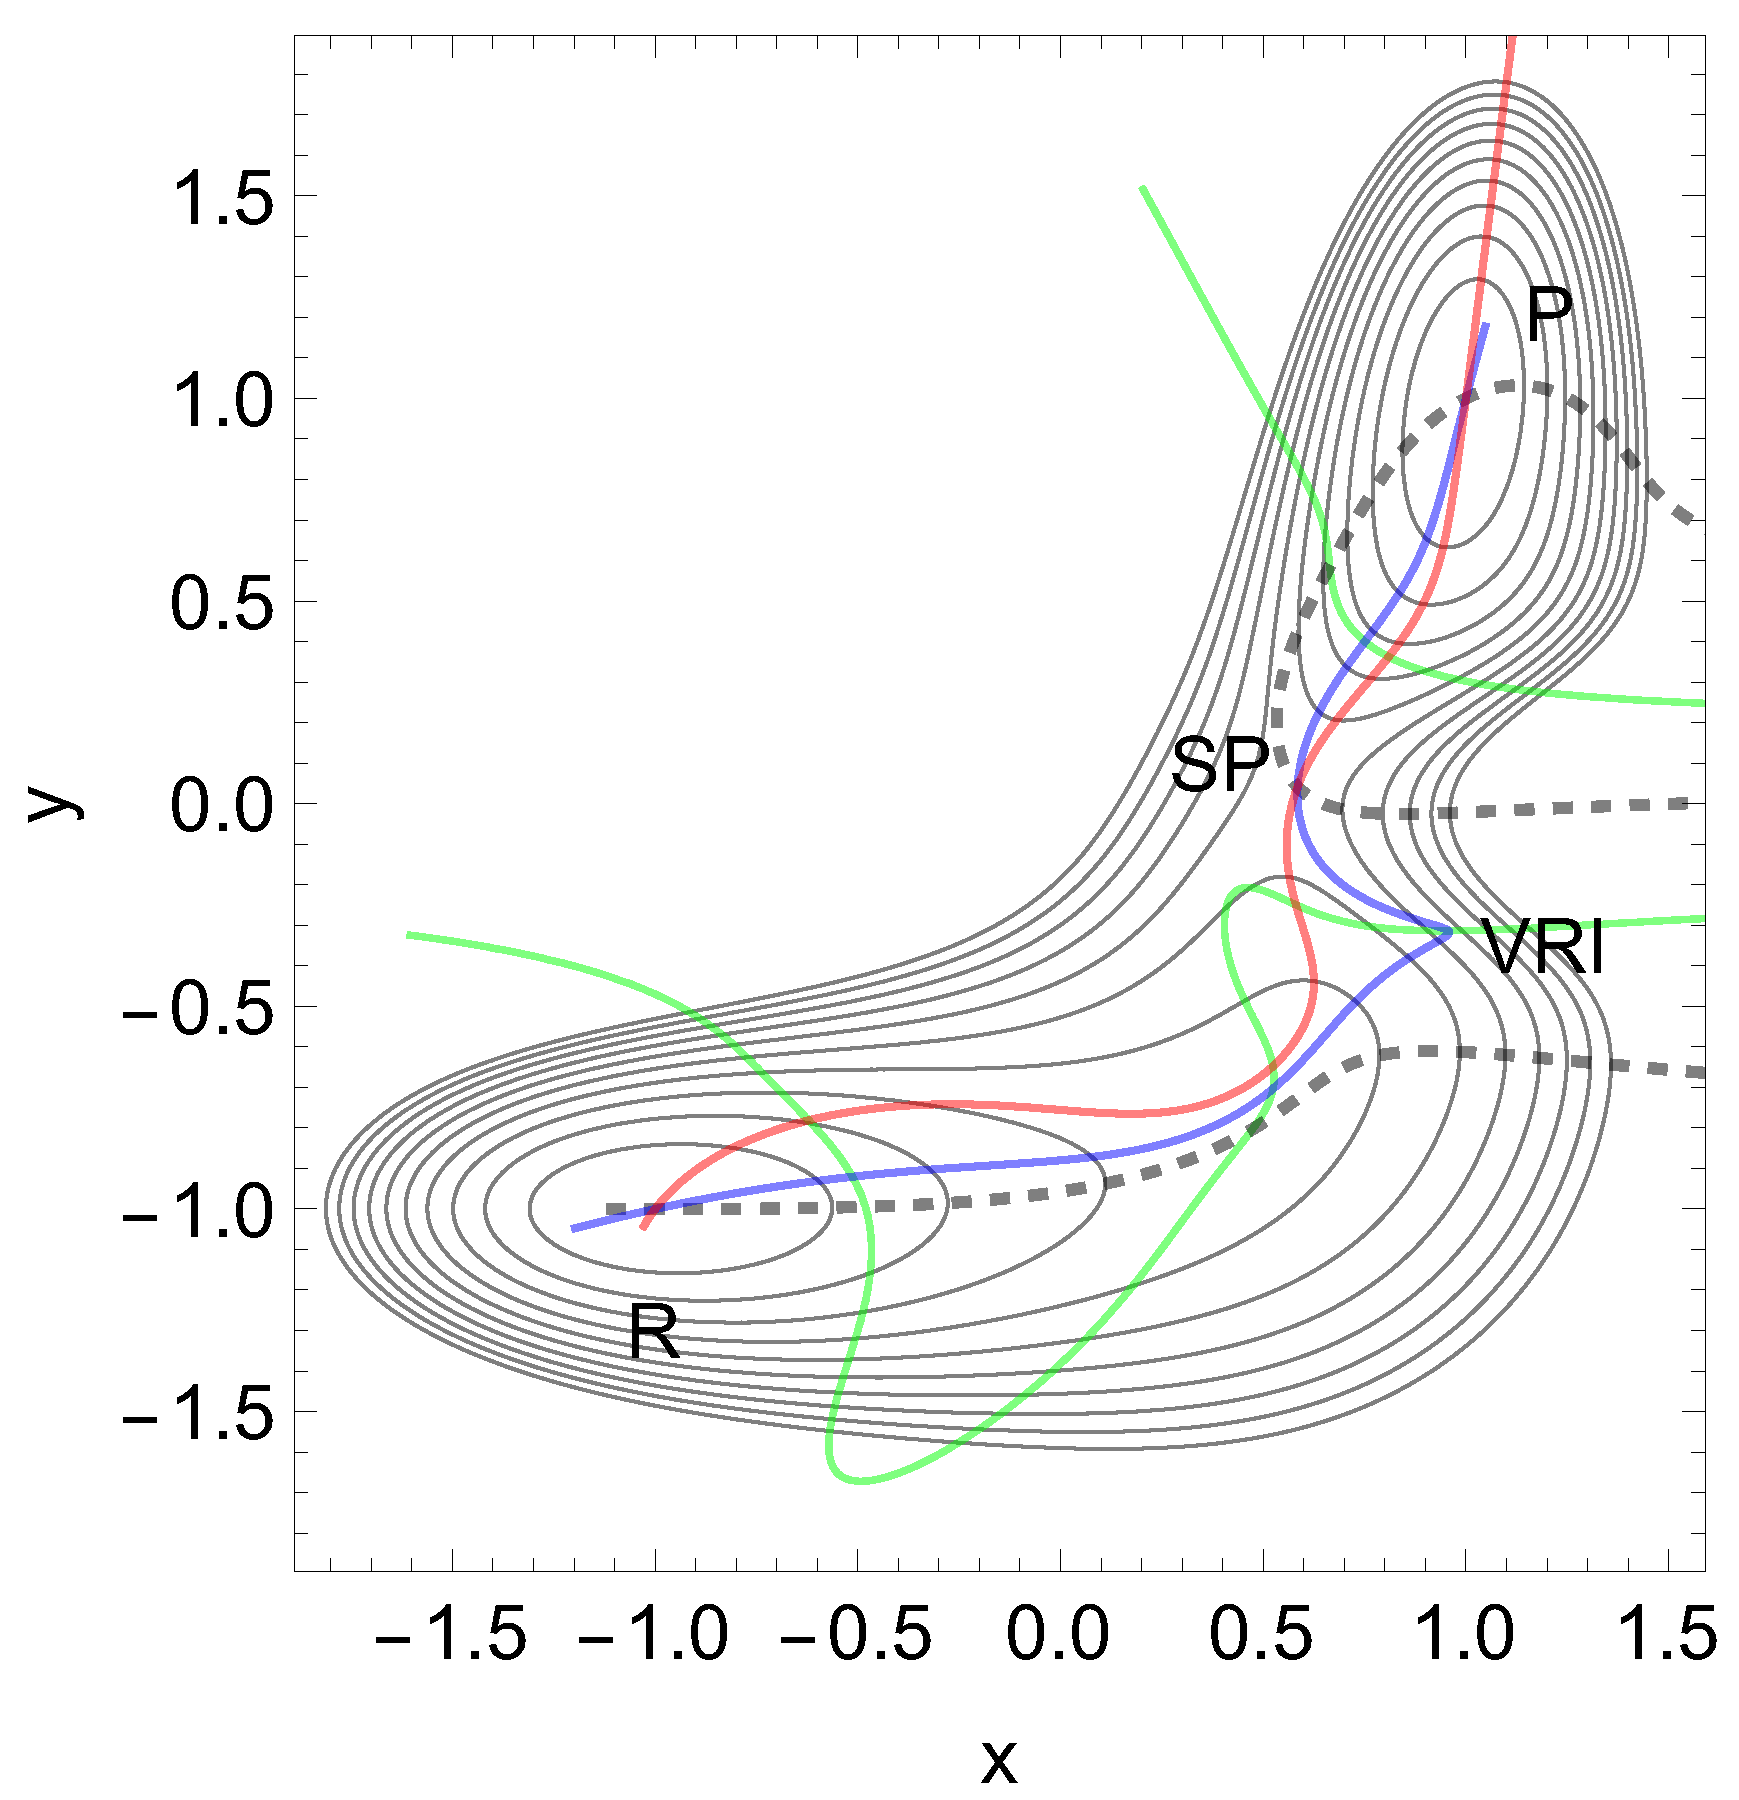
Figure 10.
Two curves for the barrier height of the effective PES to Eq.(10) with an external force along the x-direction. Dark yellow is the barrier to the original global minimum, the blue curve depicts the barrier to the new minimum.
Figure 10.
Two curves for the barrier height of the effective PES to Eq.(10) with an external force along the x-direction. Dark yellow is the barrier to the original global minimum, the blue curve depicts the barrier to the new minimum.
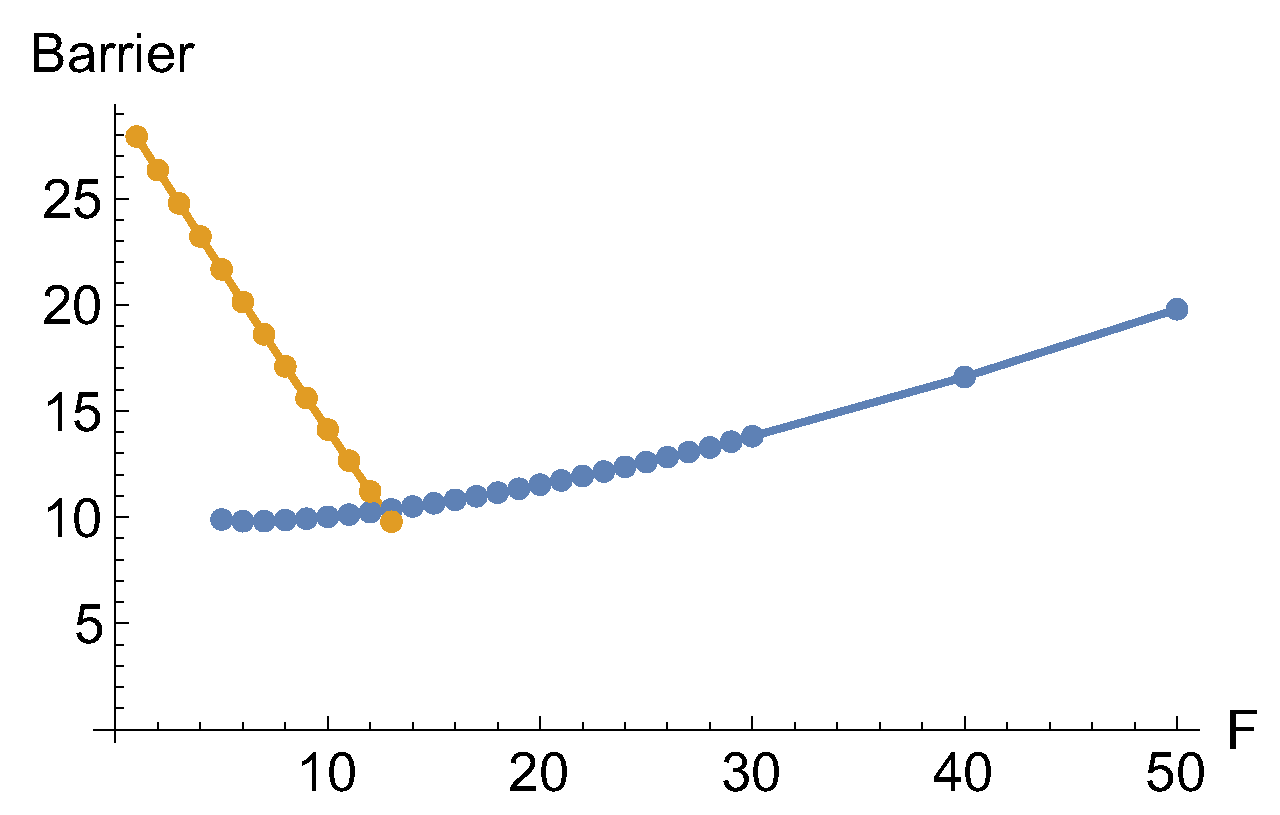
Figure 11.
Two cases of an effective PES to Eq.(10) with external force along Eq.(1) in x-direction, the dashed NT of Figure 9, and the amounts are F=6, 12 units. The stationary points move on the corresponding dashed NT.
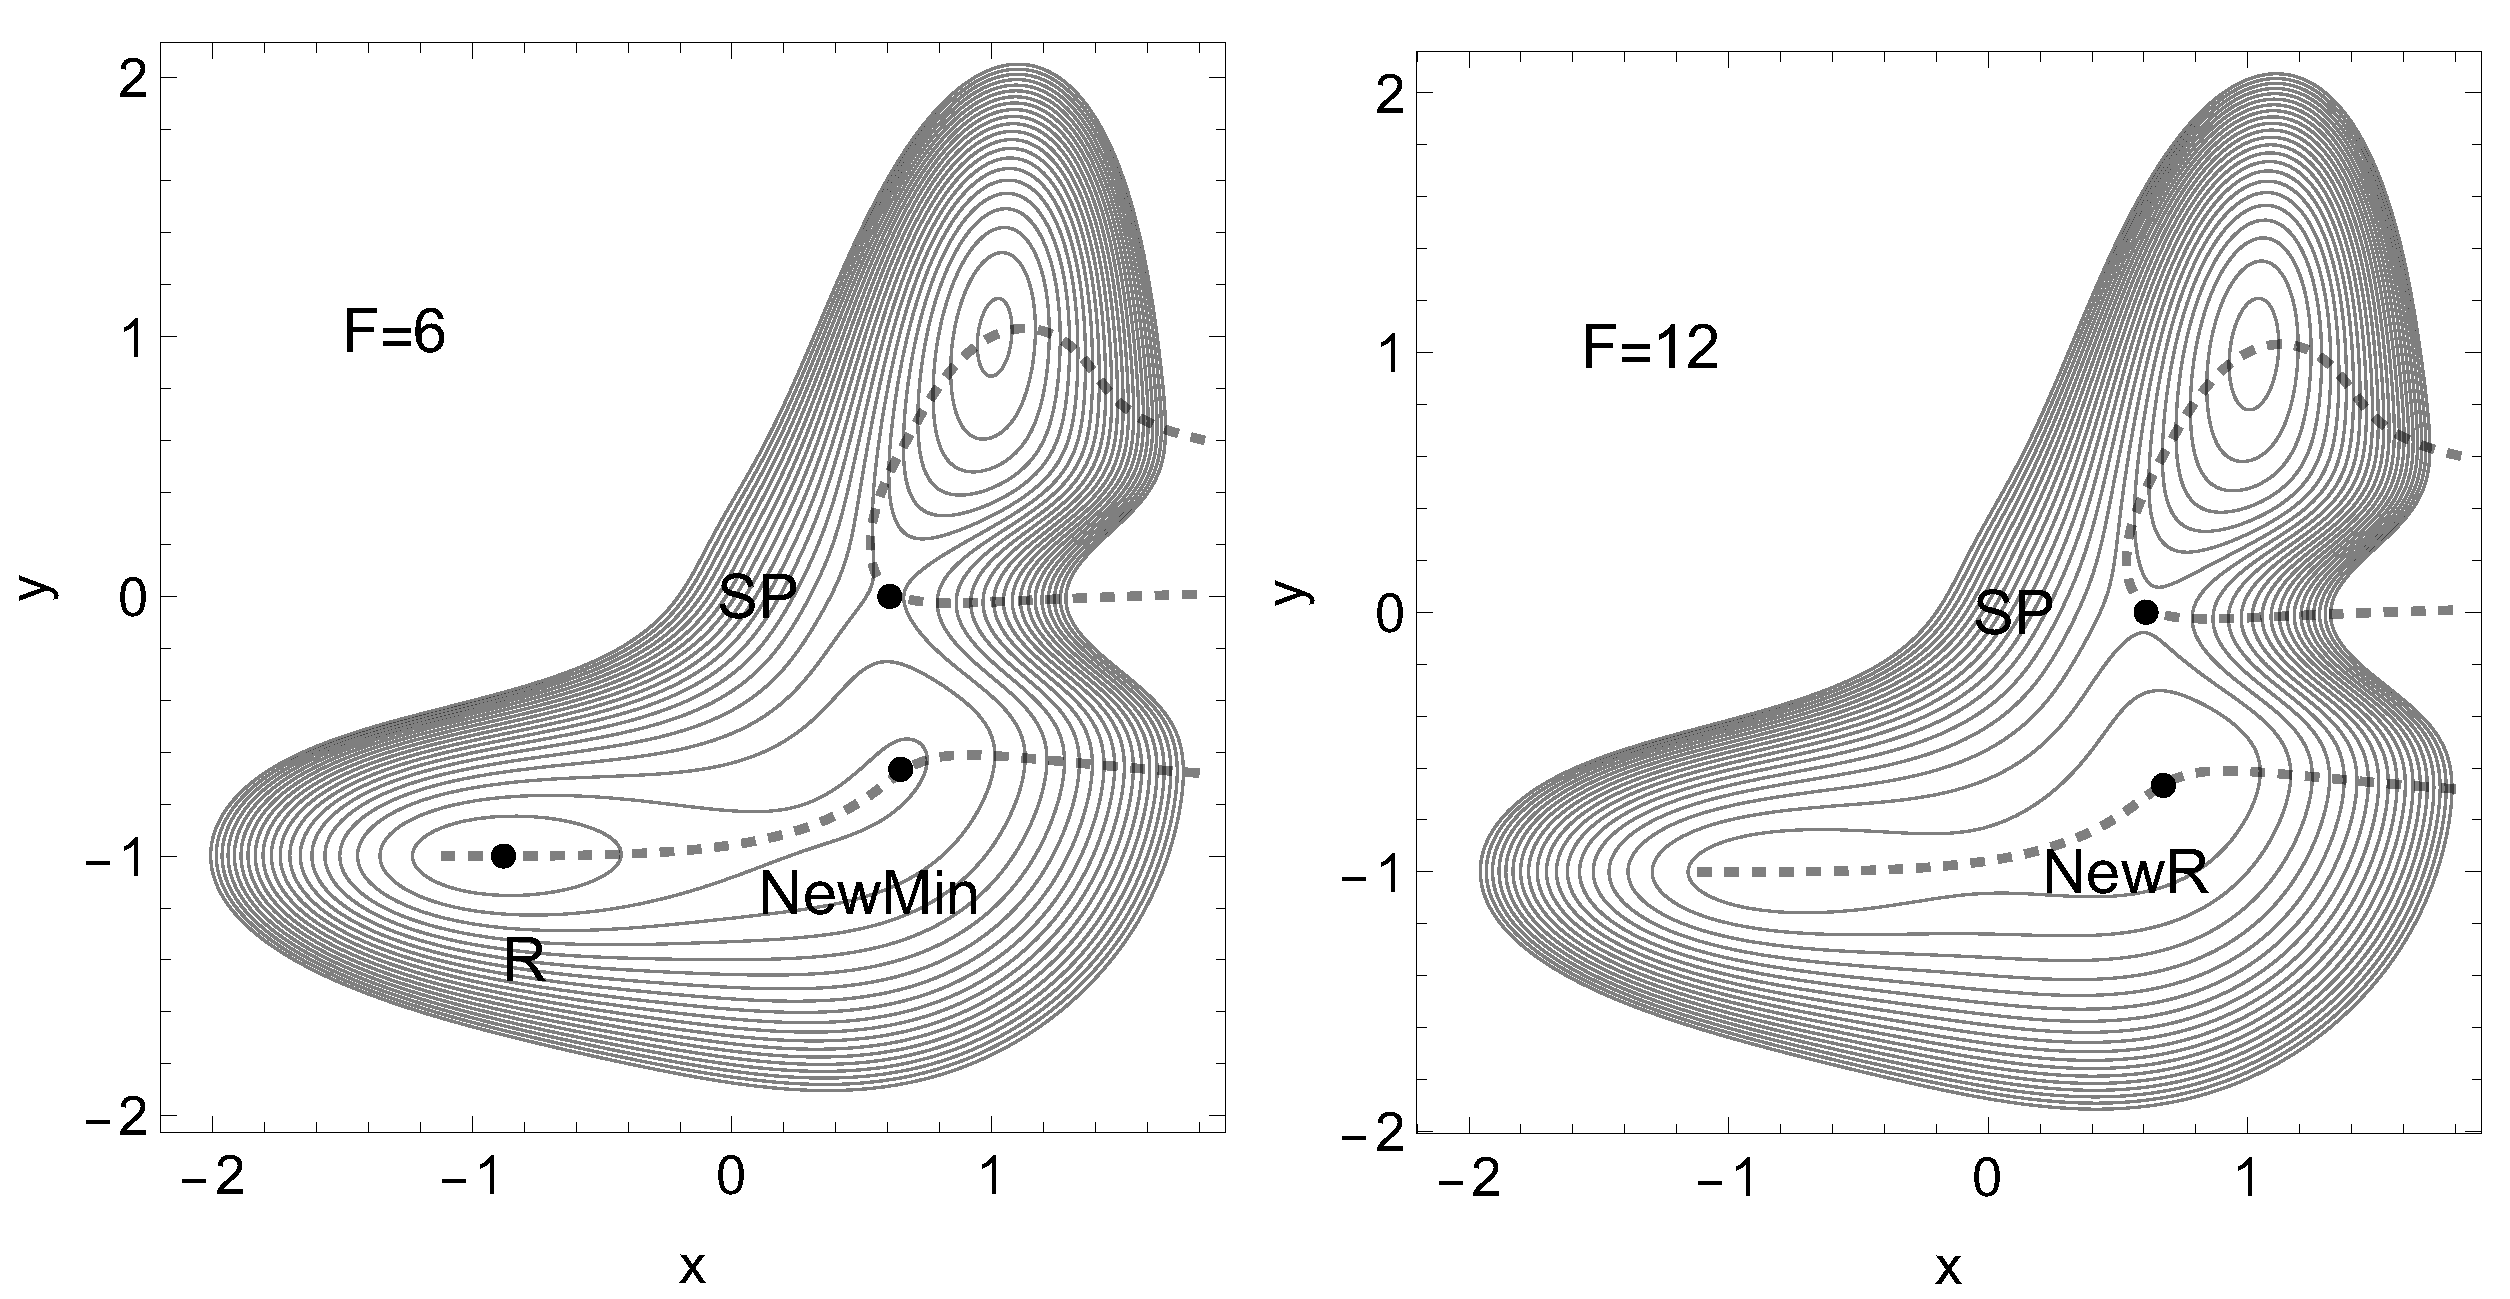
Figure 12.
Putative PES of P-selectin [5]. The TS of the dissociation limit is far outside the panel. The thickly dashed NT to direction (1, 1) is an NT with slip bond behavior like in E-selectin. The red line is the NT to direction (-1, 0), and the gray-black NT goes to direction (-1, 1). These NTs are given for comparison. The green curves are the lines of the PES.
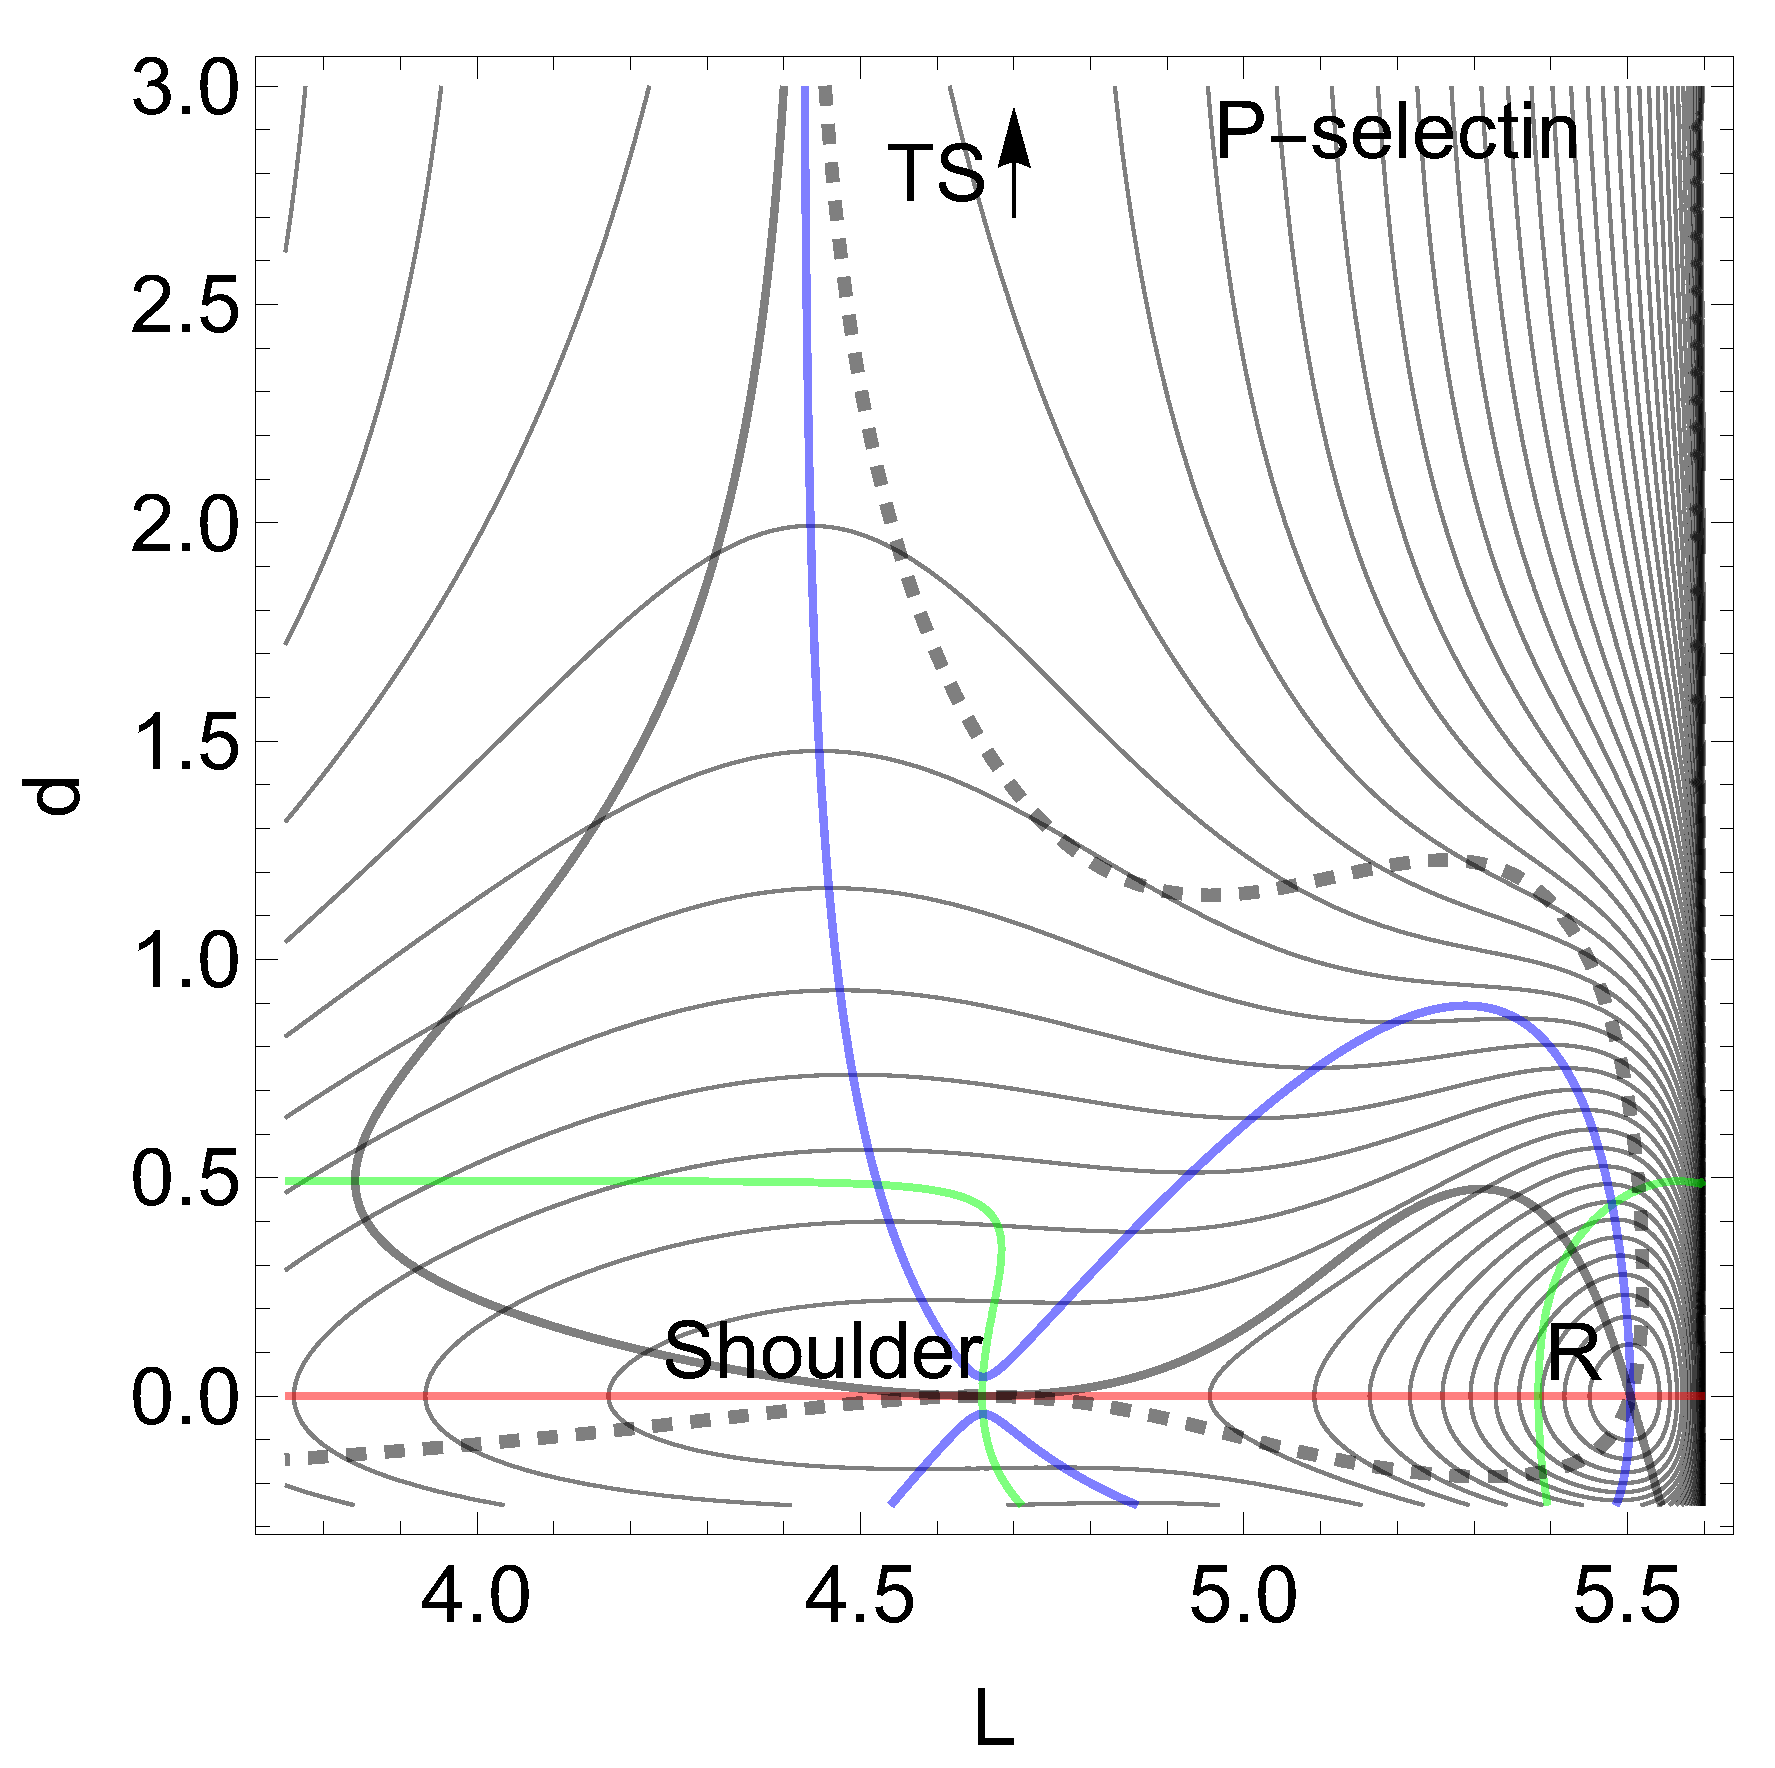
Figure 13.
PES similar to Figure 4 with NTs, dashed, red and blue as above. The difference is a Morse potential along the y-axis.
Figure 13.
PES similar to Figure 4 with NTs, dashed, red and blue as above. The difference is a Morse potential along the y-axis.
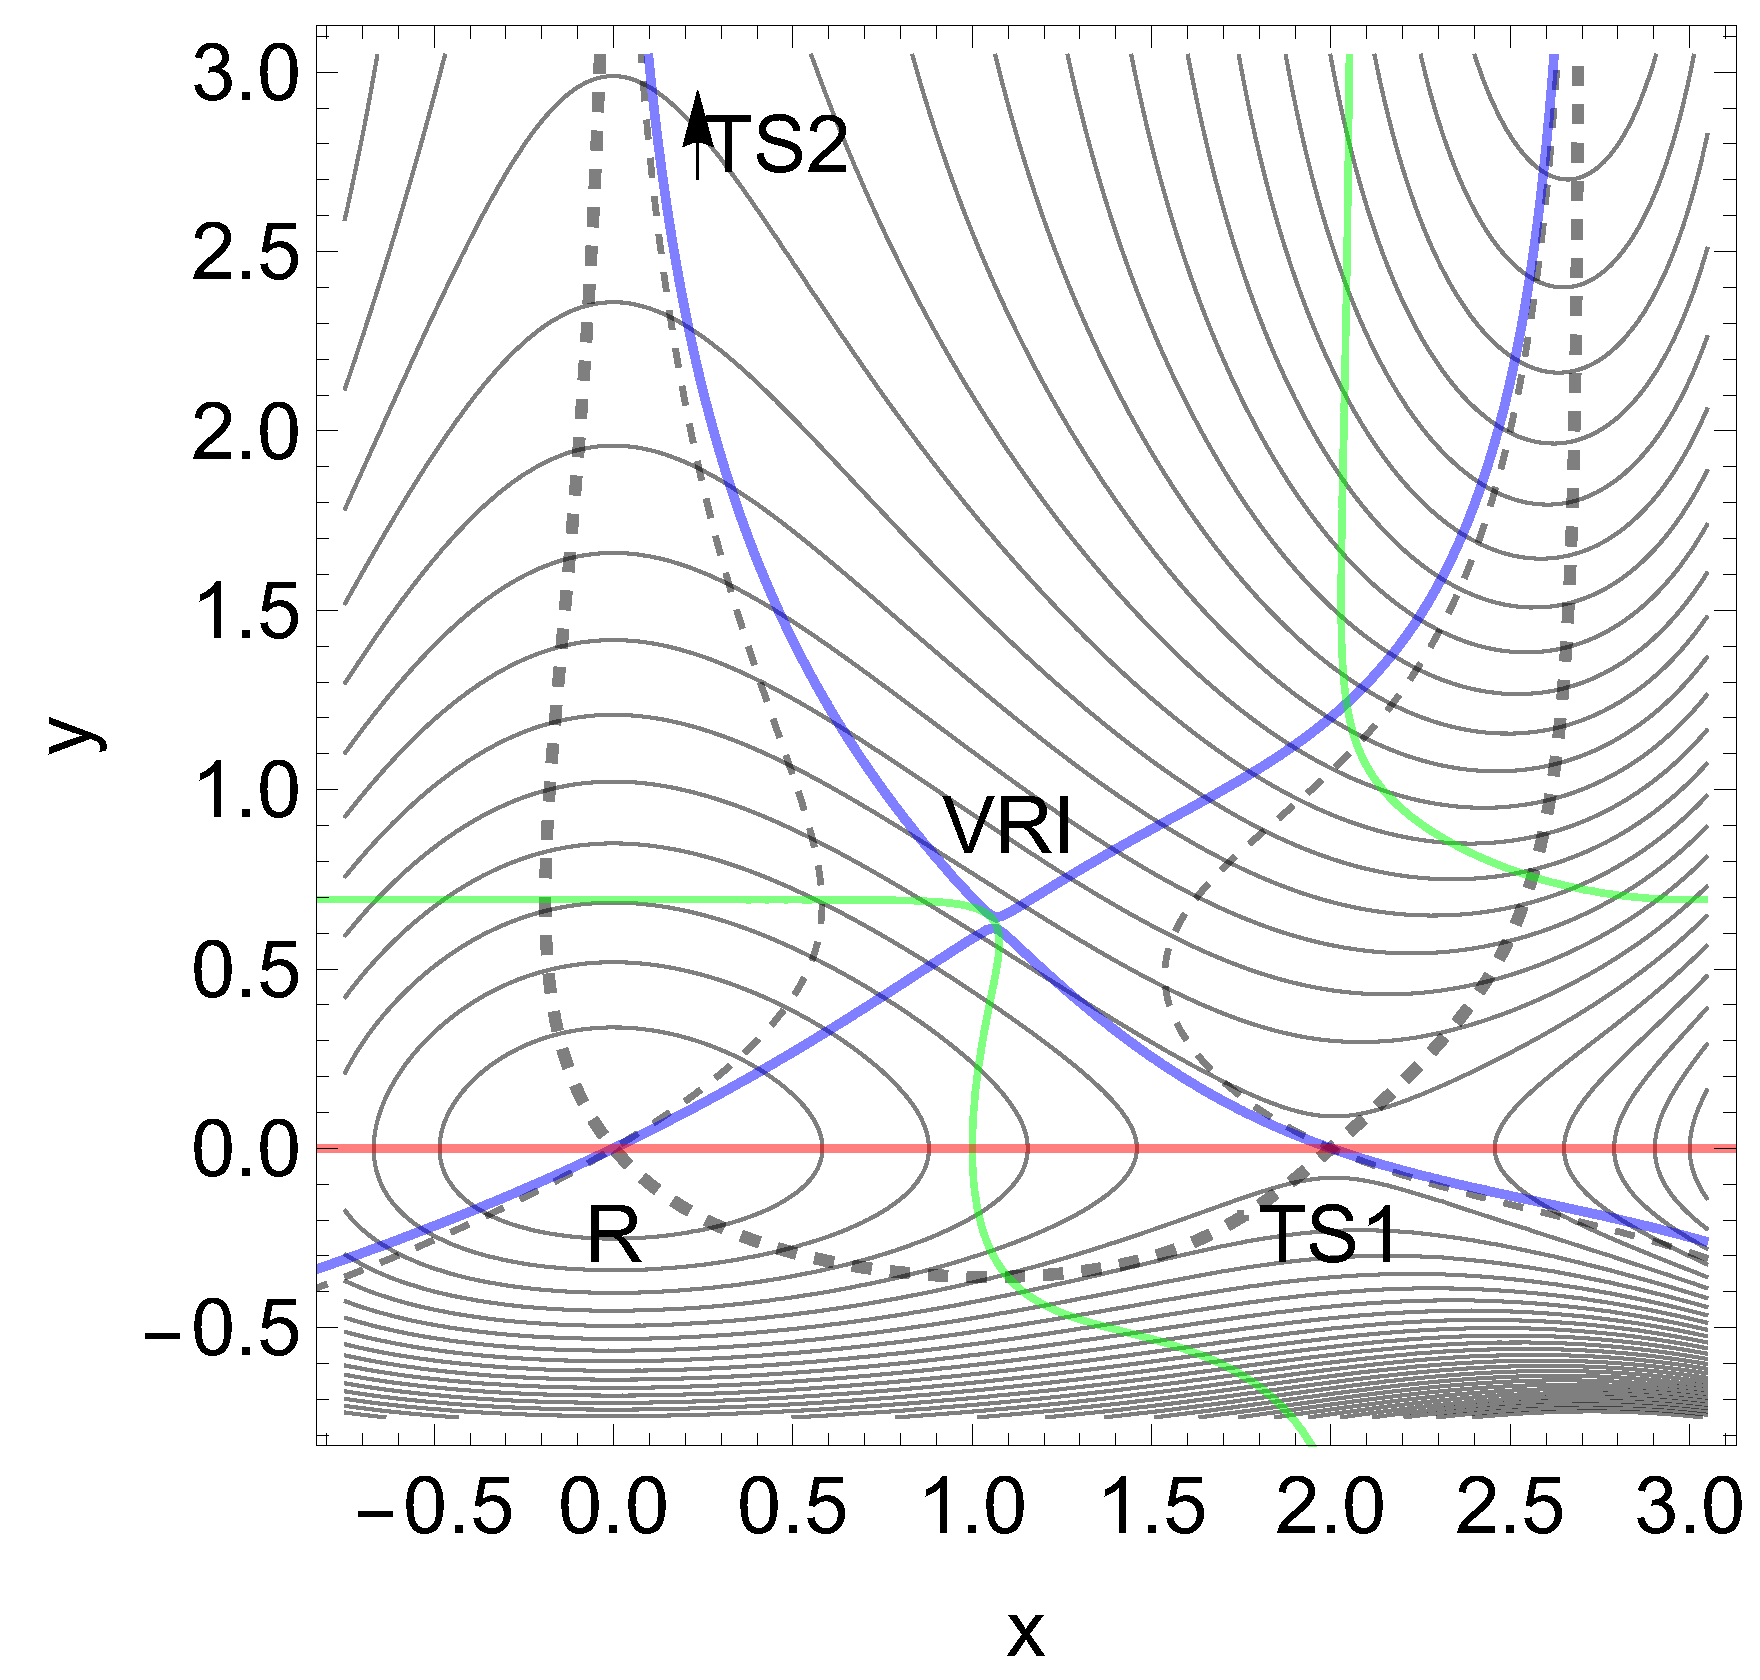
Figure 14.
Modified Wolfe-Quapp PES, see Eq. (12). Three NTs are given, see text. Two maximums arise here, M1 and M2. Note that the curvatures in y-direction are different in R and TS1 by a factor of .
Figure 14.
Modified Wolfe-Quapp PES, see Eq. (12). Three NTs are given, see text. Two maximums arise here, M1 and M2. Note that the curvatures in y-direction are different in R and TS1 by a factor of .
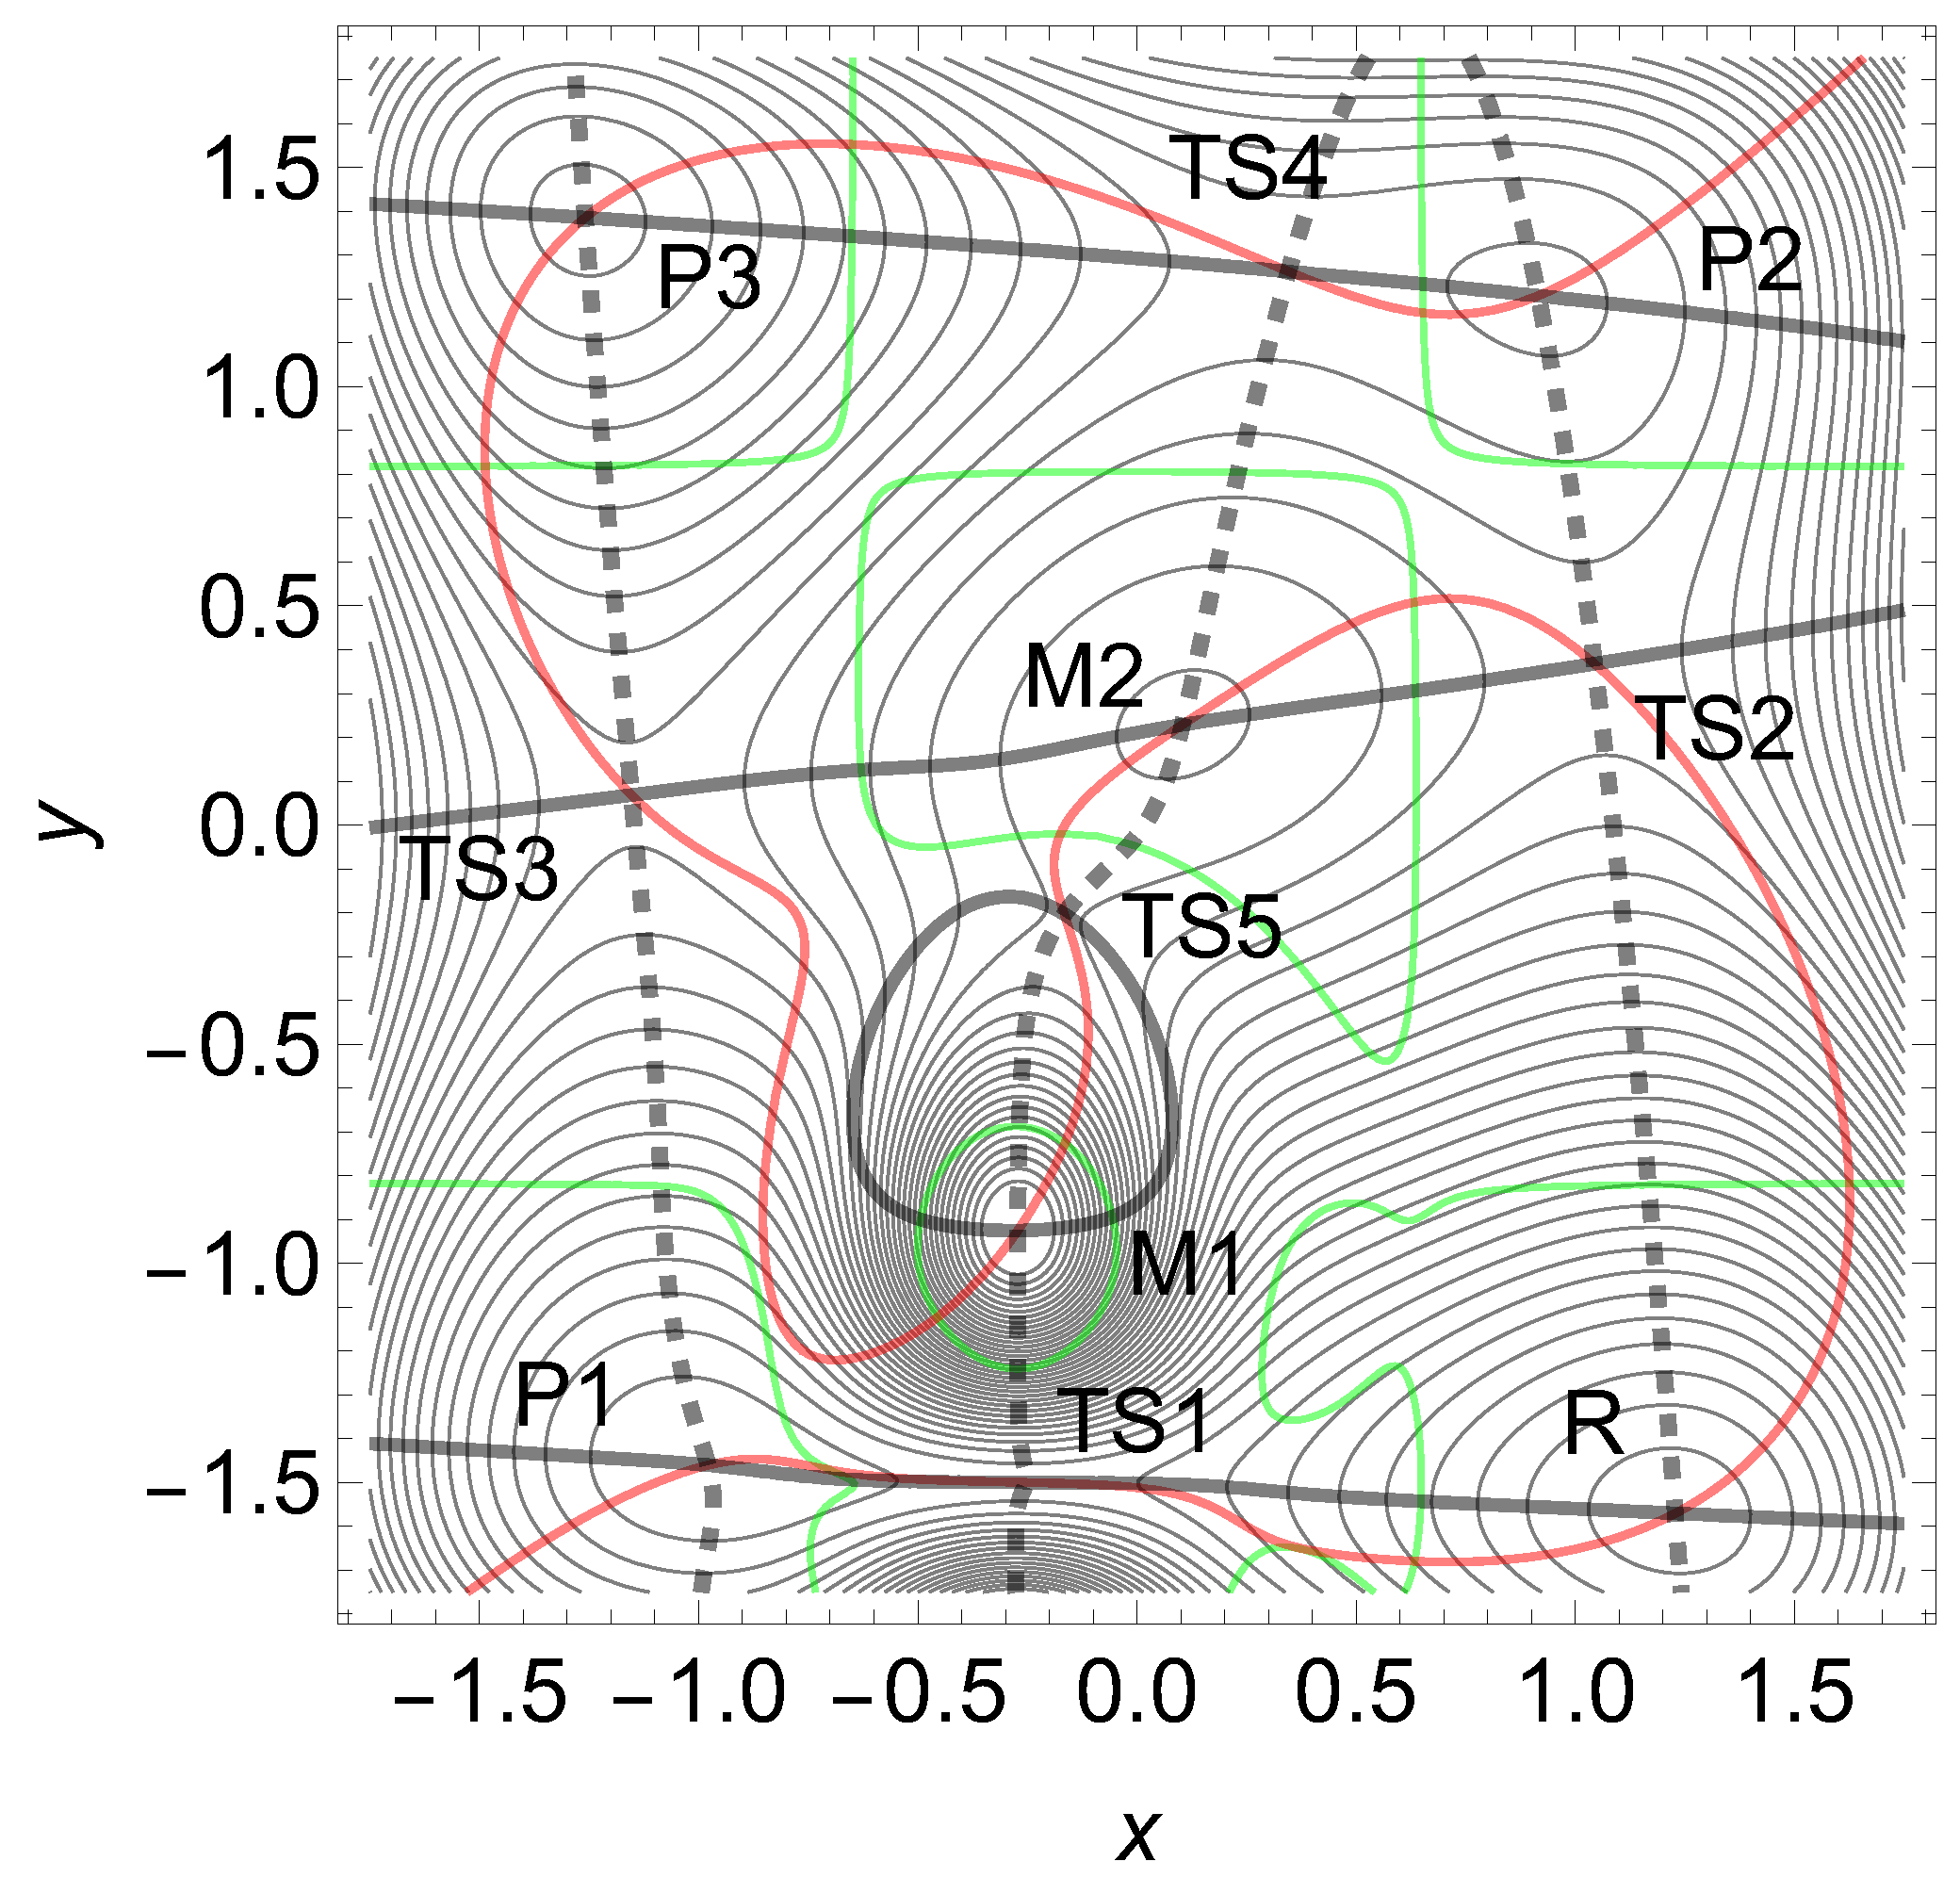
Figure 15.
Effective barriers between R and TS1 and R and TS2 (right) for y-excitation direction, on the PES with 4 minima of Figure 14. The two barriers swap roles and later TS2 disappears.
Figure 15.
Effective barriers between R and TS1 and R and TS2 (right) for y-excitation direction, on the PES with 4 minima of Figure 14. The two barriers swap roles and later TS2 disappears.
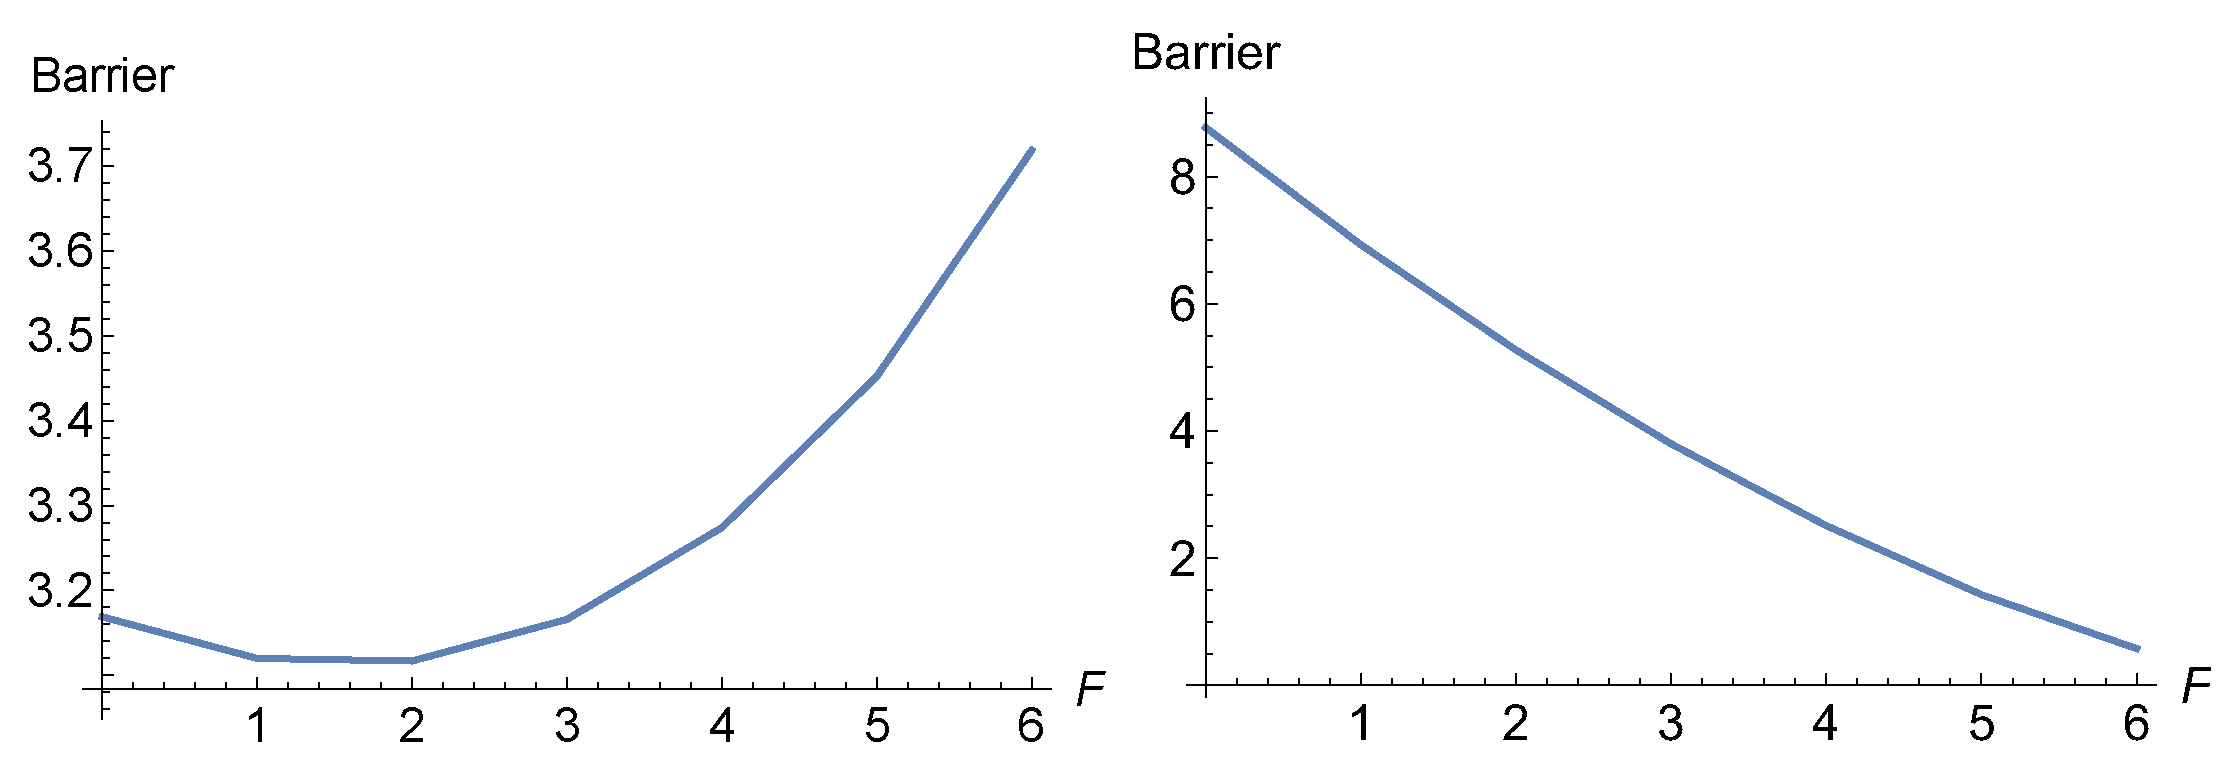
Figure 16.
Modified Wolfe-Quapp effective PES for . The dashed NT describes the movement of the stationary points in direction f =(0.075, 0.997). The TS2 slowly disappears.
Figure 16.
Modified Wolfe-Quapp effective PES for . The dashed NT describes the movement of the stationary points in direction f =(0.075, 0.997). The TS2 slowly disappears.
Disclaimer/Publisher’s Note: The statements, opinions and data contained in all publications are solely those of the individual author(s) and contributor(s) and not of MDPI and/or the editor(s). MDPI and/or the editor(s) disclaim responsibility for any injury to people or property resulting from any ideas, methods, instructions or products referred to in the content. |
© 2023 by the authors. Licensee MDPI, Basel, Switzerland. This article is an open access article distributed under the terms and conditions of the Creative Commons Attribution (CC BY) license (http://creativecommons.org/licenses/by/4.0/).
Copyright: This open access article is published under a Creative Commons CC BY 4.0 license, which permit the free download, distribution, and reuse, provided that the author and preprint are cited in any reuse.


