Submitted:
14 December 2023
Posted:
14 December 2023
You are already at the latest version
Abstract
To accurately identify high-quality functional wood with superior mechanical properties and enhance its durability, it is imperative to understand the relationships between the physical and mechanical attributes of diverse wood types. Presently, there exist issues related to accuracy, efficiency, and differentiation in studying these performance correlations. The Liang Kleeman (L-K) information flow theory, a causative analytical approach rooted in fundamental physics principles, offers swift computational capabilities. Furthermore, the coefficient of variation in L-K information flow quantitatively gauges the intensity of causal effects. Therefore, this article adopts a causal artificial intelligence perspective and introduces a wood performance analysis method based on L-K information flow.This study focuses on four Chinese fir varieties, including fast-growing Chinese fir (YKS), red heart Chinese fir (CSH, XXH), and iron heart Chinese fir (XXT). By computing and comparing variation coefficients of L-K information flow for various physical properties and their impact on mechanical properties, causal relationships between these properties are elucidated. These findings are then applied to predict wood mechanical properties, achieving a remarkable maximum accuracy of 90%.In the future, these findings will prove invaluable for the selection of high-quality wood and for improving the manufacturing process to prolong the service life of functionalized wood.
Keywords:
wood
; mechanical properties
; causal influence
; Liang-Kleeman information flow
; performance prediction
1. Introduction
Wood is an eco-friendly material that is both renewable and biodegradable. It has a multilevel hierarchical structure and excellent anisotropy, as well as a wide range of chemical properties[1]. These features have drawn much attention from researchers and scholars. However, as demand grows for sustainability and durability, the precise screening and enhancement of wood properties has become an important research issue. Functionalised wood, which involves enhancing the physical and chemical properties of wood, offers an effective solution to meet this demand. To achieve high-quality preparation of functionalised wood, it is crucial to possess a profound comprehension of the differences in the correlation between the physical and mechanical properties of various wood species[2].
However, correlating wood properties poses several challenges in current research. Traditional methods are often inaccurate and inefficient, failing to distinguish between various wood species[3,4]. Moreover, research on wood properties has been predominantly limited to wood density, neglecting other crucial physical properties of wood[12]. In recent years, researchers have sought to use advanced data science and artificial intelligence techniques to enhance the prediction and optimization of wood properties, in order to tackle these issues. Among these methods, the Liang-Kleeman (L-K) theory of information flow is a persuasive causal analysis tool. It is founded on the principle of physical first nature, and is fast to compute and capable of explaining the impact of various factors on wood properties from a microscopic viewpoint. The method's uniqueness lies in its quantitative characterization of the strength of causal influences through the coefficient of variation of information flow, thereby facilitating a comprehensive understanding of the formation mechanism of wood properties.
In this context, this article proposes an innovative causal analysis method for wood performance. Based on the L-K information flow theory and from the perspective of causal artificial intelligence, the study focuses on the different physical and mechanical correlation differences of four types of Chinese fir: fast-growing Chinese fir (YKS), red heart Chinese fir (CSH, XXH), and iron heart Chinese fir (XXT). The physical property indicators include wood basic density, air dry (radial, tangential, volume) shrinkage The total dry (radial, tangential, volumetric) shrinkage rate and mechanical property indicators include tensile strength, compressive strength, flexural modulus of elasticity, and flexural strength. By calculating and comparing the variation coefficients of L-K information flow of different physical properties on mechanical properties, the aim is to reveal how the physical properties of different wood varieties affect their mechanical properties, and further elucidate the regularity of these causal correlations. Finally, this article establishes a linear function with physical properties as the independent variable, mechanical properties as the dependent variable, and causal influence intensity as the coefficient, and uses the obtained physical and mechanical performance correlation conclusions for performance prediction. The highest prediction accuracy reaches 90%, further verifying the correctness of these causal correlation laws. In the future, these research results will also provide important guidance for screening high-quality wood and improving preparation processes, with the potential to significantly extend the service life of functional wood and promote the sustainable development of the wood industry. In addition, this method also provides an interesting demonstration for cross disciplinary research in the fields of materials science and artificial intelligence, emphasizing the potential of causal analysis based on theoretical principles in solving complex problems.
The paper's main contributions are:
(1) For the first time, the Liang Kleeman information flow, a causal characterization tool, was applied to the causal correlation analysis of wood physical and mechanical properties. The proposed method efficiently and accurately achieved causal differentiation analysis of physical and mechanical properties of different varieties of Chinese fir. The conclusions drawn have important guiding significance for the prediction of wood mechanical properties, with a prediction accuracy of up to 90%;
(2) Quantitatively describe the causal influence intensity between different physical and mechanical properties of wood through the coefficient of variation of L-K information flow, and demonstrate the magnitude relationship of causal influence intensity between different physical and mechanical properties more clearly by constructing a causal directed graph model;
(3) A theory based on information flow t line graph was proposed to determine the positive, negative, and relative magnitude of its coefficient of variation, providing guidance for real-time performance correlation analysis.
2. Related work
For the Liang-Kleeman technique of information flow, which is commonly applied in causal analysis, the transfer of information per unit time between two time series with no prior knowledge is used to quantitatively measure the causal effect between them[5]. Information flow is primarily employed in the context of identifying causes. Currently, information flow is mostly employed during the stage of cause identification, and several researchers and scholars utilize information flow causal analysis to predict causes. Literature[6] employed the causal analysis method based on the information flow theory to investigate the causal relationship between the Atlantic Multidecadal Oscillation (AMO) and surface heat fluxes in the North Atlantic Ocean since 1880. Results indicated that the information flow from the AMO to surface heat fluxes is significantly greater than the opposite direction at the multi-year intergenerational scale. These findings suggest that the AMO is responsible for the anomalies observed in the North Atlantic Ocean, indicating that the heat exchanges between the oceans and the air are predominantly driven by the oceans. The Liang-Kleeman information flow theory is employed to scrutinise the causal association between precipitation and landslide debris flow hazard. This approach yields a high accuracy rate for landslide debris flow hazard prediction[7]. Meanwhile, subsequent studies[8] have established a causal linkage model for autism spectrum disorders based on a Liang-Kleeman information flow theory. Also, multi-scale Liang-Kleeman information flow has detected a causal relationship from solar radiation to ocean heat content[9,10].
There are three primary research approaches to correlation analysis of wood performance, including correlation-based, data-driven, and multi-scale causal modelling-based techniques. The study examined the physico-mechanical properties of various types of eucalyptus and fir trees through correlations[3,4,11]. To enhance plant recognition, a convolutional neural network (CNN) backbone was employed as a feature extractor for images and recurrent neural network (RNN) units were used to create multi-view features for each image, resulting in increased accuracy[14]. A deep learning model was developed to screen semiconductor energy storage materials for high-precision bandgap, the results achieved a significant increase in computational speed[15]. A mirna-disease association prediction algorithm based on graph convolutional neural network and principal component analysis (GCNPCA) was proposed[18]. An algorithm for classification and identification based on mahogany microstructure is suggested, investigating the mahogany species identification method from multiple perspectives including multi-dimensional texture feature fusion, convolutional neural network, and tubular pore features. which can achieve intelligent classification and identification of mahogany, and enable systematic decision-making by automated experts[23]. Literature[25] applied two machine learning techniques and the interval evidence inference rule to industrial particleboard production. The focus is on building a particleboard performance prediction model to enable online monitoring of board performance during production and intelligent feedback control of the process. This will lay the foundation for achieving these goals.
In this paper, we apply the Liang-Kleeman information flow, a causal characterization tool, to analyse the causal correlation between physical and mechanical properties of wood. We differentiate the physical and mechanical properties of different species of fir with high efficiency and precision using this method. The conclusions drawn are valuable for improving the utilization efficiency of fir and for the directional cultivation of functionalized wood. This marks the first time the Liang-Kleeman information flow has been used for a causal correlation analysis of wood properties. Compared to the correlation-based analysis method, this approach commences the study from three dimensions: species, physical properties, and mechanical properties. This affords a more intricate research area resulting in more significant conclusions. Unlike other data-driven approaches, this method requires no substantial training data sets and avoids overfitting issues. Furthermore, the L-K information flow features rapid calculation and efficient performance analysis. The coefficient of variation based on the information flow is favourable for a more efficient utilisation of cedar wood. The coefficient of variation of the information flow is useful to compare the strength of causal influence among various physico-mechanical properties. The L-K information flow-based causal analysis method possesses exceptional transferability and can also be applied in examining the properties of other types of woods.
3. Related theory
3.1. Liang-Kleeman information flow
Liang-Kleeman's theory of information flow is a quantitative approach to analyzing causality based on information entropy. It differs from traditional empirical and semi-empirical statistical models and is a strictly deduced quantitative causality theory from the first principle of physics. The transmission of information from one entity to another is considered the information flow. According to the zero-causality criterion[34], an information flow must exist behind a pair of causal relationships. The L-K information flow method can quantitatively represent the causal relationship between two time series X1 and X2 by measuring the information transfer per unit of time between them. This assumes that there is no relevant a priori knowledge of the two time series X1 and X2. However, the significance of L-K information flow exceeds its implied causality, propagation of uncertainty, and transfer of predictability. Its applications span across several fields, including neuroscience, finance, climate science, turbulence studies, network dynamics, and dynamical systems, particularly in the realm of synchronization[35].
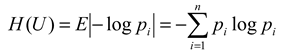
In a source, it is not the uncertainty of the occurrence of a particular individual symbol that is considered, but the average uncertainty of all possible occurrences of this source. If the source symbol has n values: ... ... , the corresponding probability is: ... ... , and the various symbol occurrences are independent of each other. At this point, the average uncertainty of the source should be the individual symbol uncertainty -log The statistical average (E), which can be called the information entropy, i.e.
Consider 2D autonomous systems
where F=( , ), x = ( ) Ω.
Suppose the sample space Ω is the direct product of Ω1 and Ω2. Let {x,t} be a stochastic process and x=() be the randomized process corresponding to (,) the random variable, p=p(,t) be the probability density distribution at t. The The joint information entropy of is formulated as:
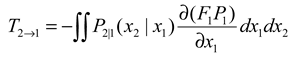
So, from to the information entropy transfer rate, i.e., the L-K information flow[34] is:
If the random variable the n-dimensional vector obeys a stochastic dynamical system
dx = Axdt + Bdw
where A=(aij),B is a constant matrix representing random white noise and if its covariance matrix is ( ),then for any i,j=1,...... ,n,i≠j,from to the L-K information flow is
included among these
:==,
is the covariance matrix between and for two-dimensional variable,],
is the variance of .
Definition 3.1 Causal effect (CE): For a causal pair If the increase/decrease of increase/decrease of the causal pair, i.e., the covariance is positive, then the causal effect of is positive, then the causal effect is positive; conversely, if the rise/fall of the rise/decline of the covariance leads to a rise/decline of the rise/fall of the causal effect leads to the rise/fall of the causal effect, i.e., the covariance is negative, then the causal effect of the causal effect is negative.
On the flip side, L-K information flow refers to the speed of the transfer of information entropy, while causal influence denotes the directionality of information entropy transfer for causal pairs. As a result, the intensity of causal association can be quantified using L-K information flow. However, the flow of L-K information for various causal pairs operates on different scales. Therefore, a large L-K information flow does not necessarily indicate a significant causal strength. Additionally, the degree of dispersion is unrelated to the scale of the flow. Thus, the degree of dispersion of the L-K information flow per unit time is a suitable quantitative metric for describing causal strength.
Definition 3.2 Coefficient of Variation (CV): CV is the ratio of the standard deviation of the original data to the mean of the original data. By calculating the coefficient of variation of the original data can eliminate the differences in the scale of measurement and the influence of the scale, and better describe the degree of dispersion of the variable. Its calculation formula is as equation (6):
where denotes the standard deviation and AVG denotes the mean.
In this paper, we introduce the use of "CV" to denote the discrete degree of information flow from L-K. Subsequently, the magnitude of CV of the L-K information flow can describe the strength of causal influence. By calculating the coefficient of variation (CV) of L-K information flow from various physical properties to mechanical properties, we can arrive at different causal influence strengths between different physical and mechanical properties.
In summary, the guidelines for establishing causality in the L-K information flow are:
(i) The existence or non-existence of L-K information flow can establish the presence of a causal connection between variables; (ii)
(ii) The positive and negative indicators of the coefficient of variation of L-K information flow can establish the positivity or negativity of the causal impact between variables.
(iii) The intensity of causal influence can be quantitatively described by the magnitude of the absolute value of the coefficient of variation of the L-K information flow.
3.1. CDG model
Causal Directed Graph (CDG) is a causal network graph composed of nodes and directed edges between them. It is a quantitative model which utilizes the lines connecting nodes to express causal relationships between variables in a system. The directed edges are assigned weighted values, which represent the intensity of causal influence between the variables. These values are also known as the coefficient of variation of the information flow. CDG is capable of encompassing large-scale potential information in the system. Below is a mathematical explanation of the CDG model.
Definition 3.3: CDG Model: The CDG model is a directed graph and a function which is a combination of = ( ). where:
(1) Directed graph consists of 4 parts = (, , and):
(A) set of nodes ;
(B) Branch collection ;
(C) Neighborhood associators "". (start node of a branch) and "": (the terminating node of the branch), which represent the start node and terminating node of each branch, respectively "" and termination node "". The start node and the termination node of a branch constitute a causal pair (CP:causal pair), denoted as CP=( , ).
(2) Functions : , is called the branch The symbols of ( ). If is positively causal, then =+, otherwise =. In the CDG model, positive causality is represented by a solid line and negative causality is represented by a dashed line.
There are three nodes in Figure 1 , the . , in the CDG model, the branch e = ( , ) has a sign determined by the ) is determined by the positivity and negativity of ). Since CV( > 0, so , the branch is represented in the CDG model by the solid line state of the branch; since CV( < 0, so , a dashed line is used in the CDG model to represent the branching The CDG model can also be used to represent the state of a branch by comparing and The branch can also be derived by comparing the magnitude of the absolute values of the coefficients of variation of the branch and the magnitude of the CE intensity between them.
4. Experiment
Four species of fir were chosen for this study: fast-growing fir (YKS), two types of red fir (CSH, XXH) and hemlock (XXT). YKS was sourced from Yangkou Town, Guangfeng District, Shangrao City, Jiangxi Province and had an average age of 53 years and an average diameter at breast height (D. B. H.) of 47. It is important to note that all technical term abbreviations will be explained upon first use. 5 cm, CSH and XXH were collected from Chenshanyuan, Liuyang City, Changsha City, Hunan Province. The trees had an average age of 51.50 years and an average diameter at breast height (DBH) of 29.5 cm and 30.8 cm, respectively. XXT was obtained from Xiaoxi, Jingning County, Qingyuan County, Lishui City, Zhejiang Province. The trees had an average age of 53 years and an average DBH of 26.6 cm. For basic information on these four fir species, please see Table 1.
Wood density is among the most crucial indicators of wood properties and has a strong correlation with physical and mechanical properties, directly impacting the wood's bending, compressive and tensile strength. It also plays a significant role in determining the physical and mechanical properties and process properties of wood. Dry shrinkage is a crucial wood property, whereby the radial and chordal rates of dry shrinkage are predominantly responsible for causing wood cracks and warping. The mechanical properties of wood, which refer to its ability to resist external forces that change its size and properties, are crucial in determining the rational utilization of wood. This paper investigates the smooth grain tensile strength, flexural modulus of elasticity, bending strength, and compressive strength of smooth grain wood. Table 2 presents the basic density, air-dry chordwise and radial shrinkage, air-dry volumetric and differential shrinkage, as well as full-dry chordwise and radial shrinkage, and full-dry volumetric and differential shrinkage. The nine categories of physical properties for lumber are identified in Table 3 along with their respective abbreviations. The four categories of mechanics for smooth grain lumber are listed in the abridged table. They include tensile strength, bending modulus of elasticity, flexural strength, and compressive strength.
Nine physical properties and four mechanical properties of four fir trees, YKS, CSH, XXH, and XXT, were collected and calculated at various intervals to generate the dataset for this experiment. The means of the 13 physical and mechanical properties of the four fir trees are presented in Table 4.
The mean values and coefficients of variation for the L-K information flow of nine physical properties (e.g. basic density) to conformal tensile strength, flexural elasticity model, flexural strength, and conformal compressive strength were calculated, and the results were recorded in Tables 5 to 8. Abbreviations for technical terms are explained upon first use. The language used is formal and value-neutral. The text adheres to structure and clarity principles while avoiding filler words and complex terminology.
From Table 5, the following conclusion can be drawn: from a local perspective, for the L-K information flow WBD → SPG, the causal impact of WBD on SPG is significantly greater for red cedar CSH and XXH; For the L-K information flow ASV → SPG, ABST → SPG, ABSR → SPG, the causal impact of ASV, ABST, and ABSR on SPG of Taxus chinensis XXT is significantly greater, with ABST having the greatest causal impact on the SPG of Taxus chinensis. Overall, ASTA has the greatest impact on SPG in CSH, WBD has the greatest impact on SPG in XXH, and ABST has the greatest impact on SPG in XXT. In addition, except for the negative impact of air dry/full dry differential shrinkage on SPG, other physical properties have a positive causal effect on the tensile strength along the grain.
To clearly present these conclusions, we have constructed a causal directed graph (CDG) model. This model includes edge nodes for physical property variables and center nodes for mechanical property variables. The directed edges are represented by solid and dashed lines, reflecting positive and negative causal influence between node variables respectively. The weighted values assigned to each directed edge reflect the strength of the causal influence between physical and mechanical properties. To avoid confusion, technical term abbreviations are spelled out upon first use. The values assigned to the oriented edges indicate the degree of causal influence between physical and mechanical properties. Figure 2 illustrates the causal directed graphs of smooth grain tensile strength (SPG) in relation to various physical properties of wood.
From Table 6, it can be concluded that locally, for the L-K information flow ASV → MEB, ABST → MEB, ABSTA → MEB, and the ABST of redwood XXH, the causal impact of ASV on MEB is stronger. Overall, for different varieties of Chinese fir trees, the causal effects of the different physical properties of XXH on MEB are significantly different. In addition, the causal effects of ABST on MEB are most significant in the CSH of Chinese fir; For different physical properties, ABST has the greatest causal effect on MEB in Chinese fir. In addition, except for the negative impact of air dry/full dry differential shrinkage on MEB, other physical properties have a positive causal effect on MEB. Figure 3 is a causal directed graph of the flexural modulus of elasticity (MEB) and different physical properties of wood.
From Table 7, it can be concluded that for the L-K information flow ASV → BS, the ASV of Tiexinshan XXT has the greatest causal impact on BS; For the L-K information flow ASTA → BS, the ASTA of fast-growing fir YKS has the greatest causal impact on BS; For the L-K information flow ABST → BS, ABSV → BS, and the ABST of Redwood CSH, ABSV has a greater causal impact on BS; For the L-K information flow ABSTA → BS, redwood XXH has the greatest negative causal impact. For different physical properties, overall, ASTA has the greatest impact on BS in Chinese fir. In addition, except for the negative impact of air dry/full dry differential shrinkage on BS, other physical properties have a positive causal impact on BS. Figure 4 is a causal directed graph of the relationship between bending strength (BS) and different physical properties of wood.
From Table 8, the following conclusion can be drawn: locally, for the L-K information flow ASV → CSP, the causal effect of Tiexinshan XXT is significant; For the L-K information flow ASTA → CSP, the causal effect of fast-growing fir YKS is significant; For the L-K information flow ABST → CSP, ABSV → CSP, and fast-growing fir YKS, the causal effect is greater. Overall, for different varieties of Chinese fir, ABST in YKS has the greatest causal effect on CSP, WBD in CSH has the greatest causal effect on CSP, ABSR in XXH has the greatest causal effect on CSP, and ABSR in XXT has the greatest impact on CSP; For different physical properties, overall, ABSR has the greatest causal effect on CSP in Chinese fir. In addition, except for the negative impact of air drying/full drying differential shrinkage on CSP, other physical properties have a positive causal effect on CSP. Figure 5 is a causal directed graph of compressive strength along grain (CSP) and different physical properties of wood.
After conducting numerous experiments, it was discovered that the information flow-t line graph can be used to estimate the positivity, negativity, and size of the coefficient of variation. This enables us to quickly compare the intensity of causal influence through real-time observation of how the information flow curve changes during the industrial process. As a result, the efficiency of causal analysis is improved. In Figures 6 to 9, the Figure “a” displays the peak value and opening direction of L-K information flow, while the Figure “b” provides an enlarged view of L-K information flow during violent oscillation. The Figure “c” also shows an enlarged view of L-K information flow when it reaches a stable state, allowing for identification of positive and negative signs of L-K information flow.
Without outside factors affecting it, L-K information flow model will tend towards the 0-axis and remain stable over time. As the standard deviation is consistently positive, we can determine the positive or negative sign of the coefficient of variation based on the positivity or negativity of the mean, indicating the causal influence. For instance, the evaluation may depend on whether the L-K information flow is oscillating violently above or below the 0-axis. In Fig. 6a, the information flow from ASR to MEB is above the 0-axis with a coefficient of variation of 5.480 (refer to Table 6), and the information flow from ASTA to MEB is below the 0-axis in Fig. 7a with a coefficient of variation of -40.079.
When the line graphs depicting the information flow are in a similar state, where the information flows are either all positive or all negative in the beginning (as illustrated in Figure 7 and Figure 8), the coefficient of variation values can be preliminarily assessed by the magnitude of the extreme values of the L-K information flow. For instance, in the third second, the information flow from ASTA to MEB in Figure 7a attained the utmost value of -89.610, while the information flow from ASTA to BS in Figure 8a reached the extreme value of -121.654. Correspondingly, their coefficients of variation are -19.507 and -40.079, respectively, as shown in Table 6 and Table 7.
When the L-K information flow partially crosses the 0-axis before converging to 0, it is possible to assess the positivity or negativity of the coefficient of variation by comparing the relative sizes of the larger and smaller values of the information flow. It should be noted that upon first use, technical term abbreviations will be explained. For example, in Figure 9b, the information flow from ABST to CSP reaches a significantly low value of -1.832 in the 3rd second and a considerably higher value of 10.562 in the 4th second. As the absolute value of the latter is greater than that of the former, it can be inferred that the coefficient of variation is larger than 0. Referring to Table 8, the coefficient of variation for the information flow from ABST to CSP is 13.012.
When the difference between the greatest and smallest values of the information flow in the information flow-t line graph is small (i.e. the amplitude of oscillation is small), and the change is relatively smooth with no sudden changes in Figs. 5, 6, and 7, it can be inferred that the absolute value of the coefficient of variation is minimal, indicating the weak strength of the causal influence. As illustrated in Figure 10a, the information flow is above the 0-axis, with a small difference between the maximum and minimum values, and a small amplitude of oscillation. From this, it can be deduced that the coefficient of variation of the information flow from ABST to BS is a positive number, with a very small value. Table 7 confirms that the coefficient of variation of the information flow from ABST to BS is 0.099.
From Figure 11, it is evident that diverse L-K information flows exhibit varying degrees of dispersion, indicating dissimilar coefficients of variation. Since L-K information flow tends to stabilize after 15 seconds, we can observe the discrete levels of information flow between 0-15 seconds to preliminarily assess the coefficient of variation of the L-K information flow. By doing so, we can derive the relationship between the different physical properties' causal influence on mechanical properties. According to Figure 11, in the 0-15 second interval, the L-K information flow with the highest magnitude of CV for YKS is AST→BS (black), which is negative. This is followed by AST→BS (green), ASR→BS (blue), WBD→BS (red), and ASV→BS (magenta). The information flows AST→BS, ASR→BS, WBD→BS, and ASV→BS have positive CV values. Checking Table 7, the coefficient of variation (CV) values for the L-K information flow AST→BS, AST→BS, ASR→BS, WBD→BS, and ASV→BS are -40.079, 3.087, 2.690, 1.816, and 0.632, respectively. These values exhibit the same magnitude relationships and signs as those deduced from the information flow-t line graph.
Based on the above data analysis results, it is assumed that there is a linear mapping relationship between the four mechanical properties and the physical properties that have the greatest causal impact:
Where Y represents the mechanical properties, X=(X1... Xn) represents the one-dimensional vector of the physical properties, a=(a1... an) corresponds to the coefficient of variation of the L-K information flow, and b is a constant.
According to the constructed CDG model (Figure 2-5), the key physical properties that affect SPG are ABST and WBD, the key physical properties that affect MEB are ABST, the key physical properties that affect BS are ASTA, and the key physical properties that affect CSP are ABSR. Calculate the average values of key physical properties (WBD, ASTA, ABST, ABSR) and mechanical properties (SPG, MEB, BS, CSP) of four types of Chinese fir trees, as shown in Table 9.
Based on the mean data in Table 9 and the causal influence coefficients corresponding to key physical properties in the CDG model, the following quantitative prediction linear function for mechanical properties can be obtained:
- (1)
- SPG=15.032*ABST+12.771*WBD+8.119
- (2)
- MEB=65.303*ABST+10198.394
- (3)
- BS=﹣9.384*ASTA+115.678
- (4)
- CSP=21.274*ABSR﹣8.426
In order to validate the proposed performance prediction function, this article measured the mechanical and physical property data of four types of ordinary shirt trees. Table 10 records the sample situation of ordinary Chinese fir, while Table 11 records the average of its physical and mechanical properties.
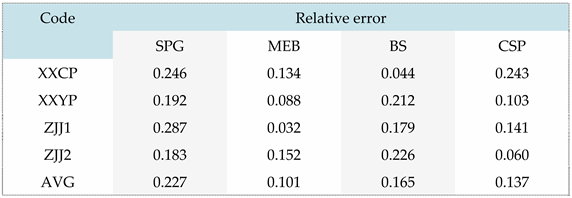
Based on the linear function predicted by the above mechanical properties, the mechanical properties of four types of ordinary shirts were predicted. The predicted results are shown in Table 12 and Table 13, which record the absolute relative error values of the predicted results.
According to Table 13, the performance prediction accuracy of SPG, MEB, BS, and CSP are 77.3%, 89.9%, 83.5%, and 86.3%, respectively. Considering that the mechanical performance indicators of Chinese fir trees follow a normal distribution and have a large coefficient of variation, the prediction results of this experiment are in a high confidence interval. That is to say, the wood physical and mechanical performance correlation analysis results obtained based on L-K information flow in this paper have good accuracy in performance prediction.
5. Summary
This article sampled data on the physical and mechanical properties of four types of Chinese fir from different regions and proposed a wood performance analysis method based on the Liang Kleeman information flow. The causal relationship between the nine physical properties and four mechanical properties of YK, CSH, XXH, and XXT four types of Chinese fir was thoroughly studied. The conclusions obtained have important guiding significance for improving the utilization efficiency of Chinese fir and the targeted cultivation of functional wood. At the same time, this article constructs a causal directed graph model based on the calculation results of the information flow coefficient. The CDG model focuses on the mechanical properties of wood and more clearly displays the magnitude relationship between the different physical properties of wood and its causal impact strength. At the same time, this article proposes a theory based on the information flow t line chart to determine the positive and negative coefficients of variation and their relative sizes. It is expected to use these laws to achieve real-time causal analysis. Finally, by establishing a linear function with physical properties as the independent variable, mechanical properties as the dependent variable, and causal impact strength as a coefficient, the physical and mechanical performance correlation conclusions obtained are used for performance prediction, with a maximum prediction accuracy of 90%.
This article is the first to apply the Liang Kleeman information flow as a causal characterization tool to the causal correlation analysis of wood physical and mechanical properties. The proposed method efficiently and accurately achieves causal differentiation analysis of physical and mechanical properties of different varieties of Chinese fir. The proposed method has obvious advantages:
- (1)
- The L-K information flow has the characteristic of fast calculation. This method is not only simple, but also has higher performance analysis efficiency;The coefficient of variation of the information flow can quantitatively compare the causal impact intensity between different physical and mechanical properties;
- (2)
- The performance correlation analysis conclusion based on L-K information flow is used to predict the mechanical properties of wood, with a prediction accuracy of up to 90%;
- (3)
- A theory based on information flow t line graph was proposed to determine the positive, negative, and relative magnitude of its coefficient of variation, providing guidance for real-time performance correlation analysis.
However, this method also has limitations. The principle of causality characterization by L-K information flow must be further extended in complex cases in order to reduce errors in the causal analysis process. These special cases will undergo further study in the future.
Acknowledgments
This work was supported in part by the National Natural Science Foundation of China under Grants Nos. 62072477, 61309027, 61702562 and 61702561, the Hunan Provincial Natural Science Foundation of China under Grants No.2018JJ3888, the Hunan Key Laboratory of Intelligent Logistics Technology 2019TP1015.
References
- WANG Chengyu,YANG Zhaolin,WANG Xin,et al. New progress in wood functionalization research[J]. Journal of Forest Engineering, 2019, 4(3):9. DOI:CNKI:SUN:LKKF.0.2019-03-003.
- QING Yan,LIAO Yu,LIU Jingyi et al. New progress in the research of wood-based energy storage materials[J]. Journal of Forestry Engineering,2021,6(05):1-13. [CrossRef]
- ZHANG Peijian,SHANG Xiuhua,WU Zhihua.Comparison of differences in the physical and mechanical properties of wood from five Eucalyptus species[J]. Journal of Northwest Forestry College, 2020. [CrossRef]
- CHEN Kui,LIU Heng,WANG Zhong et al. Study on the difference in physical and mechanical properties of wood from fir asexual lines and live seedlings[J/OL]. Journal of Southwest Forestry University:1-7[2023-09-03].http://kns.cnki.net/kcms/detail/53.1218.s.20230630.1106.002.html .
- SAN L X. Information flow and causality as rigorous notions ab initio [J].Physical review E, 2016, 94(5):052201-1-28.
- GONG Zhanqiu,SUN Cheng,LI Jianping et al. Application of causal analysis based on information flow theory in discerning the physical mechanism of the Atlantic multiyear intergenerational oscillation[J]. Atmospheric Science,2019,43(05):1081-1094.
- LU Yan,XIE Tao,XU Hui et al. Causal analysis of rainfall indicators and landslide debris flow based on information flow theory[J]. Journal of Natural Hazards,2019,28(04):196-201. [CrossRef]
- Tao Z,Jing C,Fali L, et al. Causal Network Connectivity Patterns in Autism Spectrum Disorder Based on the Liang-Kleeman Information Flow Theory[J]. International Journal of Psychophysiology,2021,168(S).
- Gang W,Chang Z,Min Z, et al. Author Correction: the causality from solar irradiation to ocean heat content detected via multi-scale Liang- Kleeman information flow[J]. Scientific Reports,2021,11(1).
- Climate Systems; Recent Findings from State Oceanic Administration Has Provided New Data on Climate Systems (The causality from solar irradiation to ocean heat content detected via multi-scale Liang-Kleeman information flow)[J]. Global Warming Focus, 2020.
- SHANG Xiu-hua, ZHANG Pei-jian, LUO Jian-zhong. Research on the physical and mechanical properties of young wood of Eucalyptus terrestris[J]. Journal of Northwest A&F University (Natural Science Edition),2019,47(05):32-41. [CrossRef]
- Zhu J, Shi Y, Fang L, Liu X, Ji C. Patterns and determinants of wood physical and mechanical properties across major tree species in China. Sci China Life Sci . 2015 Jun;58(6):602-12. Epub 2015 Apr 29. PMID: 25921943. [CrossRef]
- Qiang G,Jiangming K. Automatic Forest DBH Measurement Based on Structure from Motion Photogrammetry[J]. Remote Sensing,2022,14(9).
- Liu X,Xu F,Sun Y, et al. Convolutional Recurrent Neural Networks for Observation-Centered Plant Identification[J]. Journal of Electrical and Computer Engineering,2018,2018.
- Zhilong W,Qingxun W,Yanqiang H, et al. Deep Learning for Ultra-fast and High Precision Screening of Energy Materials[J]. Energy Storage Materials,2021.
- Zhilong W,Yanqiang H,Junfei C, et al. DeepTMC: A deep learning platform to targeted design doped transition metal compounds[J]. Energy Storage Materials,2022,45.
- Shi X,Kan J. The Sensitivity Feature Analysis for Tree Species Based on Image Statistical Properties[J]. Forests,2023,14(5).
- Jiwen L,Zhufang K,Lei D. GCNPCA: MiRNA-Disease Associations Prediction Algorithm Based on Graph Convolutional Neural Networks.[J]. IEEE/ACM transactions on computational biology and bioinformatics,2022.
- Gaoyuan C,Juhu L,Xuanxin L, et al. Learning and Compressing: Low-Rank Matrix Factorization for Deep Neural Network Compression[J]. Applied Sciences,2023,13(4).
- Meng Q,Ge H,Yao W, et al. One-step synthesis of nitrogen-doped wood derived carbons as advanced electrodes for supercapacitor applications[J]. New Journal of Chemistry,2019.
- Choudhary K , Decost B , Chen C ,et al. Recent Advances and Applications of Deep Learning Methods in Materials Science[J]. 2021. [CrossRef]
- Goswami L , Deka M , Roy M .Artificial Intelligence in Material Engineering: a review on applications of AI in Material Engineering[J]. 2022.
- Yang Xiaoxia. Research on classification and recognition algorithm based on mahogany microstructure[D]. Shandong Architecture University,2022. [CrossRef]
- Yu Yabin. Research on testing method of loosening performance of bolted joints in wood structures based on deep learning[D]. Nanjing Forestry University,2022. [CrossRef]
- Yang Cuiping. Research on the construction of particleboard performance prediction model based on data-driven[D]. Northeast Forestry University, 2021. [CrossRef]
- Yang Haiyue. Construction of wood-based phase change energy storage composites and their functional studies[D]. Northeast Forestry University,2021. [CrossRef]
- JIANG Zehui,DANG Liping,SONG Rongzhen et al. Progress in acoustic vibration characterization of wood and bamboo[J]. World Forestry Research,2021,34(02):1-7. [CrossRef]
- Guanglin Y,Bingzhen W,Jinlong L, et al. The prediction of MOE of bamboo-wood composites by ANN models based on the non-destructive vibration testing[J].Journal of Building Engineering,2022,59.
- TANG Qi-Heng, ZHANG Radium, ZOU Miao et al. Progress of research on transparent wood and bamboo materials and difficulties in industrial application[J]. Wood Science and Technology,2022,36(06):1-12.
- Zhilong W,Xirong L,Yanqiang H, et al. Harnessing artificial intelligence to holistic design and identification for solid electrolytes[J]. Nano Energy,2021,89(PA).
- ZHANG Wei-Ye,LIU Yi,GUO Hong-Wu. Research progress of wood-based electrochemical energy storage devices[J]. Materials Herald, 2020(034-023).
- ZHOU Jing,WANG Luzhen,XU Chaoyang et al. Research progress on the preparation of densified wood films and their functionalized applications[J/OL]. Journal of Composite Materials:1-10[2023-09-02]. [CrossRef]
- LIN Zuopeng,SUN Longxiang,GUO Minghui. Progress of research on delignification modification and functionalization application of wood with multistage pore structure[J]:1-7[2023-09-02].http://kns.cnki.net/kcms/detail/11.2357.TQ.20230609.1609.023.html.
- SAN L X. Normalizing the causality between time series [J]. Physical review E, Statistical, nonlinear, and soft matter physics, 2015, 92(2):022126.
- SAN L X. Information flow and causality as rigorous notions ab initio [J].Physical review E, 2016, 94(5):052201-1-28.
Figure 1.
Simple CDG model.
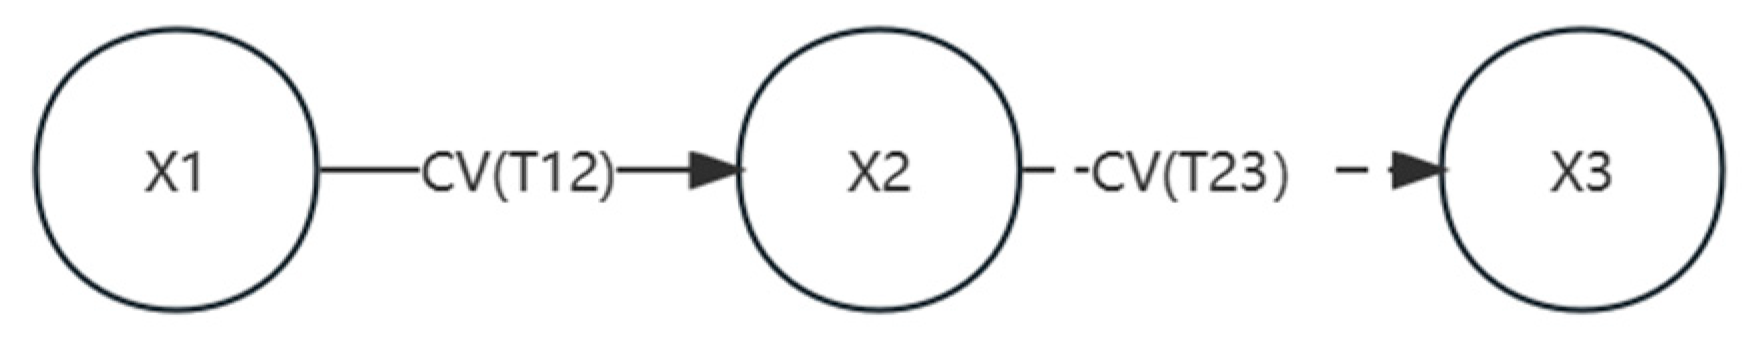
Figure 2.
Causal directed graphs of SPG.

Figure 3.
Causal directed graph of MEB.
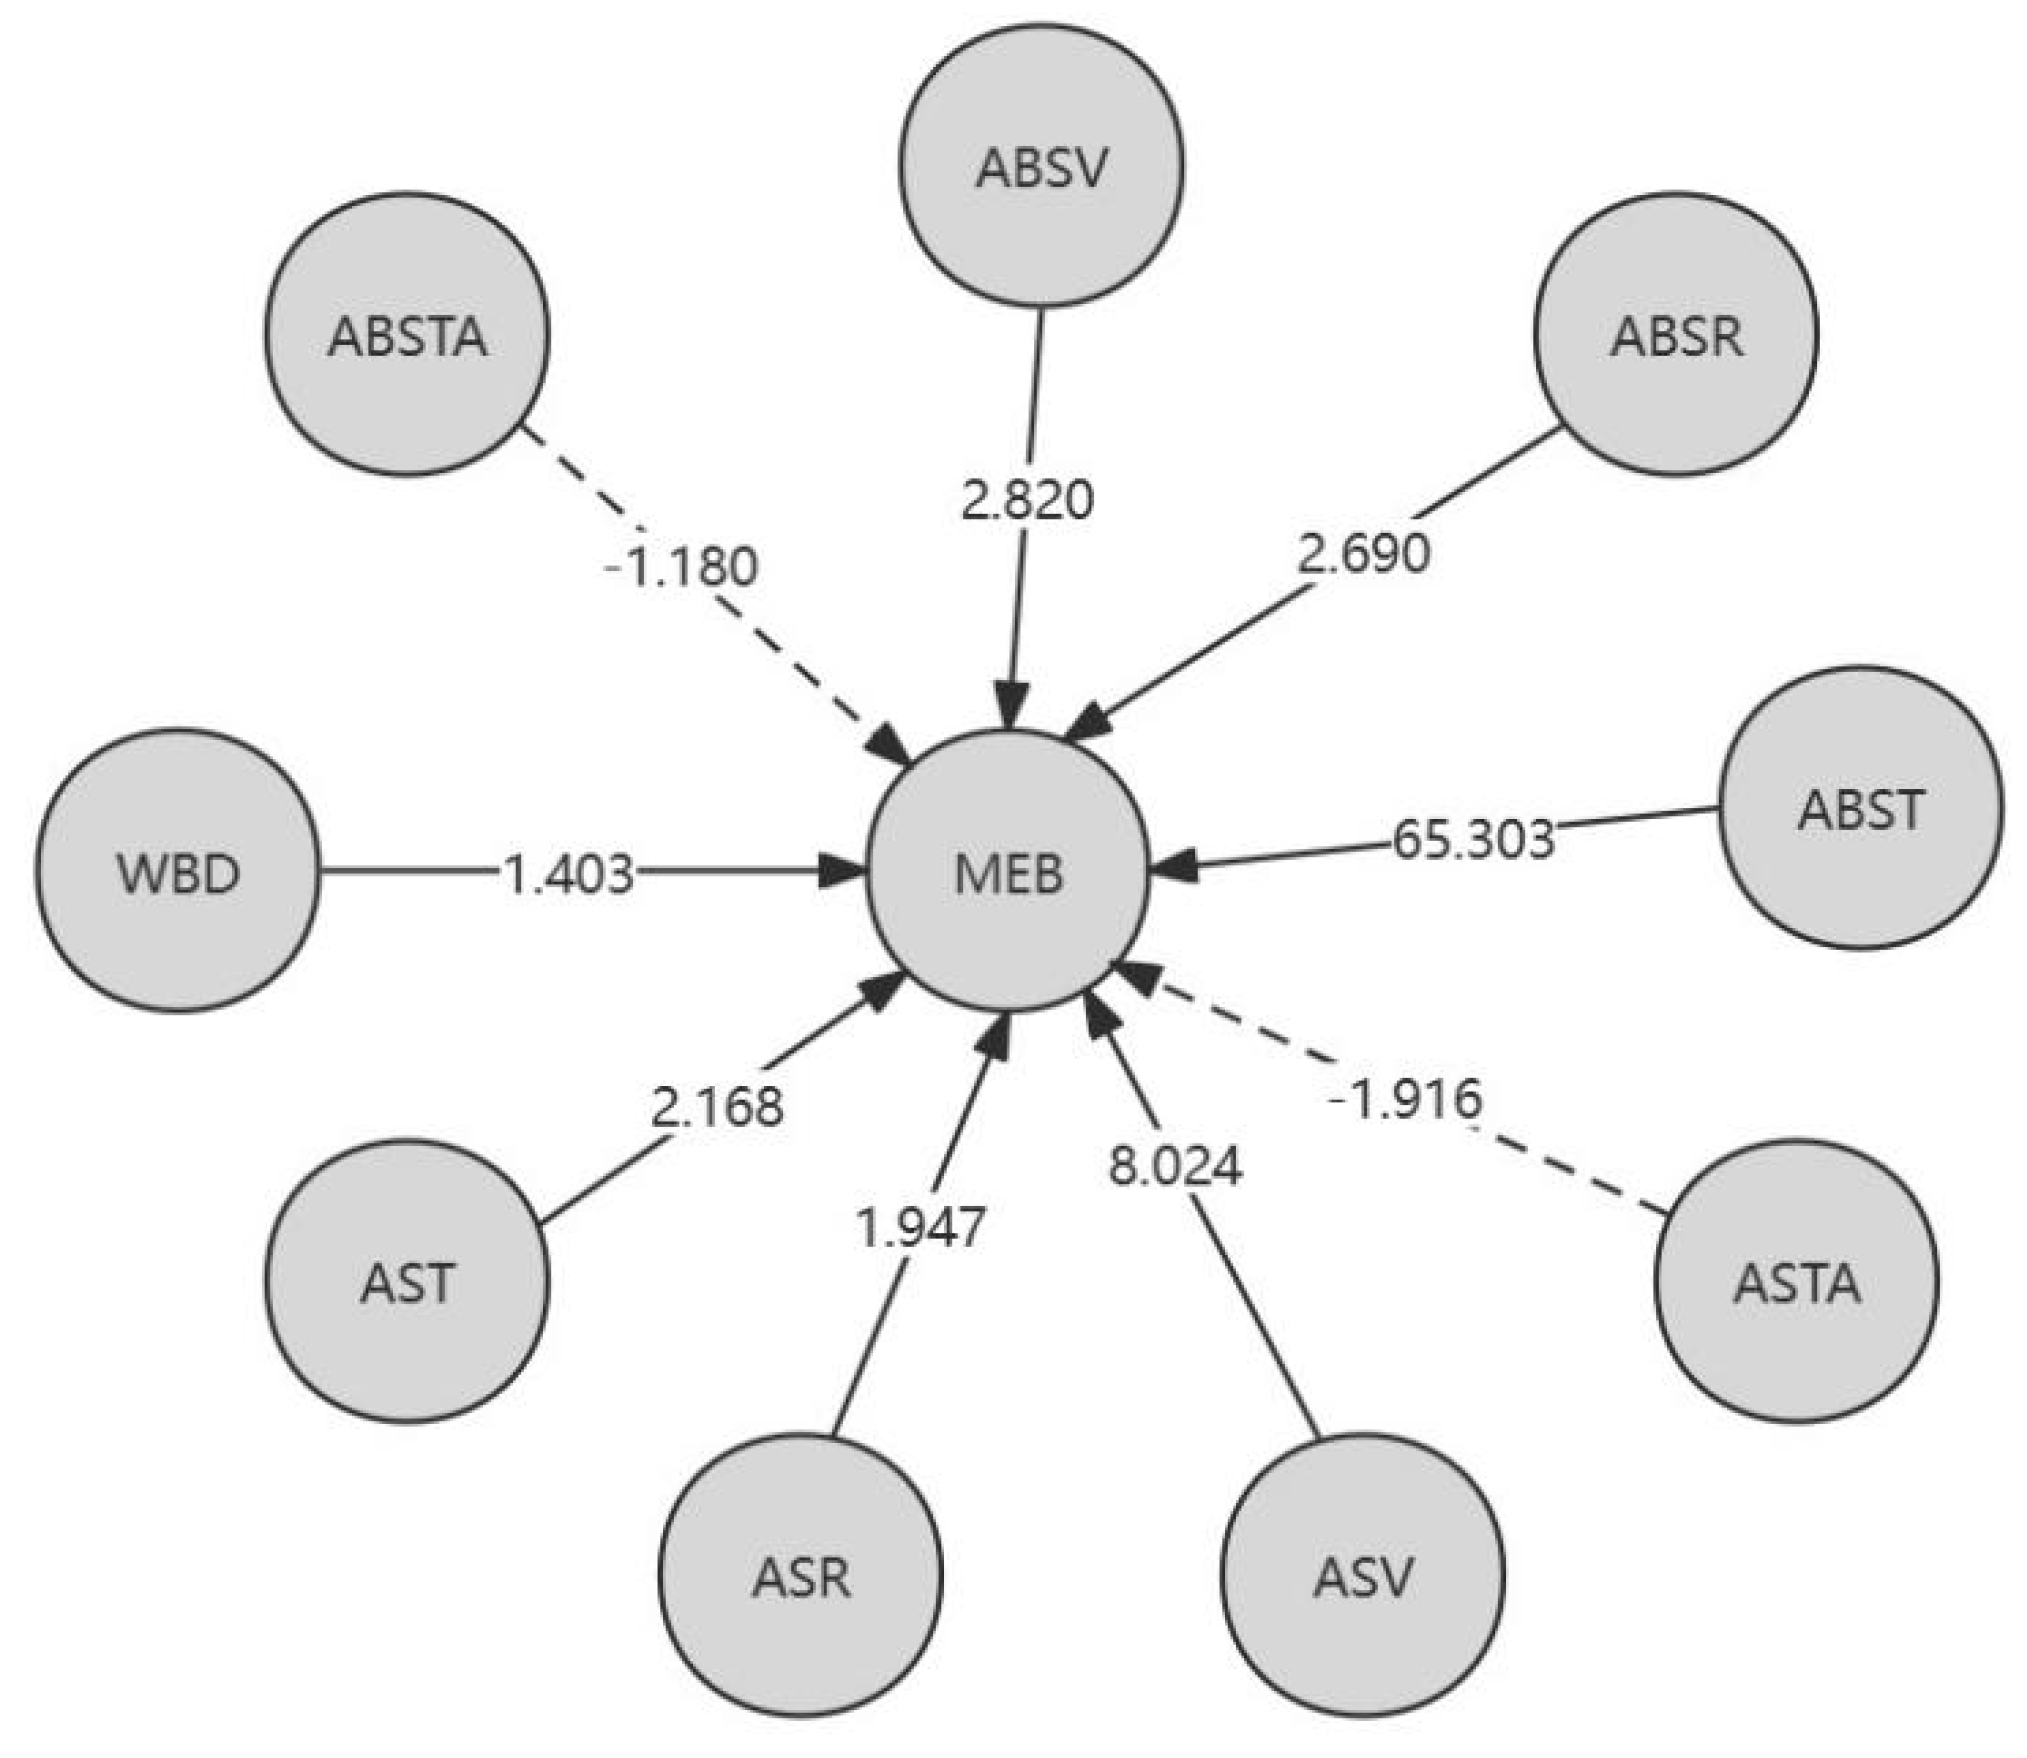
Figure 4.
Causal directed graph of BS.
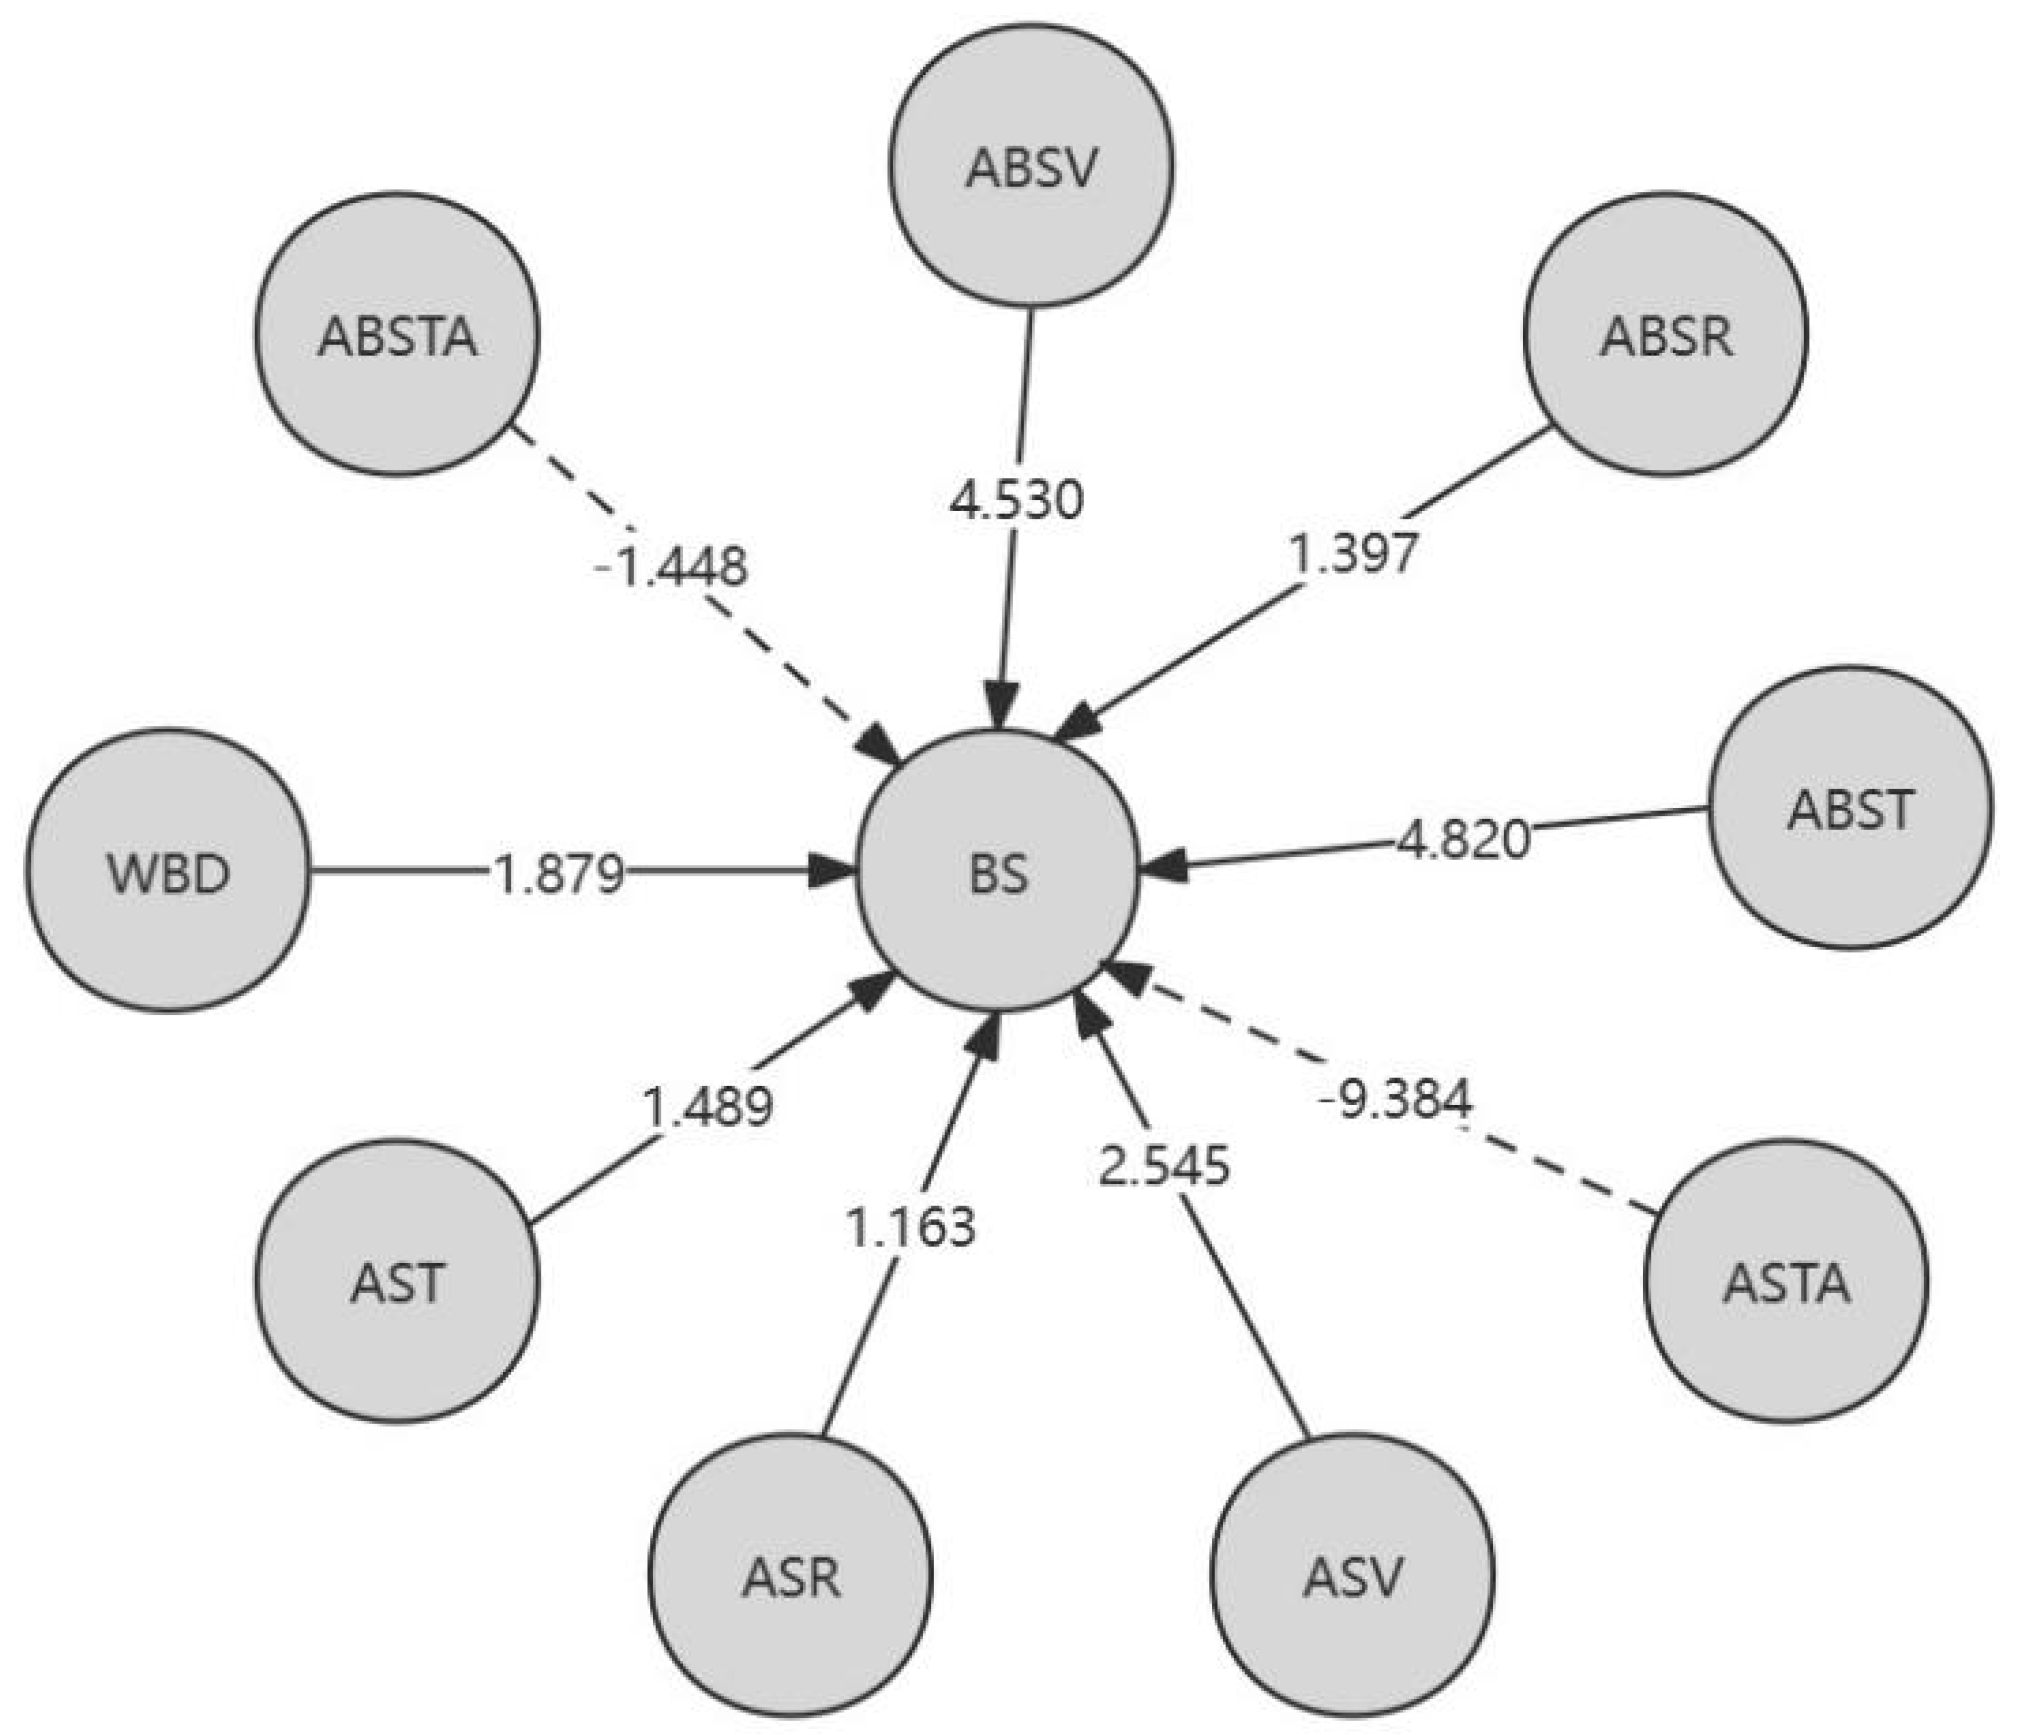
Figure 5.
Causal directed graph of CSP.
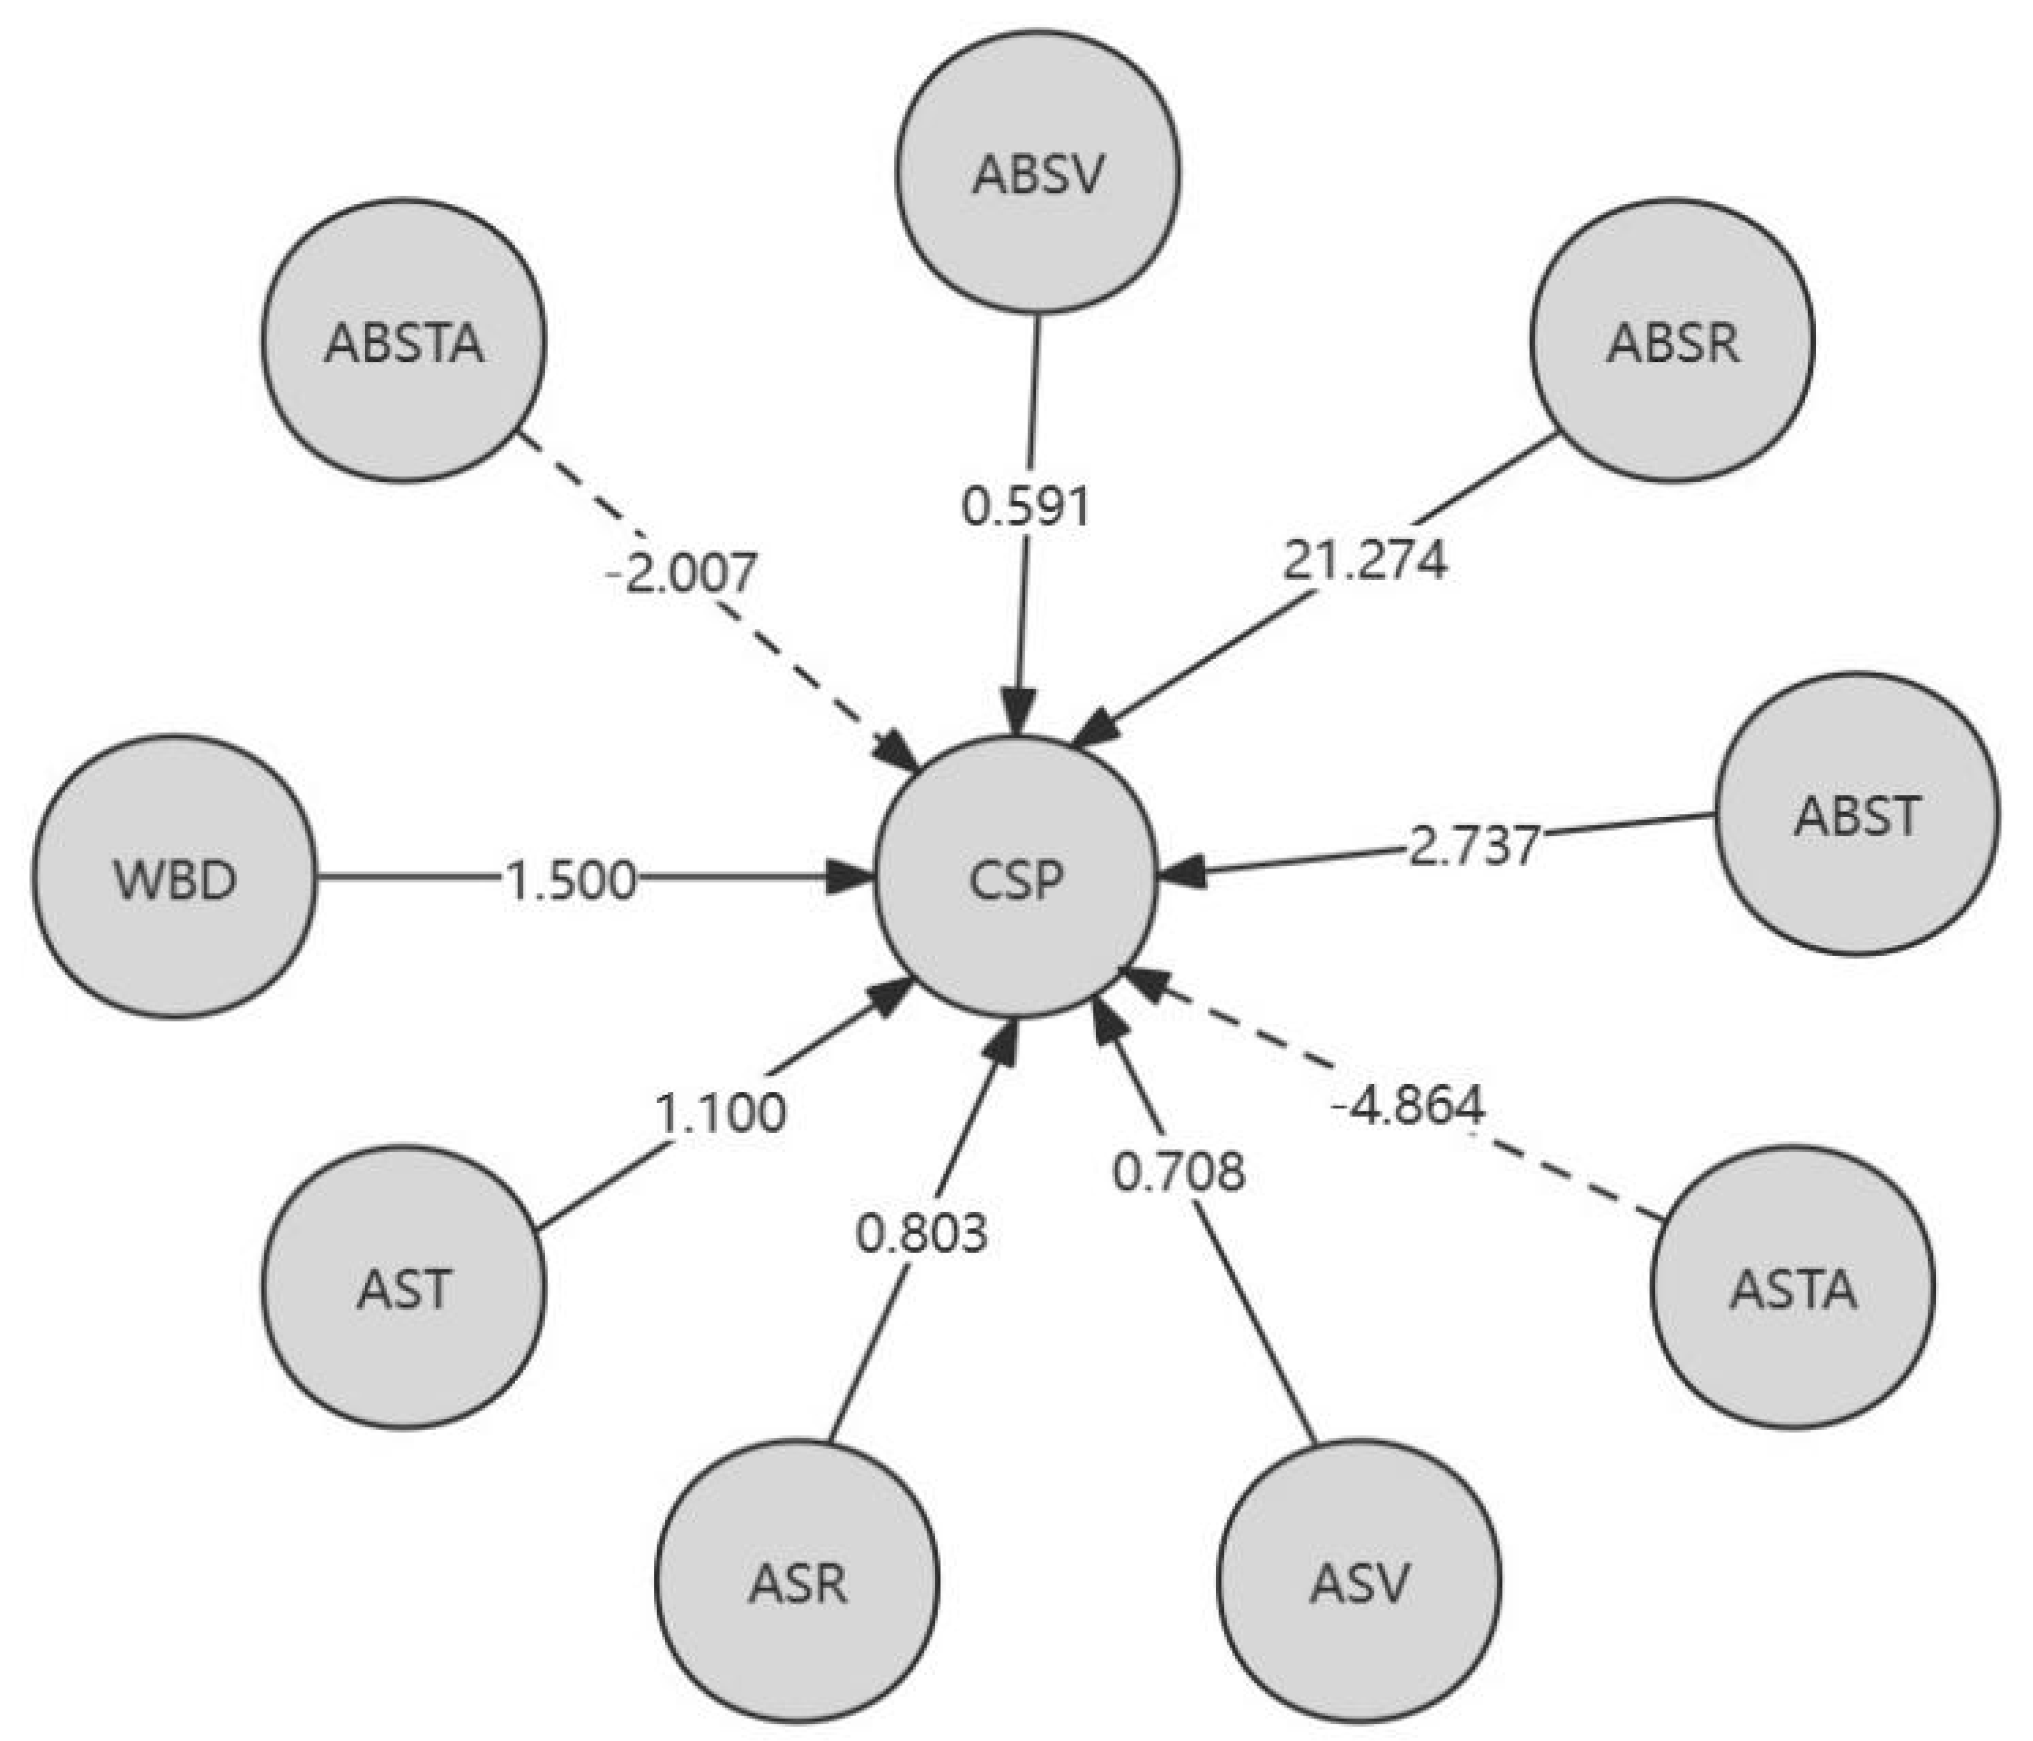
Figure 6.
YKS:ASR→MEB information flow-t line graph.
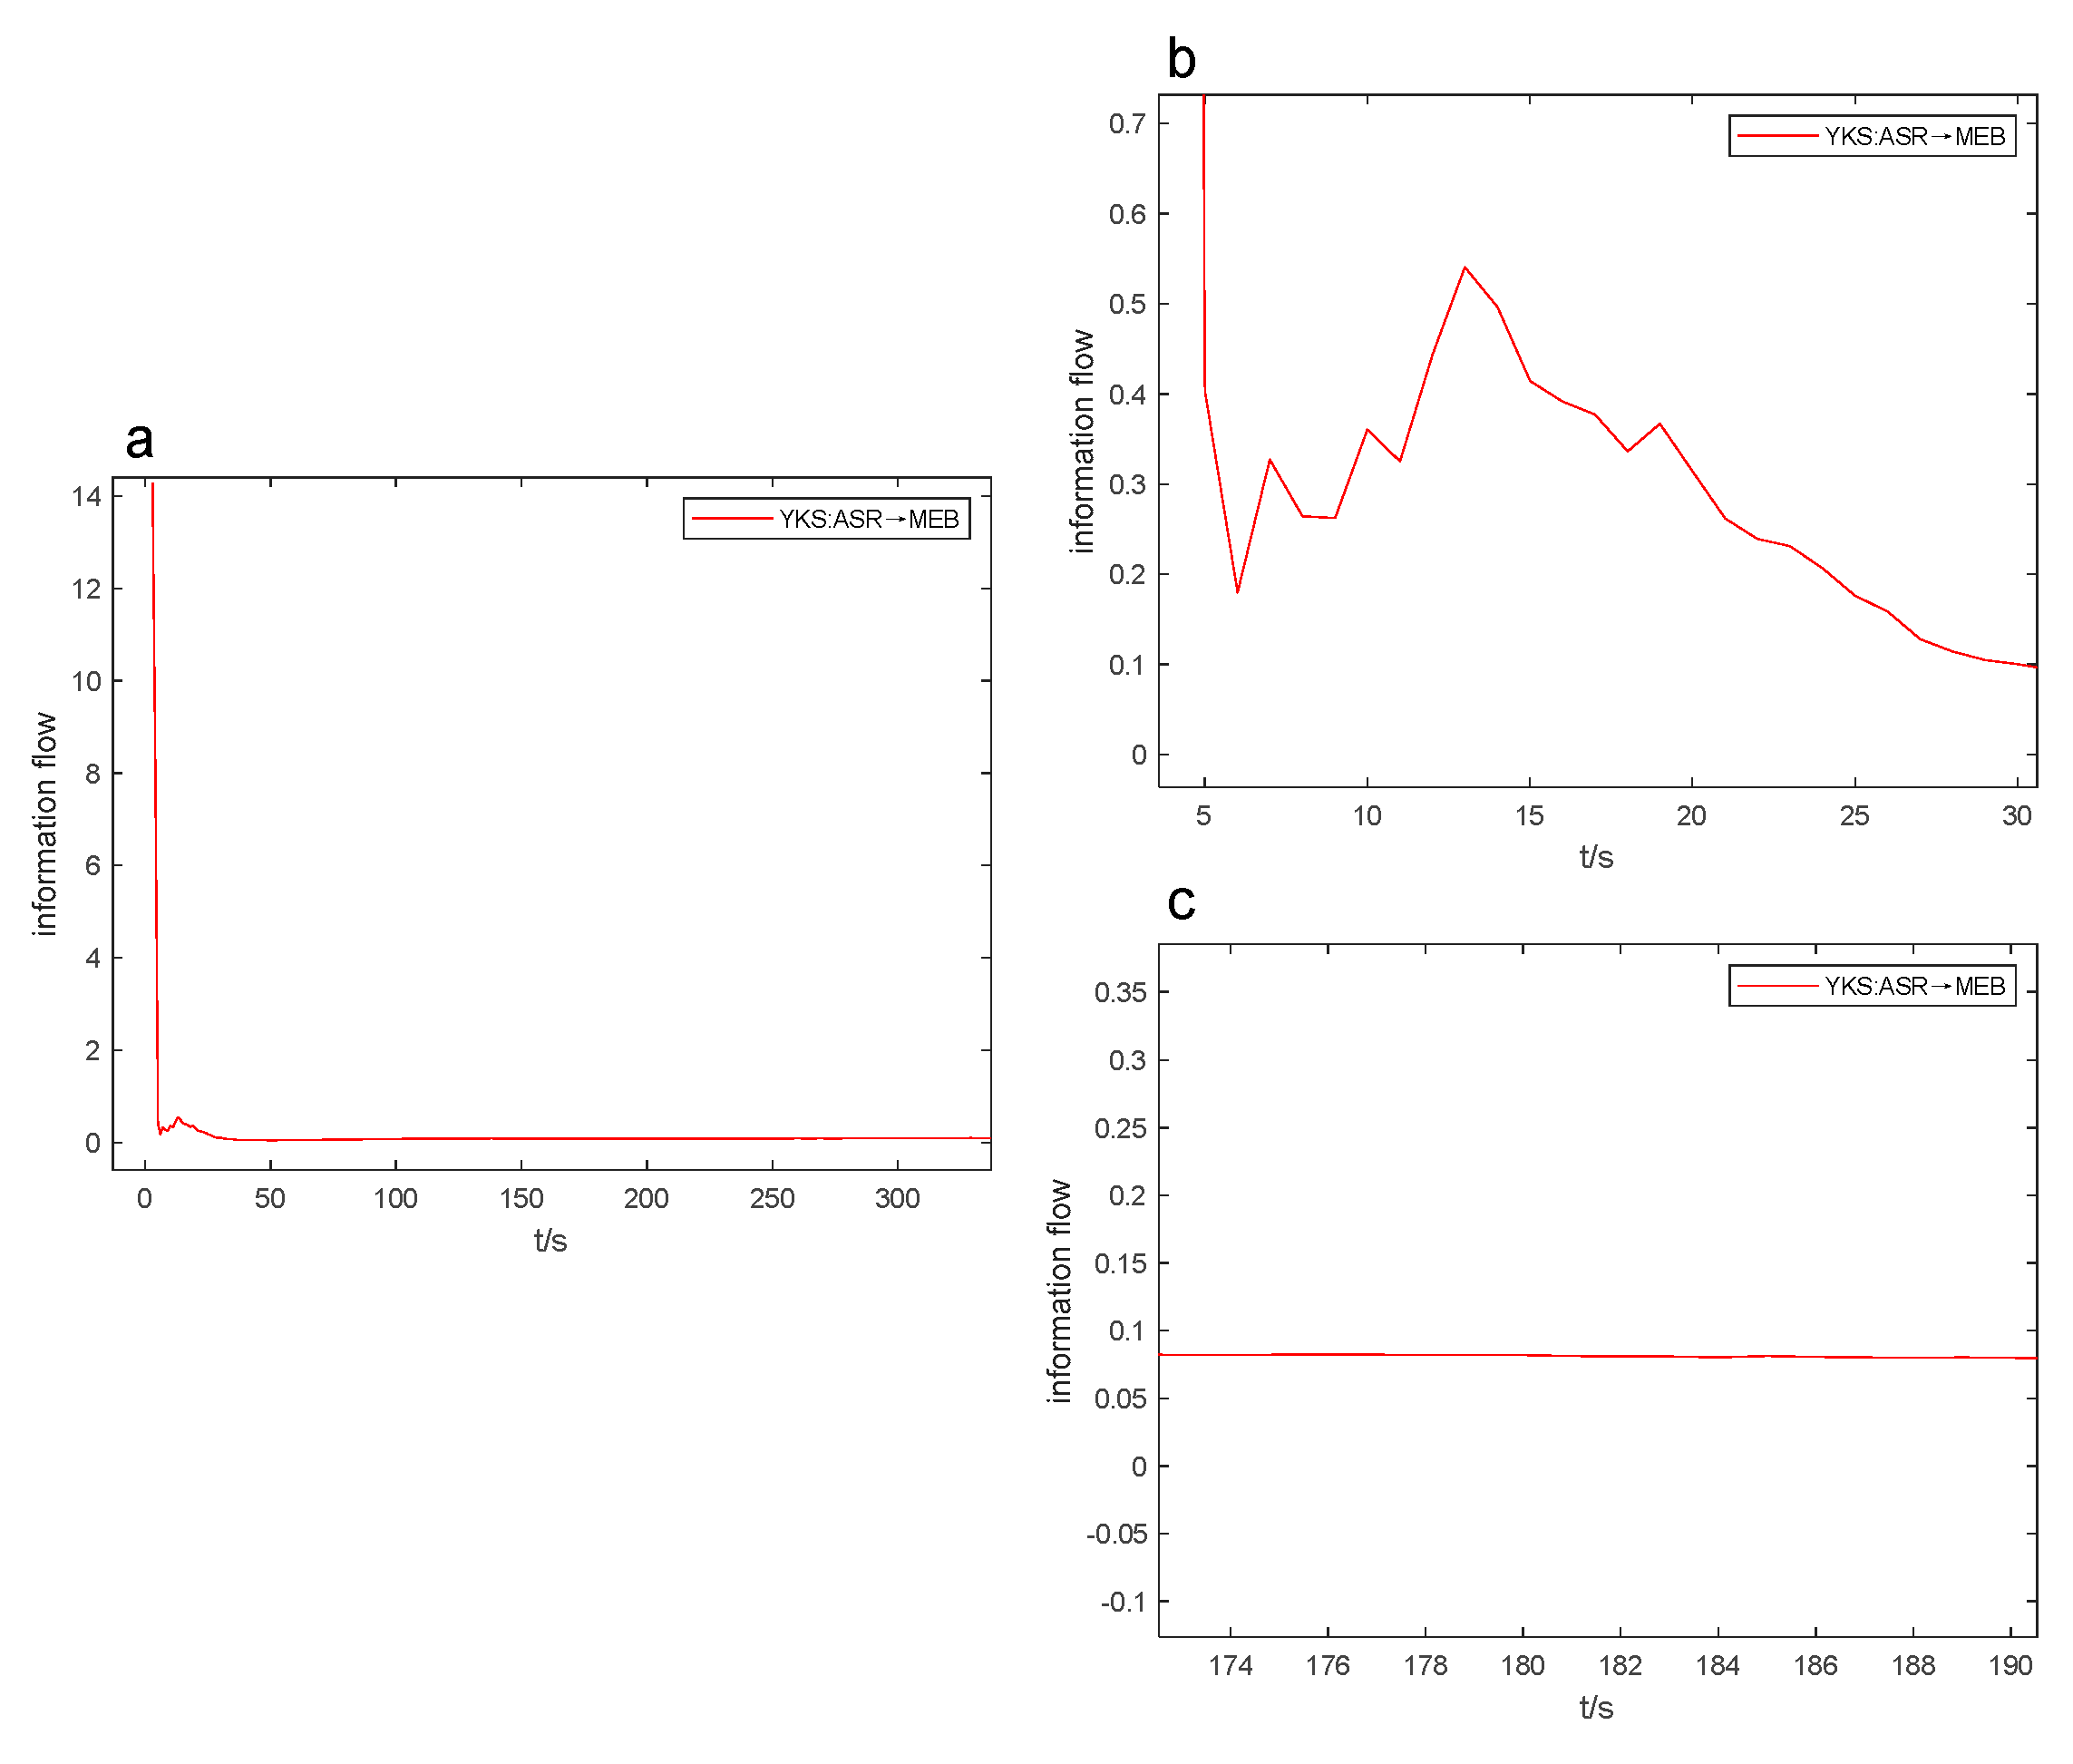
Figure 7.
XXH:ASTA→MEB information flow-t line graph.
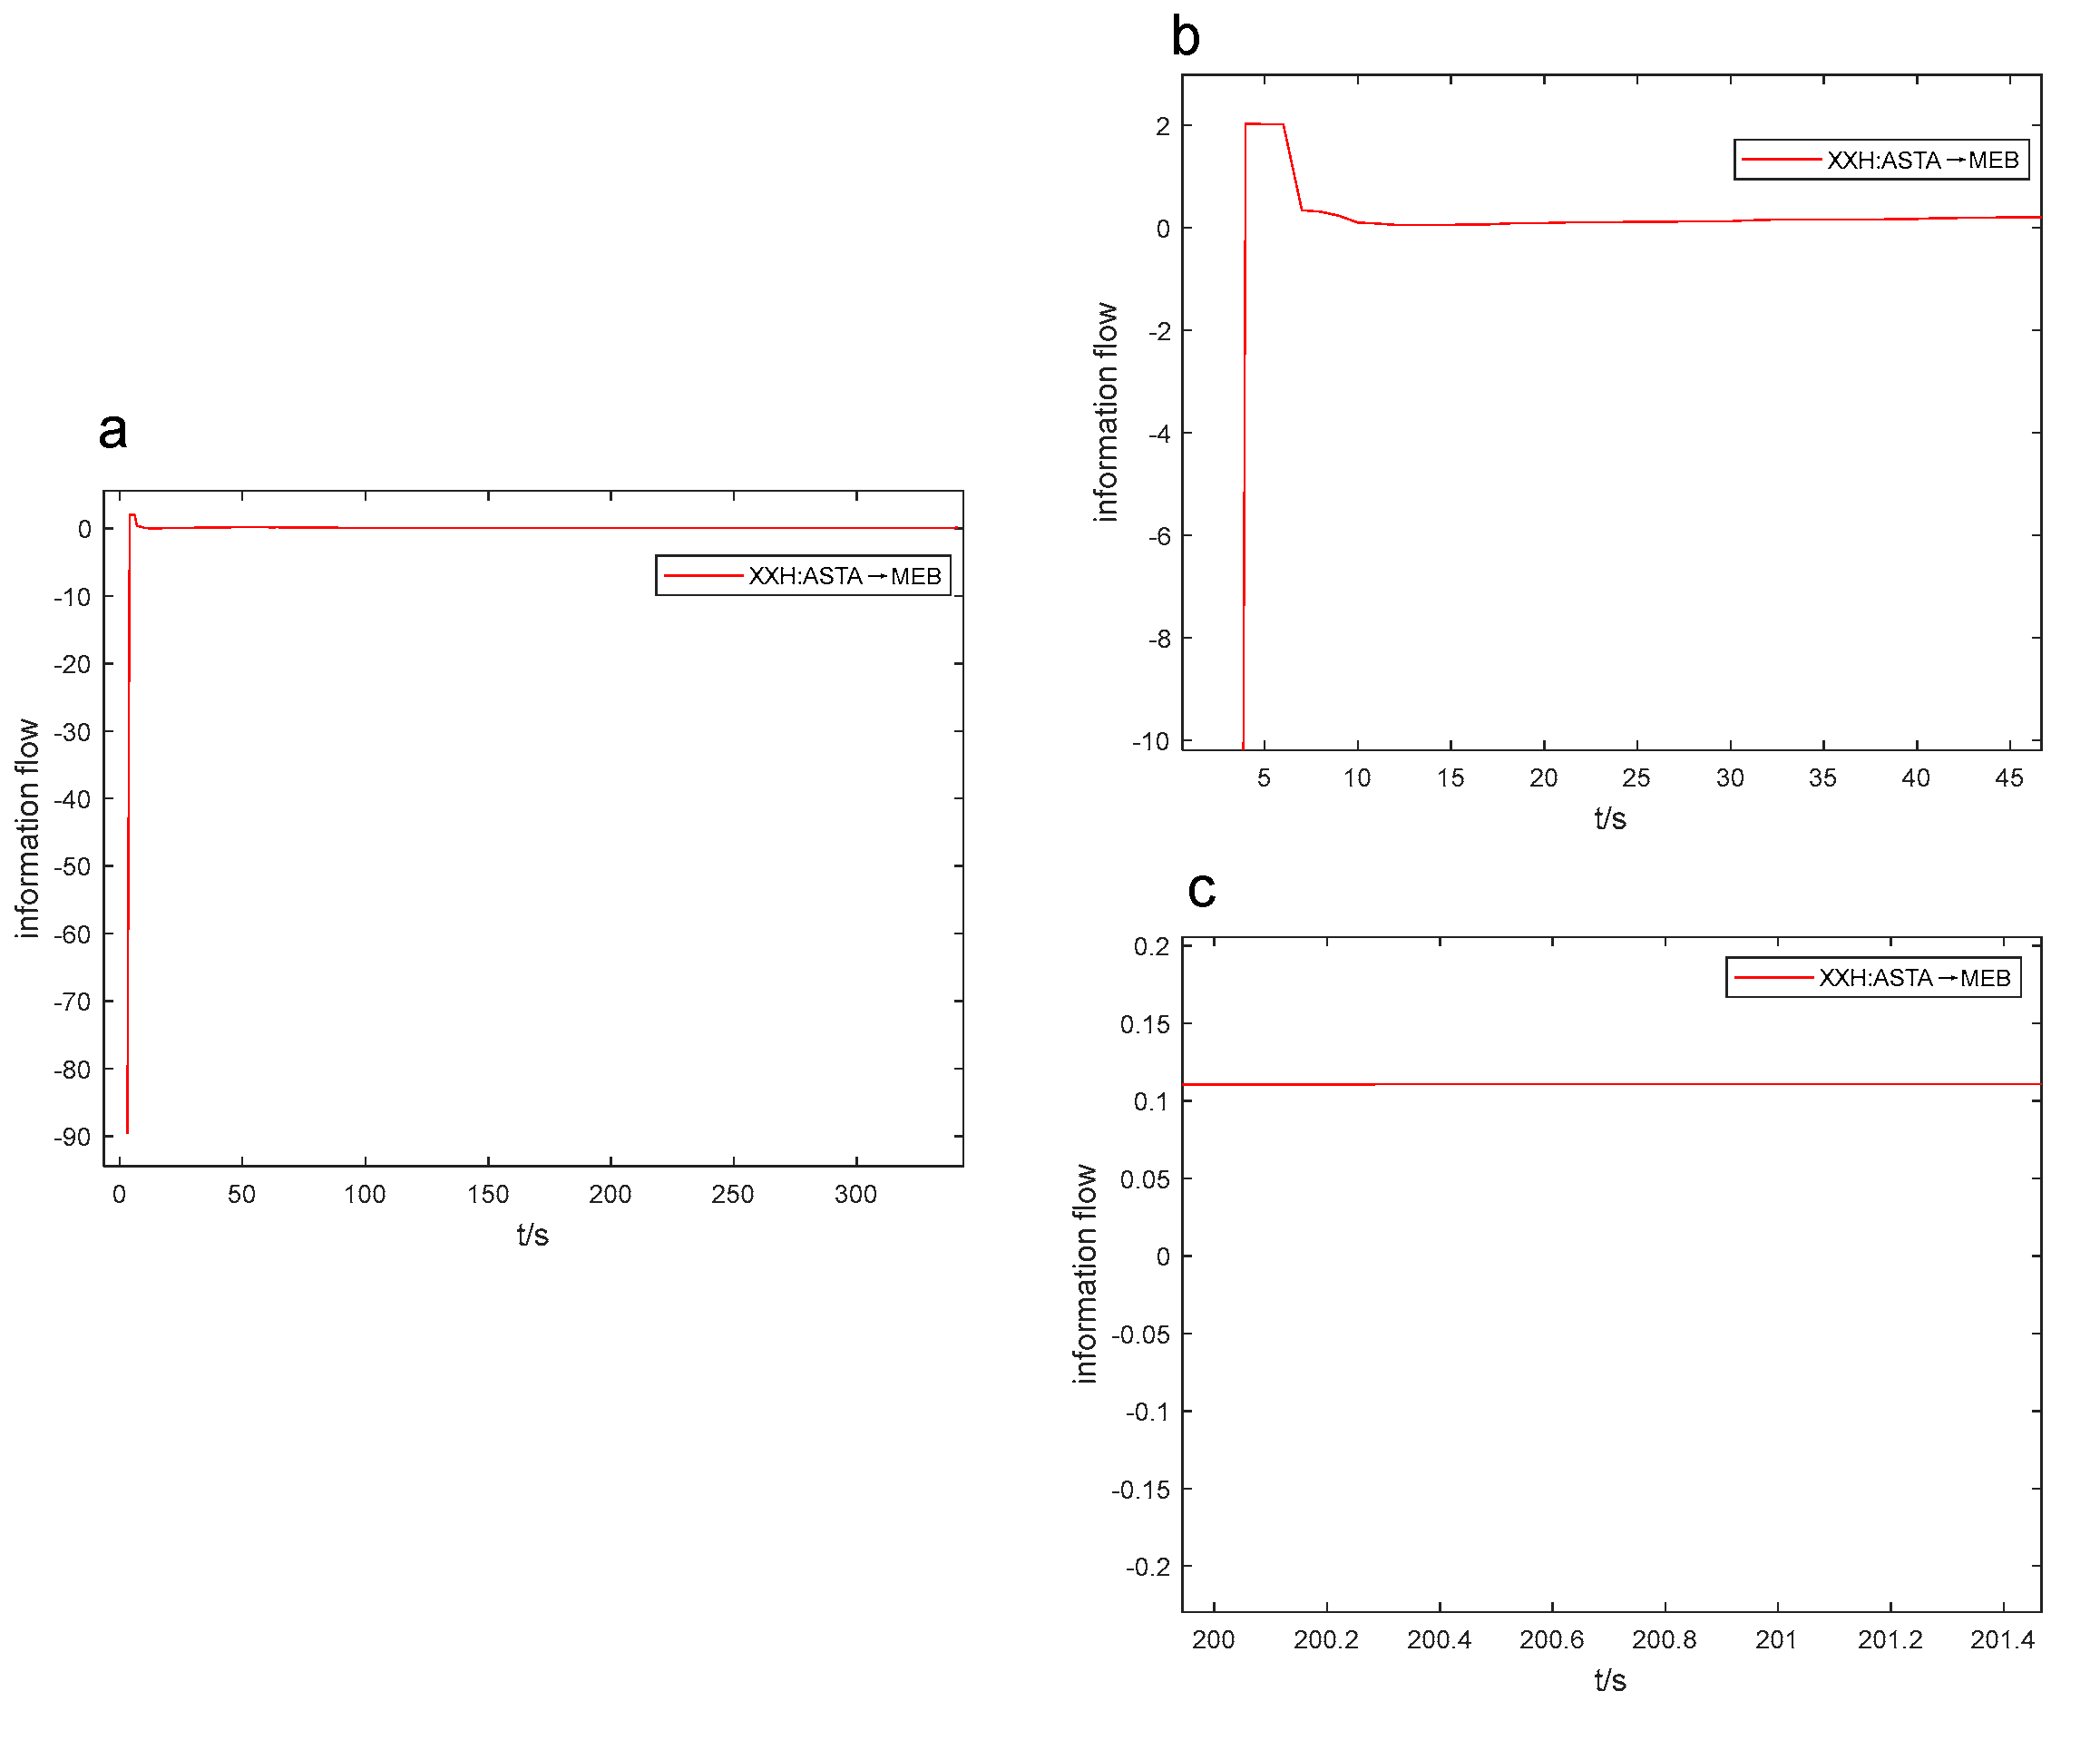
Figure 8.
YKS:ASTA→BS information flow-t line graph.
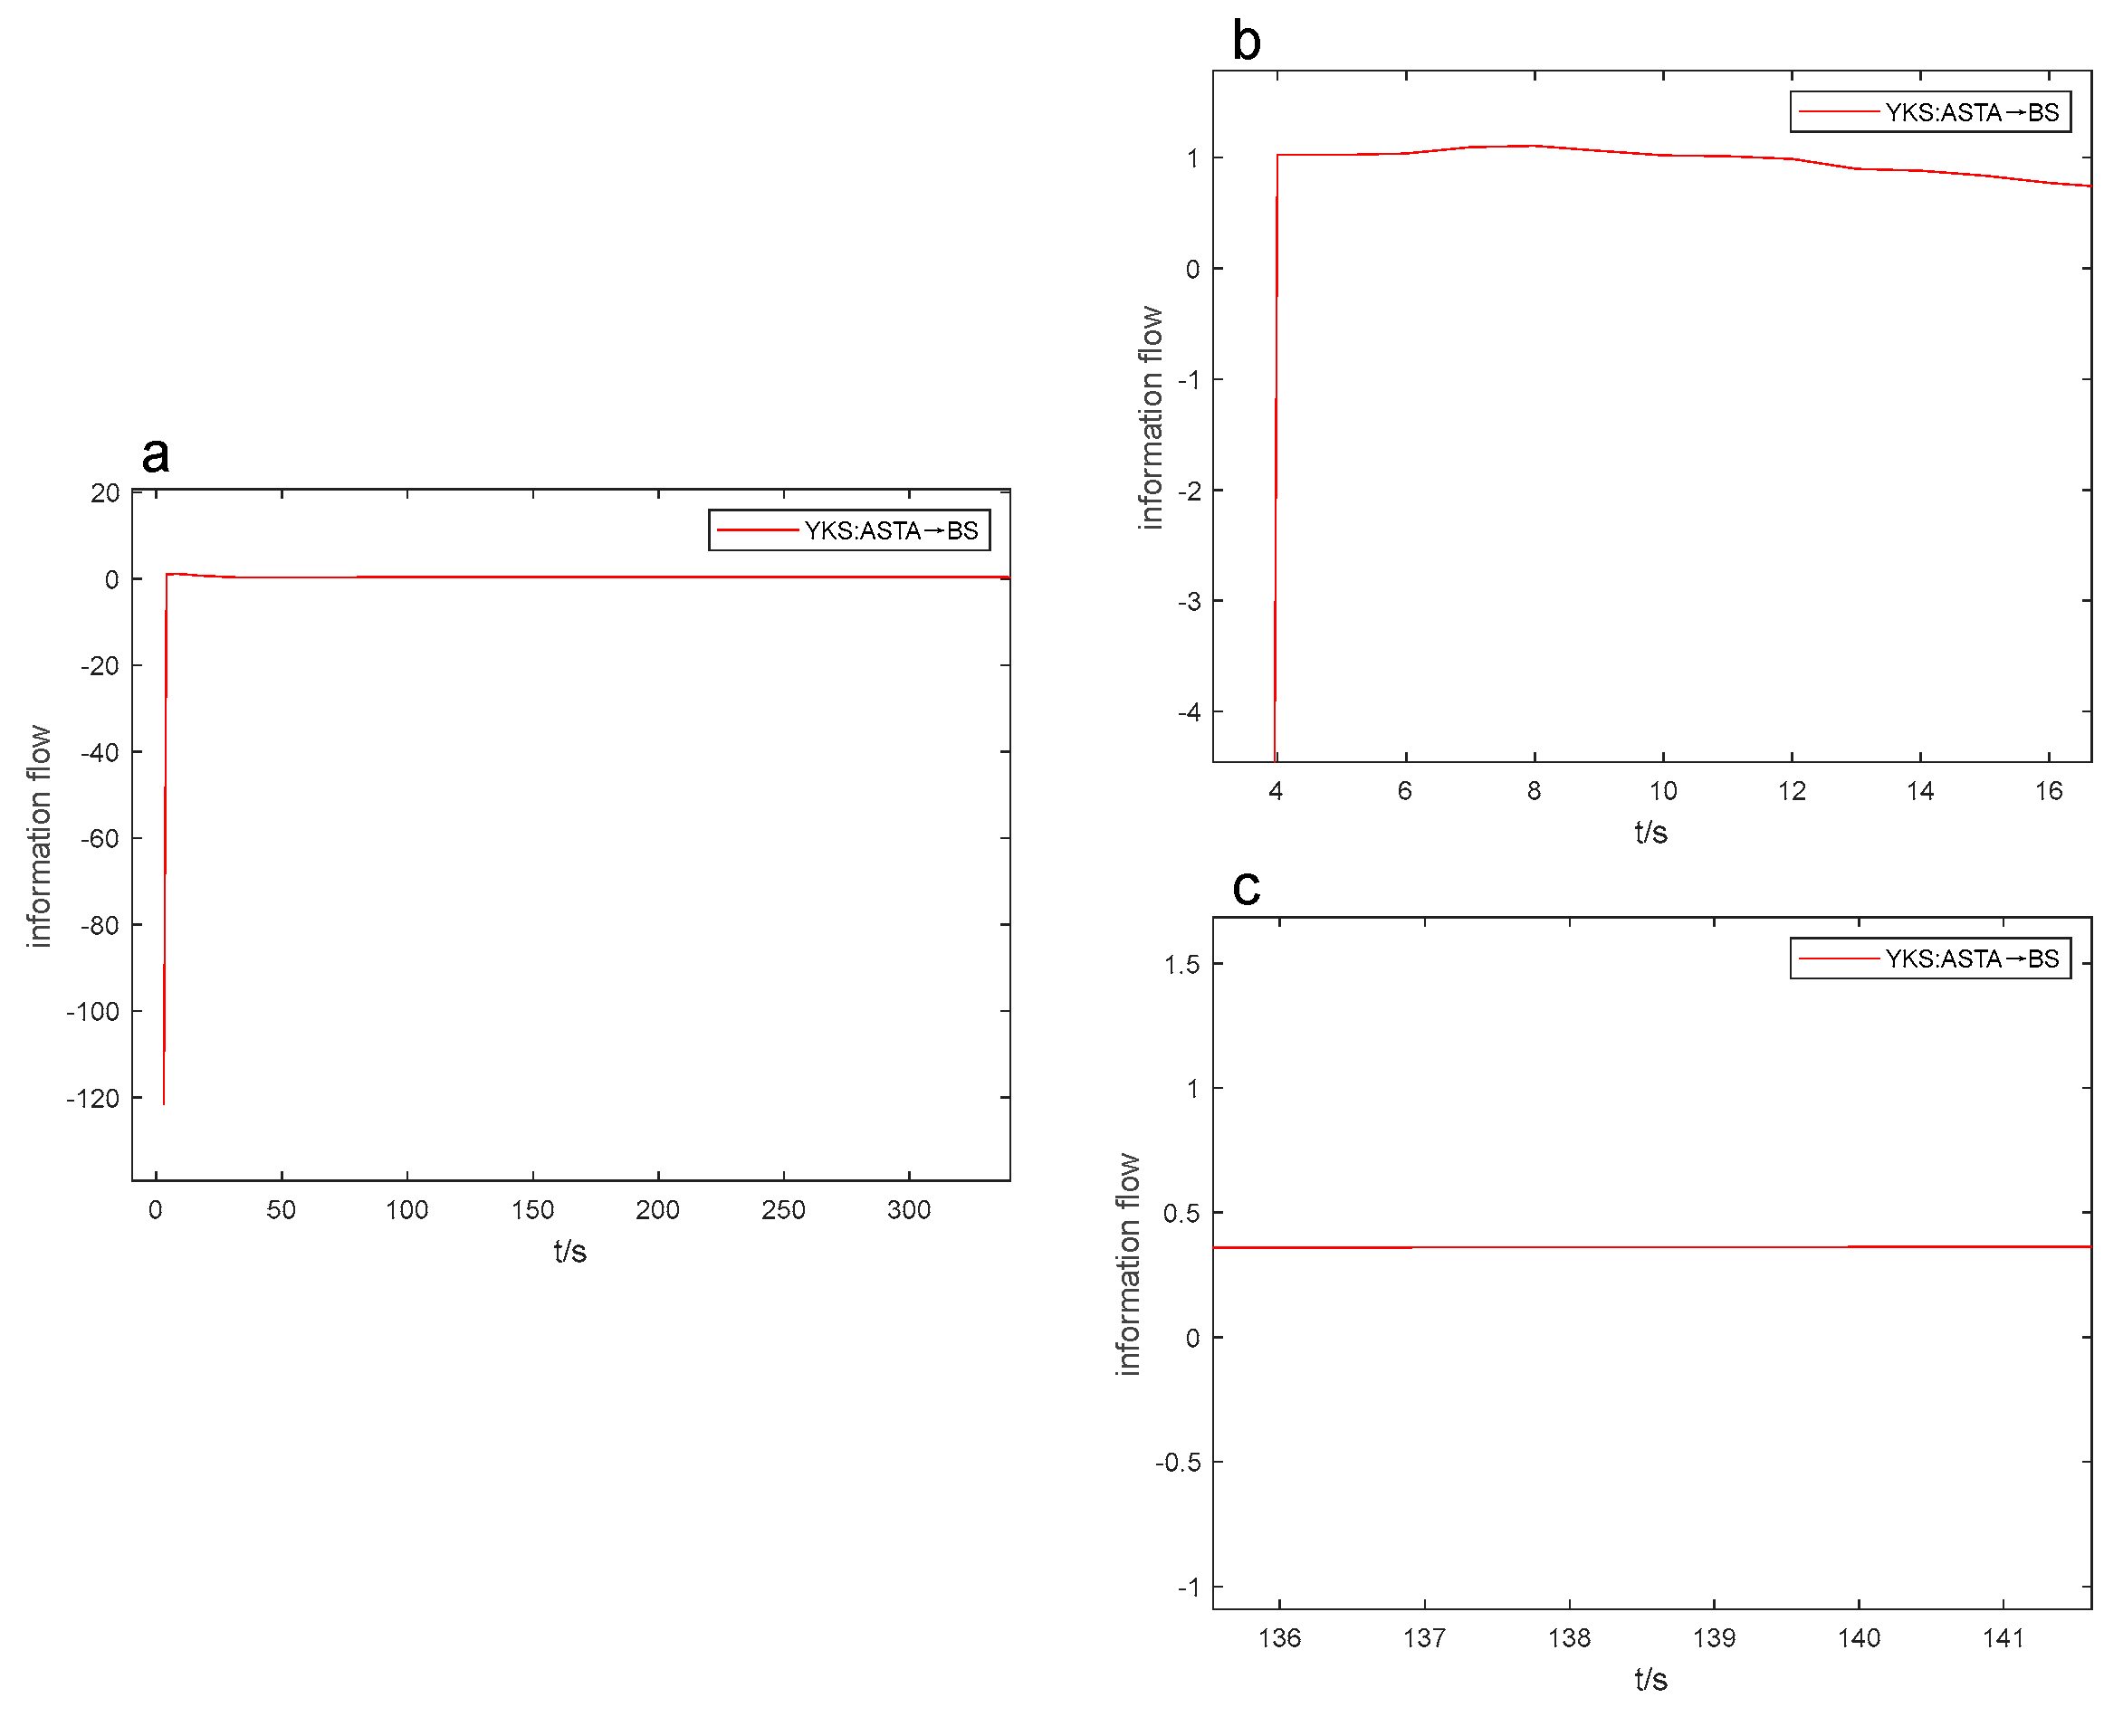
Figure 9.
YKS:ABST→CSP information flow-t line graph.
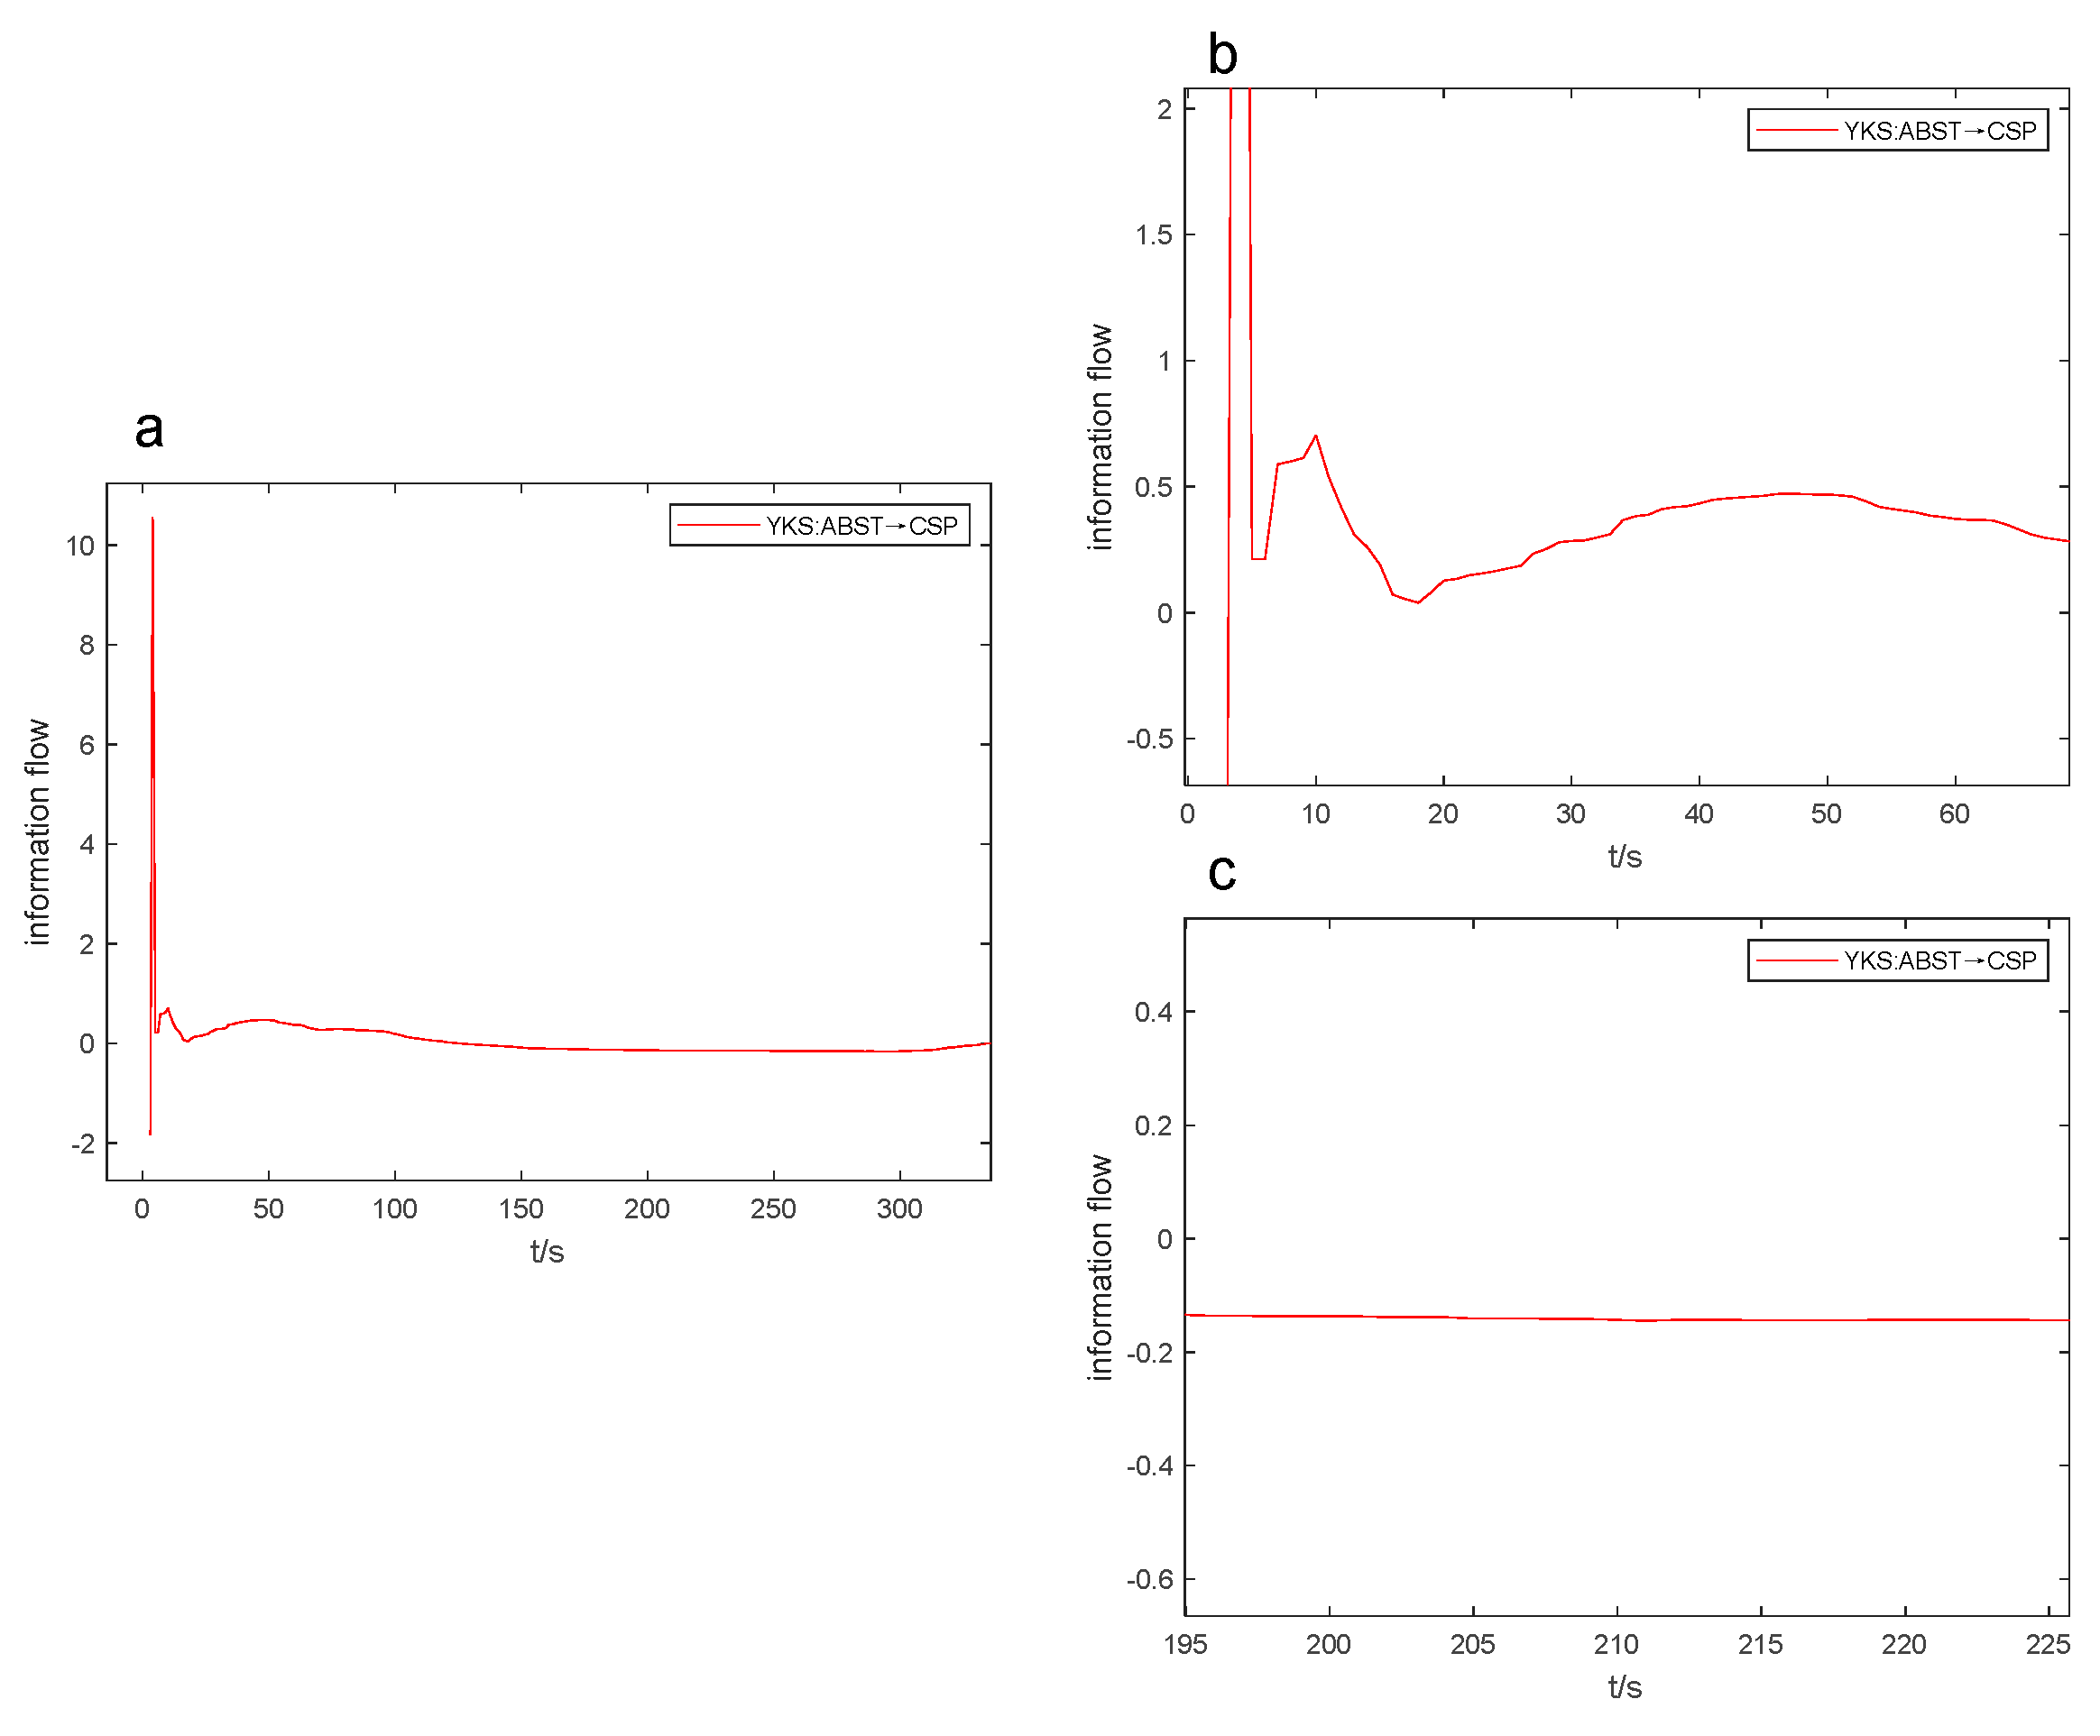
Figure 10.
XXT:ABST→BS information flow-t line graph.
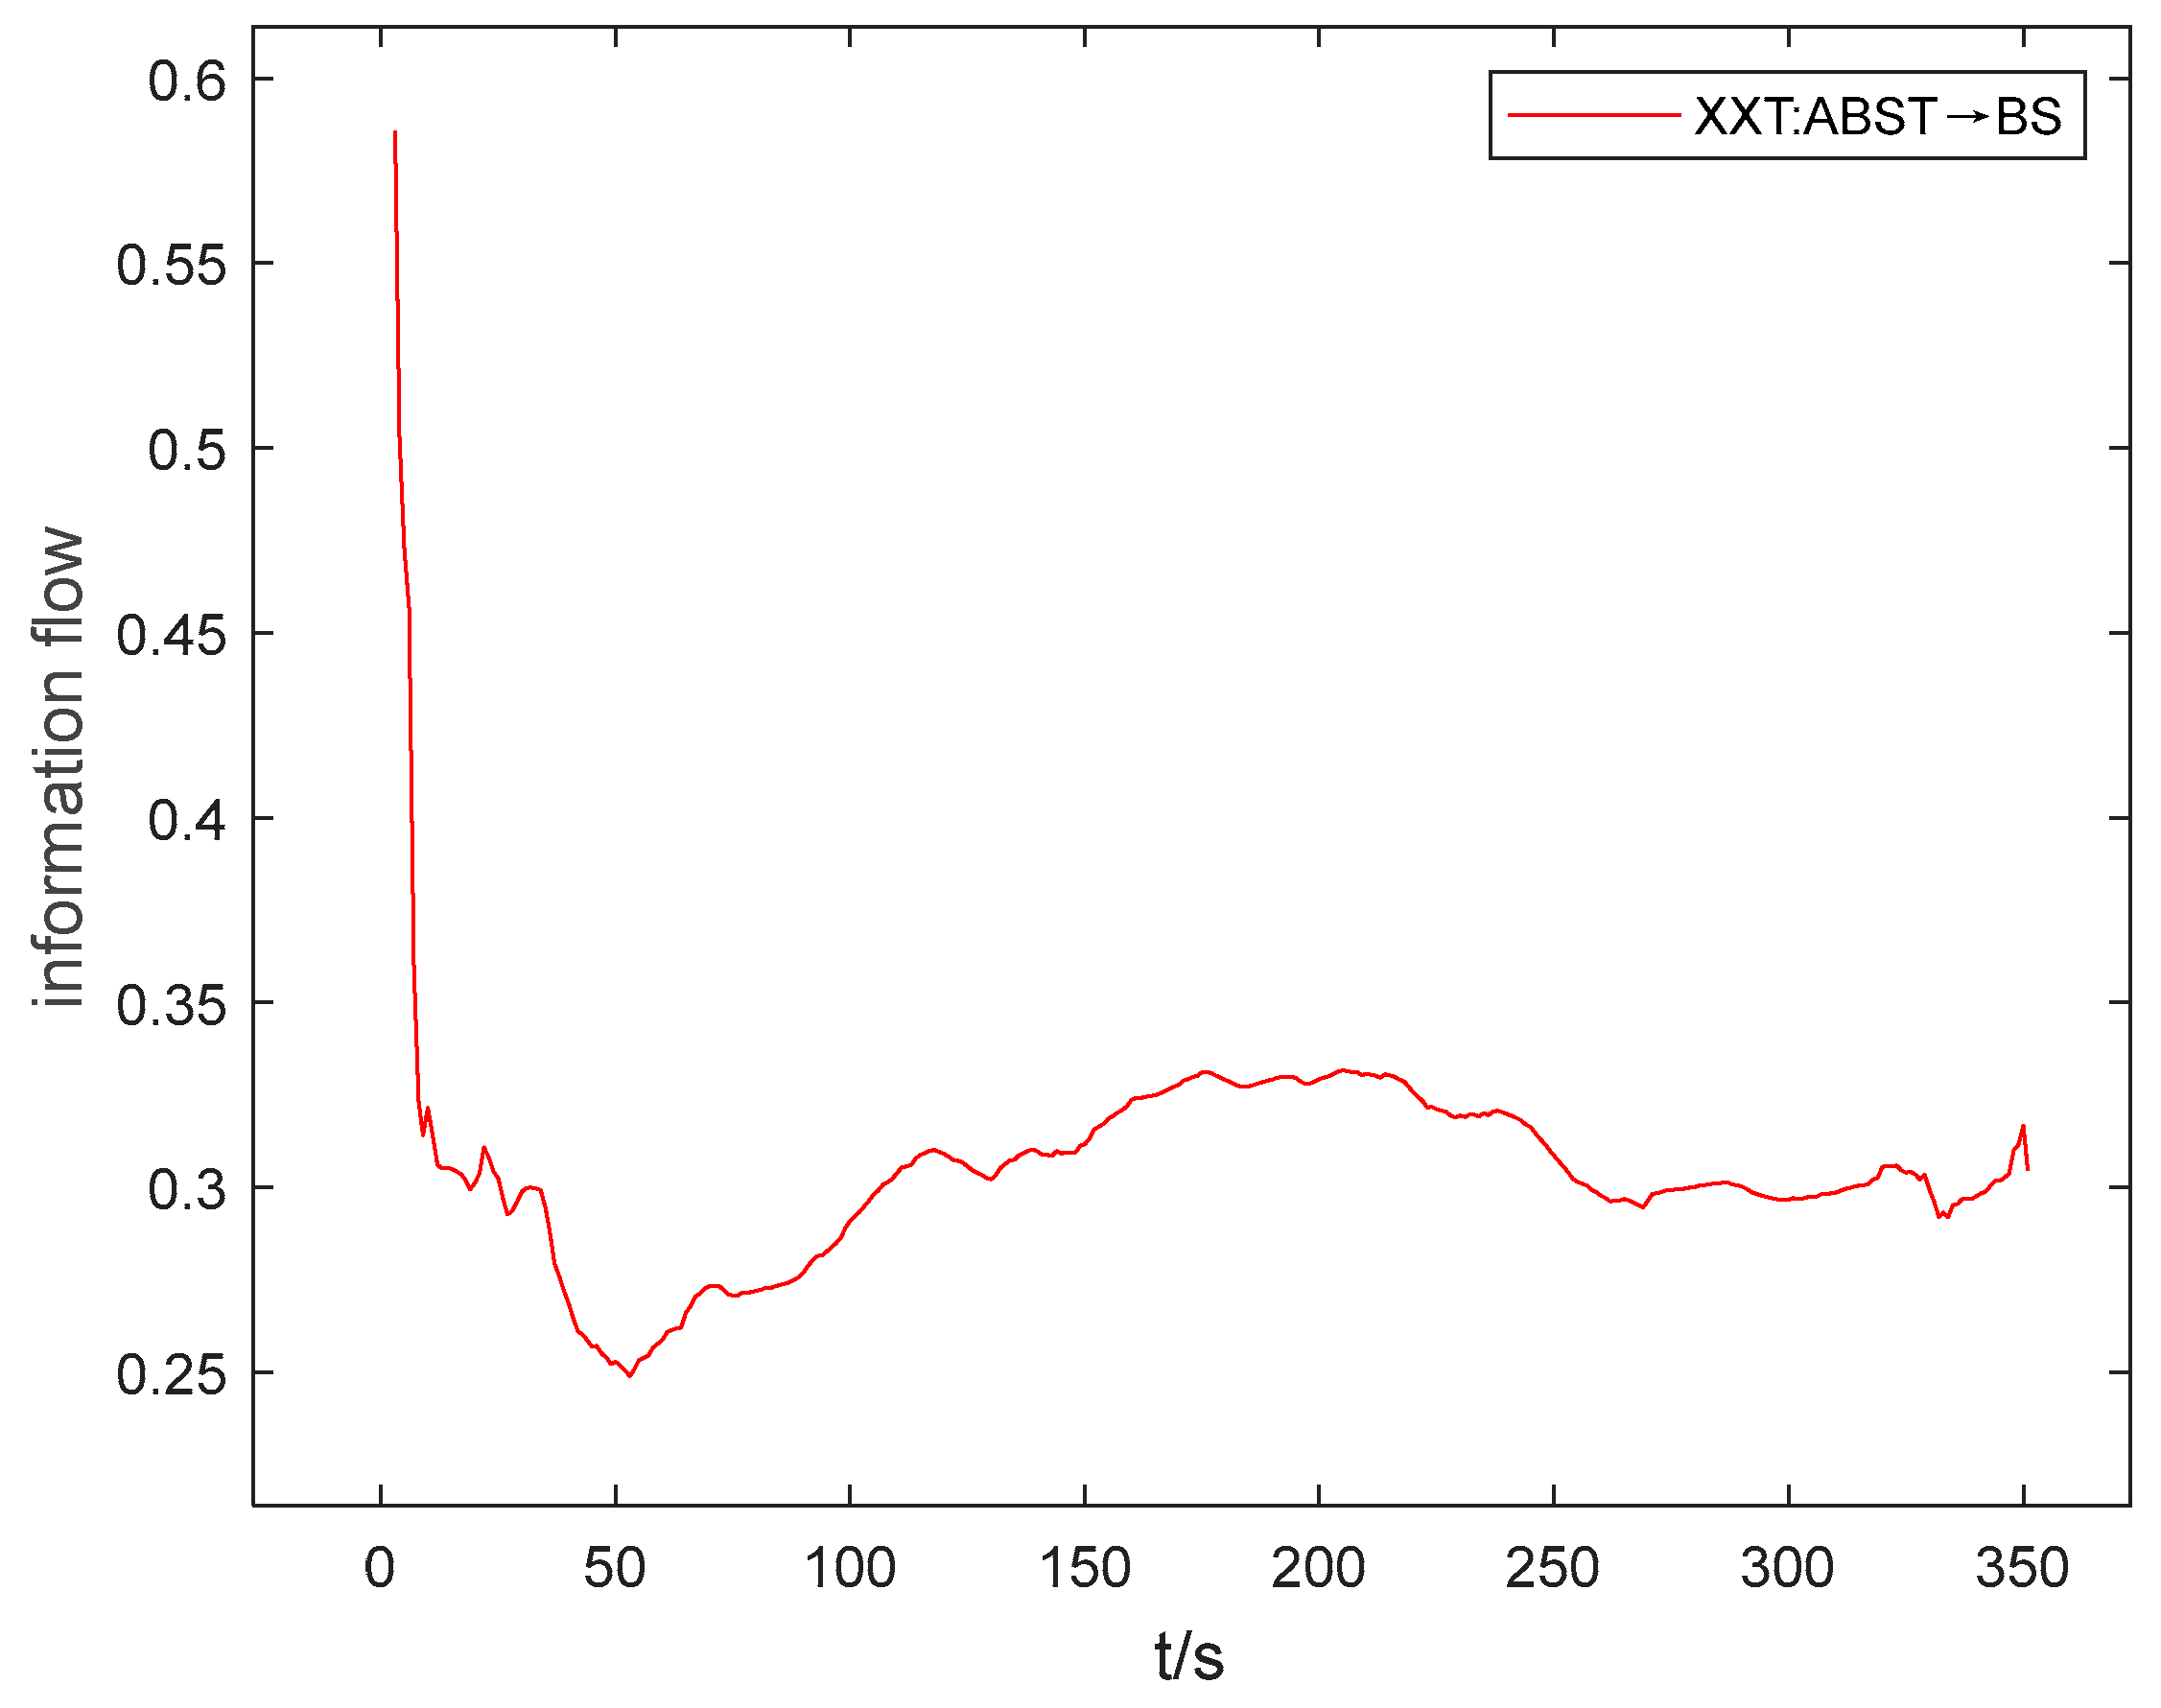
Figure 11.
YKS: information flow-t line graph on BS (the right figure is a zoom of the left figure).
Figure 11.
YKS: information flow-t line graph on BS (the right figure is a zoom of the left figure).
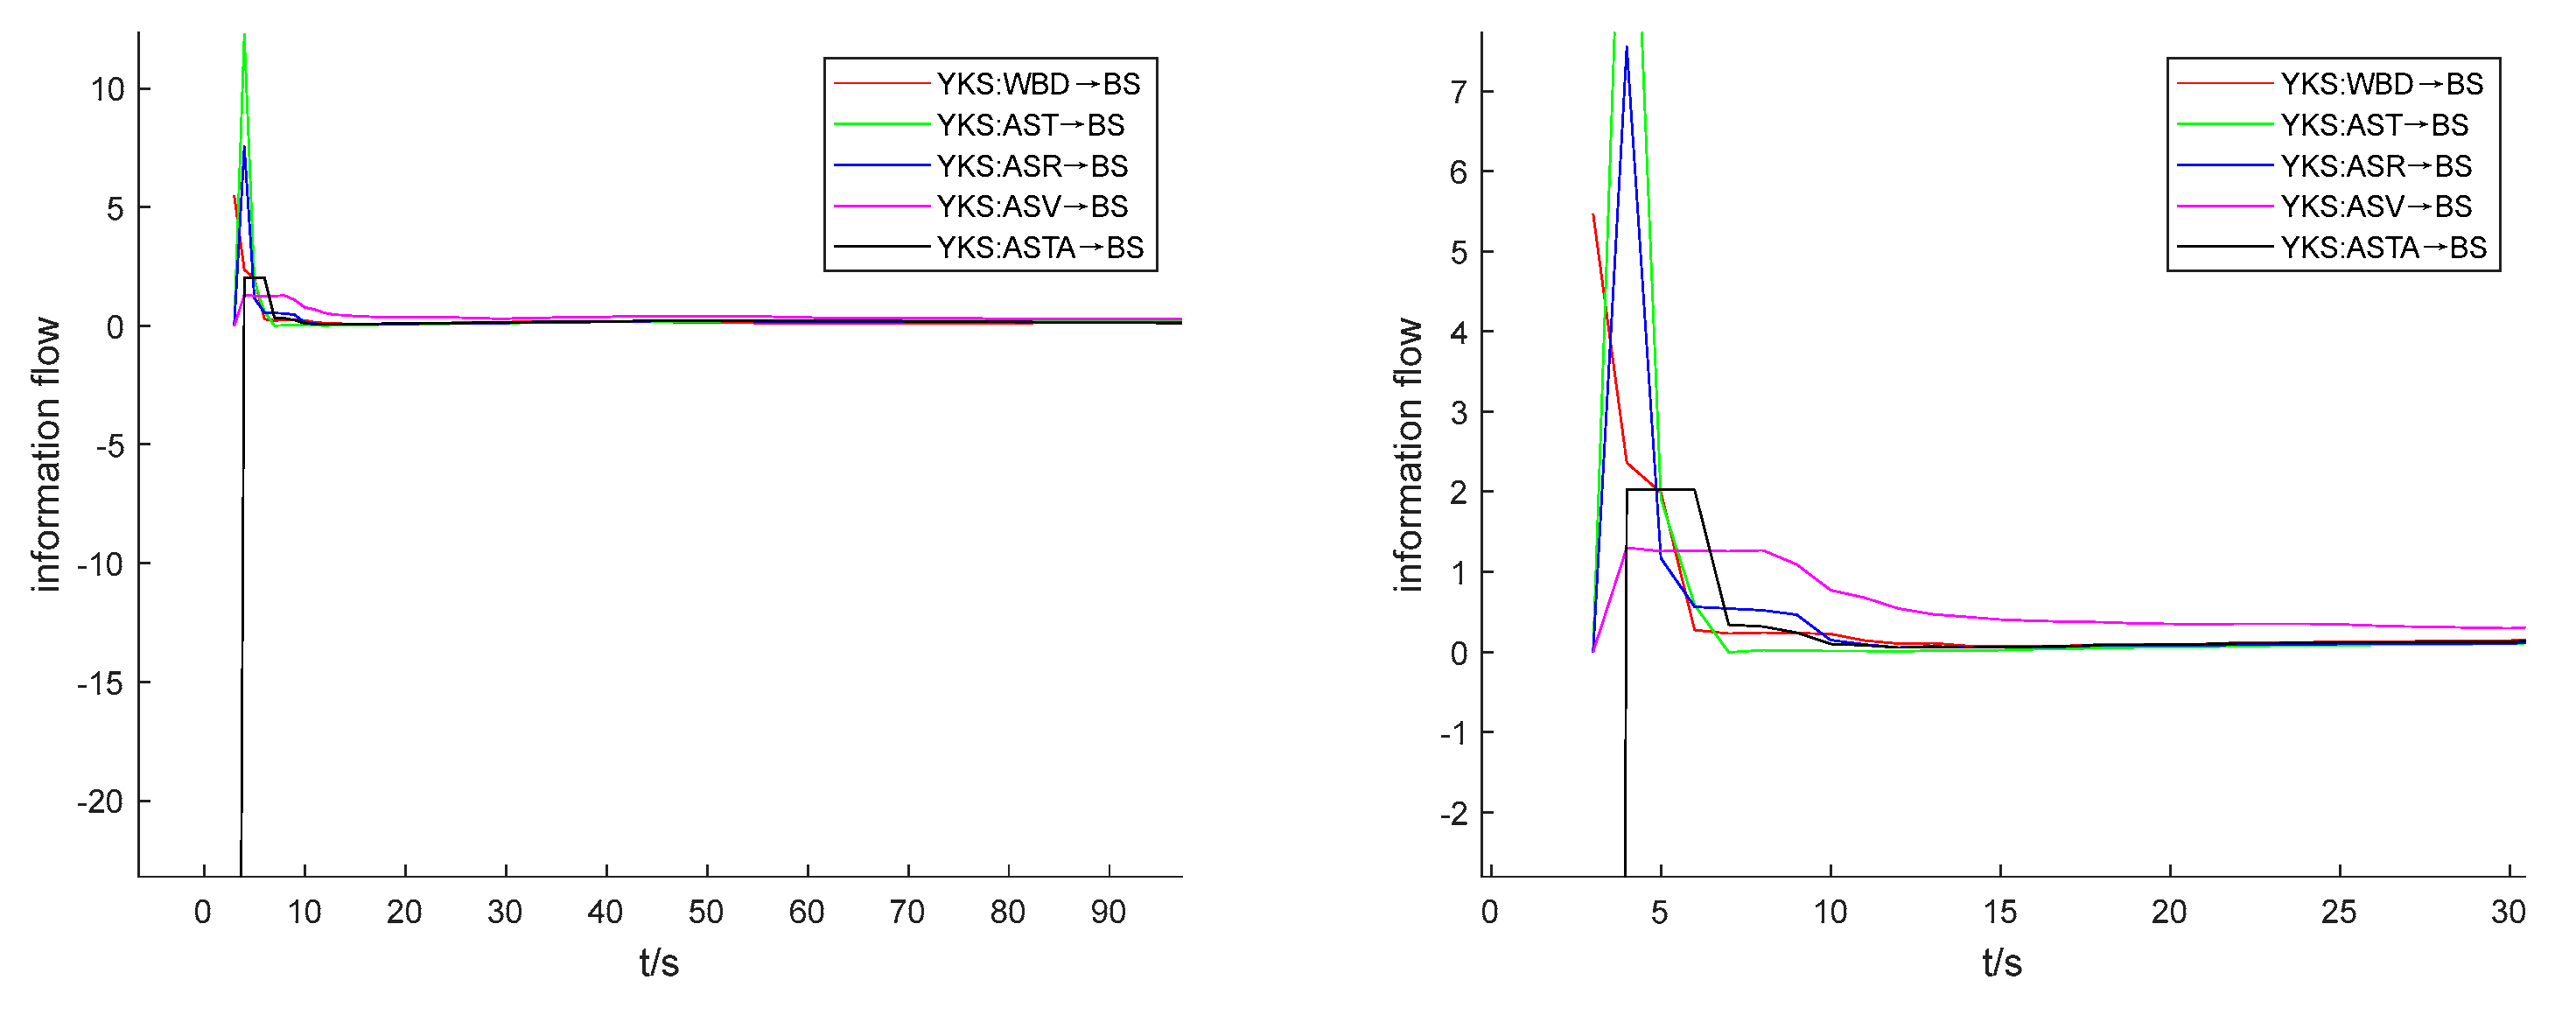

Table 1.
Basic information on different fir species.
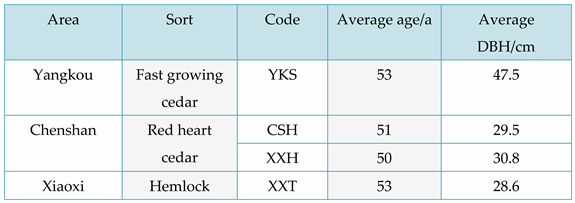 |
Table 2.
Abbreviated list of physical properties of wood.
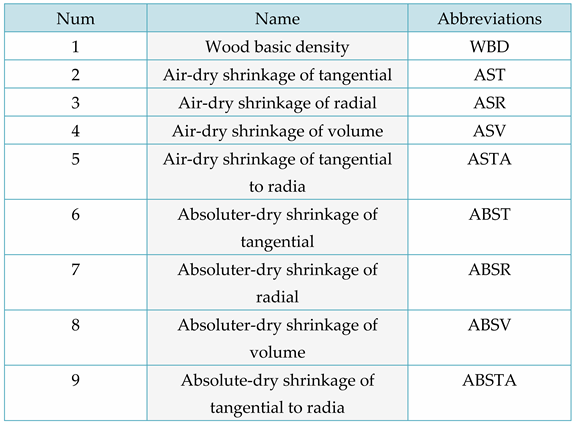 |
Table 3.
Abbreviated list of mechanical properties of wood.
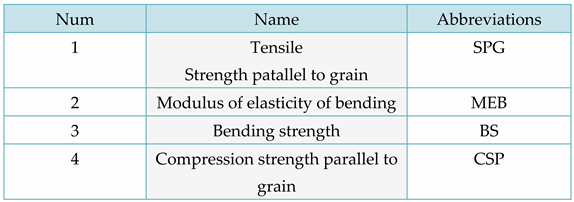 |
Table 4.
Mean value analysis of physico-mechanical properties of different species of fir trees.
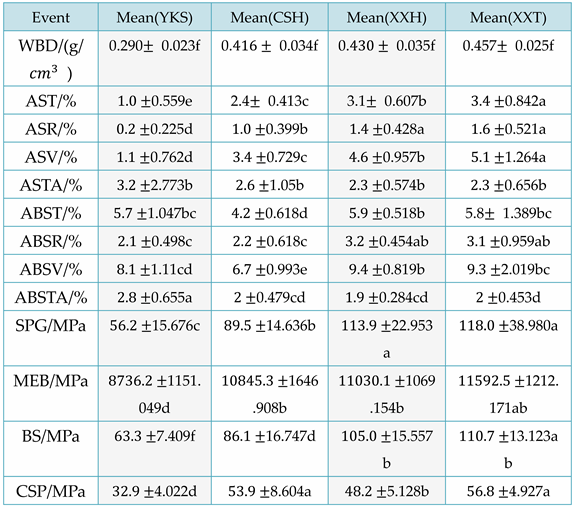 |
Note: The values after "±" in the table indicate the standard deviation of the data, and the letters in the same column are the results obtained by multiple analysis at the 0.05 level using the LSD test, in which any 2 items containing the same letter are non-significant for the difference, or else the difference is significant.
Table 5.
Coefficients of variation of L-K information flow from different physical properties of the wood to SPG.
Table 5.
Coefficients of variation of L-K information flow from different physical properties of the wood to SPG.
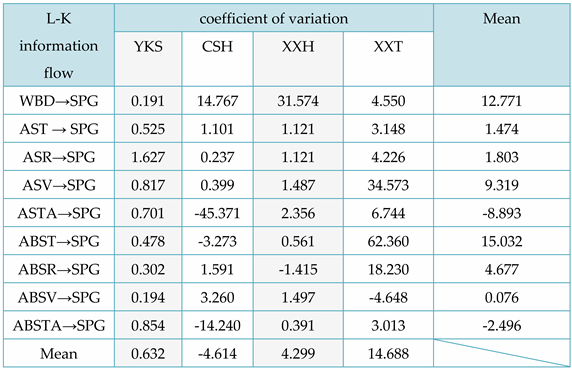 |
Table 6.
Coefficient of variation of L-K information flow from different physical properties of wood to MEB.
Table 6.
Coefficient of variation of L-K information flow from different physical properties of wood to MEB.
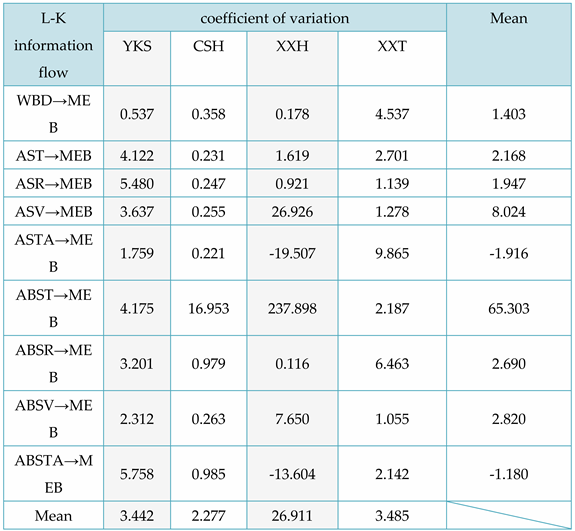 |
Table 7.
Coefficient of variation of L-K information flow from different physical properties of wood to BS.
Table 7.
Coefficient of variation of L-K information flow from different physical properties of wood to BS.
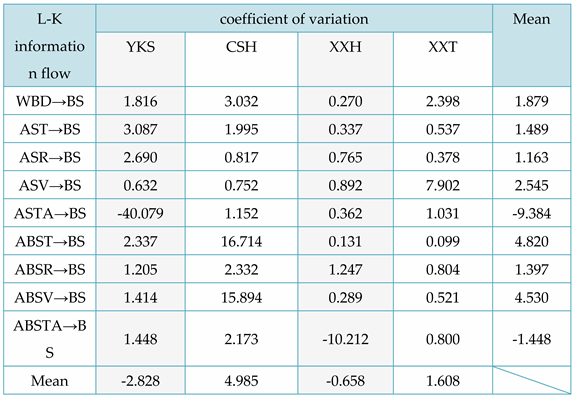 |
Table 8.
Coefficients of variation of L-K information flow from different physical properties of wood to CSP.
Table 8.
Coefficients of variation of L-K information flow from different physical properties of wood to CSP.
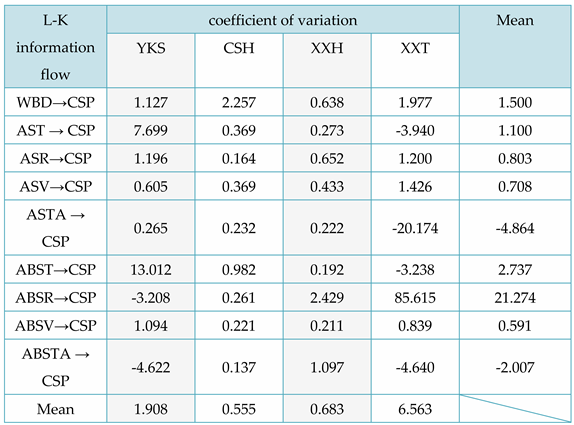 |
Table 9.
Table of Mean Values of Mechanical and Physical Properties of Special Chinese Fir.
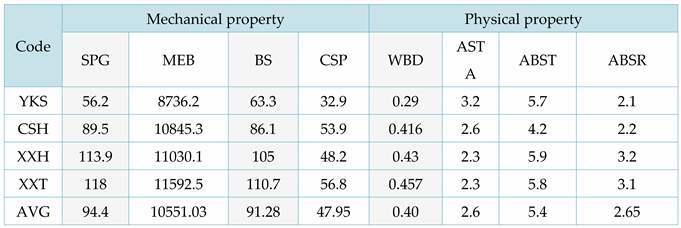 |
Table 10.
Basic information table of ordinary fir.
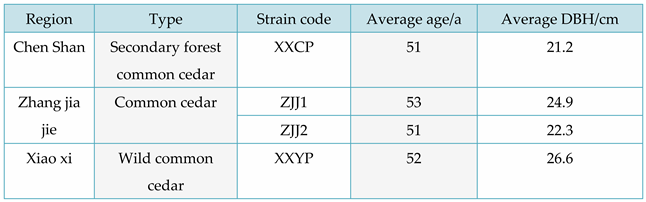 |
Table 11.
Table of Average Physical and Mechanical Properties of Ordinary Chinese Fir.
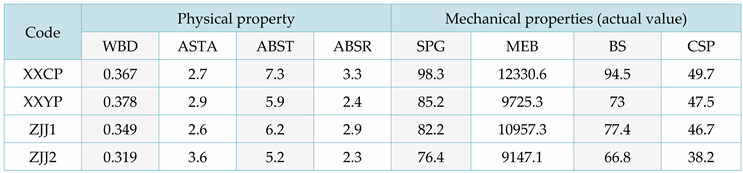 |
Table 12.
Prediction results of mechanical properties of ordinary Chinese fir.
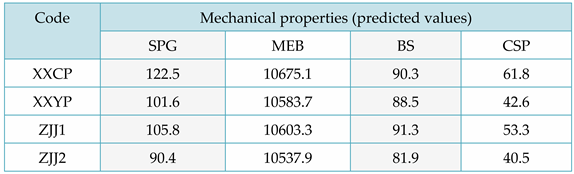 |
Table 13.
Relative error of performance prediction.
 |
Disclaimer/Publisher’s Note: The statements, opinions and data contained in all publications are solely those of the individual author(s) and contributor(s) and not of MDPI and/or the editor(s). MDPI and/or the editor(s) disclaim responsibility for any injury to people or property resulting from any ideas, methods, instructions or products referred to in the content. |
© 2023 by the authors. Licensee MDPI, Basel, Switzerland. This article is an open access article distributed under the terms and conditions of the Creative Commons Attribution (CC BY) license (http://creativecommons.org/licenses/by/4.0/).
Copyright: This open access article is published under a Creative Commons CC BY 4.0 license, which permit the free download, distribution, and reuse, provided that the author and preprint are cited in any reuse.


