
Submitted:
13 December 2023
Posted:
13 December 2023
You are already at the latest version
Abstract
Large-scale farms are pivotal sites for the development of the agricultural industry, and the quality of the ecological environment is a significant factor affecting the growth of cereal crops. Consequently, assessing the ecological quality of large-scale farms is of great importance. This paper leverages the advantages of remote sensing imagery for long-term, quantitative, and dynamic monitoring of ecological quality over extensive areas. It develops an ecological assessment procedure suitable for agricultural regions based on an Improved Remote Sensing Ecological Index (IRSEI), which considers the coupling of ecosystem component elements. This procedure introduces a Pan-Salinity Index (PSI) tailored to the characteristics of soil salinization in farming areas and incorporates an ecological greenness index based on the Normalized Difference Vegetation Index (NDVI), an ecological humidity index derived from the K-T transform (WET), an ecological dryness index synthesized from the bare soil index and the built-up index (NDBSI), and an ecological heat index represented by the Land Surface Temperature (LST) calculated from atmospheric parameter models. These five indices are integrated into the ecological assessment system. The experimental results visually demonstrate the development and changes of ecological impact factors in the farm research area over the past decade, as well as the spatiotemporal variations in the quality of the farm's ecological environment. The findings indicate that between 2010 and 2019, the overall trend of IRSEI first declined, then rose, and subsequently experienced a slight decrease. Through differential analysis, regions and areas with declining ecological quality were identified, providing a data reference for the formulation and implementation of future ecological protection and management measures for the farm. The proposed IRSEI method offers a rapid and effective new monitoring approach for agricultural planting areas with a tendency towards soil salinization.
Keywords:
large-scale farms
; ecological environment
; remote sensing imagery
; remote sensing ecological index
1. Introduction
Large-scale farms bear the critical mission of serving as the "granaries" of society. The quality of the farm's ecological environment exerts a significant influence on crop growth. Consequently, scientifically evaluating and appropriately adjusting the farm's ecological environment is vital for ensuring both high yield and quality of food crops. The ecological environment also constitutes a crucial factor affecting the sustainable development of agriculture. At present, challenges to the quality of the farm's ecological environment arise from the irrational provision of soil nutrients, increased human activities, and the processes of soil salinization due to soil moisture evaporation and salt accumulation driven by arid climates. Therefore, a rational understanding of ecological factors on farms and research into the quality of farm ecology are of paramount importance, providing data references for decision-making bodies and bearing significant practical significance.
Currently, methods for assessing the quality of the ecological environment include the Ecological Index (EI) approach and the Remote Sensing Ecological Index (RESI) approach [1]. The EI method primarily involves the coupling of individual indicators that impact the ecological environment, followed by the application of statistical techniques or mathematical models to analyze the weights of these indicators, thereby forming a comprehensive evaluation index. This index is used to explore and assess the quality of the ecological environment in the study area. For instance, some scholars have conducted a secondary classification of land use types into cultivated land and forest land, with the former including paddy fields and dry fields, and the latter comprising general forest land and shrub land. They have employed fuzzy mathematical methods to assign weights to relevant ecological indicators, proposing a regional ecological index based on EI, and quantitatively assessing the ecological environment of the study area [2]. In recent years, RESI has been widely applied to measure the ecological condition of specific study areas. Specifically, RESI utilizes remote sensing technology and mathematical models to acquire certain component indicator data, which are then synthesized to evaluate the health of ecosystems and measure the potential for sustainable development in the region. RESI can also quantitatively assess the structure, function, and services of the ecosystems under study, providing a scientific basis for ecosystem management and conservation. As the acquisition of component indicators relies on image data, researchers are required to obtain appropriate remote sensing imagery through satellites, aircraft, or other remote sensing technology platforms. The remote sensing imagery data obtained include multispectral, hyperspectral, and radar data types. Only after data preprocessing procedures such as radiometric calibration, atmospheric correction, geometric correction, and noise reduction are completed, can the models be used to calculate the relevant indicators.
The RSEI has been extensively applied in the assessment studies of various land cover types. These studies encompass evaluations of urban ecological environment quality [3,4,5], rural ecological environment quality [6,7], forestland ecological environment quality [8], wetland ecological environment quality [9,10], island ecological environment quality [11], and arid desert region ecological environment quality [12], among others. The widespread application across diverse land cover types can be attributed to the RSEI's robust periodicity and its efficient, objective characteristics. In agricultural planting areas, such as large farms, RSEI can accurately assess the growth environment of crops through remote sensing data in conjunction with relevant models. It can reveal the characteristics and dynamics of the farm's ecological environment and provide a scientific basis for planting environment management and farmland protection decisions. Consequently, this enhances the efficiency of agricultural production and the utilization rate of agricultural resources.
Research on the RSEI typically integrates four component indicators that represent the quality of the ecological environment: greenness, humidity, dryness, and heat. By coupling these component indicators, a comprehensive index is formed that can holistically assess the regional ecological environment quality. The principle of indicator acquisition should be such that it reflects the ecological characteristics and trends of the agricultural ecological environment, thereby providing a scientific basis for its evaluation [13]. This paper, addressing the semi-arid characteristics of the study area's farms and the environmental feature of soil salinization, incorporates the soil salinity indicator into the theoretical framework of the remote sensing ecological index. Consequently, an Improved Remote Sensing Ecological Index (IRSEI) model is proposed. This model has been applied to ecological detection at the Tenihe Farm in Northeast China, assessing the ecological quality of the farm over the past decade and analyzing its changing trends, with the aim of providing scientific data references for subsequent ecological protection measures.
2. Research Area and Data
2.1. Introduction to the Research Area
The Tenihe Farm was established in July 1955 and comprises 11 planting divisions, representing an agricultural reclamation enterprise with a modern management level. Geographically situated in the northern section of the Daxing'anling mountain area, the eastern and northern parts of the farm fall within the stony mid-mountain sub-region of the northern Daxing'anling, while the western and southern parts belong to the stony low-mountain sub-region of the northern Daxing'anling's western slope [14]. The overall topography is characterized by lower elevations in the west and higher in the east, with a regional distribution of rocks, among which granite occupies a significant area. Together with other types of igneous rocks, these form a terrain that combines plains with mountainous features, thus exhibiting typical riparian geomorphological characteristics [14]. The mountains, shaped by long-term weathering and erosion, have gentle slopes. The total area of the farm is approximately 1,900 square kilometers, with about 670,000 mu of arable land available for cultivation. It is located between 119°45′-120°60′East longitude and 49°10′-49°55′North latitude, with elevations ranging from 628 to 1,064 meters. The cropping system of the farm's agriculture is based on a single harvest per year, with land preparation and sowing typically carried out in May, and crop harvesting generally completed by October. The water requirements for the crops during the growing season are primarily met by natural precipitation.
The geographical location and basic information of the Tenihe Farm are illustrated in Figure 1 below:
2.2. Data Preparation
The experimental data presented in this chapter predominantly consist of Landsat satellite imagery spanning approximately a decade, pertinent to the study area. Due to the geographical extent of the Tenihe Farm, it was necessary to utilize two separate images to achieve complete coverage, resulting in the acquisition of eight remote sensing image datasets. These datasets include Landsat TM (Thematic Mapper) imagery from 2010, Landsat ETM (Enhanced Thematic Mapper) imagery from 2013, as well as Landsat OLI (Operational Land Imager) imagery from the years 2016 and 2019. The procurement of the Landsat series imagery was facilitated through the Geospatial Data Cloud website (https://www.gscloud.cn/). The selection of the sensor imagery was strategically timed to avoid the ice and snow seasons. The extensive presence of ice and snow can obscure a variety of surface features, significantly impacting the sensor's ability to accurately detect the true nature of the ground objects. The months in which the imagery was captured ranged from late April to October, a period deliberately chosen due to the minimal cloud cover in the images. This timeframe also coincides with the growing and harvesting seasons of crops, as well as the peak growth period for surrounding vegetation, making it more conducive for ecological detection. Employing the IIRSEI method within this context yielded more reliable evaluative results [15].
The acquired imagery data necessitates a series of preprocessing steps prior to the computation of indices to enhance the accuracy of subsequent spectral band calculations. The rationale for preprocessing is attributed to the fact that detectors and other instruments are influenced by factors such as atmospheric radiation, the satellite's orientation during flight, the solar zenith angle, and the conditions of the Earth's surface coverage. Moreover, the multitude of radiometric information obtained through remote sensing methods undergoes physical alterations such as absorption or scattering upon interaction with the atmosphere, leading to attenuation of the radiative energy and consequently, introducing errors into the spectral information captured. Preprocessing enables the correction of distortions in remote sensing imagery, as well as the reduction or elimination of noise impacts, thereby ensuring more accurate geometric features of the imagery and information content that is more representative of reality. The remote sensing image preprocessing workflow conducted in this chapter primarily encompasses radiometric calibration, atmospheric correction, image mosaicking, image cropping, and the combination of image bands. The remote sensing imagery of the experimental farm area, post-preprocessing, is illustrated in the Figure 2 below:
3. Methods
3.1. Overview
The experimental procedure of the present study is illustrated in Figure 3. The specific steps are as follows: Firstly, preprocessing operations on remote sensing imagery are conducted, which primarily involve radiometric calibration and atmospheric correction of the raw remote sensing images, followed by mosaicking and cropping of the corrected images to ensure that the cropped images are well-suited to the study area's boundaries. Secondly, the computation of the five component indices of IRSEI is carried out, with the calculation of these indices referencing several literatures. Through the dissection of algorithms, more appropriate expressions are selected, and certain algorithmic models are transformed into parameter settings for the computation of remote sensing image bands, resulting in the acquisition of specific values and distribution characteristics of the component indices. Thirdly, the five component indices—greenness, humidity, dryness, heat, and salinity—are standardized and fused, followed by principal component analysis to obtain statistical information of each component. Subsequently, the first principal component post-transformation is utilized as the representative component encapsulating the primary information of the indices. Fourthly, mathematical transformations are applied to determine the spatiotemporal variation characteristics of the IRSEI for the farm research area.
3.2. Calculation of Component Indicators
Prior to the comprehensive computation of IRSEI, it is imperative to explore and calculate the component indices within the IRSEI framework. As critical constituents in the assessment of the ecological environmental quality of the farm research area, these component indices require precise control to provide an accurate data foundation for the subsequent coupling of component indices. The theoretical underpinnings and specific calculation methods for the five component indices—greenness, humidity, dryness, heat, and salinity—are elaborated in detail below.
3.2.1. Calculation of Greenness Index
In the context of the IRSEI framework, the greenness index is an important indicator representing the quality of the ecological environment. This paper utilizes the normalized difference vegetation index (NDVI) for characterizing the greenness index [16]. Vegetation, as a vital component of ecosystems, plays an indelible role in the Earth's carbon cycle and climate dynamics. NDVI is a commonly used remote sensing index that can also be employed for assessing and monitoring the condition and growth of vegetation. Specifically, it reflects the greenness and growth status of vegetation by calculating the difference between the infrared and visible light bands in remote sensing images. The formula for calculating NDVI is as follows:
Wherein represents the reflectance in the near-infrared band, and represents the reflectance in the visible light red band. The value range of is from -1 to 1, with higher values indicating more vegetation cover and lower values indicating less.
The principle of is based on the reflective characteristics of vegetation across different spectral bands. Vegetation reflects higher in the infrared band and lower in the visible light red band. Therefore, can reflect the greenness and growth condition of vegetation by calculating the difference between the reflectances in the infrared and visible light red bands. A higher value typically indicates more vegetation cover and better growth conditions, while a lower value indicates less vegetation cover and poorer growth conditions. finds extensive applications in fields such as agriculture, forestry, and environmental monitoring. It can be utilized for vegetation monitoring, land use research, drought monitoring, pest and disease early warning, providing a crucial index for evaluating and monitoring vegetation status.
3.2.2. Calculation of Humidity Index
The humidity index primarily characterizes the moisture content of vegetation and soil within image coverage. This index is extensively employed across various domains, such as ecological environment monitoring and evaluation. The humidity index can be represented by the WET component of the Tasseled Cap Transform (TCT), also known as the K-T transform. The WET component is essentially a feature component generated through the K-T transform [17] The K-T transform can be viewed as a specialized form of principal component analysis (PCA). However, a notable distinction is that, unlike conventional PCA, the K-T transform utilizes a fixed transformation matrix. The K-T transform introduces a constant matrix into the digitized original remote sensing image and translates it into a new feature space, whereby humidity can be aptly transformed to obtain results. The transformed components can enhance image information and effectively represent spatial moisture content. The transformation formula is as follows:
Wherein, represents the image after the K-T transformation; denotes the matrix coefficients of the transformation; signifies the original image. To perform a K-T transformation on remote sensing images, it is necessary to obtain information about the transformation matrix coefficients. The transformation matrix coefficients vary with the different settings of satellite sensors, and thus, the coefficient settings of the WET calculation formula are not identical. Through expert experience summarization, the humidity calculation formula corresponding to different Landsat satellite sensors can be realized through different parameter settings [18,19]. The specific settings of the transformation matrix coefficients for the humidity index are shown in Table 1 below:
Through the configuration of different K-T transformation matrix coefficients, various WET index calculation formulas for different sensors can be derived, as shown below:
The WET index calculation formula for Landsat 5 TM is as follows:
The WET index calculation formula for Landsat 7 ETM+ is as follows:
The WET index calculation formula for Landsat 8 OLI is as follows:
In the aforementioned three equations, represents the reflectance in the blue band; denotes the reflectance in the green band; signifies the reflectance in the red band; corresponds to the reflectance in the near-infrared band; is indicative of the reflectance in the shortwave infrared-1 band; and stands for the reflectance in the shortwave infrared-2 band. A higher WET value suggests increased humidity.
3.2.3. Calculation of Dryness Index
Due to the presence of human settlements and construction areas in the study area, as well as the existence of bare soil, the aridity index in this chapter is characterized using a composite approach combining the Building Index and the Bare Soil Index. These two indices can to some extent reflect the condition of soil health, soil aridification phenomena, and consequently, to a certain degree, the changes and quality of the local ecological environment. The aridity index, known as the Normalized Difference Build and Soil Index (NDBSI) [20], is calculated by adding the Soil Erosion Index (SI) [21] and the Index-based Build-up Index (IBI) [22], and then averaging the result. The SI and IBI indices can be expressed using different band calculation formulations. The specific formulas are as follows:
In this context, represents the reflectance in the shortwave infrared 1 (SWIR1) band; represents the reflectance in the visible red band; represents the reflectance in the near-infrared band; represents the reflectance in the visible blue band; and represents the reflectance in the visible green band. The values of these parameters typically range from -1 to 1. Because these indicators characterize two types of content, namely, content that enhances dryness and content that reduces dryness, where the enhancing content typically includes buildings and bare soil, while content that reduces dryness includes vegetation and water bodies, among others.
3.2.4. Calculation of Heat Index
This study investigates the use of land surface temperature (LST) as a representation of heat [23]. The thermal infrared bands of the Landsat satellite series are sensitive to the thermal radiation of surface coverings, making them extensively utilized in monitoring LST variations [24]. Regarding LST computation, there are two conventional methodologies: the single-channel algorithm and the multi-channel algorithm. The single-channel algorithm encompasses methods such as atmospheric correction (also referred to as the radiative transfer equation), the universal single-channel method, and the single-window algorithm. The multi-channel algorithm primarily includes the split-window algorithm and the temperature emissivity separation algorithm. In this chapter, the atmospheric correction method is adopted for LST inversion. The principle of calculating surface temperature using the atmospheric correction method involves initially aggregating the total thermal radiation detected by the satellite sensor. Subsequently, various techniques are employed to simulate and quantify the atmospheric influence on surface thermal radiation. The total thermal radiation is then reduced by the radiation amount consumed by atmospheric effects, yielding the actual thermal radiation at the surface. This genuine surface thermal radiation undergoes mathematical transformation to derive the inverted surface temperature. The process of calculating surface temperature using the atmospheric correction method can be illustrated as shown in the following figure 4:
From Figure 4, it is discernible that the computation of surface temperature necessitates several intermediary steps for realization, involving the acquisition of remote sensing imagery and some preprocessing routines, as well as the calculation of certain indices and parameter retrieval. The specific intermediary processes and steps are elaborated in detail in the following text.
- (1)
- Radiometric calibration
Utilizing atmospheric correction, an initial step involves conducting radiometric calibration on the thermal infrared band to obtain radiance imagery. It is noteworthy that the thermal infrared bands of Landsat 7 and Landsat 8 sensors are not identical; Landsat 7 operates in the sixth band, while Landsat 8 operates in the tenth and eleventh bands, with the tenth band being employed for operations in this study.
- (2)
- NDVI calculation
The calculation of the NDVI is synonymous with the computation of the greenness index, as seen in Equation 1.
- (3)
- Vegetation cover calculation
Vegetation cover is primarily calculated by comparing the vertical projection area of vegetation on the surface to the overall area of the study region, including branches, stems, and leaves in the projection. Numerous studies focus on estimating vegetation cover using remote sensing methods, among which the utilization of vegetation indices is a frequently applied approach. A commonly used vegetation index is expressed through . The vegetation cover in this chapter's experiment is mainly calculated through . In the imagery, areas with and without vegetation cover, as well as purely vegetated areas, are present. Vegetation cover is characterized by calculating the ratio of the difference between and the non-vegetated area to the difference between purely vegetated and non-vegetated areas. The formula can be expressed as follows:
Herein, represents the magnitude of vegetation coverage; denotes the value for areas devoid of vegetation coverage; and signifies the value for purely vegetated areas. In the experiments of this chapter, based on empirical evidence, and are set to 0.05 and 0.7, respectively. This implies that when the value of within a pixel exceeds 0.7, the value of is set to 1; when the value of within a pixel is less than 0.05, the value of is set to 0 [25].
By integrating the formula for vegetation coverage with the set parameters for and , the formula can be transformed into a band calculation method. The band calculation formula is as follows:
Herein, is the result of .
- (1)
- Calculation of Surface Emissivity (SE)
Based on prior research, remote sensing images are categorized into three types: water bodies, urban areas, and natural surfaces [26]. In this chapter, the following methodology is adopted to compute the surface emissivity for the study area: the emissivity value for water body pixels is set at 0.995, while the emissivity estimates for natural surface pixels and urban pixels are represented by and , respectively [25,26]. The specific formulae are as follows:
Incorporating the parameters allows for the transformation of the equation into a band calculation method. The formula for band calculation is as follows:
where denotes the surface reflectance ratio; represents the value of ; and signifies the vegetation cover fraction .
- (2)
- Calculation of blackbody radiance values under identical temperature conditions
The computation of radiance values involves three types of radiative signals received by the detector from the Landsat satellite. The first signal pertains to the atmospheric transmittance in the thermal infrared band, which represents the portion of ground-level radiance that, after being filtered by the atmosphere, is captured by the satellite sensor (). The second signal is the upward atmospheric radiance (). The third signal is the energy reflected back after being radiated downwards by the atmosphere and received by the detector (). These three sets of data can be accessed from the website published by NASA (http://atmcorr.gsfc.nasa.gov/). It's noteworthy that during the query, one needs to provide the imaging time, the central latitude and longitude of the image, and other relevant parameters. For ease of calculation, the radiance value parameters for four remote sensing images from the experimental area are presented in Table 2:
Upon acquiring the values of , , and , the formula for calculating the brightness value (L) of thermal infrared radiation received by the satellite can be expressed as follows:
where represents the true surface temperature; denotes the surface emissivity; signifies the atmospheric transmittance under thermal infrared conditions; and stands for the blackbody brightness value of thermal radiation.
From the aforementioned equation, the brightness value of the blackbody radiation in the thermal infrared band at temperature can be derived, and the formula is presented as follows:
Through the intervention of the inverse function of Planck's Law, the surface temperature can be obtained. It is noteworthy that the actual surface temperature obtained at this point is expressed in Kelvin (K), not the Celsius (℃) unit commonly used in general contexts. Consequently, a conversion of temperature units is requisite. Converting Kelvin to Celsius merely necessitates subtracting 273.15 from the original temperature. Hence, the expression for LST is as follows:
In this context, and represent predefined constants prior to the satellite launch. The settings for and for different sensor types of Landsat satellites are presented in Table 3.
Due to the susceptibility of the 11th band of Landsat 8 TIRS to interference from stray light and other noise, calibration can introduce significant biases. If incorporated into calculations, it may compromise the accuracy of subsequent results [27]. Hence, this study utilizes the 10th shortwave band of Landsat 8 TIRS for computation, employing the corresponding K1 and K2 values from the table for analysis.
When translated into band calculation format, the formula is as follows:
Within this context, b1 represents the blackbody radiance image under identical temperature conditions.
From this, the Celsius temperature band calculation formula for Landsat 5 TM can be derived as:
The Celsius temperature band calculation formula for Landsat 7 ETM+ is as follows:
The Celsius temperature band calculation formula for Landsat 8 TIRS is as follows:
where b1 are the blackbody radiance brightness images for the same temperature conditions.
3.2.5. Calculation of Salinity Index
Salinization, as a form of soil degradation, primarily refers to the phenomenon where salts from the deep soil layers and groundwater are transported to the surface through tubular pathways, resulting in the accumulation of salts on the soil surface following the evaporation of saline water. The occurrence of soil salinization is the outcome of both natural and anthropogenic factors. Natural factors are influenced by the parent material of soil formation, topography, climate, water quality, and the level of the underground water table; whereas human factors include unscientific irrigation and drainage practices, and the excessive application of pesticides and fertilizers. Currently, over 100 countries worldwide are affected by salinized soils, with the global total area exceeding 950 million hectares, and this area is continuing to expand annually [28,29]. In China, salinized soils are widespread, with potential large-scale soil salinization changes occurring in the regions of North China, Northeast China, and Northwest China [30]. For instance, in some agricultural reclamation areas of the Hulunbuir region in Northeast China, which is characterized by a semi-arid climate with low precipitation and high evaporation, the long-term use of pesticides and fertilizers in planting soils is leading to salinization changes. The issue of soil salinization can lead to reduced soil productivity, thereby decreasing agricultural production efficiency and exacerbating the deterioration of the agricultural ecological environment, which in turn has adverse effects on the socio-economic landscape [31,32]. Hence, conducting research on regional soil salinization conditions to comprehensively identify potential risks is instrumental for the scientific and rational planning of land resources, which can enhance the intrinsic productivity of the soil and contribute to ecological improvement [33]. Therefore, by employing certain technical methods to thoroughly understand the spatial distribution of soil salinization, it is possible to diagnose salinized soils and implement customized measures to prevent the worsening of soil salinization, improve land use efficiency in agricultural areas, and achieve the goals of ecological sustainability.
Soil salinity serves as an effective evaluative metric for the degree of soil salinization. Given that the visible and near-infrared spectral bands of remote sensing exhibit certain responses to soil salinity, it is feasible to consider the estimation of soil salinity information via remote sensing techniques. Recently, the inversion research of soil salinity indices using remote sensing spectral information has garnered increasing attention. This method holds advantages for large-scale monitoring, offering benefits such as a continuous temporal sequence and strong timeliness of data. The results of remote sensing inversion estimation can also serve as a reference, providing assistance for subsequent soil environmental remediation and land reclamation efforts [34]. This paper employs a pan-salinity index (PSI) that integrates three different remote sensing salinity indices to quantify the soil salinity index of the study area. The first method of integration is the SI-S method [35], which utilizes the red, green, blue, and near-infrared spectral bands for the estimation of the soil salinity index. The calculation formula is as follows:
In this context, denotes the reflectance of the near-infrared band; represents the reflectance of the red band; signifies the reflectance of the green band; corresponds to reflectance of the blue band.
The second fusion method is the SI-W method [36], which utilizes the red and green bands for estimating the soil salinity index. The calculation formula is presented below:
where represents the reflectance of the green band, and denotes the reflectance of the red band.
The third fusion method is the SI-K method [37], which employs the red band and the near-infrared band to estimate the soil salinity index. The calculation formula is as follows:
where represents the reflectance of the red band, and denotes the reflectance of the near-infrared band.
Fusion is conducted by adding the values and then calculating the mean. Prior to fusion, the three indices are normalized to constrain the values within the range of 0 to 1. Given that the SI-S index is negatively correlated with the soil salinity index, a positive correlation transformation is performed in advance. The resultant PSI exhibits a positive correlation with the soil salinity conditions, whereby higher values indicate a greater degree of salinity, and lower values suggest reduced soil salinity. The calculation formula for PSI is as follows:
where represents the normalized value of after a positive correlation transformation, denotes the normalized value of , and indicates the normalized value of .
3.3. Calculation of IRSEI
The Principal Component Analysis (PCA) method is employed to perform a principal component transformation on five indicators. Prior to executing the principal component transformation, it is imperative to normalize the five component indicators. In the experiment of this chapter, range normalization method is utilized, standardizing the numerical values of the component indicators to a uniform scale between 0 and 1. The computational formula for the range normalization method is as follows:
wherein, represents the value of the component indicator after standardization; represents the numerical value of a single indicator; represents the maximum value within the indicator range; and represents the minimum value within the indicator range.
Subsequent to the principal component transformation, the first principal component often contributes a substantial proportion and can purely and objectively represent ecological characteristics. The following second, third, fourth, and five principal components frequently contain disordered information; indiscriminately incorporating them into calculations may result in a loss of fairness in the final results. Therefore, the transformed first principal component can represent the general trend of comprehensive ecological characteristics. The transformed first principal component can represent the initial remote sensing ecological index value, denoted as , and its formulaic expression can be presented as follows:
For the convenience of statistical analysis, it is necessary to standardize , yielding . Hence, can be expressed as:
wherein, represents the value after standardization; represents the initial value of the remote sensing ecological index; represents the minimum value among the initial values; and represents the maximum value among the initial values. The interval of is between 0 and 1, where a high value indicates good ecological environment quality and a low value indicates poorer ecological environment quality.
4. Results
4.1. Results of Component Indicators
To facilitate presentation, this paper has standardized the dimensions, and the results of the five component indices of the Tenihe Farm IRSEI are displayed using normalized outcomes. The results of component indices for the farm in the years 2010, 2013, 2016, and 2019 are as follows.
4.1.1. Results of Greenness Index
As can be observed from Figure 5, the remote sensing ecological NDVI results for the Tenihe Farm have been favorable over the past decade. Although there have been instances of diminished performance in certain years, the greenness index has remained relatively high for the majority of the period under consideration. This indicates that the vegetation cover in the study area has maintained a consistently positive state over an extended duration.
4.1.2. Results of Humidity Index
Figure 6 reveals that the ecological WET index for the Tenihe Farm has exhibited a relatively stable performance over the course of a decade. The ecological moisture index for the entire study area has demonstrated a favorable condition in recent years, with both soil and surface vegetation maintaining satisfactory levels of moisture.
4.1.3. Results of Dryness Index
Examination of Figure 7 indicates that the ecological NDBSI index for the Tenihe Farm has undergone some variations over the past decade. For instance, in 2019, the NDBSI index was observed to be at a low value state, whereas in 2013, the NDBSI value was comparatively higher. Theoretically, the NDBSI is considered to exert a negative impact on the ecosystem. However, a comprehensive reflection of the overall ecological index can only be ascertained through an integrated analysis in conjunction with other component indices.
4.1.4. Results of Heat Index
Analysis of Figure 8 reveals that the ecological LST index for the Tenihe Farm has maintained a relatively stable state over the past decade. This suggests that there has been minimal variation in surface temperature during the crop growing seasons, indicating conditions that are conducive to crop growth.
4.1.5. Results of Salinity Index
The graphical representation in Figure 9 illustrates that the salinity distribution within the Tenihe Farm in the years 2010, 2013, and 2019 is characterized by lower values in the northeastern part and higher values in the southwestern part. Conversely, the salinity distribution in 2016 appears to be more uniform across the region. The peak in overall salinity levels was recorded in 2016, while the lowest overall salinity levels were observed in 2019.
The series of figures presented herein illustrate developmental variations over the course of a decade in the indices of greenness, humidity, dryness, heat, and salinity at the Tenihe Farm. These fluctuations indicate that the ecological environment is subject to dynamic transitions. Alterations in the indicators that affect the ecological environment inevitably precipitate a shift in the overall quality of the ecological milieu. The mean values and standard deviations of these five component indices over the ten-year period are depicted in Figure 10.
Figure 10 reveals that the five component indices impacting the ecological environment quality at Tenihe Farm have experienced fluctuations and changes over the past decade, a phenomenon attributable to the combined effects of natural factors and human activities. Notably, the mean peak values for the greenness and salinity indices were recorded in 2019, while the humidity, dryness, and heat indices reached their mean peak values in 2013. The mean minimum values for the greenness, humidity, and heat indices all occurred in 2016. In contrast, the dryness index presented its mean minimum value in 2019, and the salinity index did so in 2013.
4.2. Results of IRSEI
4.2.1. Validity Analysis of IRSEI
The component indices were normalized and subsequently transformed through PCA, resulting in a remote sensing image that integrates a novel spectral combination of five principal components. This image constitutes the new representative layer for the IRSEI model, and the eigenvalues for each principal component were ascertained. The eigenvalues and corresponding contribution percentages of the five principal components, PC1, PC2, PC3, PC4, and PC5 post,-transformation, offer a more precise delineation of the outcomes derived from the PCA. Within the IRSEI framework for the Tenihe Farm experimental zone, the eigenvalues and contribution percentages of the five newly derived principal components, subsequent to the PCA of the five component indices—NDVI, WET, NDBSI, LST, and PSI—are shown in Table 4.
The table above illustrates that, over the past decade, the contribution of the first principal component (PC1) following the principal component transformation of the IRSEI component indices for the Tenihe Farm's remote sensing imagery consistently exceeds 73%. This suggests that PC1 can essentially represent the condition of the farm's IRSEI. As previously discussed, since PC2, PC3, PC4, and PC5 often contain noisy information, it is not prudent to indiscriminately combine principal components. Unscientific merging may lead to deviations or even inaccuracies in the results.
To further substantiate the validity of the experimental outcomes, an analysis of data quality was conducted. Typically, indices of greenness and humidity tend to exert a positive influence on the ecological environment, enhancing its condition, whereas indices of dryness, heat, and salinity are likely to have a deleterious impact, diminishing the quality of the ecological environment. Consequently, when conducting a correlation analysis between these indices and the IRSEI, one would expect to obtain disparate results indicative of both positive and negative correlations. This study employs the Pearson correlation coefficient (PCC) method for the quantitative analysis of the correlation between component indices and IRSEI. The PCC method is a classical approach for calculating correlation coefficients, primarily used to characterize linear correlations. It operates under the assumption that the two variables in question are normally distributed and possess non-zero standard deviations. The calculation formula enables the condensation of values into a range between -1 and 1. The closer the absolute value of the PCC is to 1, the higher the degree of correlation between the two variables, indicating greater similarity. The formula for calculating the PCC is as follows:
In this context, denotes the computed result of the correlation coefficient; signifies the index of the variable; represents the total number of variables; and correspond respectively to the values of variable and variable at index ; while and respectively denote the mean values of variable and variable .
The correlation calculation results of the PCC between the IRSEI outcomes of the Tenihe Farm across different years and the component indicators are presented in the following Table 5:
The table 5 reveals that the correlation coefficients between different annual component indicators and the IRSEI display both positive and negative values, yet they follow a discernible pattern. Specifically, the NDVI and WET indicators are positively correlated with the IRSEI, whereas the NDBSI, LST, and PSI exhibit negative correlations with the IRSEI. The p-values associated with these correlation calculations are all less than 0.01, indicating statistically significant correlations. Notably, the component indicators for the year 2013 show the strongest average correlation with the IRSEI, reaching a value of 0.930, while other years also demonstrate high correlation values. The mean values of the five indicators across different years also maintain high levels, with the highest absolute value of correlation in the four years being for WET, at 0.911. This suggests that humidity conditions have a substantial impact on the ecosystem, while other indicators such as heat, greenness, salinity, and dryness are similarly closely linked to the quality of the ecological environment.
4.2.2. Analysis of Spatial and Temporal Variations
The spatial statistical analysis and cartographic representation of the IRSEI results post-principal component transformation reveal a clear temporal and spatial variation in IRSEI gradation. The grading standard employs an interval of 0.2 to divide the values into five categorical levels, namely: excellent (0.8 < RSEI ≤ 1.0), good (0.6 < RSEI ≤ 0.8), moderate (0.4 < RSEI ≤ 0.6), poor (0.2 < RSEI ≤ 0.4), and inferior (0 < RSEI ≤ 0.2). The grading results are shown in Figure 11 below:
The graphical representation clearly indicates that the numerical changes and distribution of the IRSEI at the Tenihe Farm have varied over the past decade. This variability can be attributed to the differential impact of various component indices each year, as well as the discrepancies inherent in the representation methods of PCA. The cartographic outcomes suggest that the overall value of IRSEI is in a relatively favorable state. A detailed quantitative analysis of these results is provided in the subsequent statistical summary.
Upon statistical examination, the mean and standard deviation of the IRSEI for the Tenihe Farm experimental zone over the past ten years are presented in Table 6. The data reveals a remarkable stability in the standard deviation values over the decade, indicating the effectiveness and consistency of the statistical measurements. Specifically, the peak value of the IRSEI mean occurred in 2016, while the lowest value was recorded in 2013. Although the mean IRSEI for 2013 was 0.534, it still falls within the moderate range (0.4 < IRSEI ≤ 0.6), whereas the mean values for other years approached the higher end of this interval. This suggests that the ecological quality of the Tenihe Farm has maintained a commendable condition throughout the recent decade.
The subsequent categorization and area statistics of the IRSEI results across different years are presented in the Table 7 below. The table reveals that for the Tenihe Farm, the ecological environment quality in 2010 had the highest area proportion at a 'Moderate' level, followed by 'Poor', 'Good', 'Excellent', and 'Inferior'. In 2013, the most prevalent category for the farm's ecological environment quality was 'Moderate', succeeded by 'Poor', 'Good', 'Inferior', and 'Excellent'. In 2016, the 'Poor' category dominated in terms of area proportion, with the remaining categories following in the order of 'Moderate', 'Good', 'Inferior', and 'Excellent'. For the year 2019, the category with the highest area proportion remained 'Moderate', with the subsequent categories being 'Poor', 'Good', 'Excellent', and 'Inferior'. Considering the mean results of the aforementioned years, it can be inferred that within certain graded intervals of area proportion, there should be subtle shifts, such as the IRSEI values within the 'Poor' interval, which are slightly lower than 'Moderate', tending towards the 'Moderate' level, while the IRSEI values within the 'Good' interval, which are higher than 'Moderate', likely exhibit a trend of clustering towards the higher values within the interval.
To further investigate the spatiotemporal variations of the IRSEI at the Tenihe Farm, differential calculations for various years were conducted, followed by stratified statistical analysis. The classification comprises five intervals, which are delineated as follows: significantly deteriorated [-1, -0.1), moderately deteriorated [-0.1, -0.05), essentially unchanged [-0.05, 0.05), moderately improved [0.05, 0.1), and significantly improved [0.1, 1]. The visualization of the results is presented in the Figure 12 below. It is evident from the Figure 12 that over the course of a decade, there have been alterations in the IRSEI, with some regions experiencing improvements in ecological environmental quality, while others have witnessed a decline. These changes sometimes alternate as the time series progresses.
The quantitative results of the temporal differentiation of the IRSEI at the Tenihe Farm are presented in the Table 8 below. The Table 8 reveals that over a decade, the changes in IRSEI at the Tenihe Farm primarily fell into three categories: essentially unchanged, significantly deteriorated, and significantly improved. For instance, between 2010 and 2013, the largest percentage change in IRSEI area was a significant deterioration, accounting for 33.74%, followed by essentially unchanged at 27.42%, and then significantly improved, moderately deteriorated, and moderately improved, at 17.62%, 11.13%, and 10.09% respectively. From 2013 to 2016, the IRSEI area changes in descending order of magnitude were significantly deteriorated, significantly improved, essentially unchanged, moderately deteriorated, and moderately improved, with proportions of 38.72%, 25.69%, 17.96%, 9.80%, and 7.83% respectively. During the period from 2016 to 2019, the IRSEI area changes from largest to smallest were significantly improved, significantly deteriorated, essentially unchanged, moderately improved, and moderately deteriorated, with respective shares of 35.60%, 22.70%, 21.92%, 11.44%, and 8.34%. Over the period from 2010 to 2019, the ecological environmental quality of the Tenihe Farm largely remained stable, with the area proportion of significantly improved regions being 18.94% and that of significantly deteriorated regions being 23.98%. The mean IRSEI value was 0.589 in 2010 and 0.573 in 2019, indicating a slight decline of 0.016, which suggests a minor trend towards ecological environmental quality deterioration over the ten-year span.
5. Discussion and Conclusions
This paper initiates from the perspective of the ecological and environmental characteristics of semi-arid agricultural planting regions, establishing the IRSEI model to assess the temporal sequence of ecological environment quality in the farm study area. The model addresses the current status of soil salinization in the study area by proposing the PSI, which is a composite salinity indicator derived from the integration of three salinity indices. It employs the NDVI to represent the greenness component of the study area; the humidity component is characterized using the WET from the Tasseled Cap Transformation; the dryness component is indicated by the NDBSI, a synthesis of the SI and the IBI; and the LST is utilized to denote the heat component. Through principal component transformation for the integration of component indicators, the normalized first principal component's contribution rate exceeds 73%, effectively integrating the valid characteristic information of each indicator. Consequently, the generated IRSEI results proficiently represent the changes in the ecological environment quality of the farm within the study area.
To ensure the reliability of data quality, a correlation analysis was conducted on indices such as NDVI, WET, NDBSI, LST, and PSI with IRSEI. The analysis yielded positive correlations between the greenness and humidity indices with IRSEI, as well as negative correlations between the indices of dryness, heat, and salinity with IRSEI. These results are consistent with the characteristic influences of ecological environmental factors and also serve to validate the integrity of the data quality.
The quality of the ecological environment in farming areas is a crucial component of food security. Only by ensuring the ecological integrity of farm regions can the sustainability of agriculture be guaranteed. In turn, sustainable agriculture can provide a green and healthy food source for human habitation. It can be argued that the quality of the ecological environment in crop cultivation areas is a vital foundation for the stable and healthy operation of the economy and society. Therefore, the assessment of farm ecological environment quality based on IRSEI holds significant importance. Given that this method incorporates the PSI and considers the semi-arid climate attributes of agricultural planting areas and the salinization characteristics of the soil, it has potential applicability and expansion potential in agricultural planting regions with arid climate features and soil salinization characteristics.
This study addresses the need for dynamic monitoring of the ecological environment over time in semi-arid agricultural planting areas by proposing an IRSEI. It employs objective remote sensing data to spatially measure and analyze the temporal evolution of the ecological environment quality in the experimental area of the Tenihe Farm. In future research, consideration will be given to various other factors that contribute to changes in ecological environment quality, such as atmospheric conditions, precipitation, biodiversity, and human activities, to more comprehensively assess the ecological environment quality of agricultural planting areas.
Author Contributions
conceptualization, J.W. and L.J.; methodology, J.W.; validation, J.W.; investigation, J.W., and Y.W.; data curation, Q.Q.; writing—original draft preparation, J.W.; writing—review and editing, J.W., and L.J.; visualization, J.W.; supervision, L.J.
Funding
This work was funded by the Third Xinjiang Scientific Expedition of China with project number 2021xjkk0303.
Acknowledgments
The authors would like to thank the reviewers and editors for valuable comments and suggestions.
Conflicts of Interest
The authors declare no conflict of interest.
References
- Xu, H.Q. A remote sensing urban ecological index and its application. Acta Ecologica Sinica 2013, 33(24), 7853–7862. [Google Scholar]
- Hatfield, S.B.I.A. Normalizing the stress-degree-day parameter for environmental variability. Agricultural Meteorology 1981.
- Xu, H.; et al. Prediction of ecological effects of potential population and impervious surface increases using a remote sensing based ecological index (RSEI). Ecological Indicators 2019, 93, 730–740. [Google Scholar] [CrossRef]
- Yuan, B.; et al. Spatiotemporal change detection of ecological quality and the associated affecting factors in Dongting Lake Basin, Based on RSEI. Journal of Cleaner Production 2021, (Suppl 1), 126995. [Google Scholar] [CrossRef]
- Xu, H.; et al. Remote Sensing Detecting Ecological Changes with a Remote Sensing Based Ecological Index (RSEI) Produced Time Series and Change Vector Analysis. Remote Sensing 2019, 11. [Google Scholar] [CrossRef]
- Jing, Y.; et al. Assessment of spatial and temporal variation of ecological environment quality in Ebinur Lake Wetland National Nature Reserve, Xinjiang, China. Ecological Indicators 2020, 110, 105874. [Google Scholar] [CrossRef]
- Qureshi, S.; et al. A Remotely Sensed Assessment of Surface Ecological Change over the Gomishan Wetland, Iran. Remote Sensing 2020, 12(18), 2989. [Google Scholar] [CrossRef]
- B, C.L.A.; et al. Spatiotemporal evolution of island ecological quality under different urban densities: A comparative analysis of Xiamen and Kinmen Islands, southeast China. Ecological Indicators 2021, 124. [Google Scholar]
- Jiang, C.; et al. Dynamic monitoring of eco-environmental quality in arid desert area by remote sensing: Taking the Gurbantunggut Desert China as an example. Journal of applied ecology 2019, 30(3), 877–883. [Google Scholar]
- Airiken, M.; et al. Assessment of spatial and temporal ecological environment quality under land use change of urban agglomeration in the North Slope of Tianshan, China. Environmental Science and Pollution Research 2022, 29(8), 12282–12299. [Google Scholar] [CrossRef]
- Song, H.M. and L. Xue. Dynamic monitoring and analysis of ecological environment in Weinan City, Northwest China based on RSEI model. Journal of applied ecology 2016, 27(12), 3913. [Google Scholar]
- Nie, X.; et al. Research on Temporal and Spatial Resolution and the Driving Forces of Ecological Environment Quality in Coal Mining Areas Considering Topographic Correction. Remote Sensing 2021. [CrossRef]
- Moran, M.S.; et al. Estimating crop water deficit using the relation between surface-air temperature and spectral vegetation index. Remote Sensing of Environment 1994, 49(3), 246–263. [Google Scholar] [CrossRef]
- Lei, M., et al., Uncertainty of Object-Based Image Analysis for Drone Survey Images. 2018: Drones - Applications.
- Benz, U.C.; et al. Multi-resolution, object-oriented fuzzy analysis of remote sensing data for GIS-ready information. ISPRS Journal of Photogrammetry and Remote Sensing 2004, 58(3/4), 239–258. [Google Scholar] [CrossRef]
- Rouse, J.W., et al., Monitoring Vegetation Systems in the Great Plains with Erts. NASA Special Publication, 1974. 351.
- Zha, Y., J. Gao and N.I. S. Use of normalized difference built-up index in automatically mapping urban areas from TM imagery. International Journal of Remote Sensing 2003, 24(3), 583–594. [Google Scholar] [CrossRef]
- Roy, P.S., A. Rikimaru and S. Miyatake. Tropical forest cover density mapping. Tropical Ecology 2002, 43(No 1), 39–47. [Google Scholar]
- Xu, H. A new index for delineating built-up land features in satellite imagery. International Journal of Remote Sensing 2008, 29(14), 4269–4276. [Google Scholar] [CrossRef]
- Xu and Hanqiu. Analysis of Impervious Surface and its Impact on Urban Heat Environment using the Normalized Difference Impervious Surface Index (NDISI). Photogrammetric Engineering & Remote Sensing 2010, 76(5), 557–565. [Google Scholar]
- Shivers, S.W., D.A. Roberts and J.P. Mcfadden. Using paired thermal and hyperspectral aerial imagery to quantify land surface temperature variability and assess crop stress within California orchards. Remote Sensing of Environment 2019, 222, 215–231. [Google Scholar] [CrossRef]
- Wulder, M.A.; et al. Current status of Landsat program, science, and applications. Remote Sensing of Environment 2019, 225, 127–147. [Google Scholar] [CrossRef]
- Jimenez-Munoz, J.C.; et al. Revision of the Single-Channel Algorithm for Land Surface Temperature Retrieval From Landsat Thermal-Infrared Data. IEEE Transactions on Geoscience and Remote Sensing 2009, 47(1), 339–349. [Google Scholar] [CrossRef]
- Jiménez-Muoz, J.C. and J.A. Sobrino. A generalized single-channel method for retrieving land surface temperature from remote sensing data (vol 109, art no D08112, 2004). Journal of Geophysical Research Atmospheres 2003, 108(D8). [Google Scholar]
- Duan, S.B.; et al. Land-surface temperature retrieval from Landsat 8 single-channel thermal infrared data in combination with NCEP reanalysis data and ASTER GED product. International Journal of Remote Sensing 2018, 1–16. [Google Scholar] [CrossRef]
- A, L.Y. and D.P.R.A. B. Spatially and temporally complete Landsat reflectance time series modelling: The fill-and-fit approach. Remote Sensing of Environment 2020, 241. [Google Scholar]
- Zhichun, W.U.; et al. A Review on Application of Techniques of Principle Component Analysis on Extracting Alteration Information of Remote Sensing. Journal of Geo-Information Science 2018. [Google Scholar]
- Shrivastava, P. and R. Kumar. Soil salinity: A serious environmental issue and plant growth promoting bacteria as one of the tools for its alleviation. Saudi Journal of Biological Sciences 2015, 22(2), 123–131. [Google Scholar] [CrossRef]
- Xiao, X.L.J. Soil salinization of cultivated land in Shandong Province, China-Dynamics during the past 40 years. Land Degradation and Development 2019, 30(4). [Google Scholar] [CrossRef]
- Yang, J.S. Development and prospect of the research on salt-affected soils in China. Acta Pedologica Sinica 2008.
- A, A.A. and R.A. B. Mapping soil salinity in arid and semi-arid regions using Landsat 8 OLI satellite data-ScienceDirect. Remote Sensing Applications: Society and Environment 2019, 13, 415–425. [Google Scholar]
- Kumar, N., S.K. Singh and H.K. Pandey. Drainage morphometric analysis using open access earth observation datasets in a drought-affected part of Bundelkhand, India. Applied Geomatics 2018, 10(2), 1–17. [Google Scholar] [CrossRef]
- Jun-Han, L.I. and G. Ming-Xiu. Temporal and Spatial Characteristics of Salinization of Coastal Soils in the Yellow River Delta. Chinese Journal of Soil Science 2018.
- Abderrazak, B.; et al. Sentinel-MSI VNIR and SWIR Bands Sensitivity Analysis for Soil Salinity Discrimination in an Arid Landscape. Remote Sensing 2018, 10(6), 1–20. [Google Scholar]
- Scudiero, E., T.H. Skaggs and D.L. Corwin. Regional-scale soil salinity assessment using Landsat ETM+ canopy reflectance. Remote Sensing of Environment 2015, 169, 335–343. [Google Scholar] [CrossRef]
- Wang, J.; et al. Capability of Sentinel-2 MSI data for monitoring and mapping of soil salinity in dry and wet seasons in the Ebinur Lake region, Xinjiang, China. Geoderma 2019, 353, 172–187. [Google Scholar] [CrossRef]
- Khan, N.M.; et al. Assessment of hydrosaline land degradation by using a simple approach of remote sensing indicators. Agricultural Water Management 2005, 77(1-3), 96–109. [Google Scholar] [CrossRef]
Figure 1.
Overview of Tenihe Farm.
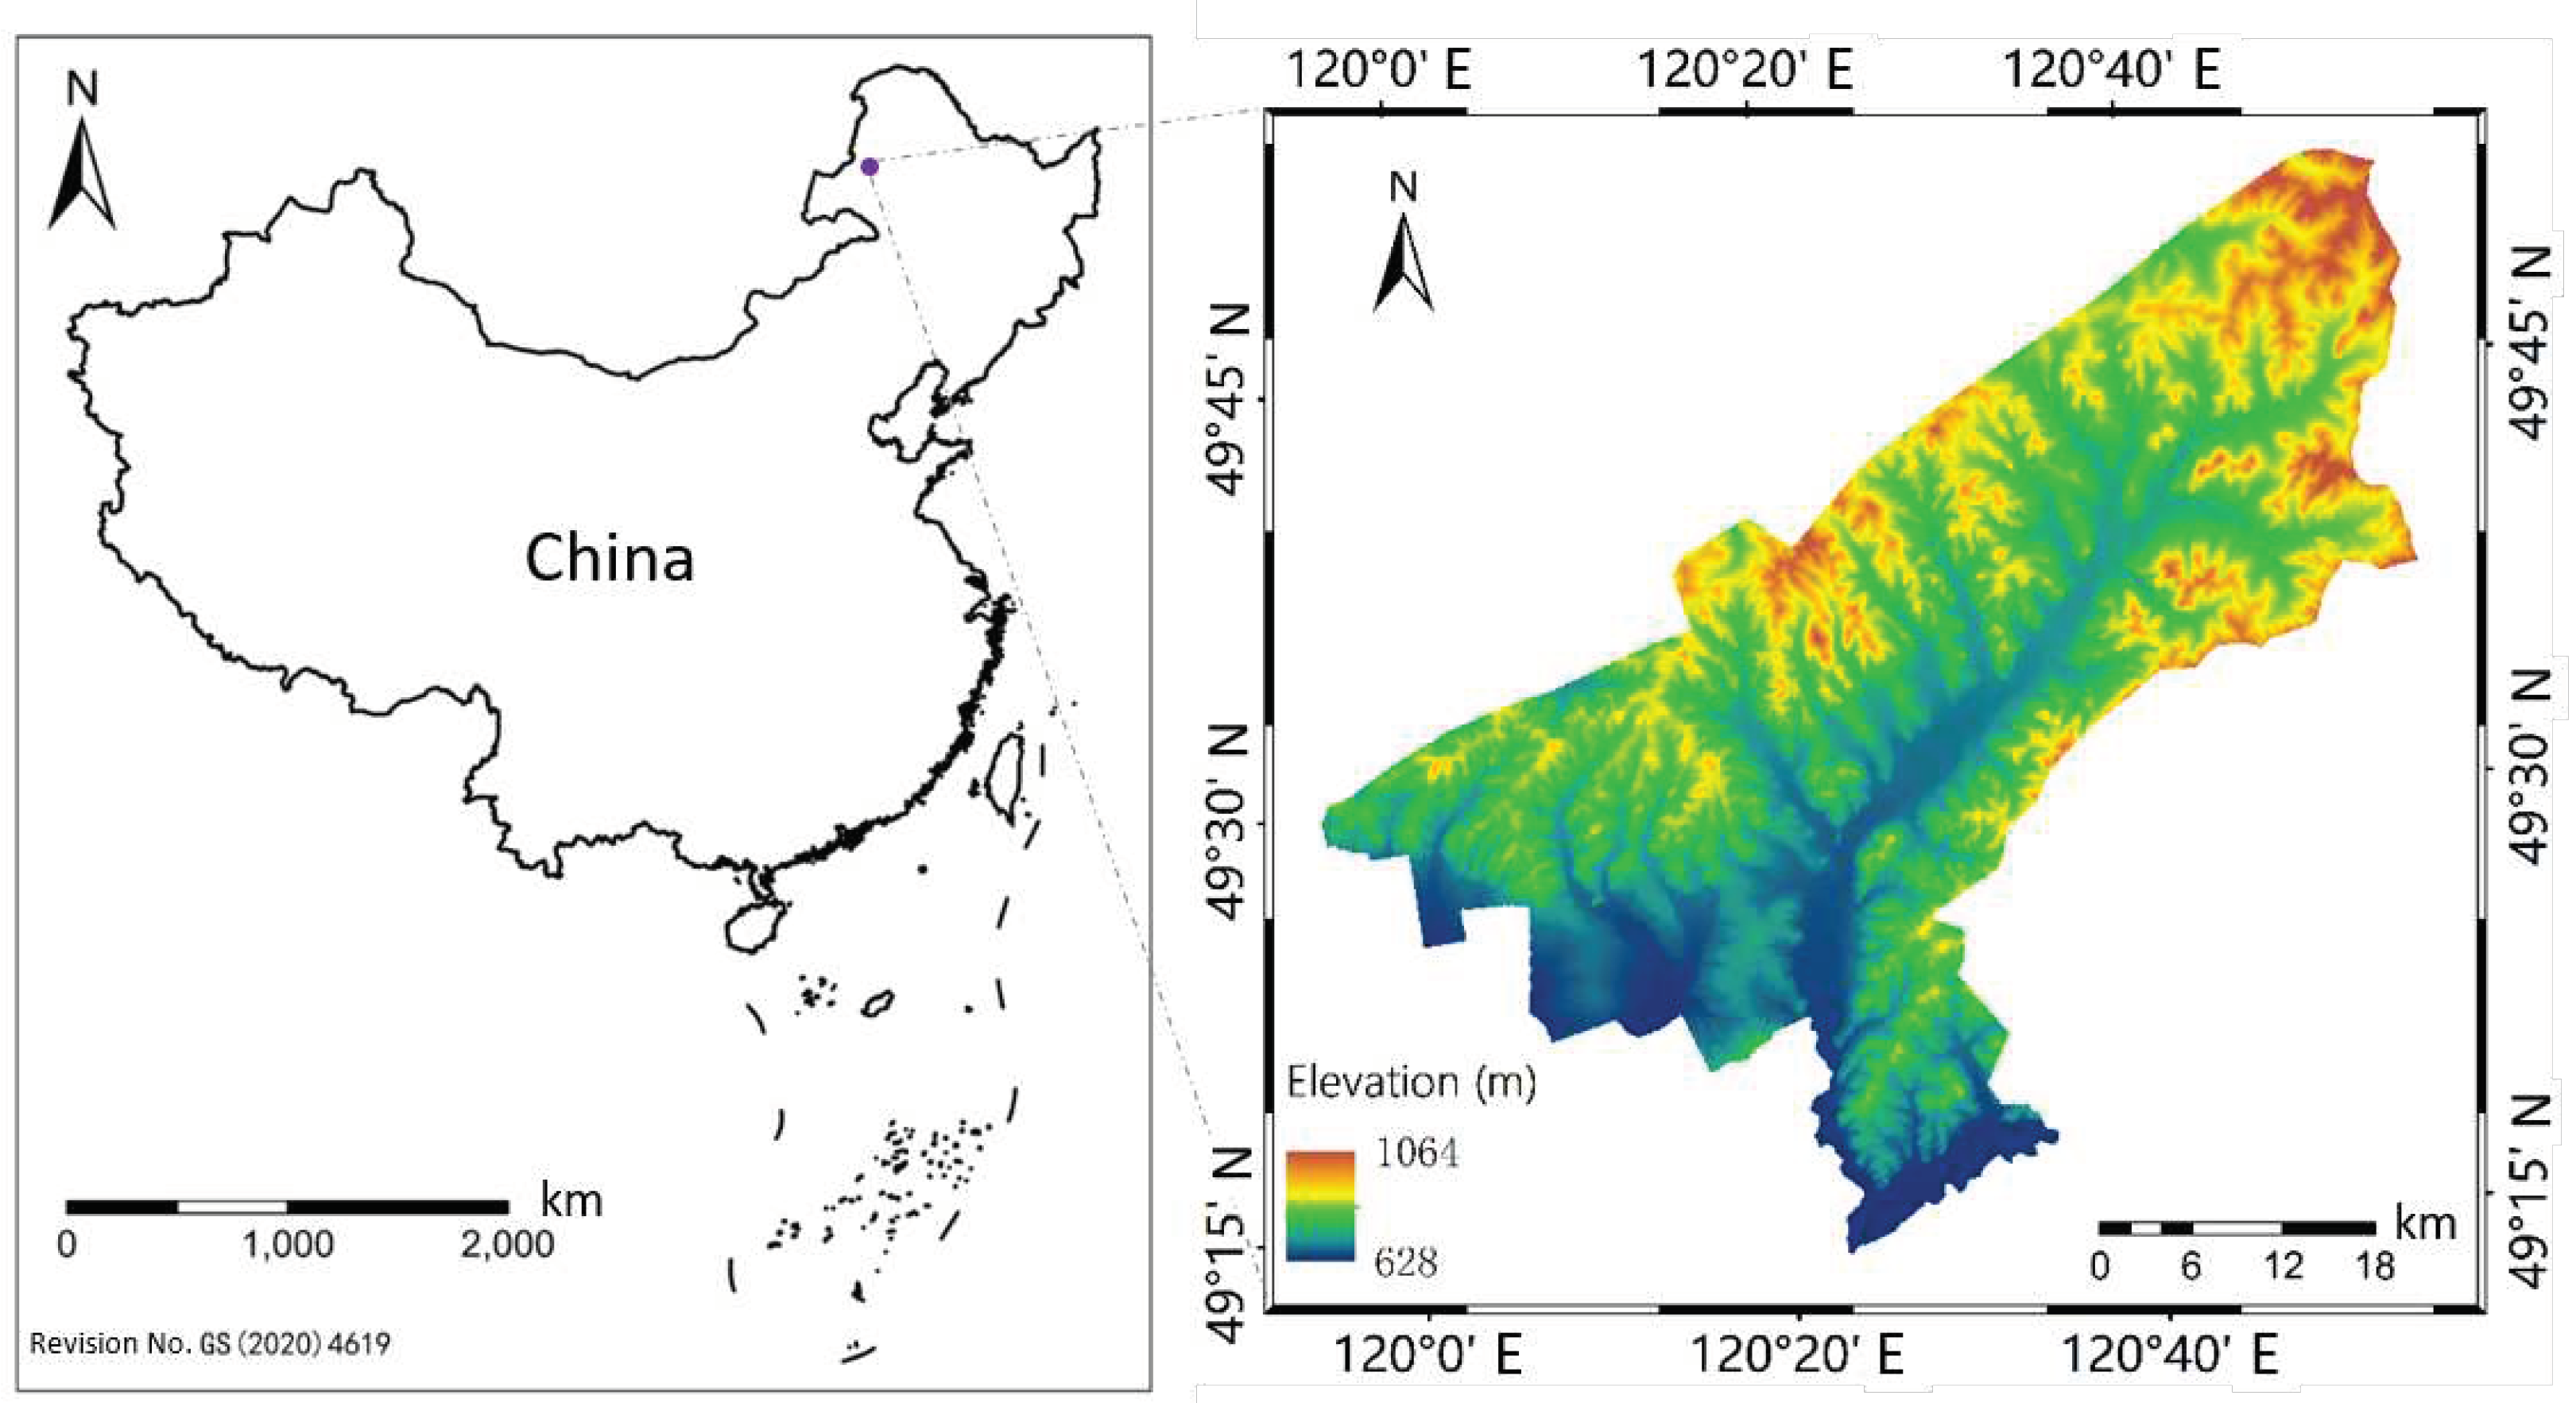
Figure 2.
Remote sensing image data (RGB) of Tenihe Farm, (a–d) correspond to 2010, 2013, 2016 and 2019, respectively: a comes from Landsat 5 TM; b comes from Landsat 7 ETM+; c and d come from Landsat 8 OLI.
Figure 2.
Remote sensing image data (RGB) of Tenihe Farm, (a–d) correspond to 2010, 2013, 2016 and 2019, respectively: a comes from Landsat 5 TM; b comes from Landsat 7 ETM+; c and d come from Landsat 8 OLI.
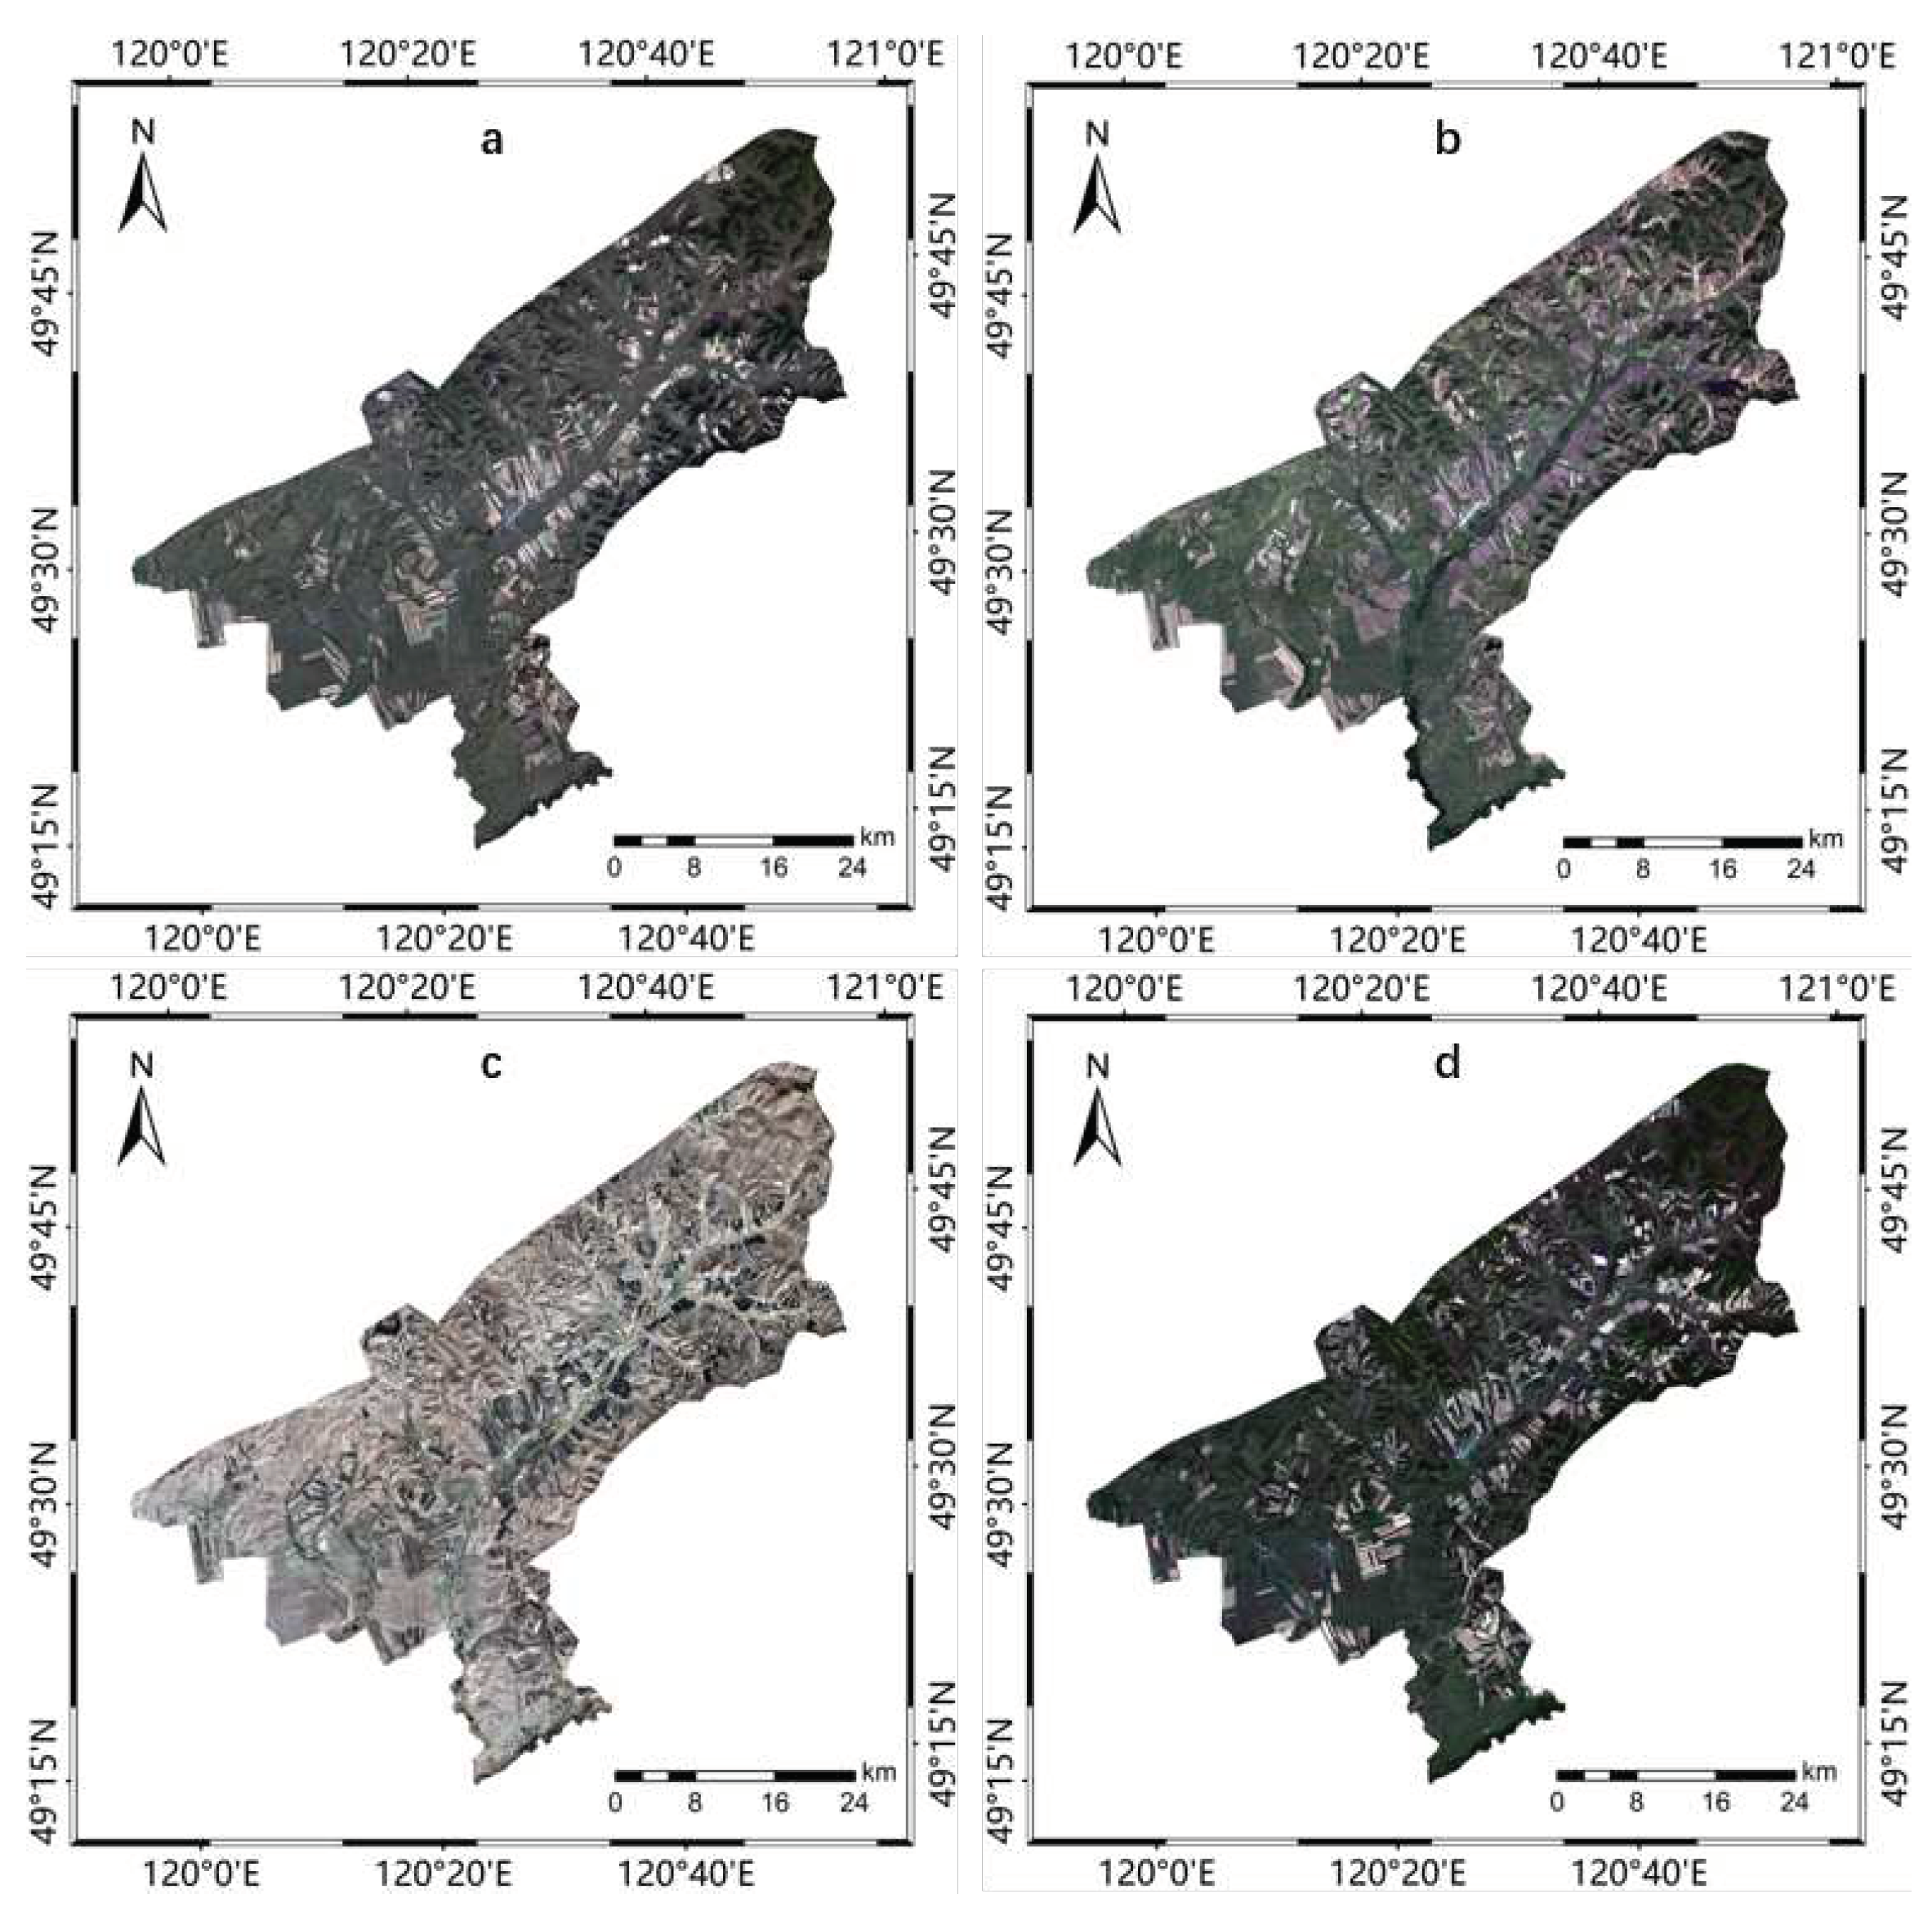
Figure 3.
IRSEI-based process for evaluating the ecological environment quality of Tenihe Farm.
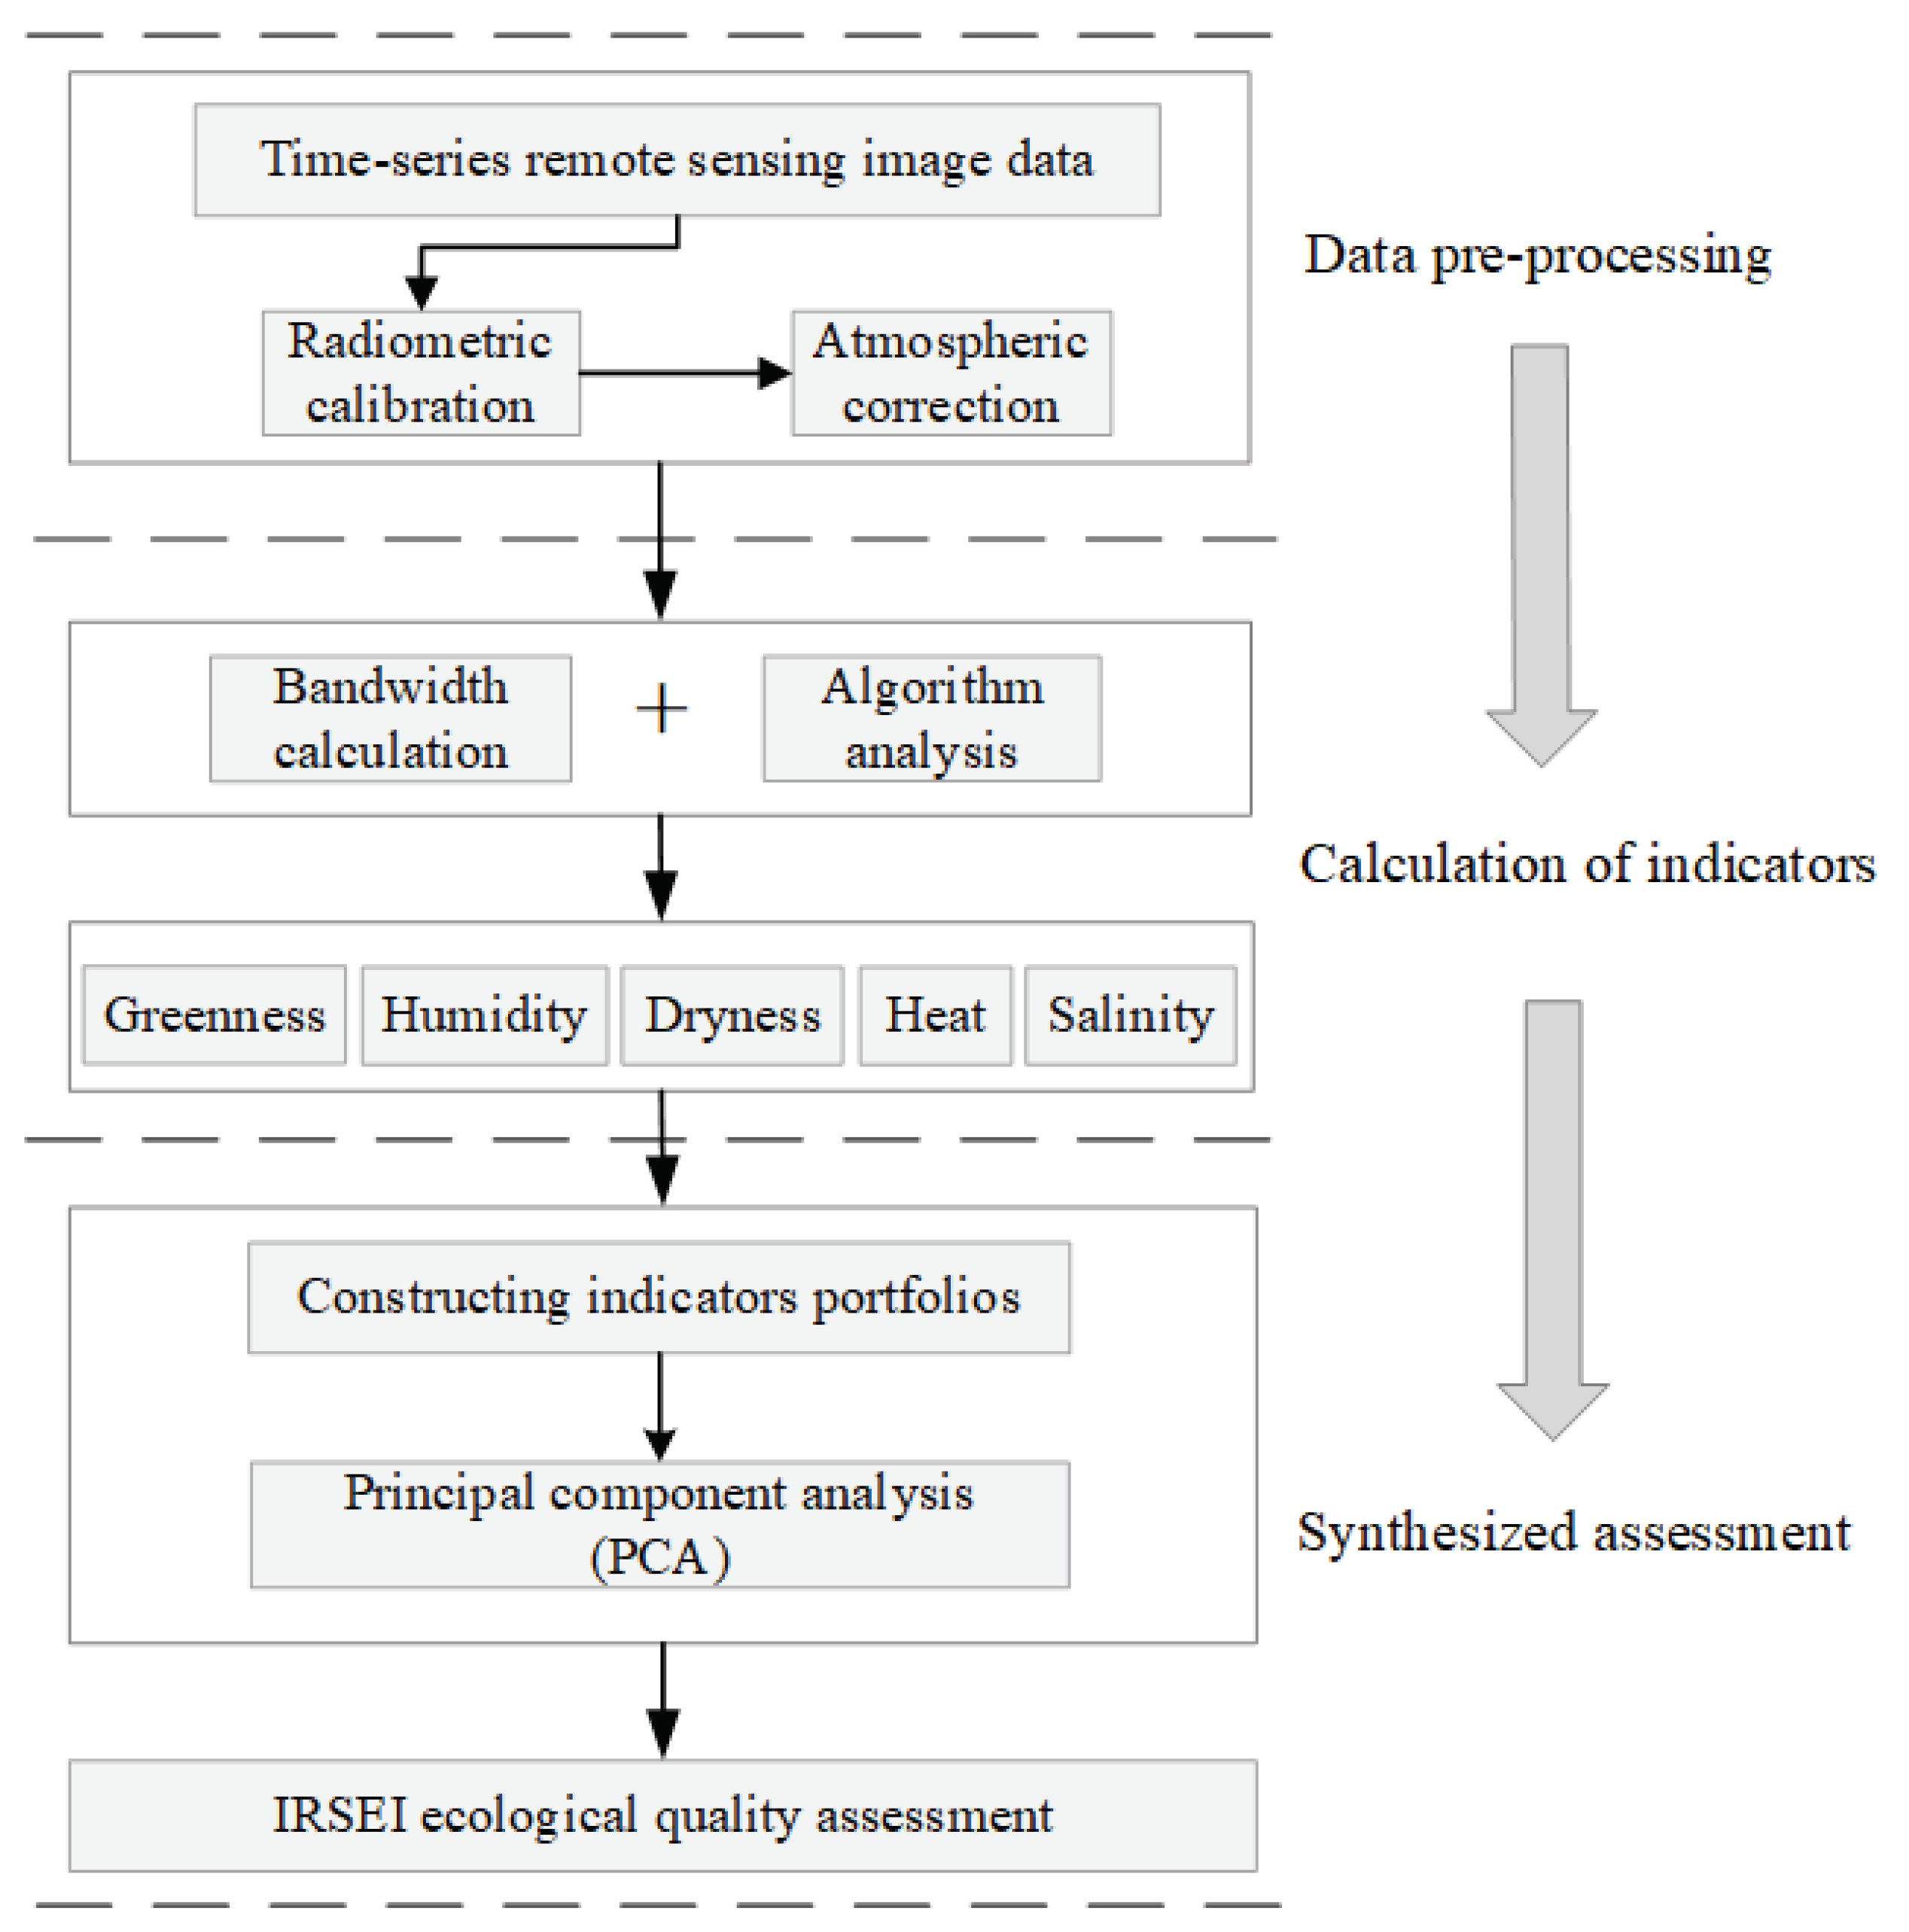
Figure 4.
Calculation process of land surface temperature.
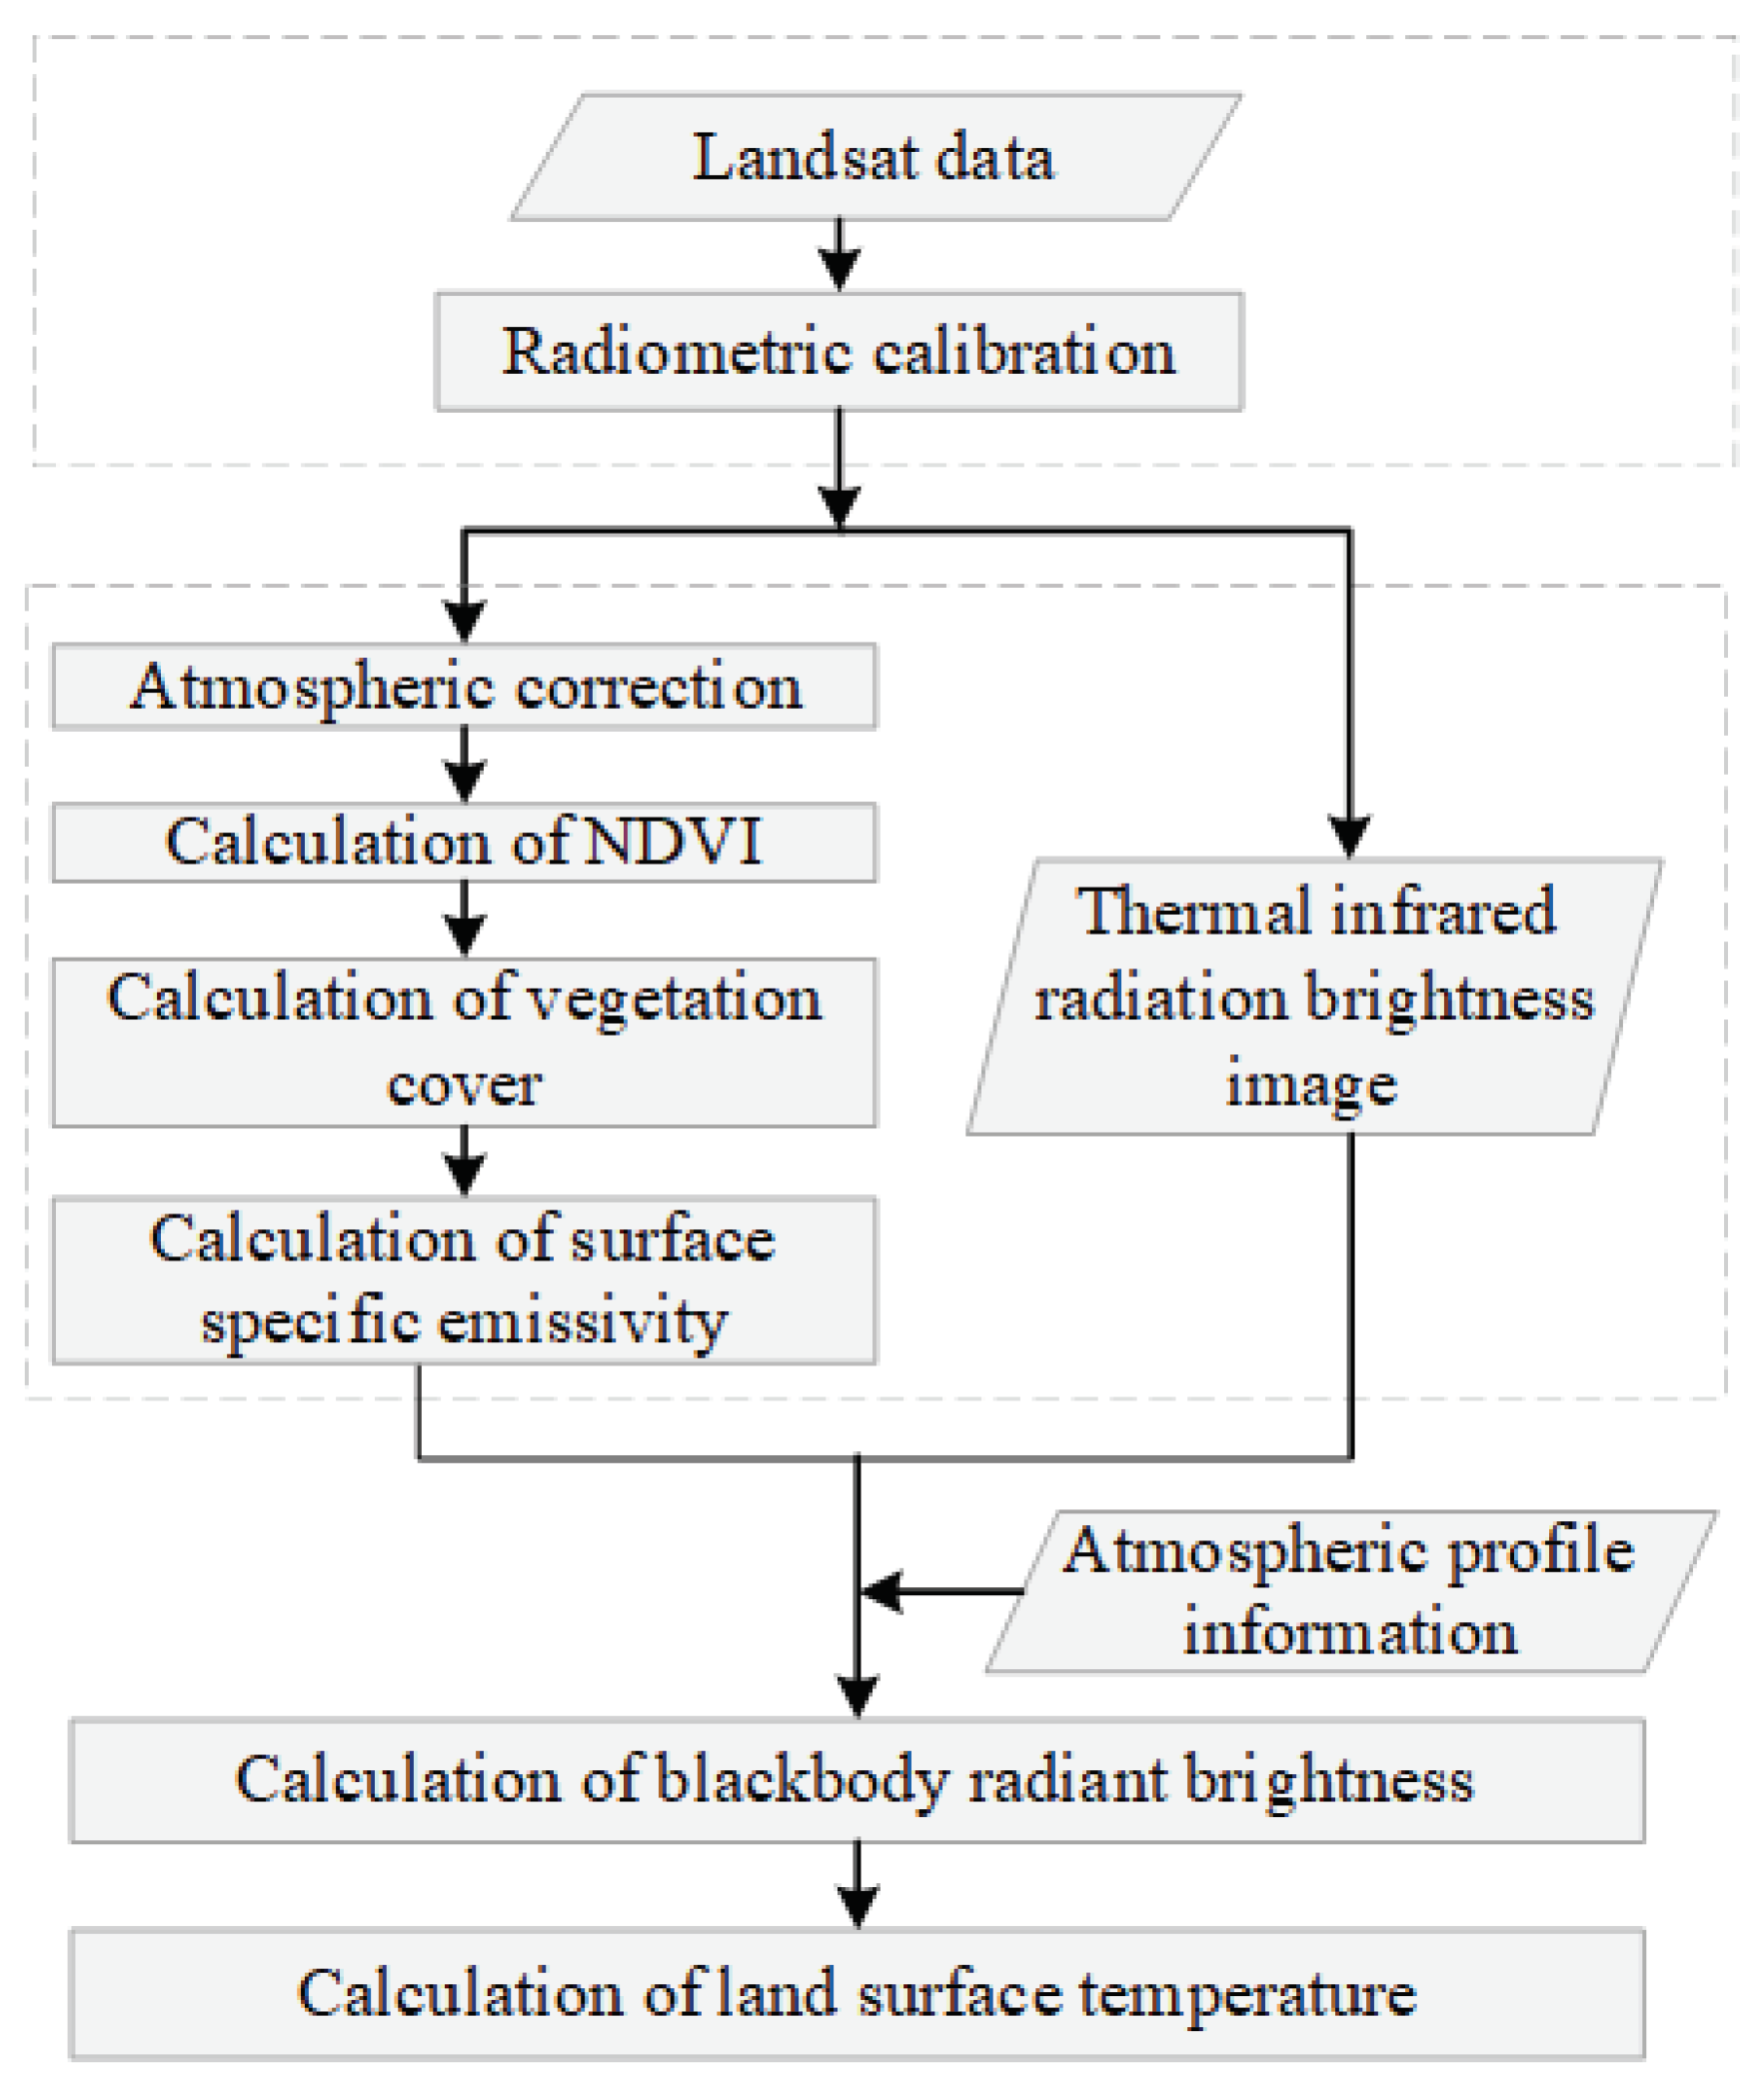
Figure 5.
The greenness index results for the ecological environment assessment of Tenihe Farm: (a–d) correspond to the results for 2010, 2013, 2016, and 2019, respectively.
Figure 5.
The greenness index results for the ecological environment assessment of Tenihe Farm: (a–d) correspond to the results for 2010, 2013, 2016, and 2019, respectively.
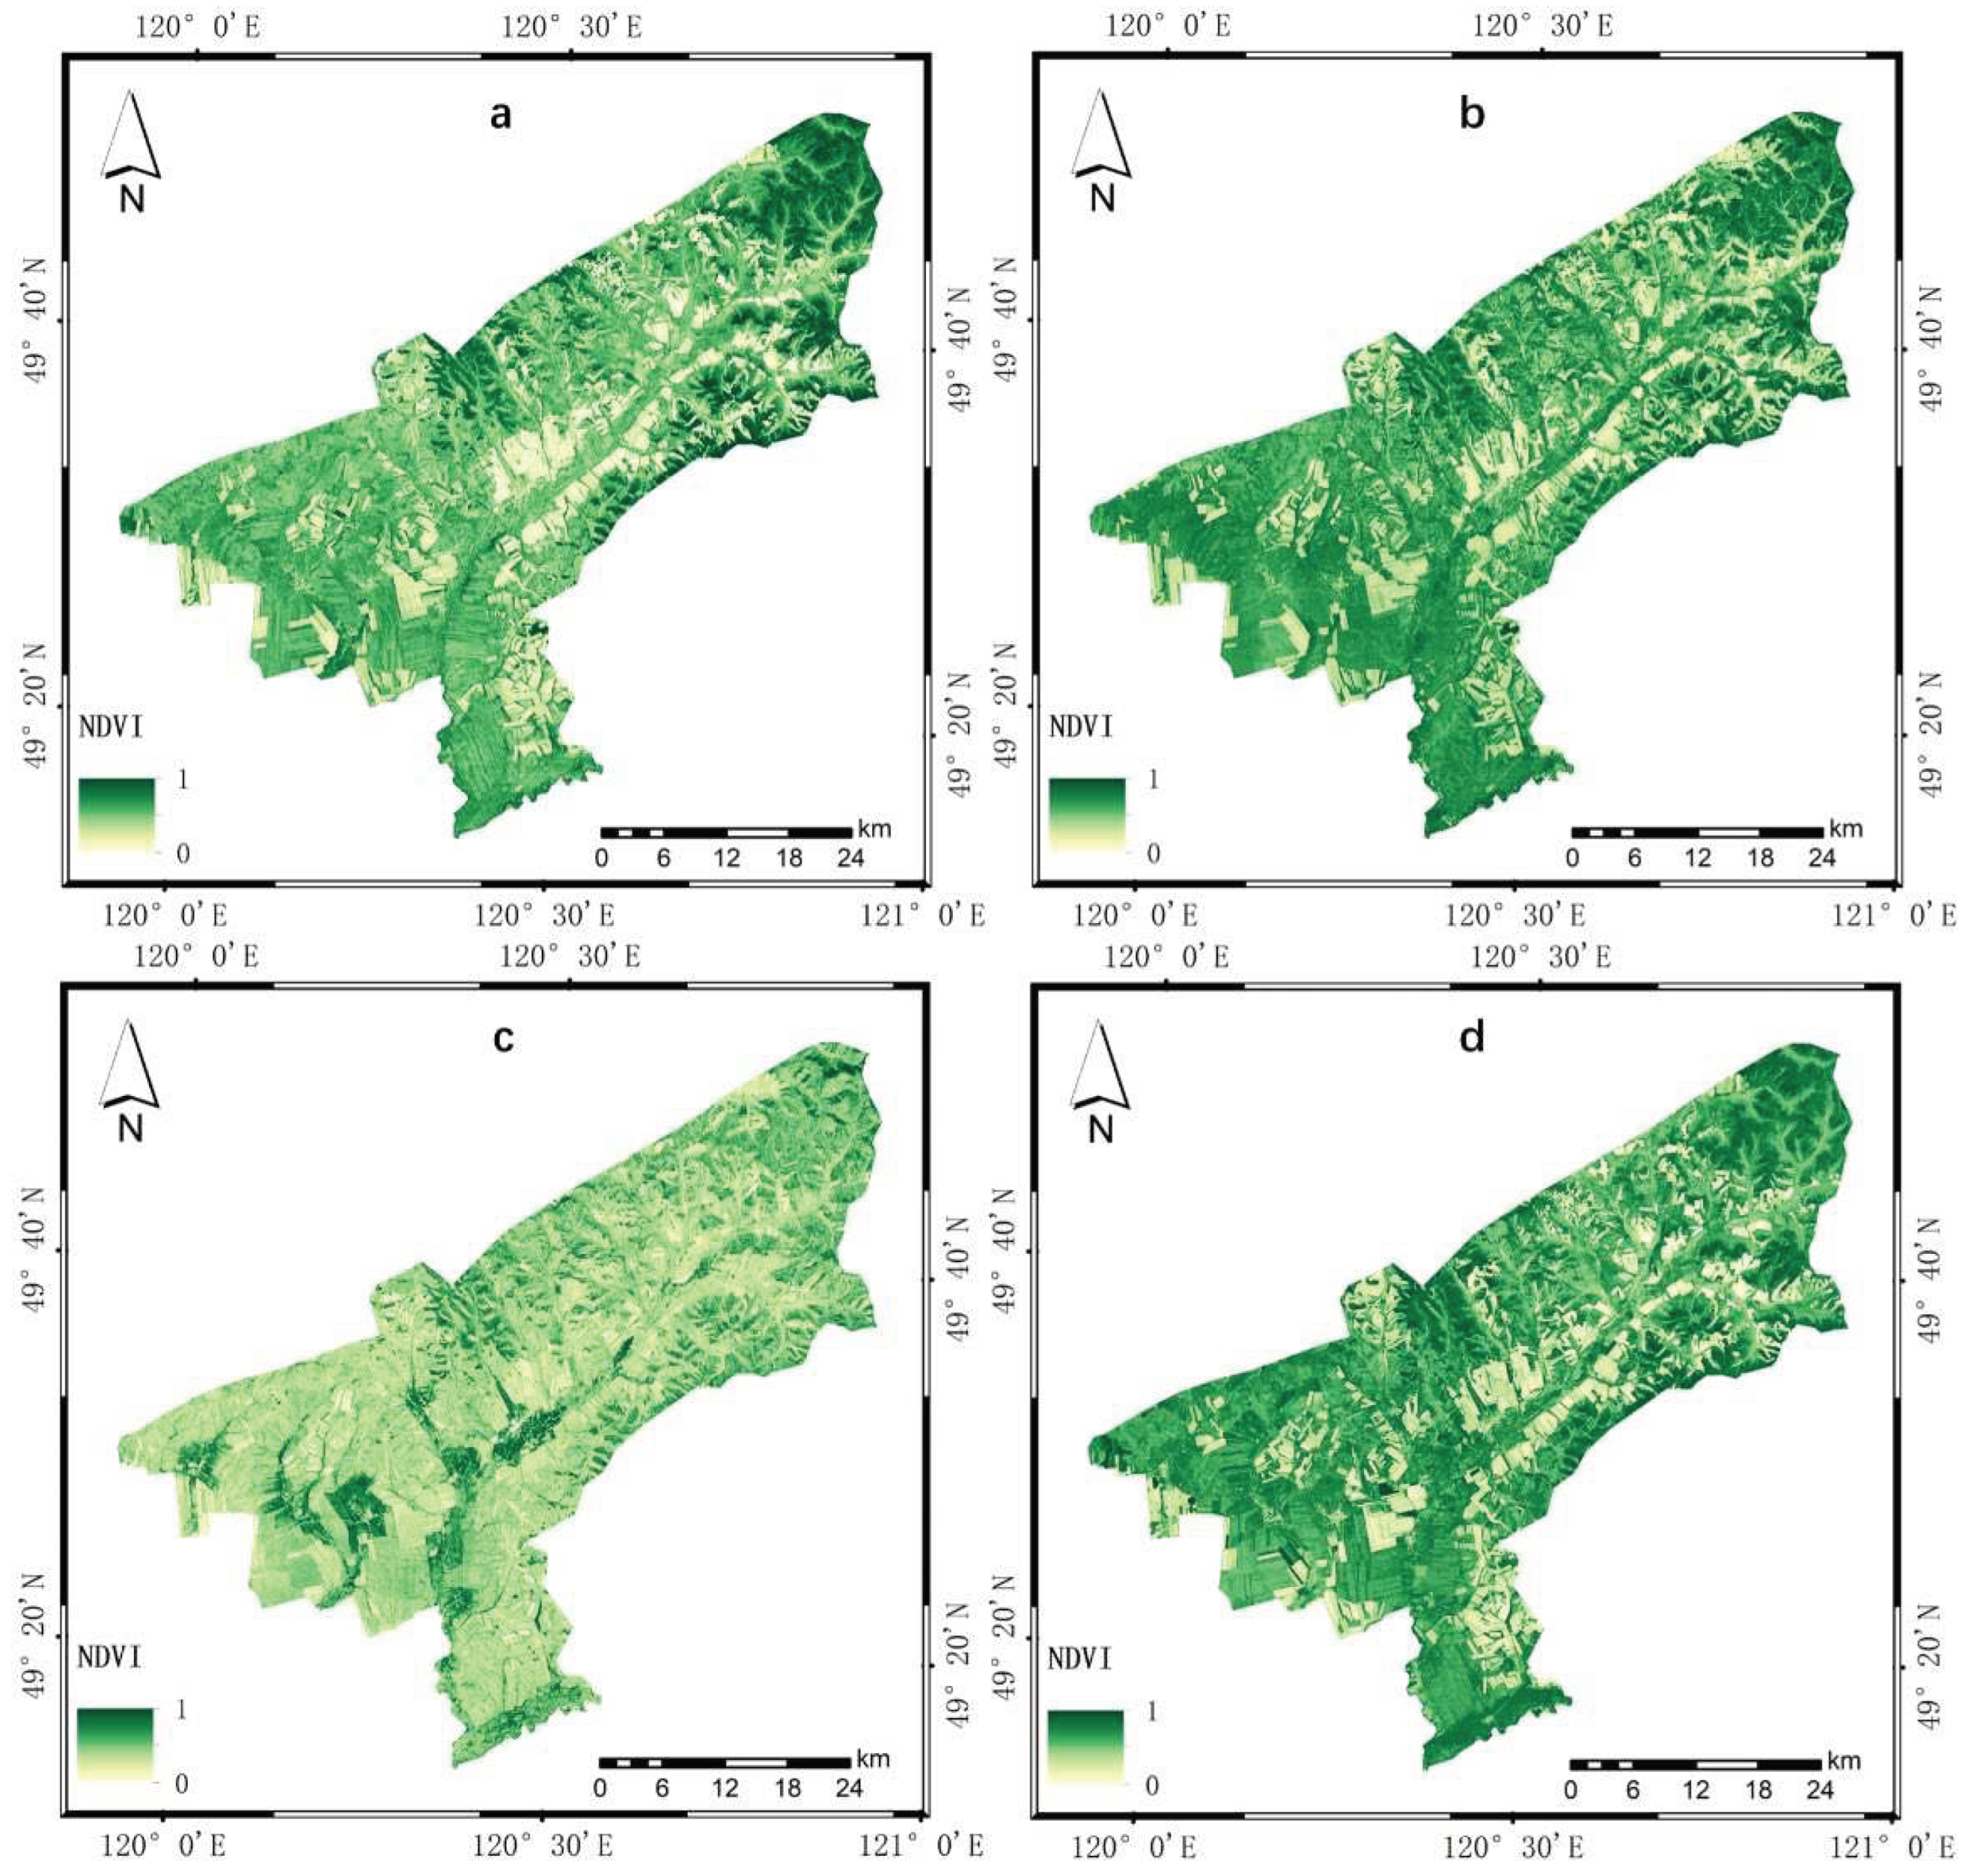
Figure 6.
The humidity index results for the ecological environment assessment of Tenihe Farm: (a–d) correspond to the results for 2010, 2013, 2016, and 2019, respectively.
Figure 6.
The humidity index results for the ecological environment assessment of Tenihe Farm: (a–d) correspond to the results for 2010, 2013, 2016, and 2019, respectively.
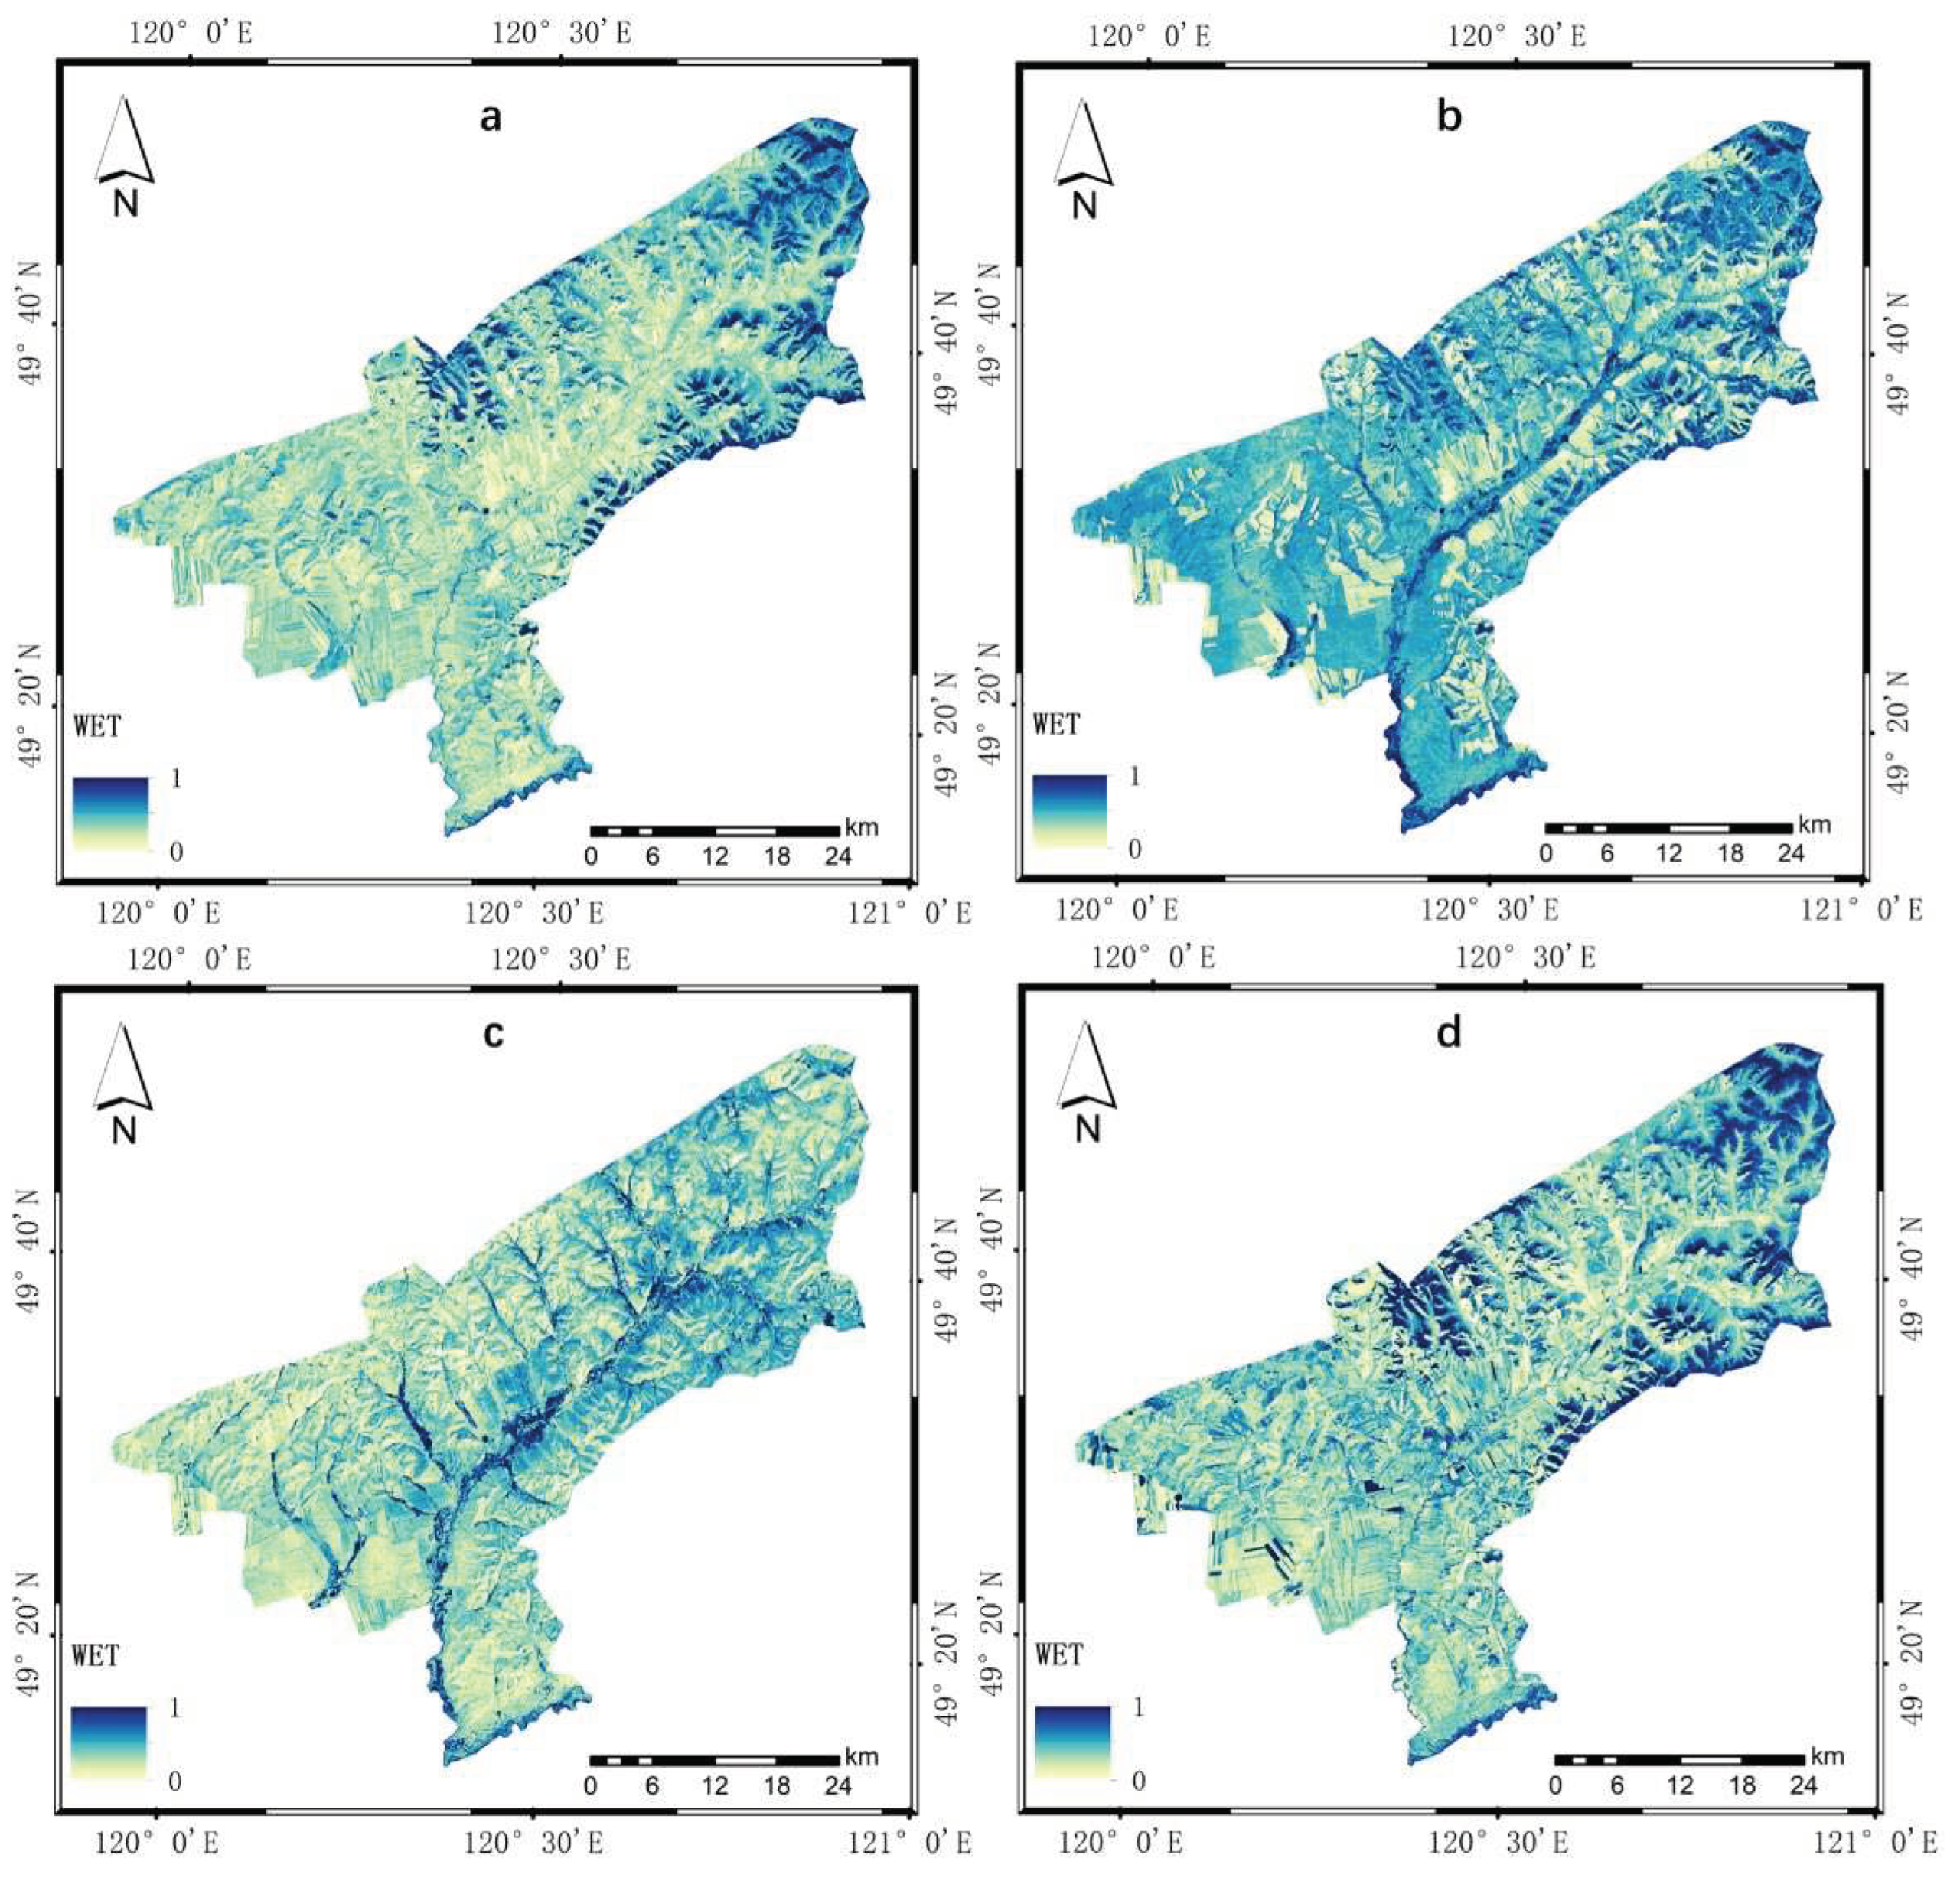
Figure 7.
The dryness index results for the ecological environment assessment of Tenihe Farm: (a–d) correspond to the results for 2010, 2013, 2016, and 2019, respectively.
Figure 7.
The dryness index results for the ecological environment assessment of Tenihe Farm: (a–d) correspond to the results for 2010, 2013, 2016, and 2019, respectively.
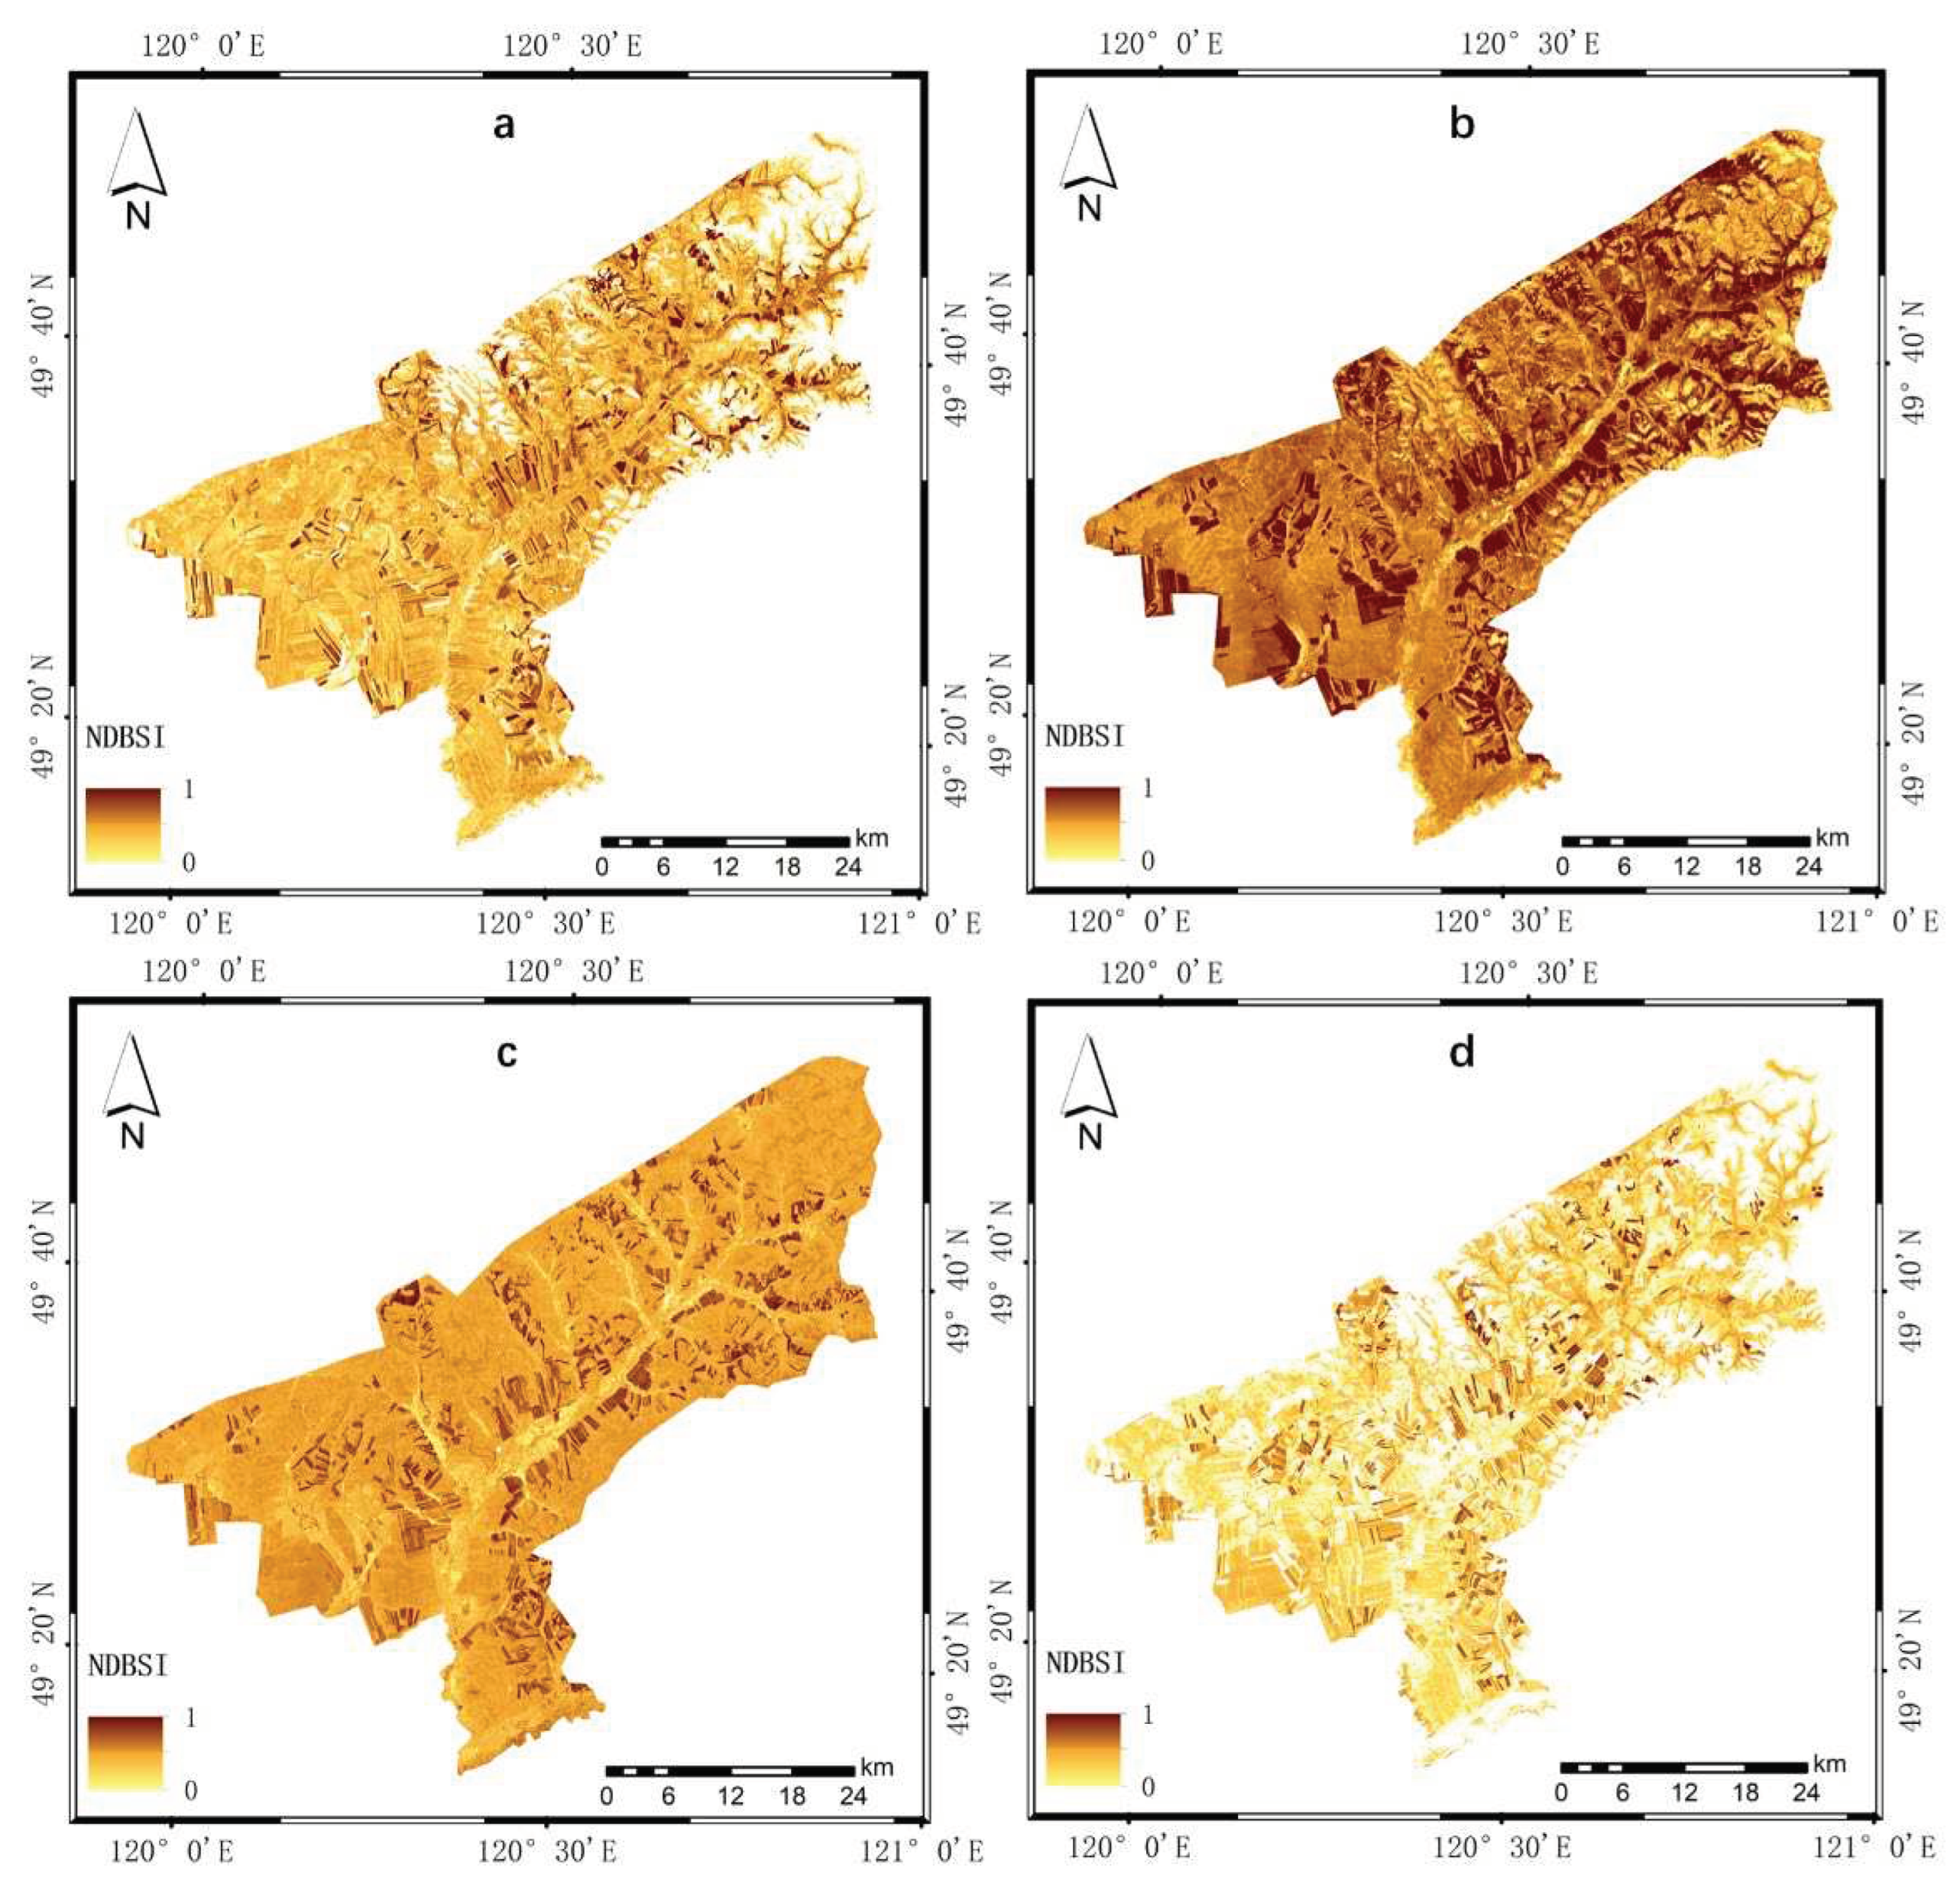
Figure 8.
The heat index results for the ecological environment assessment of Tenihe Farm: (a–d) correspond to the results for 2010, 2013, 2016, and 2019, respectively.
Figure 8.
The heat index results for the ecological environment assessment of Tenihe Farm: (a–d) correspond to the results for 2010, 2013, 2016, and 2019, respectively.
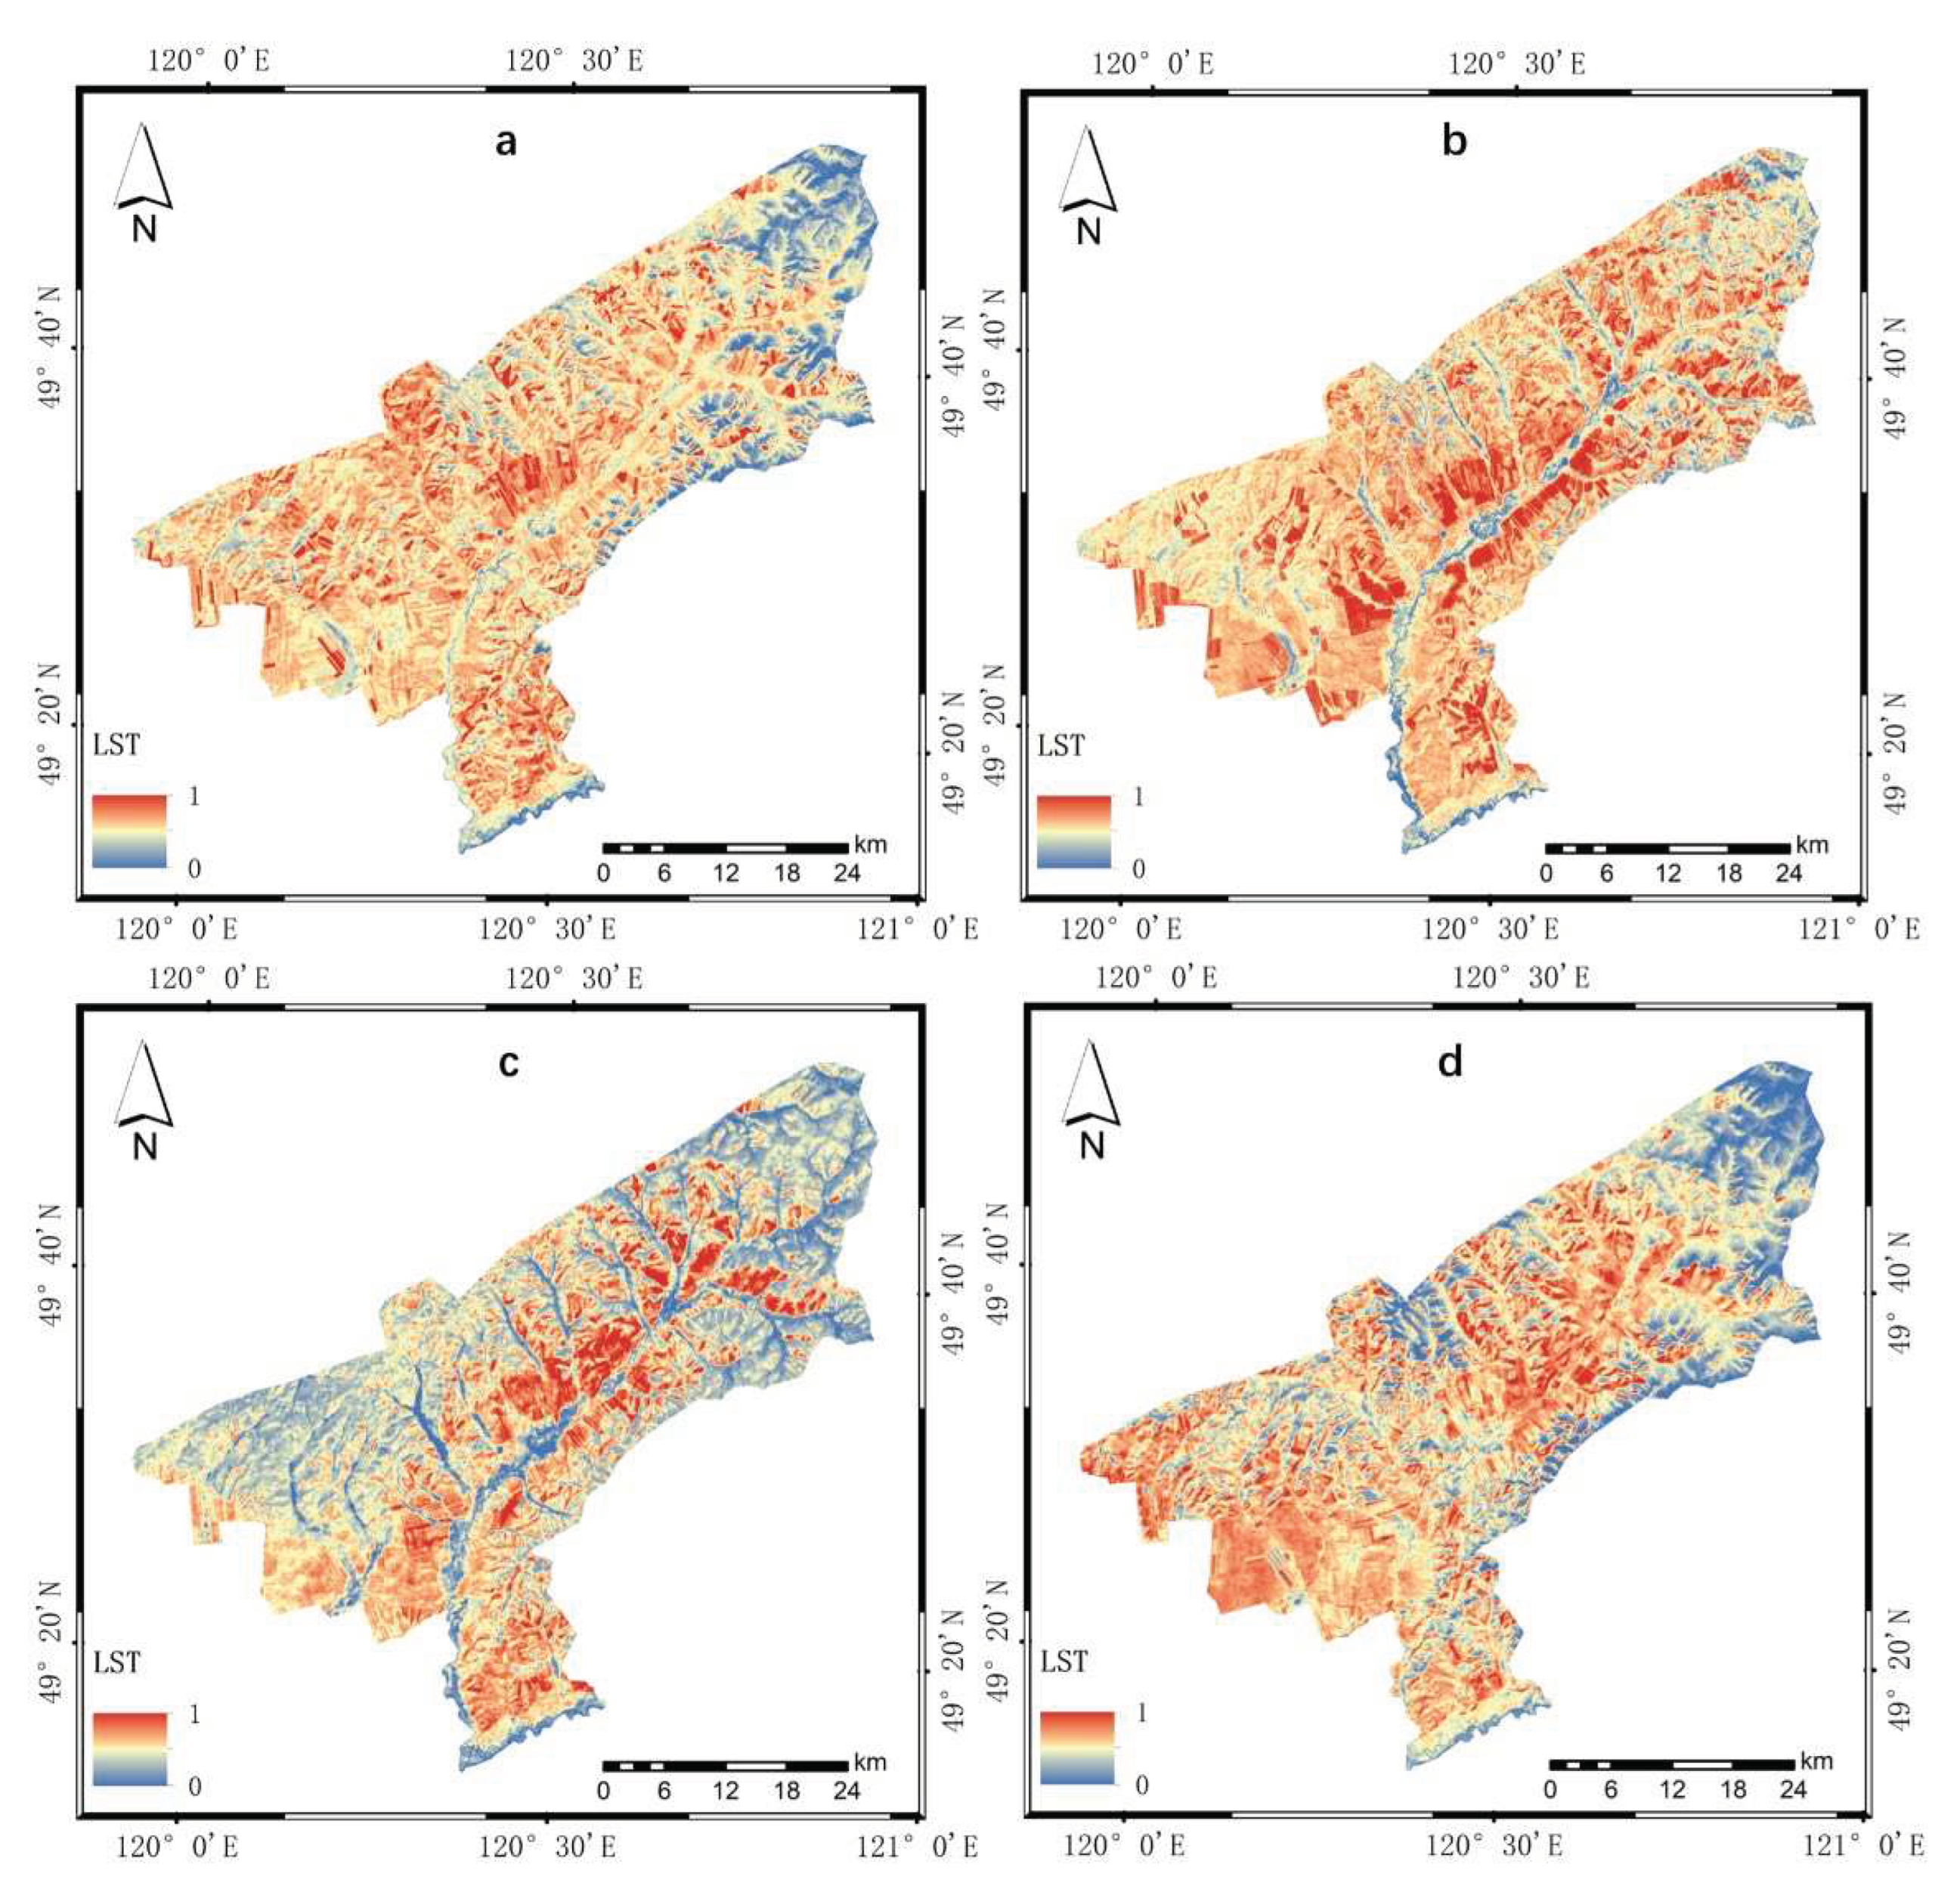
Figure 9.
The salinity index results for the ecological environment assessment of Tenihe Farm: (a–d) correspond to the results for 2010, 2013, 2016, and 2019, respectively.
Figure 9.
The salinity index results for the ecological environment assessment of Tenihe Farm: (a–d) correspond to the results for 2010, 2013, 2016, and 2019, respectively.

Figure 10.
The mean and standard deviation of the ecological environment evaluation component indices of Tenihe Farm in the past decade: (a) is the result of the greenness index; (b) is the result of the humidity index; (c) is the result of the dryness index; (d) is the result of the heat index; (e) is the result of the salinity index.
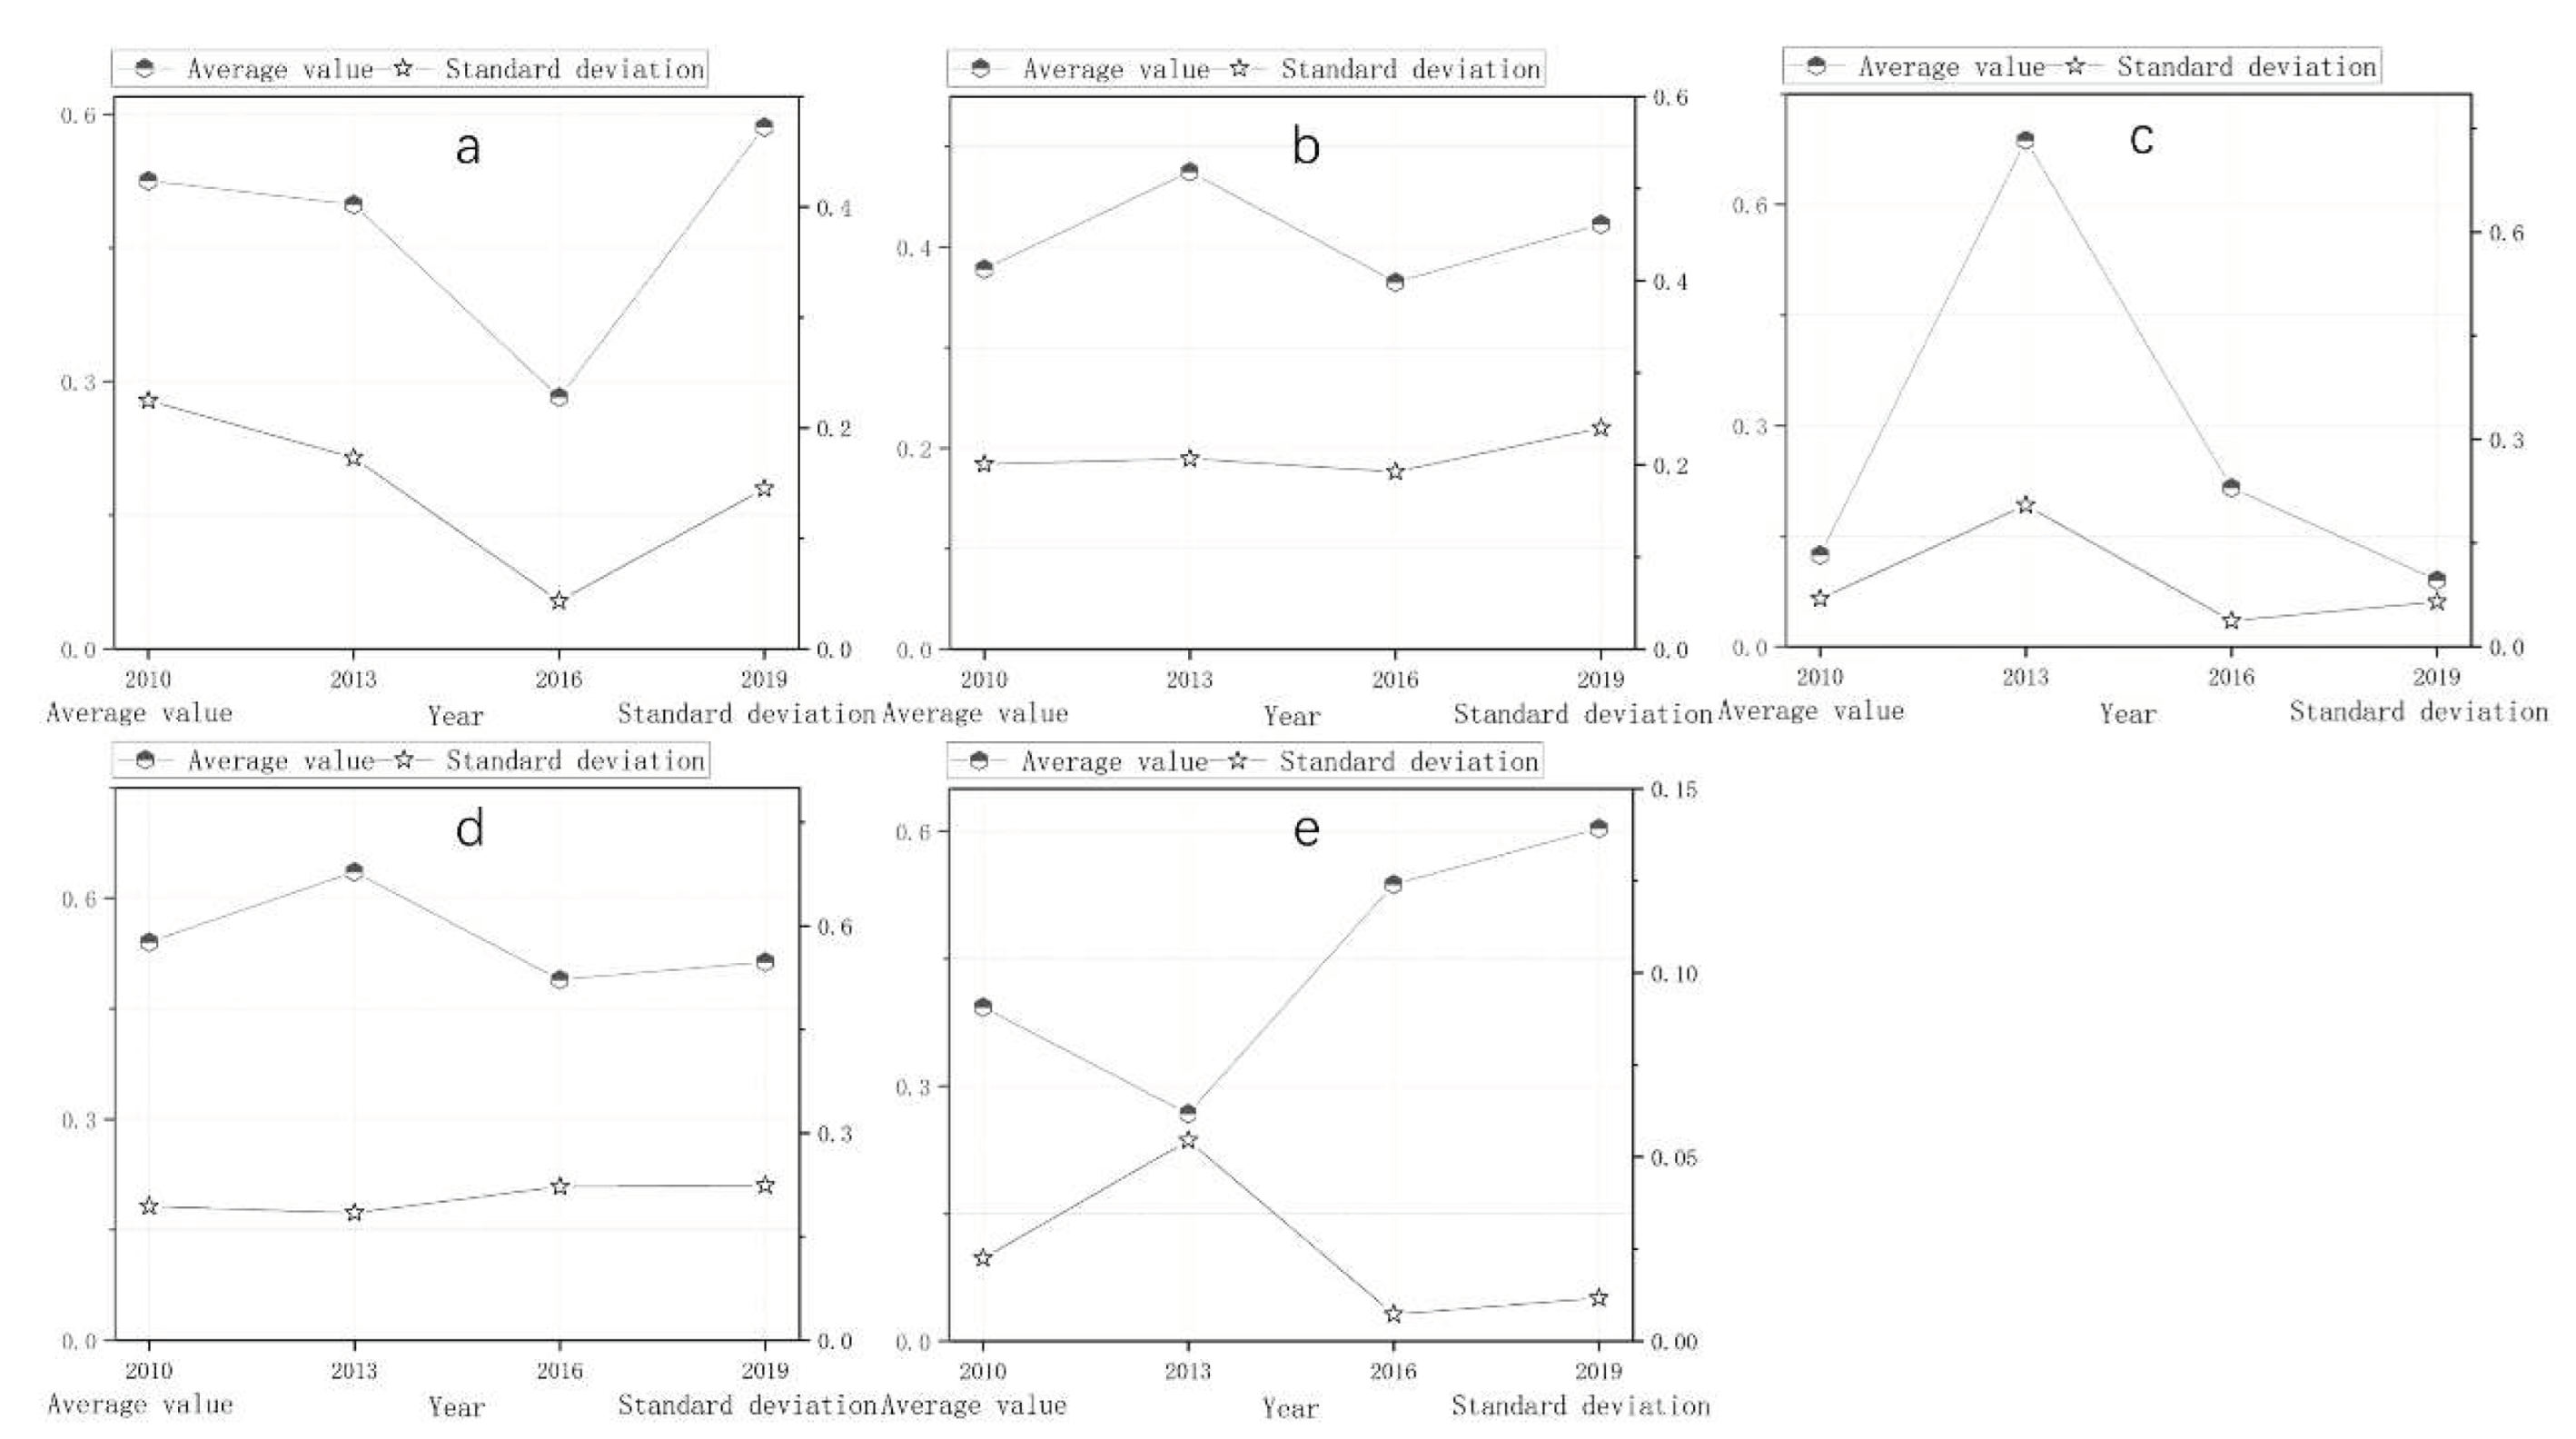
Figure 11.
The IRSEI results for the ecological environment assessment of Tenihe Farm: (a–d) correspond to the results for 2010, 2013, 2016, and 2019, respectively.
Figure 11.
The IRSEI results for the ecological environment assessment of Tenihe Farm: (a–d) correspond to the results for 2010, 2013, 2016, and 2019, respectively.
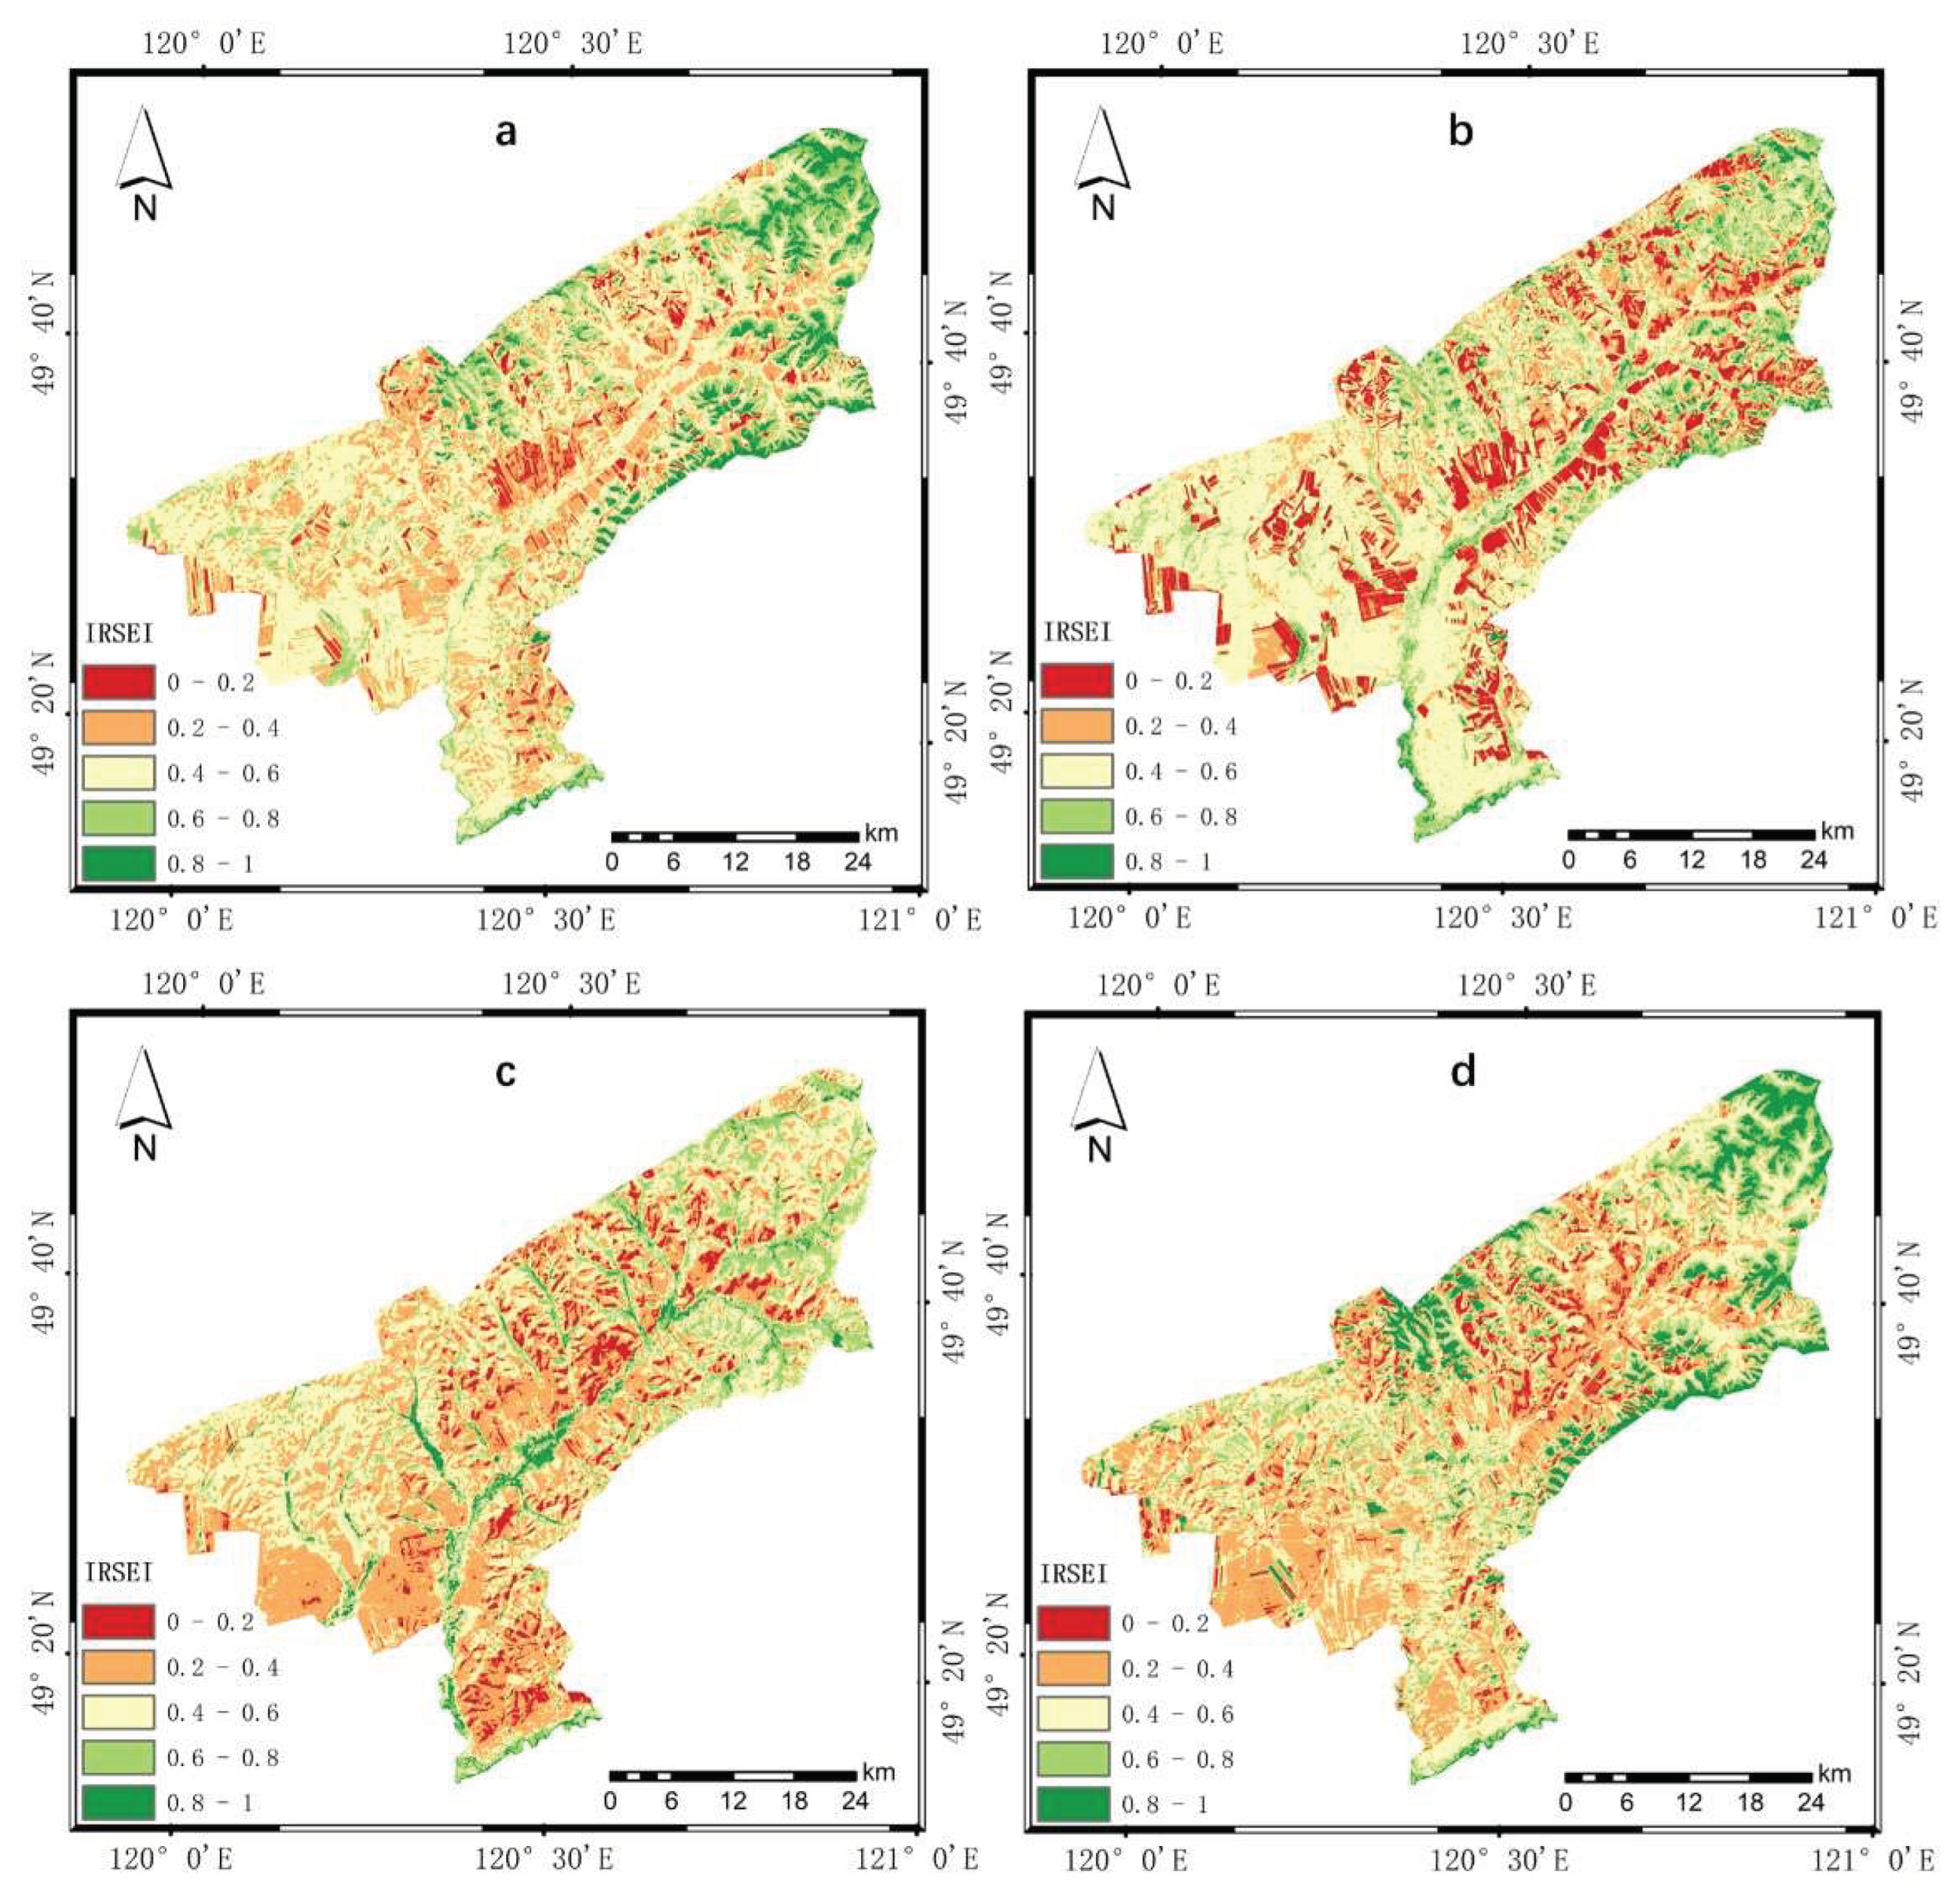
Figure 12.
The IRSEI change results for ten years in the ecological environment assessment of Tenihe Farm: (a–d) correspond to the IRSEI change results from 2010 to 2013, 2013 to 2016, 2016 to 2019, and 2010 to 2019, respectively.
Figure 12.
The IRSEI change results for ten years in the ecological environment assessment of Tenihe Farm: (a–d) correspond to the IRSEI change results from 2010 to 2013, 2013 to 2016, 2016 to 2019, and 2010 to 2019, respectively.
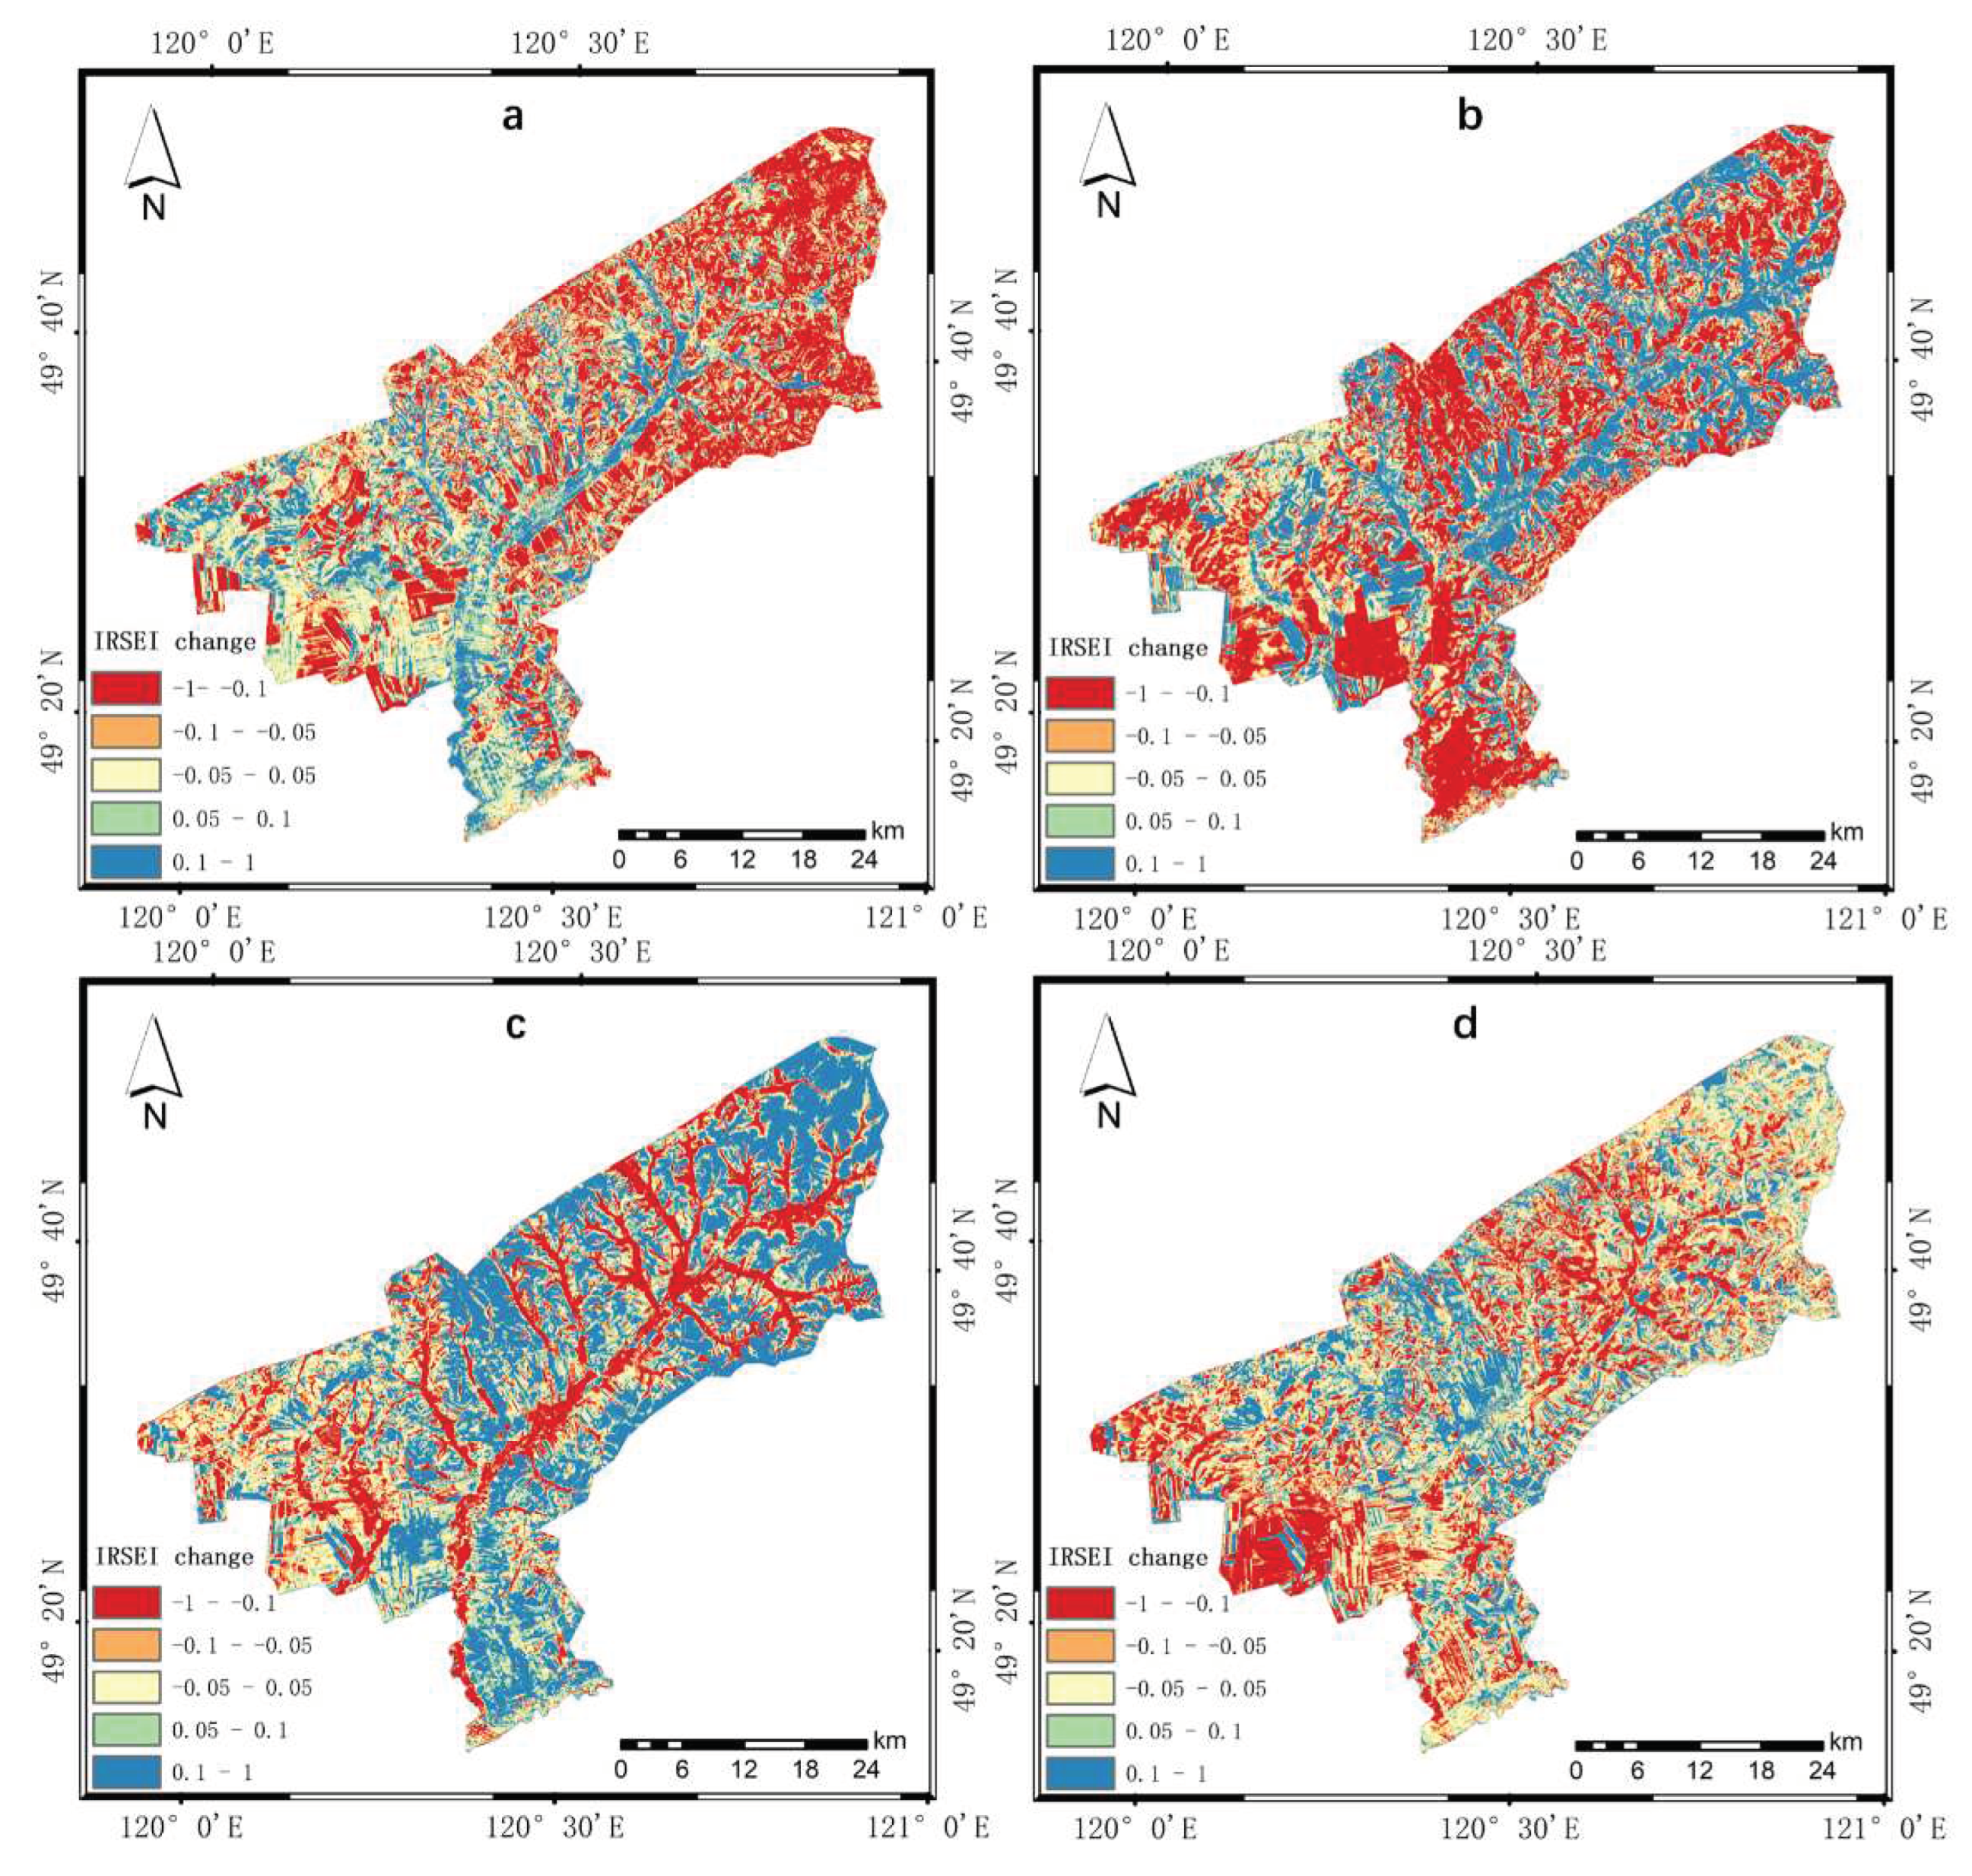

Table 1.
K-T transformation matrix coefficients of Landsat series satellites.
| Band | Blue | Green | Red | NIR | SWIR1 | SWIR2 | |
|---|---|---|---|---|---|---|---|
| Sensor | |||||||
| Landsat TM | 0.0315 | 0.2021 | 0.3102 | 0.1594 | 0.6806 | 0.6109 | |
| Landsat ETM+ | 0.1509 | 0.1973 | 0.3279 | 0.3406 | 0.7112 | 0.4572 | |
| Landsat OLI | 0.1511 | 0.1973 | 0.3283 | 0.3407 | 0.7117 | 0.4559 | |
Table 2.
Parametric statistics of radiance values of remote sensing images of Tenihe Farm.
| Year | t | Lu | Ld |
|---|---|---|---|
| 2010 | 0.82 | 1.28 | 2.13 |
| 2013 | 0.83 | 1.16 | 1.96 |
| 2016 | 0.96 | 0.23 | 0.44 |
| 2019 | 0.95 | 0.27 | 0.48 |
Table 3.
Setting of K1 and K2 under different sensor types.
| Sensor Types | K1 | K2 |
|---|---|---|
| Landsat 5 TM (band 6) | 607.76 | 1260.56 |
| Landsat 7 ETM+ (band 6) | 666.09 | 1282.71 |
| Landsat 8 TIRS (band 10) | 774.89 | 1321.08 |
| Landsat 8 TIRS (band 11) | 480.89 | 1201.14 |
Table 4.
Results of PCA (eigenvalues and contributions).
| Year | Index | PC1 | PC2 | PC3 | PC4 | PC5 |
|---|---|---|---|---|---|---|
| 2010 | Eigenvalue | 0.1214 | 0.0209 | 0.0102 | 0.0019 | 0.0000 |
| Contribution | 0.7861 | 0.1355 | 0.0660 | 0.0122 | 0.0002 | |
| 2013 | Eigenvalue | 0.1689 | 0.0282 | 0.0071 | 0.0024 | 0.0003 |
| Contribution | 0.8162 | 0.1365 | 0.0342 | 0.0115 | 0.0016 | |
| 2016 | Eigenvalue | 0.0788 | 0.0223 | 0.0024 | 0.0016 | 0.0000 |
| Contribution | 0.7491 | 0.2124 | 0.0225 | 0.0156 | 0.0004 | |
| 2019 | Eigenvalue | 0.1094 | 0.0253 | 0.0117 | 0.0017 | 0.0001 |
| Contribution | 0.7385 | 0.1706 | 0.0792 | 0.0113 | 0.0004 |
Table 5.
Correlation analysis between IRSEI results and component indicators over the past decade at Tenihe Farm.
Table 5.
Correlation analysis between IRSEI results and component indicators over the past decade at Tenihe Farm.
| Year | NDVI | WET | NDBSI | LST | PSI | Average correlation |
|---|---|---|---|---|---|---|
| 2010 | 0.914 | 0.920 | -0.027 | -0.899 | -0.907 | 0.733 |
| 2013 | 0.939 | 0.977 | -0.976 | -0.829 | -0.928 | 0.930 |
| 2016 | 0.363 | 0.801 | -0.434 | -0.915 | -0.313 | 0.565 |
| 2019 | 0.669 | 0.947 | -0.008 | -0.914 | -0.617 | 0.631 |
| Mean value | 0.721 | 0.911 | -0.361 | -0.889 | -0.691 | p<0.01 |
Table 6.
Changes in mean and standard deviation of IRSEI at Tenihe Farm over the past decade.
| Year | 2010 | 2013 | 2016 | 2019 |
|---|---|---|---|---|
| Mean | 0.589 | 0.534 | 0.598 | 0.573 |
| Standard deviation | 0.220 | 0.235 | 0.216 | 0.244 |
Table 7.
Grading statistics of IRSEI area by year at Tenihe Farm.
| Level | 2010 | 2013 | 2016 | 2019 | ||||
|---|---|---|---|---|---|---|---|---|
| Proportion/% | Area/ km2 |
Proportion/% | Area/ km2 |
Proportion/% | Area/ km2 |
Proportion/% | Area/ km2 |
|
| Inferior | 4.61 | 90.99 | 14.61 | 288.37 | 7.81 | 154.18 | 6.27 | 123.82 |
| Poor | 27.25 | 537.80 | 18.97 | 374.34 | 38.66 | 762.91 | 34.31 | 677.07 |
| Moderate | 47.89 | 945.08 | 47.87 | 944.62 | 37.07 | 731.58 | 36.29 | 716.09 |
| Good | 13.61 | 268.67 | 14.85 | 292.97 | 13.22 | 260.83 | 14.05 | 277.37 |
| Excellent | 6.64 | 130.97 | 3.71 | 73.21 | 3.24 | 64.01 | 9.08 | 179.16 |
Table 8.
Analysis of changes in IRSEI over a ten-year period at Tenihe Farm.
| Changes | 2010-2013 | 2013-2016 | 2016-2019 | 2010-2019 | ||||
|---|---|---|---|---|---|---|---|---|
| Proportion/% | Area/ km2 |
Proportion/% | Area/ km2 |
Proportion/% | Area/ km2 |
Proportion/% | Area/ km2 |
|
| [-1, -0.1) | 33.74 | 665.85 | 38.72 | 764.13 | 22.70 | 448.03 | 23.98 | 473.19 |
| [-0.1, -0.05) | 11.13 | 219.60 | 9.80 | 193.49 | 8.34 | 164.54 | 16.02 | 316.16 |
| [-0.05, 0.05) | 27.42 | 541.18 | 17.96 | 354.43 | 21.92 | 432.64 | 30.94 | 610.69 |
| [0.05, 0.1) | 10.09 | 199.19 | 7.83 | 154.46 | 11.44 | 225.83 | 10.12 | 199.64 |
| [0.1, 1] | 17.62 | 347.68 | 25.69 | 507.00 | 35.60 | 225.83 | 18.94 | 373.83 |
Disclaimer/Publisher’s Note: The statements, opinions and data contained in all publications are solely those of the individual author(s) and contributor(s) and not of MDPI and/or the editor(s). MDPI and/or the editor(s) disclaim responsibility for any injury to people or property resulting from any ideas, methods, instructions or products referred to in the content. |
© 2023 by the authors. Licensee MDPI, Basel, Switzerland. This article is an open access article distributed under the terms and conditions of the Creative Commons Attribution (CC BY) license (http://creativecommons.org/licenses/by/4.0/).
Copyright: This open access article is published under a Creative Commons CC BY 4.0 license, which permit the free download, distribution, and reuse, provided that the author and preprint are cited in any reuse.


