
Submitted:
12 December 2023
Posted:
14 December 2023
You are already at the latest version
Abstract
Fifteen transgenic shoot clones (TS A-TS O) regenerated from Hypericum perforatum hairy roots were evaluated for growth characteristics, phenylpropanoid, and naphthodianthrone production, as well as non-enzymatic and enzymatic antioxidant status. Transgenic shoots displayed higher biomass production and non-altered phenotype compared to control shoots. Phenylpropanoid production in TS was not related to phenylalanine ammonia lyase activity indicating that alternative enzymes could be involved in the regulation of phenylpropanoid/flavonoid biosynthesis. The positive correlation between phenylpropanoids (phenolic acids, flavonoids, flavan-3-ols, tannins) and non-enzymatic antioxidant assays suggested that these compounds are the main contributors to the redox state and radical scavenging properties of TS clones. More importantly, enhanced naphthodianthrone production (hypericin, pseudohypericin and protopseudohypericin) in TS was associated with the number of leaf dark glands. Concerning the enzymatic antioxidant status of TS, guaiacol peroxidase was shown as the main enzyme that turn down H2O2 levels, while the up-regulation of superoxide dismutase coincided with decreased O2•− production. The efficiency of antioxidant enzymes for O2•− and H2O2 neutralization declined the MDA level and consequently delayed lipid peroxidation in TS clones. Altogether, H. perforatum transgenic shoots could be proposed as a prospective biotechnological system for scale-up production of naphthodianthrones and phenylpropanoids with antioxidant properties.
Keywords:
antioxidant activity
; Hypericum perforatum L.
; naphthodianthrones
; phenolic compounds
; transgenic shoots
1. Introduction
Hypericum perforatum L. (St. John’s wort) is the most popular medicinal plant worldwide due to а broad diversity of phenolic compounds with pharmacological properties [1]. The aerial parts of H. perforatum wild-growing plants represented the main source of naphthodiathrones, acyl-phloroglucinols, flavonol glycosides, flavan-3-ols, and phenolic acids, while roots synthesized significant amounts of xanthones [2,3]. The naphthodianthrone hypericin commonly distributed into dark glands on the leaf and petal margins [4] has been shown as a powerful photosensitizer used in photodynamic therapy of cancer and virus diseases [5]. In addition, prenylated phloroglucinols and flavonoids possessed antidepressant, anti-inflammatory, antimicrobial, antioxidant, and wound-healing activities [1,6]. The xanthones have been proposed as promising compounds with antibacterial, antifungal, and antidiabetic properties [7,8]. Taking into account the continuous demand of the pharmaceutical industry for H. perforatum raw material, many studies have been focused on the evaluation of various factors that influence the chemical composition of Hyperici herba. In this context, phytochemical variability of field-grown plants has been related to the geographical origin, abiotic and biotic environmental factors, contamination issues, as well the genotype, time of harvest, plant development, and physiological stage [7,9,10]. To overcome these confounding factors, various biotechnological techniques have been applied to obtain H. perforatum raw material with stable amounts of secondary metabolites [11,12].
Plant cell and tissue culture technology represents a promising approach for the sustainable production of bioactive metabolites in controlled and aseptic conditions. The main advantage of in vitro technology over traditional cultivation of medicinal plants includes fast cell growth, pathogen-free plant material, and reliable secondary metabolite production [13]. Recently, attractive in vitro strategies have been established to increase the quantity and quality of H. perforatum secondary metabolites. The optimization of culture conditions, bioreactor technology, elicitation, and genetic transformation have been extensively studied for the overproduction of hypericins, hyperforins, phenylpropanoids, and xanthones in H. perforatum in vitro cultures [11,14,15]. Even though elicitation represents the commonly used approach for the up-regulation of secondary metabolites in H. perforatum in vitro cultures, the commercial relevance is still a challenge due to the influence of culture conditions, cell differentiation, elicitor concentration, and post-elicitation duration [15]. Since the biological activity of plant extracts is greatly influenced by phenylpropanoid and naphthodianthrone contents, the enhancement of their production has been suggested as an important target for the genetic transformation of H. perofratum [16].
In the last two decades, Agrobacterium-mediated transformation has emerged as a novel approach for the modulation of secondary metabolite production in Hypericum in vitro cultures [14]. The H. perforatum has been shown as a recalcitrant species to A. tumefaciens-mediated transformation due to the presence of antimicrobial compounds that inhibit bacterial growth [17]. On the other hand, A. rhizogenes-mediated transformation of H. perforatum represents a reliable method to obtain hairy root (HR) cultures characterized by fast growth on an auxin-free medium, as well as genetic and biochemical stability [18]. The rol and aux genes from the T-DNA of A. rhizogenes root-inducing (Ri) plasmid have been successfully integrated into the genome of H. perforatum [19,20,21] and other Hypericum species [22,23]. Those studies revealed that phenotypic characteristics, bioactive metabolites production, and antioxidant status of Hypericum HR clones depend on rol and aux gene expression and their copy numbers in the plant genome. Our previous studies revealed that the integration of A. rhizogenes T-DNA genes into transformed cells suppresses reactive oxygen species (ROS) production in H. perforatum HR cultures through the activation of antioxidant enzyme machinery and up-regulation of phenylpropanoid metabolism [24,25,26]. In this context, H. perforatum HR cultures were proposed as a perspective system for enhanced production of root-specific compounds, such as phenolic acids, flavonoids, and xanthones [21,24,26,27,28]. However, Hypericum HR cultures did not show capability for hypericins production, since the accumulation of these bioactive compounds is related to the development of dark glands in plant aerial parts [4]. Several studies have been directed toward the establishment of Hypericum HR-regenerated shoots as an efficient experimental system for naphthodianthrone production [12,29].
To the best of our knowledge, H. perforatum HR cultures have a great potential for spontaneous regeneration into transgenic shoots upon exposure to light or photoperiod [24,29,30]. The expression of rol gene loci from A. rhizogenes Ri-plasmid into plant genome has been related to the unique morphological characteristics of transgenic plants such as dwarfism and increased branching [31]. Several studies pointed out that rol gene copy number is the main determinant for phenotypic alterations in H. perforatum transgenic plants including the number and density of dark glands as the multicellular reservoirs of hypericins [32,33]. The production of hypericins in Hypericum transgenic shoots has been observed to be comparable [24,32] or even higher [20,30,33] than non-transgenic shoots. Thus, the screening of various H. perforatum transgenic shoot clones could be a promising strategy for the selection of superior lines with enhanced production of bioactive metabolites with antioxidant properties.
In this study, fifteen H. perforatum transgenic shoot clones (TS A-TS O) regenerated from the corresponding HR lines (HR A-HR O) were evaluated for the following topics:
- (1)
- biomass production (fresh weight, dry weight, fresh weight/dry weight ratio and dry weight yield);
- (2)
- phenotypic characteristics (index of compactness and number of dark glands per leaf);
- (3)
- production of total phenylpropanoids (phenolics, flavonoids, flavan-3-ols, condensed taninns, and phenolic acids);
- (4)
- identification and quantification of naphthodianthrones (hypericin, pseudohypericin, and protopseudohypericim) by UPLC analysis;
- (5)
- phenylalanine ammonia lyase and polyphenol oxidase activities;
- (6)
- non-enzymatic antioxidant capacity (cupric reducing antioxidant capacity; ferric ions reducing antioxidant power, ABTS radical scavenging activity, lipid peroxidation inhibition);
- (7)
- radical scavenging activity (hydrogen peroxide, superoxide anion and hydroxyl radical);
- (8)
- antioxidant enzyme activities (guaiacol peroxidase, ascorbate peroxidase, catalase and superoxide dismutase);
- (9)
- oxidative stress marker contents (hydrogen peroxide, superoxide anion and malondialdehyde).
2. Materials and Methods
2.1. Establishment of Hypericum perforatum Transgenic Shoots
The protocol for the establishment of fifteen H. perforatum TS clones (TS A-TS O) from corresponding HR lines (HR A-HR O) was described in our previous study [30]. The transgenic nature of HR clones was previously confirmed by PCR amplification of rolB gene [21]. The segments from all HR lines along with non-transformed roots (NTR) were inoculated on solid hormone-free MS/B5 medium and exposed to photoperiod conditions of 16-h light and irradiance at 50 μmol·m2·s-1. The NTR and HR A-HR O lines exhibited a potential for spontaneous shoot differentiation into corresponding non-transgenic shoots (NTS) and transgenic shoot clones (TS A-TS O). After the determination of regeneration frequency (RF), NTS and TS clones were multiplied on a solid MS/B5 medium supplemented with 0.2 mg·L-1 N6-benzyladenine (BA).
2.2. Growth and Phenotypic Characteristics
The NTS and TS clones were used for the determination of fresh weight (FW), dry weight (DW), FW/DW ratio, and dry weight yield (DWY). The morphology of shoot cultures was evaluated by measurement of shoot length (SL) and number of leaves per shoot (NLS). These parameters were used to calculate the index of compactness (IC=SL/NLS) of shoot cultures. Fully developed apical leaf couples were used for the determination of the number of dark glands per leaf (NDG).
2.3. Phenylpropanoid Production
The H. perforatum control (NTS) and transgenic shoot lines (TS A-TS O) were harvested, frozen in liquid nitrogen or lyophilized, and then stored at -80°C, until phytochemical analyses. Briefly, phenolic compounds were extracted from powdered dry plant material with 80% (v/v) CH3OH in an ultrasonic bath for 30 min at 4°C [34,35]. Thereafter, methanolic extracts were centrifuged at 12000 rpm for 15 min and the supernatants were used for the determination of total contents of phenolics (TP), flavonoids (TF), flavan-3-ols (TFA), condensed tannins (TCT), and phenolic acids (TPA). The protocols for quantification of TP, TF, TFA, TCT, and TPA in shoot extracts were described in our recent studies [25,26]. Spectrophotometric analyses were performed on SpectraMax 190 Microplate Reader (Molecular Devices Corp., Sunnyvale, CA) supported with SoftMax Pro (v. 5.4.1) software.
2.4. UPLC-TUV Analysis of Naphthodianthrones
Extract preparation. The extracts were prepared by homogenization of 0.05 g lyophilized shoot cultures with 1 mL 80% (v/v) CH3OH in an ultrasonic bath for 30 min. The homogenates were vortexed and centrifuged at 12000 rpm for 15 min at 4°C. The supernatants were filtered through 0.2 µm filters (Ministart RC 25, Sartorius Stedim Biotech, Germany) prior to the chromatographic analysis. The light was excluded as much as possible during all procedures for extract preparation.
UPLC-TUV system. The identification and quantification of naphthodianthrones in shoot extracts were performed on ACQUITY ultra-performance liquid chromatography (UPLC) system with dual-wavelength tunable UV/Vis (TUV) detector (H-class, Waters, Milford, MA, USA). The instrument was equipped with a quaternary solvent manager (QSM), sample manager-flow through the needle (SM-FTN), degassing system, and CH-A column heater controlled by ACQUITY UPLC Console and MassLynx software (Waters). Chromatographic separation of naphthodianthrones was performed using ACQUITY UPLC HSS T3 column (100 × 2.1 mm, 1.8 μm; Waters) thermostated at 38°C. The mobile phase consisted of two solvents A: 0.1% formic acid (v/v) and B: acetonitrile. The gradient program was as follows: from 10% to 50% B (0.0–1.0 min), from 50% to 100% B (1.0–14 min), 100% B (14–19 min), and from 100% to 10% B (19–25 min). The flow rate was set at 0.571 mL·min−1 and the injection volume was 10 μL. Total run time was 25 min. Retention time (tR) for protopseudohypericin (PPHYP), pseudohypericin (PHYP), and hypericin (HYP) were 3.9, 4.9, and 12.6 min, respectively.
The peak assignment of naphthodianthrones was based on the comparison of their retention time to those of reference standards. The reference standards of hypericin (HYP) and pseudohypericin (PHYP) were HPLC grade with >99% and >98% purity, respectively (PLANTA Naturstoffe Vertriebs GmbH, Vienna, Austria). The stock solutions of reference standards (1 mg·mL-1) were prepared in 80% (v/v) CH3OH and were stored at 4°C. The external standard method was used for quantification of all identified naphthodianthrones in shoot samples at 590 nm according to their peak area.
The identification of naphthodianthrones in shoot extracts was additionally confirmed using the HPLC system connected to the Agilent G2445A ion-trap mass spectrometer equipped with electrospray ionization (ESI) system and controlled by LCMSD software (Agilent, v.6.1.) as previously reported [24,30,36]. The UV/Vis, MS, and MS2 spectra of the component peaks are presented in Table 1.
Method validation. The UPLC-TUV method was validated for linearity, sensitivity, accuracy and precision. To determine the linearity and range of the analytical method, the standard stock solutions (1 mg·mL-1) for HYP and PHYP were diluted in concentration ranges of 0.02-0.1 μg·mL-1 and 0.1-3 μg·mL-1, respectively. Calibration curves of HYP and PHYP revealed a good linearity, as shown by the correlation coefficients above 0.99 in tested ranges (Table 2). The sensitivity of the method was evaluated by determination of the limit of detection (LOD) and limit of quantification (LOQ). The LOD and LOQ values (Table 2) were calculated using the following formulas: LOD = 3.3 × σ/S and LOQ = 10 × σ/S, where σ is the standard deviation of the y-intercept and S is the slope of the calibration curve in the low concentration level (0.001-0.01 μg·mL-1 for HYP and 0.01-0.2 μg·mL-1 for PHYP). The accuracy of the method was assessed through a recovery test. The contents of HYP and PHYP in shoot samples were 0.025 and 1.918 μg·mL-1, respectively. Then, three different concentration levels (high, medium, and low) of a standard mixture were added to this sample (Table 2).
The spiked samples were then analyzed with the previously established method. The recovery was calculated according to the following formula: Recovery = (found concentration-original concentration)/spiked concentration × 100%. The recoveries for HYP and PHYP are presented in Table 2. To determine the repeatability of the method, six replicates of mixed standard solutions containing PHYP and HYP at three different concentrations within the concentration range were injected and analyzed. The relative standard deviation (RSD) of the components peak area was < 1.5% (Table 2). These data demonstrated that the established UPLC method had satisfactory precision, accuracy, and repeatability for simultaneous analysis of HYP and PHYP in H. perforatum shoot culture extracts.
2.5. Phenylalanine Ammonia Lyase (PAL) and Polyphenol Oxidase (PPO) Activities
The extracts for the determination of phenylalanine ammonia lyase (PAL) and polyphenol oxidase (PPO) activities were prepared by homogenization of frozen shoot tissue (about 0.3 g) in the appropriate buffer solution. For the PAL assay was used 1 mL 100 mМ sodium borate (Na2B4O7, pH 8.8), while for the PPO assay was used 50 mM K2HPO4/KH2PO4 (pH 7.0) buffer [26]. The enzyme extracts were also used for the determination of protein content by Bradford assay using bovine serum albumin as a standard [37].
The PAL assay was performed in a reaction mixture consisting of shoot extract and 20 mM L-phenylalanine [34,35]. The molar extinction coefficient of trans-cinnamic acid (ε290=9630 L·mol-1·cm-1) was used to express PAL activity in pkat·mg-1 proteins.
The PPO assay was conducted by mixing the shoot extract and 40 mM pyrocatechol [26]. The molar extinction coefficient of ortho-benzoquinone (ε390=1417 L·mol-1·cm-1) was used to express PPO activity in nkat·mg-1 proteins.
2.6. Antioxidant Activities
The antioxidant activity was determined in methanolic shoot extracts by the following methods: cupric ion-reducing antioxidant capacity (CUPRAC), ferric ion-reducing antioxidant power (FRAP), ABTS radical scavenging activity and lipid peroxidation inhibition (LPI). The CUPRAC and LPI assays were performed according to the protocols described in our previous studies [25,26].
The FRAP assay was determined in a reaction mixture including shoot extract and FRAP reagent [38]. The FRAP reagent consisted of 300 mM CH3COONa buffer (pH 3.6), 10 mM TPTZ (2,4,6-tri(2-pyridyl)-s-triazine) in 40 mM HCl and 20 mM FeCl3 (10:1:1, v/v/v). After incubation of the reaction mixture for 30 min at 37°C under dark, the sample absorbance was measured at 593 nm. The FRAP values were calculated with FeSO4·7H2O as a standard (0-10 mМ). Results were expressed as micromoles of Fe2+ equivalents per gram of dry weight (μM Fe2+·g-1 DW).
The ABTS radical scavenging activity was determined by the method of Re et al. [39]. The ABTS radical cation (ABTS•+) was generated by a reaction of 7 mM ABTS [2.2’-azinobis(3-ethylbenzothiazoline-6-sulphonic acid) diammonium salt] with 2.45 mM K2S2O8 (1:1, v/v). The mixture was incubated in the dark (12–16 h) at room temperature and the generated blue-green ABTS•+ solution was diluted with CH3OH to obtain an absorbance of 0.70 (±0.05) at 734 nm. All shoot extracts were diluted to give a 20-80% absorbance decrease of ABTS•+ solution. The reaction was initiated by the addition of ABTS•+ solution to shoot extract and thoroughly mixed. The control samples contained CH3OH instead of plant extract. The samples were allowed to stand for 6 min and the absorbance was recorded at 734 nm. The ABTS radical scavenging activity was calculated with trolox as a standard (0-1000 μМ). Results were expressed as micromoles of Trolox equivalents (T) per gram of dry weight (μM T·g-1 DM).
2.7. Radical Scavenging Activities
The scavenging activity (SA) of shoot extracts was determined for the hydrogen peroxide (H2O2), superoxide radical (O2•-), and hydroxyl radical (OH•).
The H2O2 SA and O2•- SA were performed in shoot methanolic extracts as previously described in our studies [25,26], while OH• SA was evaluated in water extracts with the method described by [40].
The protocol for OH• SA was performed in the reaction mixture consisted of shoot extract, 28 mM 2-deoxy-2-D-ribose (in 20 mM KH2PO4/KOH buffer, pH 7.4), 0.1 mM EDTA, 0.1 mM FeCl3, 1 mM ascorbic acid (AA) and 1 mM H2O2. After incubation at 37°С for 1 hour, 1% trichloroacetic acid (TCA) and 2.8% thiobarbituric acid (TBA) were added and the mixture was incubated at 95°С for 30 min. The absorbance of pink colored complex was measured at 532 nm. The OH• SA of shoot extracts was calculated with mannitol as a standard (0-10 mМ). Results were expressed as millimoles of mannitol equivalents (M) per gram of dry weight (mM M·g-1 DW).
2.8. Antioxidant Enzymes
Antioxidant enzymes such as guaiacol peroxidase (PX), ascorbate peroxidase (APX), catalase (CAT), and superoxide dismutase (SOD) were determined in shoot extracts. The procedure for enzyme extraction was performed by the method described in our previous study [26].
The PX activity was measured in a reaction mixture consisting of enzyme extract, 2% guaiacol, and 0.3% H2O2 [41]. The rate of absorbance increase due to tetraguaiacol formation was monitored for a period of 5 min at 470 nm. The molar extinction coefficient of tetraguaiacol (ε470=26.6 L·mol-1·cm-1) was used to express PX activity in nkat·mg-1 proteins.
The APX activity was determined by mixing enzyme extract with 0.5 mM AA and 1 mM H2O2 [42]. The rate of absorbance decrease due to AA oxidation was monitored for a period of 10 min at 290 nm. The molar extinction coefficient of AA (ε290=2.8 L·mol-1·cm-1) was used to express APX activity in pkat·mg-1 proteins.
The CAT activity was performed in a reaction mixture consisting of enzyme extract, 0.1% H2O2, and 50 mM potassium phosphate buffer [43]. The rate of absorbance decrease due to H2O2 consumption was monitored for a period of 1 min at 240 nm. The molar extinction coefficient of H2O2 (ε240=43.6 L·mol-1·cm-1) was used to express CAT activity in nkat·mg-1 proteins.
The SOD activity was measured through the determination of the sample’s ability to inhibit photochemical reduction of NBT [44]. The reaction mixture consisting of enzyme extract, 130 mM methionine, 750 μM NBT, and 20 μM riboflavin was illuminated for 15 min. The absorbance of the illuminated reaction mixture was recorded at 560 nm and compared with that of the non-illuminated reaction mixture that served as a control. One unit (U) of SOD activity was defined as the amount of enzyme required to cause 50% inhibition of NBT photoreduction rate. The SOD activity was expressed as U·mg-1 protein.
2.9. Oxidative Stress Markers
The shoot extracts for quantification of oxidative stress markers H2O2 and malondialdehyde (MDA) were prepared from fresh tissue using 5% ТСА, while O2•- production rate was assessed in the extracts for determination of antioxidant enzymes.
The endogenous H2O2 level was determined in the reaction mixture consisting of shoot extract, 10 mM K2HPO4/KH2PO4 buffer (pH 7.0), and 1 М KI [45]. After incubation at room temperature for 1 hour, the sample absorbance was measured at 390 nm. The H2O2 content was calculated using H2O2 as a standard (0-1000 μМ). The results were expressed as micromoles of H2O2 per gram of fresh weight (μM H2O2·g-1 FW).
The O2•- production rate was measured in a mixture containing shoot extract, 50 mM potassium phosphate buffer (pH 7.0), and 10 mM hydroxylamine hydrochloride [46]. Thereafter, an aliquot of Griess reagent was added to the reaction mixture and the absorbance was measured at 530 nm. The O2•- production rate was calculated with NaNO2 as a standard (0-1000 μМ). The results were expressed as nanomoles of generated O2•- per min and gram of fresh weight (nM O2•- ·min-1·g-1 FW).
The MDA content was determined by mixing shoot extracts with 0.5% TBA in 20% TCA and further heating of reaction mixture at 95°C for 30 min [47]. After cooling to room temperature, the sample absorbance was monitored at 532 nm and at 600 nm to subtract the non-specific absorbance. The MDA content was calculated using the molar extinction coefficient of MDA (155 mM-1·cm-1) and the results were expressed as nanomoles MDA per gram of fresh weight (nМ MDA·g-1 FW).
2.10. Statistical Analysis
The experiments with transgenic shoot clones were independently repeated two times under the same conditions and all analyses were performed in triplicate. All data were presented as mean values with standard deviation (±SD). The data were analyzed by one-way ANOVA (version 5.0; StatSoft Inc., Tulsa, OK, USA) to detect significant differences between shoot samples. A post hoc separation of means between different shoot clones was performed by the Duncan’s test (p < 0.05). The data for growth and morphological characteristics, phenylpropanoid and naphthodianthrone contents, as well for the antioxidant status were subjected to principal component analysis (PCA) and hierarchical agglomerative clustering (HAC) using the statistical software XLSTAT 2014.5.03 (Addinsoft, NY, USA). Pearson’s correlation coefficients between the analyzed parameters were obtained by R software v. 4.2.1 (R Core Team, Vienna, Austria).
3. Results
3.1. Establishment of Hypericum perforatum Transgenic Shoots
Transgenic shoot clones (TS A-TS O) of H. perforatum were regenerated from corresponding hairy root clones (HR A-HR O) grown on hormone-free MS/B5 medium under photoperiod (Figure 1A). Non-transgenic shoots (NTS) that served as a control were regenerated from non-transgenic root cultures (NTR). The regenerated shoots were isolated from root tissues and then cultivated on a medium supplemented with 0.2 mg·L-1 BA for incessant growth. After 1 month of cultivation, shoot clones were successfully multiplied (Figure 1B) and were evaluated for differences in morphological and growth characteristics, production of phenylpropanoids and naphthodianthrones, as well antioxidant status.
3.2. Morphological and Growth Characteristics of Transgenic Shoots
The cultivation of HR and NTR explants on hormone-free MS/B5 solid medium resulted in spontaneous regeneration into corresponding TS clones and NTS. The RF of HR and NTR explants was evaluated after 1 month of cultivation (Table 3). The HR clones showed significant differences in RF from 12.5% to 82%. A maximum RF was observed for HR G and HR L clones, which was about 4-fold higher in comparison to NTR. In contrast, HR C and HR J clones showed significantly lower RF (1.6-fold) compared to NTR. Multiplied TS clones and NTS cultures of H. perforatum were used for the evaluation of biomass accumulation FW, DW, FW/DW ratio, and DWY, as well as morphological characteristics including the IC and NDG (Table 2).
The FW production among TS clones varied from 2.16 to 18.68 g. The FW accumulation in TS D and TS K was markedly higher (about 3.5-fold) than that found in NTS. Results also showed variability in DW production among TS clones from 0.21 to 0.98 g. The highest DW production was noticed in TS K, which was about 2.9-fold of that observed in NTS. The FW/DW ratio of TS clones was ranged from 8.83 to 25.06. The TS C and TS D clones showed a significantly higher FW/DW ratio (about 1.6-fold) than that observed in NTS. With respect to DWY in TS clones, the values varied from 3.99% to 11.33%. The TS A and TS N clones displayed about 1.7-fold higher DWY than that noticed in NTS. The IC in TS clones varied from 2.40 to 5.27, while NTS had a value of 3.73. Only three clones (TS G, TS I, and TS M) showed significantly higher IC values (up to 1.4-fold) compared to NTS. The NDG in TS clones was ranged from 6.00 to 15.67, while NTS showed a value of 9.00. Three clones denoted as TS B, TS G, and TS K exhibited the highest NDG value (from 1.5- to 1.7-fold) than that found in control shoots.
3.3. Phenylpropanoid Production in Transgenic Shoots
The results for phenylpropanoid contents, as well as for phenylalanine ammonia lyase (PAL) and polyphenol oxidase (PPO) activities in H. perforatum shoot cultures are presented in Table 4. The contents of phenolics (TP) in TS clones ranged from 23.26 to 62.03 mg GA·g-1 DW. Five clones denoted as TS C-TS F and TS J showed significantly higher TP amounts (up to 1.4-fold) compared to NTS. Total flavonoid (TF) contents in TS clones showed values from 7.36 to 27.82 mg C·g-1 DW. Three clones TS C, TS D, and TS F exhibited the highest TF production (about 1.4-fold) than that found in NTS. The amounts of flavan-3-ols (TFA) in TS clones varied from 1.85 to 10.44 mg C·g-1 DW. The TS F clone showed 2-fold elevated TFA production compared to NTS. The TS clones displayed a variation in condensed tannins (TCT) contents (1.37-4.2 mg CG·g-1 DW). The highest TCT production (1.3-fold) was noticed for the TS F clone in comparison to NTS. Total phenolic acids (TPA) content in TS clones varied from 1.29 to 4.35 mg P·g-1 DW. Two clones TS E and TS F showed slightly higher TPA contents than that found in NTS.
The PAL activity in TS clones varied from 0.1 to 2.8 pkat·mg-1 P. Three clones denoted as TS A, TS F, and TS N showed significantly higher enzyme activity (from 1.3- to 3.9-fold) compared to NTS. Present results demonstrated that all tested TS clones had markedly enhanced PPO activity (11.49-51.39 nkat·mg-1 P) compared to NTS (5.6 nkat·mg-1 P). A maximum increase in PPO activity was noticed in TS A and TS C clones which was about 9.2-fold higher than that found in NTS cultures.
3.4. Naphthodianthrone Production in Transgenic Shoots
Among the group of naphthodianthrones, hypericin (HYP), pseudohypericin (PHYP), and protopseudohypericin (PPHYP) were identified and quantified in all tested TS clones, as well in NTS (Table 5). Particularly, PHYP was found as a pre-eminent compound from the class of naphthodianthrones in shoot extracts (Figure 2).
The HYP contents in TS clones ranged from 11.11 to 69.41 µg·g-1 DW. From the selected clones, only TS B showed markedly higher HYP amounts (2.4-fold) compared to NTS. The amounts of PHYP in TS clones varied from 537.09 to 1915.34 µg·g-1 DW. The most of TS clones exhibited significantly higher or comparable PHYP contents than in NTS. A maximum PHYP production was observed in the TS B clone that was almost 3-fold enhanced than NTS. The PPHYP contents in TS clones varied from 142.61 to 578.80 µg·g-1 DW. It is interesting to note that all tested TS clones displayed significantly increased PPHYP amounts compared to NTS cultures. The highest PPHYP production (6.3-fold) was noticed for the TS H clone than that observed in NTS cultures.
3.5. Antioxidant and Radical Scavenging Activities in Transgenic Shoots
The H. perforatum shoot cultures were evaluated for antioxidant capacity (CUPRAC, FRAP, ABTS, and LPI) and radical scavenging activity (H2O2 SA, O2•- SA, and OH• SA), (Table 6).
The CUPRAC values in TS clones varied from 79.56 to 250.81 μМ Т·g-1 DW. The highest value for CUPRAC (1.4-fold) was found in TS F and TS E clones compared to NTS. The FRAP values in TS clones ranged from 230.88 to 649.91 μМ Fe2+·g-1 DW. A maximum FRAP was noticed in the TS F clone (1.5-fold) compared to NTS cultures. The ABTS values in TS cultures varied from 48.66 to 168.75 μМ Т·g-1 DW and the TS F clone showed 1.4-fold higher activity compared to NTS. The LPI in TS clones varied from 51.50 to 91.33% and only the TS K clone exhibited a slightly higher value compared to NTS cultures.
The H2O2 SA in all tested TS clones (21.92-33.15%) was significantly higher compared to NTS (18.47%). A maximum H2O2 SA was noticed in the TS K clone (1.8-fold) than that found in NTS. The O2•- SA in TS clones varied from 24.20 to 57.94% and the highest value was noticed in the TS N clone (1.7-fold) in comparison to NTS (34.68%). The TS clones did not show a great variation in OH• SA (1.14-1.85 mM M·g-1 DW), and only the TS F clone displayed a slightly higher scavenging value compared to NTS cultures.
3.6. Antioxidant Enzymes and Oxidative Stress Markers in Transgenic Shoots
The enzymatic antioxidant system in H. perforatum shoot extracts was evaluated through the activity of guaiacol peroxidase (PX), ascorbate peroxidase (APX), catalase (CAT) and superoxide dismutase (SOD), while oxidative stress markers included quantification of H2O2, O2•- and malondialdehyde (MDA), (Table 7).
The PX activity in all tested TS clones (0.04-0.29 nkat·mg-1 P) was significantly higher compared to NTS (0.03 nkat·mg-1 P). The TS B clone showed markedly higher PX activity (9.7-fold) compared to NTS. The APX activity in TS clones varied from 13.06 to 124.69 pkat·mg-1 P and only TS C and TS A showed significantly higher enzyme activity (1.9- and 1.6-fold, respectively) compared to NTS. The CAT activity in TS clones ranged from 0.11 to 1.17 nkat·mg-1 P and TS G and TS C showed significantly elevated enzyme activity (1.5- and 1.3-fold, respectively) in comparison to NTS. The SOD activity in TS clones varied from 0.47 to 7.51 U·mg-1 P and TS C and TS A exhibited significantly enhanced SOD activity (3.7- and 1.2-fold, respectively) than that in NTS.
The H2O2 contents in all TS clones (0.38-1.18 μM·g-1 FW) were significantly decreased compared to NTS (1.34 μM·g-1 FW). The TS A clone showed markedly lower H2O2 contents (3.5-fold) compared to NTS cultures. The O2•- production rate in TS clones varied from 0.24 to 1.22 nM·min-1·g-1 FW and five clones (TS I, TS J, TS L, TS M, and TS O) exhibited significantly higher values (up to 1.9-fold) compared to NTS. Other TS clones demonstrated comparable or lower O2•- production rate than NTS. The MDA contents in TS clones (0.41 to 1.75 nM·g-1 FW) were similar or lower compared to NTS (1.42 nM·g-1 FW).
3.7. Principal Component Analysis and Hierarchical Agglomerative Clustering
The principal component analysis (PCA) and hierarchical agglomerative clustering (HAC) were performed as statistical tools to determine the variance of analyzed parameters within fifteen H. perforatum TS clones and NTS, as well as to cluster the samples (Figure 3).
The PCA data showed that PC1 and PC2 explained 49.74% of the total variation. The loadings plot of PCA (Figure 3A) indicated that the PC1 exhibited a variance of 32.67% that was positively related to phenylpropanoid production (TP, TF, TFA, TCT, TPA), antioxidant activities (CUPRAC, FRAP, ABTS) and OH• SA. The PC2 showed a variance of 17.07% and it was positively related to the growth and morphological characteristics (FW, DW, FW/DW, NDG), but a negative relationship was observed for DWY.
Present results for the analyzed parameters showed that control and transgenic shoots are mainly separated on PC1 (Figure 3B) and grouped into 3 clusters (Figure 3C). Cluster I was represented with five clones (TS C-TS F, TS J) along with NTS exhibiting positive scores on PC1. Those TS clones were described with intensive phenylpropanoid metabolism that resulted in the accumulation of phenolic compounds with antioxidant and OH• scavenging capacity. Cluster II included six clones (TS A, TS B, TS G, TS H, TS K, TS L) distributed among the origin of PC1 and they were characterized by moderate production of phenylpropanoids and antioxidant activities. Cluster III was represented by four clones (TS I, TS M-TS O) displaying the strongest negative scores on PC1 and they showed weak phenylpropanoid metabolism and low non-enzymatic antioxidant status.
The Pearson’s correlation matrix (Figure 4) demonstrated that phenylpropanoids (TP, TPA, TF, TCT, and TFA) were in significant positive correlation with growth characteristics (FW and FW/DW), antioxidant/radical scavenging activity (CUPRAC, FRAP, ABTS, and OH• SA) and antioxidant enzymes (PX, APX, CAT, and SOD). The activities of antioxidant enzymes including PPO showed a significant negative correlation with oxidative stress markers (H2O2 and O2). The H2O2 and MDA levels showed a significant negative correlation with naphthodianthrone production (HYP, PHYP, and PPHYP). The O2•- production rate was in significant negative correlation with phenylpropanoid production and antioxidant activities. The contents of identified naphthodianthrones were in significant positive correlation with growth and phenotypic characteristics (RF, FW, DW, FW/DW, and NDG), as well as with antioxidant enzymes (GPX and CAT).
4. Discussion
4.1. Growth Characteristics of Transgenic Shoots
The fifteen solid-grown H. perforatum HR clones (HR A-HR O) induced by A. rhizogenes-mediated transformation [25] were regenerated into corresponding transgenic shoot clones (TS A-TS O). It has been shown that H. perforatum root segments are the most responsive explants to photoperiod and plant growth regulators for shoot development [48,49]. The regenerative potential of H. perforatum HR has been promoted by light [30,50], but also it was reported that this process could be light-independent [51]. From our previous study, photoperiod exposition of H. perforatum HR cultures induced spontaneous shoot regeneration on a hormone-free medium [26]. Those photoperiod-exposed HR were characterized by green coloration and slow growth rate due to the usage of photosynthetically derived carbohydrates for shoot organogenesis rather than for root proliferation. In addition, Damgaard and Rasmussen [52] have reported that shoot meristem development is related to the light-induced biosynthesis of endogenous cytokinins in HR cells. These findings indicated that light-mediated phytohormonal imbalance in H. perforatum HR tissues could be considered as the main factor for spontaneous transgenic shoot regeneration.
Outgoing data showed considerable variability in the shoot regeneration frequency among fifteen HR A-HR O clones. Noteworthy, H. perforatum transgenic roots displayed higher shoot organogenic potential compared to non-transgenic roots implicating that the presence of Ri T-DNA genes additionally stimulated the formation of HR-regenerated shoots. Taking into account the unique transformation event in transgenic clones, the heterogeneity in the integration sites, copy numbers, and expression level of Ri T-DNA genes could be the reasons for different shoot regeneration potential of HR lines. In this view, the variation in regeneration frequency of H. perforatum HR clones induced by A. rhizogenes strain A4M70GUS has been attributed to the differences in rol gene expression [19]. These authors revealed that high rol gene expression was related to fast root growth, while low amounts of rol gene transcripts induced shorter roots with shoot-directed morphogenesis. Therefore, the fast growth previously observed for HR B and HR F clones [25] may indicate that levels of rol transcripts in these lines did not favor shoot morphogenesis as evidenced here by their low regeneration frequency. Additionally, the integration of rol genes altered the endogenous auxin/cytokinin ratio in HR cells, which may affect the shoot regenerative potential of transgenic roots [53]. The differences in regeneration frequency observed here for HR clones open a new possibility for further evaluation of hormonal and genetic background for organogenic competence of various transgenic root lines.
Present results demonstrated that the most of TS clones were characterized by better biomass accumulation compared to NTS cultures. Even though H. perforatum transgenic shoots have been successfully multiplied on a hormone-free medium, their multiplication rate was comparable to control shoots cultured on a medium with kinetin [51]. The growth responses of transgenic plants have been related to the expression of rol genes that induce endogenous cytokinin biosynthesis or sensitivity to exogenously applied cytokinins [56]. Thus, an enhancement in biomass production through intensive axillary branching and multiplication of H. perforatum TS clones might be ascribed to the alteration of cytokinin metabolism caused by A. rhizogenes transformation.
In this study, H. perforatum TS clones were also evaluated for FW/DW ratio as a measure of cell size and water content, as well as DWY as an index for biosynthetic capability. The biomass accumulation of transgenic shoots was positively related to the FW/DW ratio implying their high capability for water uptake from the medium. In accordance with our data, biomass accumulation of H. perforatum HR-regenerated plants has been correlated with tissue hyperhydricity [29]. Additionally, tissue hydration of H. maculatum and H. hirsutum shoot cultures has been related to the presence of cytokinins in the medium [57]. Therefore, the growth-associated hydration of H. perforatum TS clones observed here could be attributed to the usage of cytokinin BA for shoot multiplication. Despite the great variation in DWY between TS clones and control cultures, the enhanced DWY values in some TS lines suggested that the transformation process might activate certain stress responses that lead to the activation of secondary metabolite pathways.
The H. perforatum TS clones evaluated here resembled normal phenotype similar to non-transgenic shoots as evidenced by the determination of the index of compactness. Accordingly, H. perforatum transgenic plants transformed with A. rhizogenes A4M70GUS did not show phenotypic variations compared to non-transformed plants [51]. On the other hand, H. perforatum transgenic shoots transformed with A. rhizogenes ATCC 15834 exhibited typical “HR phenotype” characterized by dwarfism, shorter internodes, increased branching, reduced apical dominance, as well as small and wrinkled leaves [50]. Such an alteration of the phenotype in HR-regenerated plants has been attributed to the sites and copy numbers of rol genes integrated into the host cells [58]. The weak expression of transgenic phenotype in H. perforatum plants has been related to the high copy numbers of integrated rol genes resulting in post-transcriptional silencing of transgenes [32]. The appearance of normal phenotype in transgenic plants has already been reported for many plant species, but it could not be solely related to the rol gene integration [53,59]. In this context, transgenic plants with HR phenotype might produce normal axillary shoots after prolonged time of in vitro propagation [59]. In favor of this hypothesis, rol gene expression induced temporary phytohormonal imbalance in transgenic plants that alter growth behavior, but further subculturing on medium with cytokinins reversed the normal plant phenotype [60,61]. Since TS clones in this study were subcultured on BA-containing medium, the wild-type shoot morphology was probably attributed to the long-term cultivation. The phenotypic stability of H. perforatum TS clones observed here was a preferable feature, since the HR phenotype still limits the usage of A. rhizogenes for routine transformation of crop plants.
4.2. Phenylpropanoid and Naphthodianthrone Production in Transgenic Shoots
The production of phenylpropanoids (total phenolics, flavonoids, flavan-3-ols, proanthocyanidins and phenolic acids) in H. perforatum TS clones was at levels comparable to or even greater than that in control shoots. In this view, various transgenic plant species have shown significantly higher production of secondary metabolites compared to non-transformed shoots [53,55,62] or intact plants [33,54,63]. The importance of phenylpropanoids as defense compounds in H. perforatum shoots has been previously confirmed by using different strategies, such as phytohormone supplementation [64], precursor feeding [65], elicitation [34,35] and genetic transformation [24]. However, there is no available data for total phenylpropanoid/flavonoid production in H. perforatum transgenic shoots.
With respect to TS clonal variation observed here, the clones TS C, TS D and TS E with high growth rate and biomass productivity exhibited strong accumulation of phenylpropanoids. However, the TS F clone with the lowest biomass yield accumulated the highest content of phenolic compounds indicating that secondary metabolite production of TS clones could not be exclusively observed on the basis of their growth performance. These findings suggested that A. rhizogenes-mediated transformation affects phenylpropanoid production in H. perforatum TS clones through stress-induced biosynthetic capacity rather than to biomass accumulation. From our previous study, H. perforatum transgenic shoots transformed with A. rhizogenes A4M70GUS accumulated high levels of phenolics, flavonoids and flavan-3-ols depending on their growth characteristics [24]. In this view, several studies pointed out that the accumulation of secondary metabolites in transformed plants is a consequence of the endogenous elicitation by Ri T-DNA genes from A. rhizogenes [66,67]. It could be assumed that Ri T-DNA genes integrated in H. perforatum TS mimic stressful conditions and phenylpropanoid production could be related to the activation of defense responses during transformation process.
Chromatographic analyses revealed that H. perforatum transgenic shoots are better producers of hypericin, pseudohypericin and protopseudohypericin compared to control shoots. More importantly, HYP and PHYP contents in TS clones were positively related to the number of dark glands per leaf as the main sites for accumulation of hypericins. It has been shown that naphthodianthrone production strongly correlated to the number of dark glands on the leaves of transgenic shoots from H. perforatum [20,29,30,32] and H. tomentosum [33]. The modulation of naphthodianthrone production in transgenic shoots could be explained by the A. rhizogenes-mediated alteration of plant phenotype, particularly the index of compactness and number of dark glands on the leaves. These findings could be attributed by the present data for significant negative correlation of naphthodianthrone contents and the compactness of TS clones. In this context, TS B clone with the most elongated architecture (the smallest IC value) was shown as the best performing line for naphthodianthrone production, while TS I and TS M clones with the compact morphology (the highest IC value) displayed inferior capacity for hypericins biosynthesis. According to Koperdáková et al. [20], H. perforatum transgenic plants with alteration in the phenotype exhibited decrease in vigour and dark glands development leading to the reduction of hypericins accumulation. Thus, the absence of phenotypic variations in H. perforatum TS clones evaluated here represents an important advantage for establishment of efficient in vitro system for enhanced production of naphthodianthrones.
The activity of PAL enzyme was also monitored to estimate its contribution to the accumulation of phenylpropanoids in H. perforatum TS clones. It is interesting to point out that TS F was selected as exclusive clone with the strongest production of flavonoids, flavan-3-ols and condensed tannins along with markedly up-regulated PAL activity. These findings are in agreement with our previous studies where H. perforatum HR F clone was promoted as a superior line for phenolic compounds production [25,26]. Present results did not show a clear correlation between PAL activity and phenylpropanoid contents in H. perforatum transgenic shoots. Such a non-significant correlation between PAL activity and phenolic compounds accumulation has been previously reported for Salvia miltiorrhiza transgenic cultures [69]. These authors found that tyrosine aminotransferase rather than PAL is a limiting step for phenylpropanoid biosynthesis. Moreover, chalcone-flavanone isomerase has been found as an essential enzyme for the flavonoid biosynthesis in H. perforatum cells, calli and shoots elicited with jasmonic acid, salicylic acid, fungal mycelia and polysaccharides [34,35,70,71]. Thus, the accumulation of phenylpropanoids in TS clones is probably mediated by the activity of alternative enzymes involved in the phenylpropanoid/flavonoid pathways. Further research is necessary to evaluate the activity of various enzymes involved in the channeling of phenylpropanoid metabolism in H. perforatum TS clones.
The PPO enzyme plays a major role in plant cell protection against various stress factors through oxidation of phenolic compounds to semiquinones that can act as antioxidant compounds [72]. In the present study, the enhancement of PPO activity in TS clones could be related to the oxidative stress caused by interaction of Agrobacterium and H. perforatum host cells. In accordance, we have previously observed an elevation of PPO activity in solid-grown H. perforatum HR lines that were used here for regeneration of transgenic shoots [25]. Furthermore, shoot organogenic response of H. perforatum explants has been related to oxidative stress caused by culture conditions and followed by subsequent activation of PPO as antioxidant enzyme [73]. The potential role of PPO as a ROS scavenging enzyme in TS clones tested here was additionally confirmed by its negative correlation with H2O2 and O2•- contents. These findings suggested that the up-regulation of PPO activity in H. perforatum TS clones might, at least in part, represents an antioxidant response to A. rhizogenes-mediated transformation.
4.3. Antioxidant Activity and Radical Scavenging Capacity in Transgenic Shoots
The antioxidant activities of H. perforatum TS clones measured by different assays (CUPRAC, FRAP, ABTS and LPI) were similar to or even greater than those in non-transformed shoots. Such an elevation of antioxidant capacity has been observed in transgenic plants of H. perforatum [24], Artemisia carvifolia [74], and Bacopa monnieri [55]. All these studies suggested that A. rhizogenes-mediated transformation induced defense response in transgenic plants through the accumulation of phenolic compounds with antioxidant properties. The correlation analyses in this study revealed that phenolics, flavonoids, phenolic acids, and catechins are the main contributors to the non-enzymatic antioxidant activity of H. perforatum TS clones. These correlation data are not surprising since it is well established that those phenylpropanoids have structural characteristics that make them ideal antioxidants. It could be proposed that the antioxidant activity of H. perforatum transgenic shoots was attributed to the synergistic interaction of various secondary metabolites rather than to the particular group of phenolics.
Present results showed that TS clones were superior scavengers of H2O2 compared to non-transgenic shoots. In our recent study, H. perforatum HR cultures have been presented as a rich source of phenolic compounds with strong H2O2 and O2•- scavenging activity [25]. We have hypothesized that the A. rhizogenes-mediated transformation of H. perforatum was followed by oxidative burst and strong disturbance of the antioxidant system leading to the accumulation of various classes of phenylpropanoids as ROS scavengers. Even though H2O2 and O2•- scavenging activity did not show a positive correlation with phenylpropanoids, it is worth pointing out the strong contribution of flavonoids, flavan-3-ols, tannins, and phenolic acids to the OH• scavenging activity of TS clones. In this context, Božin et al. [75] reported that phenolic acids and flavonoids from Hypericum extracts are responsible for OH• scavenging capacity. These observations indicated that phenylpropanoids in H. perforatum transgenic shoots significantly contribute to the non-enzymatic antioxidant system, although other shoot-specific metabolites cannot be ruled out as efficient ROS scavengers.
4.4. Antioxidant Enzymes and Oxidative Stress Markers in Transgenic Shoots
The up-regulation of antioxidant enzymes (PX, APX, CAT, and SOD) is a well-known mechanism for ROS neutralization in plant tissues upon abiotic and biotic stress [76]. Present results showed that strong enhancement of PX activity in TS cultures coincided with suppression of H2O2 level. On the other hand, the inconsistent CAT and APX activities in TS clones might be compensated by the PX that acts concurrently to remove H2O2. These findings implied that the antioxidant protection of transgenic shoots against H2O2 production could be ascribed to PX activity rather than to CAT and APX. Curiously, we have previously shown that APX and CAT co-operatively down-regulated intracellular H2O2 levels in solid-grown H. perforatum HR clones that were used here for the regeneration of transgenic shoots [25]. Discrepancies in the H2O2 scavenging enzyme activities between H. perforatum transgenic roots and shoots might be explained by the organ-specific differences in the constitutive levels of antioxidant enzymes, as well as by variation in culture conditions. The significant positive correlation of CAT and APX activities with SOD activity in tested TS clones could be ascribed to the fact that those antioxidant enzymes share their substrates and products. The elevation of SOD activity in some TS clones (TS A and TS C) was related to a significantly declined O2•- production rate, which highlights the additional protective role of this antioxidant enzyme in ROS neutralization. In accordance with the current study, the up-regulation of antioxidant enzymes in transgenic shoots has already been reported for various plant species [77,78]. Even the actual mechanism for activation of antioxidant enzymes upon A. rhizogenes-mediated transformation is still unresolved, several studies [77,78] emphasized the influence of T-DNA rol and aux genes in the suppression of H2O2 and O2•- levels in transformed cells. It has been shown that the integration of aux and rol genes in HR cells resulted in higher biosynthesis and perception of auxins [79]. Taking into account the stimulatory effects of auxins on the enzymatic antioxidant state in root cultures [80], the high intrinsic amounts of auxins in TS clones might be responsible for enhanced antioxidant enzyme activities and subsequent declination of ROS contents. In addition, rol genes have been found as powerful suppressors of intracellular ROS levels in transformed cells due to their important role in the expression of genes for antioxidant enzymes [81,82]. However, the relationship between rol and aux gene expression with ROS production in transgenic plants needs further investigation. Though still preliminary, present data indicated that activation of the antioxidant defense system contributed to the improvement of oxidative stress tolerance of H. perforatum transgenic shoots.
The formation of MDA as a final product of lipid peroxidation was used as a biomarker for oxidative stress in H. perofratum transgenic shoots. As presently established, decrement of MDA formation in TS clones was correlated with the suppression of ROS levels (H2O2 and O2•-). Thus, the MDA down-regulation in H. perforatum TS clones was ascribed to the antioxidant enzyme efficiency in O2•- and H2O2 scavenging that resulted in a delay of lipid peroxidation. The activation of antioxidant enzymes that suppress ROS levels and lipid peroxidation is an important prerequisite for oxidative stress tolerance in transgenic plants [83,84]. Reduction of membrane lipid peroxidation has also been reported in H. perofratum cells co-cultivated with Agrobacterium [85]. These authors revealed that the oxidative burst upon plant-pathogen interaction triggered the antioxidant defense system of plant cells to achieve redox homeostasis. In contrast, we have previously reported high MDA levels in H. perforatum HR despite the up-regulation of antioxidant enzymes, which indicated that A. rhizogenes-mediated transformation triggers lipid peroxidation processes in HR cells [25]. On the other side, transgenic shoots possess non-enzymatic antioxidant compounds [24] that may additionally contribute to the suppression of oxidative stress markers at levels that are not deleterious for membrane lipids.
5. Conclusions
This is the first report on phenylpropanoid and naphthodianthrone production, as well non-enzymatic and enzymatic antioxidant status of Hypericum perforatum L. transgenic shoot clones. Transgenic shoots exhibited normal phenotypic characteristics and better growth performance compared to control shoots. Phenylpropanoid production in transgenic shoots was related to the up-regulation of the non-enzymatic antioxidant defense system as a stress response upon A. rhizogenes-mediated transformation. Moreover, transgenic shoots represented an efficient system for naphthodianthrones production, particularly pseudohypericin and protopseudohypericin. Antioxidant enzymes significantly contributed to the suppression of H2O2 and O2•- levels that consequently delayed lipid peroxidation in transgenic shoots. Further studies are necessary to reveal the biosynthetic potential of H. perforatum transgenic shoots and identification of novel compounds with desirable biological activities.
Author Contributions
Conceptualization, methodology, formal analysis, investigation, resources, data curation, visualization, writing—review and editing, O.T. and S.G.S.; validation, software, formal analysis, M.T. and I.T.; methodology, formal analysis, investigation, validation, J.P.S.; writing—original draft preparation, O.T.; supervision, S.G.S. All authors have read and agreed to the published version of the manuscript.
Funding
This research received no external funding.
Institutional Review Board Statement
Not applicable.
Informed Consent Statement
Not applicable.
Data Availability Statement
The presented data in this study are available on request from the corresponding author.
Conflicts of Interest
The authors declare no conflict of interest.
References
- Mir, M.Y.; Hamid, S.; Kamili, A.N.; Hassan, Q.P. Sneak peek of Hypericum perforatum L.: phytochemistry, phytochemical efficacy and biotechnological interventions. J. Plant Biochem. Biotechnol. 2019, 28, 357–373. [Google Scholar] [CrossRef]
- Crockett, S.L.; Poller, B.; Tabanca, N.; Pferschy-Wenzig, E.M.; Kunert, O.; Wedge, D.E.; Bucar, F. Bioactive xanthones from the roots of Hypericum perforatum (common St John’s wort). J. Sci. Food Agric. 2011, 91, 428–434. [Google Scholar] [CrossRef] [PubMed]
- Tusevski, O.; Krstikj, M.; Stanoeva, J.P.; Stefova, M.; Simic, S.G. Phenolic profile and biological activity of Hypericum perforatum L.: Can roots be considered as a new source of natural compounds? S. Afr. J. Bot. 2018, 117, 301–310. [Google Scholar] [CrossRef]
- Zobayed, S.M.A.; Afreen, F.; Goto, E.; Kozai, T. Plant–environment interactions: accumulation of hypericin in dark glands of Hypericum perforatum. Ann. Bot. 2006, 98, 793–804. [Google Scholar] [CrossRef] [PubMed]
- Theodossiou, T.A.; Olsen, C.E.; Jonsson, M.; Kubin, A.; Hothersall, J.S.; Berg, K. The diverse roles of glutathione-associated cell resistance against hypericin photodynamic therapy. Redox Biol. 2017, 12, 191–197. [Google Scholar] [CrossRef] [PubMed]
- Velingkar, V.S.; Gupta, G.L.; Hegde, N.B. A current update on phytochemistry, pharmacology and herb–drug interactions of Hypericum perforatum. Phytochem. Rev. 2017, 16, 725–744. [Google Scholar] [CrossRef]
- Tocci, N.; Simonetti, G.; D’Auria, F.D.; Panella, S.; Palamara, A.T.; Ferrari, F.; Pasqua, G. Chemical composition and antifungal activity of Hypericum perforatum subsp. angustifolium roots from wild plants and plants grown under controlled conditions. Plant Biosyst. 2013, 147, 557–562. [Google Scholar] [CrossRef]
- Rafailovska, E.; Tushevski, O.; Shijakova, K.; Simic, S.G.; Kjovkarovska, S.D.; Miova, B. Hypericum perforatum L. extract exerts insulinotropic effects and inhibits gluconeogenesis in diabetic rats by regulating AMPK expression and PKCε concentration. J. Ethnopharmacol. 2023, 302, 115899. [Google Scholar] [CrossRef]
- Murch, S.J.; Saxena, P.K. St. John’s wort (Hypericum perforatum L.): challenges and strategies for production of chemically-consistent plants. Can. J. Plant Sci. 2006, 86, 765–771. [Google Scholar] [CrossRef]
- Carrubba, A.; Lazzara, S.; Giovino, A.; Ruberto, G.; Napoli, E. Content variability of bioactive secondary metabolites in Hypericum perforatum L. Phytochem. Lett. 2021, 46, 71–78. [Google Scholar] [CrossRef]
- Murthy, H.N.; Kim, Y.S.; Park, S.Y.; Paek, K.Y. Hypericins: biotechnological production from cell and organ cultures. Appl. Microbiol. Biotechnol. 2014, 98, 9187–9198. [Google Scholar] [CrossRef] [PubMed]
- Coste, A.; Pop, C.; Halmagyi, A.; Butiuc-Keul, A. Secondary Metabolites in Shoot Cultures of Hypericum. In Plant Cell and Tissue Differentiation and Secondary Metabolites; Reference Series in, Phytochemistry, Ramawat, K., Ekiert, H., Goyal, S., Eds.; Springer Nature: Geneva, Switzerland, 2021; pp. 273–308. [Google Scholar]
- Kowalczyk, T.; Wieczfinska, J.; Skała, E.; Śliwiński, T.; Sitarek, P. Transgenesis as a tool for the efficient production of selected secondary metabolites from plant in vitro cultures. Plants 2020, 9, 132. [Google Scholar] [CrossRef] [PubMed]
- Hou, W.; Shakya, P.; Franklin, G. A perspective on Hypericum perforatum genetic transformation. Front. Plant Sci. 2016, 7, 879. [Google Scholar] [CrossRef] [PubMed]
- Shakya, P.; Marslin, G.; Siram, K.; Beerhues, L.; Franklin, G. Elicitation as a tool to improve the profiles of high-value secondary metabolites and pharmacological properties of Hypericum perforatum. J. Pharm. Pharmacol. 2019, 71, 70–82. [Google Scholar] [CrossRef] [PubMed]
- Franklin, G.; Oliveira, M.; Dias, A.C.P. Production of transgenic Hypericum perforatum plants via particle bombardment-mediated transformation of novel organogenic cell suspension cultures. Plant Sci. 2007, 172, 1193–1203. [Google Scholar] [CrossRef]
- Franklin, G.; Conceição, L.F.; Kombrink, E.; Dias, A.C.P. Hypericum perforatum plant cells reduce Agrobacterium viability during co-cultivation. Planta 2008, 227, 1401–1408. [Google Scholar] [CrossRef] [PubMed]
- Morey, K.J.; Peebles, C.A. Hairy roots: An untapped potential for production of plant products. Front. Plant Sci. 2022, 13, 937095. [Google Scholar] [CrossRef] [PubMed]
- Vinterhalter, B.; Zdravković-Korać, S.; Mitić, N.; Bohanec, B.; Vinterhalter, D.; Savić, J. Effect of sucrose on shoot regeneration in Agrobacterium transformed Hypericum perforatum L. roots. Acta Physiol. Plant. 2015, 37, 1–12. [Google Scholar] [CrossRef]
- Koperdáková, J.; Komarovská, H.; Košuth, J.; Giovannini, A.; Čellárová, E. Characterization of hairy root-phenotype in transgenic Hypericum perforatum L. clones. Acta Physiol. Plant. 2009, 31, 351–358. [Google Scholar] [CrossRef]
- Tusevski, O.; Stanoeva, J.P.; Stefova, M.; Kungulovski, D.; Pancevska, N.A.; Sekulovski, N.; Panov, S.; Simic, S.G. Hairy roots of Hypericum perforatum L.: a promising system for xanthone production. Cent. Eur. J. Biol. 2013, 8, 1010–1022. [Google Scholar] [CrossRef]
- Komarovská, H.; Giovannini, A.; Košuth, J.; Čellárová, E. Agrobacterium rhizogenes-mediated transformation of Hypericum tomentosum L. and Hypericum tetrapterum Fries. Z. Naturforsch. C 2009, 64, 864–868. [Google Scholar] [CrossRef]
- Khlifa, H.D.; Klimek-Chodacka, M.; Baranski, R.; Combik, M.; Taha, H.S. Agrobacterium rhizogenes-mediated transformation of Hypericum sinaicum L. for the development of hairy roots containing hypericin. Braz. J. Pharm. Sci. 2020, 56. [Google Scholar] [CrossRef]
- Tusevski, O.; Vinterhalter, B.; Krstić Milošević, D.; Soković, M.; Ćirić, A.; Vinterhalter, D.; Zdravković Korać, S.; Petreska Stanoeva, J.; Stefova, M.; Gadzovska Simic, S. Production of phenolic compounds, antioxidant and antimicrobial activities in hairy root and shoot cultures of Hypericum perforatum L. Plant Cell Tissue Organ Cult. 2017, 128, 589–605. [Google Scholar] [CrossRef]
- Tusevski, O.; Petreska Stanoeva, J.; Stefova, M.; Spasenoski, M.; Gadzovska Simic, S. State of antioxidant systems and phenolic compounds’ production in Hypericum perforatum L. hairy roots. Acta Physiol. Plant. 2019, 41, 1–15. [Google Scholar] [CrossRef]
- Tusevski, O.; Gadzovska Simic, S. Non-Enzymatic and Enzymatic Antioxidant Responses of Hypericum perforatum L. Hairy Roots upon Photooxidative Stress. Horticulturae 2023, 9, 581. [Google Scholar] [CrossRef]
- Tusevski, O.; Petreska Stanoeva, J.; Stefova, M.; Simic, S.G. Phenolic profile of dark-grown and photoperiod-exposed Hypericum perforatum L. hairy root cultures. Sci. World J. 2013, 2013, 1–9. [Google Scholar] [CrossRef] [PubMed]
- Tusevski, O.; Todorovska, M.; Stanoeva, J.P.; Stefova, M.; Simic, S.G. In Vitro and in Silico Insights on the Biological Activities, Phenolic Compounds Composition of Hypericum perforatum L. Hairy Root Cultures. Phyton-Int. J. Exp. Bot. 2023, 92, 921–941. [Google Scholar] [CrossRef]
- Bertoli, A.; Giovannini, A.; Ruffoni, B.; Guardo, A.D.; Spinelli, G.; Mazzetti, M.; Pistelli, L. Bioactive constituent production in St. John’s wort in vitro hairy roots. Regenerated plant lines. J. Agric. Food Chem. 2008, 56, 5078–5082. [Google Scholar] [CrossRef] [PubMed]
- Tusevski, O.; Petreska Stanoeva, J.; Stefova, M.; Pavokovic, D.; Gadzovska Simic, S. Identification and quantification of phenolic compounds in Hypericum perforatum L. transgenic shoots. Acta Physiol. Plant. 2014, 36, 2555–2569. [Google Scholar] [CrossRef]
- Christey, M.C. Use of Ri-mediated transformation for production of transgenic plants. In Vitro Cell. Dev. Biol. - Plant 2001, 37, 687–700. [Google Scholar] [CrossRef]
- Komarovska, H.; Košuth, J.; Giovannini, A.; Smelcerovic, A.; Zuehlke, S.; Čellárová, E. Effect of the number of rol genes integrations on phenotypic variation in hairy root-derived Hypericum perforatum L. plants. Z. Naturforsc. C 2010, 65, 701–712. [Google Scholar] [CrossRef]
- Henzelyová, J.; Čellárová, E. Modulation of naphthodianthrone biosynthesis in hairy root-derived Hypericum tomentosum regenerants. Acta Physiol. Plant. 2018, 40, 1–12. [Google Scholar] [CrossRef]
- Gadzovska Simic, S.; Tusevski, O.; Maury, S.; Hano, C.; Delaunay, A.; Chabbert, B.; Lamblin, F.; Lainé, E.; Joseph, C.; Hagège, D. Fungal elicitor-mediated enhancement in phenylpropanoid and naphtodianthrone contents of Hypericum perforatum L. cell cultures. Plant Cell, Tiss. Organ Cult. 2015, 122, 213–226. [Google Scholar] [CrossRef]
- Gadzovska Simic, S.; Tusevski, O.; Maury, S.; Delaunay, A.; Lainé, E.; Joseph, C.; Hagège, D. Polysaccharide elicitors enhance phenylpropanoid and naphtodianthrone production in cell suspension cultures of Hypericum perforatum. Plant Cell, Tiss. Organ Cult., 2015, 122, 649–663. [Google Scholar] [CrossRef]
- Tusevski, O.; Stanoeva, J.P.; Markoska, E.; Brndevska, N.; Stefova, M.; Gadzovska Simic, S. Callus cultures of Hypericum perforatum L. a novel and efficient source for xanthone production. Plant Cell Tiss. Org. Cult. 2016, 125, 309–319. [Google Scholar] [CrossRef]
- Bradford, M.M. A rapid and sensitive method for the quantitation of microgram quantities of protein utilizing the principle of protein-dye binding. Anal. Biochem. 1976, 72, 248–254. [Google Scholar] [CrossRef] [PubMed]
- Benzie, I.F.; Strain, J.J. The ferric reducing ability of plasma (FRAP) as a measure of “antioxidant power”: the FRAP assay. Anal. Biochem. 1996, 239, 70–76. [Google Scholar] [CrossRef] [PubMed]
- Re, R.; Pellegrini, N.; Proteggente, A.; Pannala, A.; Yang, M.; Rice-Evans, C. Antioxidant activity applying an improved ABTS radical cation decolorization assay. Free Radic. Biol. Med. 1999, 26, 1231–1237. [Google Scholar] [CrossRef] [PubMed]
- Halliwell, B.; Gutteridge, J.M.; Aruoma, O.I. The deoxyribose method: a simple “test-tube” assay for determination of rate constants for reactions of hydroxyl radicals. Anal. Biochem. 1987, 165, 215–219. [Google Scholar] [CrossRef] [PubMed]
- Hemeda, H.M.; Klein, B.P. Effects of naturally occurring antioxidants on peroxidase activity of vegetable extracts. J. Food Sci. 1990, 55, 184–185. [Google Scholar] [CrossRef]
- Nakano, Y.; Asada, K. Hydrogen peroxide is scavenged by ascorbate-specific peroxidase in spinach chloroplasts. Plant Cell Physiol. 1981, 22, 867–880. [Google Scholar] [CrossRef]
- Aebi, H. [13] Catalase in vitro. In Methods in Enzymology; Academic Press: Cambridge, MA, USA, 1984; Volume 105, pp. 121–126. [Google Scholar] [CrossRef]
- Beauchamp, C.; Fridovich, I. Superoxide dismutase: improved assays and an assay applicable to acrylamide gels. Anal. Biochem. 1971, 44, 276–287. [Google Scholar] [CrossRef] [PubMed]
- Sergiev, I.; Alexieva, V.; Karanov, E. Effect of spermine, atrazine and combination between them on some endogenous protective systems and stress markers in plants. Comptes Rendus de l ’Academie Bulg. des Sci. 1997, 51, 121–124. [Google Scholar] [CrossRef]
- Elstner, E.F.; Heupel, A. Inhibition of nitrite formation from hydroxylammoniumchloride: a simple assay for superoxide dismutase. Anal. Biochem. 1976, 70, 616–620. [Google Scholar] [CrossRef]
- Heath, R.L.; Packer, L. Photoperoxidation in isolated chloroplasts: I. Kinetics and stoichiometry of fatty acid peroxidation. Arch. Biochem. Biophys. 1968, 125, 189–198. [Google Scholar] [CrossRef]
- Franklin, G.; Dias, A.C.P. Organogenesis and embryogenesis in several Hypericum perforatum genotypes. In Vitro Cell. Dev. Biol. Plant 2006, 42, 324–330. [Google Scholar] [CrossRef]
- Goel, M.K.; Kukreja, A.K.; Bisht, N.S. In vitro manipulations in St. John’s wort (Hypericum perforatum L.) for incessant and scale up micropropagation using adventitious roots in liquid medium and assessment of clonal fidelity using RAPD analysis. Plant Cell Tiss. Org. Cult. 2009, 96, 1–9. [Google Scholar] [CrossRef]
- Di Guardo, A.; Cellarova, E.; Koperdáková, J.; Pistelli, L.; Ruffoni, B.; Allavena, A.; Giovannini, A. Hairy root induction and plant regeneration in Hypericum perforatum L. J. Genet. Breed. 2003, 57, 269–278. [Google Scholar]
- Vinterhalter, B.; Ninković, S.; Cingel, A.; Vinterhalter, D. Shoot and root culture of Hypericum perforatum L. transformed with Agrobacterium rhizogenes A4M70GUS. Biol. Plant. 2006, 50, 767–770. [Google Scholar] [CrossRef]
- Damgaard, O.; Rasmussen, O. Direct regeneration of transformed shoots in Brassica napus from hypocotyl infections with Agrobacterium rhizogenes. Plant Mol. Biol. 1991, 17, 1–8. [Google Scholar] [CrossRef] [PubMed]
- Mehrotra, S.; Goel, M.K.; Rahman, L.U.; Kukreja, A.K. Molecular and chemical characterization of plants regenerated from Ri-mediated hairy root cultures of Rauwolfia serpentina. Plant Cell Tiss. Org. Cult. 2013, 114, 31–38. [Google Scholar] [CrossRef]
- Piątczak, E.; Kuźma, Ł.; Skała, E.; Żebrowska, M.; Balcerczak, E.; Wysokińska, H. Iridoid and phenylethanoid glycoside production and phenotypical changes in plants regenerated from hairy roots of Rehmannia glutinosa Libosch. Plant Cell Tiss. Org. Cult. 2015, 122, 259–266. [Google Scholar] [CrossRef]
- Largia, M.J.V.; Satish, L.; Johnsi, R.; Shilpha, J.; Ramesh, M. Analysis of propagation of Bacopa monnieri (L.) from hairy roots, elicitation and Bacoside A contents of Ri transformed plants. World J. Microbiol. Biotechnol. 2016, 32, 1–11. [Google Scholar] [CrossRef] [PubMed]
- Casanova, E.; Trillas, M.I.; Moysset, L.; Vainstein, A. Influence of rol genes in floriculture. Biotechnol. Adv. 2005, 23, 3–39. [Google Scholar] [CrossRef] [PubMed]
- Coste, A.; Vlase, L.; Halmagyi, A.; Deliu, C.; Coldea, G. Effects of plant growth regulators and elicitors on production of secondary metabolites in shoot cultures of Hypericum hirsutum and Hypericum maculatum. Plant Cell Tiss. Org. Cult. 2011, 106, 279–288. [Google Scholar] [CrossRef]
- Tang, W.; Newton, R.J.; Weidner, D.A. Genetic transformation and gene silencing mediated by multiple copies of a transgene in eastern white pine. J. Exp. Bot. 2007, 58, 545–554. [Google Scholar] [CrossRef] [PubMed]
- Sinkar, V.P.; Pythoud, F.; White, F.F.; Nester, E.W.; Gordon, M.P. rolA locus of the Ri plasmid directs developmental abnormalities in transgenic tobacco plants. Genes Dev. 2, 1101. [Google Scholar]
- Bettini, P.; Baraldi, R.; Rapparini, F.; Melani, L.; Mauro, M. L.; Bindi, D.; Buiatti, M. The insertion of the Agrobacterium rhizogenes rolC gene in tomato (Solanum lycopersicum L.) affects plant architecture and endogenous auxin and abscisic acid levels. Sci Hortic. 2010, 123, 323–328. [Google Scholar] [CrossRef]
- Martin, K.P.; Sabovljevic, A.; Madassery, J. High-frequency transgenic plant regeneration and plumbagin production through methyl jasmonate elicitation from hairy roots of Plumbago indica L. J. Crop Sci. Biotechnol. 2011, 14, 205–212. [Google Scholar] [CrossRef]
- Gangopadhyay, M.; Chakraborty, D.; Bhattacharyya, S.; Bhattacharya, S. Regeneration of transformed plants from hairy roots of Plumbago indica. Plant Cell Tiss. Org. Cult. 2010, 102, 109–114. [Google Scholar] [CrossRef]
- Behera, P.R.; Jena, R.C.; Das, A.; Thirunavoukkarasu, M.; Chand, P.K. Genetic stability and coumarin content of transformed rhizoclones and regenerated plants of a multi-medicinal herb, Hybanthus enneaspermus (L.) F. Muell. Plant Growth Regul. 2016, 80, 103–114. [Google Scholar] [CrossRef]
- Gadzovska, S.; Maury, S.; Ounnar, S.; Righezza, M.; Kascakova, S.; Refregiers, M.; Spasenoski, M.; Joseph, C.; Hagège, D. Identification and quantification of hypericin and pseudohypericin in different Hypericum perforatum L. in vitro cultures. Plant Physiol. Biochem. 2005, 43, 591–601. [Google Scholar] [CrossRef] [PubMed]
- Liu, X.N.; Zhang, X.Q.; Sun, J.S. Effects of cytokinins and elicitors on the production of hypericins and hyperforin metabolites in Hypericum sampsonii and Hypericum perforatum. Plant Growth Regul. 2007, 53, 207–214. [Google Scholar] [CrossRef]
- Bulgakov, V.P. Functions of rol genes in plant secondary metabolism. Biotechnol. Adv. 2008, 26, 318–324. [Google Scholar] [CrossRef] [PubMed]
- Majumdar, S.; Garai, S.; Jha, S. Genetic transformation of Bacopa monnieri by wild type strains of Agrobacterium rhizogenes stimulates production of bacopa saponins in transformed calli and plants. Plant Cell Rep. 2011, 30, 941–954. [Google Scholar] [CrossRef] [PubMed]
- Dixon, R.A.; Achnine, L.; Kota, P.; Liu, C.J.; Reddy, M.S.; Wang, L. The phenylpropanoid pathway and plant defence-a genomics perspective. Mol. Plant Pathol. 2002, 3, 371–390. [Google Scholar] [CrossRef]
- Yan, Q.; Shi, M.; Ng, J.; Wu, J.Y. Elicitor-induced rosmarinic acid accumulation and secondary metabolism enzyme activities in Salvia miltiorrhiza hairy roots. Plant Sci. 2006, 170, 853–858. [Google Scholar] [CrossRef]
- Gadzovska, S.; Maury, S.; Delaunay, A.; Spasenoski, M.; Joseph, C.; Hagege, D. Jasmonic acid elicitation of Hypericum perforatum L. cell suspensions and effects on the production of phenylpropanoids and naphtodianthrones. Plant Cell Tiss Org Cult. 2007, 89, 1–13. [Google Scholar] [CrossRef]
- Gadzovska, S.; Maury, S.; Delaunay, A.; Spasenoski, M.; Hagège, D.; Courtois, D.; Joseph, C. The influence of salicylic acid elicitation of shoots, callus, and cell suspension cultures on production of naphtodianthrones and phenylpropanoids in Hypericum perforatum L. Plant Cell Tissue Organ Cult. 2013, 113, 25–39. [Google Scholar] [CrossRef]
- Pourcel, L.; Routaboul, J.M.; Cheynier, V.; Lepiniec, L.; Debeaujon, I. Flavonoid oxidation in plants: from biochemical properties to physiological functions. Trends Plant Sci. 2007, 12, 29–36. [Google Scholar] [CrossRef]
- Savio, L.E.B.; Astarita, L.V.; Santarém, E.R. Secondary metabolism in micropropagated Hypericum perforatum L. grown in non-aerated liquid medium. Plant Cell Tiss. Org. Cult. 2012, 108, 465–472. [Google Scholar] [CrossRef]
- Dilshad, E.; Ismail, H.; Haq, I.U.; Cusido, R.M.; Palazon, J.; Ramirez-Estrada, K.; Mirza, B. Rol genes enhance the biosynthesis of antioxidants in Artemisia carvifolia Buch. BMC Plant Biol. 2016, 16, 1–9. [Google Scholar] [CrossRef] [PubMed]
- Božin, B.; Kladar, N.; Grujić, N.; Anačkov, G.; Samojlik, I.; Gavarić, N.; Čonić, B.S. Impact of origin and biological source on chemical composition, anticholinesterase and antioxidant properties of some St. John’s wort species (Hypericum spp., Hypericaceae) from the Central Balkans. Molecules 2013, 18, 11733–11750. [Google Scholar] [CrossRef]
- Gill, S.S.; Tuteja, N. Reactive oxygen species and antioxidant machinery in abiotic stress tolerance in crop plants. Plant Physiol. Biochem. 2010, 48, 909–930. [Google Scholar] [CrossRef] [PubMed]
- Cornea, C.P.; Dragos, S.; Rosu, A.; Guidea, S.; Israel, F. Peroxidase production in armoracia sp. transformed hairy roots. ROM. BIOTECHNOL. LETT. 2006, 11, 2619. [Google Scholar]
- Nikravesh, F.; Khavari-Nejad, R.A.; Rahimian, H.; Fahimi, H. Study of antioxidant enzymes activity and isozymes pattern in hairy roots and regenerated plants in Nicotiana tabacum. Acta Physiol. Plant. 2012, 34, 419–427. [Google Scholar] [CrossRef]
- Veena, V.; Taylor, C.G. Agrobacterium rhizogenes: recent developments and promising applications. In Vitro Cell. Dev. Biol. Plant 2007, 43, 383–403. [Google Scholar] [CrossRef]
- Tyburski, J.; Dunajska, K.; Mazurek, P.; Piotrowska, B.; Tretyn, A. Exogenous auxin regulates H2O2 metabolism in roots of tomato (Lycopersicon esculentum Mill.) seedlings affecting the expression and activity of CuZn-superoxide dismutase, catalase, and peroxidase. Acta Physiol. Plant. 2009, 31, 249–260. [Google Scholar] [CrossRef]
- Shkryl, Y.N.; Veremeichik, G.N.; Bulgakov, V.P.; Gorpenchenko, T.Y.; Aminin, D.L.; Zhuravlev, Y.N. Decreased ROS level and activation of antioxidant gene expression in Agrobacterium rhizogenes pRiA4-transformed calli of Rubia cordifolia. Planta 2010, 232, 1023–1032. [Google Scholar] [CrossRef]
- Bulgakov, V.P.; Gorpenchenko, T.Y.; Veremeichik, G.N.; Shkryl, Y.N.; Tchernoded, G.K.; Bulgakov, D.V.; Aminin, D.L.; Zhuravlev, Y.N. The rolB gene suppresses reactive oxygen species in transformed plant cells through the sustained activation of antioxidant defense. Plant Physiol. 2012, 158, 1371–1381. [Google Scholar] [CrossRef] [PubMed]
- Wang, Y.C.; Qu, G.Z.; Li, H.Y.; Wu, Y.J.; Wang, C.; Liu, G.F.; Yang, C.P. Enhanced salt tolerance of transgenic poplar plants expressing a manganese superoxide dismutase from Tamarix androssowii. Mol. Biol. Rep. 2010, 37, 1119–1124. [Google Scholar] [CrossRef] [PubMed]
- Sato, Y.; Masuta, Y.; Saito, K.; Murayama, S.; Ozawa, K. Enhanced chilling tolerance at the booting stage in rice by transgenic overexpression of the ascorbate peroxidase gene, OsAPXa. Plant Cell Rep. 2011, 30, 399–406. [Google Scholar] [CrossRef] [PubMed]
- Franklin, G.; Conceição, L.F.; Kombrink, E.; Dias, A.C. Xanthone biosynthesis in Hypericum perforatum cells provides antioxidant and antimicrobial protection upon biotic stress. Phytochemistry 2009, 70, 60–68. [Google Scholar] [CrossRef] [PubMed]
Figure 1.
Hypericum perforatum transgenic shoots (TS) regenerated from hairy roots (HR) on a hormone-free medium (A). Multiplication of TS on MS/B5 medium supplemented with 0.2 mg·L-1 N6-benzyladenine (B).
Figure 1.
Hypericum perforatum transgenic shoots (TS) regenerated from hairy roots (HR) on a hormone-free medium (A). Multiplication of TS on MS/B5 medium supplemented with 0.2 mg·L-1 N6-benzyladenine (B).
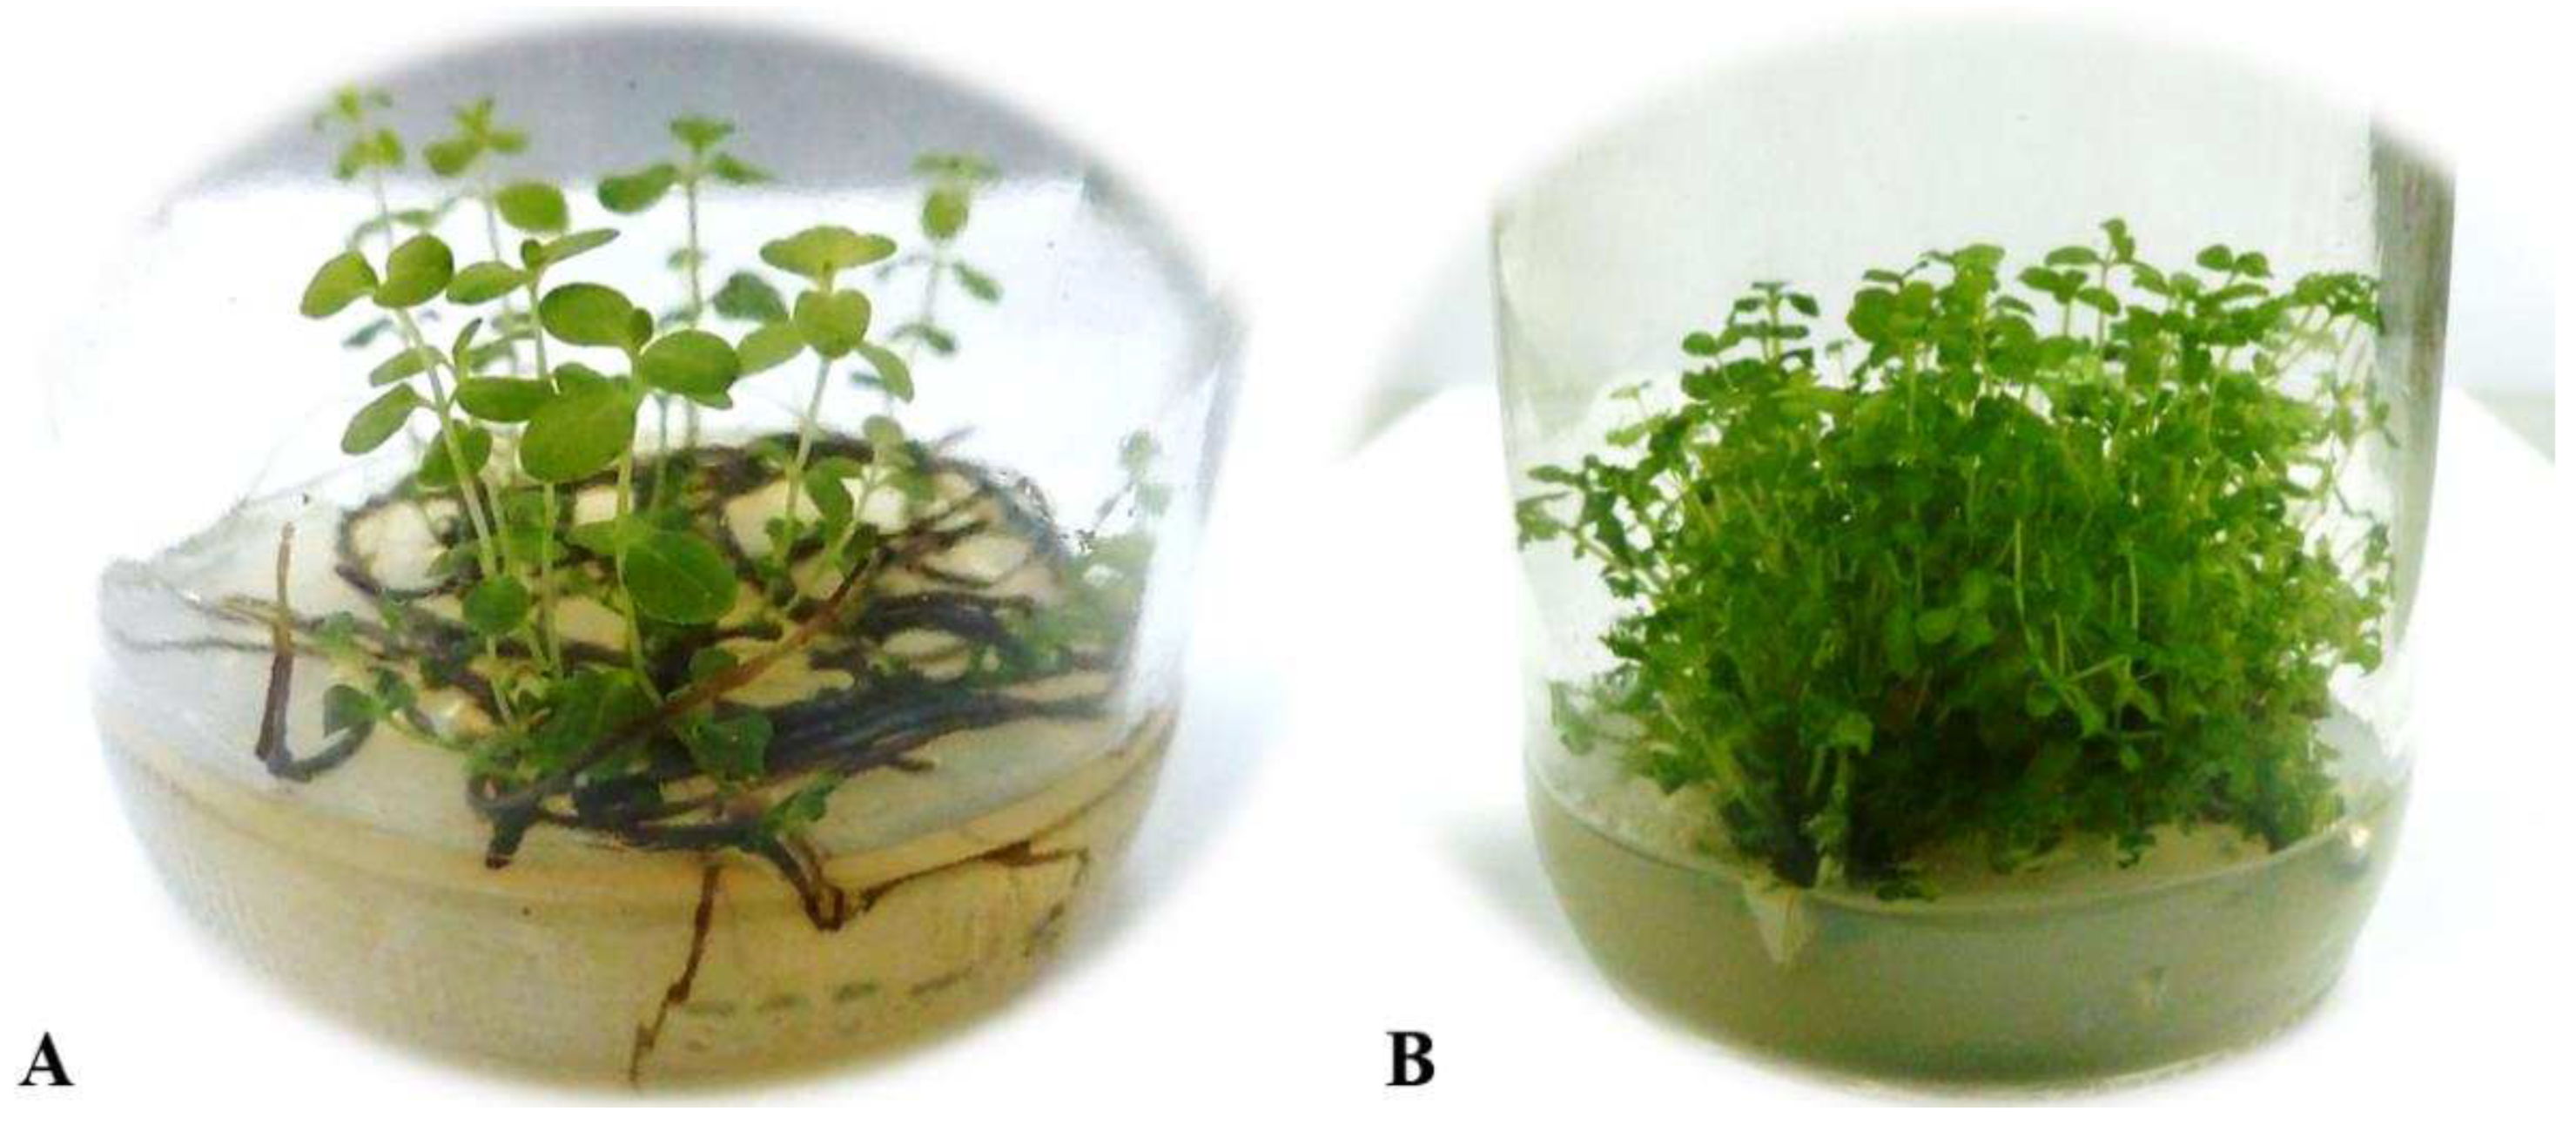
Figure 2.
Chromatograms of Hypericum perforatum control (A) and transgenic shoots (B) monitored at 590 nm for detection of naphthodianthrones. HYP: hypericin; PHYP: pseudohypericin; PPHYP: protopseudohypericin.
Figure 2.
Chromatograms of Hypericum perforatum control (A) and transgenic shoots (B) monitored at 590 nm for detection of naphthodianthrones. HYP: hypericin; PHYP: pseudohypericin; PPHYP: protopseudohypericin.
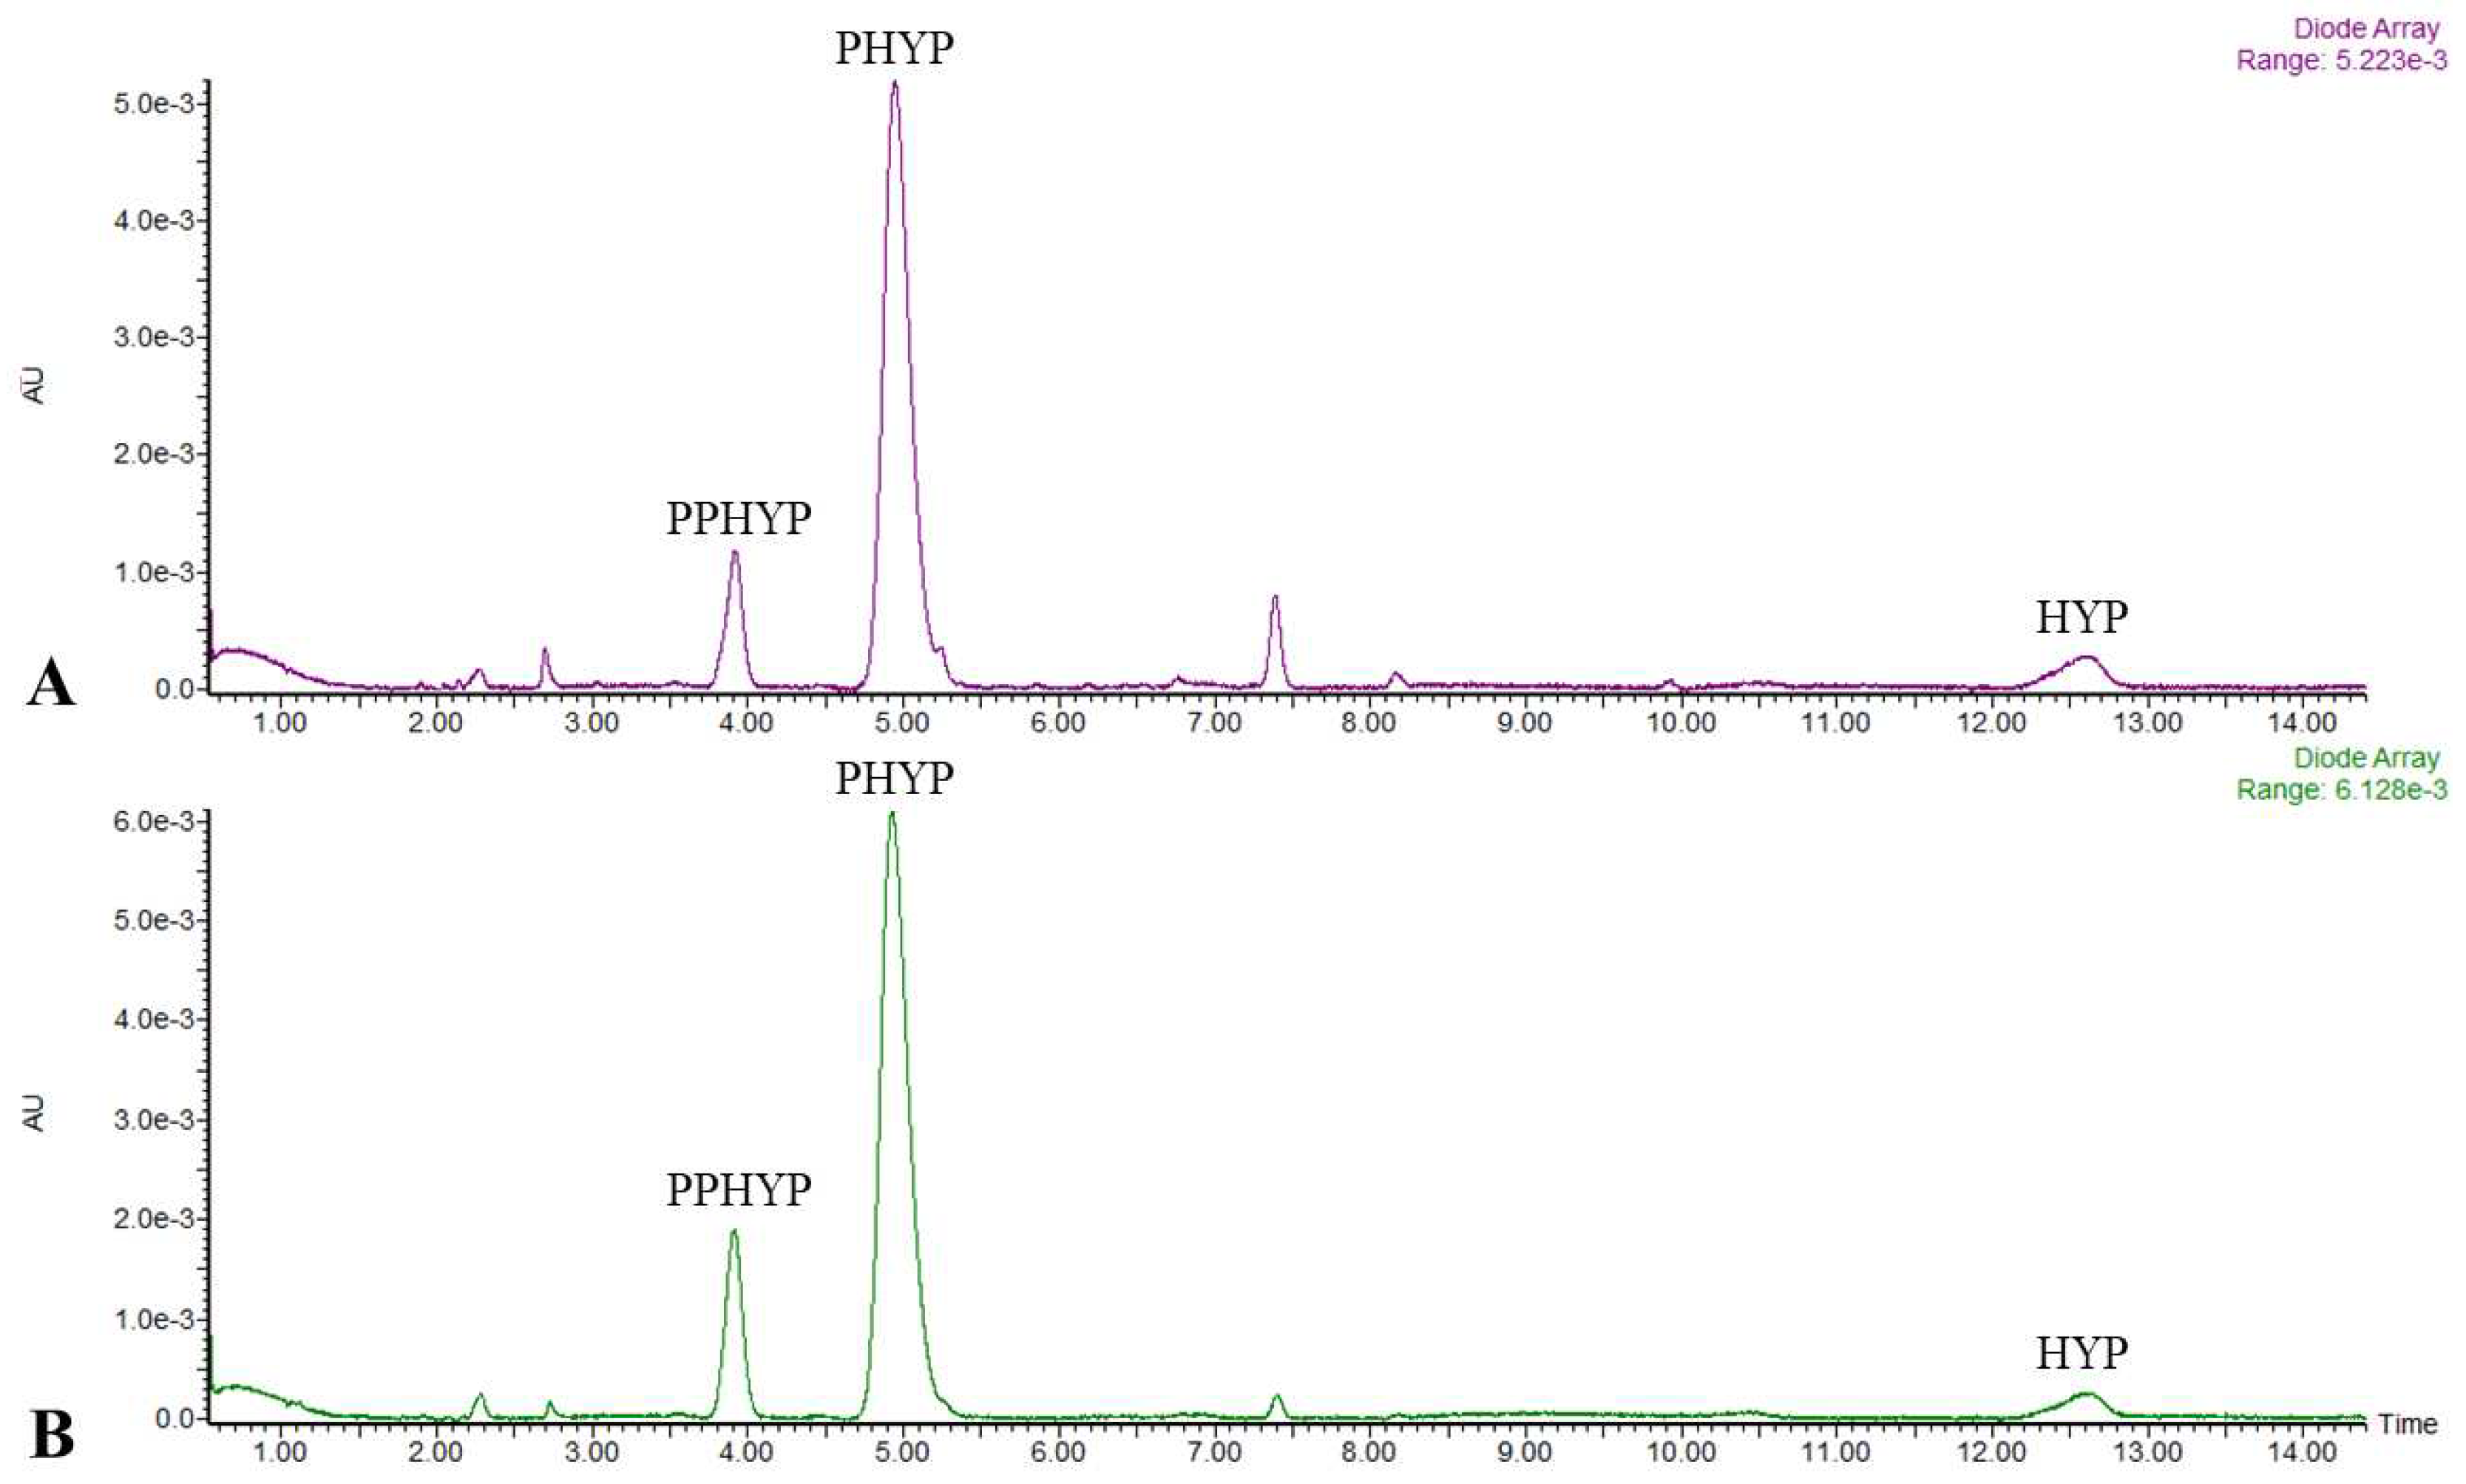
Figure 3.
Loadings plot (A) and scores plot (B) of principal component analysis and hierarchical agglomerative clustering (C) for growth and morphological characteristics, phenylpropanoid and naphthodianthrone production, as well antioxidant status of Hypericum perforatum transgenic shoots. Note: PC: principal components; NTS: control shoots; TS A-TS O: transgenic shoot clones; TP: total phenolics; TF: total flavonoids; TFA: total flavan-3-ols; TCT: total condensed tannins; TPA: total phenolic acids; CUPRAC: cupric reducing antioxidant capacity; FRAP: ferric ion reducing antioxidant power, ABTS: ABTS radical scavenging activity; LPI: lipid peroxidation inhibition; H2O2 SA: hydrogen peroxide scavenging activity, O2•− SA: superoxide anion scavenging activity, OH• SA: hydroxyl radical scavenging activity; PAL: phenylalanine ammonia lyase; PPO: polyphenol oxidase; PX: guaiacol peroxidase; APX: ascorbate peroxidase; CAT: catalase; SOD: superoxide dismutase; H2O2: hydrogen peroxide; O2•-: superoxide anion; MDA: malondialdehyde; RF: regeneration frequency; FW: fresh weight, DW: dry weight, FW/DW: fresh weight/dry weight ratio; DWY: dry weight yield; IC: index of compactness; NDG: number of dark glands, HYP: hypericin; PHYP: pseudohypericin; PPHYP: protopseudohypericin.
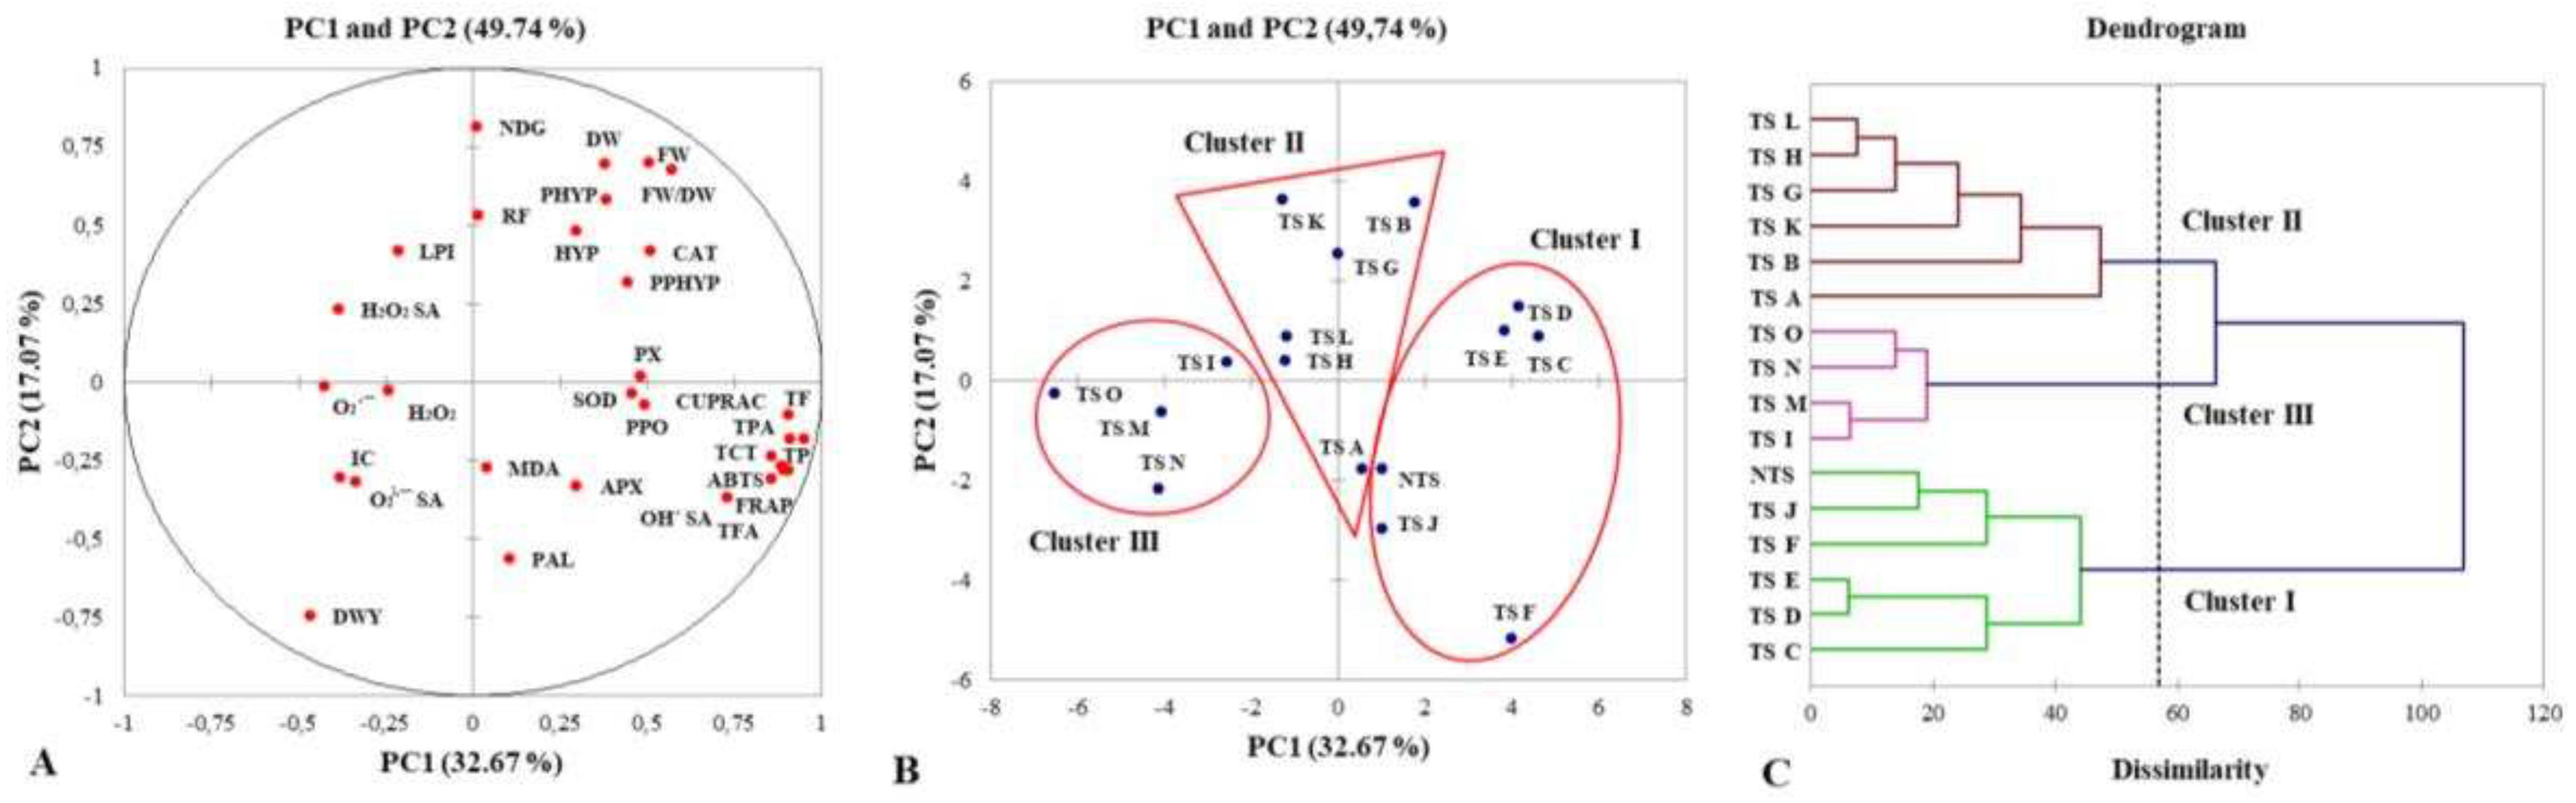
Figure 4.
Correlation matrix between growth and morphological characteristics, phenylpropanoid and naphthodianthrone production, as well antioxidant status of Hypericum perforatum transgenic shoots. Blue colors indicated positive correlation, while red colors showed negative correlation. Note: TP: total phenolics; TF: total flavonoids; TFA: total flavan-3-ols; TCT: total condensed tannins; TPA: total phenolic acids; CUPRAC: cupric reducing antioxidant capacity; FRAP: ferric ion reducing antioxidant power, ABTS: ABTS radical scavenging activity; LPI: lipid peroxidation inhibition; H2O2 SA: hydrogen peroxide scavenging activity, O2•− SA: superoxide anion scavenging activity, OH• SA: hydroxyl radical scavenging activity; PAL: phenylalanine ammonia lyase; PPO: polyphenol oxidase; PX: guaiacol peroxidase; APX: ascorbate peroxidase; CAT: catalase; SOD: superoxide dismutase; H2O2: hydrogen peroxide; O2•-: superoxide anion; MDA: malondialdehyde; RF: regeneration frequency; FW: fresh weight, DW: dry weight, FW/DW: fresh weight/dry weight ratio; DWY: dry weight yield; IC: index of compactness; NDG: number of dark glands, HYP: hypericin; PHYP: pseudohypericin; PPHYP: protopseudohypericin.
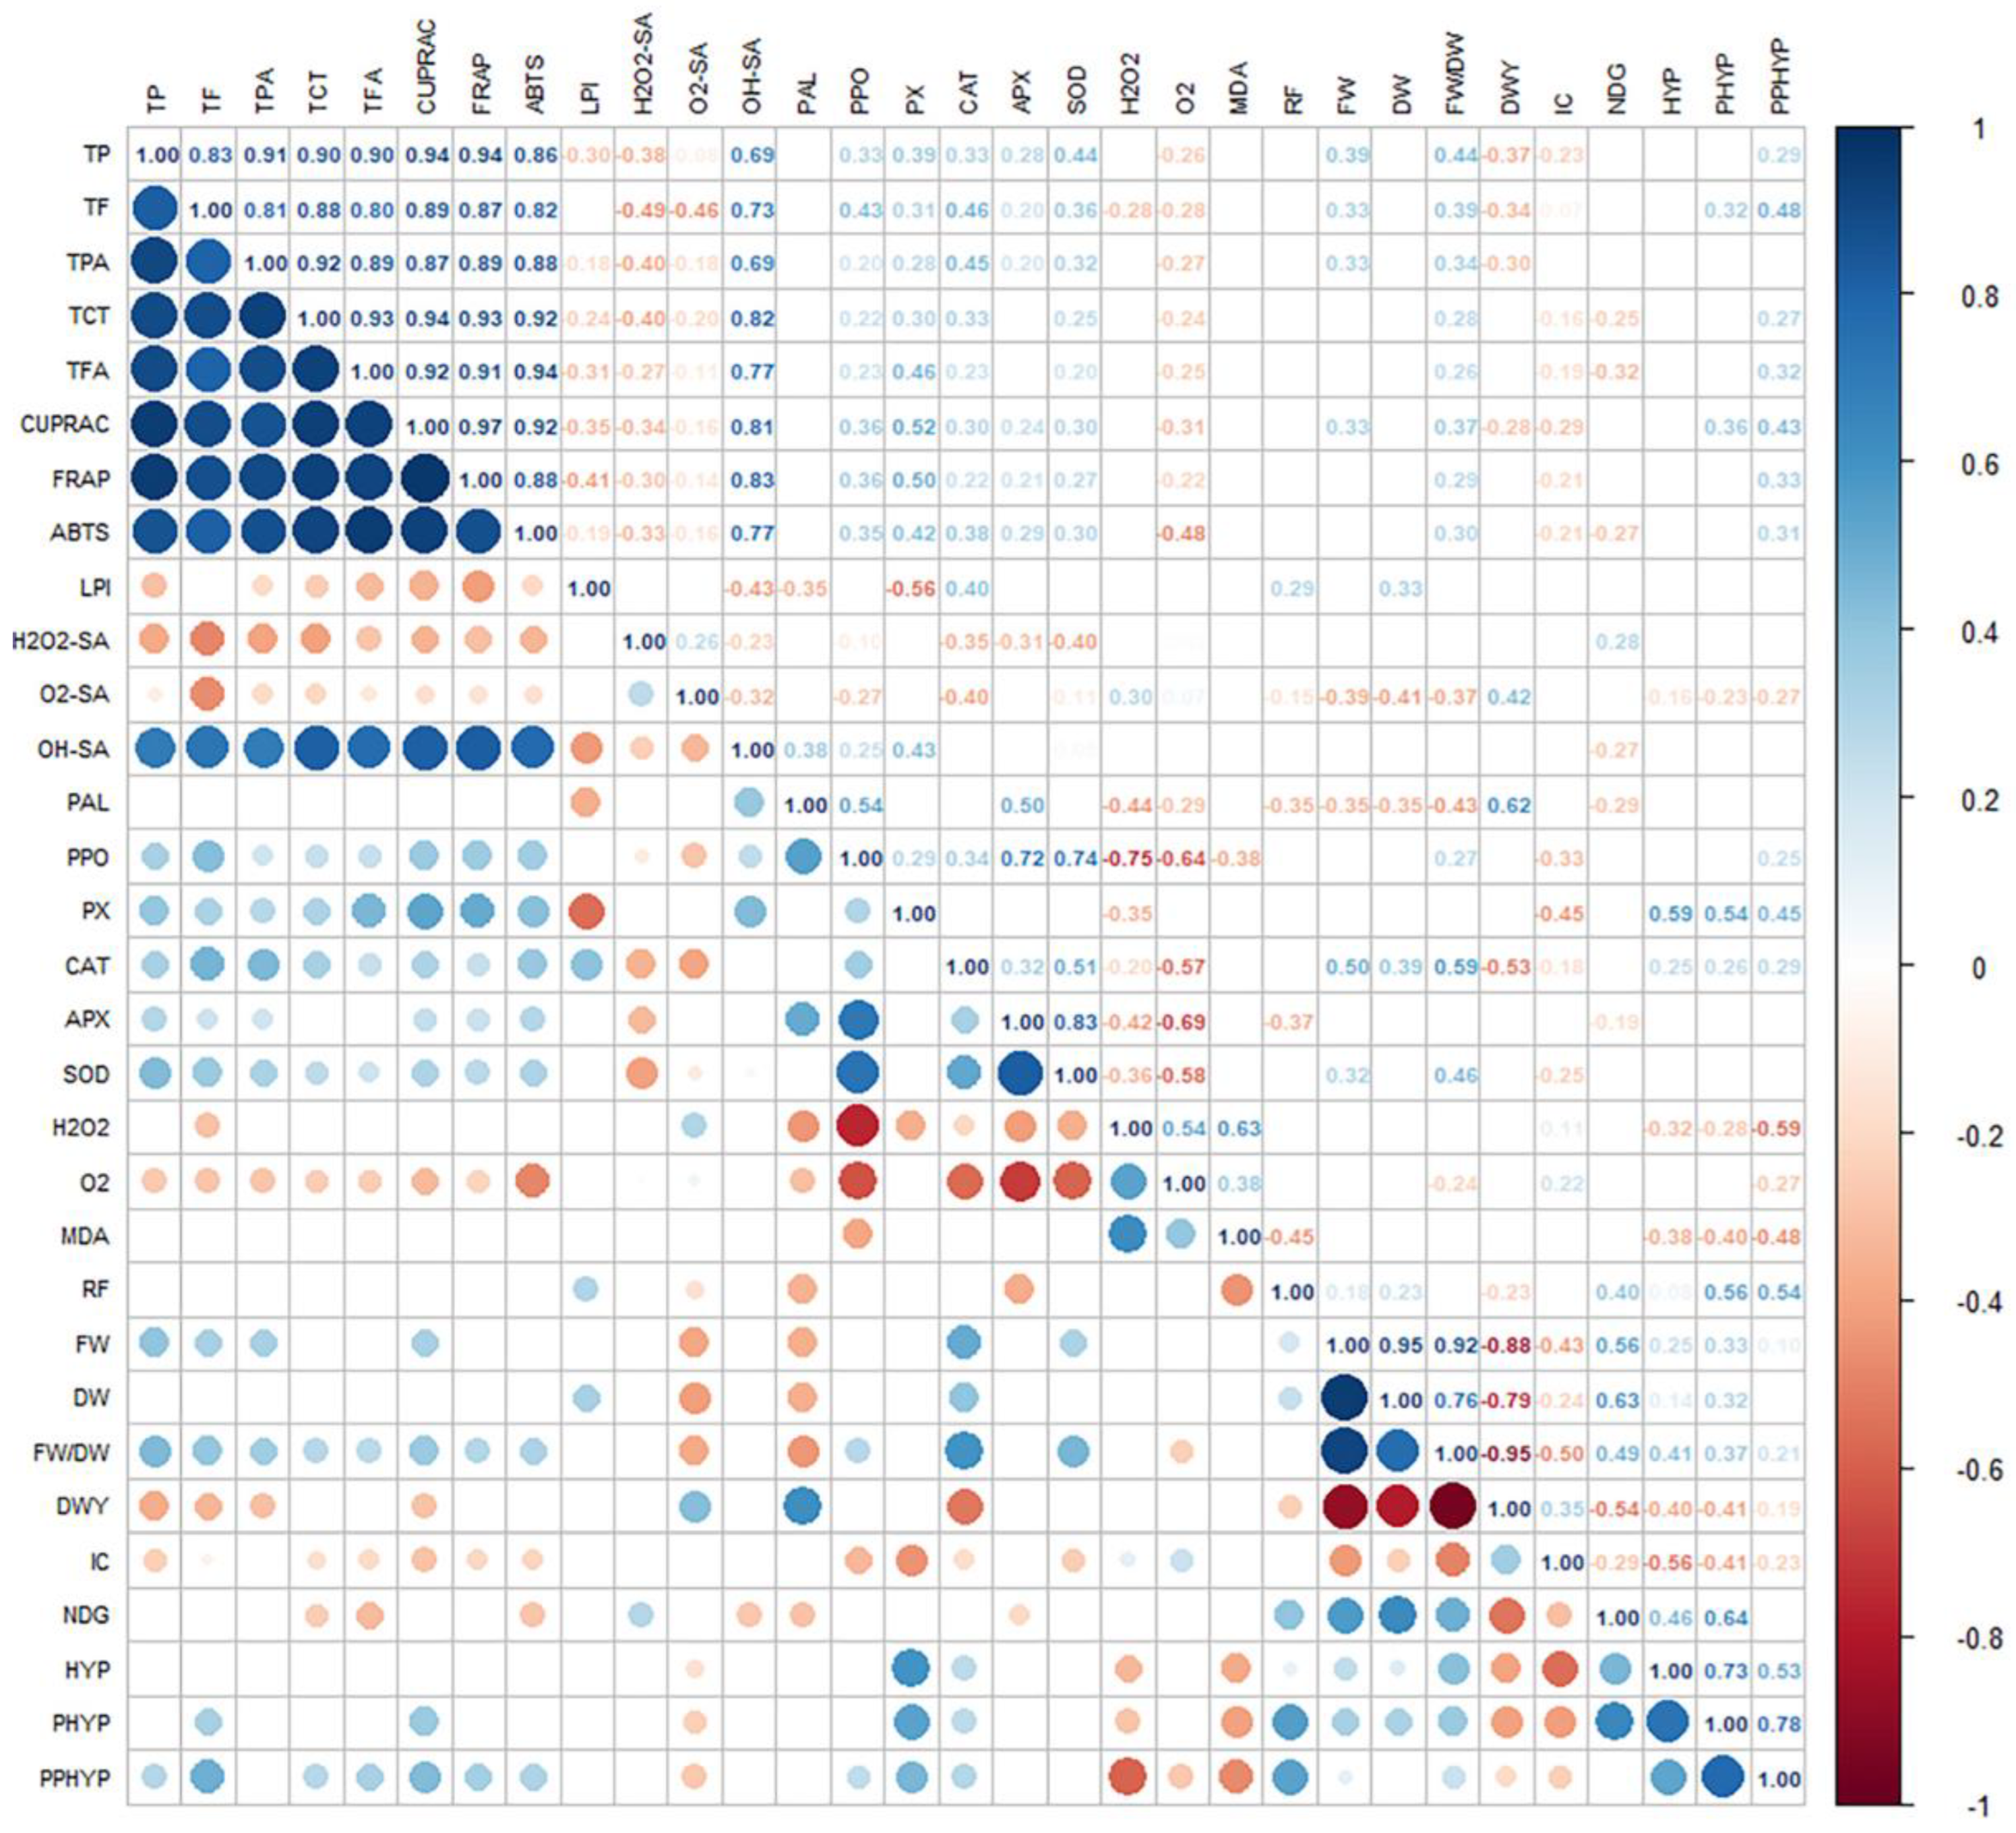

Table 1.
The UV and mass spectral data of naphthodianthrones in Hypericum perforatum shoot extracts.
Table 1.
The UV and mass spectral data of naphthodianthrones in Hypericum perforatum shoot extracts.
| Compounds | UV (nm) | [M-H]‒ (m/z) |
-MS2 [M-H] ‒ (m/z) |
|---|---|---|---|
| PPHYP | 285, 375, 550 | 521 | 423 |
| PHYP | 288, 325, 465, 580 | 519 | 487, 421 |
| HYP | 288, 325, 465, 580 | 503 | 405 |
Note: PHYP: pseudohypericin; HYP: hypericin; PPHYP: protopseudohypericin; [M–H]‒: deprotonated molecular ion; –MS2 [M–H]-: collision fragment ions. MS2 ions in bold indicate the base peak.
Table 2.
Linear regression equation, correlation coefficient, sensitivity, accuracy, and repeatability of hypericin (HYP) and pseudohypericin (PHYP) by UPLC analysis.
Table 2.
Linear regression equation, correlation coefficient, sensitivity, accuracy, and repeatability of hypericin (HYP) and pseudohypericin (PHYP) by UPLC analysis.
| Compound | Test range (μg·mL-1) | Linear regression equation |
R2 | LOD (μg·mL-1) |
LOQ (μg·mL-1) |
Spiked conc. (μg·mL-1) |
Recovery (%) |
Average Recovery (%) |
RSD (%) |
|---|---|---|---|---|---|---|---|---|---|
| PHYP | 0.1-3 | y=334.76x-26.28 | 0.997 | 0.0086 | 0.0260 | 1.534 | 114.98 | 103.15 | 1.27 |
| 1.918 | 97.68 | ||||||||
| 2.302 | 96.79 | ||||||||
| HYP | 0.02-0.1 | y=788x-7.96 | 0.998 | 0.0005 | 0.0016 | 0.020 | 90 | 97.77 | 1.40 |
| 0.025 | 100 | ||||||||
| 0.030 | 103.30 |
Note: PHYP: pseudohypericin; HYP: hypericin; R2: correlation coefficient, LOD: limit of detection, LOQ: limit of quantification, RSD: relative standard deviation.
Table 3.
Morphological and growth characteristics of Hypericum perforatum transgenic shoots.
| Root cultures | RF (%) | Shoot cultures | FW (g) | DW (g) | FW/DW | DWY (%) | IC (NLS/SL) | NDG |
|---|---|---|---|---|---|---|---|---|
| NTR | 20.00±1.50 b-e | NTS | 5.28±0.59 bc | 0.34±0.02 d | 15.48±1.24 e | 6.46±0.32 de | 3.73±0.33 cdg | 9.00±1.83 bc |
| HR A | 26.60±0.80 g | TS A | 2.41±0.33 a | 0.27±0.03 bc | 8.83±0.38 a | 11.33±1.00 n | 3.43±0.39 bd | 9.75±0.50 be |
| HR B | 20.00±2.00 b-df | TS B | 13.70±1.23 e | 0.63±0.01 fg | 21.81±1.57 gh | 4.58±0.20 ac | 2.40±0.11 a | 15.67±3.21 lm |
| HR C | 12.50±1.20 a | TS C | 17.47±2.51 f | 0.70±0.04 i | 25.06±1.45 h | 3.99±0.11 a | 3.31±0.14 bc | 10.75±1.50 bh |
| HR D | 45.00±2.10 hi | TS D | 18.60±3.45 f | 0.77±0.05 j | 24.10±1.31 h | 4.15±0.30 ab | 3.11±0.16 be | 10.67±1.15 bg |
| HR E | 50.00±3.80 i | TS E | 14.17±1.66 e | 0.76±0.02 j | 18.58±1.29 f | 5.38±0.19 cd | 3.68±0.17 cd | 12.50±2.08 c-k |
| HR F | 15.00±0.70 ac | TS F | 2.16±0.22 a | 0.21±0.01 a | 10.31±1.04 ab | 9.69±0.09 lm | 4.23±0.41 f-k | 6.00±1.00 a |
| HR G | 78.00±5.60 k | TS G | 8.57±0.14 d | 0.59±0.03 f | 14.61±1.23 de | 6.85±0.50 eh | 4.72±0.03 kl | 14.00±1.63 i-km |
| HR H | 44.00±2.40 h | TS H | 4.05±0.28 ab | 0.32±0.01 d | 12.78±0.73 cd | 7.82±0.31 f-jl | 3.93±0.20 dj | 8.60±0.89 ab |
| HR I | 16.70±0.90 ad | TS I | 10.03±1.10 d | 0.68±0.02 g-i | 14.71±1.13 de | 6.80±0.49 eg | 5.11±0.68 lm | 12.00±2.45 c-k |
| HR J | 12.50±0.40 a | TS J | 9.17±0.56 d | 0.63±0.02 fh | 14.56±1.27 de | 6.87±0.62 ei | 3.83±0.18 cdi | 11.40±0.89 bj |
| HR K | 65.00±4.40 j | TS K | 18.68±2.20 f | 0.98±0.07 k | 19.10±1.86 fg | 5.24±0.10 bc | 3.00±0.10 b | 13.33±1.15 g-l |
| HR L | 82.00±7.90 k | TS L | 4.06±0.88 ac | 0.27±0.01 bc | 14.86±1.33 de | 6.73±0.42 ef | 3.81±0.29 cdh | 11.67±0.58 bk |
| HR M | 22.20±3.40 dg | TS M | 5.17±0.19 bc | 0.42±0.02 e | 12.28±1.21 cd | 8.14±0.81 jk | 5.27±0.15 m | 9.75±0.96 bf |
| HR N | 23.30±1.60 e-g | TS N | 2.19±0.10 a | 0.23±0.01 ac | 9.53±0.75 ab | 10.49±1.20 mn | 3.62±0.05 cde | 11.00±2.31 bi |
| HR O | 14.80±2.20 ab | TS O | 2.59±0.21 a | 0.23±0.01 ab | 11.38±0.94 bc | 8.79±0.97 kl | 3.71±0.56 cdf | 9.40±1.14 bd |
Note: NTR: non-transgenic roots; HR A-HR O: hairy root clones; NTS: non-transgenic shoots; TS A-TS O: transgenic shoot clones; RF: regeneration frequency; FW: fresh weight; DW: dry weight; FW/DW ratio: fresh weight/dry weight ratio; DWY: dry weight yield; IC: index of compactness; NLS: number of leaves per shoot; SL: shoot length; NDG: number of dark glands. The values in one column marked with different lower-case letters denoted significant differences at p<0.05 between clones (Duncan’s multiple range test).
Table 4.
Phenylpropanoid production in Hypericum perforatum transgenic shoots.
| TP (mg GA·g-1 DW) |
TF (mg C·g-1 DW) |
TFA (mg C·g-1 DW) |
TPA (mg P·g-1 DW) |
TCT (mg CG·g-1 DW) |
PAL (pkat·mg-1 P) |
PPO (nkat·mg-1 P) |
|
|---|---|---|---|---|---|---|---|
| NTS | 45.06±1.40 f | 19.77±2.00 eg | 5.16±0.21 f | 3.60±0.02 h | 3.30±0.02 hj | 0.72±0.10 fg | 5.60±0.26 a |
| TS A | 38.95±2.30 e | 22.26±0.91 h | 4.14±0.25 d | 2.44±0.08 ef | 2.85±0.14 g | 2.80±0.30 i | 51.39±3.01 l |
| TS B | 42.13±1.63 ef | 18.09±1.09 de | 4.64±0.01 e | 2.38±0.18 ef | 2.41±0.03 cf | 0.63±0.25 eg | 24.45±1.60 j |
| TS C | 61.05±3.29 h | 26.14±1.38 i | 5.80±0.20 g | 3.61±0.16 h | 3.17±0.16 i-k | 0.30±0.11 b-d | 51.17±2.44 l |
| TS D | 51.69±0.90 g | 26.32±1.53 i | 7.08±0.13 h | 3.64±0.03 h | 3.35±0.13 hk | 0.70±0.19 fg | 27.74±1.02 k |
| TS E | 62.03±0.74 h | 22.86±1.03 h | 7.56±0.11 i | 3.85±0.28 i | 3.47±0.23 h | 0.16±0.01 ab | 17.65±1.85 gh |
| TS F | 61.63±4.28 h | 27.82±0.45 i | 10.44±0.37 j | 4.35±0.13 j | 4.20±0.13 l | 1.00±0.10 h | 23.13±2.60 ij |
| TS G | 40.70±1.57 e | 22.80±1.84 h | 4.18±0.16 d | 3.22±0.07 g | 2.82±0.20 fg | 0.24±0.00 ac | 14.26±2.14 bf |
| TS H | 35.12±1.48 bd | 19.26±0.97 ef | 4.13±0.11 d | 2.30±0.14 df | 2.51±0.04 cd | 0.35±0.02 b-d | 13.61±0.42 bd |
| TS I | 32.09±0.16 b | 16.95±1.03 cd | 2.50±0.16 b | 2.42±0.05 ef | 2.06±0.09 b | 0.59±0.06 ef | 20.57±3.27 i |
| TS J | 54.22±3.44 g | 23.53±1.89 h | 5.42±0.22 f | 3.49±0.02 h | 3.28±0.11 hi | 0.77±0.09 fg | 11.89±0.06 b |
| TS K | 35.62±1.23 cd | 15.18±0.19 bc | 3.30±0.26 c | 2.27±0.06 de | 2.72±0.25 d-g | 0.29±0.14 ad | 15.32±0.76 c-fh |
| TS L | 39.36±4.03 e | 20.64±1.48 fg | 3.53±0.24 c | 1.88±0.09 c | 2.53±0.18 ce | 0.10±0.01 a | 15.18±0.37 c-g |
| TS M | 32.13±2.34 b | 14.80±0.78 b | 2.48±0.14 b | 1.53±0.01 b | 2.03±0.03 b | 0.31±0.05 b-d | 11.49±3.14 b |
| TS N | 35.17±0.08 bc | 8.73±0.19 a | 2.61±0.16 b | 2.20±0.10 d | 1.92±0.06 b | 0.97±0.07 h | 13.50±1.10 bc |
| TS O | 23.26±0.99 a | 7.36±0.96 a | 1.85±0.03 a | 1.29±0.18 a | 1.37±0.08 a | 0.45±0.04 de | 14.22±0.01 be |
Note: NTS: non-transgenic shoots; TS A-TS O: transgenic shoot clones; TP: phenolics; TF: flavonoids; TFA: flavan-3-ols; TCT: condensed tannins; TPA: phenolic acids; GA: gallic acid; P: pyrocatechol; C: catechin; CG: cyanidin-3-glucoside; PAL: phenylalanine ammonia-lyase; PPO: polyphenol oxidase; P: proteins; DW: dry weight. The values in one column marked with different lower-case letters denoted significant differences at p<0.05 between clones (Duncan’s multiple range test).
Table 5.
Naphthodianthrone production in Hypericum perforatum transgenic shoots.
| HYP (µg·g-1 DW) |
PHYP (µg·g-1 DW) |
PPHYP (µg·g-1 DW) |
|
|---|---|---|---|
| NTS | 28.55±1.45 g | 660.64±35.33 b | 91.92±1.12 a |
| TS A | 24.33±1.19 f | 1101.39±20.57 e | 366.51±11.85 f |
| TS B | 69.41±2.54 i | 1915.34±56.88 g | 477.90±3.41 h |
| TS C | 24.14±1.01 f | 755.99±19.09 c | 356.37±5.67 ef |
| TS D | 21.15±1.35 e | 1096.43±35.96 de | 364.90±10.08 f |
| TS E | 27.13±1.09 g | 1543.25±43.12 f | 441.51±8.61 g |
| TS F | 19.18±1.27 e | 758.68±62.04 c | 348.99±3.32 e |
| TS G | 23.98±0.95 f | 1495.50±26.04 f | 511.09±9.89 i |
| TS H | 34.63±1.11 h | 1178.44±64.78 e | 578.80±12.22 j |
| TS I | 13.25±0.56 b | 626.12± 21.77 b | 142.61±7.54 b |
| TS J | 14.16±1.22 bc | 1062.12±9.88 d | 220.77±3.12 d |
| TS K | 23.53±1.85 f | 1074.68±12.99 de | 198.98±6.09 c |
| TS L | 26.67±1.18 | 1463.86±38.31 f | 506.73±12.49 i |
| TS M | 16.97±0.72 d | 652.18±8.76 b | 147.43±2.67 b |
| TS N | 11.11±0.86 a | 537.09±18.71 a | 190.03±7.91 c |
| TS O | 15.87±0.58 cd | 647.69±11.67 b | 146.94±1.20 b |
Note: NTS: non-transgenic shoots; TS A-TS O: transgenic shoot clones; HYP: hypericin; PHYP: pseudohypericin; PPHYP: protopseudohypericin; DW: dry weight. Protopseudohypericin content was expressed as pseudohypericin equivalents. The values in one column marked with different lower-case letters denoted significant differences at p<0.05 between clones (Duncan’s multiple range test).
Table 6.
Antioxidant and radical scavenging activities in Hypericum perforatum transgenic shoots.
| CUPRAC (μМ Т·g-1 DW) |
FRAP (μМ Fe2+·g-1 DW) |
ABTS (μМ Т·g-1 DW) |
LPI (%) |
H2O2 SA (%) |
O2•- SA (%) |
OH• SA (mM M·g-1 DW) |
|
|---|---|---|---|---|---|---|---|
| NTS | 178.27±2.90 e-g | 432.11±0.74 fg | 123.51±2.90 i | 74.10±2.40 dg | 18.47±0.92 a | 34.68±1.15 df | 1.63±0.02 i |
| TS A | 188.20±4.83 g | 492.19±14.87 h | 113.54±4.05 h | 66.53±1.92 c | 26.36±0.64 dg | 30.95±0.78 c | 1.71±0.03 i |
| TS B | 186.66±4.11 g | 440.00±21.21 g | 100.89±1.89 g | 60.60±0.32 b | 28.87±2.30 hikl | 38.15±0.48 gj | 1.53±0.05 d-h |
| TS C | 210.44±10.62 h | 530.79±6.39 i | 123.21±2.53 i | 84.72±0.52 ij | 22.42±1.50 bc | 33.42±1.40 d | 1.44±0.00 cd |
| TS D | 212.95±11.95 h | 550.13±28.47 i | 144.42±2.21 j | 75.89±4.12 e-g | 25.56±1.30 de | 27.27±0.80 b | 1.70±0.05 i |
| TS E | 236.27±10.40 i | 595.79±20.97 j | 142.19±1.58 j | 71.97±4.12 d | 27.86±0.64 dh-jmn | 33.39±2.43 d | 1.71±0.01 i |
| TS F | 250.81±14.52 i | 649.91±37.46 k | 168.75±0.00 k | 63.97±4.08 c | 27.46±1.06 e-gi | 41.94±2.23 k | 1.85±0.05 j |
| TS G | 166.52±8.81 de | 431.05±9.86 g | 98.66±2.23 e-g | 84.97±0.48 ij | 27.11±2.00 e-h | 34.41±0.36 de | 1.27±0.06 b |
| TS H | 157.86±3.44 cd | 390.79±14.89 ce | 88.69±6.70 d | 82.69±1.29 hi | 25.58±0.31 df | 26.60±0.10 b | 1.45±0.04 cf |
| TS I | 126.78±7.50 b | 366.93±20.15 c | 78.87±7.16 bc | 79.97±0.77 h | 28.76±2.19 gjk | 24.20±3.51 a | 1.50±0.00 ch |
| TS J | 202.22±4.36 h | 586.18±1.67 j | 92.19±10.00 df | 51.50±2.61 a | 24.46±1.77 cd | 37.94±1.52 gi | 1.73±0.03 i |
| TS K | 152.95±4.85 c | 380.26±8.66 cd | 84.97±5.65 cd | 91.33±3.01 k | 33.15±0.35 o | 36.12±0.57 e-g | 1.48±0.01 cg |
| TS L | 168.69±4.36 df | 401.32±49.87 d-f | 90.63±1.89 de | 63.76±3.13 c | 21.92±1.13 b | 38.11±0.12 gh | 1.39±0.10 c |
| TS M | 131.96±1.88 b | 328.42±11.16 b | 76.12±4.10 b | 83.00±4.73 hj | 30.00±0.71 k-m | 40.17±0.39 hjk | 1.45±0.03 ce |
| TS N | 133.68±9.34 b | 368.68±13.40 c | 83.63±0.68 bd | 74.04±1.43 df | 30.10±0.42 kln | 57.94±1.33 l | 1.24±0.09 b |
| TS O | 79.56±6.05 a | 230.88±13.41 a | 48.66±0.63 a | 73.03±1.17 de | 28.81±0.44 gjl | 39.67±2.53 h-j | 1.14±0.02 a |
Note: NTS: non-transgenic shoots; TS A-TS O: transgenic shoot clones; CUPRAC: cupric reducing antioxidant capacity; FRAP (ferric ions reducing antioxidant power); ABTS: ABTS radical scavenging activity; LPI: lipid peroxidation inhibition; T: trolox; M: mannitol; H2O2 SA: hydrogen peroxide scavenging activity; O2•- SA: superoxide anion scavenging activity; OH• SA: hydroxyl radical scavenging activity; DW: dry weight. The values in one column marked with different lower-case letters denoted significant differences at p<0.05 between clones (Duncan’s multiple range test).
Table 7.
Antioxidant enzymes and oxidative stress markers in Hypericum perforatum transgenic shoots.
Table 7.
Antioxidant enzymes and oxidative stress markers in Hypericum perforatum transgenic shoots.
| PX (nkat·mg-1 P) |
АPX (pkat·mg-1 P) |
CAT (nkat·mg-1 P) |
SOD (U·mg-1 P) |
H2O2 (μM·g-1 FW) |
O2•- (nM·min-1·g-1 FW) |
MDA (nM·g-1 FW) |
|
|---|---|---|---|---|---|---|---|
| NTS | 0.03±0.00 a | 66.15±10.54 j | 0.80±0.10 j | 2.05±0.20 j | 1.34±0.04 j | 0.64±0.10 efh | 1.42±0.08 j |
| TS A | 0.14±0.02 gk | 104.96±7.42 k | 0.48±0.00 h | 2.44±0.16 k | 0.38±0.06 a | 0.35±0.04 b | 0.41±0.02 a |
| TS B | 0.29±0.01 m | 34.08±2.71 d-h | 0.55±0.01 i | 1.19±0.23 hi | 0.69±0.02 b | 0.67±0.01 ghj | 0.82±0.02 bd |
| TS C | 0.09±0.02 bd | 124.69±12.61 l | 1.02±0.02 k | 7.51±0.47 l | 0.63±0.03 b | 0.24±0.02 a | 1.18±0.02 g-i |
| TS D | 0.14±0.03 fgi | 28.32±2.06 cg | 0.87±0.02 j | 1.32±0.32 i | 0.81±0.08 c | 0.44±0.04 c | 1.07±0.01 fg |
| TS E | 0.15±0.00 h-k | 32.08±1.45 d-g | 0.51±0.07 hi | 0.84±0.10 b-df | 1.04±0.08 h | 0.59±0.08 dfi | 1.37±0.14 j |
| TS F | 0.20±0.03 l | 25.96±3.66 cd | 0.19±0.03 c | 1.28±0.15 i | 0.92±0.06 d-f | 0.57±0.02 de | 1.10±0.05 fi |
| TS G | 0.08±0.01 bc | 41.52±5.05 hi | 1.17±0.10 l | 0.75±0.07 b-d | 0.87±0.08 ce | 0.55±0.02 d | 0.74±0.09 b |
| TS H | 0.10±0.03 be | 17.10±3.68 ab | 0.33±0.03 f | 0.47±0.15 a | 0.64±0.02 b | 0.62±0.03 e-g | 0.90±0.01 c-e |
| TS I | 0.11±0.00 deg | 27.93±0.26 cf | 0.27±0.02 de | 0.84±0.05 b-dg | 0.95±0.05 e-g | 0.75±0.06 k | 1.45±0.01 j |
| TS J | 0.13±0.02 f-h | 20.05±0.78 ac | 0.11±0.00 a | 0.60±0.04 ab | 1.18±0.06 i | 1.22±0.03 n | 1.75±0.10 k |
| TS K | 0.08±0.02 b | 21.73±3.46 bc | 0.40±0.01 g | 0.73±0.03 b-d | 1.17±0.01 i | 0.65±0.04 g-i | 0.77±0.03 bc |
| TS L | 0.11±0.01 c-f | 26.73±1.30 ce | 0.18±0.02 bc | 0.69±0.02 ad | 0.88±0.07 cf | 0.83±0.06 l | 0.85±0.04 be |
| TS M | 0.05±0.01 a | 45.48±3.36 i | 0.23±0.05 ce | 0.80±0.00 b-e | 0.84±0.08 cd | 0.73±0.03 jk | 1.08±0.05 fh |
| TS N | 0.14±0.01 fgj | 73.75±0.67 j | 0.12±0.01 ab | 1.02±0.06 e-h | 1.02±0.06 gh | 0.45±0.08 c | 1.39±0.10 j |
| TS O | 0.04±0.01 a | 13.06±2.41 a | 0.22±0.00 cd | 0.66±0.02 ac | 1.06±0.03 h | 0.95±0.07 m | 0.97±0.10 ef |
Note: NTS: non-transgenic shoots; TS A-TS O: transgenic shoot clones; PX: guaiacol peroxidase; APX: ascorbate peroxidase; CAT: catalase; SOD: superoxide dismutase; P: proteins; H2O2: hydrogen peroxide; O2•-: superoxide anion; MDA: malondialdehyde; FW: fresh weight. The values in one column marked with different lower-case letters denoted significant differences at p<0.05 between clones (Duncan’s multiple range test).
Disclaimer/Publisher’s Note: The statements, opinions and data contained in all publications are solely those of the individual author(s) and contributor(s) and not of MDPI and/or the editor(s). MDPI and/or the editor(s) disclaim responsibility for any injury to people or property resulting from any ideas, methods, instructions or products referred to in the content. |
© 2023 by the authors. Licensee MDPI, Basel, Switzerland. This article is an open access article distributed under the terms and conditions of the Creative Commons Attribution (CC BY) license (http://creativecommons.org/licenses/by/4.0/).
Copyright: This open access article is published under a Creative Commons CC BY 4.0 license, which permit the free download, distribution, and reuse, provided that the author and preprint are cited in any reuse.


