Submitted:
11 December 2023
Posted:
12 December 2023
You are already at the latest version
Abstract
Keywords:
1. Introduction
2. Literature review
3. Construction of index system of rural digital governance level
3.1. Selection of indicators of rural digital governance level
3.2. Index system design and construction
- (1)
- Digital economy index design. The field of digital economy focuses on digital infrastructure, digitalization of rural industry and digital inclusive finance, which is an important prerequisite for the five key governance areas and a key factor for carrying out rural digital governance work. There are four indicators in the second-level indicator layer. Among them, digital infrastructure, as the foundation of the development of digital economy, can not only upgrade and transform obsolete facilities, but also bring new technologies to empower rural industries and effectively promote industrial transformation and high-quality development in rural areas [16]. The digital infrastructure index in the National County Digital Countryside Index (2020) released by Peking University is taken as a secondary index. By referring to the Evaluation of National County Digital Agriculture Rural Development Level (2020), the paper constructs a model with "Taobao Village" as the representative of agriculture-related e-commerce, and takes the proportion of Taobao villages in all administrative villages and the delivery rate of live agricultural products as the secondary indicators to reflect the digitalization situation of rural industries. Digital finance is an important support for the effective operation of rural economy. Inclusive finance increases the coverage of financial services, optimizes the allocation of financial resources, effectively alleviates the financing constraints of rural low-income groups, and greatly improves people's living standards [17]. The rural inclusive finance index in Peking University Digital Inclusive Finance Index (2021) is used as a secondary index.
- (2)
- Digital ecological index design. The field of digital ecology focuses on the combination of digital information or technology with agricultural and rural production, environment and other aspects to build a digital ecological environment of harmonious coexistence between man and nature. To this end, it is necessary to start from the aspects of agricultural science and technology investment, environmental remediation, and production safety. Among them, according to the "14th Five-Year Plan" to promote the modernization of agriculture and rural areas, the construction of local financial agricultural science and technology expenditure as a secondary index layer, through the financial investment in agricultural science and technology can understand the construction degree of digital ecology; Referring to the research of scholar Zhang Hong [14], the green development of digital agriculture and agricultural and rural informatization production environment are selected as the second-level index layer. The digital production index in the national digital rural index is used to reflect the rural digital production environment.
- (3)
- Digital culture index design. Digital culture focuses on how to promote excellent rural culture and tourism consultation through digital media. It reflects the "soft power" of rural development and is the key to the promotion and development of rural excellent culture. There are 3 indicators in this secondary index layer. The number of county-level financial media centers is taken as a secondary index to reflect rural network culture. The comprehensive strength of county tourism is taken as a secondary index to reflect the development of new rural business forms. The number of cultural stations in towns and villages is taken as a secondary index to reflect the spread of rural digital culture.
- (4)
- Digital livelihood index design. The field of digital livelihood aims at the idea of "people-centered", mainly including rural education, medical care, training and employment of professional farmers in the new era, and is an important internal cause to promote the high-quality development of rural public services. The second level of indicators is set up with 6 indicators. Among them, Internet + education has the advantage of empowering the development of rural basic education, which can improve the quality of rural basic education, and is also an effective path for precise poverty alleviation through education [18]. The proportion of rural education expenditure reflects the importance of rural education, and the coverage rate of rural distance education can reflect the actual situation of rural Internet + education. The new rural cooperative medical care and local financial medical expenditures reflect the specific situation of Internet + medical care; Rural productivity and employment are reflected by the employment situation of farmers (primary industry) and the number of training for new professional farmers.
- (5)
- Digital government index design. Digital government mainly promotes the sinking of government services to the rural grassroots by digital technology, mainly including Internet + government and comprehensive governance at the grassroots level, and three indicators are set in this secondary index layer. Among them, the proportion of villages and towns on wechat public service platform and the proportion of online disclosure of rural government information reflect the level of Internet + government affairs; The coverage rate of "Xueliang Project" administrative village reflects the level of comprehensive management at the grass-roots level.
4. Measurement and analysis of digital governance level of county rural areas in China
4.1. Data source and processing
4.2. Evaluation method
- (1)
- Index data standardization
- (2)
- Index weighting
- (3)
- To evaluate the governance level, the specific steps are as follows


4.3. Analysis of the measurement results of digital governance level in county rural areas in China
- (1)
- Analysis of the comprehensive development trend of digital governance level in county rural areas in China
- (2)
- Spatial difference analysis of digital governance level in China's counties and villages
- (3)
- Analysis of the sub-systems of digital governance in China's county rural areas
1.31. provinces and counties at each level of indicators score
- 2.
- The scores of the three regions at each level of the indicators
- (1)
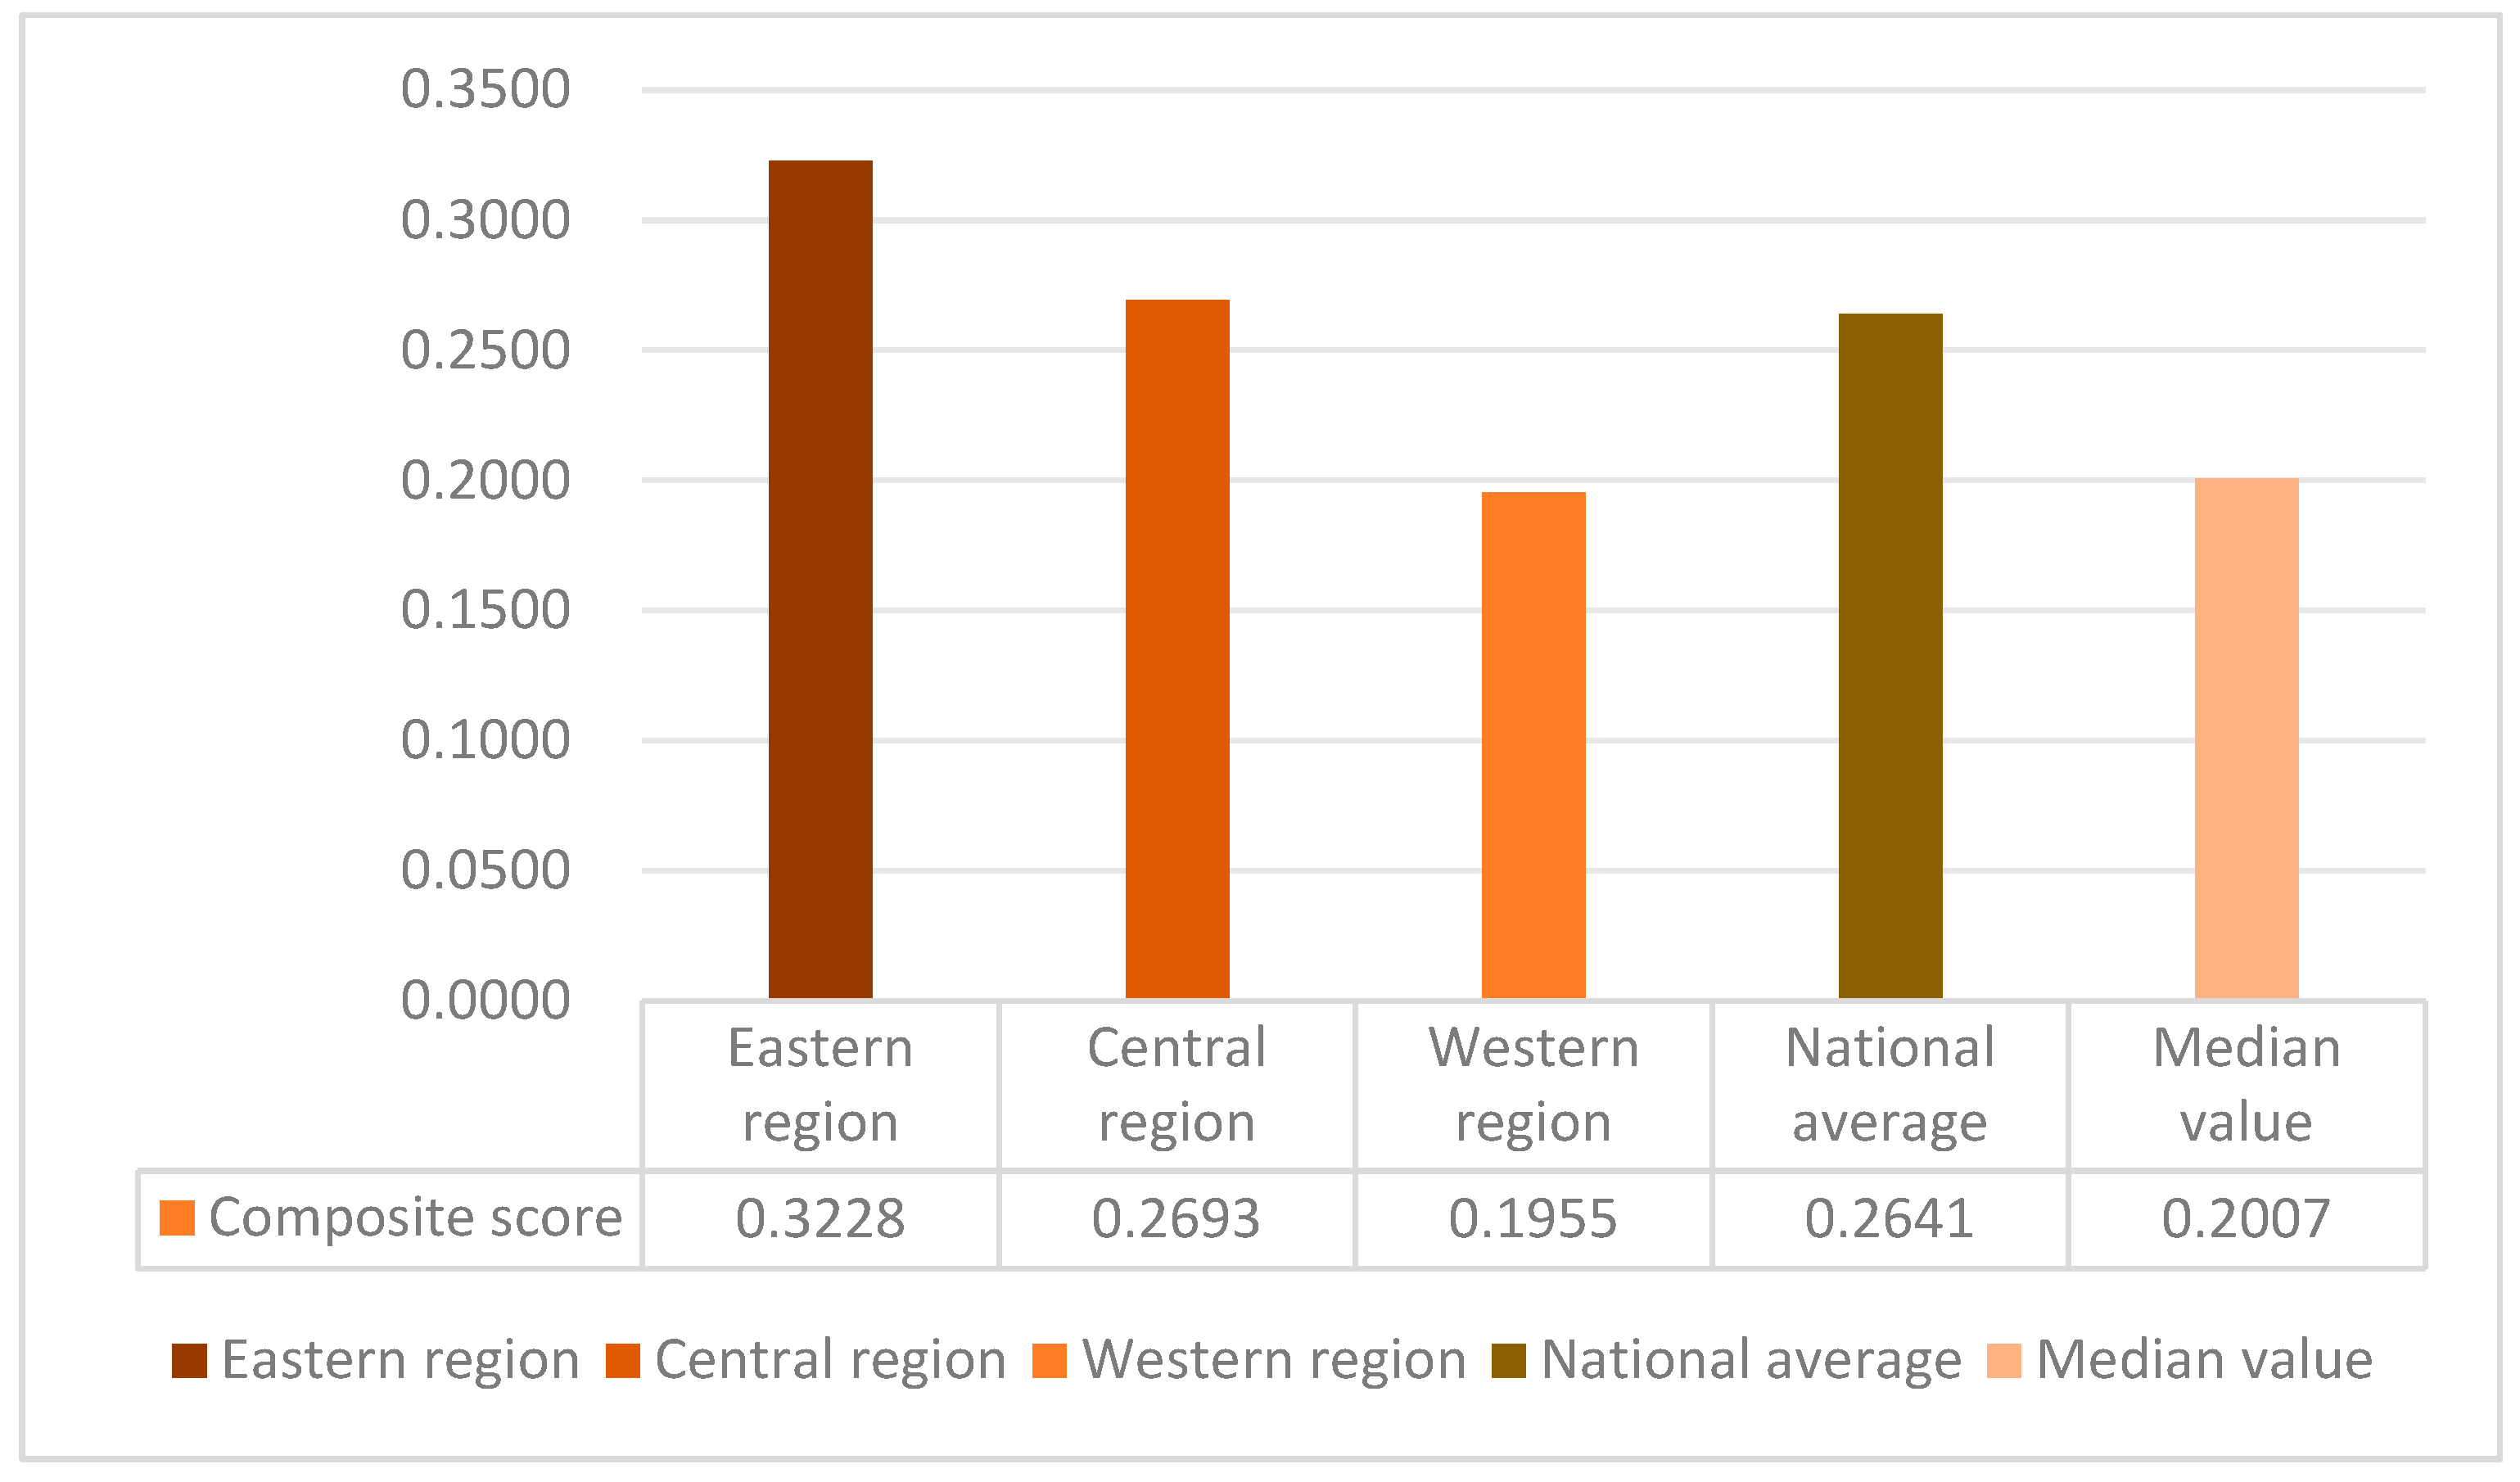
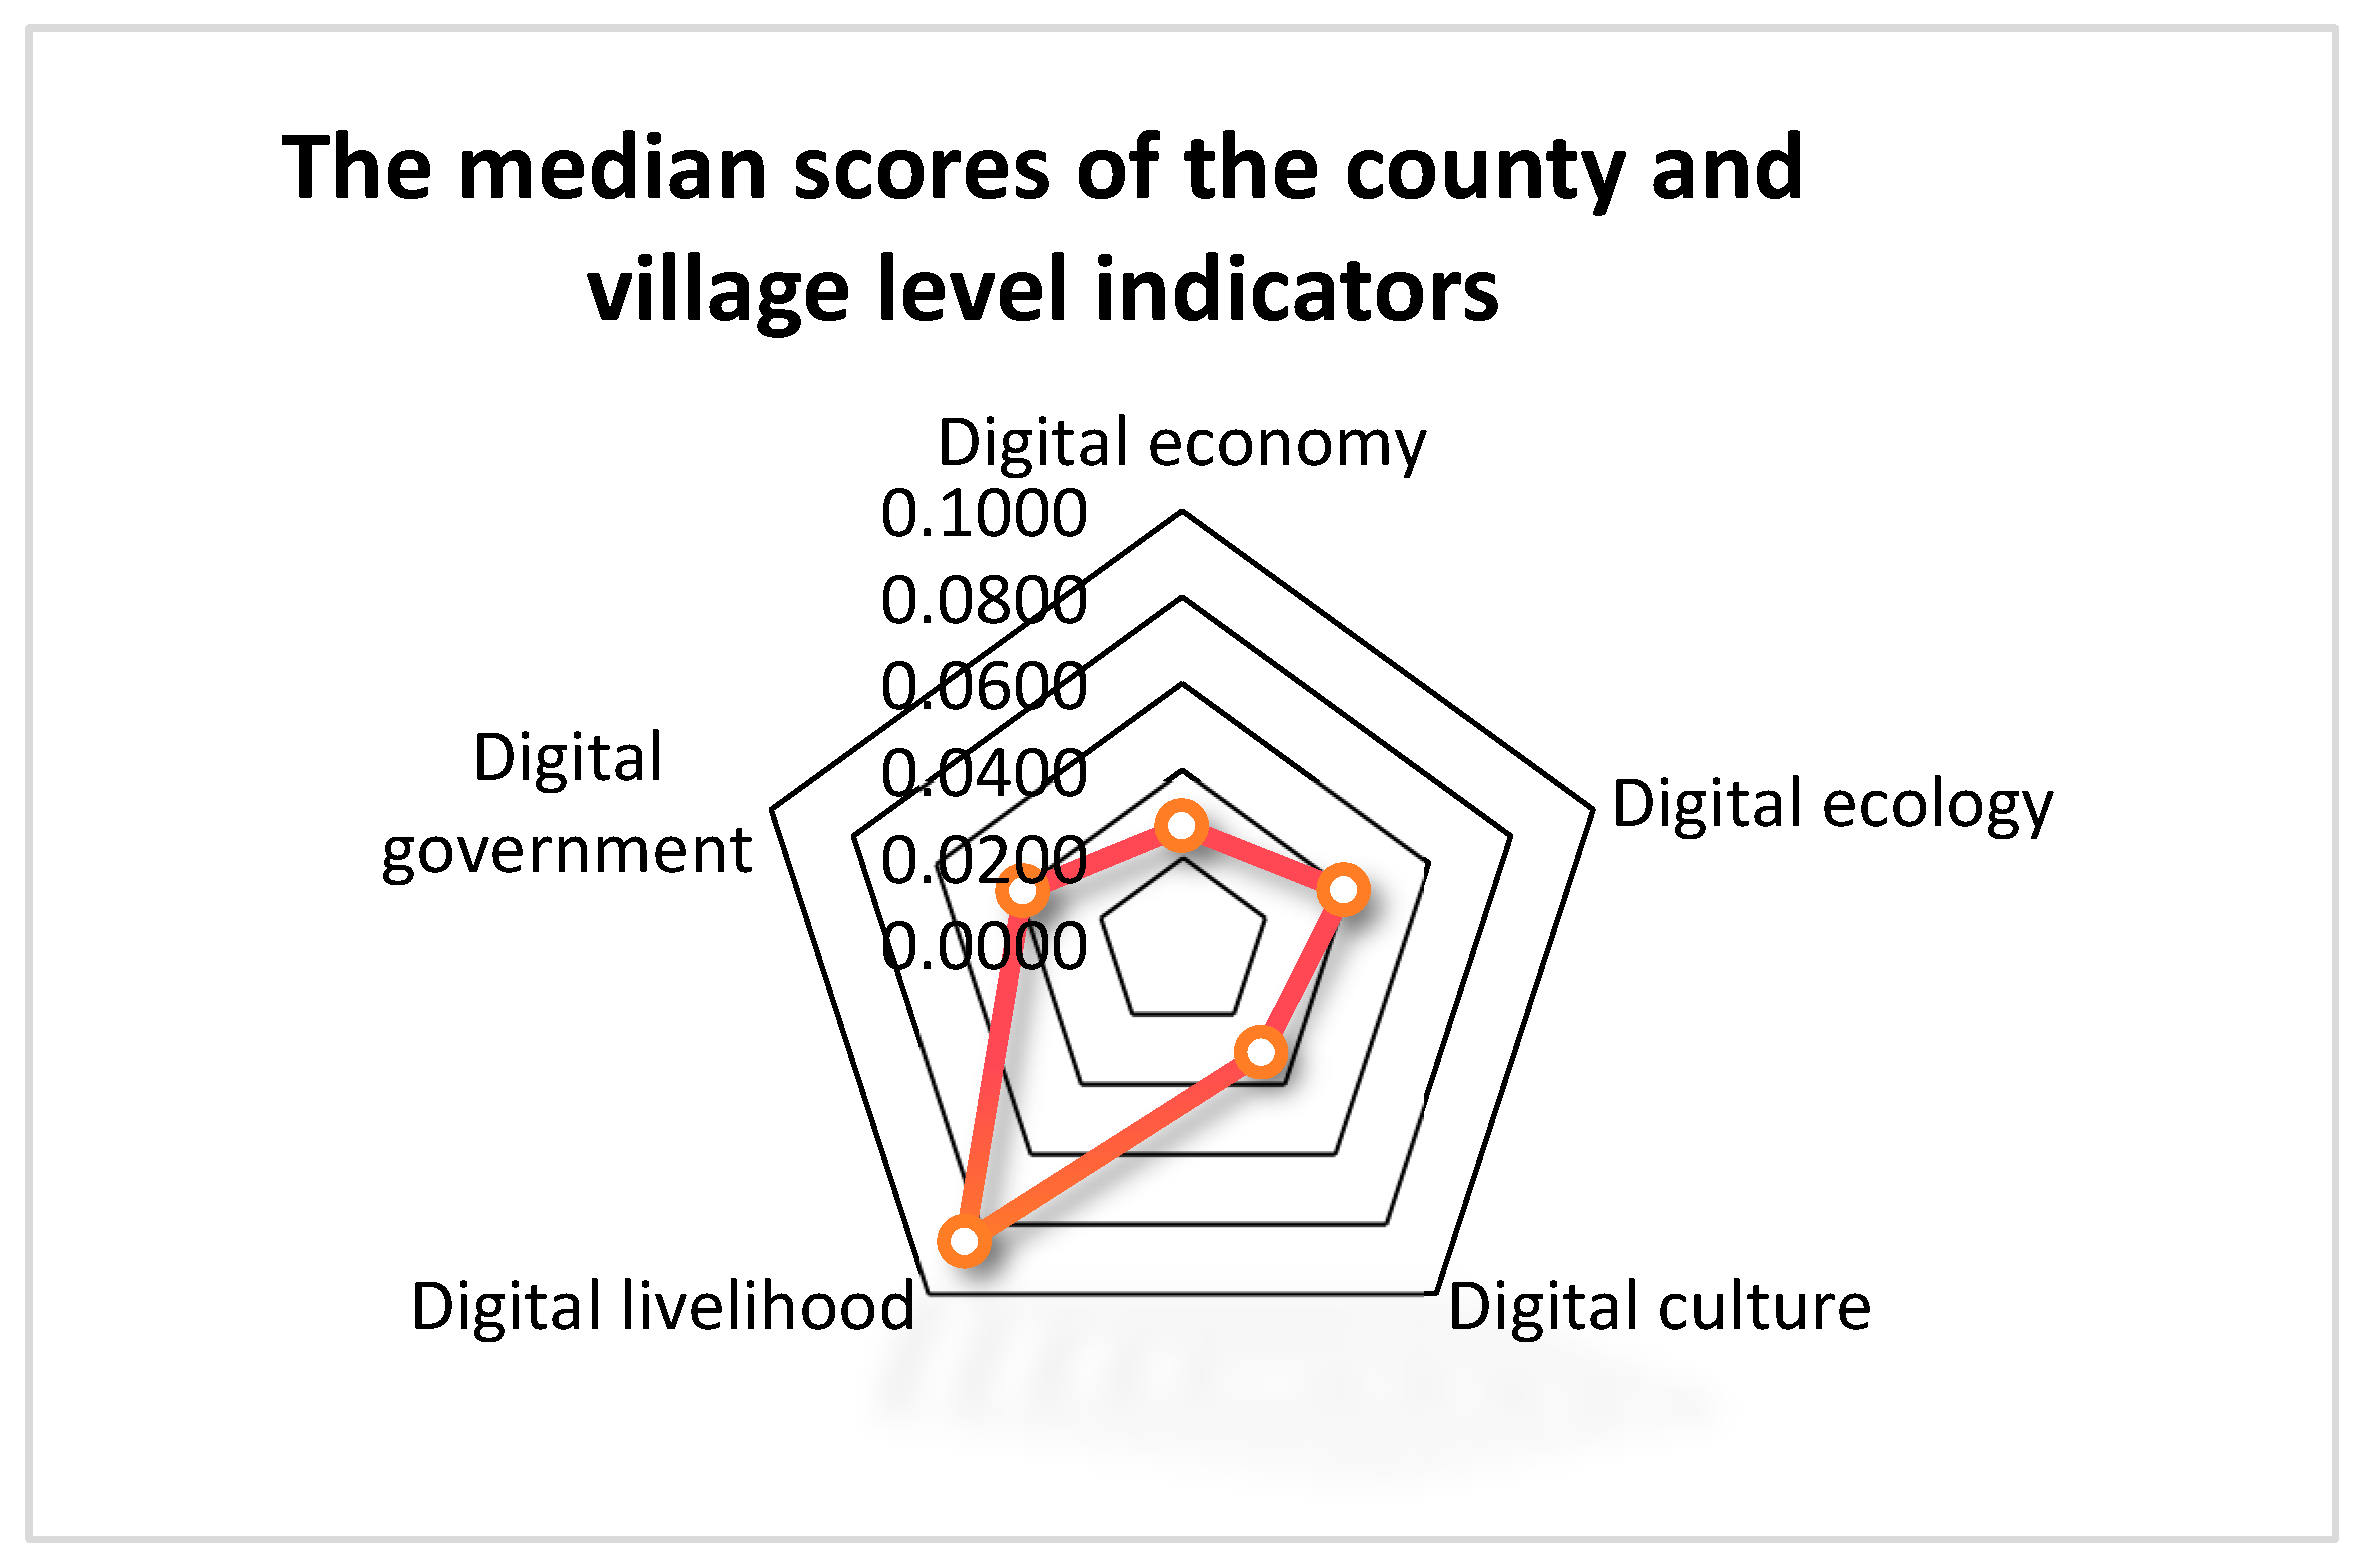
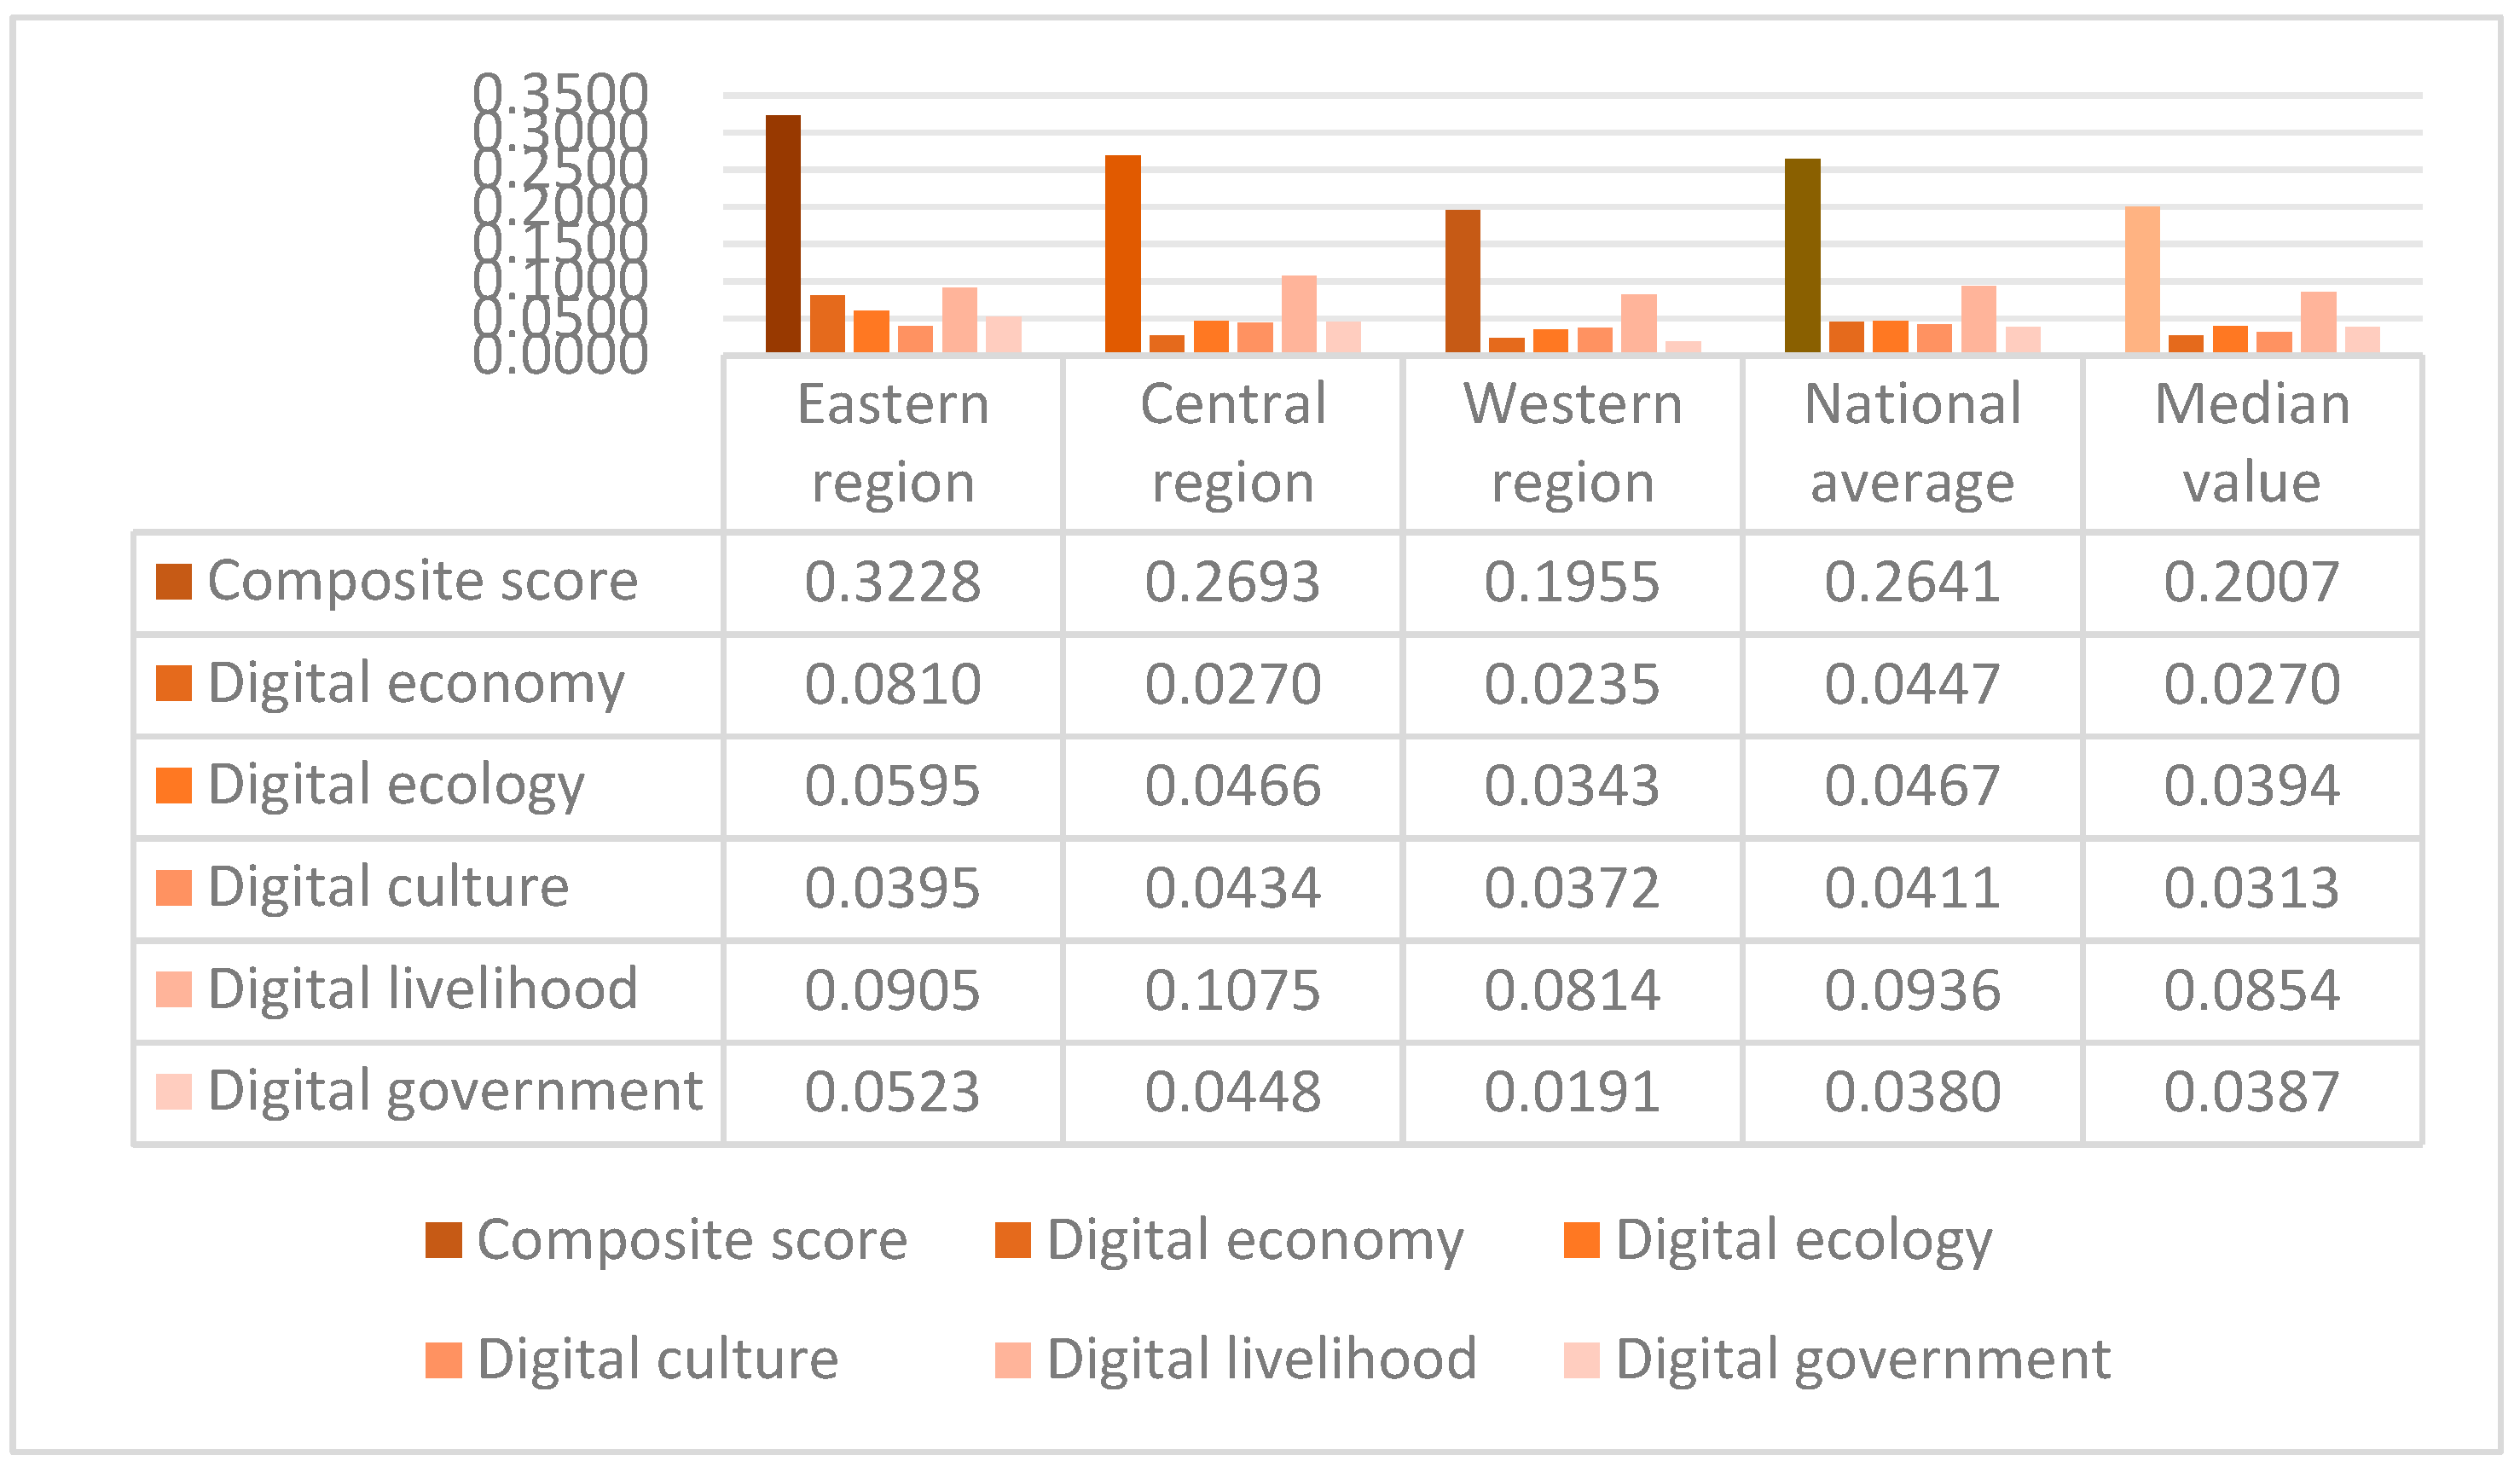
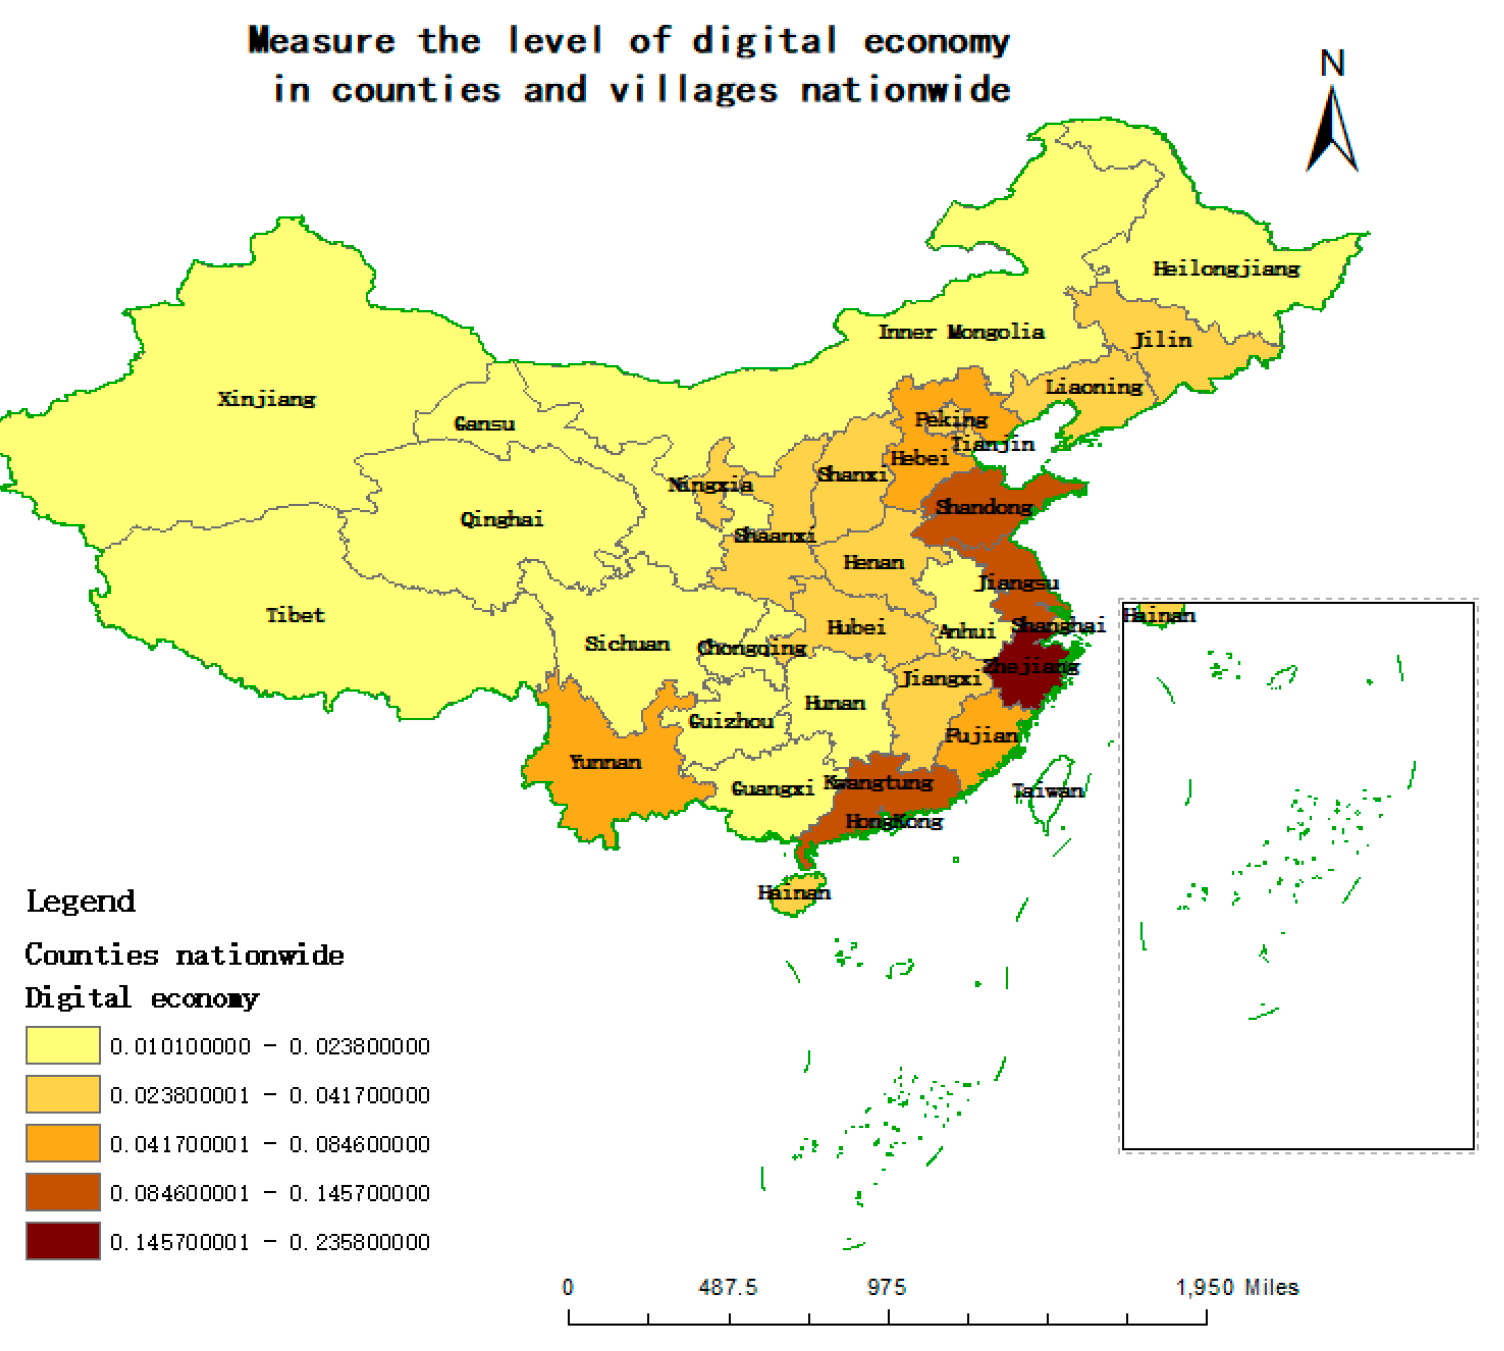
- The level of digital economy mainly focuses on exploring how to drive farmers' poverty alleviation and income increase through "digital production", high-quality agricultural development, and digital financial inclusion. The average value and median value of 31 provinces and counties in the digital economy level are 0.0447 and 0.0270. It can be seen from Figure 5 that the scores of 31 provinces and counties in this dimension are mostly distributed in the range of 0.0100-0.0238. Among them, Zhejiang Province ranked first with a score of 0.2358, Guangdong and Shandong ranked second and third with scores above 0.1000. In addition, the top five provinces and counties are Zhejiang, Guangdong, Shandong, Jiangsu and Fujian, with a median value of 0.1013; The next five provinces and counties are Guizhou, Chongqing, Heilongjiang, Inner Mongolia and Xinjiang. It can be seen that all provinces except Heilongjiang belong to the western region, with a median value of 0.0161. The median value of the top five is about 6.266 times that of the bottom five. This shows that there is a clear gap in the level of digital economy between provinces and counties. Digital economy is the necessary basis for the normal development of digital governance, so the provinces and counties with low ranking, especially those in the western region, should pay attention to and strengthen the construction of the level of digital economy, such as the upgrading of obsolete facilities, can also bring new technologies to empower rural industries, and effectively promote the industrial transformation and high-quality development of rural areas. Given that the level of digital economy plays a fundamental and important role in the implementation of digital governance, the eastern and central regions still need to continue to strengthen the construction of this aspect, so as to provide a sustainable digital governance environment for the implementation of digital governance.
- (2)
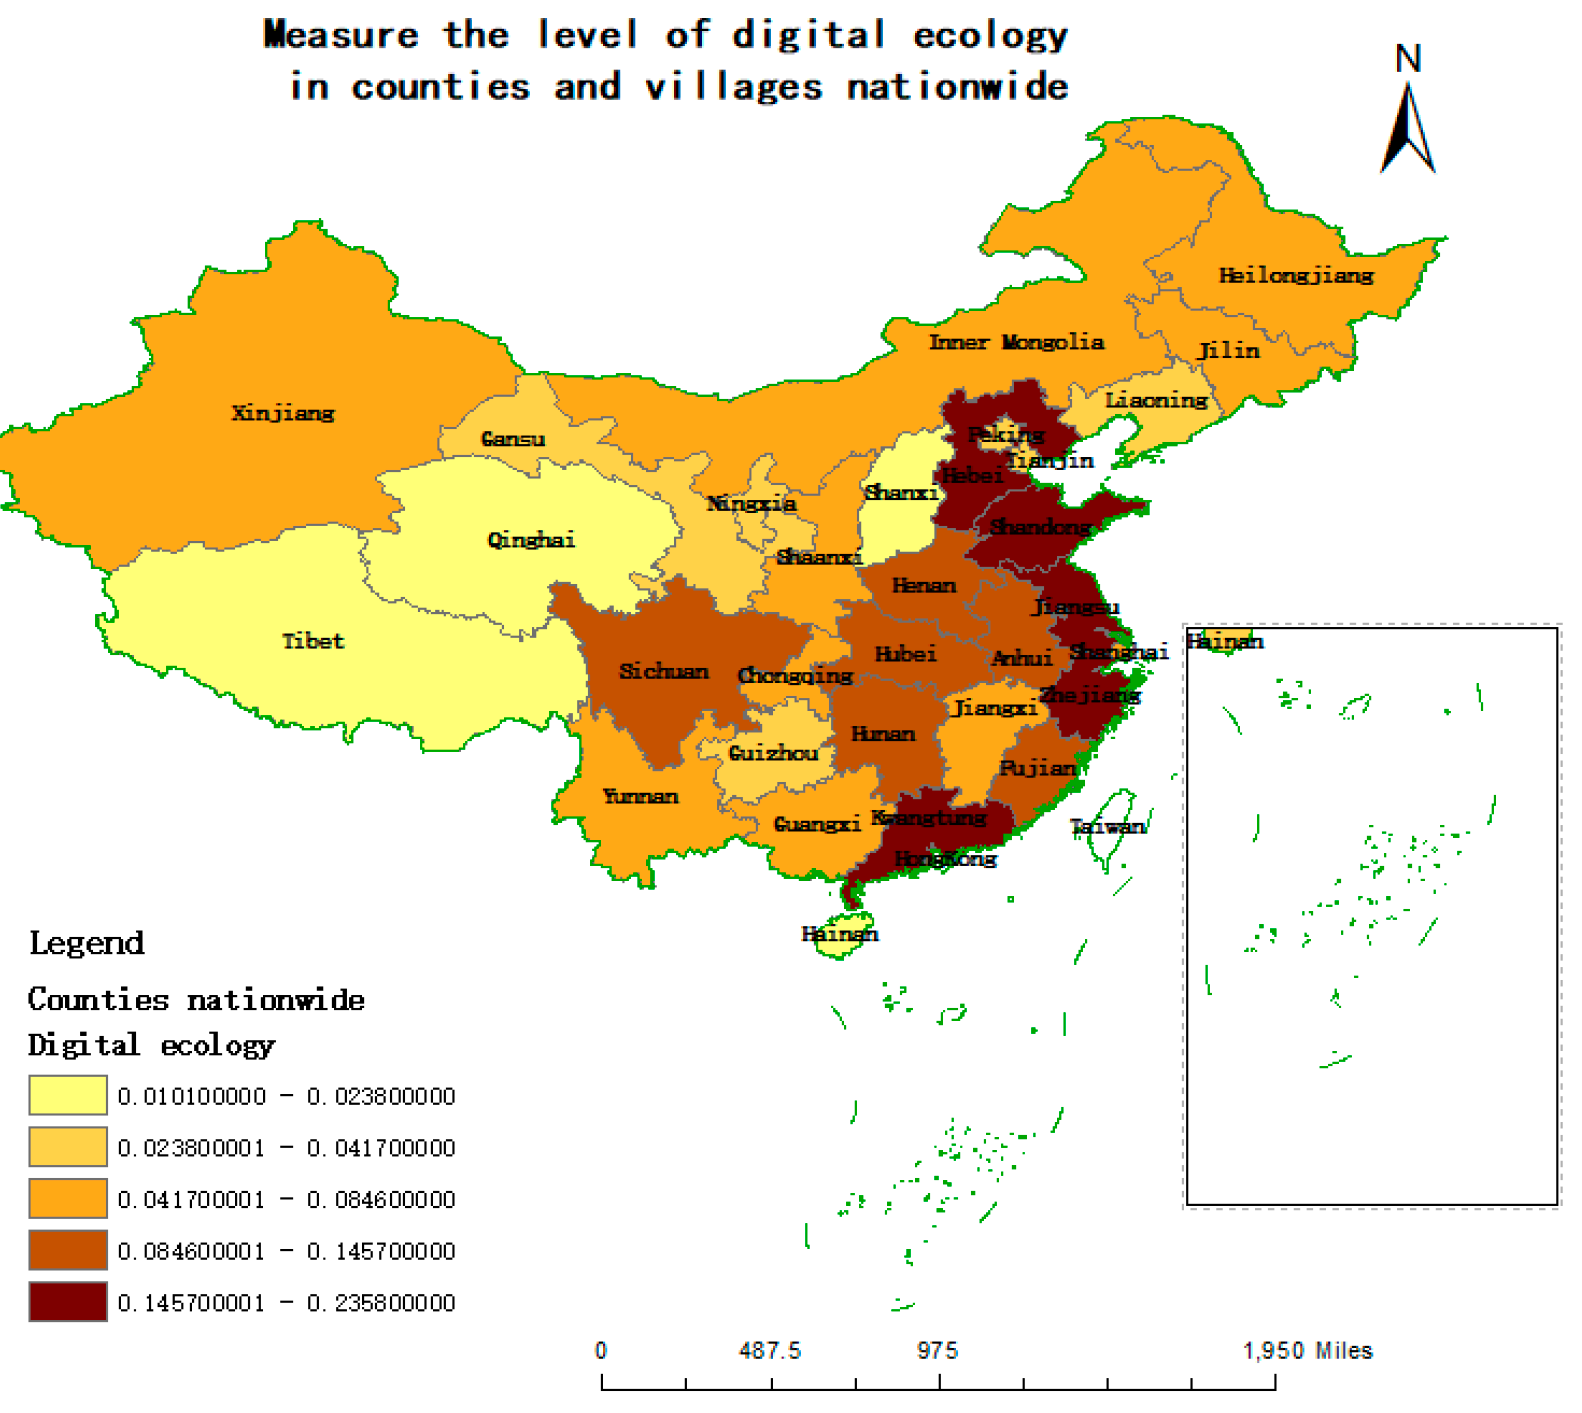
- The level of digital ecology is mainly about how to build a rural humanistic ecological environment of harmonious coexistence between man and nature through digital monitoring. Specific secondary indicators include local financial expenditure on agriculture, forestry and water affairs, digital agricultural green development, digital production index and agricultural and rural information production environment. The average value and median value of the 31 provinces and counties in the digital ecological level are 0.0467 and 0.0394. It can be seen from Figure 6 that the scores of the 31 provinces in this dimension are mostly distributed in the range of 0.0238-0.0846. Among them, Jiangsu Province ranked first with a score of 0.1114, Zhejiang Province and Guangdong Province ranked second and third, and Zhejiang Province also scored more than 0.1000. In addition, the top five provinces and counties are Jiangsu, Zhejiang, Guangdong, Shandong and Hebei, with a median value of 0.0849; The last five provinces and counties are Ningxia, Qinghai, Shanxi, Tibet and Hainan in turn. It can be seen that all provinces except Hainan belong to the western region, with a median value of 0.0163, and the median value of the top five is about 5.2 times that of the bottom five, indicating that there is an obvious gap in the level of digital ecology among provinces and counties. Digital ecology is an important link in the normal development of digital governance, so the provinces and counties with low ranking, especially those in the western region, should pay attention to and strengthen the construction of digital ecology level, such as counties still need to increase financial expenditure on agriculture, forestry and water affairs, organically integrate digital technology with agricultural manufacturing, machinery and tools, and improve the quality and quantity of agricultural production. Given that the level of digital economy is an important condition for the implementation of digital governance, the eastern region and the central region still need to continue to strengthen the construction of this aspect, so as to provide a good digital ecological environment for the implementation of digital governance.
- (3)
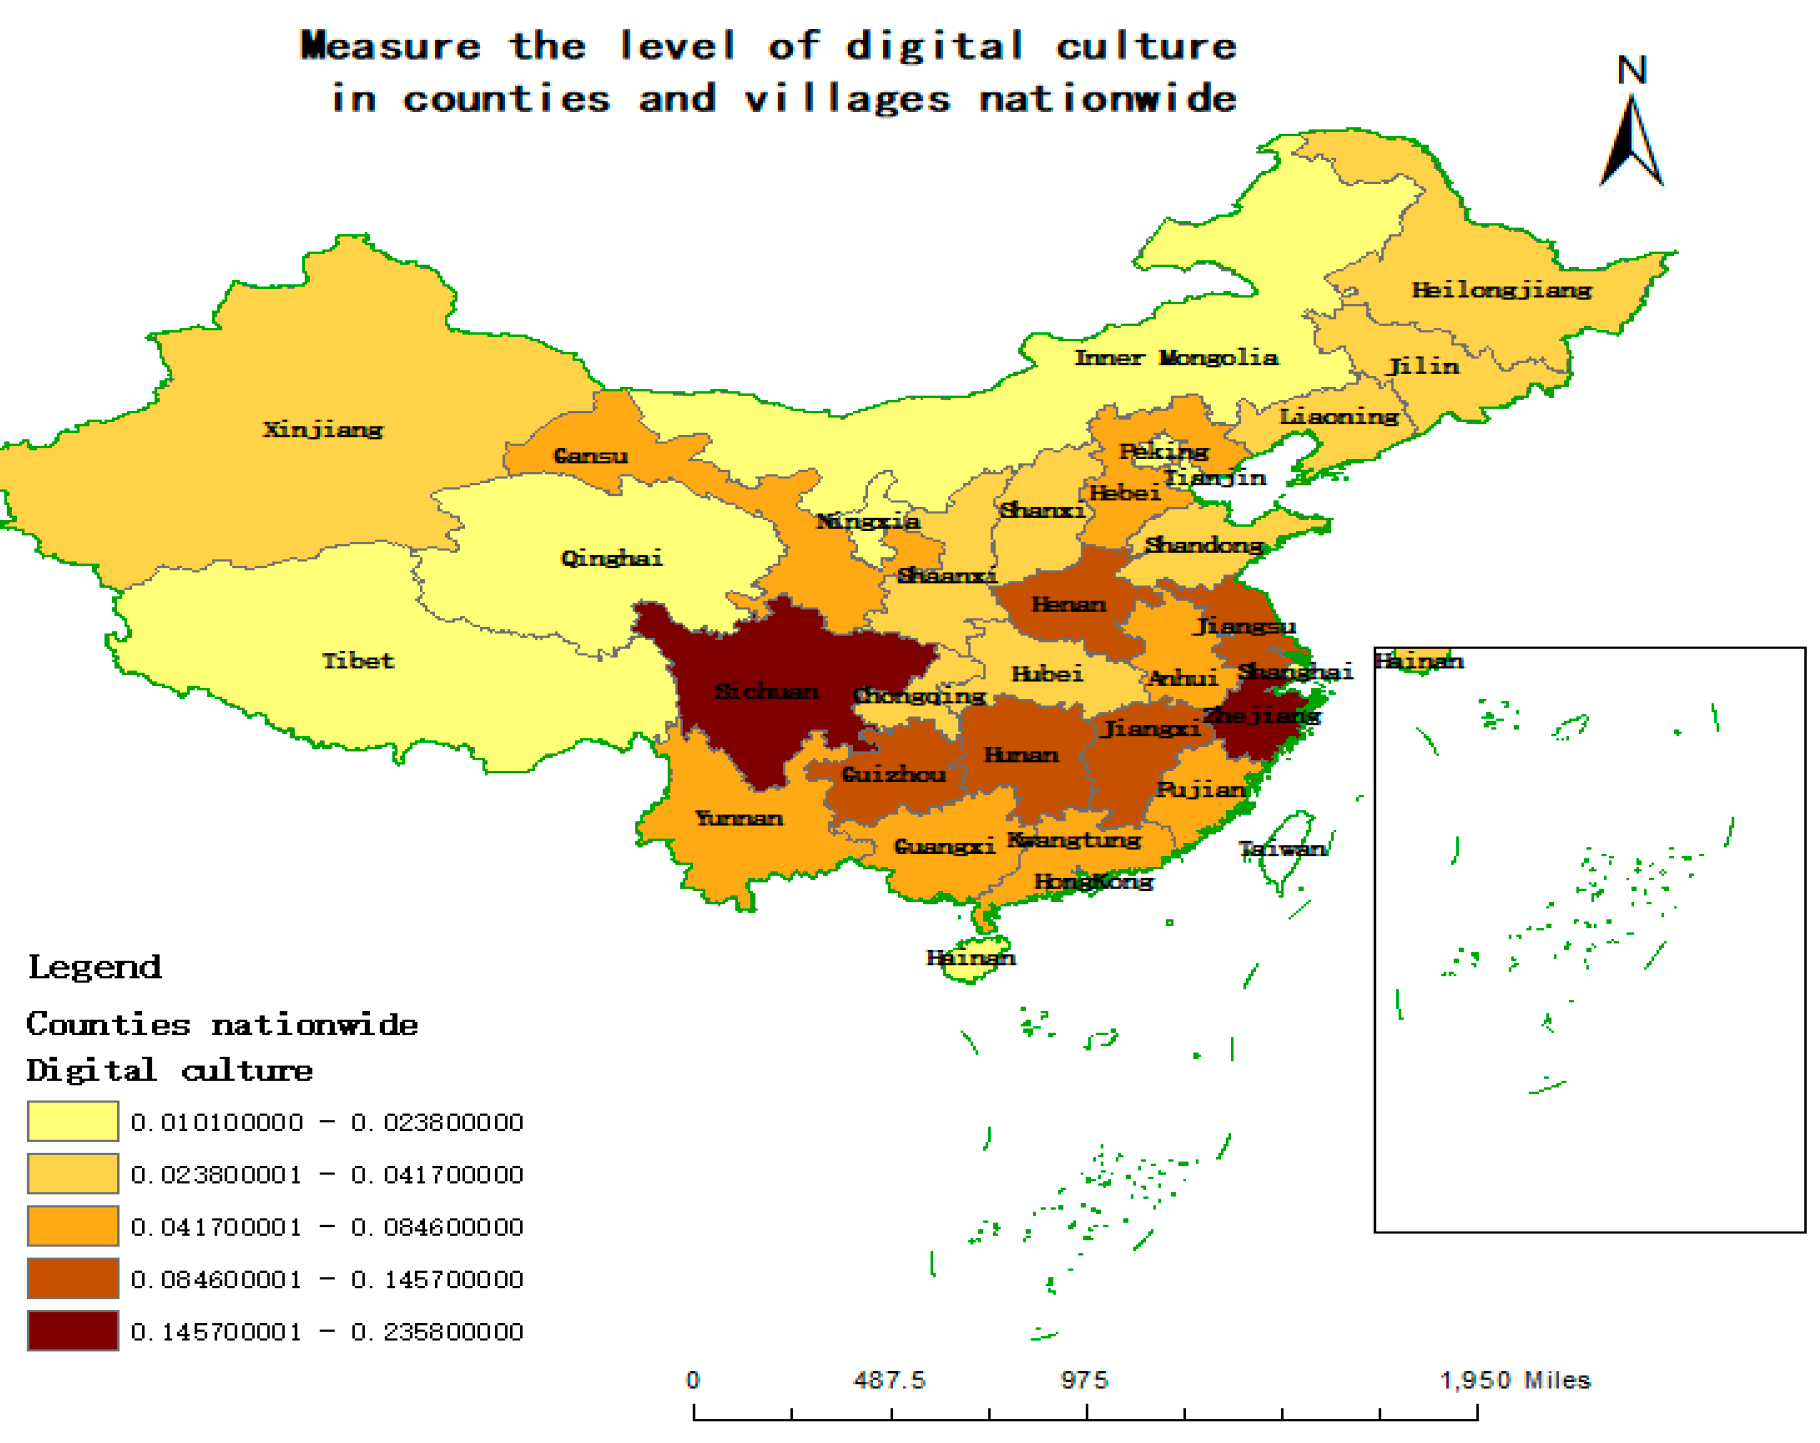
- The level of digital culture in counties mainly focuses on how to empower rural culture through digital communication. The mean value and median value of digital literacy level of 31 provinces and counties in China are 0.0411 and 0.0313. It can be seen from Figure 7 that the scores of 31 provinces and counties in this dimension are mostly distributed in the range of 0.0238-0.0846. Among them, Zhejiang Province ranked first with a score of 0.1939, and Sichuan and Guizhou ranked second and third, with Sichuan scoring more than 0.1000. In addition, the top five provinces and counties are Zhejiang, Sichuan, Guizhou, Hunan and Jiangxi, with a median value of 0.0819; The last five provinces and counties are successively Beijing, Hainan, Tianjin, Ningxia and Shanghai, with a median value of 0.0021, and the median value of the top five is about 39 times that of the bottom five, which indicates that there is an obvious gap in the digital literacy level among provinces and counties. It should be noted that in addition to Ningxia, the last five provinces and counties belong to the western region, and the remaining four provinces and counties are from the eastern region, while in the top five provinces and counties, except Zhejiang Province, the remaining four provinces and counties are from the central region and the western region, which indicates that there is also a significant gap in the level of digital culture within the region. Digital culture is the "soul project" of the normal development of digital governance, so the provinces and counties with low scores should pay attention to and strengthen the construction of digital culture level, such as the promotion and inheritance of rural culture more widely through digital technology and platforms, and effectively promote the development of rural tourism. In view of the fact that the promotion of digital culture level is an important means to promote the common prosperity of rural areas and plays an important role in the implementation of digital governance, the eastern and western regions still need to continue to strengthen the construction of this aspect, so as to effectively play the comprehensive driving role of digital culture in rural economic and social development at the county level.
- (4)
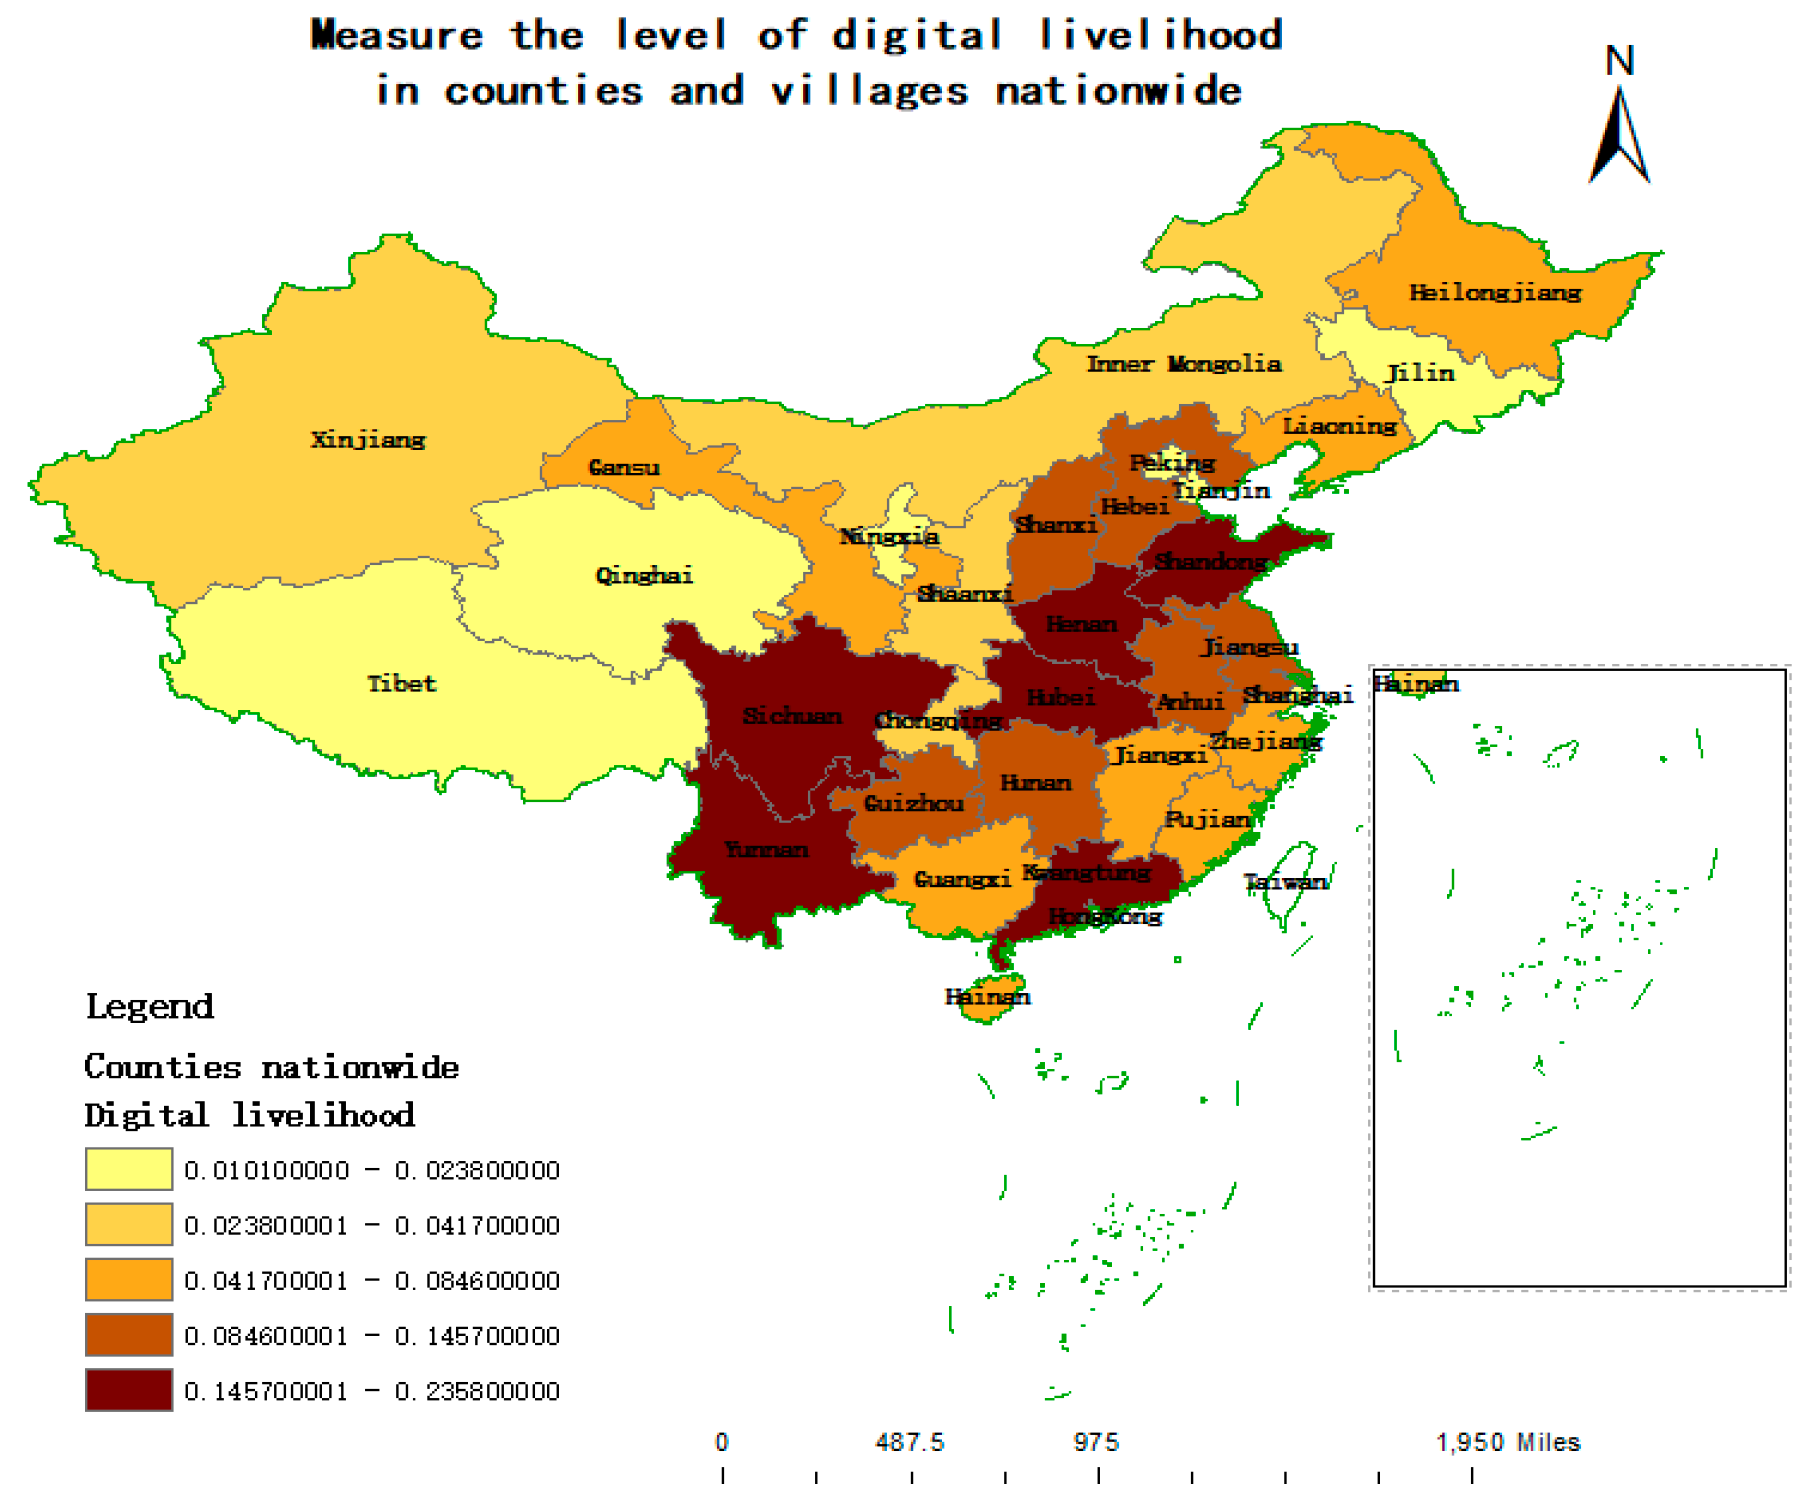
- County digital livelihood mainly reflects how to use digital platforms to promote the high-quality development of rural public services, mainly including education, medical care and other aspects. The average value and median value of the 31 provinces and counties in the country in the level of digital livelihood are 0.0936 and 0.0854. It can be seen from Figure 8 that the scores of the 31 provinces and counties in this dimension are mostly distributed in the range of 0.0417-0.1457. Among them, Guangdong Province ranked first with a score of 0.1787, and Henan and Yunnan ranked second and third with scores above 0.1600. In addition, the top five provinces and counties are Guangdong, Henan, Yunnan, Sichuan and Hubei, with a median value of 0.1603; The bottom five provinces and counties are Beijing, Shanghai, Tianjin, Qinghai and Tibet, showing that the eastern region accounts for the majority, and there are no provinces and counties in the central region. The median value of the top five is 0.0334, and the median value of the top five is about 4.8 times of the median value of the bottom five. This shows that there is a clear gap in the level of digital livelihood between provinces and counties. Digital people's livelihood is an important guarantee for the normal development of digital governance, which is related to all aspects of rural villagers' lives. Therefore, provinces and counties with low scores, especially those in the western region, should attach importance to and strengthen the construction of digital people's livelihood, such as maintaining investment in people's livelihood and improving rural public services. In view of the fact that the level of digital livelihood is an important measure to promote the upgrading of rural digital governance, which can effectively improve the governance efficiency, the central and western regions still need to strengthen the construction of this aspect, so as to comprehensively improve the sense of gain, happiness and security of farmers.
- (5)
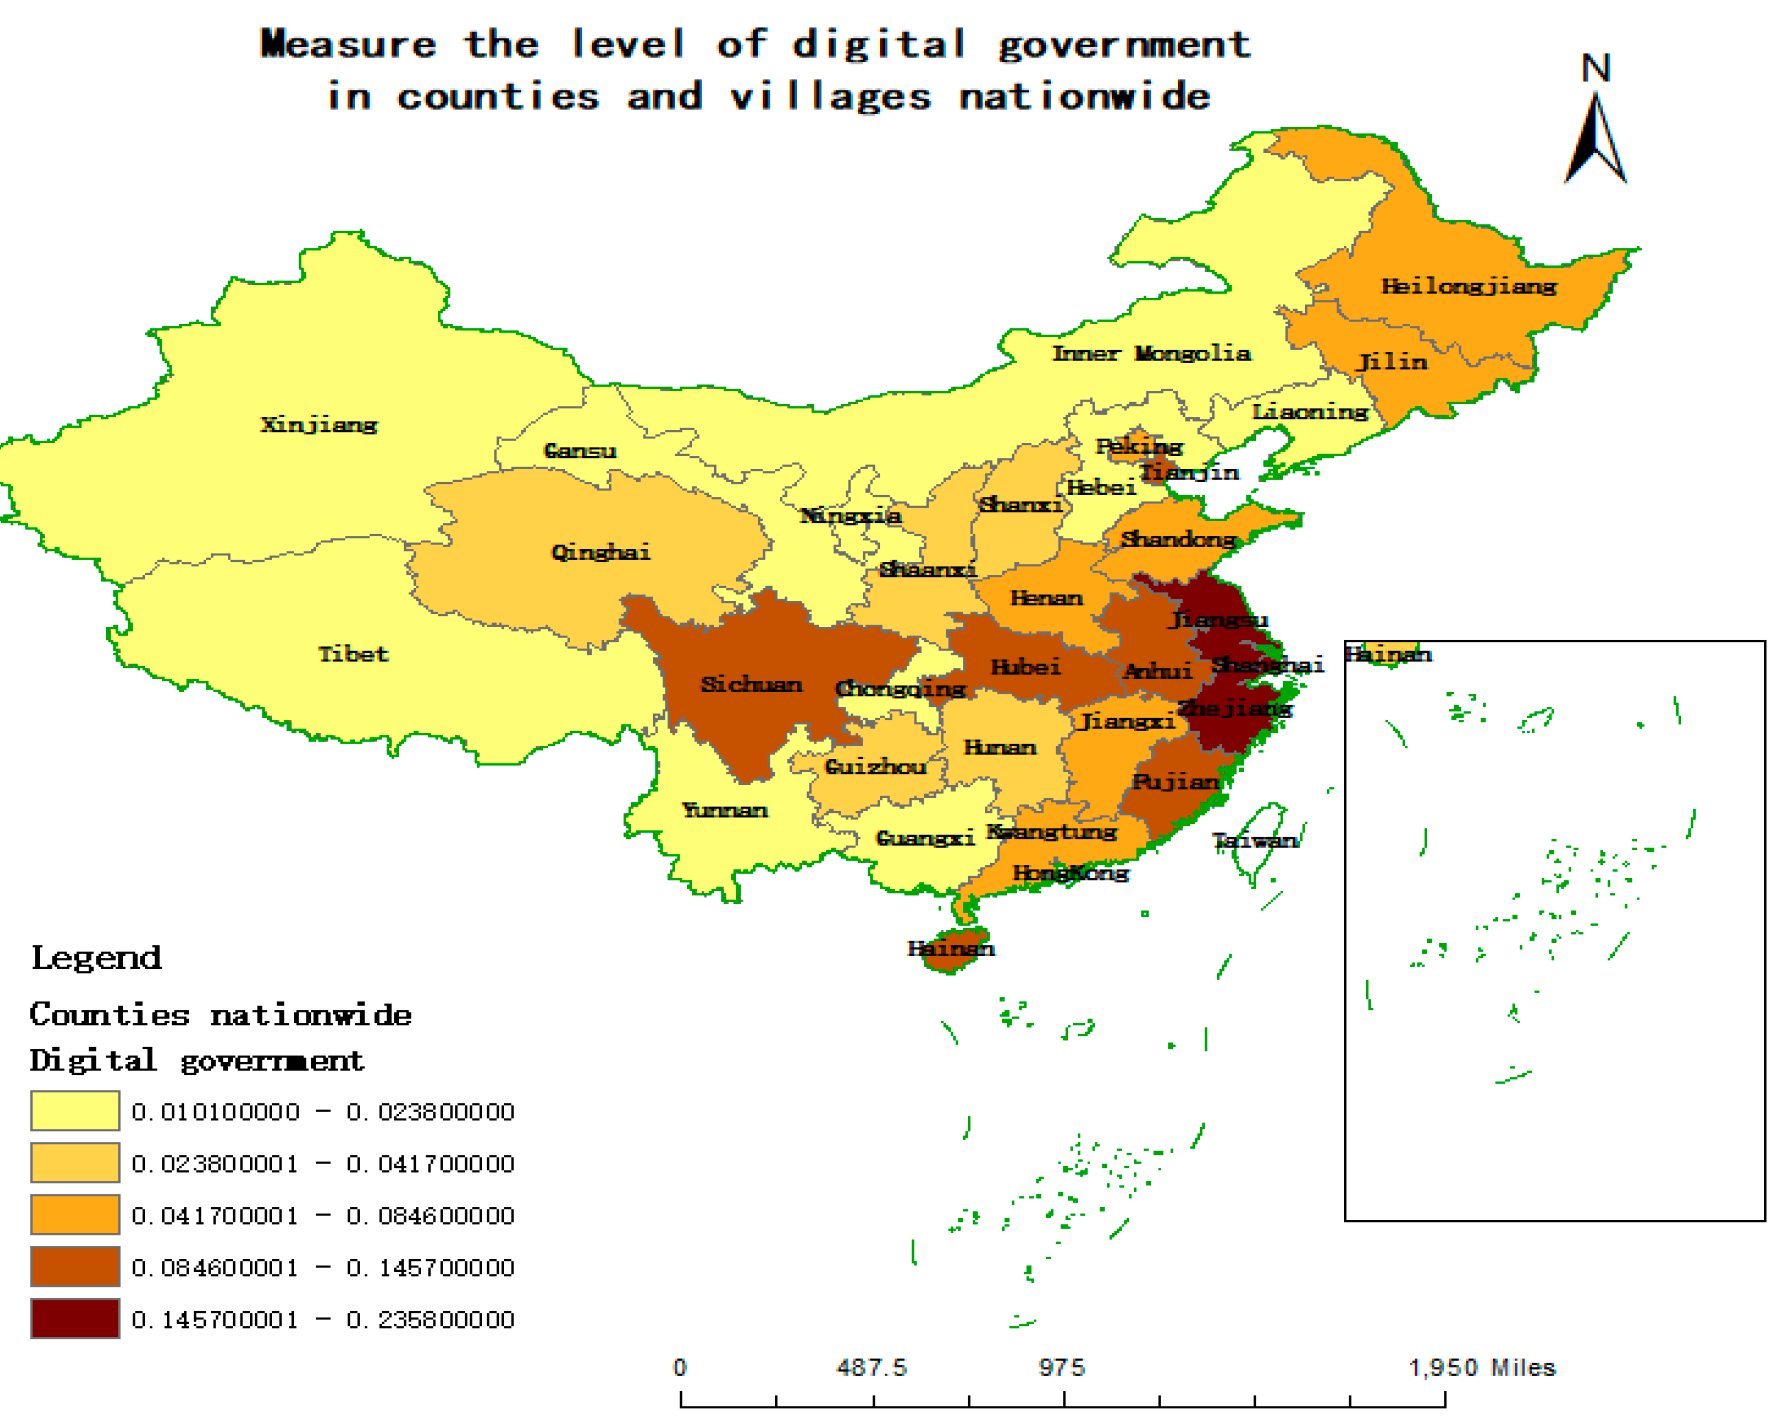
- The key area of county digital government level is how to achieve sustainable development and digital transformation of rural society through technology embedding. The average and median values of the 31 provinces and counties in China in the level of digital government affairs are 0.0380 and 0.0387. It can be seen from Figure 9 that the scores of the 31 provinces and counties in this dimension are mostly distributed in the range of 0.0238-0.0846. Among them, Zhejiang Province ranked first with a score of 0.0899, while Shanghai and Jiangsu ranked second and third with scores above 0.0800. In addition, the top five provinces and counties are Zhejiang, Shanghai, Jiangsu, Hubei and Anhui, with a median value of 0.0837; The bottom five provinces and counties are Ningxia, Liaoning, Yunnan, Xinjiang and Tibet, with a median value of 0.0095, and the median value of the top five is about 8.81 times that of the bottom five, indicating that there is an obvious gap in the level of digital government among provinces and counties. Digital government affairs is the extension of "Internet + government affairs services" to the countryside, making full use of information means to do a comprehensive and efficient job in government affairs services. Therefore, provinces and counties with low scores, especially those in the western region, should pay attention to and strengthen the construction of digital government affairs. For example, digital government will continue to play a positive role in policy communication, public opinion transmission, open village affairs, dispute mediation, etc., and fully protect the villagers' right to supervision and participation.
5. Conclusion and suggestion
5.1. Research conclusion
5.2. Suggestions
5.3. Limitation
Funding
References
- ZHAO Xingyu, Wang Guibin, Yang Peng. Digital village construction under the background of rural revitalization strategy [J]. Journal of Northwest A&F University (Social Science Edition),2022,22(06):52-58.
- Li Jieyi, Hu Jinglan, Ma Zihan. Rural revitalization: Theoretical mechanism, practical Path and policy implications [J/OL]. Southwest Finance :1-12[2022-11-14].
- Liu Yan-Hong, Lv Peng. Objectives, achievements and challenges of digital village construction [J/OL]. Economy and Management :1-9[2022-11-14].
- Liu Junxiang, Zeng Sen. Intellectual attributes, top-level design and exploratory practice of rural digital governance in China [J]. Journal of Lanzhou University (Social Sciences Edition), 2019,48(01):64-71. (in Chinese)
- Zhang Zhaosu. Participation in dilemma, scene upgrading and panoramic governance of digital countryside: A case study of "One Map of Digital Countryside" governance platform in Huzhou City [J]. Zhejiang Journal,2022(05):88-99.
- Wu Xiaolong. Why Digital rural governance is possible: an overall analytical framework [J]. E-government,2022(06):37-48.
- Cui Yuanpei, Wei Zkun, Xue Qinglin. Innovation logic and orientation of rural digital governance during the 14th Five-Year Plan period [J]. Social Sciences of Ningxia,2022(01):103-110.
- Ding B. Digital empowerment or digital burden: Practical logic and governance reflection of digital rural governance [J]. E-government,2022(08):32-40.
- Huang Xinhua, Chen Baoling. Governance dilemma, digital empowerment and institutional supply: The realistic logic of the digital transformation of grassroots governance [J]. Journal of Theory,2022(01):144-151.
- Zhao Xiaofeng, Liu Haiying. Digital rural governance: Theoretical origins, development opportunities and unintended consequences [J]. Academia,2022(07):125-133. (in Chinese)
- Li Xiaoxia, Zhao Xiufeng, Zhang Tianzi. Digital rural governance: Practical basis, key issues and optimization strategies [J]. Journal of Agricultural Economics,2022(02):42-44.
- Yang Yulei. Research on evaluation of rural digital governance readiness in Anhui Province [J]. Journal of Taiyuan University (Social Sciences Edition),2022,23(05):30-40.
- Zhu Honggen, Chen Hui. The horizontal measurement, spatial-temporal evolution and advancing path of digital countryside development in China [J/OL]. Agricultural economic problems :1-14[2022-11-15].
- Zhang Hong, Du Kaiwen, Jin Bingyan. Research on Evaluation of Digital rural development Readiness under Rural Revitalization Strategy [J]. Journal of Xi 'an University of Finance and Economics, 2019,33(01):51-60.
- Wu Xiaolong. Why digital rural governance is possible: an overall analysis framework [J]. E-government,2022(06):37-48.
- Luo M Y. 5G new infrastructure enables the digital transformation of rural industry [J]. China Fruit Trees,2022(11):131. (in Chinese).
- Yan Jie, Guo Guo Ling, Liu Qingjuan. Financial inclusion, income increase and rural revitalization: Evidence from microfinance for poverty alleviation [J]. Jiangsu Agricultural Sciences, 2019,50(11):245-254.
- Nie Zhuming, Shi Yuhan. "Internet Plus" to promote targeted poverty alleviation through education: Problems, directions and paths [J]. Research on audio-visual Education, 21,42(12):48-54.
- Yang Y. Evaluation of weighting method in multi-index comprehensive evaluation. Statistics and Decision,2006(13):17-19. (in Chinese).
- Liu Qing, Chen Zhuanqing. Research on digital village measurement model based on entropy weight TOPSIS method [J]. Fuzzy Systems and Mathematics,2023,37(04):137-150. (in Chinese)
- Yang Shasha, Cheng Yin, Tang Tingting. Spatial and temporal differentiation and optimization path of digitalization and ecological civilization construction in urban agglomerations in China [J]. Statistics and Decision,2023,39(14):39-45. (in Chinese)
- Fan Y X, Lei S P. Evaluation and key driving forces of urban livability in Shaanxi Province under the overall layout of "five in one" [J/OL]. Journal of Peking University (Natural Science):1-14[2023-09-13].
- Wu Zenghai, Li Tao. Research on Spatial distribution of comprehensive performance in high-tech development zones: An analysis based on natural breakpoint method [J]. Statistics and Information Forum,2013,28(03):82-88.
| Primary indicator layer | Secondary indicator layer | Attribute | Indicator source |
|---|---|---|---|
| Digital Economy | Digital Infrastructure Index | + | National Digital Rural Index (2020) |
| The proportion of Taobao villages in all administrative villages | + | China's Taobao Village Research Report (2021) | |
| Agricultural products live commodity delivery rate | + | Oteo Consulting (2021) | |
| Rural Financial Inclusion Digital Index | + | Peking University Digital Financial Inclusion Index (2021) | |
| Digital ecology | Local fiscal expenditures for agriculture, forestry and water conservancy affairs | + | National Bureau of Statistics (2021) |
| Green development of digital agriculture | + | Zhang Hong (2021) | |
| Digital production index | + | National Digital Rural Index (2020) | |
| Agricultural and rural informatization production environment | + | Zhang Hong (2021) | |
| Digital culture | Number of county-level financial media centers | + | Digital Village Development Action Plan (2021) |
| County tourism comprehensive strength top 100 | + | National County Tourism Research Report 2021 | |
| Number of township cultural stations | + | China Rural Statistical Yearbook (2021) | |
| Digital livelihood | The proportion of rural education expenditure | + | China Rural Statistical Yearbook (2021) |
| Rural distance education coverage | + | Digital Village Development Action Plan (2021) | |
| Number of new rural cooperative medical care | + | National Bureau of Statistics (2021) | |
| Local government medical expenditure | + | National Bureau of Statistics (2021) | |
| Rural Employment (Primary industry) | + | China Rural Statistical Yearbook (2021) | |
| The number of new professional farmer training | + | National Report on the Development of New Professional Farmers | |
| Digital government | The proportion of villages and towns on wechat public service platform | + | National Digital Rural Index (2021) |
| The proportion of rural government information disclosed online | + | National Bureau of Agriculture and Rural Affairs of Cities and Counties (2021) | |
| "Xueliang Project" administrative village coverage | + | Digital Village Development Action Plan (2021) |
| Primary indicator layer | weight | Secondary indicator layer | weight |
|---|---|---|---|
| Digital Economy | 0.2618 | Digital Infrastructure Index | 0.0134 |
| The proportion of Taobao villages in all administrative villages | 0.2061 | ||
| Agricultural products live commodity delivery rate | 0.0441 | ||
| Rural Financial Inclusion Digital Index | 0.0088 | ||
| Digital ecology | 0.1353 | Local fiscal expenditures for agriculture, forestry and water conservancy affairs | 0.0271 |
| Green development of digital agriculture | 0.0138 | ||
| Digital production index | 0.0613 | ||
| Agricultural and rural informatization production environment | 0.0385 | ||
| Digital culture | 0.3387 | Number of county-level financial media centers | 0.0523 |
| County tourism comprehensive strength top 100 | 0.1715 | ||
| Number of township cultural stations | 0.0406 | ||
| Digital livelihood | 0.1490 | The proportion of rural education expenditure | 0.0190 |
| Rural distance education coverage | 0.0240 | ||
| Number of new rural cooperative medical care | 0.0343 | ||
| Local government medical expenditure | 0.0413 | ||
| Rural Employment (Primary industry) | 0.0667 | ||
| The number of new professional farmer training | 0.0473 | ||
| Digital government | 0.1152 | The proportion of villages and towns on wechat public service platform | 0.0094 |
| The proportion of rural government information disclosed online | 0.0057 | ||
| "Xueliang Project" administrative village coverage | 0.0749 |
| Regional | Digital economy | Digital ecology | Digital culture | Digital livelihood | Digital government | Total score | Rank |
|---|---|---|---|---|---|---|---|
| Eastern region | 0.0769 | 0.0608 | 0.0406 | 0.0978 | 0.0506 | 0.3267 | - |
| Peking | 0.0417 | 0.0324 | 0.0026 | 0.0435 | 0.0387 | 0.1591 | 28 |
| Tianjin | 0.0289 | 0.0276 | 0.0021 | 0.0334 | 0.0532 | 0.1452 | 30 |
| Jiangsu | 0.0978 | 0.1114 | 0.0590 | 0.1140 | 0.0837 | 0.4659 | 3 |
| Liaoning | 0.0246 | 0.0284 | 0.0186 | 0.0793 | 0.0107 | 0.1616 | 27 |
| Shanghai | 0.0270 | 0.0364 | 0.0018 | 0.0376 | 0.0866 | 0.1894 | 19 |
| Zhejiang | 0.2358 | 0.1010 | 0.1939 | 0.0842 | 0.0899 | 0.7047 | 1 |
| Kwangtung | 0.1457 | 0.0849 | 0.0338 | 0.1787 | 0.0391 | 0.4822 | 2 |
| Shandong | 0.1013 | 0.0831 | 0.0313 | 0.1361 | 0.0457 | 0.3974 | 5 |
| Hebei | 0.0765 | 0.0811 | 0.0422 | 0.1165 | 0.0135 | 0.3297 | 8 |
| Henan | 0.0398 | 0.0691 | 0.0583 | 0.1683 | 0.0406 | 0.3761 | 6 |
| Hainan | 0.0273 | 0.0133 | 0.0025 | 0.0844 | 0.0553 | 0.1828 | 21 |
| Central region | 0.0334 | 0.0461 | 0.0565 | 0.1057 | 0.0489 | 0.2907 | - |
| Shanxi | 0.0255 | 0.0163 | 0.0287 | 0.0994 | 0.0307 | 0.2007 | 17 |
| Ji Lin. | 0.0249 | 0.0381 | 0.0207 | 0.0443 | 0.0436 | 0.1716 | 24 |
| Sichuan | 0.0226 | 0.0577 | 0.1419 | 0.1518 | 0.0559 | 0.4300 | 4 |
| Anhui | 0.0232 | 0.0568 | 0.0384 | 0.1111 | 0.0616 | 0.2912 | 12 |
| Jiangxi | 0.0345 | 0.0425 | 0.0717 | 0.0887 | 0.0459 | 0.2833 | 14 |
| Fujian | 0.0846 | 0.0545 | 0.0466 | 0.0876 | 0.0593 | 0.3327 | 7 |
| Hunan | 0.0225 | 0.0538 | 0.0739 | 0.1189 | 0.0296 | 0.2986 | 11 |
| Hubei | 0.0294 | 0.0494 | 0.0304 | 0.1435 | 0.0647 | 0.3174 | 9 |
| Western region | 0.0229 | 0.0334 | 0.0275 | 0.0759 | 0.0179 | 0.1776 | - |
| Inner Mongolia | 0.0153 | 0.0402 | 0.0125 | 0.0744 | 0.0121 | 0.1545 | 29 |
| Guangxi | 0.0238 | 0.0394 | 0.0348 | 0.0794 | 0.0130 | 0.1905 | 18 |
| Chongqing | 0.0182 | 0.0393 | 0.0268 | 0.0720 | 0.0129 | 0.1692 | 25 |
| Heilongjiang | 0.0162 | 0.0468 | 0.0249 | 0.0856 | 0.0419 | 0.2154 | 16 |
| Guizhou | 0.0182 | 0.0339 | 0.0819 | 0.1044 | 0.0299 | 0.2684 | 15 |
| Yunnan | 0.0589 | 0.0394 | 0.0442 | 0.1603 | 0.0095 | 0.3124 | 10 |
| Xizang. | 0.0186 | 0.0137 | 0.0066 | 0.0274 | 0.0045 | 0.0708 | 33 |
| Shaanxi | 0.0270 | 0.0376 | 0.0247 | 0.0649 | 0.0312 | 0.1853 | 20 |
| Gansu | 0.0193 | 0.0288 | 0.0354 | 0.0854 | 0.0122 | 0.1810 | 22 |
| Qinghai | 0.0200 | 0.0164 | 0.0038 | 0.0313 | 0.0269 | 0.0985 | 32 |
| Ningxia | 0.0293 | 0.0263 | 0.0020 | 0.0483 | 0.0114 | 0.1172 | 31 |
| Xinjiang | 0.0101 | 0.0389 | 0.0321 | 0.0772 | 0.0094 | 0.1678 | 26 |
| National average | 0.0449 | 0.0467 | 0.0412 | 0.0933 | 0.0381 | 0.2643 | - |
| Area type | Counties | level |
|---|---|---|
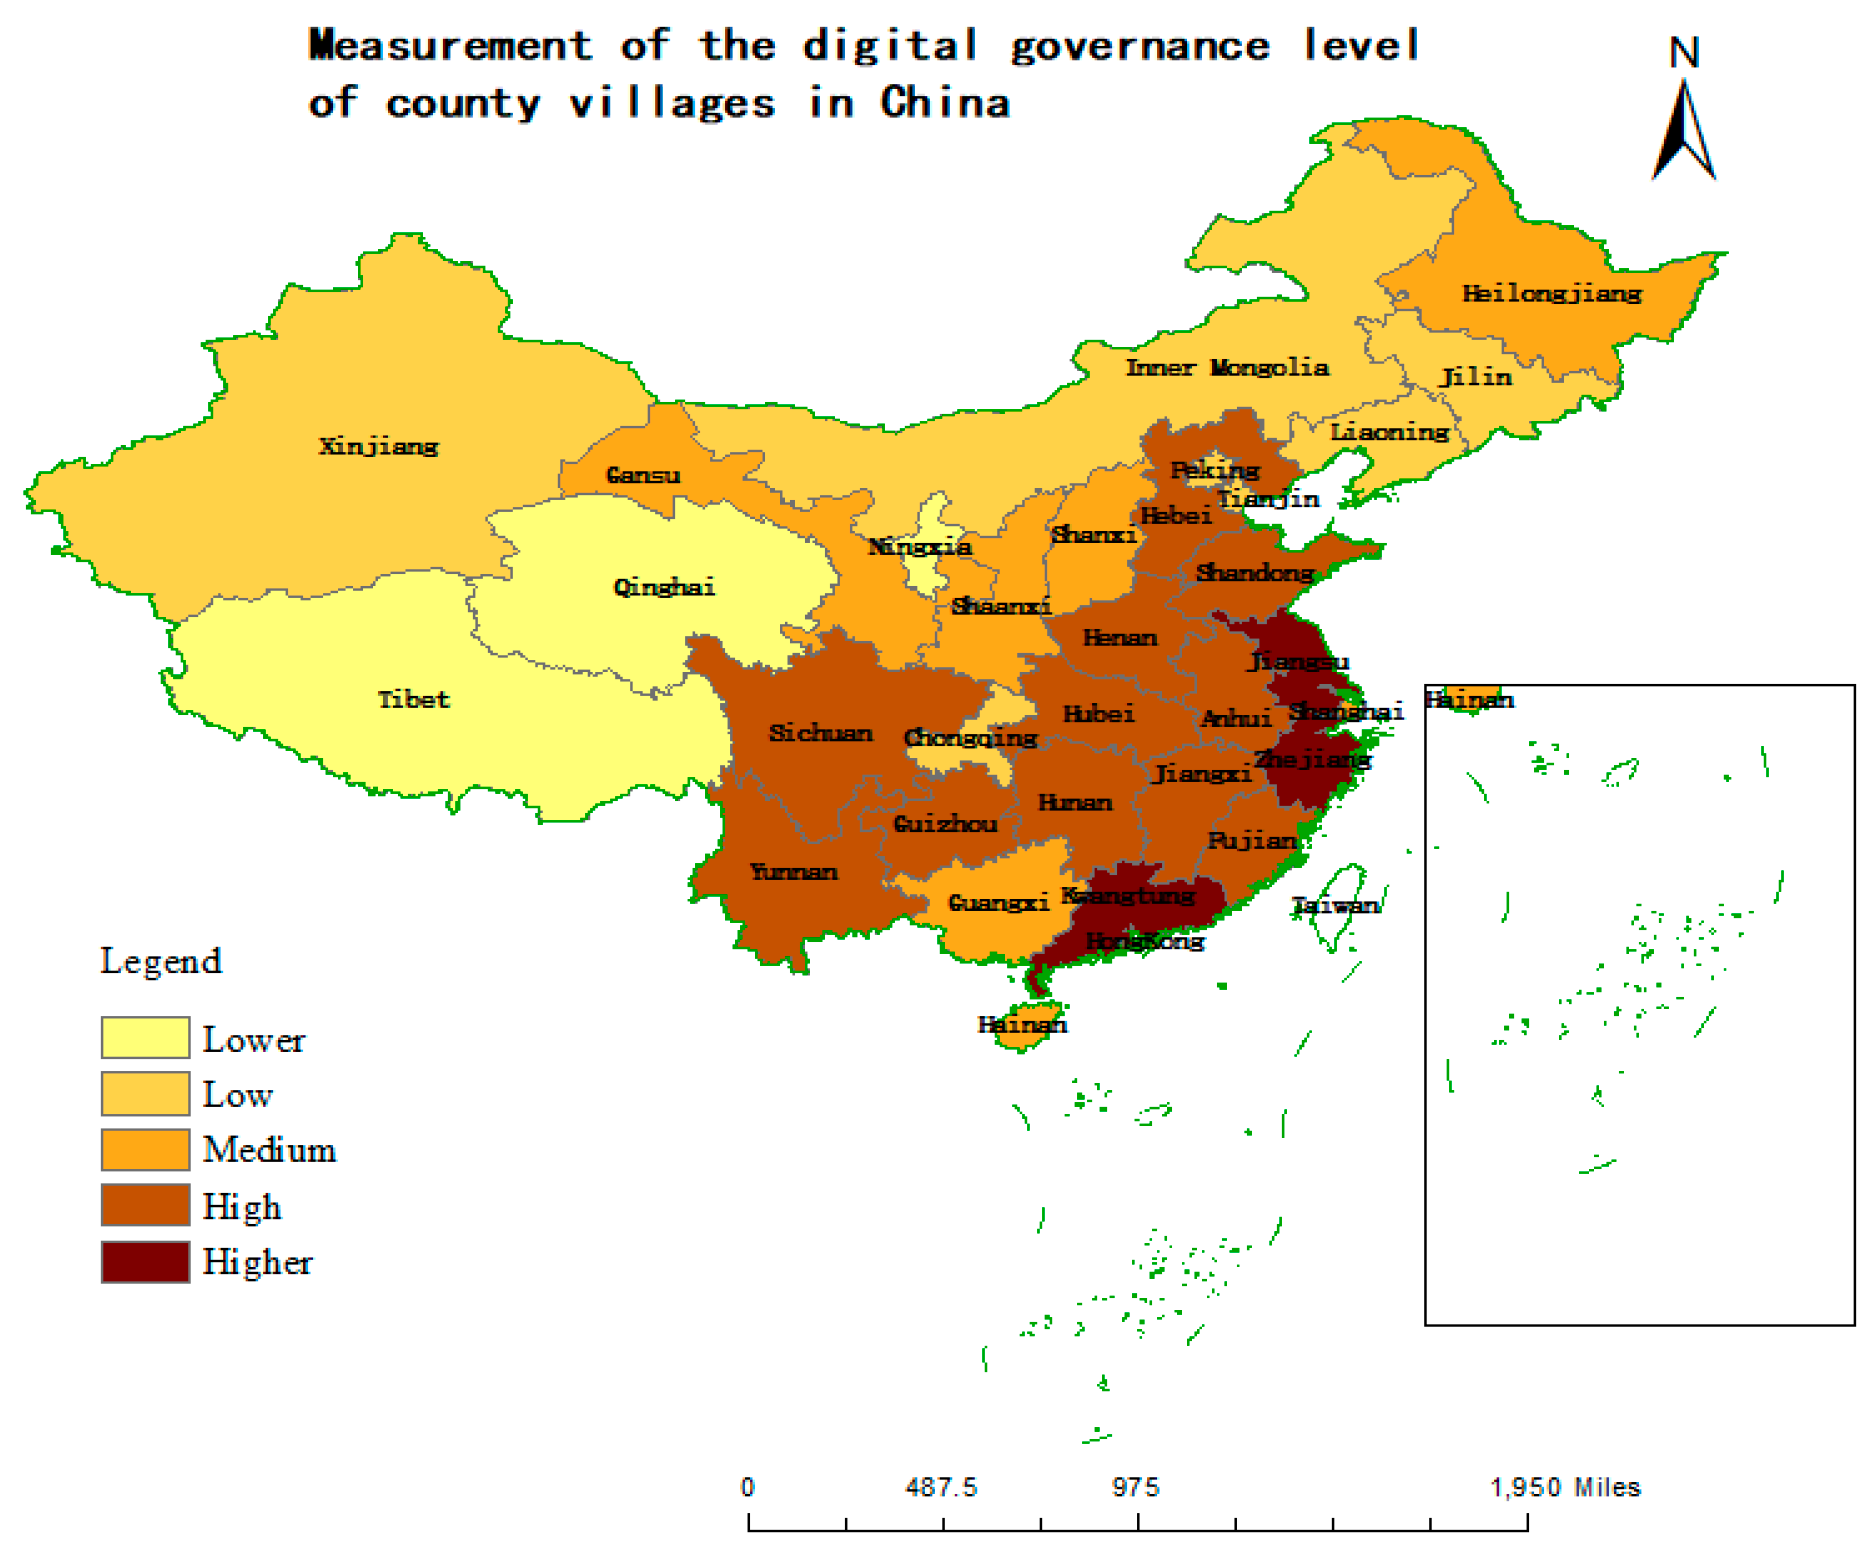
| S≥0.430001 | Zhejiang, Jiangsu, Guangdong | Higher |
| 0.215401≤S<0.430000 | Sichuan, Shandong, Henan, Fujian, Hebei, Hubei, Yunnan, Hunan, Anhui, Jiangxi, Guizhou, Heilongjiang | High |
| 0.171601≤S<0.215400 | Shanxi, Guangxi, Shanghai, Shaanxi, Hainan, Gansu, Jilin | Medium |
| 0.117201≤S<0.171600 | Chongqing, Xinjiang, Liaoning, Beijing, Inner Mongolia, Tianjin | Low |
| S<0.117200 | Ningxia, Qinghai, Tibet | Lower |
Disclaimer/Publisher’s Note: The statements, opinions and data contained in all publications are solely those of the individual author(s) and contributor(s) and not of MDPI and/or the editor(s). MDPI and/or the editor(s) disclaim responsibility for any injury to people or property resulting from any ideas, methods, instructions or products referred to in the content. |
© 2023 by the authors. Licensee MDPI, Basel, Switzerland. This article is an open access article distributed under the terms and conditions of the Creative Commons Attribution (CC BY) license (http://creativecommons.org/licenses/by/4.0/).


