
Submitted:
10 December 2023
Posted:
11 December 2023
You are already at the latest version
Abstract
High levels of groundwater containing both arsenic and fluorine are prevalent, resulting in serious health problems when consumed as drinking water. This co-pollution phenomenon is widespread and requires urgent attention. The multiple forms of arsenic and arsenic-fluorine co-contamination pose a significant challenge to efficiently co-remove both substances. This research utilized a green and stable synthesis approach to create MgLaFe LDO heterostructures, which were anchored on α-MnO2 nanowires. The materials comprise magnesium and lanthanum elements with a powerful attraction towards fluoride ions, elemental iron, which can establish stable compounds with arsenate, and MnO2, which can effectively oxidize arsenous acid, thereby enabling efficient co-removal of arsenic and fluorine. The efficient oxidation process of the MnO2 nanowire and the prompt ion adsorption process of the LDO work together synergistically. The adsorption performance was assessed through isotherm and kinetic fitting. Chemisorption was found to be the process for As(Ⅲ), As(V), and F- adsorption, with As(Ⅲ) going through monolayer adsorption on the surface of MnO2 nanowires, while As(V) and F- were mainly adsorbed by multilayer process on LDO. The maximum adsorption capacities were 111.76 mg/g, 230.51 mg/g, and 765.10 mg/g for As(Ⅲ), As(V), and F-, respectively. The XPS analysis provided further elucidation on the adsorption mechanism of the MnO2@LDO heterostructure, detailing each component's role in the process. The results confirm the successful construction of the heterostructure and its efficient coupling of oxidation and adsorption.
Keywords:
adsorption
; arsenic
; fluorine
; manganese
; LDO
; heterostructure
1. Introduction
Groundwater contamination due to arsenic and fluorine is prevalent worldwide and exhibits geographic variations[1]. Arid and semi-arid regions encounter single-element contamination and compound contamination of these elements, especially in closed-flow and inland river areas with high groundwater mineralization[2]. Consistent long-term consumption of such water carries varying degrees of arsenic and fluoride toxicity, having severe negative impacts on human health (according to the World Health Organisation, the maximum permissible of arsenic and fluoride in drinking water are 10ppb and 1.5ppm, respectively[3]). Ingestion of contaminated water can negatively impact individual and collective human health. Excessive fluoride consumption can lead to fluorosis, which damages the central nervous and reproductive systems and may cause cancer[4]. On the other hand, arsenic poisoning can result in abnormal skin pigmentation, keratinization, skin cancer, and internal organ cancer[5]. Currently, the principal techniques employed to eliminate arsenic and fluoride from drinking water include membrane separation[6], coagulation-precipitation[7,8], and adsorption technology[9,10]. The adsorption technique, in particular, offers distinct advantages for the co-removal of arsenic and fluorine, including high ion removal efficiency, operational simplicity, no secondary pollution, and no wastewater. It primarily utilizes the adsorbent's high specific surface area, well-developed pore structure, and wealthy functional groups to capture arsenic and fluorine ions[11].
Currently, most research is focused on the adsorption of pentavalent arsenic (As(V)) and fluoride ions (F-) in groundwater or the removal of trivalent arsenic (As(Ⅲ)) alone. Arsenic ions possess two valence states in groundwater, of which As(Ⅲ) is more hazardous to human well-being than As(V). As(Ⅲ) generally occurs as a molecule in groundwater; therefore, it exhibits different removal mechanisms than As(V) and F-[12]. Common materials like TiO2[13] and MnO2[14] can effectively remove trivalent arsenic through oxidation. Zero-valent iron nanoparticles[15], hydroxyl iron oxides[10,16,17], and lanthanum hydroxide[18] are common adsorption materials for As(V) and F-. These materials have a more substantial binding capacity than porous mineral and carbon adsorption materials[19]. Fewer studies have been conducted on achieving high efficiency when removing As(Ⅲ), As(V), and F- simultaneously. More than individual removal is needed in groundwater environments where arsenic and fluorine frequently coexist to achieve efficient water purification. Moreover, there is a risk of competition for adsorption sites for anions. Therefore, finding ways to couple oxidative and anion adsorption capacity to achieve efficient co-adsorption proves challenging.
Manganese (Mn) is a highly abundant element on Earth that is non-toxic and inexpensive[20]. In addition, the α-MnO2 crystalline form exhibits a nanowire morphology with a double tunnel structure, providing efficient oxidation capacity and a high surface area and metal-carrier solid interactions compared to other crystalline forms[21]. In recent years, there has been growing research interest in layered double hydroxides (LDH) and their calcined derivatives, layered double oxides (LDO), due to their noteworthy chemical stability, large specific surface area, low cost, and high ion-exchange capacity[22,23]. Currently, studies are investigating the efficacy of forming heterostructures with LDH and α-MnO2 nanowires to create supercapacitors[21], catalysts[24], and other devices[25]. Nevertheless, limited research exists on using this heterostructure material for groundwater purification. This study employed a one-step hydrothermal method to synthesize α-MnO2 nanowires. These nanowires were subsequently used as the surface for anchoring Mg2+, La3+, and Fe3+ ions, forming MnO2@LDO materials with heterostructures following calcination. The study investigated the morphological structure and adsorption performance of MnO2@LDO, MnO2 NW, and MgLaFe LDO. Moreover, the adsorption mechanism of MnO2@LDO was further explored.
2. Materials and Methods
2.1. Materials
Potassium permanganate (KMnO4); Manganese sulfate (MnSO4·H2O); Magnesium nitrate (Mg(NO3)2∙6H2O); Lanthanum nitrate (La(NO3)3∙6H2O); Ferric nitrates (Fe(NO3)3∙9H2O); Sodium fluoride (NaF); sodium hydroxide (NaOH) supplied by Sinopharm Chemical Reagent Co., Ltd. (Shanghai, China). Urea and other regents were obtained from Aladdin (Shanghai, China). Experimental As (Ⅲ) solution was prepared by dissolving NaAsO2 and As (Ⅴ) solution was prepared by dissolving Na2HAsO4∙7H2O in nitric acid. Arsenic (As) standard stock solutions in HNO3 (Sigma Aldrich) was used for preparation calibration standards. pH modification of the experimental simulated solutions was carried out using HNO3 and NaOH. All the Chemical reagents were of analytical grade and used without further purification. Ultra-pure water (18.2 MΩ·cm) was used for the preparation of all solutions.
2.2. Synthesis of MnO2 Nanowires
A simple one-step hydrothermal method was used to prepare α-MnO2 nanowires. Initially, 2 mmol KMnO4 (0.3160 g) and 3 mmol MnSO4-H2O (0.5072 g) were dissolved in 40 mL of deionised water and stirred for 5 minutes until the MnSO4 solution became clear. Subsequently, KMnO4 solution was added gradually to the aforementioned MnSO4 solution to obtain a brown suspension, which was stirred for a further 30 minutes. The brown suspension was stirred, then transferred to a reaction kettle with a capacity of 100 mL and hydrothermally heated to 160℃ for 12 hours. Then the brown-black solid obtained through hydrothermal heating was washed three times with ethanol and deionised water, and subsequently centrifuged and dried at 100 ℃ overnight. The α-MnO2 nanowires (MnO2 NW) were obtained by grinding.
2.3. Synthesis of MnO2 Nanowires@MgLaFe LDO
The reaction mixture was prepared by 0.2 M solutions of related salts where the used amounts were: Mg(NO3)2·6H2O (20 mL), La(NO3)3·3H2O (5 mL) and Fe(NO3)3·9H2O (5 mL). The volume was completed by distillated water up to 70 mL and 10 g urea was added. Then the brown MnO2 nanowires were dispersed into the mixture above and stirred at 80 ℃ in a water bath for 10 h. Afterward, the precipitates were filtered, washed with deionized water, and dried at 60 ℃ overnight. Then the obtained powder was calcined at 350 ℃ for 5 h with heating rate of 0.8 ℃/min to obtain the stable MnO2 nanowires@MgLaFe LDO (MnO2@LDO).
2.4. Synthesis of MgLaFe LDO
The MgLaFe LDO was prepared by the same route with MnO2@LDO, but without the MnO2 NW added.
2.5. Adsorbent characterization techniques
Scanning electron microscopy (SEM) was obtained with an TESCAN MIRA field emission scanning electron microscope. Transmission electron microscopy (TEM) was using a Talos F200X G2 microscope. The X-ray diffraction (XRD) data were acquired on Rigaku SmartLab SE (diffractometer with graphite monochromatized Cu Kα irradiation, λ = 1.540598 Å). The Fourier transform infrared (FT-IR) spectra were performed on a Thermo Scientific Nicolet iS20. The X-ray photo-electronic spectroscopy (XPS) was measured on a Thermo Scientific ESCALAB 250Xi electron spectrometer. Nitrogen adsorption-desorption isotherms were performed at 77 K was applied to determine the specific surface area of samples using Micromeritics ASAP 2460 equipment.
2.6. Measurement method
The concentration of fluoride ions was determined by the method of standard addition using a fluoride ion selective electrode (F-ISE) by Thermo Scientific. Total Ionic Strength Adjustment Buffer IV (TISAB IV) with tartrate was added to stabilize ionic strength and pH of the fluoride containing solution. The concentration of As(Ⅲ) and As(V) ions was measured by Inductively Coupled Plasma-Optical Emission Spectroscopy (ICP-OES). The aqueous sample solutions for ICP-OES analysis were diluted with 2% nitric acid (HNO3).
2.7. Adsorption experiments
The adsorption experiments in terms of pH value, contact time and initial concentration were performed to evaluate the simultaneous sorption performance of As(Ⅲ), As(V), and F-. The system pH (3.0–11.0) was adjusted with negligible dilute HCl or NaOH. Then, the mixture suspension was shaken at 120 rpm at 303 K. All samples were taken and filtered by qualitative filter paper before instrument analysis. Samples were collected for hazardous ions concentration analysis at specific time intervals from 5 to 720 min. Adsorption isotherm experiments were conducted with initial concentrations of As(Ⅲ), As(V), and F- ranging from 5 to 100 mg/L, 5 to 100 mg/L and 10-500 mg/L respectively. Desorption and reusability were conducted using 1 M NaOH, the MLF-Ns was first saturated with the mixed solution of As(Ⅲ) (5 mg/L), As(V) (5 mg/L), and F- (100 mg/L) for 24 h and separated from the solution. Then it was immersed in NaOH solutions for another 24 h. The adsorbed amount (Qe, mg/g) and rate (%) were calculated as follows[26]:
Where C0 and Ce (mg/L) stand for the As(V), As(Ⅲ) and F- concentrations (mg/L) at the initial and equilibrium stages. V (mL) and m (g) stand for the volume of the total mixture and the mass of adsorbent used, respectively. Ct (mg/L) is the concentration of F-, As(Ⅲ), and As(V) at time t.
2.8. Kinetics of adsorption study
The kinetic experimental data were mathematically simulated by the pseudo-first-order kinetics and pseudo-secondorder kinetics the equations were presented as follows[27]:
pseudo-first-order model:
Where Qt (mg/g) is the sorption amount at time t; Qe (mg/g) is the sorption capacity of F-, As(Ⅲ) and As(V) at equilibrium; k1 (min-1) and k2 (min-1) are the rate constants of the pseudo-first-order kinetics and pseudo second-order kinetics models, respectively.
2.9. Adsorption isotherms study
Adsorption isotherms were analyzed using Langmuir and Freundlich model, the equations are expressed as follow[18,28]:
Langmuir equation:
Freundlich equation:
Where Qe (mg/g) and Ce (mg/L) are defined as above; Qm (mg/g) was the theoretical maximum sorption amount; KL (L/mg) is the Langmuir sorption constant (L/mg); KF (mg/g)·(L/mg)1/n is the constant associated with the relative sorption amount; and n was the sorption intensity; R (8.314×10⁻³ kJ/mol·K) is the gas constant.
3. Results and discussion
3.1. Morphology of the adsorbents
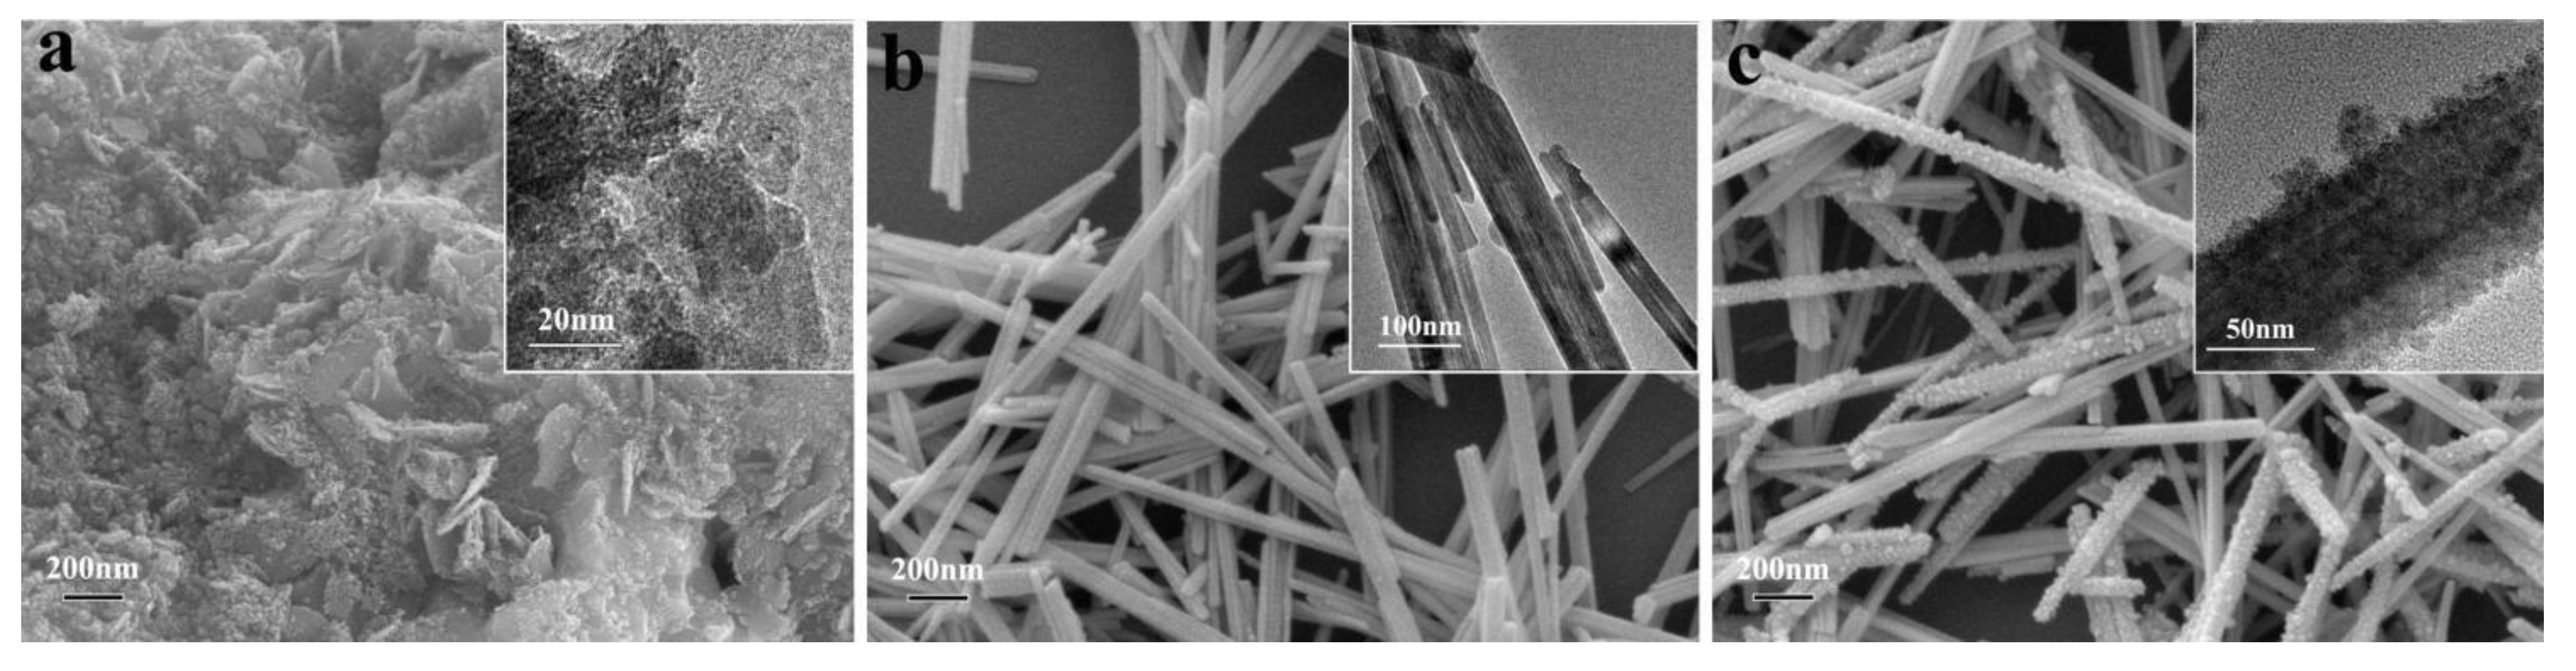
The morphology of MgLaFe LDO, MnO2 NW, and MnO2@LDO composite was observed by SEM and TEM. Figure 1a showed that the MgLaFe LDO exhibits lamellar agglomerates produced by stacking 2D nanosheets, as shown in the TEM image, which displays stacked nanosheet aggregates. Figure 1b displayed the uniform length of the α-MnO2 nanowires, also shown as a hollow tubular material in the TEM image. Figure 1c displayed the uniform wrapping around most of the nanowires, exhibiting core-shell material characteristics of MnO2@LDO. Additionally, as seen from the TEM image, many tiny sheet materials were distributed on the surface of the wrapped nanowires.
Figure 1.
SEM and insetted TEM images of (a) MgLaFe LDO, (b) MnO2 NW, and (c) MnO2@LDO.
3.2. Characterization of the adsorbents
The crystal structures of MgLaFe LDO, MnO2 NW, and MnO2@LDO composites were characterized by XRD, as presented in Figure 2. The diffraction peaks of MnO2@LDO were consistent with those of MnO2. Still, the 2θ of all peaks is shifted to the left by about 0.6◦ overall, indicating that the lattice has been stretched by the stress of the interstitial atoms. The intensity of the peaks on the (110) and (131) crystal planes decreased, implying successful immobilisation of LDO on MnO2. The characteristic diffraction peaks of 12.8◦, 18.1◦, 28.7◦, 37.6◦, 42.0◦, 49.9◦, 56.2◦, 60.2◦, 65.5◦, 69.6◦, and 73.1◦ corresponded to the (110), (020), (131), (211), (031), (141), (060), (251), (002), (541), and (132) crystal planes of α-MnO2 (PDF#98-002-0227), respectively. The sharp shape indicated that the sample had good crystallinity. In contrast, the diffraction patterns of MgLaFe LDO exhibited characteristics of amorphous metal (hydro)oxides.
Figure 2.
XRD patterns of MgLaFe LDO, MnO2 NW, and MnO2@LDO.
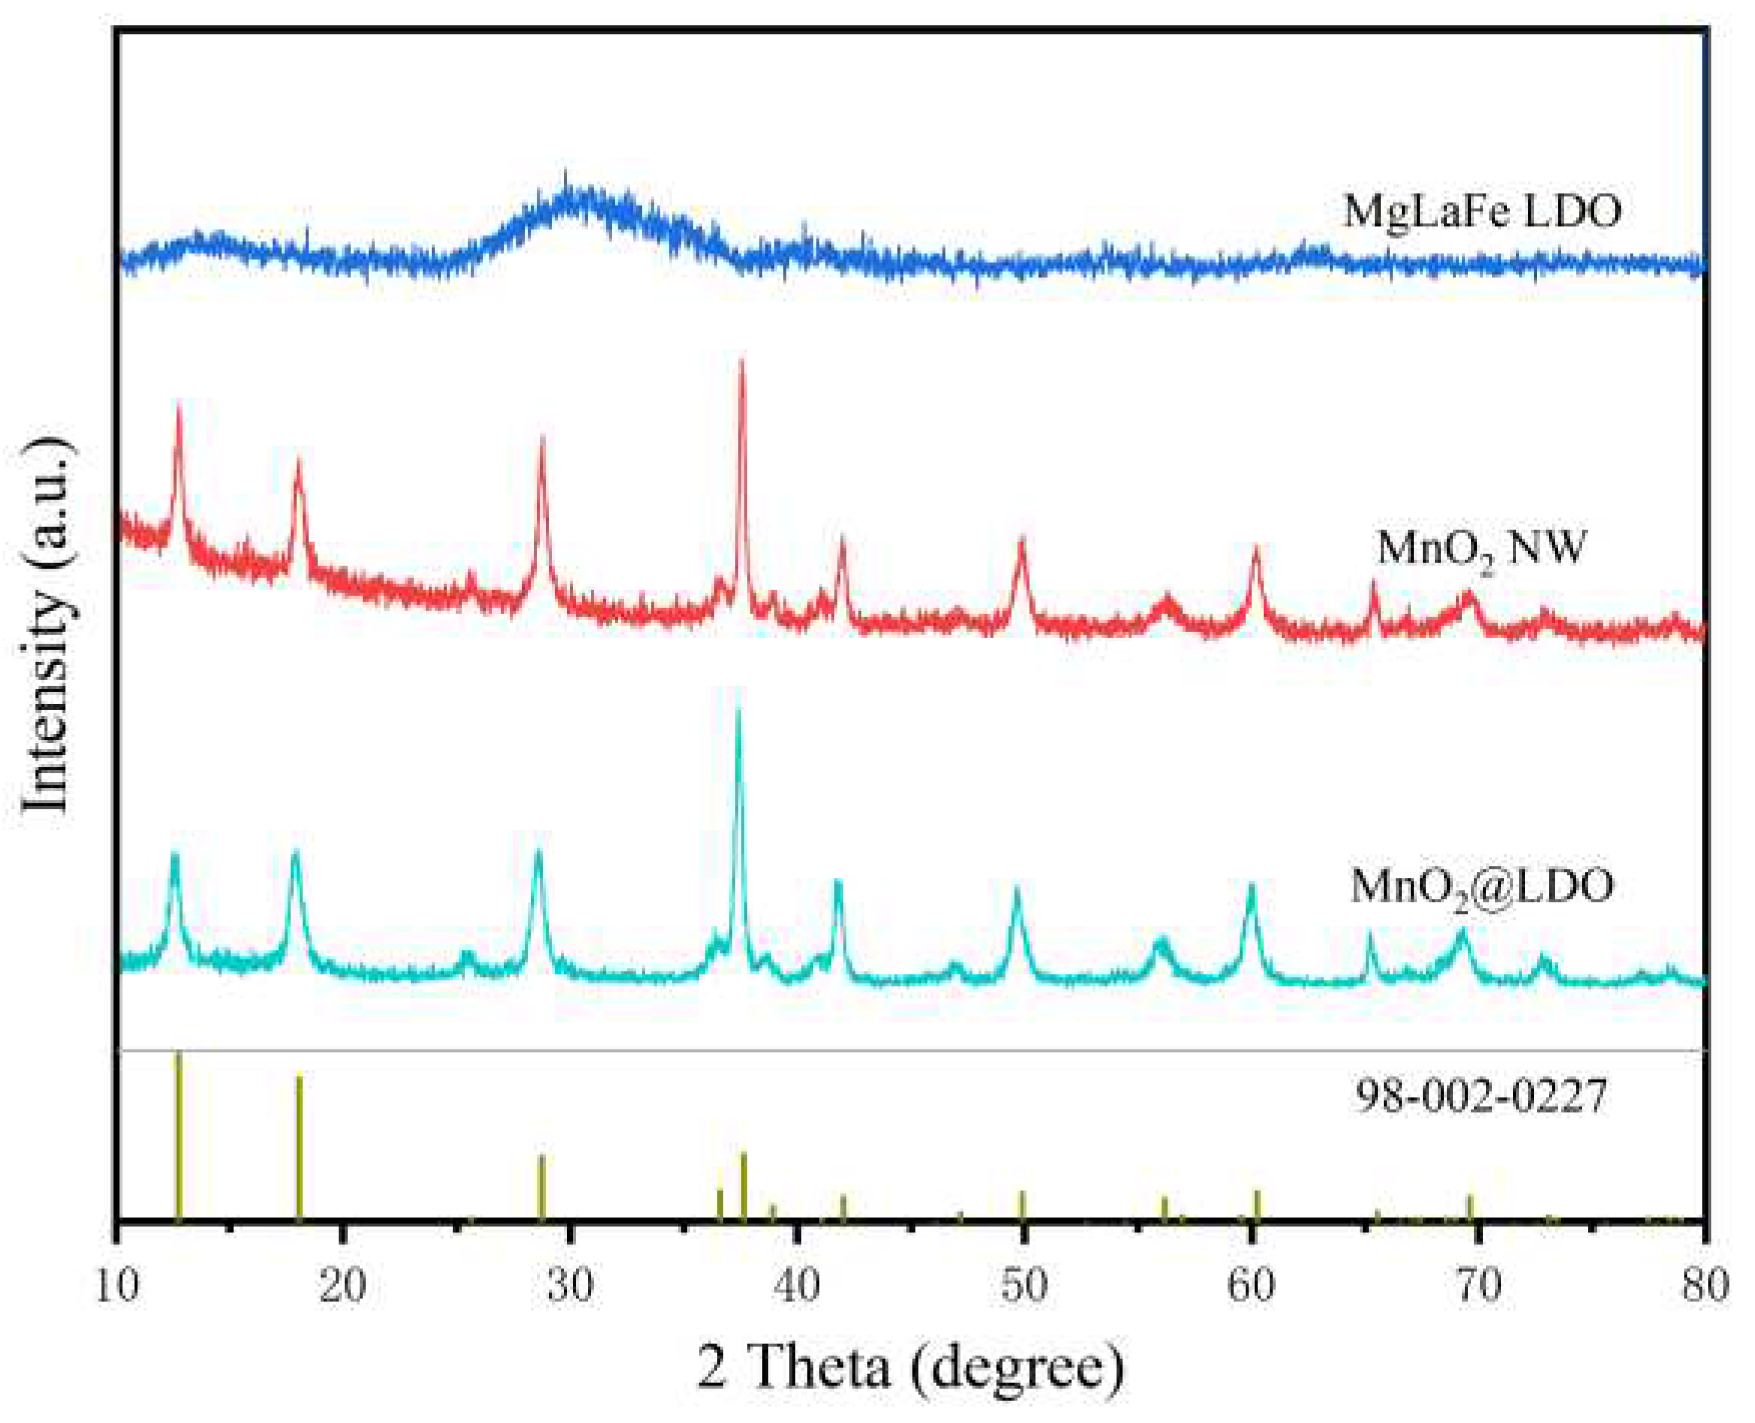
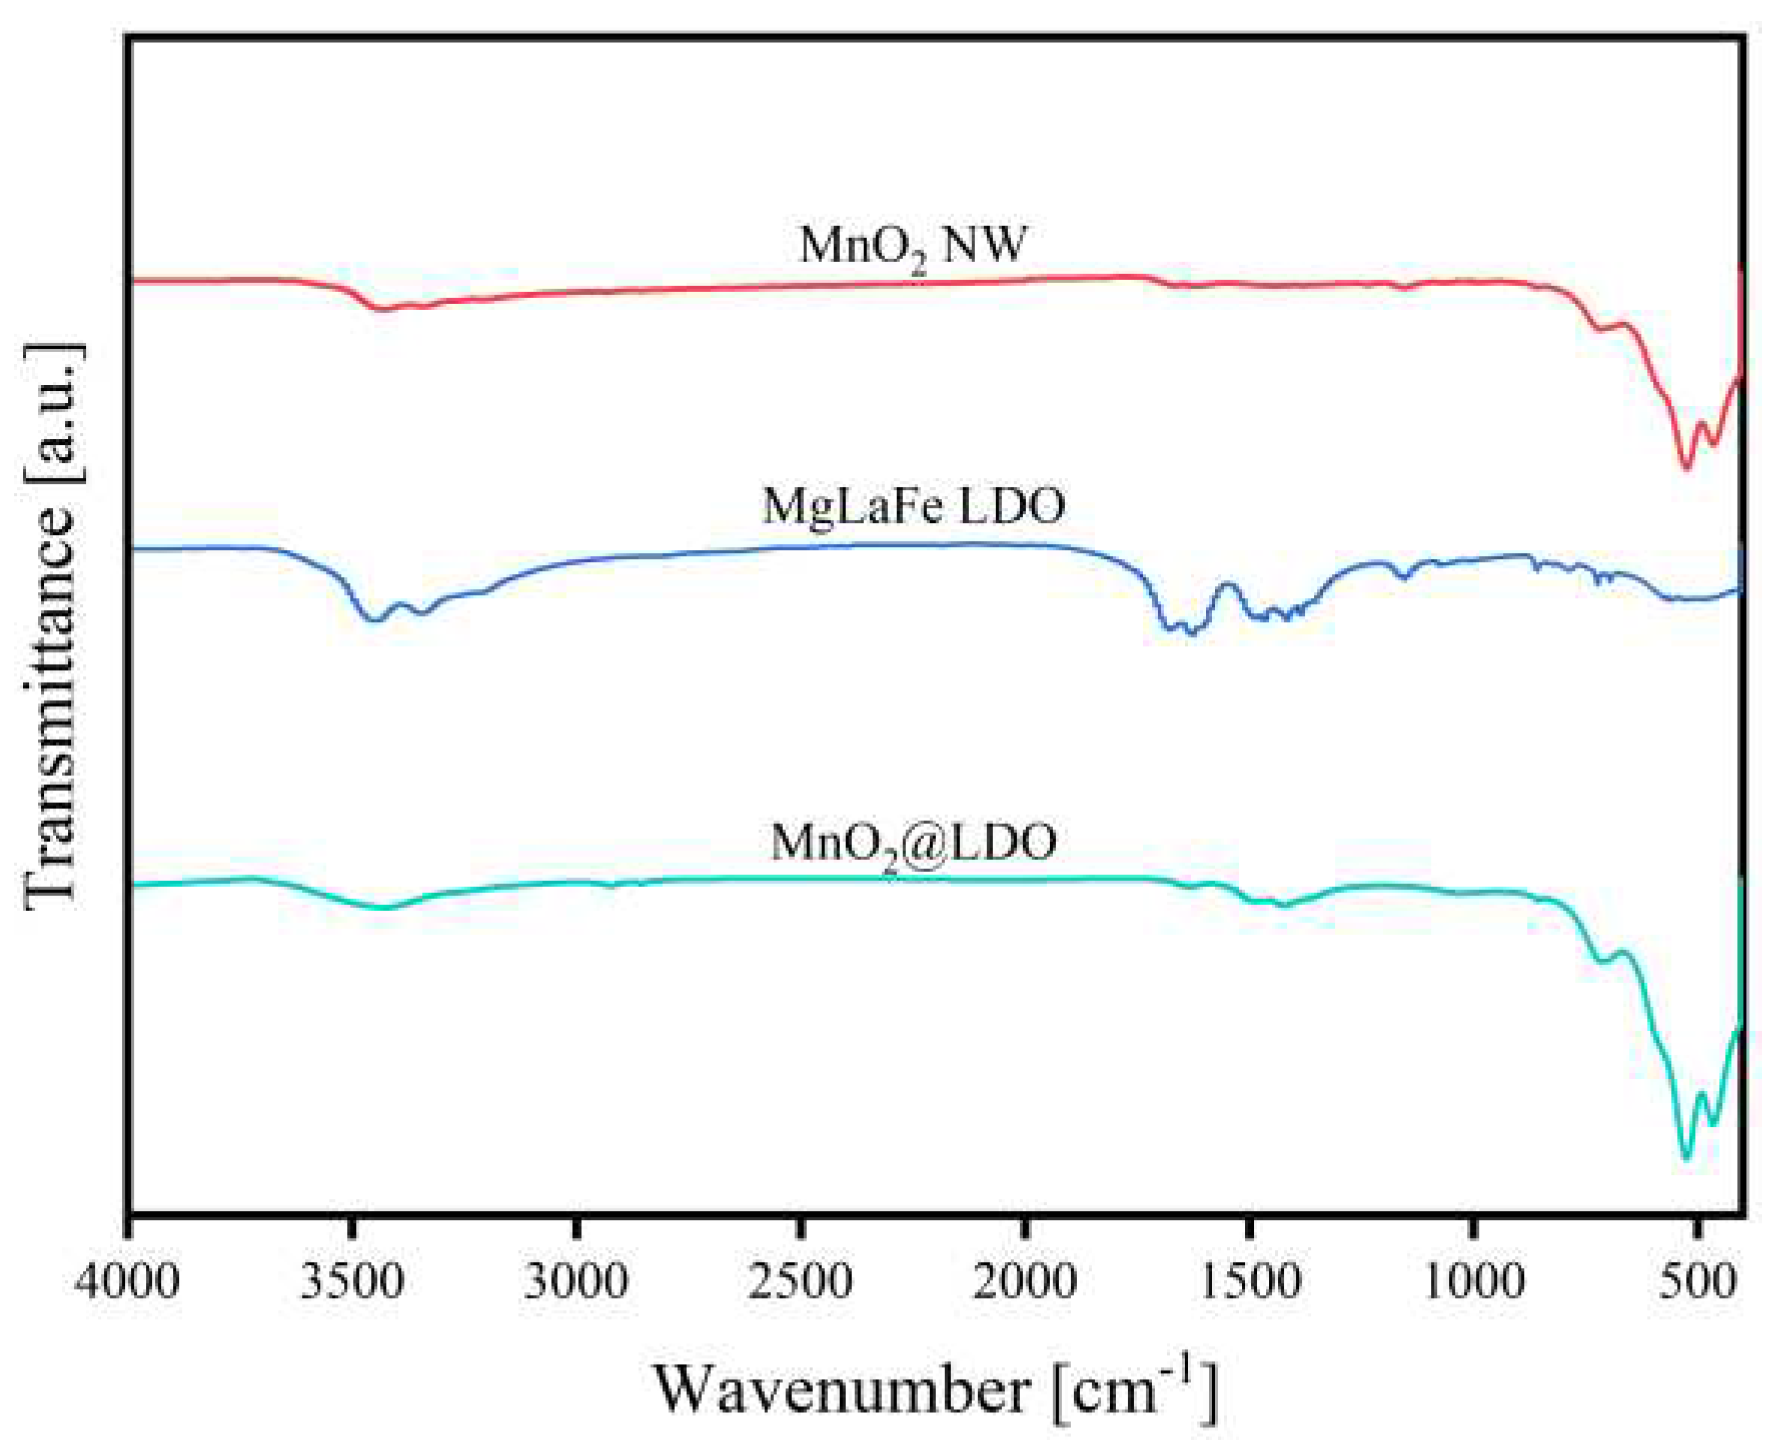
Figure 3 showed the FT-IR spectra of MgLaFe LDO, MnO2 NW, and MnO2@LDO. The observed bands ranging from 400 to 1000 are attributed to O-M-O, O-M, and M-O-M bonds (M= Mn, Mg, La, and Fe)[29]. The bands below 1000 were improved in MnO2@LDO as opposed to MnO2 NW. Moreover, the absorption peak of MnO2 NW at 725 cm-1 showed a shift to 712 cm-1, perhaps due to surface loading of LDO. The LDO's specific CO32- absorption peaks were also evident at 1420-1490 cm-1[30]. The bending mode of the H-O-H bond on the metal hydroxides and adsorbed water appeared at 1640 and 3450 cm-1[31], respectively. By contrast, the MgLaFe LDO demonstrated absorption peaks of CO32- and adsorbed water, with the vibration of metal oxide M-O also visible in the 700-720 cm-1 absorption band[32]. In the comparison, the MnO2@LDO surface exhibited more metal (hydro)oxides and LDO's typical CO32- intercalation feature.
Figure 3.
FT-IR spectra of MgLaFe LDO, MnO2 NW, and MnO2@LDO.
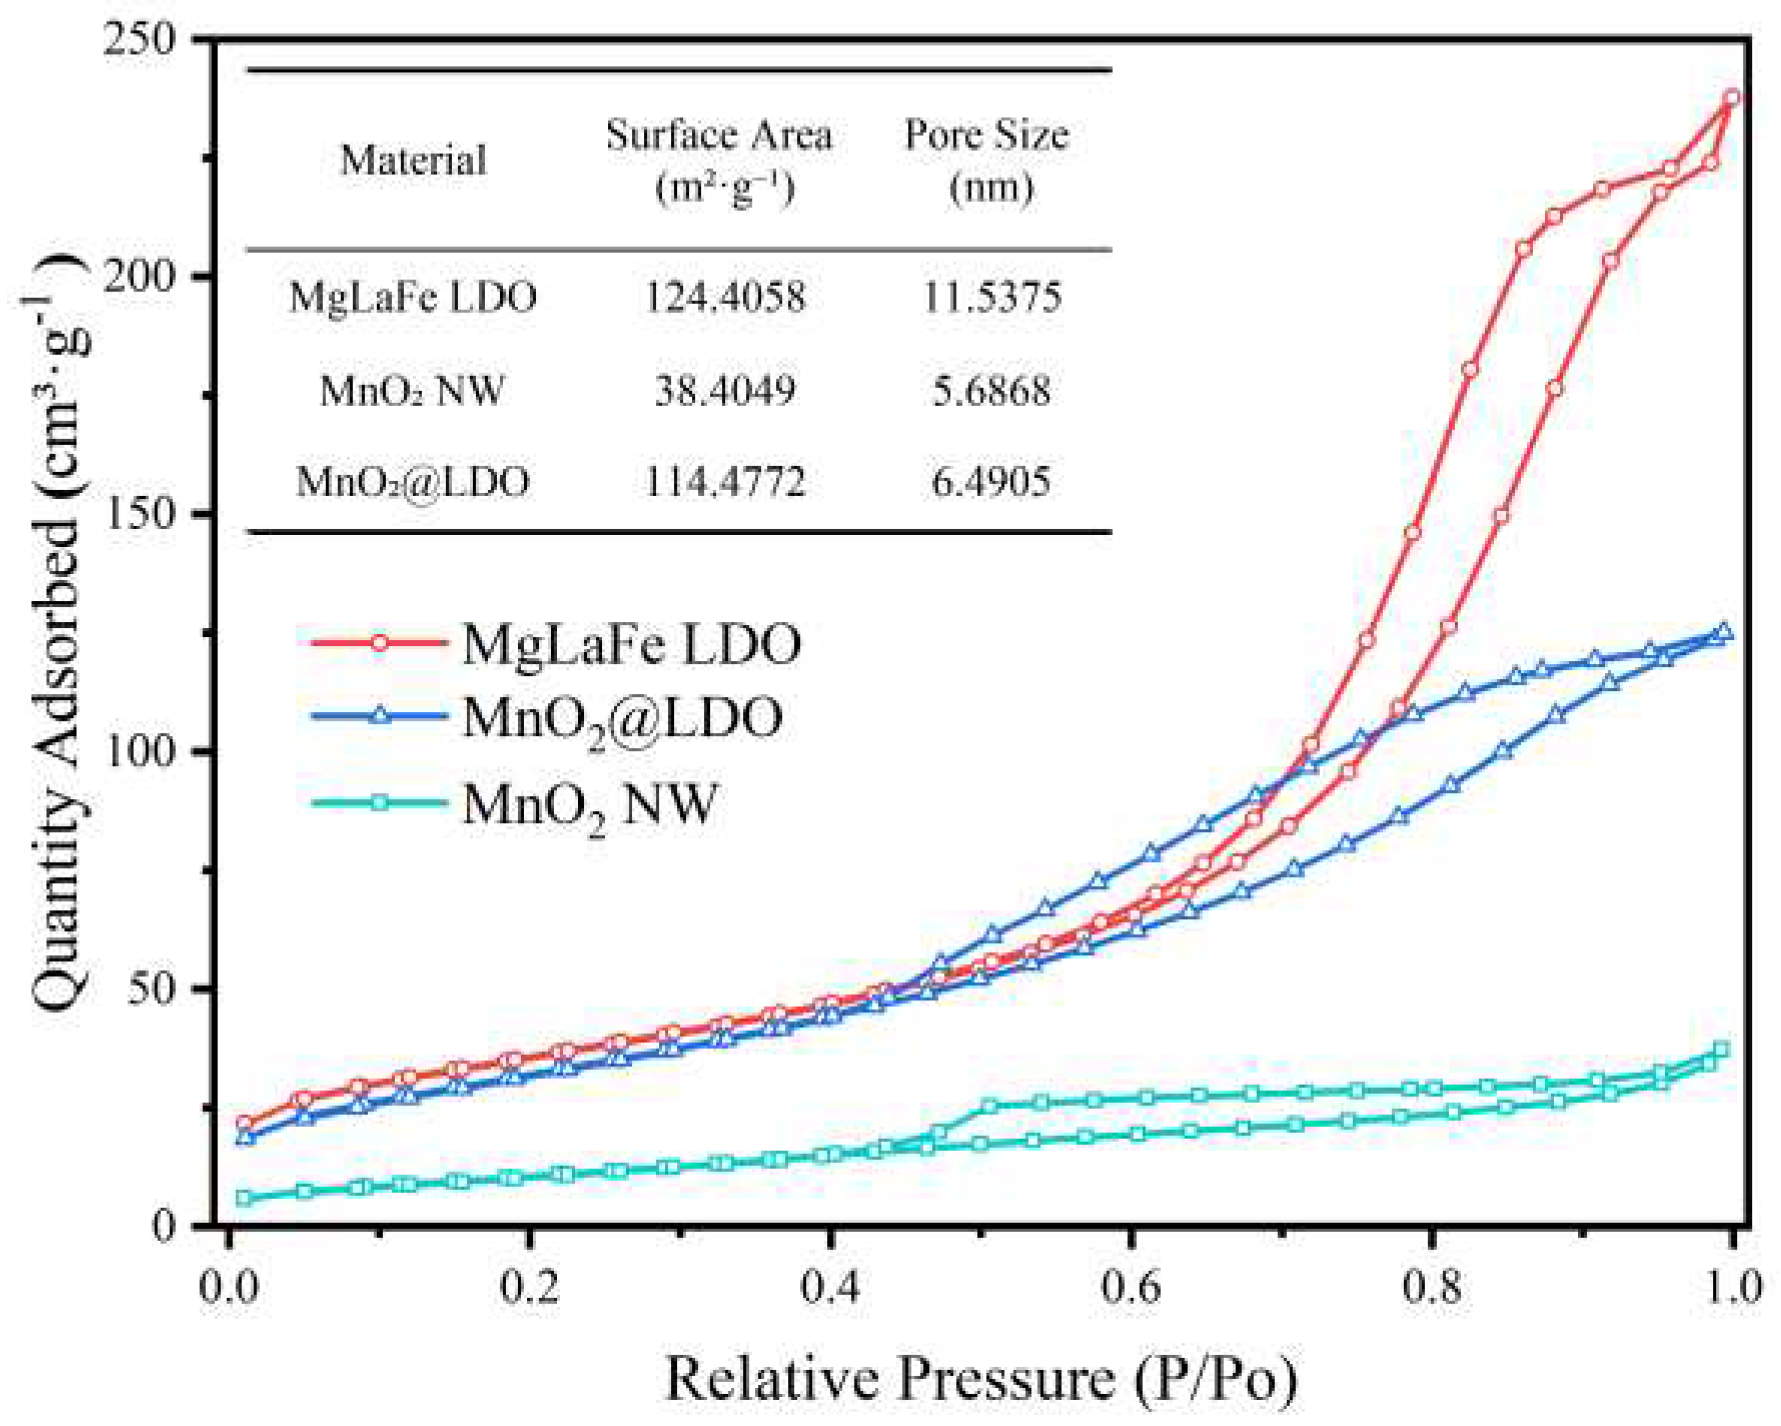
As shown in Figure 4, the adsorption isotherms of IV-type were observed. The hysteresis loops of MnO2@LDO and MgLaFe LDO belonged to type H3, whereas the MnO2 NW hysteresis loop was of type H4. Both H3 and H4 had a combination of micropores and mesopores, which arose mainly from irregular pore structures, including cracks and slits. The H3 hysteresis loop, in particular, corresponded to surfaces with more flat plate slit structures and wedge structures, which were typical of LDO structures[33]. The justification for the presence of the H3 hysteresis loop lay in the numerous irregular voids caused by stacking and the high concentration of loaded MgLaFe LDOs featuring lamellar flat plate slit structures, as evidenced by the SEM images of MnO2@LDO (Figure 2c). The surface area had increased from 38.4 m2/g to 114.5 m2/g. This increase in surface area could be due to the reduction in the packing of MnO2 by LDO, resulting in a further increase in porosity. The larger surface area led to an increased contact reaction area, which was beneficial for adsorption. Although MgLaFe LDO possessed a larger specific surface area, the effect of the specific surface area on the adsorption process would be further analyzed by adsorption performance.
Figure 4.
N2 adsorption-desorption isotherm curves of MgLaFe LDO, MnO2 NW, and MnO2@LDO.
3.3. Evaluation of adsorption performance
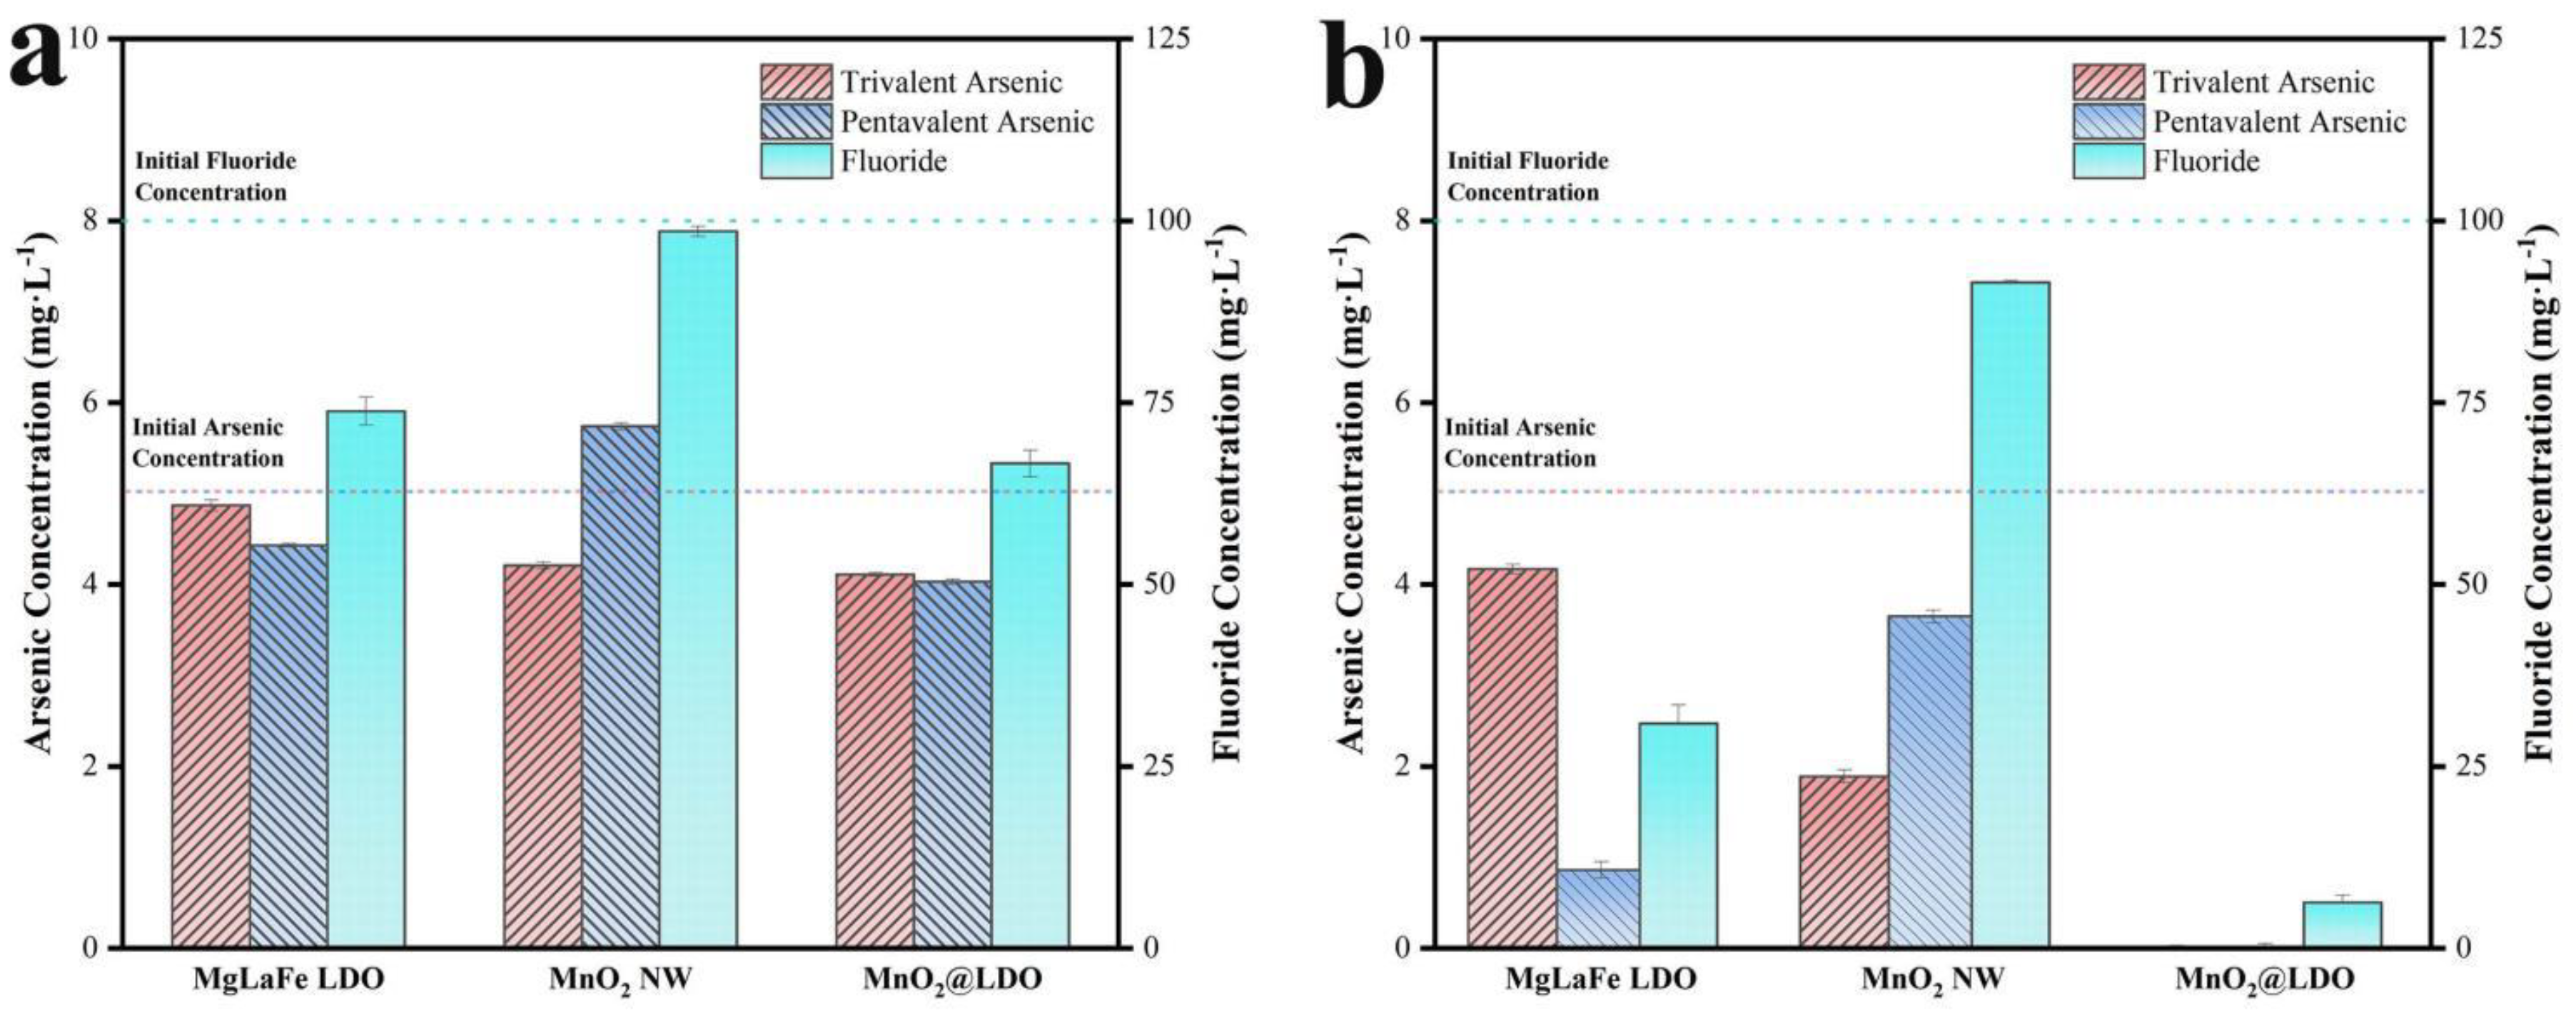
The adsorption abilities of As(Ⅲ), As(V), and F- were investigated using samples of MgLaFe LDO, MnO2 NW, and MnO2@LDO as adsorbents. The experimental conditions were: adsorbent amount was settled as 0.5 g/L according to the preliminary experiment, As(Ⅲ) concentration 5 mg/L, As(V) concentration 5 mg/L, F- concentration 100 mg/L, experimental temperature 303K, reaction time 480 min.
Figure 5a indicated that the adsorption of As(Ⅲ) by MnO2 NW had a high oxidation efficiency, resulting in a high As(Ⅲ) removal rate of 15.8% during early adsorption stages. However, this increase was only 14.8% for As(V), implying that As(Ⅲ) was almost entirely oxidized to As(V). The MgLaFe LDO demonstrated improved adsorption for As(V) and F-, while revealing inadequate adsorption for As(Ⅲ). This was because the LDO material, being an anionic adsorbent, cannot effectively adsorb As(V) presented in the molecule. The adsorption performance of MnO2@LDO on As(Ⅲ), As(V), and F- was improved by 18.1%, 7.0%, and 7.3%, respectively, compared to that of MgLaFe LDO after 10 min of reaction.
As Figure 5b shown, the removal rate for As(V) was merely 27% as most of the As(Ⅲ) underwent oxidation to As(V), with limited oxidation of As(Ⅲ) because of the competition for the adsorption sites on the MnO2 NW surface. And MnO2 NW's removal of F- was less efficient. The MgLaFe LDO exhibited additional adsorption of As(V) and F- while the adsorption effect of As(Ⅲ) remained relatively stable, similar to that observed at 10 min. MnO2@LDO demonstrated superior efficacy in eliminating As(Ⅲ), As(V), and F- after a 480 mins reaction. The underlying cause for this higher removal rate could be attributed to the heterogeneous structure of MnO2@LDO, which possessed increased oxidation capabilities and anionic adsorption properties. Therefore, MnO2@LDO was selected as the adsorbent for further study.
Figure 5.
Individual adsorption performance of As(Ⅲ), As(V) and F- in absorbent MgLaFe LDO, MnO2 NW, and MnO2@LDO after (a) 10 mins, (b) 480 mins.
Figure 5.
Individual adsorption performance of As(Ⅲ), As(V) and F- in absorbent MgLaFe LDO, MnO2 NW, and MnO2@LDO after (a) 10 mins, (b) 480 mins.
3.4. Effect of solution pH
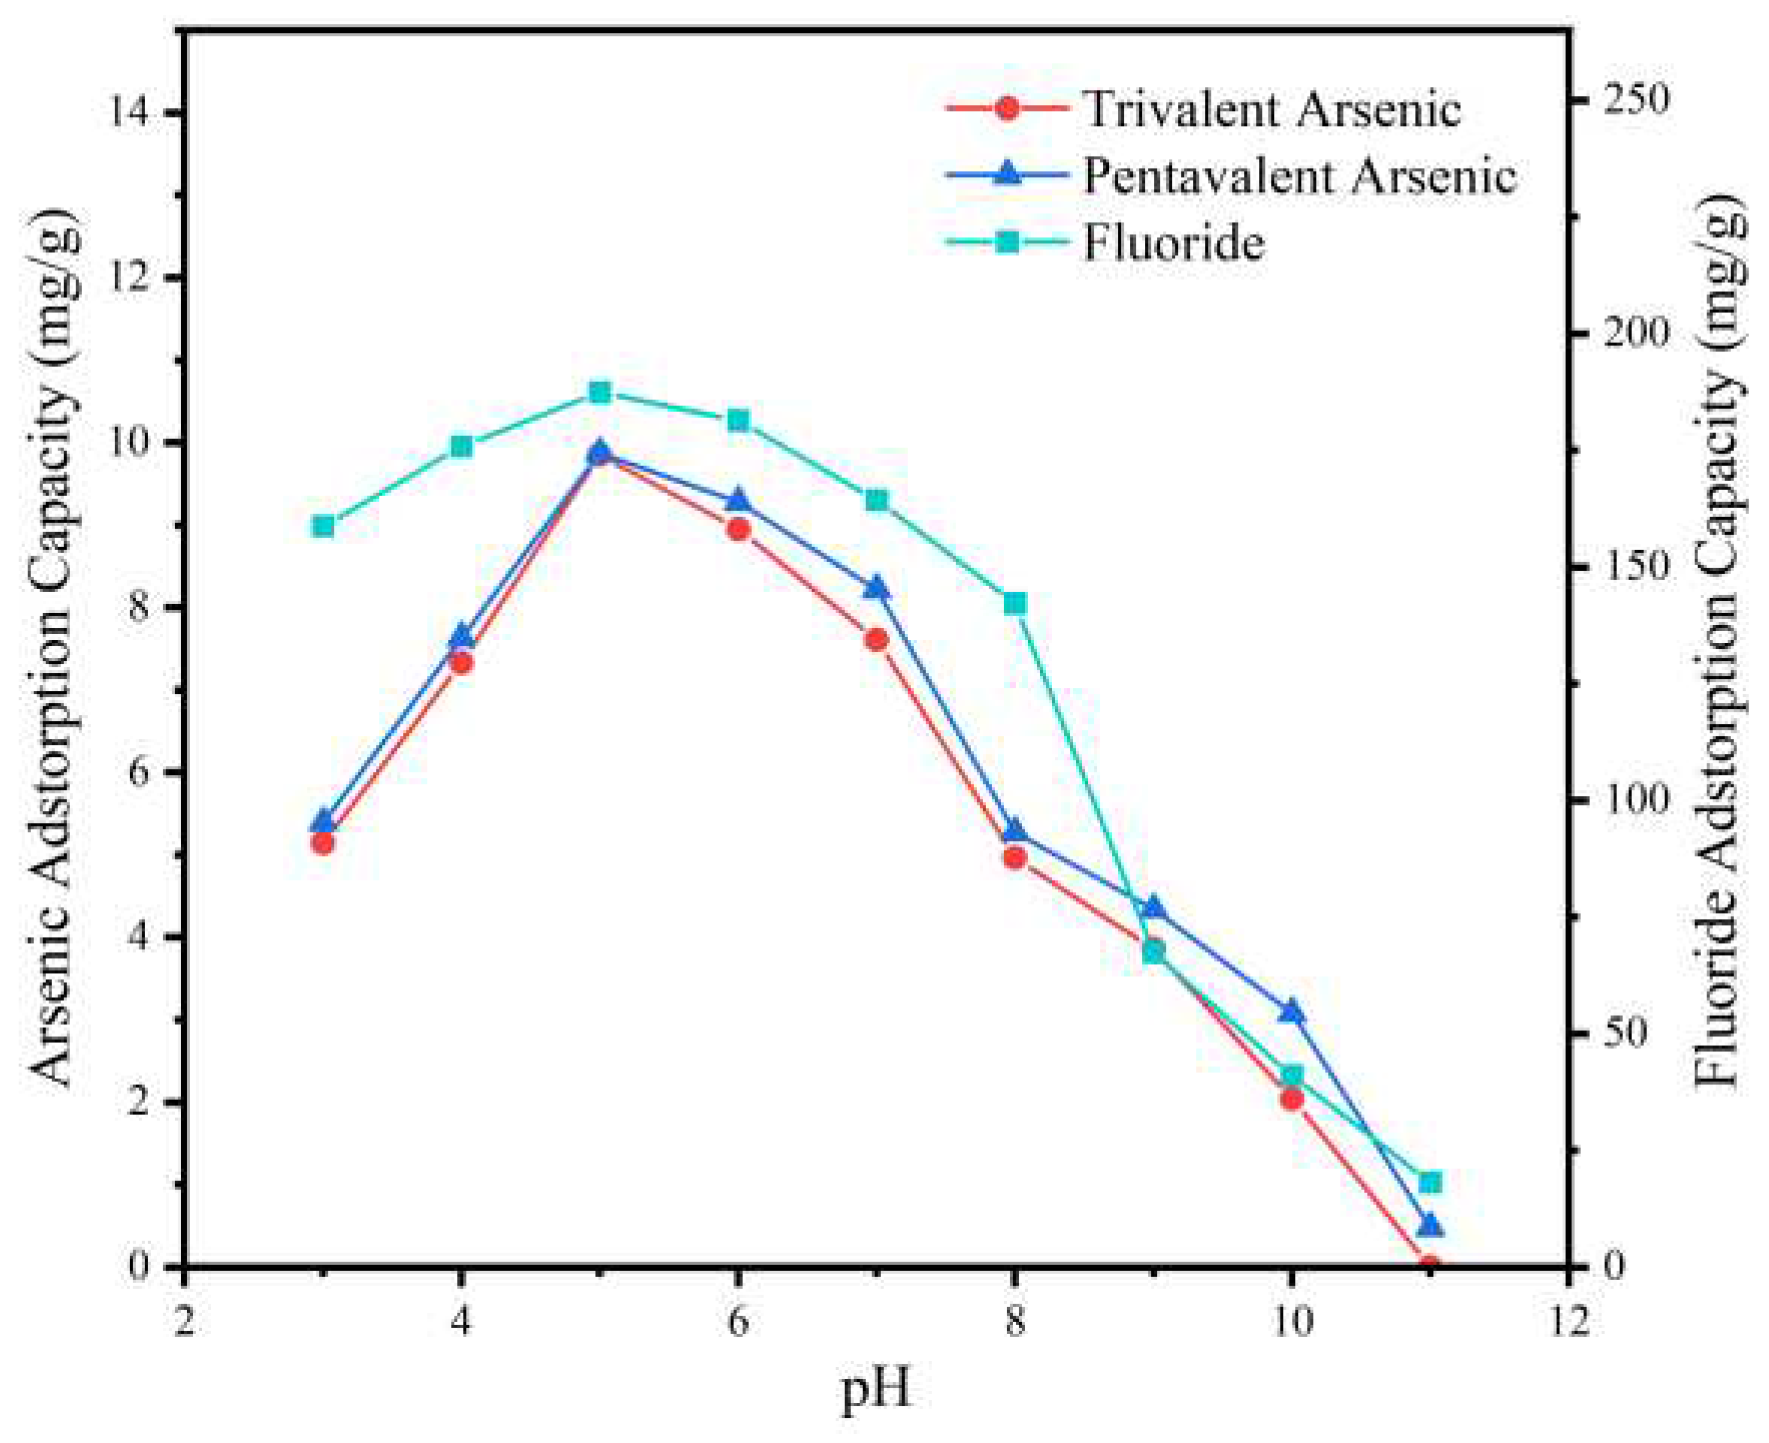
Figure 6 displayed the adsorption of As (Ⅲ), As (V), and F- based on the pH of the solution. The pH values were consistently maintained at a range of pH 3 to pH 11 while keeping other parameters constant (initial concentration of As (Ⅲ) 5 mg/L, As (V) 5 mg/L, F- 100 mg/L; contact time 480 mins; adsorbent dosing 500 mg/L). The findings indicated that the highest As (V) intake occurred within a pH range of 5-6, whereas As (Ⅲ) intake displayed a comparable pattern. The reason behind the similar trend of As (Ⅲ) and As (V) could be the conversion of As (Ⅲ) to As(V) by MnO2 in the heterogeneous structure of the adsorbent; simultaneously, As(V) could be absorbed into the interlayers of LDO which anchored growth on the MnO2 surface. Additionally, F- was effectively adsorbed within a pH range of 4-6. A low pH could lead to the conversion of F- to hydrofluoric acid, making it challenging to adsorb. On the other hand, a high pH could result in a large number of hydroxides aggregating on the adsorbent material surface, occupying the adsorption sites containing deprotonated As (Ⅲ), As (V), and F-, causing a significant reduction in adsorption capacity.
Figure 6.
Effect of pH on As(Ⅲ), As(V), and F- adsorption by MnO2@LDO.
3.5. Isotherm study
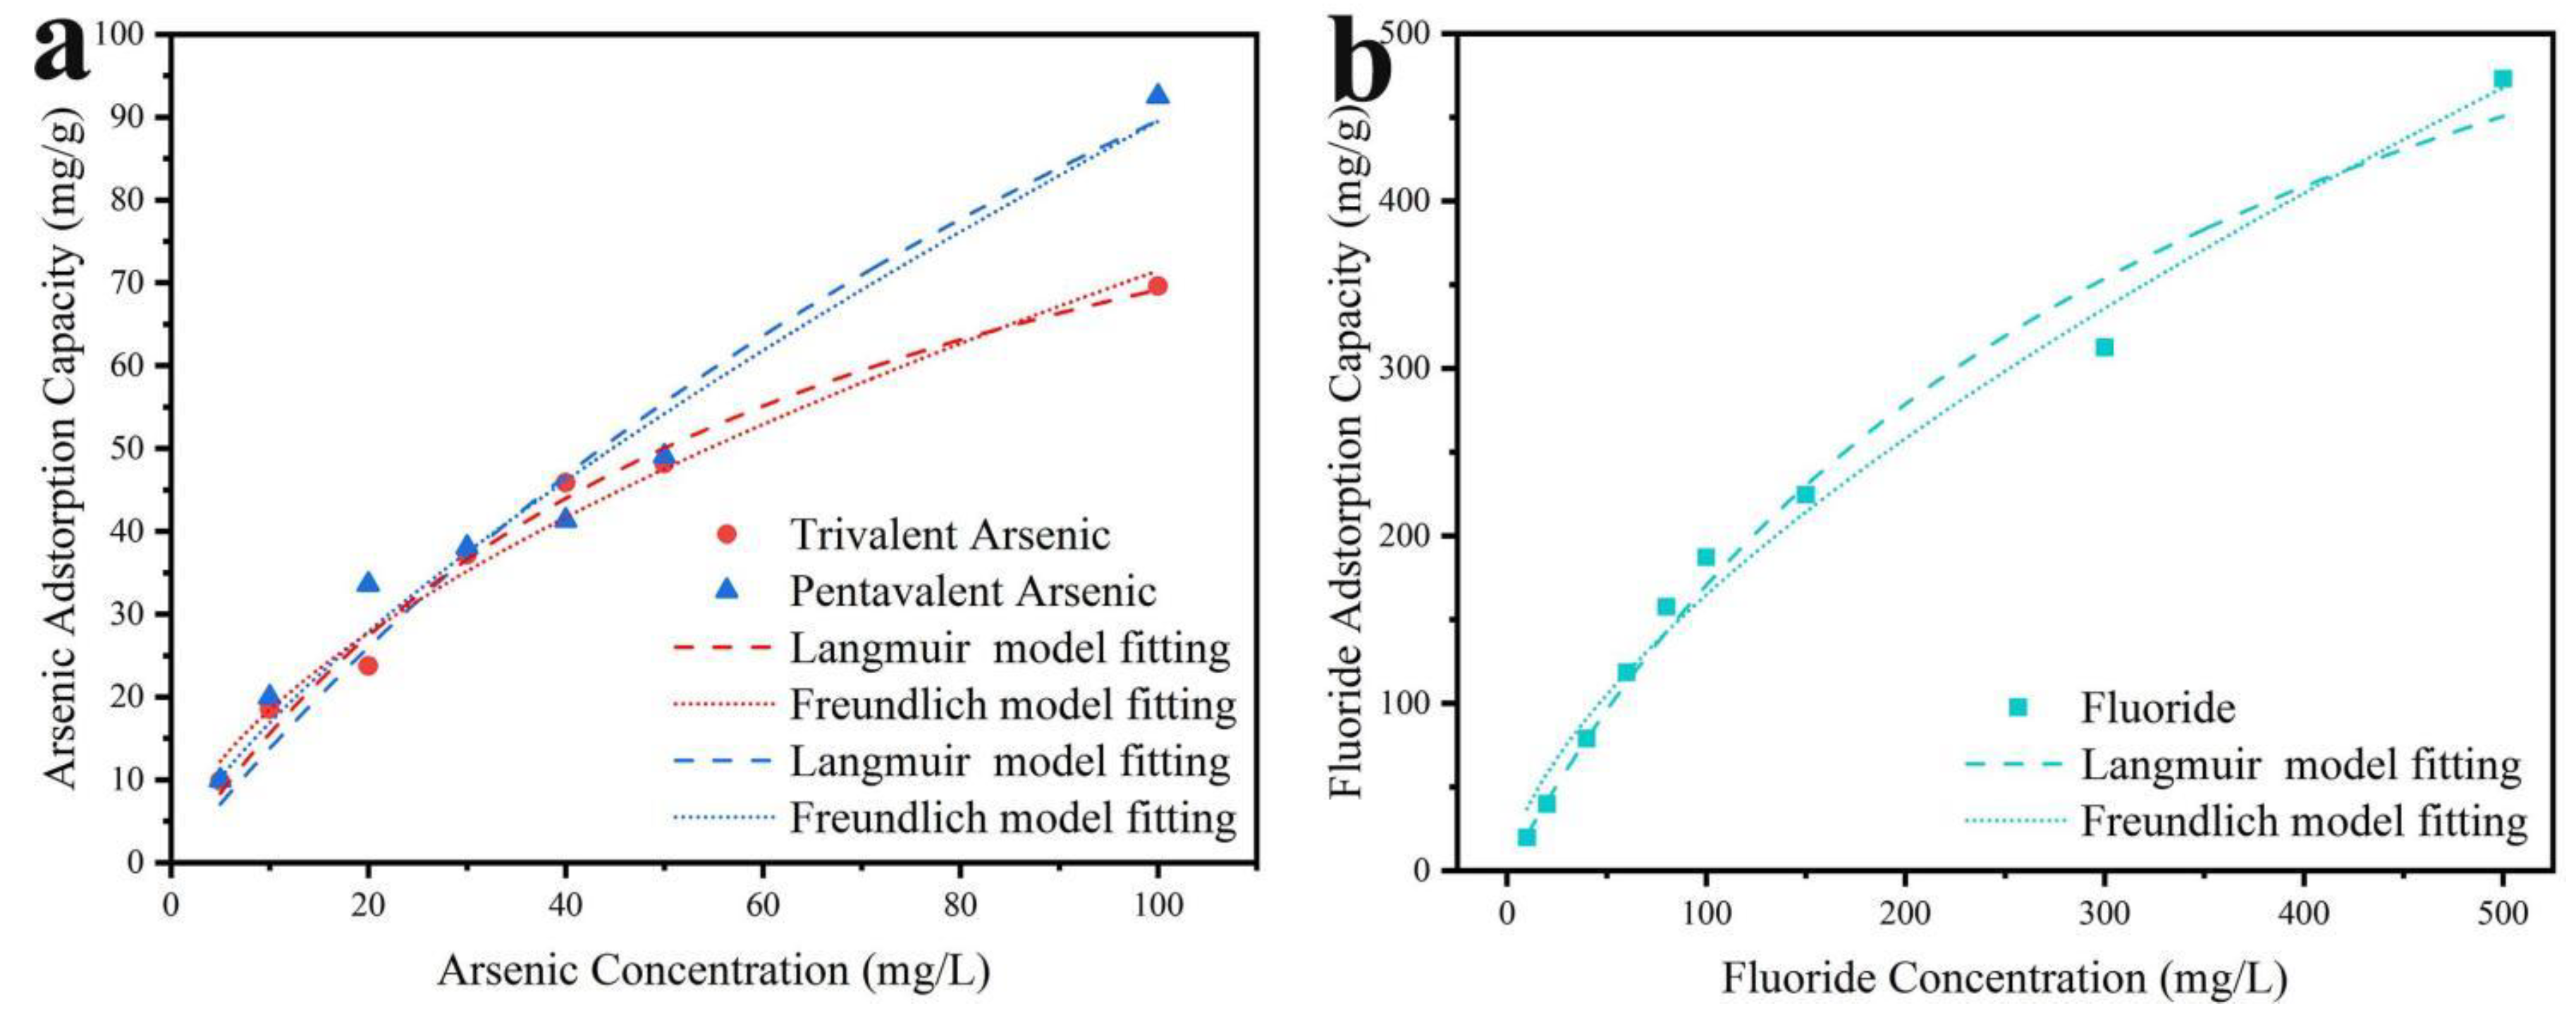
Isotherm models are commonly employed to describe the equilibrium interaction between adsorbates and adsorbents. The adsorption process occurring on the heterogeneous structure of MnO2@LDO can be better explored by isotherm model fitting. The Langmuir isotherm model indicates that monolayer adsorption occurs on identical adsorbent sites. In contrast, the Freundlich isotherm model suggests multilayer adsorption occurs due to adsorptive interaction with various sites on the non-homogeneous adsorbent surface. The adsorption capacity for As (Ⅲ), As (V), and F- under different solution concentrations was displayed in Figure 7, and the characteristic constants were listed in Table 1. The Langmuir model demonstrated better fitting for the adsorption process of As (Ⅲ), leading to the inference that As (Ⅲ) might mainly react on the MnO2 surface within the heterogeneous structure. These findings aligned with the results from our experiments on adsorption performance. The Freundlich model demonstrated a better fit for the equilibrium results for As (V) and F-. It suggested that multilayer adsorption occurred on the LDO and heterogeneous interface. In addition, since the nF parameter of the Freundlich model followed the order: As (Ⅲ) < F- < As (V) < 1, which also suggested that the adsorption rate of As (V) was the most rapid and that chemisorption was predominantly present on all adsorbents. The MnO2@LDO demonstrated excellent adsorption capacity compared to the present adsorbent, as illustrated in Table 1, manifesting outstanding performance.
Figure 7.
The MnO2@LDO co-adsorption isotherms fitting of (a) arsenic and of (b) fluoride.
3.6. Kinetics study
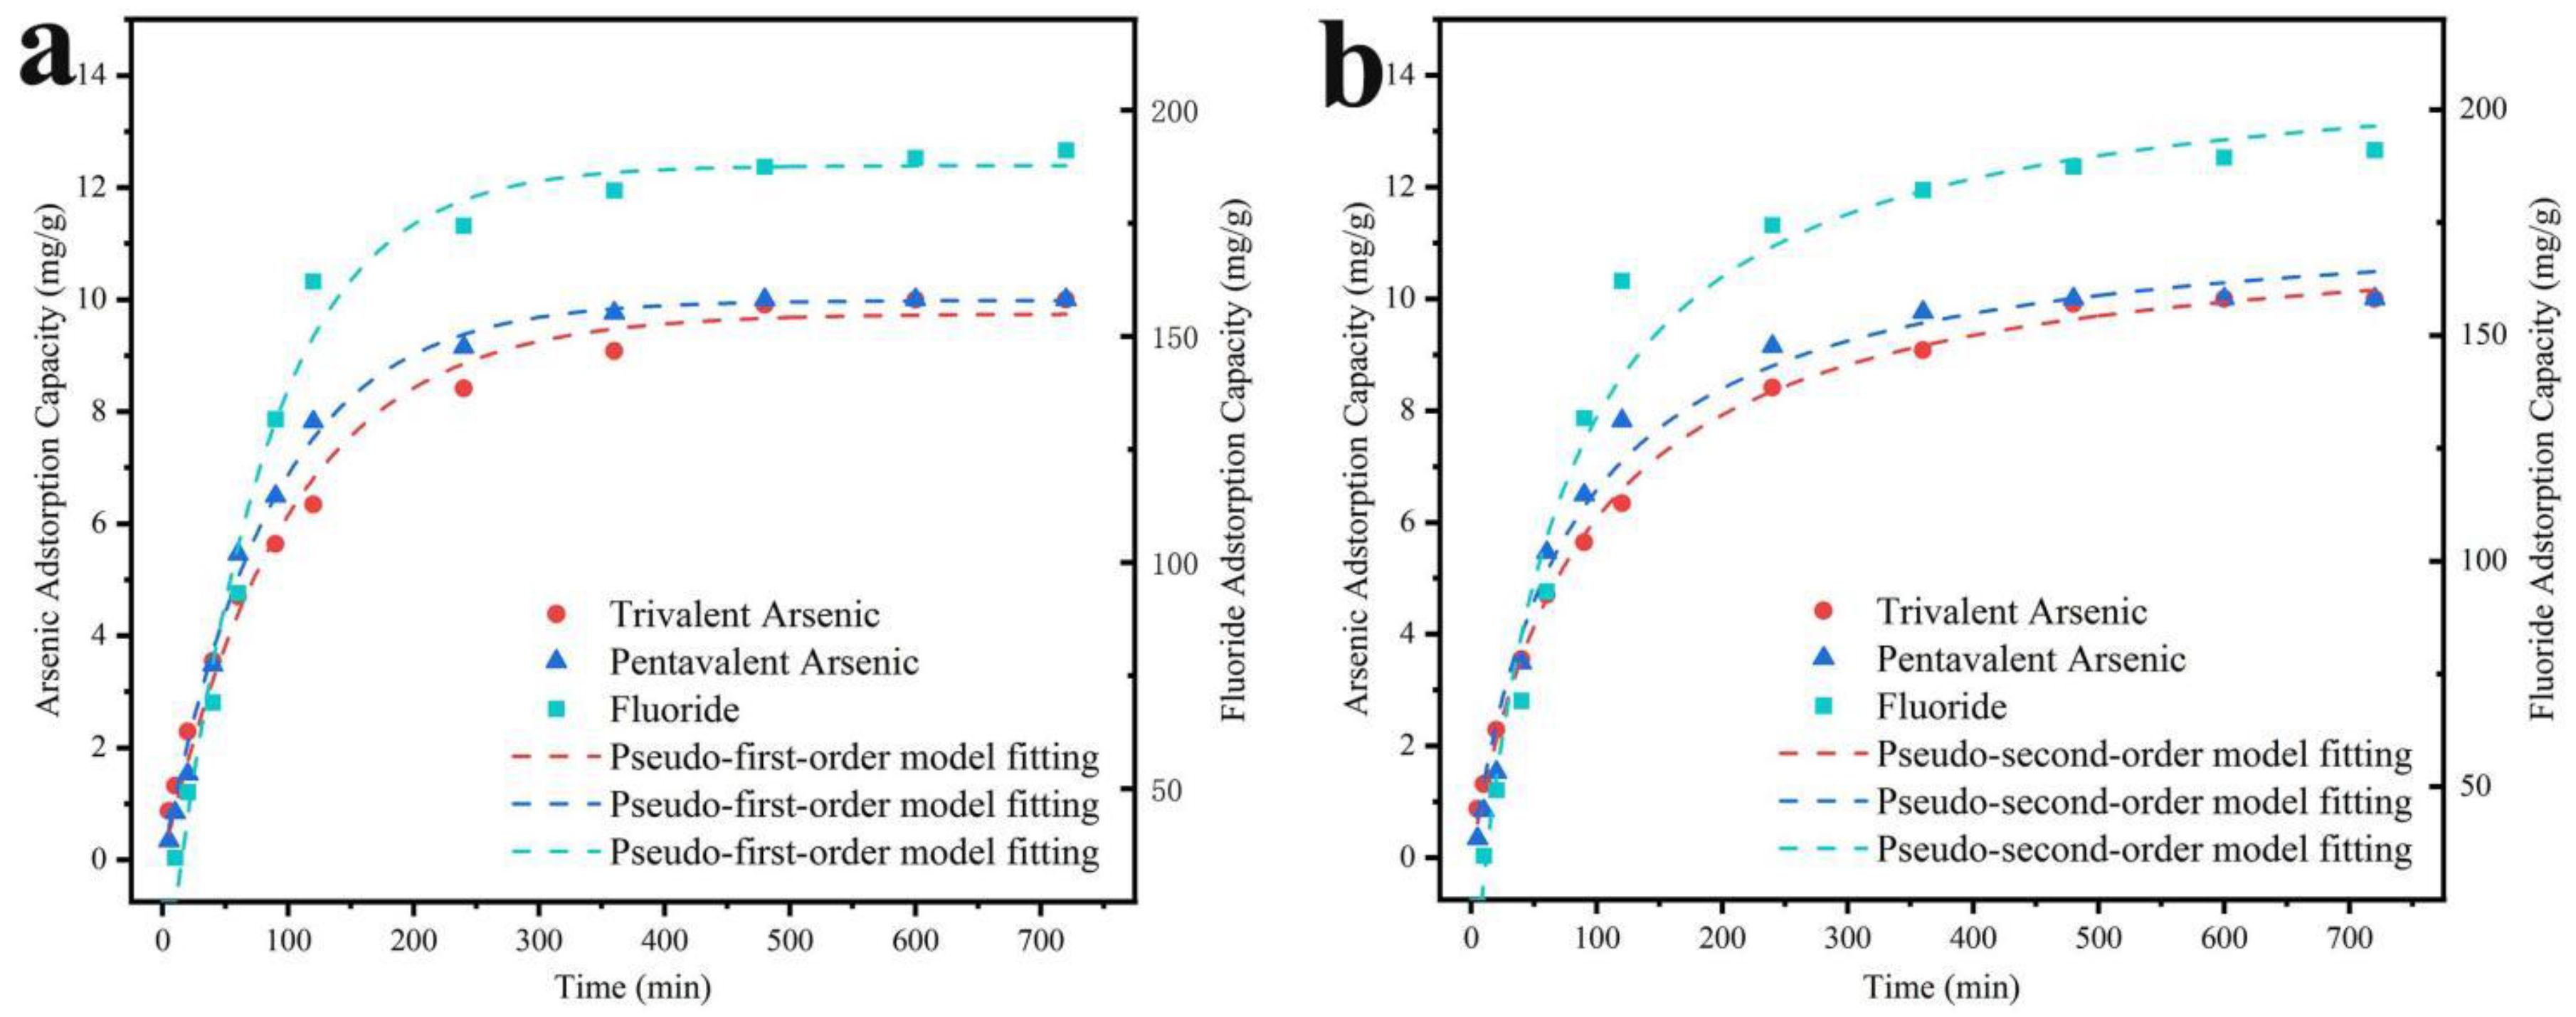
The adsorption kinetic curves and parameters were presented in Figure 8 and Table 2. The adsorption rates of As (Ⅲ), As (V), and F- were more rapid before 120 min, with removal rates of 63.4%, 78.2%, and 81.0%, respectively. The adsorption rate of As (Ⅲ) was higher than that of As (V) before 40 minutes, potentially due to the oxidation of most of the As (Ⅲ) to As (V) during the initial stage of adsorption, leading to the increment of As (V) concentration in the solution. After 480 minutes, the adsorption process reached stability, and As (Ⅲ), As (V), and F- removal rates reached 99.1%, 100%, and 93.7%, respectively. Additionally, based on the R2 fitted by the kinetic model, the adsorption of As (Ⅲ) could be better described by pseudo-second-order, indicating that the chemisorption mainly governed the adsorption process. In contrast, the pseudo-first-order kinetic model better fitted for the adsorption of As (V) and F-, suggesting that electrostatic interaction and ligand exchange also co-existed in the adsorption process.
Figure 8.
(a) Pseudo-first-order model fitting and (b) Pseudo-second-order model fitting with co-adsorption of As(Ⅲ), As(V), and F- on MnO2@LDO.
Figure 8.
(a) Pseudo-first-order model fitting and (b) Pseudo-second-order model fitting with co-adsorption of As(Ⅲ), As(V), and F- on MnO2@LDO.
3.7. Mechanism Study
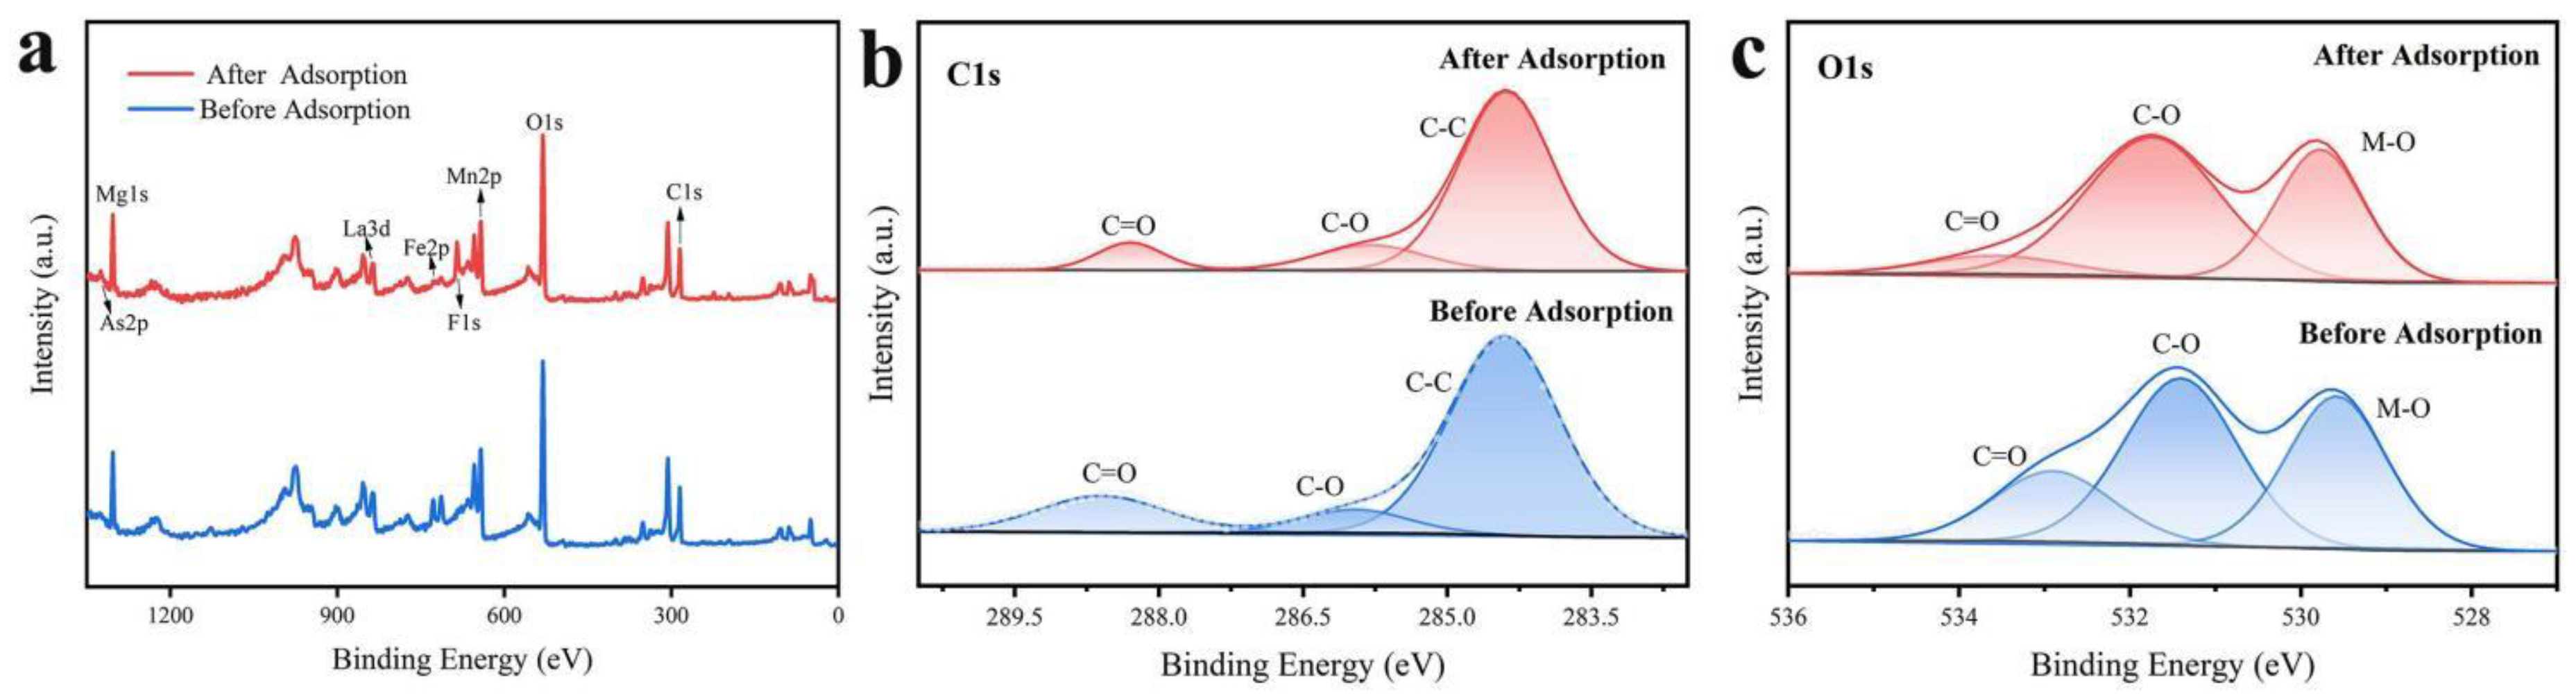
The XPS measurements can detect the surface elemental composition, metal oxidation states, and adsorbed species of solid materials, providing critical information about binding mechanisms. In the spectrum of MnO2@LDO (Figure 9a), two significant new peaks were observed at As2p (1325 eV) and F1s (685 eV). The presence of these peaks indicated that the target ions were immobilized. As shown in Figure 9b, the C1s spectra of MnO2@LDO after adsorption were assigned as C=O, C-O, and C-C with binding energies of 288.3, 285.9, and 284.4 eV, respectively. There was a negative shift accompanied by a significant decrease in the intensity of C=O, which belongs to CO32- between the interlayers of LDO in the heterostructure (Table 4). It indicated that the interlayer CO32- is replaced by the anion of As(V)/ F-, thus assuming a free state. The O1s spectra before and after adsorption are displayed in Figure 9c and assigned to C=O, C-O, and M-O. Positive shifts of different degrees were observed after adsorption, accompanied by a noteworthy reduction in C=O intensity. These observations indicated that the interlayer CO32- in MnO2@LDO was replaced during adsorption. It could contribute to its rapid adsorption of As(V) and F-.
Figure 9.
MnO2@LDO before and after As(Ⅲ), As(V) and F- co-adsorption of (a) XPS survey spectra, high-resolution spectra of (b) C1s, and (c) O1s.
Figure 9.
MnO2@LDO before and after As(Ⅲ), As(V) and F- co-adsorption of (a) XPS survey spectra, high-resolution spectra of (b) C1s, and (c) O1s.
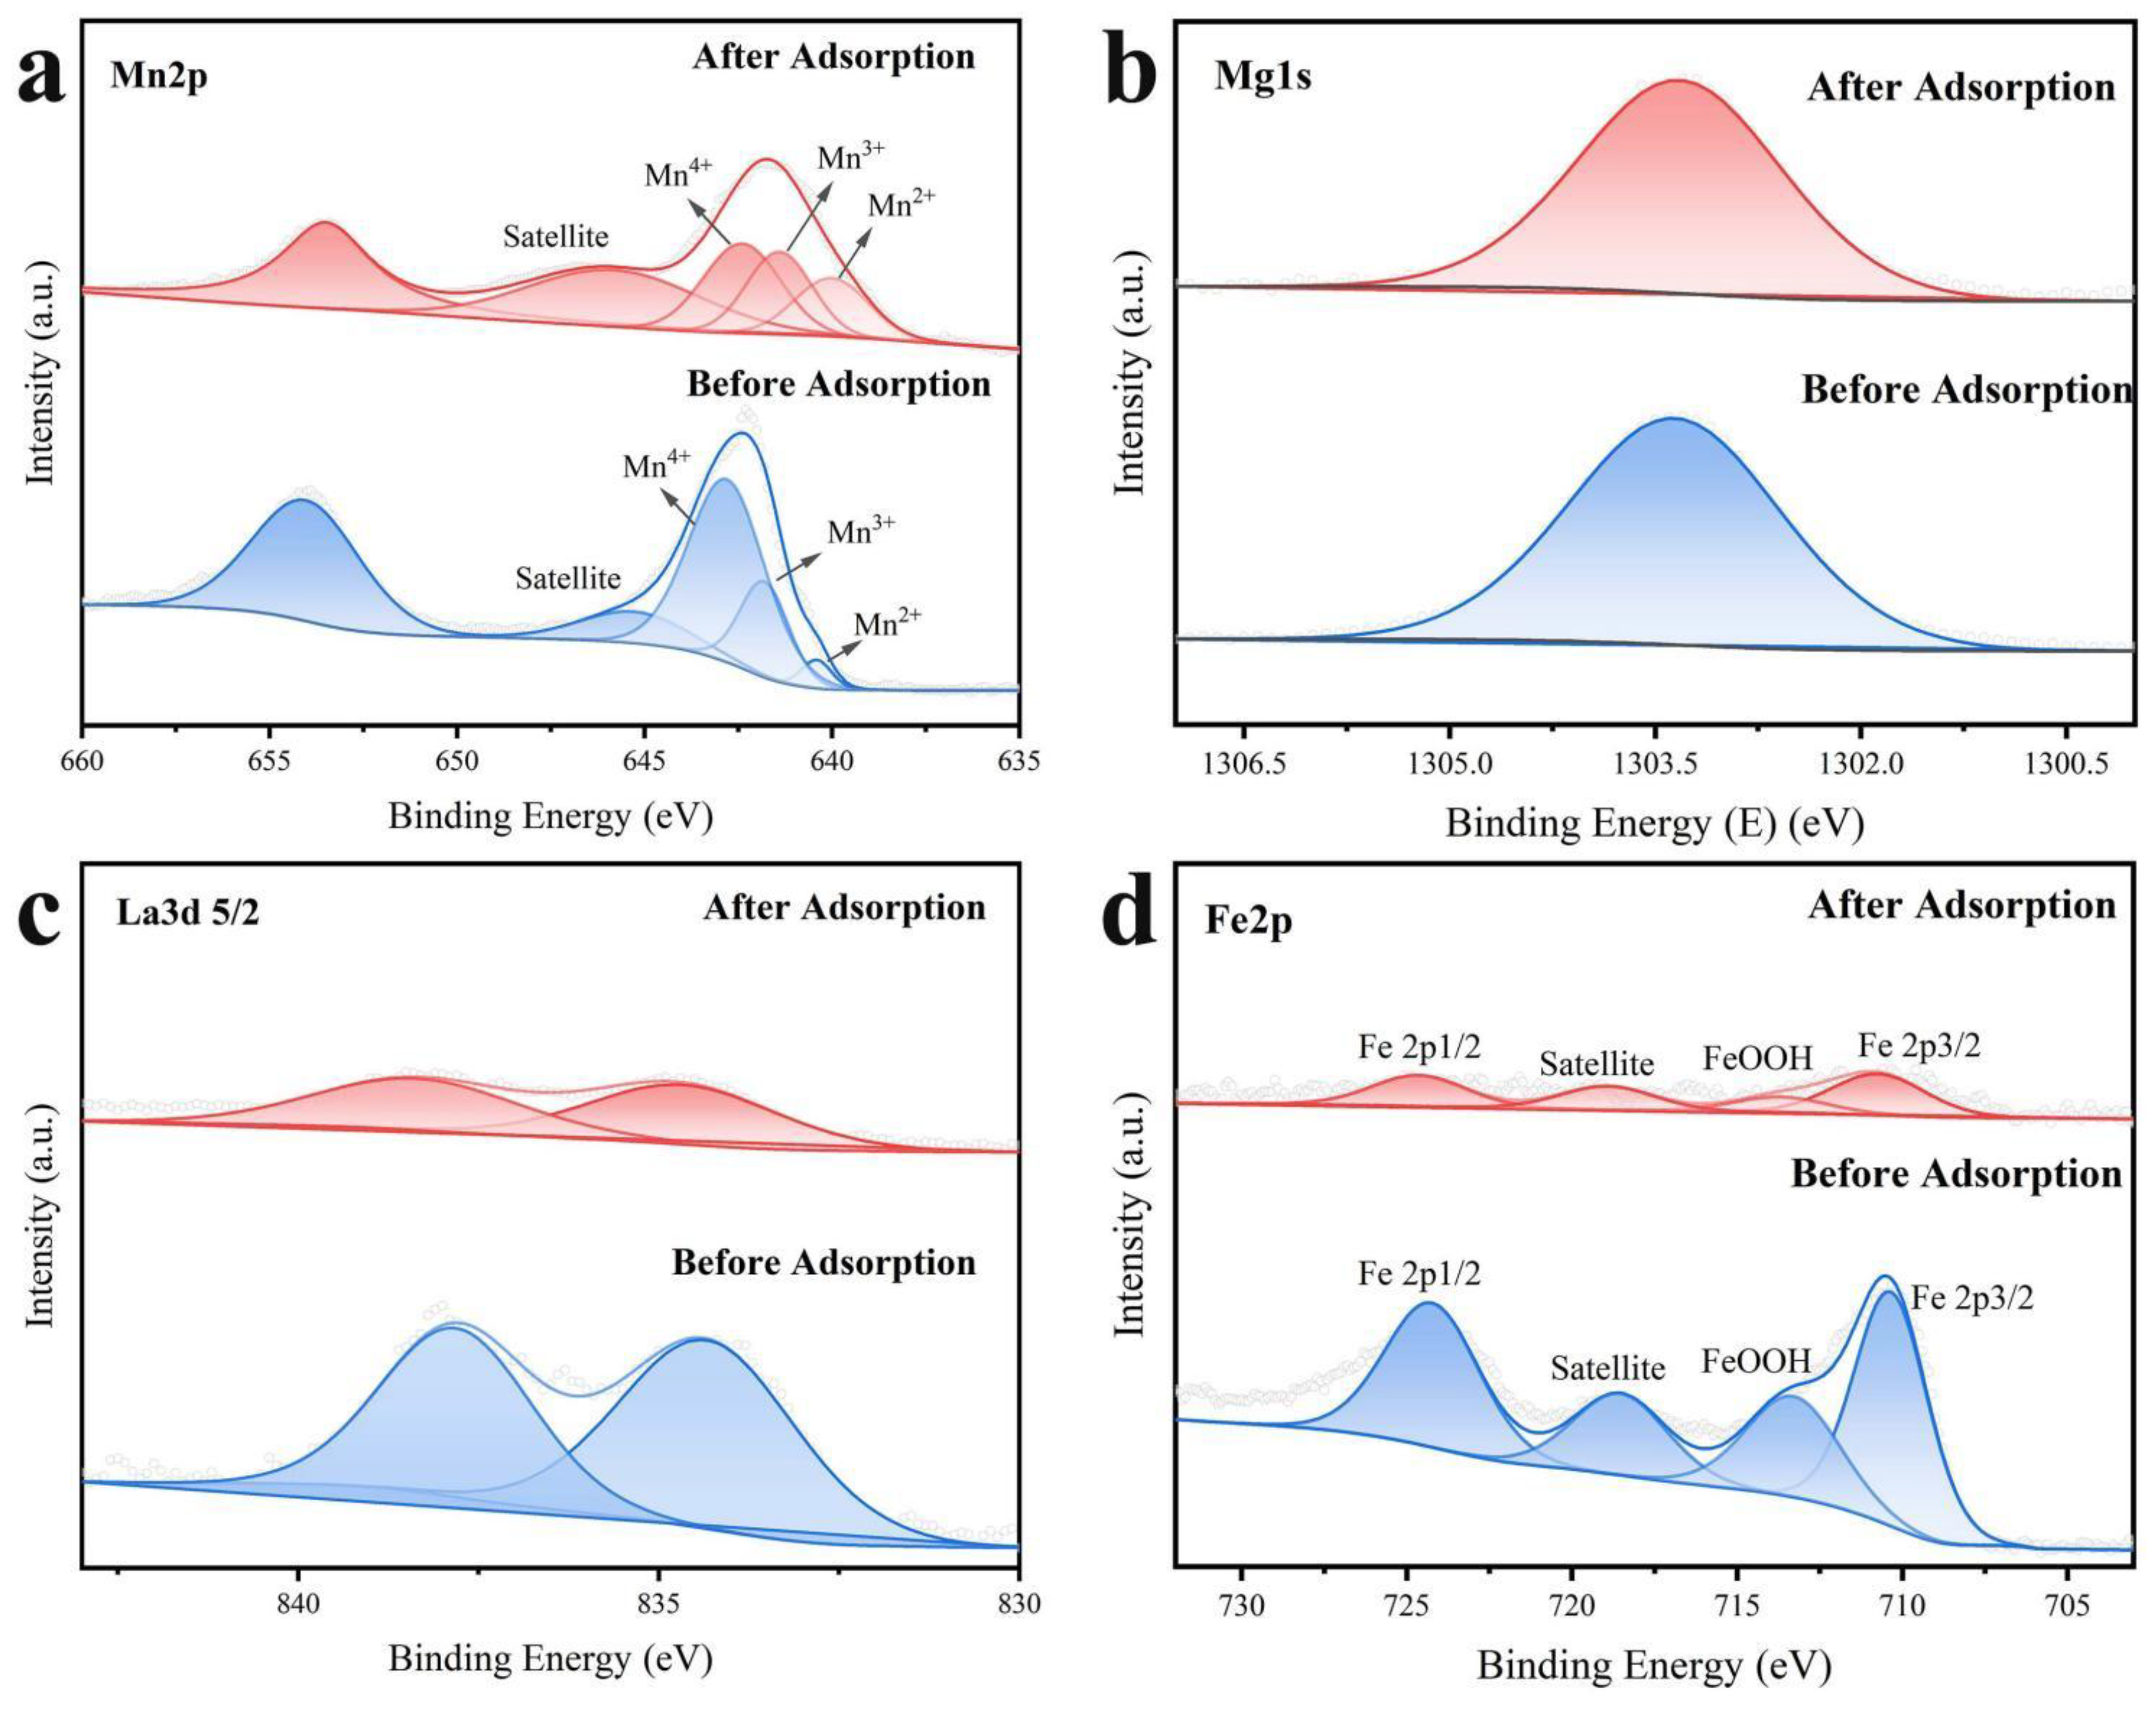
The XPS spectra for Mn 2p, Mg 1s, La3d 5/2, and Fe 2p before and after adsorption are presented in Figure 10. The Mn 2p 3/2 XPS spectra can be deconvoluted into four components with binding energies (BE) of 646.1, 642.5, 641.3, and 639.9 eV after adsorption (Figure 10a). These components could be attributed to the satellite peaks of the surface Mn 2+ species, and the Mn4+, Mn3+, and Mn2+ species, respectively. The typical satellite peaks produced by the Mn2+ shock effect were observed after adsorption, which indicated that significant redox reactions during the adsorption process accompanied the surface MnO2@LDO. Moreover, the molar ratio of Mn4+/(Mn3++ Mn2+) in MnO2@LDO (0.64) was significantly decreased after adsorption (0.49). It explained the efficient removal of As(Ⅲ) in the adsorption performance as well as the increase in As(V) at the beginning of adsorption. The intensity of the spectra of Mg1s in Figure 10b exhibited negligible alteration, while the binding energy revealed a negative shift of 0.1 eV. For the peaks in Figure 10c of La3d 5/2 and Figure 10d of Fe2p, there was a notable alteration in intensity. These findings implied that La and Fe have a significant chemisorption function in the adsorption of As(Ⅲ), As(V), and F-. It also further explained the results obtained in adsorption performance, isotherm fitting, and kinetic fitting.
Figure 10.
MnO2@LDO before and after As(Ⅲ), As(V) and F- co-adsorption XPS high-resolution spectra of (a) Mn2p; (b) Mg1s; (c) La3d 5/2; (d) Fe2p.
Figure 10.
MnO2@LDO before and after As(Ⅲ), As(V) and F- co-adsorption XPS high-resolution spectra of (a) Mn2p; (b) Mg1s; (c) La3d 5/2; (d) Fe2p.
4. Conclusion
In this work, Mg2+, La3+, and Fe3+ were anchored on the surface of α-MnO2 nanowires by a simple urea hydrothermal method, after which MnO2@LDO was obtained by further calcination. The experimental data suggested that the adsorption of As(V) and F- by MnO2@LDO followed the pseudo-second-order kinetic model, with the chemisorption process likely controlling the rate-limiting step. The Langmuir model more accurately describes the removal process of As(Ⅲ) by MnO2@LDO. It pointed to As(Ⅲ) acting as a monolayer through chemisorption on the surface of MnO2 nanowires in the material's heterostructure. The Freundlich model provides a better adsorption description for As(V) and F−, indicating a multilayered adsorption process for LDO-anchored MnO2 NW. Based on the adsorption performance, MnO2@LDO demonstrated a faster As(Ⅲ) removal rate and more robust co-adsorption performance than MnO2 and LDO. The high adsorption efficiency of the MnO2@LDO adsorbent was attributed to the coupling of the high oxidation efficiency of the MnO2 nanowires with the high adsorption efficiency for the As(V) and F- anions by the LDO material.
The findings of this work revealed that MnO2@LDO possessed excellent co-adsorption performance for As(Ⅲ), As(V), and F-, with corresponding adsorption capacities of 111.76 mg/g, 230.51 mg/g, and 765.10 mg/g. The experimental results suggested that MnO2@LDO could serve as a proficient adsorbent for eliminating arsenic and fluorine from water.
Author Contributions
Conceptualization, X.W.; methodology, X.W.; formal analysis, Wb.L. and W.L.; investigation: W.L. and H.W.; writing—original draft preparation, X.W.; writing—review and editing, X.W.; visualization, X.W.; supervision, J.Z.; project administration, J.Z.; funding acquisition, X.W. and J.Z. All authors have read and agreed to the published version of the manuscript.
Funding
This work was funded by Central Guided Local Science and Technology Development Fund Project (No. 2021ZY0042); Special Project for Fundamental Research Funds of China Institute of Water Resources and Hydropower Research (No. MK2022J14); Key special projects of the "Science and Technology for the Development of Inner Mongolia" initiative (No. 2022EEDSKJXMO04); Natural Science Foundation of Inner Mongolia Autonomous Region (No. 2022QN05031).
Data Availability Statement
The data presented in this study are available on request from the corresponding author.
Conflicts of Interest
The authors declare no conflict of interest.
References
- Dong, S.; Liu, B.; Chen, Y.; Ma, M.; Liu, X.; Wang, C., Hydro-geochemical control of high arsenic and fluoride groundwater in arid and semi-arid areas: A case study of Tumochuan Plain, China. Chemosphere 2022, 301, 134657. [CrossRef]
- Kumar, M.; Goswami, R.; Patel, A. K.; Srivastava, M.; Das, N., Scenario, perspectives and mechanism of arsenic and fluoride Co-occurrence in the groundwater: A review. Chemosphere 2020, 249, 126126. [CrossRef]
- World Health, O., Guidelines for drinking-water quality: fourth edition incorporating the first and second addenda. 4th ed + 1st add + 2nd add ed.; World Health Organization: Geneva, 2022.
- Podgorski, J.; Berg, M., Global analysis and prediction of fluoride in groundwater. Nature Communications 2022, 13(1), 4232. [CrossRef]
- Podgorski, J.; Berg, M., Global threat of arsenic in groundwater. Science 2020, 368(6493), 845-850. [CrossRef]
- Rawat, S.; Maiti, A., A hybrid ultrafiltration membrane process using a low-cost laterite based adsorbent for efficient arsenic removal. Chemosphere 2023, 316, 137685. [CrossRef]
- Kong, Y.; Ma, Y.; Huang, Z.; Ma, J.; Ding, L.; Nie, Y.; Chen, Z.; Shen, J.; Huang, Y., Characteristics and mechanisms of As(III) removal by potassium ferrate coupled with Al-based coagulants: Analysis of aluminum speciation distribution and transformation. Chemosphere 2023, 313, 137251. [CrossRef]
- Sandoval, M. A.; Fuentes, R.; Thiam, A.; Salazar, R., Arsenic and fluoride removal by electrocoagulation process: A general review. Science of The Total Environment 2021, 753, 142108. [CrossRef]
- Liu, B.; Kim, K.-H.; Kumar, V.; Kim, S., A review of functional sorbents for adsorptive removal of arsenic ions in aqueous systems. Journal of Hazardous Materials 2020, 388, 121815. [CrossRef]
- Yan, L.; Tu, H.; Chan, T.; Jing, C., Mechanistic study of simultaneous arsenic and fluoride removal using granular TiO2-La adsorbent. Chemical Engineering Journal 2017, 313, 983-992. [CrossRef]
- Alka, S.; Shahir, S.; Ibrahim, N.; Ndejiko, M. J.; Vo, D.-V. N.; Manan, F. A., Arsenic removal technologies and future trends: A mini review. Journal of Cleaner Production 2021, 278, 123805. [CrossRef]
- Rathi, B. S.; Kumar, P. S., A review on sources, identification and treatment strategies for the removal of toxic Arsenic from water system. Journal of Hazardous Materials 2021, 418, 126299. [CrossRef]
- Wei, Z.; Fang, Y.; Wang, Z.; Liu, Y.; Wu, Y.; Liang, K.; Yan, J.; Pan, Z.; Hu, G., pH effects of the arsenite photocatalytic oxidation reaction on different anatase TiO2 facets. Chemosphere 2019, 225, 434-442. [CrossRef]
- Gude, J. C. J.; Rietveld, L. C.; van Halem, D., As(III) oxidation by MnO2 during groundwater treatment. Water Research 2017, 111, 41-51. [CrossRef]
- Rana, A.; Kumari, N.; Tyagi, M.; Jagadevan, S., LeaF-extract mediated zero-valent iron for oxidation of Arsenic (III): Preparation, characterization and kinetics. Chemical Engineering Journal 2018, 347, 91-100. [CrossRef]
- Tang, Y.; Wang, J.; Gao, N., Characteristics and model studies for fluoride and arsenic adsorption on goethite. Journal of Environmental Sciences 2010, 22(11), 1689-1694. [CrossRef]
- Hou, J.; Tan, X.; Xiang, Y.; Zheng, Q.; Chen, C.; Sha, Z.; Ren, L.; Wang, M.; Tan, W., Insights into the underlying effect of Fe vacancy defects on the adsorption affinity of goethite for arsenic immobilization. Environmental Pollution 2022, 314, 120268. [CrossRef]
- Zhang, Y.; Qian, Y.; Li, W.; Gao, X.; Pan, B., Fluoride uptake by three lanthanum based nanomaterials: Behavior and mechanism dependent upon lanthanum species. Science of The Total Environment 2019, 683, 609-616. [CrossRef]
- Bibi, S.; Kamran, M. A.; Sultana, J.; Farooqi, A., Occurrence and methods to remove arsenic and fluoride contamination in water. Environmental Chemistry Letters 2017, 15(1), 125-149. [CrossRef]
- Luo, J.; Meng, X.; Crittenden, J.; Qu, J.; Hu, C.; Liu, H.; Peng, P., Arsenic adsorption on α-MnO2 nanofibers and the significance of (100) facet as compared with (110). Chemical Engineering Journal 2018, 331, 492-500.
- Ma, Z.; Fan, L.; Jing, F.; Zhao, J.; Liu, Z.; Li, Q.; Li, J.; Fan, Y.; Dong, H.; Qin, X.; Shao, G., MnO2 Nanowires@NiCo-LDH Nanosheet Core–Shell Heterostructure: A Slow Irreversible Transition of Hydrotalcite Phase for High-Performance Pseudocapacitance Electrode. ACS Applied Energy Materials 2021, 4(4), 3983-3992.
- Chubar, N.; Gilmour, R.; Gerda, V.; Mičušík, M.; Omastova, M.; Heister, K.; Man, P.; Fraissard, J.; Zaitsev, V., Layered double hydroxides as the next generation inorganic anion exchangers: Synthetic methods versus applicability. Advances in Colloid and Interface Science 2017, 245, 62-80. [CrossRef]
- Pei, Y.; Cheng, W.; Liu, R.; Di, H.; Jiang, Y.; Zheng, C.; Jiang, Z., Synergistic effect and mechanism of nZVI/LDH composites adsorption coupled reduction of nitrate in micro-polluted water. Journal of Hazardous Materials 2024, 464, 133023. [CrossRef]
- Meng, X.; Liu, T.; Qin, M.; Liu, Z.; Wang, W., Carbon-Free, Binder-Free MnO2@Mn Catalyst for Oxygen Reduction Reaction. ACS Applied Materials & Interfaces 2023, 15(16), 20110-20119.
- Wang, F.; Zheng, Y.; Chen, Q.; Yan, Z.; Lan, D.; Lester, E.; Wu, T., A critical review of facets and defects in different MnO2 crystalline phases and controlled synthesis – Its properties and applications in the energy field. Coordination Chemistry Reviews 2024, 500, 215537. [CrossRef]
- Han, L.; Liu, X.; Zhang, X.; Li, M.; Li, D.; Qin, P.; Tian, S.; Lu, M.; Cai, Z., Preparation of multivariate zirconia metal-organic frameworks for highly efficient adsorption of endocrine disrupting compounds. Journal of Hazardous Materials 2022, 424, 127559. [CrossRef]
- Lee, S.-H.; Tanaka, M.; Takahashi, Y.; Kim, K.-W., Enhanced adsorption of arsenate and antimonate by calcined Mg/Al layered double hydroxide: Investigation of comparative adsorption mechanism by surface characterization. Chemosphere 2018, 211, 903-911. [CrossRef]
- Li, H.; Hu, J.; Yao, L.; Shen, Q.; An, L.; Wang, X., Ultrahigh adsorbability towards different antibiotic residues on fore-modified selF-functionalized biochar: Competitive adsorption and mechanism studies. Journal of Hazardous Materials 2020, 390, 122127. [CrossRef]
- Xie, M.; Luo, X.; Liu, C.; You, S.; Rad, S.; He, H.; Huang, Y.; Tu, Z., Enhancing mechanism of arsenic(iii) adsorption by MnO2-loaded calcined MgFe layered double hydroxide. RSC Advances 2022, 12(40), 25833-25843. [CrossRef]
- Cao, Y.; Wu, X.; Li, B.; Tang, X.; Lin, X.; Li, P.; Chen, H.; Huang, F.; Wei, C.; Wei, J.; Qiu, G., Ca–La layered double hydroxide (LDH) for selective and efficient removal of phosphate from wastewater. Chemosphere 2023, 325, 138378. [CrossRef]
- Mrózek, O.; Ecorchard, P.; Vomáčka, P.; Ederer, J.; Smržová, D.; Slušná, M. Š.; Machálková, A.; Nevoralová, M.; Beneš, H., Mg-Al-La LDH-MnFe2O4 hybrid material for facile removal of anionic dyes from aqueous solutions. Applied Clay Science 2019, 169, 1-9.
- Wang, J.; Wu, L.; Li, J.; Tang, D.; Zhang, G., Simultaneous and efficient removal of fluoride and phosphate by Fe-La composite: Adsorption kinetics and mechanism. Journal of Alloys and Compounds 2018, 753, 422-432. [CrossRef]
- Wu, P.; Xia, L.; Liu, Y.; Wu, J.; Chen, Q.; Song, S., Simultaneous Sorption of Arsenate and Fluoride on Calcined Mg–Fe–La Hydrotalcite-Like Compound from Water. ACS Sustainable Chemistry & Engineering 2018, 6(12), 16287-16297. [CrossRef]
- Wang, Q.; Lin, Q.; Li, Q.; Li, K.; Wu, L.; Li, S.; Liu, H., As(III) removal from wastewater and direct stabilization by in-situ formation of Zn-Fe layered double hydroxides. Journal of Hazardous Materials 2021, 403, 123920. [CrossRef]
- Kwok, K. C. M.; Koong, L. F.; Al Ansari, T.; McKay, G., Adsorption/desorption of arsenite and arsenate on chitosan and nanochitosan. Environmental Science and Pollution Research 2018, 25(15), 14734-14742. [CrossRef]
- Pintor, A. M. A.; Vieira, B. R. C.; Santos, S. C. R.; Boaventura, R. A. R.; Botelho, C. M. S., Arsenate and arsenite adsorption onto iron-coated cork granulates. Science of The Total Environment 2018, 642, 1075-1089. [CrossRef]
- Zoroufchi Benis, K.; Soltan, J.; McPhedran, K. N., Electrochemically modified adsorbents for treatment of aqueous arsenic: Pore diffusion in modified biomass vs. biochar. Chemical Engineering Journal 2021, 423, 130061. [CrossRef]
- Zuo, Z.; Tian, Q.; Liu, D.; Yang, D.; Qiu, F.; Zhang, T.; Sun, X., Pollution control by waste: Dual metal sludges derived Ni-Al LDOs for efficient fluoride removal. Journal of Industrial and Engineering Chemistry 2023, in press. [CrossRef]
- Huang, Y.; Liu, Z.; Bo, A.; Tang, X.; Martens, W.; Kou, L.; Gu, Y.; Carja, G.; Zhu, H.; Sarina, S., High efficient arsenic removal by In-layer sulphur of layered double hydroxide. Journal of Colloid and Interface Science 2022, 608, 2358-2366. [CrossRef]

Table 1.
Parameters related to the Langmuir and Freundlich equations for fluorine and arsenic adsorption on MnO2@LDO.
Table 1.
Parameters related to the Langmuir and Freundlich equations for fluorine and arsenic adsorption on MnO2@LDO.
| MnO2@LDO | Langmuir model | Freundich model | |||||
| Qm(mg/g) | KL(L/mg) | r2 | KF | n | r2 | ||
| As(Ⅲ) | 111.76 | 0.0162 | 0.9849 | 4.7628 | 0.5882 | 0.9778 | |
| As(Ⅴ) | 230.51 | 0.0064 | 0.9465 | 3.1986 | 0.7236 | 0.9712 | |
| F- | 765.10 | 0.0029 | 0.9808 | 8.3411 | 0.6480 | 0.9849 | |
Table 2.
Comparison of adsorption capacities of different adsorbents for the removal of As(Ⅲ), As(Ⅴ) and F-.
Table 2.
Comparison of adsorption capacities of different adsorbents for the removal of As(Ⅲ), As(Ⅴ) and F-.
| Adsorbents | Qm of As(Ⅲ) (mg/g) | Qm of As(Ⅴ) (mg/g) | Qm of F- (mg/g) | t (min) | References |
|---|---|---|---|---|---|
| MnO2@LDO | 111.76 | 230.51 | 765.10 | 480 | This work |
| MnO2/MgFe-LDH | 53.79 | 1800 | [29] | ||
| ZnFe-LDHs | 62.11 | 200 | [34] | ||
| nanochitosan | 6.10 | 13.00 | 360 | [35] | |
| iron-coated cork granulates | 4.9 | 4.3 | 960 | [36] | |
| optimum modified biochar | 10.2 | 90 | [37] | ||
| Mg/Fe/La CHLc | 81.40 | 73.80 | 450 | [33] | |
| Ni-Al LDOs/sludge | 47.075 | 100 | [38] | ||
| TiO2-La | 114 | 78.4 | 900 | [10] | |
| In layer sulphur of LDH | 40.8 | 120 | [39] |
Table 3.
Parameters related to the Pseudo-first-order model and Pseudo-second-order model for fluorine and arsenic adsorption on MnO2@LDO.
Table 3.
Parameters related to the Pseudo-first-order model and Pseudo-second-order model for fluorine and arsenic adsorption on MnO2@LDO.
| MnO2@LDO | Pseudo-first-order model | Pseudo-second-order model | |||||
| qe(mg /g) | k1(min−1) | r2 | qe(mg /g) | k2(g/mg∙ min−1) | r2 | ||
| As (Ⅲ) | 9.75 | 0.0010 | 0.9867 | 11.40 | 0.0011 | 0.9973 | |
| As (Ⅴ) | 9.99 | 0.0117 | 0.9944 | 11.60 | 0.0011 | 0.9821 | |
| F- | 187.71 | 0.0133 | 0.9845 | 213.24 | 0.0001 | 0.9770 | |
Table 4.
The binding energy of C1s and O 1s before and after co-adsorption.
| Samples | C1s | O1s | ||||
|---|---|---|---|---|---|---|
| C=O | C-O | C-C | C=O | C-O | M-OH | |
| MnO2@LDO | 289.0 | 286.5 | 284.8 | 533.8 | 531.7 | 529.8 |
| MnO2@LDO after adsorption | 288.7 | 286.3 | 284.8 | 532.9 | 531.4 | 529.6 |
Disclaimer/Publisher’s Note: The statements, opinions and data contained in all publications are solely those of the individual author(s) and contributor(s) and not of MDPI and/or the editor(s). MDPI and/or the editor(s) disclaim responsibility for any injury to people or property resulting from any ideas, methods, instructions or products referred to in the content. |
© 2023 by the authors. Licensee MDPI, Basel, Switzerland. This article is an open access article distributed under the terms and conditions of the Creative Commons Attribution (CC BY) license (http://creativecommons.org/licenses/by/4.0/).
Copyright: This open access article is published under a Creative Commons CC BY 4.0 license, which permit the free download, distribution, and reuse, provided that the author and preprint are cited in any reuse.


