
Submitted:
08 December 2023
Posted:
08 December 2023
You are already at the latest version
Abstract
The surface electromyogram (sEMG)--based gesture recognition to the development of intelligent prostheses has emerged as a promising avenue for upper limb amputees. However, the temporal variations in sEMG have rendered recognition models less efficient than anticipated. Cross-session calibration and training data indicate the capacity to reduce this variation. The impact of varying calibration and training data amounts on gesture recognition performance for amputees is still unknown. To assess these effects, we present four datasets for the evaluation of calibration data and examine the impact of training data volume on benchmark performance. Two amputees who had undergone amputations years prior were recruited and seven sessions of data were collected for analysis from each of them. The experimental results show that the calibration data improved the average accuracy per subject by 3.03% and 6.16%, respectively, compared to the baseline results. Moreover, it was found that to collect training data for modeling, boosting the number of training sessions proves more efficient than increasing the number of trials within a single session. Two potentially effective strategies are proposed in light of this research to enhance the cross-session models further. We consider these findings to be of the utmost importance for the commercialization of intelligent prostheses, as they demonstrate the criticality of gathering calibration and cross-session training data, as well as offer effective strategies for maximizing the utilization of the entire dataset.
Keywords:
surface electromyogram
; cross-session gesture recognition
; model calibration
; amputee
; intelligent prostheses
1. Introduction
Annually, a total of 22,211 amputations of the upper limb are conducted in 27 European Union member states and the United States [1]. Physical disability has a profound impact on the well-being and quality of life of affected individuals, resulting in detrimental physical and psychological consequences [2,3]. Intelligent prostheses have emerged as a prospective technological solution to address this challenge, facilitating fundamental hand movements for amputees [4,5,6,7]. An essential aspect of this innovative approach referred to as sEMG-based hand gesture recognition, is its ability to decode sEMG from the muscles of the residual upper limbs of amputees as they endeavor to regain control over their hands [8,9].
Nevertheless, the temporal fluctuations observed in sEMG pose a significant challenge to gesture recognition. While pre-trained recognition models demonstrate satisfactory estimation accuracy in intra-session scenarios, their performance tends to deteriorate significantly in cross-session scenarios [10,11]. These deficiencies, which are hindering the efficacy of intelligent prostheses from reaching their expected potential [12], can be attributed to various external factors, including but not limited to muscle fatigue, electrode shift, variations of contraction forces, and arm position effects [13]. Thus, pre-trained models with limited training session data are greatly restricted to mitigate these risks [14,15].
Recently, two strategies have been put forth to overcome the existing bottleneck. First, the augmentation of training data sessions demonstrates promise in reducing the temporal variability of sEMG signals. In a study [16], the researchers examined inter-day recognition errors by utilizing fixed and incremental training data. The findings revealed that the use of incremental training data yielded significantly better outcomes in comparison to the use of fixed training data. Second, the utilization of calibration data, derived from the distribution of unseen data, has also demonstrated efficacy in mitigating the impact of EMG variations [11,17,18,19]. It was found that the system with transfer learning (using calibration data) could significantly lessen the impact of electrode shifts (simulating cross-session) in the Box and Beans test [19]. However, a limited number of the aforementioned studies have utilized data from individuals with amputations or have effectively verified the calibration data through multiple experiments conducted across different sessions. The evolution of gesture recognition performance for amputees in the presence of varying quantities of training and calibration data remains uncertain, as does the optimal amount of training data required to achieve an acceptable level of accuracy.
To address the above questions, we conducted a quantitative analysis of sEMG-based gesture recognition on a cross-session and amputee-independent dataset. We presented the impact of calibration data, both alone and in conjunction with training data, on performance, as well as the contribution of the number of training data sessions and trials to baseline accuracy. The primary contributions of this study can be succinctly outlined as follows. First, we enlisted two chronic amputee volunteers and constructed a sEMG-based gesture database comprising seven sessions, with twenty trials per session for each. Next, we conducted feature visualization using the cross-session databases in order to depict the temporal and gesture-dependent feature variation. Then, four datasets were created to evaluate the impact of calibration data on the performance, named as baseline, calibrated, updated, and cumulative datasets. Finally, we investigated how increasing the number of training sessions and trials affected the pre-trained models in the baseline dataset.
In the subsequent sections of this paper, Materials and Methods provides an introduction to the human participants involved in this research as well as an overview of the data collection, expounds upon methods for detecting EMG activity and extracting their features, and describes two techniques for visualizing feature variation and two validation approaches for investigating the impact of calibration and training data on gesture recognition using the selected classifier and the performance metric. Results details the experimental results of the proposed methods. Discussion examines the challenges associated with enhancing cross-session performance, evaluates the efficacy of calibration and training data, and proposes two prospective approaches for addressing cross-session issues in subsequent research. Conclusion sums up the main points of this study.
2. Materials and Methods
2.1. Data Description
Two male amputees were included in this study, one with a 30-year history of right-arm amputation, aged 55 (Subject S1), and the other with a 26-year history of double-hand wrist disarticulation, aged 36 (Subject S2). Both of them are right-handed and performed experiments with the right hand. Ethical approval was granted by the Institutional Ethics Committees from the Fourth Medical Center of PLA General Hospital, Beijing, China, and informed consent to participate in the study was obtained from each subject before the experiment. All experiments were performed in accordance with relevant guidelines and regulations.
First, we designed three daily-use gestures for Subject S1 and five for Subject S2 (Figure 1). Then, for each subject, gesture collection was split up into seven separate sessions. Every session began with a fresh set of electrodes and the same content of collection tasks. Each session involved three trials for Subject A1, wherein the three gestures were performed consecutively, and five trials for Subject A2, wherein the five gestures were performed sequentially. Every gesture was executed for three seconds in each trial, with a three-second break in between, for a total of twenty sets of actions.
The same EMG recording system, which included a commercial microcomputer and a self-designed signal acquisition circuit (Figure 2), was used in all experiments. The signal electrode number was designed as eight for the EMG signal acquisition circuit (36.5mm*28.5mm*4mm), with the REF electrode as the unified reference electrode and the RLD electrode as the input of the right leg driver to reduce the common-mode interference. A second-order low-pass filter analog front-end circuit was designed to filter out high-frequency noises before the signal digitization. The low-power ADS1298R chip was used for physiological electrical signal measurement with an 8-channel 24-bit analog-to-digital converter. As the main control chip, NRF52832 controls the ADS1298R chip through the SPI communication protocol to collect 8-channel sEMG signals and sends them to the upper computer through the serial port. The upper computer was deployed on a commercial microcomputer, the Cortex-A72 (ARM v8) 64-bit SoC @ 1.5GHz Raspberry Pi 4B/8GB platform (9.4cm*6.9cm*2.5cm), and communicates with the Personal Computer (Intel (R) Core (TM) i7-8750H CPU @ 2.20GHz 2.21 GHz) through WIFI for data transmission and command execution. The system is powered and rechargeable by lithium batteries, which has the advantages of small size, portability, and easy use. The positions of medical gel electrodes (CH50B, Shanghai Hanjie Electronic Technology Co., LTD., Shanghai, China) attached to each subject remained almost constant for each data collection session.
2.2. Signal Preprocessing
Data preprocessing in this study involved EMG signal preprocessing, EMG activity detection, and feature extraction. The signals were divided into frames using a sliding window of 128ms with a 64ms overlap, with a sampling frequency of 1000Hz. A Butterworth fourth-order zero-phase bandpass filter (20Hz-450Hz) was selected to eliminate noise, including that which is inherent in electronic devices (ranging from 0 Hz to several thousand Hz), caused by the quasi-random nature of EMG (ranging from 0 Hz to 20 Hz), and motion artifacts (ranging from 0 Hz to 10 Hz) [23]. The Hanning window was applied to reduce spectral leakage by truncating the filtered frames.
EMG Activity Detection (EAD) was then used to determine whether a given EMG signal contains EMG information, i.e., effective EMG corresponding to gesture execution (Supplementary Figure 1). Typical EAD methods include feature extraction and EMG/non-EMG determination. In this study, the extracted feature was the short-term energy of sub-bands (Table 1), and the decision model was the unsupervised learning method based on the Gaussian Mixture Model (GMM). A total of 14,000 activity frames were extracted for Subject S1 and 35396 activity frames were extracted for Subject S2 (Supplementary Table 1) in preparation for the ongoing feature engineering and modeling.
Table 1 lists every feature that was extracted for this study, including both intra- and inter-channel features. The intra-channel features are divided into three subcategories: time domain features, frequency domain features, and autoregressive coefficient. The inter-channel feature encompasses Pearson’s Correlation Coefficient. Therefore, each activity frame, associated with the 8-channel signals, produces a total of 112 intra-channel features and 28 inter-channel features, resulting in a 140-dimensional feature vector.
2.3. Feature Visualization
To address the issue of hand gesture recognition performance degeneration cross sessions, it is essential to first visualize the variation of signals. From the aforementioned feature extraction work, it is possible to generate a graph depicting the evolution of feature distribution over time. Two methods of feature visualization are introduced here, either individually or comprehensively. We utilized a probability density curve for independent feature visualization to observe the evolution of the distribution of a single feature over time. We utilized principal component analysis (PCA) for comprehensive feature information visualization to demonstrate the degree of feature distribution overlap for a single gesture over time.
2.4. Cross-Session Validation
We aimed to examine the efficacy of gesture recognition in cross-session data and explore strategies for optimizing model training in real-world applications. To this end, we established four distinct datasets to facilitate cross-session validations. These datasets were derived from four separate sets, as depicted in Figure 3. The training set comprised all trials conducted during sessions 1-2, the validating set consisted of all trials conducted during session 3, the calibration set consisted of the initial 5 trials conducted during sessions 4-7, and the testing set comprised the final 15 trials conducted during sessions 4-7.
The purpose of the validating set was to ascertain the optimal classifier and its corresponding parameters by training on the training set. The calibrating set consisted of a range of 1 to 5 trials of data obtained from the testing session (sessions 4-7). The classifier was tested on the same testing set to obtain all the final results.
The baseline dataset, comprising the training and validating sets, was used to obtain a benchmark result, which is an empirical way to train a gesture recognition model for prostheses [9]. The calibrated dataset, consisting only of the calibrating set, was used to achieve an intra-session result, without the effort of collecting data beforehand. The updated dataset, including training, validating, and calibration sets, was used to investigate the contribution of calibration data compared with the benchmark result. The cumulative dataset, including training, validating, and all previous calibrating sets, was used to evaluate the effects of continuously adding the previous calibration data into the dataset. A comparison of these four datasets will provide insight into the effectiveness of using the calibration data.
2.5. Amount of Training Data Validation
We also sought to determine the amount of training data required to achieve a relatively satisfactory benchmark result. To this end, we trained our model using a variety of training sets and only evaluated it using the data from session 7. The number of training sessions varied between 1 and 6, with each session consisting of training trials ranging from 1 to 20. Consequently, a total of 120 distinct training sets were generated, each differing in scale. An analysis of these training sets will provide insight into how the quantity of data, as measured by the number of sessions and trials, impacts the performance of gesture recognition for cross-session datasets.
2.6. Classifiers and Evaluation Metric
Commonly used shallow learning methods were chosen as classifiers due to their simplicity, efficiency, and ease of use compared to deep learning methods. After testing several classifiers on the baseline dataset, including KNN, SVM, MLP, LGBM, and XGBoost, it was discovered that SVM performed the best in terms of accuracy and training time (Supplementary Table 2). As a result, SVM was selected for the subsequent tests.
The classification performance was assessed by its accuracy, calculated as the number of correctly classified samples divided by the total number. To smooth out the classification results, a post-processing technique was applied. This technique groups three consecutive classification results and selects the mode of the results as the final predicted class. The data processing, visualization of features, classification, and evaluation were all carried out using Python 3.6.
3. Results
3.1. Feature Distribution Visualization
Figure 4 shows the distribution of features across varying conditions for two subjects. Figure 4(a) and Figure 4(b) illustrate the probability density curves for the Root Mean Square (RMS) feature in a single session and across 7 sessions, respectively. By conducting a visual analysis of the distribution of individual features, it becomes evident that there is variation in the distribution not only within a single session but also across multiple sessions. The latter case exhibits more pronounced variations. While certain distributions among sessions may exhibit similarities, others may display greater dissimilarity. In the case of subject S1, the distribution of session 7 (yellow curve) exhibits greater similarity to that of session 3 (green curve) as compared to session 4 (black curve) (Figure 4(b)). The disparity may be magnified when performing Principal Component Analysis (PCA) on the datasets. Figure 4(c) depicts the tridimensional distribution of the first three principal components across the seven sessions of the identical gesture for each participant. This visualization has the potential to provide a more comprehensive understanding of the variation in distribution across different sessions. This is because Principal Component Analysis (PCA) is capable of effectively reducing the dimensionality of the data, thereby eliminating noise and irrelevant features while retaining the most significant ones. In relation to subject S2, it can be observed that the degree of overlap between session 5 (purple dots) and session 6 (red dots) is considerably greater compared to that between session 5 and session 1 (blue dots) (Figure 4(c)).
3.2. Overall Comparison of the Four Datasets
Table 2 displays the overall performance and eventual improvement for different datasets. The accuracy of the final dataset (cumulative dataset) was improved in 9 out of 10 instances (except for the 1 calibration trial for S1, which was reduced by 0.16%), with an overall average improvement of 4.58%. As the number of calibration trials for each type of dataset increases, so does the accuracy, which is consistent with expectations. This enhancement differs between individuals and calibration trials. For example, as the number of calibration trials increased from 1 to 5, the accuracy of the calibrated dataset for subject S1 increased by 15.44% (from 71.31% to 86.75%), while that of the cumulative dataset increased by 9.41% (from 75.21% to 84.62%). However, the improvement appears to be less pronounced for Subject S2, with a 9.15% improvement for the calibrated dataset and a 2.03% improvement for the cumulative dataset. There was not always an improvement in accuracy when comparing the results longitudinally by fixing the number of calibration trials. For subject S1, the accuracy decreased when the calibration trials were set to 3, 4, and 5. For subject S2, the accuracy dropped at the 5 calibration trials.
To provide a macro-level interpretation of the findings, it is observed from the final column (Average) of Table 2 that the inclusion of calibration data has the potential to enhance accuracy to a certain extent. Specifically, for subject S1, the accuracy improved by 6.16%, while for subject S2, the improvement was 3.03%. These results validate the effectiveness of calibrating gesture recognition models for everyday applications of intelligent prostheses.
3.3. Performance of Different Datasets Across Sessions
Additionally, we provide a micro-level analysis of the datasets, illustrating the fluctuations in accuracy across different sessions (Figure 5). To facilitate a straightforward comparison, the results produced by the cumulative dataset have been excluded here, as their contribution appears to be comparable to that of the updated dataset (Table 2).
Surprisingly, the performance of the three datasets exhibits significant variation across sessions. Not invariably does the baseline dataset exhibit the worst performance. The baseline dataset achieved the maximum accuracy for subject S1 in session 4 but maintained the minimum accuracy in session 7. The updated dataset did not consistently outclass the calibrated dataset. For subject S2, the updated dataset displayed superior performance in sessions 4 and 6, and the performance of both was comparable in session 7. This disparity is also evident in the last column Table 2, where the updated dataset has a higher average accuracy than the calibrated dataset for subject S1 (81.70% versus 81.25%), while the opposite is true for subject S2 (89.40% versus 93.53%).
Despite the divergent trends, the updated dataset produced more stable results, indicating that the calibration trials have less of an impact on the updated dataset. For example, session 5 for subject S1 and session 6 for subject S2 exhibited steady upward trends in the updated dataset, while witnessing noticeable increases in the calibrated dataset. This discovery may offer a justification for the significance of collecting a baseline dataset for gesture recognition models before their incorporation into intelligent prosthetic devices, as the baseline dataset ensures basic and stable performance.
3.4. Performance of Increasing the Amount of Training Data
Figure 6 illustrates how the quantity of training data affects gesture recognition performance. To simplify matters, we limited our experiment to the baseline dataset. As expected, performance improved with an increased number of collected sessions and trials.
However, there exists a discernible pattern of diminishing marginal benefits when the number of trials is increased. Substantial increases in accuracy, followed by fluctuations, are observed during the initial 6 trials for subject S1 and during the initial 7 trials for subject S2. In the case of subject S1, the curve of session 1 exhibits an initial increase from around 55% to 70%, followed by a period of stability. Regarding subject S2, the progression of the curve sessions 1-6 exhibits an initial increase from 86% to 92%, followed by a period of stability. Such a pattern of diminishing marginal benefits is not readily apparent in the increase of the session numbers. For subject S1, as the number of trials increased to 20, there was a consistent level of performance between session 1 and sessions 1-4. A substantial improvement was noted in sessions 1-5, followed by an even greater improvement in sessions 1-6. For subject S2, sessions 1-5 and sessions 1-6 exhibited comparable performance, while sessions 1-2 to sessions 1-4 yielded similar outcomes, surpassing the performance of session 1.
This finding could suggest that augmenting the number of sessions yields greater efficacy compared to increasing the number of trials. To illustrate, 6 trials can be collected in 1 session or split across 6 sessions. For subject S1, the accuracy was about 70% when 6 trials were collected in a single session (curve for session 1), and increased to around 77% when the same number of trials were collected from 6 different sessions (curve for sessions 1-6). This distinction is further highlighted in the case of subject S2. It is comparable to collecting 40 trials from 4 sessions (curve of sessions 1-4 at 10 trials, 84.92%) versus collecting only 6 trials from 6 sessions (curve of sessions 1-6 at 1 trial, 86.70%).
As there are no established criteria for the amount of baseline data required before proceeding with the use of prostheses, these experimental findings highlight the significance of the number of trials and sessions to be collected.
4. Discussion
4.1. Difficulty of Improving Cross-Session Performance
This study is aimed to provide insights into improving gesture recognition performance in real-world scenarios by assessing the quantitative impact of training data and calibration data on cross-session datasets. It is important to acknowledge that neither the electrode positions for each session were recorded nor were each electrode firmly attached to a fixed position. Instead, each electrode had a general position on the arms. We consider this approach to be more effective in simulating the electrode shifts.
Based on the feature distribution across sessions, as depicted in Figure 4, it is evident that the distributions of individual features acquired from each session exhibited a moderate degree of overlap (Figure 4(b)). This overlap was further diminished when the distributions of the first three principal components were taken into account (Figure 4(c)). In the same way [16], histograms of time-domain features were presented at three distinct sensor placements across sessions. It is concluded that alterations in the sEMG data distribution resulted in gesture recognition instability over several days [16]. In addition, it is not possible to ensure absolute stability in the performance of sEMG data collected from the same sensor placement for extended periods of time [16]. Nevertheless, cross-session is not the sole determinant of the fluctuations that have occurred in sEMG over time. It is evident from Figure 4(a) that variations can occur even when the electrodes are fixed during one session.
Despite the fact that the causes of these variations may be diverse and obscure, distribution overlaps continue to exist both between and within sessions, facilitating the development of stable gesture recognition models by machine learning algorithms.
4.2. Effectiveness of Calibration Data
We first demonstrated that incorporating calibration data can mitigate these variations. To illustrate, Table 2 and Figure 5 depict how calibration data influences the gesture recognition model. Experimental evidence suggests that the inclusion of calibration data in baseline datasets (updated and cumulative datasets) leads to improved performance. Furthermore, performance tends to increase as the amount of calibration data increases. One potential rationale could be that the calibration data are generated from a partial distribution of the testing data, wherein the physiological characteristics of the subjects remain consistent and the positions of the electrodes are held constant. Additional calibration data collected for the updated dataset tend to increase its similarity to the testing dataset, thereby mitigating the effects of electrode shifts and physiology-induced variation.
4.3. Effectiveness of Training Data
We also demonstrated that augmenting training data can reduce the risks of sEMG variations. Expanding the training data has a profound effect on gesture recognition, as illustrated in Figure 6. For both subjects, 6 sessions with 20 trials each resulted in a 25% increase in accuracy (around 95%) compared to 1 session with 20 trials (around 70%). Although both augmentation of sessions and trials contribute to performance enhancement, their respective contributions are distinct. The distribution of data collected in a single session tends to be similar, which accounts for the diminishing marginal benefits as the number of trials increases. Increasing the number of sessions, which is more effective when the number of trials remains constant, does not, however, produce any discernible diminishing marginal benefits. This is because different electrode shifts, the varying physiological states of subjects, and other factors are all taken into account over multiple sessions. As a result, there is a greater chance that the distribution of testing data will overlap with that of previous sessions. Despite the limited number of sessions under investigation, it can be inferred that a turning point, characterized by diminishing marginal benefits, is likely to manifest with further increases in the number of sessions.
We believe that our findings could aid in the commercialization of intelligent prostheses and benefit their users. As intelligent prosthetic systems are personalized and worn daily by the same user, it is necessary to collect training data for developing user-dependent gesture recognition models. During data collection, the number of sessions and trials should be taken into account as they significantly impact long-term accuracy. Additionally, it is recommended for users to calibrate the system prior to use to achieve stable performance. The amount of calibration data collected pre-use is at the discretion of the user. As usage time increases, calibration data accumulates, enriching the distribution of training data and improving system performance. It is worth noting that even in the absence of calibration data collection, the system could still operate satisfactorily due to the potential inclusion of calibration data from multiple sessions within the existing training data.
4.4. Future Work
In light of our findings, two approaches that have been previously tested may be investigated in an effort to further improve the performance of long-term gesture recognition models for amputees. To begin, calibration data could be utilized to fine-tune the pre-trained models via transfer learning. Transfer learning, which frequently employs deep learning algorithms, shows potential in addressing domain shift issues [13,16,24,25]. These issues frequently arise in cross-session gesture recognition scenarios and occur when a model trained in one domain (sessions to collect training data) cannot be adapted to another domain (sessions to collect testing data). A deep learning-based architecture to calibrate a pre-trained gesture recognition model was developed in a study, where it was discovered that recalibrating with a small quantity of single session data (referred to as calibration data) resulted in an accuracy of 79.5% for that session [26]. This is in contrast to architectures that either learn exclusively from the training data or solely from the single session (55.2% and 49.6%, respectively). Hence, it is advantageous to implement transfer learning based on deep learning on the dataset utilized in this research. Second, the models could be routinely fine-tuned through the use of self-recalibration. Fine-tuning the model routinely is attainable by the prediction outcomes of the unseen data (which will be the self-recalibration data) that have been primarily corrected via a multi-vote method [27]. It is assumed that adjacent sEMG segments most probably correspond to the same category of hand gestures. In a study, a self-recalibration system demonstrated an average improvement in classification accuracy of <2.99% (11 amputees, 10 movement types) over five testing trials using self-calibration data compared to the unrecalibrated classifier [27]. Utilizing long-term daily data, the self-calibration technique holds promise for enhancing the training data and bolstering the robustness of the prosthetic system without requiring additional effort to calibrate the system.
5. Conclusions
In order to mitigate the decline in gesture recognition performance across multiple sessions in the context of intelligent prostheses, we assessed the effectiveness of calibration data and examined the impact of varying amounts of training data on pre-trained models. First, we recruited two subjects who had undergone amputations several years ago and collected a total of 7 sessions of data from each participant. This dataset presents a valuable opportunity to examine the efficacy of cross-session gesture recognition. Next, by means of feature distribution visualization, it was determined that the variations in sEMG occur not only across different sessions but also within individual sessions. Then, through the comparative analysis of four datasets, the experimental findings demonstrate that the inclusion of calibration data yielded average accuracy improvements of 6.16% and 3.03% for each subject when compared to the baseline results. The utilization of the updated dataset was able to generate a more consistent performance in comparison to the calibrated dataset. The aforementioned findings provide empirical evidence that underscores the importance of acquiring cross-session training data and calibration data. In order to enhance the efficacy of training data collection, we conducted a comprehensive analysis of the impact of training data at both the session and trial levels. While it is evident that there are diminishing marginal benefits associated with increasing the number of trials within a single session, it is argued that the effectiveness and importance of increasing the number of sessions outweigh this factor. Finally, two potential strategies are suggested for enhancing the cross-session performance of gesture recognition in future research. The significance of these findings lies in their potential to enhance the usability and durability of commercially available intelligent prosthetic devices, thereby leading to an overall enhancement in the well-being and quality of life for individuals with limb loss.
Supplementary Materials
The following supporting information can be downloaded at the website of this paper posted on Preprints.org.
Funding
This research was funded in part by the National Key R&D Program of China (2021YFB3200600, 2020YFC2004500), in part by National Natural Science Foundation of China (NSFC) under Grant 62073307, 62273321, 62204243, 61774157 and 81771388, in part by CAMS Innovation Fund for Medical Sciences (2019-I2M-5-019), in part by CAS Joint Fund for Equipment Pre-Research (8091A140106), and in part by Shanghai Municipal Science and Technology Major Project (2021SHZDZX).
Institutional Review Board Statement
The study was conducted in accordance with the Declaration of Helsinki, and approved by the Institutional Ethics Committee of the Fourth Medical Center of PLA General Hospital.
Informed Consent Statement
Informed consent was obtained from all subjects involved in the study.
Data Availability Statement
The datasets used and analyzed in this study are available from the corresponding author upon reasonable request.
Conflicts of Interest
The authors declare no conflict of interest.
References
- Raspopovic, S.; Valle, G.; Petrini, F.M. Sensory feedback for limb prostheses in amputees. Nat. Mater. 2021, 20, 925–939. [Google Scholar] [CrossRef] [PubMed]
- Sagar, R.; Sahu, A.; Sarkar, S.; Sagar, S. Psychological effects of amputation: A review of studies from India. Ind. Psychiatry J. 2016, 25, 4–10. [Google Scholar] [CrossRef] [PubMed]
- Ligthelm, E.J.; Wright, S.C. Lived experience of persons with an amputation of the upper limb. Int. J. Orthop. Trauma Nurs. 2014, 18, 99–106. [Google Scholar] [CrossRef]
- Zhuang, K.Z.; Sommer, N.; Mendez, V.; Aryan, S.; Formento, E.; D’anna, E.; Artoni, F.; Petrini, F.; Granata, G.; Cannaviello, G.; et al. Shared human–robot proportional control of a dexterous myoelectric prosthesis. Nat. Mach. Intell. 2019, 1, 400–411. [Google Scholar] [CrossRef]
- Nguyen, A.T.; Drealan, M.W.; Luu, D.K.; Jiang, M.; Xu, J.; Cheng, J.; Zhao, Q.; Keefer, E.W.; Yang, Z. A portable, self-contained neuroprosthetic hand with deep learning-based finger control. J. Neural Eng. 2021, 18, 056051. [Google Scholar] [CrossRef] [PubMed]
- Fang, B.; Wang, C.; Sun, F.; Chen, Z.; Shan, J.; Liu, H.; Ding, W.; Liang, W. Simultaneous sEMG Recognition of Gestures and Force Levels for Interaction With Prosthetic Hand. IEEE Trans. Neural Syst. Rehabilitation Eng. 2022, 30, 2426–2436. [Google Scholar] [CrossRef] [PubMed]
- Lee, C.; Vaskov, A.K.; A Gonzalez, M.; Vu, P.P.; Davis, A.J.; Cederna, P.S.; A Chestek, C.; Gates, D.H. Use of regenerative peripheral nerve interfaces and intramuscular electrodes to improve prosthetic grasp selection: a case study. J. Neural Eng. 2022, 19, 066010. [Google Scholar] [CrossRef]
- Sebelius, F.C.; Rosén, B.N.; Lundborg, G.N. Refined Myoelectric Control in Below-Elbow Amputees Using Artificial Neural Networks and a Data Glove. J. Hand Surg. 2005, 30, 780–789. [Google Scholar] [CrossRef] [PubMed]
- Fougner, A.; Stavdahl, *!!! REPLACE !!!*; Kyberd, P.J.; Losier, Y.G.; Parker, P.A. Control of Upper Limb Prostheses: Terminology and Proportional Myoelectric Control—A Review. IEEE Trans. Neural Syst. Rehabilitation Eng. 2012, 20, 663–677. [Google Scholar] [CrossRef]
- Shi, P.; Zhang, X.; Li, W.; Yu, H. Improving the robustness and adaptability of sEMG-based pattern recognition using deep domain adaptation. IEEE J. Biomed. Health. Inform. 2022, 26, 5450–5460. [Google Scholar] [CrossRef] [PubMed]
- Du, Y.; Jin, W.; Wei, W.; Hu, Y.; Geng, W. Surface EMG-Based Inter-Session Gesture Recognition Enhanced by Deep Domain Adaptation. Sensors 2017, 17, 458. [Google Scholar] [CrossRef] [PubMed]
- Kyranou, I.; Vijayakumar, S.; Erden, M.S. Causes of Performance Degradation in Non-invasive Electromyographic Pattern Recognition in Upper Limb Prostheses. Front. Neurorobotics 2018, 12, 58. [Google Scholar] [CrossRef]
- Bao, T.; Wang, C.; Yang, P.; Xie, S.Q.; Zhang, Z.-Q.; Zhou, P. LSTM-AE for Domain Shift Quantification in Cross-Day Upper-Limb Motion Estimation Using Surface Electromyography. IEEE Trans. Neural Syst. Rehabilitation Eng. 2023, 31, 2570–2580. [Google Scholar] [CrossRef] [PubMed]
- F. Palermo, M. Cognolato, A. Gijsberts, H. Müller, B. Caputo, and M. Atzori, “Repeatability of grasp recognition for robotic hand prosthesis control based on sEMG data,” in 2017 International Conference on Rehabilitation Robotics (ICORR), Aug. 2017, pp. 1154-1159.
- S. Furman, and M. H. Imtiaz, “A Subject-Independent Machine Learning Model to Recognize Hand Gestures from Surface Electromyography Signals,” in 2023 IEEE 32nd Microelectronics Design & Test Symposium (MDTS), Jul. 2023, pp. 1-5.
- Kanoga, S.; Kanemura, A.; Asoh, H. Are armband sEMG devices dense enough for long-term use?—Sensor placement shifts cause significant reduction in recognition accuracy. Biomed. Signal Process. Control. 2020, 60, 101981. [Google Scholar] [CrossRef]
- S. Kanoga, M. Matsuoka, and A. Kanemura, “Transfer learning over time and position in wearable myoelectric control systems,” in 2018 40th Annual International Conference of the IEEE Engineering in Medicine and Biology Society (EMBC), Oct. 2018, pp. 1-4.
- C. Prahm, B. Paassen, A. Schulz, B. Hammer, and O. Aszmann, “Transfer learning for rapid re-calibration of a myoelectric prosthesis after electrode shift,” in Converging Clinical and Engineering Research on Neurorehabilitation II: Proceedings of the 3rd International Conference on NeuroRehabilitation (ICNR2016), Oct. 2016, pp. 153-157.
- Prahm, C.; Schulz, A.; Paaben, B.; Schoisswohl, J.; Kaniusas, E.; Dorffner, G.; Hammer, B.; Aszmann, O. Counteracting Electrode Shifts in Upper-Limb Prosthesis Control via Transfer Learning. IEEE Trans. Neural Syst. Rehabilitation Eng. 2019, 27, 956–962. [Google Scholar] [CrossRef] [PubMed]
- Hudgins, B.; Parker, P. Scott A new strategy for multifunction myoelectric control. IEEE Trans. Biomed. Eng. 1993, 40, 82–94. [Google Scholar] [CrossRef]
- Tolooshams, B.; Jiang, N. Robustness of Frequency Division Technique for Online Myoelectric Pattern Recognition against Contraction-Level Variation. Front. Bioeng. Biotechnol. 2017, 5, 3. [Google Scholar] [CrossRef] [PubMed]
- Graupe, D.; Salahi, J.; Kohn, K.H. Multifunctional prosthesis and orthosis control via microcomputer identification of temporal pattern differences in single-site myoelectric signals. J. Biomed. Eng. 1982, 4, 17–22. [Google Scholar] [CrossRef] [PubMed]
- Nazmi, N.; Rahman, M.A.A.; Yamamoto, S.-I.; Ahmad, S.A.; Zamzuri, H.; Mazlan, S.A. A Review of Classification Techniques of EMG Signals during Isotonic and Isometric Contractions. Sensors 2016, 16, 1304. [Google Scholar] [CrossRef]
- Zou, Y.; Cheng, L. A Transfer Learning Model for Gesture Recognition Based on the Deep Features Extracted by CNN. IEEE Trans. Artif. Intell. 2021, 2, 447–458. [Google Scholar] [CrossRef]
- Z. Li, X. Zhao, G. Liu, B. Zhang, D. Zhang, and J. Han, “Electrode shifts estimation and adaptive correction for improving robustness of sEMG-based recognition,” IEEE J. Biomed. Health. Inform., vol. 25, no. 4, pp. 1101-1110, Jul. 2020.
- Karrenbach, M.; Preechayasomboon, P.; Sauer, P.; Boe, D.; Rombokas, E. Deep learning and session-specific rapid recalibration for dynamic hand gesture recognition from EMG. Front. Bioeng. Biotechnol. 2022, 10, 1034672. [Google Scholar] [CrossRef] [PubMed]
- Zhai, X.; Jelfs, B.; Chan, R.H.M.; Tin, C. Self-Recalibrating Surface EMG Pattern Recognition for Neuroprosthesis Control Based on Convolutional Neural Network. Front. Neurosci. 2017, 11, 379–379. [Google Scholar] [CrossRef] [PubMed]
Figure 1.
Designed gestures for each subject and their corresponding bionic hand postures.
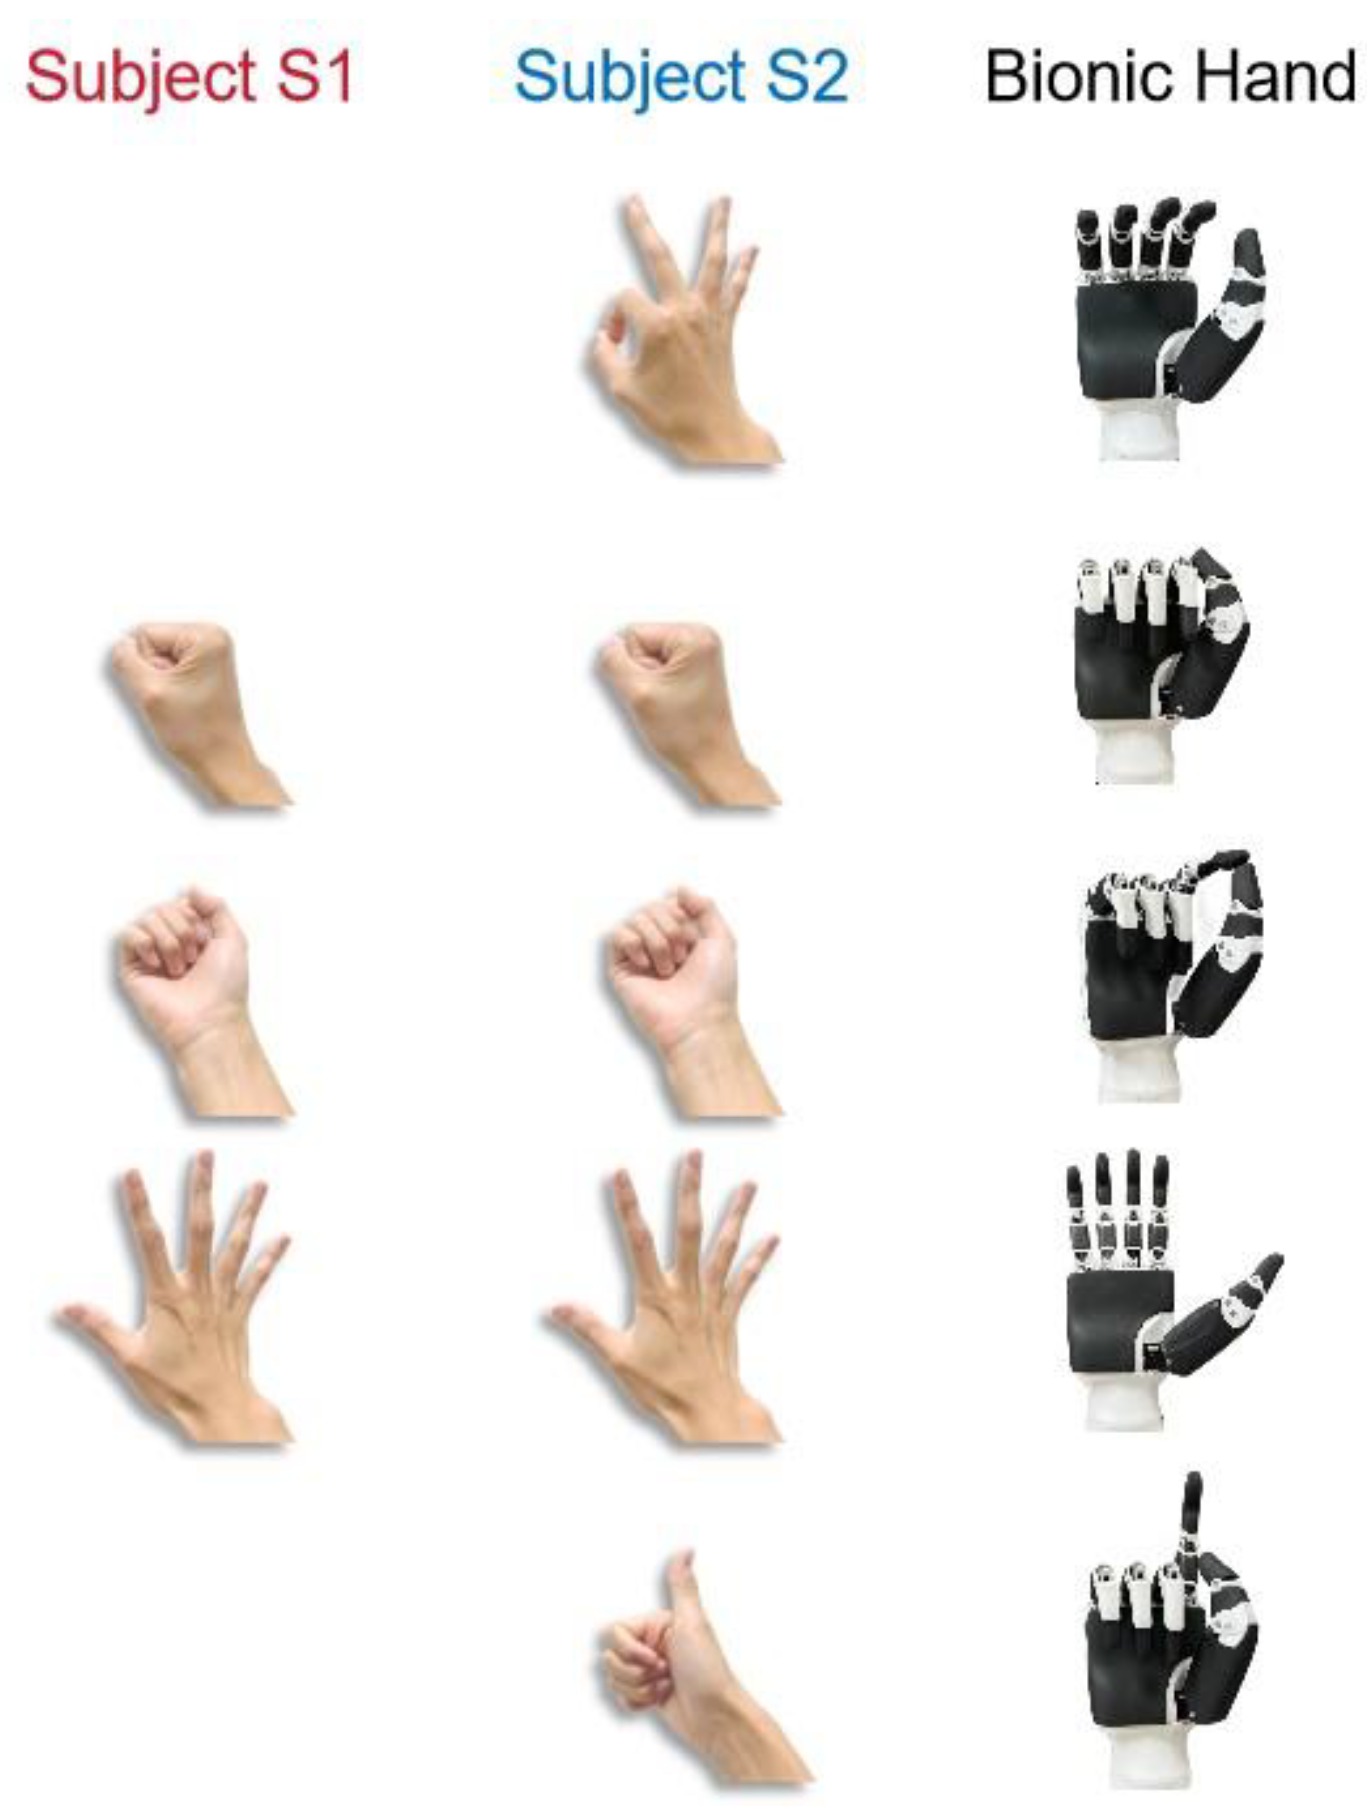
Figure 2.
The block diagram of multi-channel sEMG acquisition circuit.
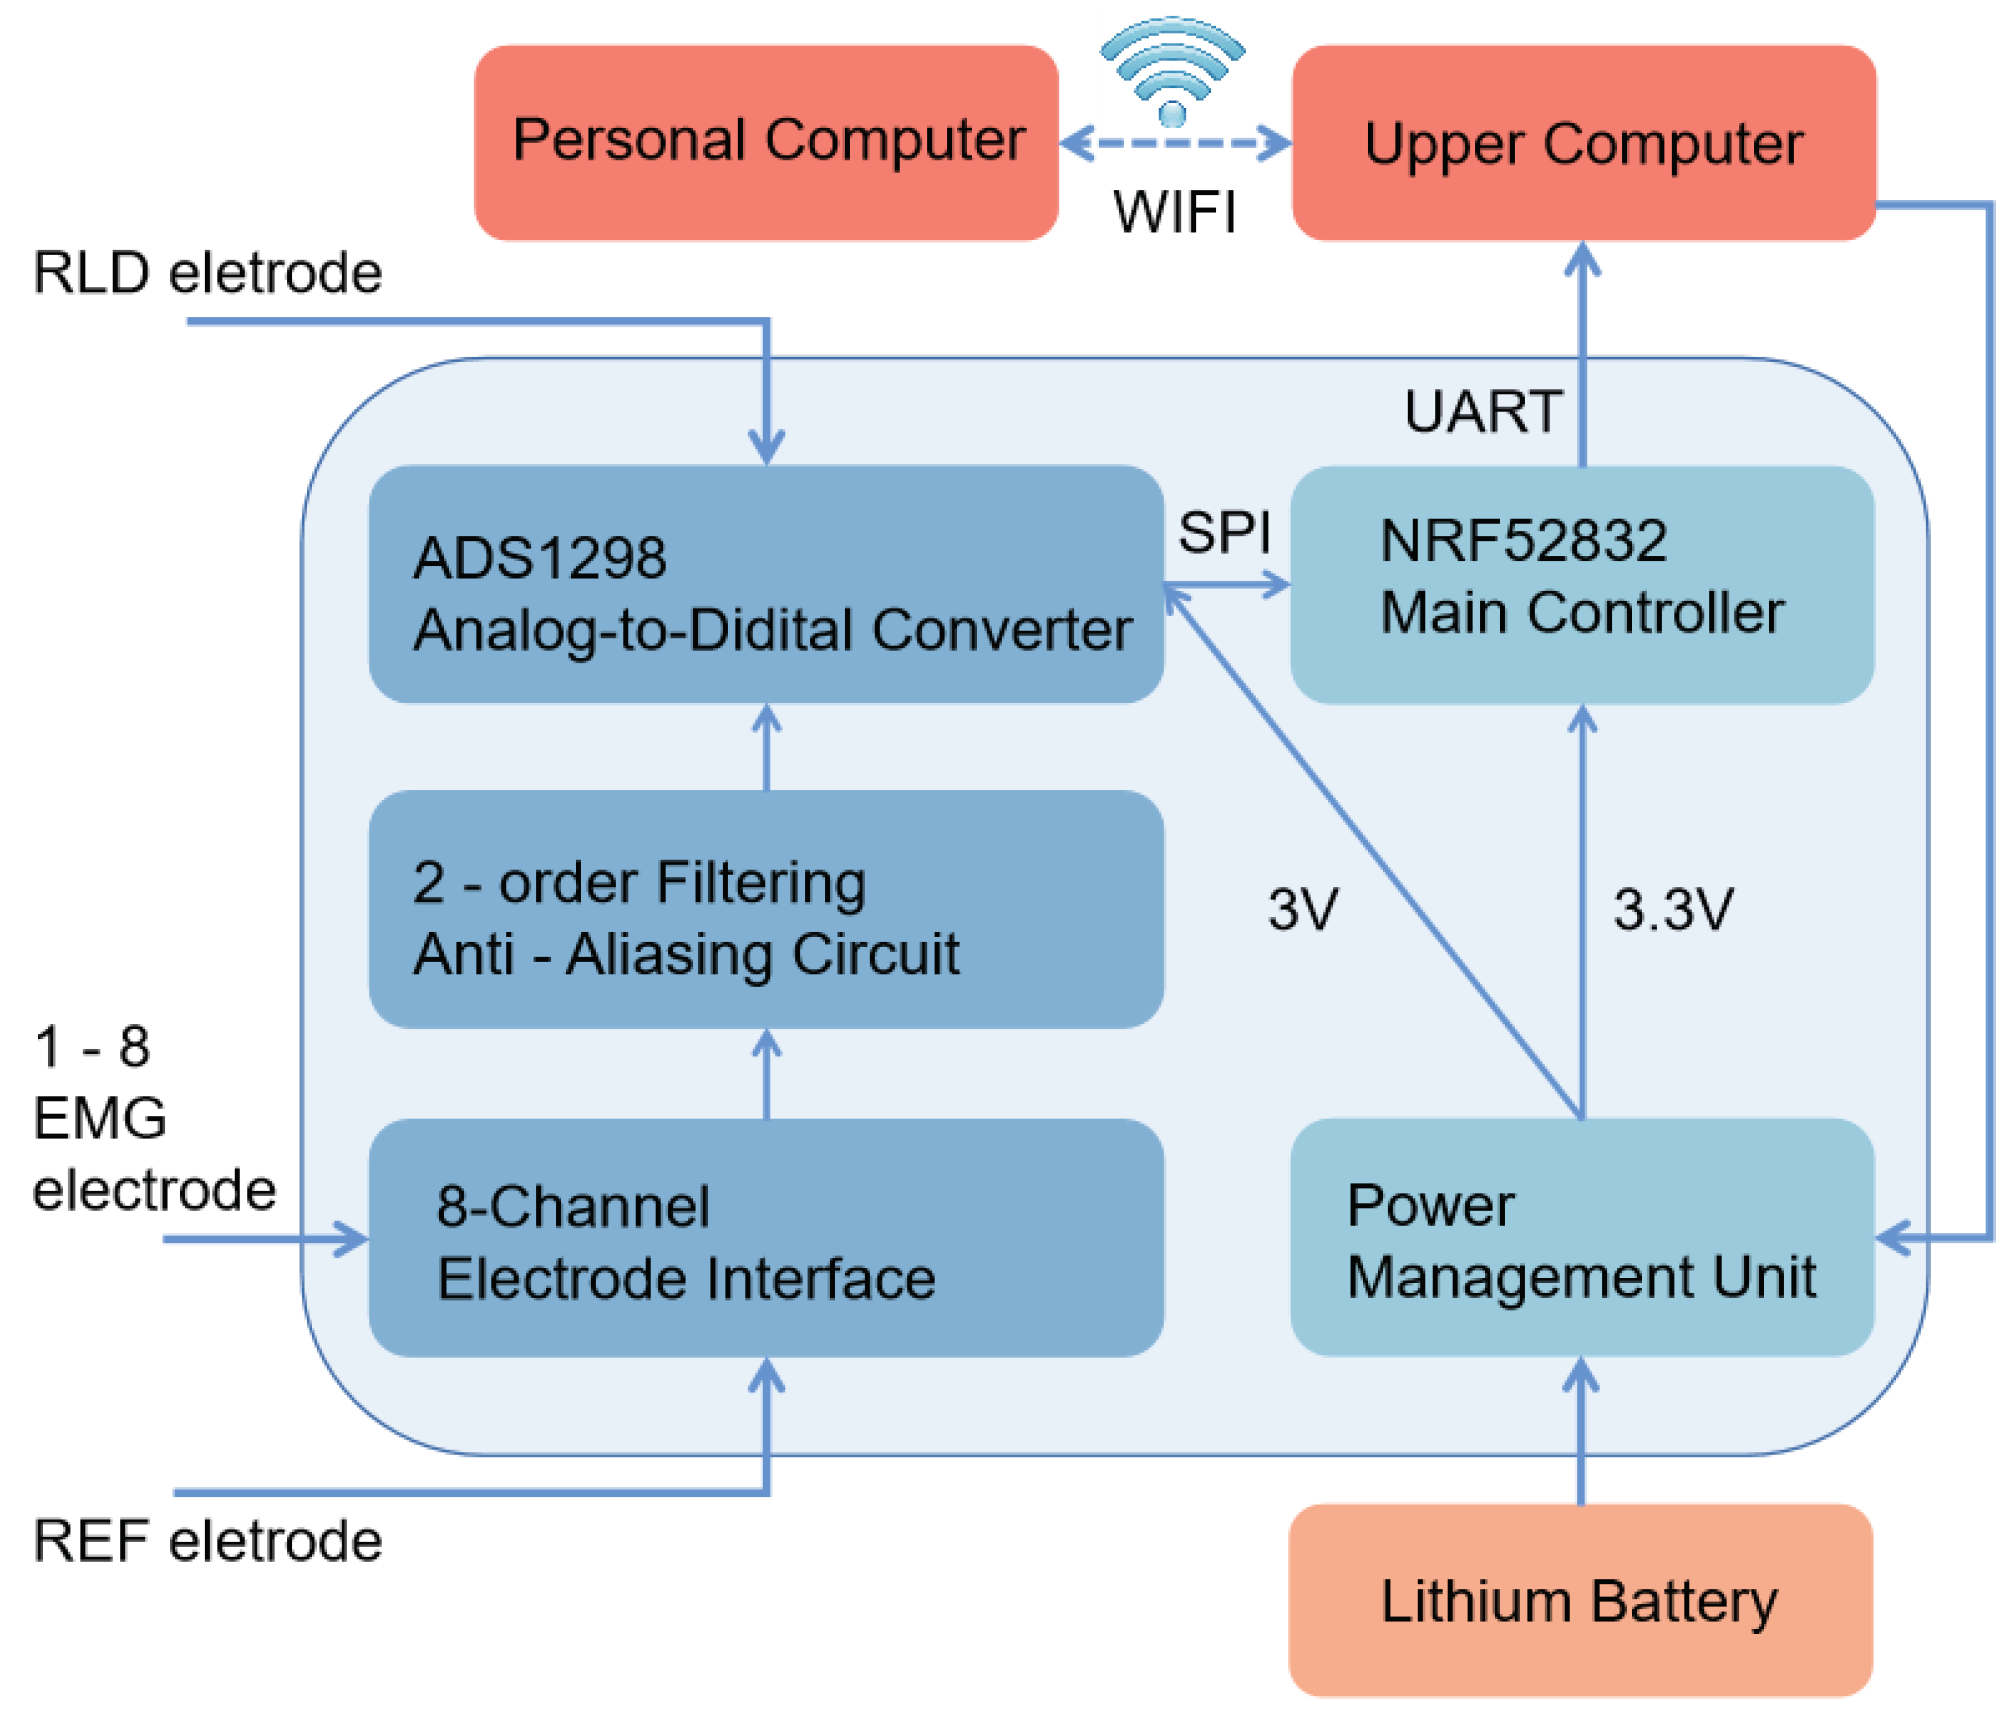
Figure 3.
Schematic diagram of cross-session validation.
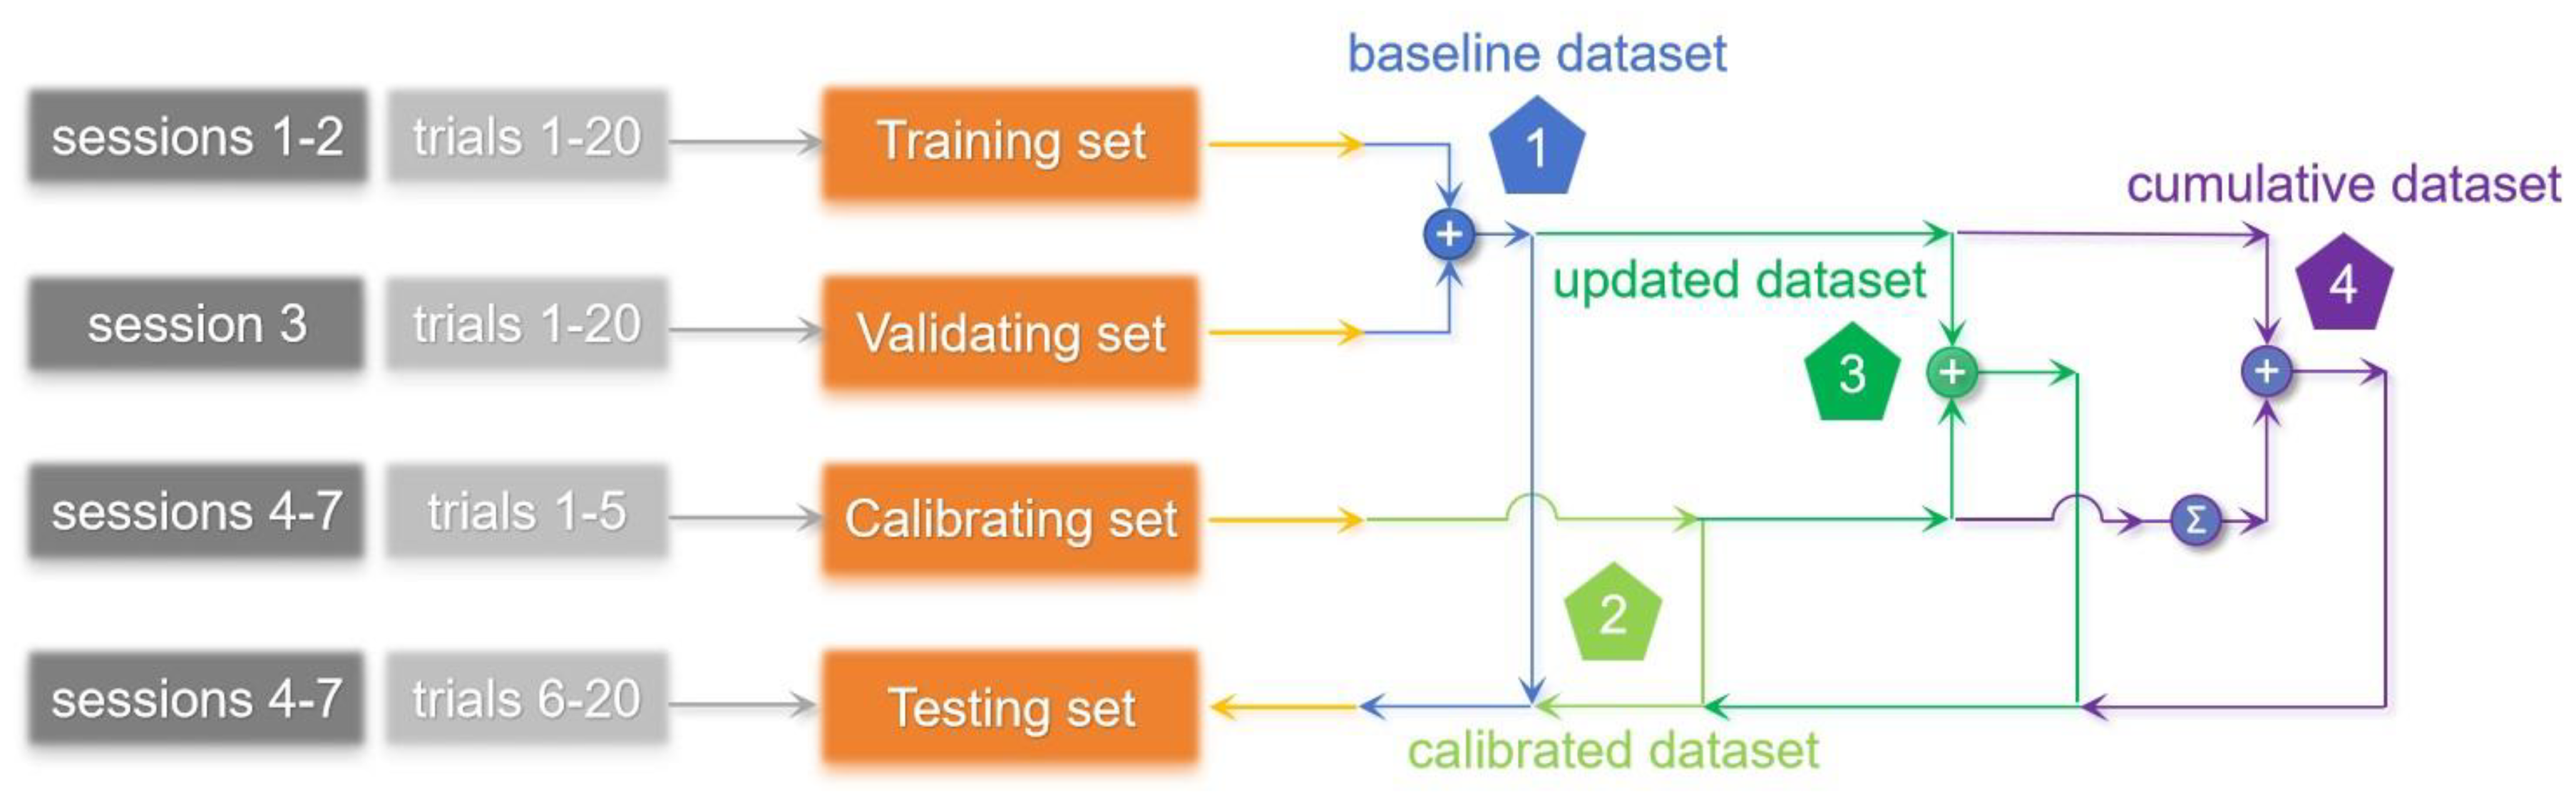
Figure 4.
Feature distribution visualization. (a) The distribution of the feature RMS of channel 1 for gesture 3 in session 7. (b) The distribution of the feature RMS of channel 1 for gesture 3 among 7 sessions. (c) The distribution of the first three principal components by PCA for gesture 3 among 7 sessions.
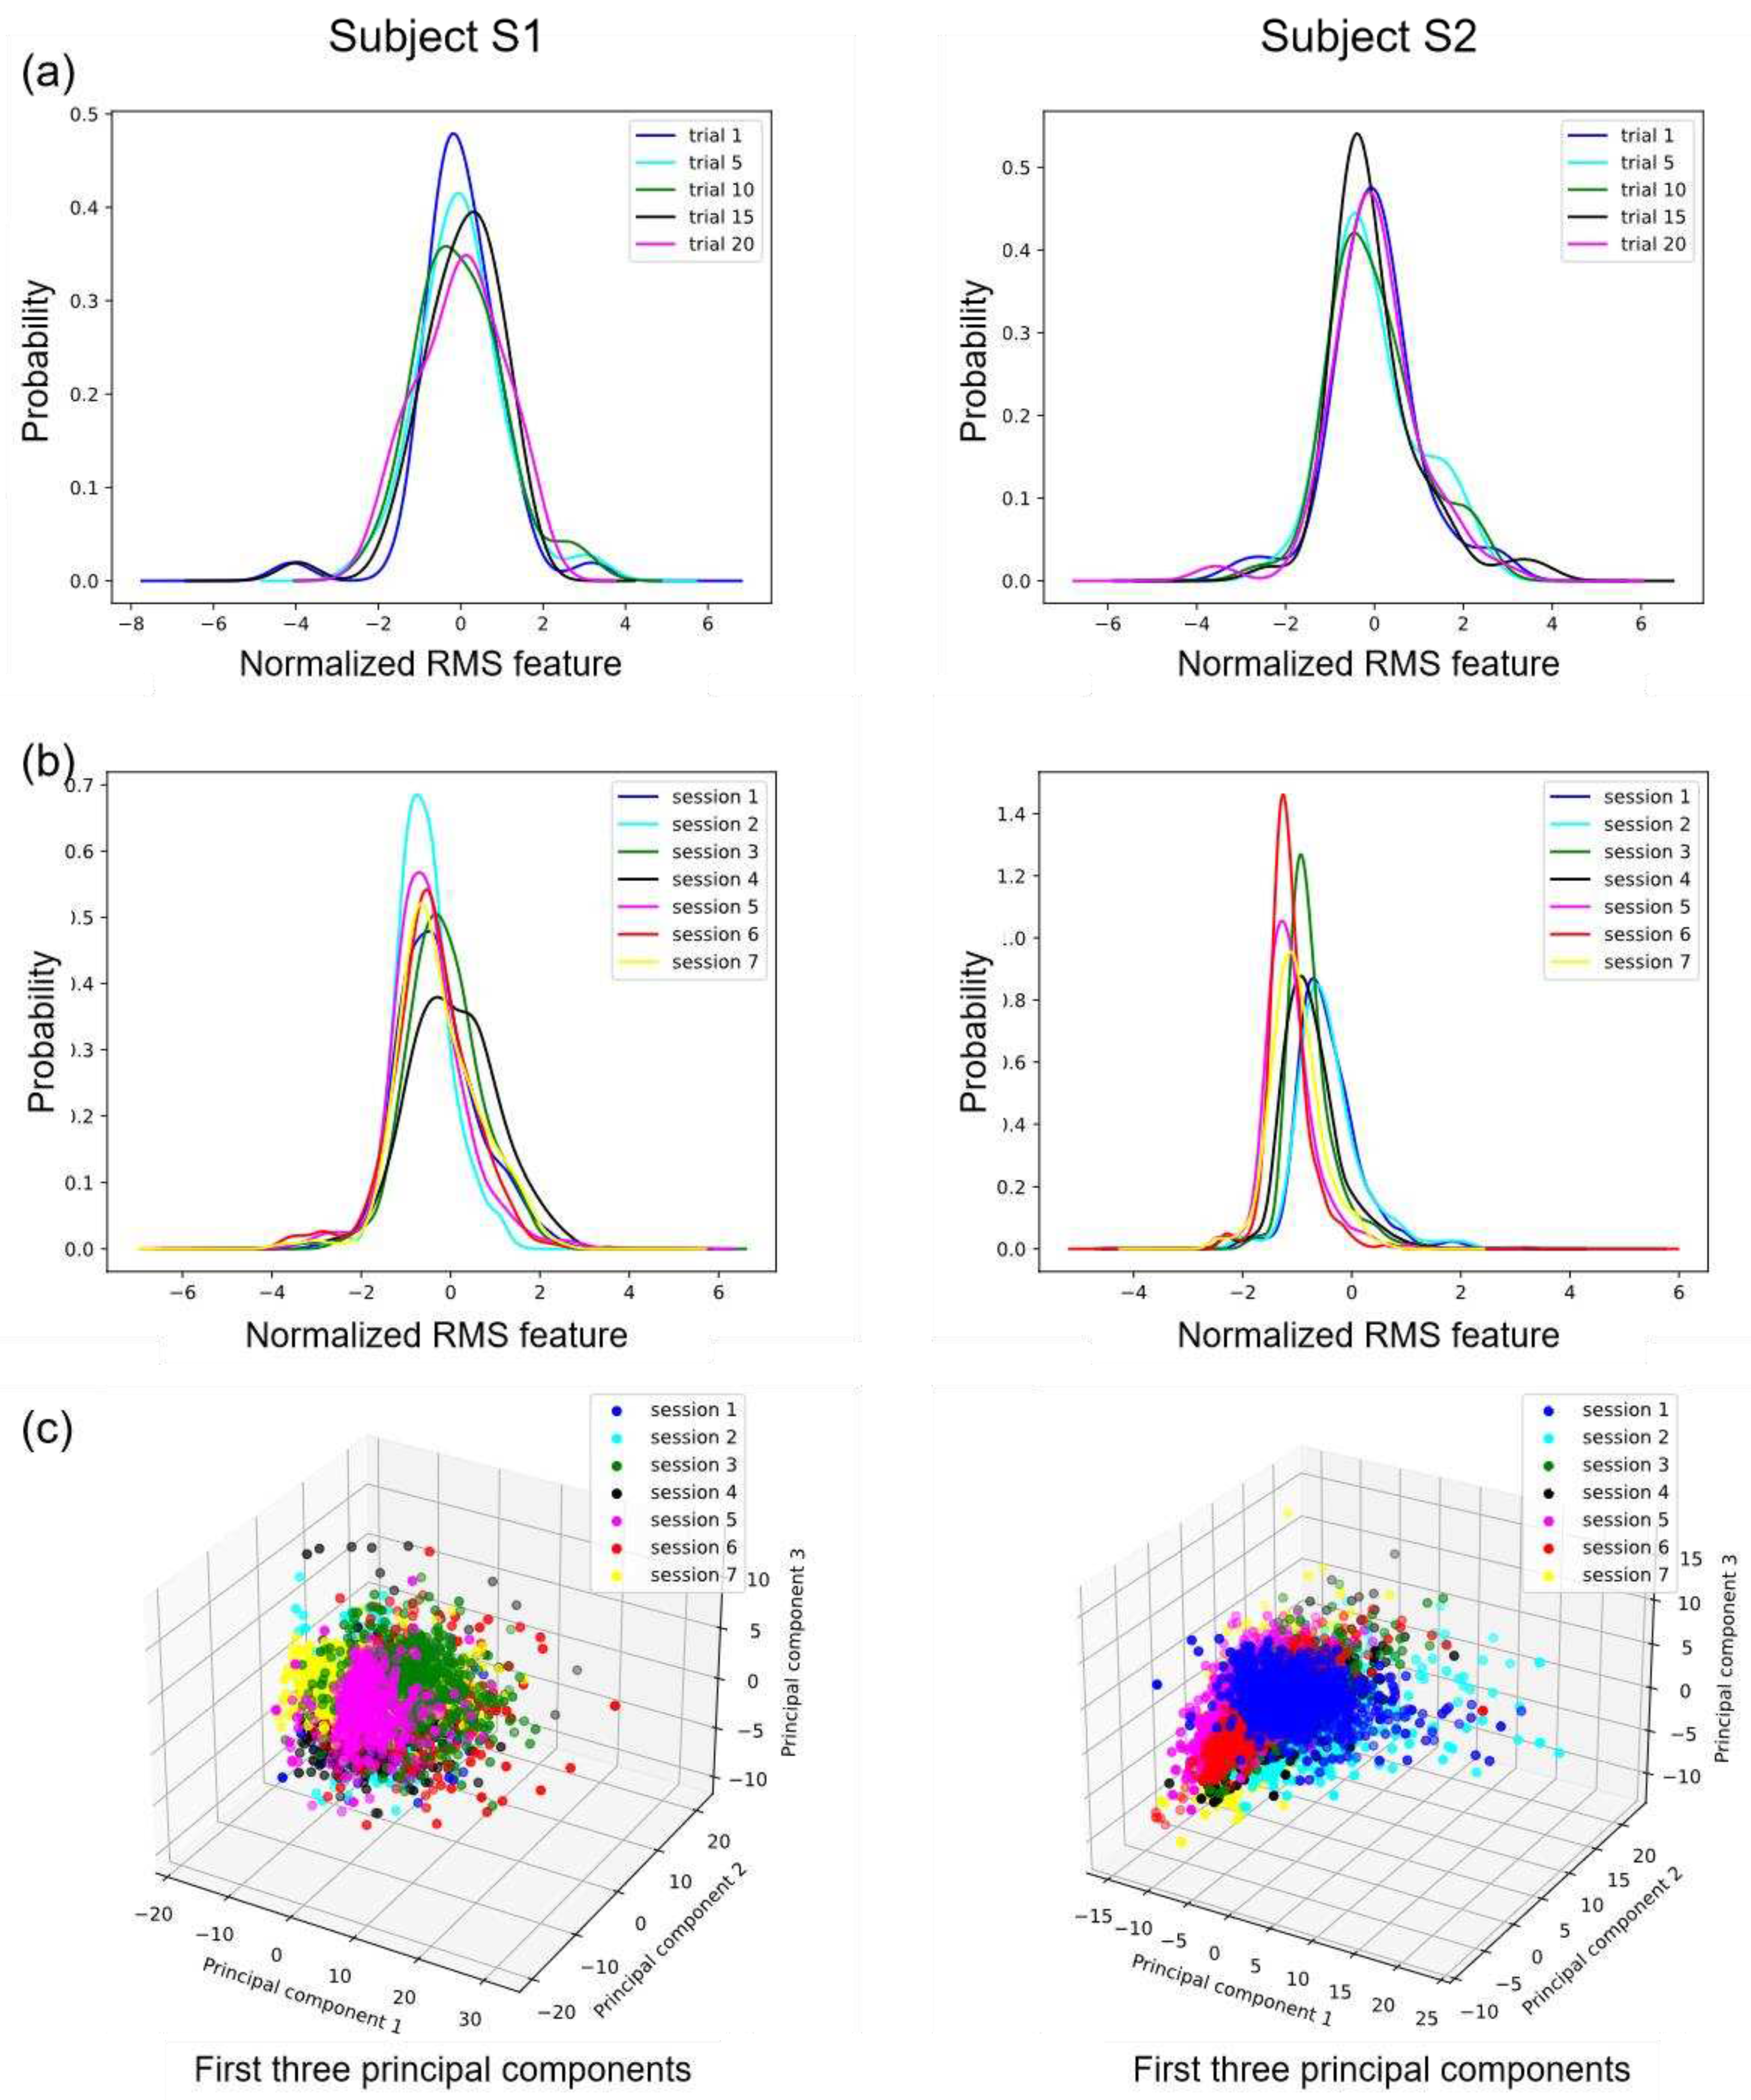
Figure 5.
Effect of the number of calibration trials added to the datasets.
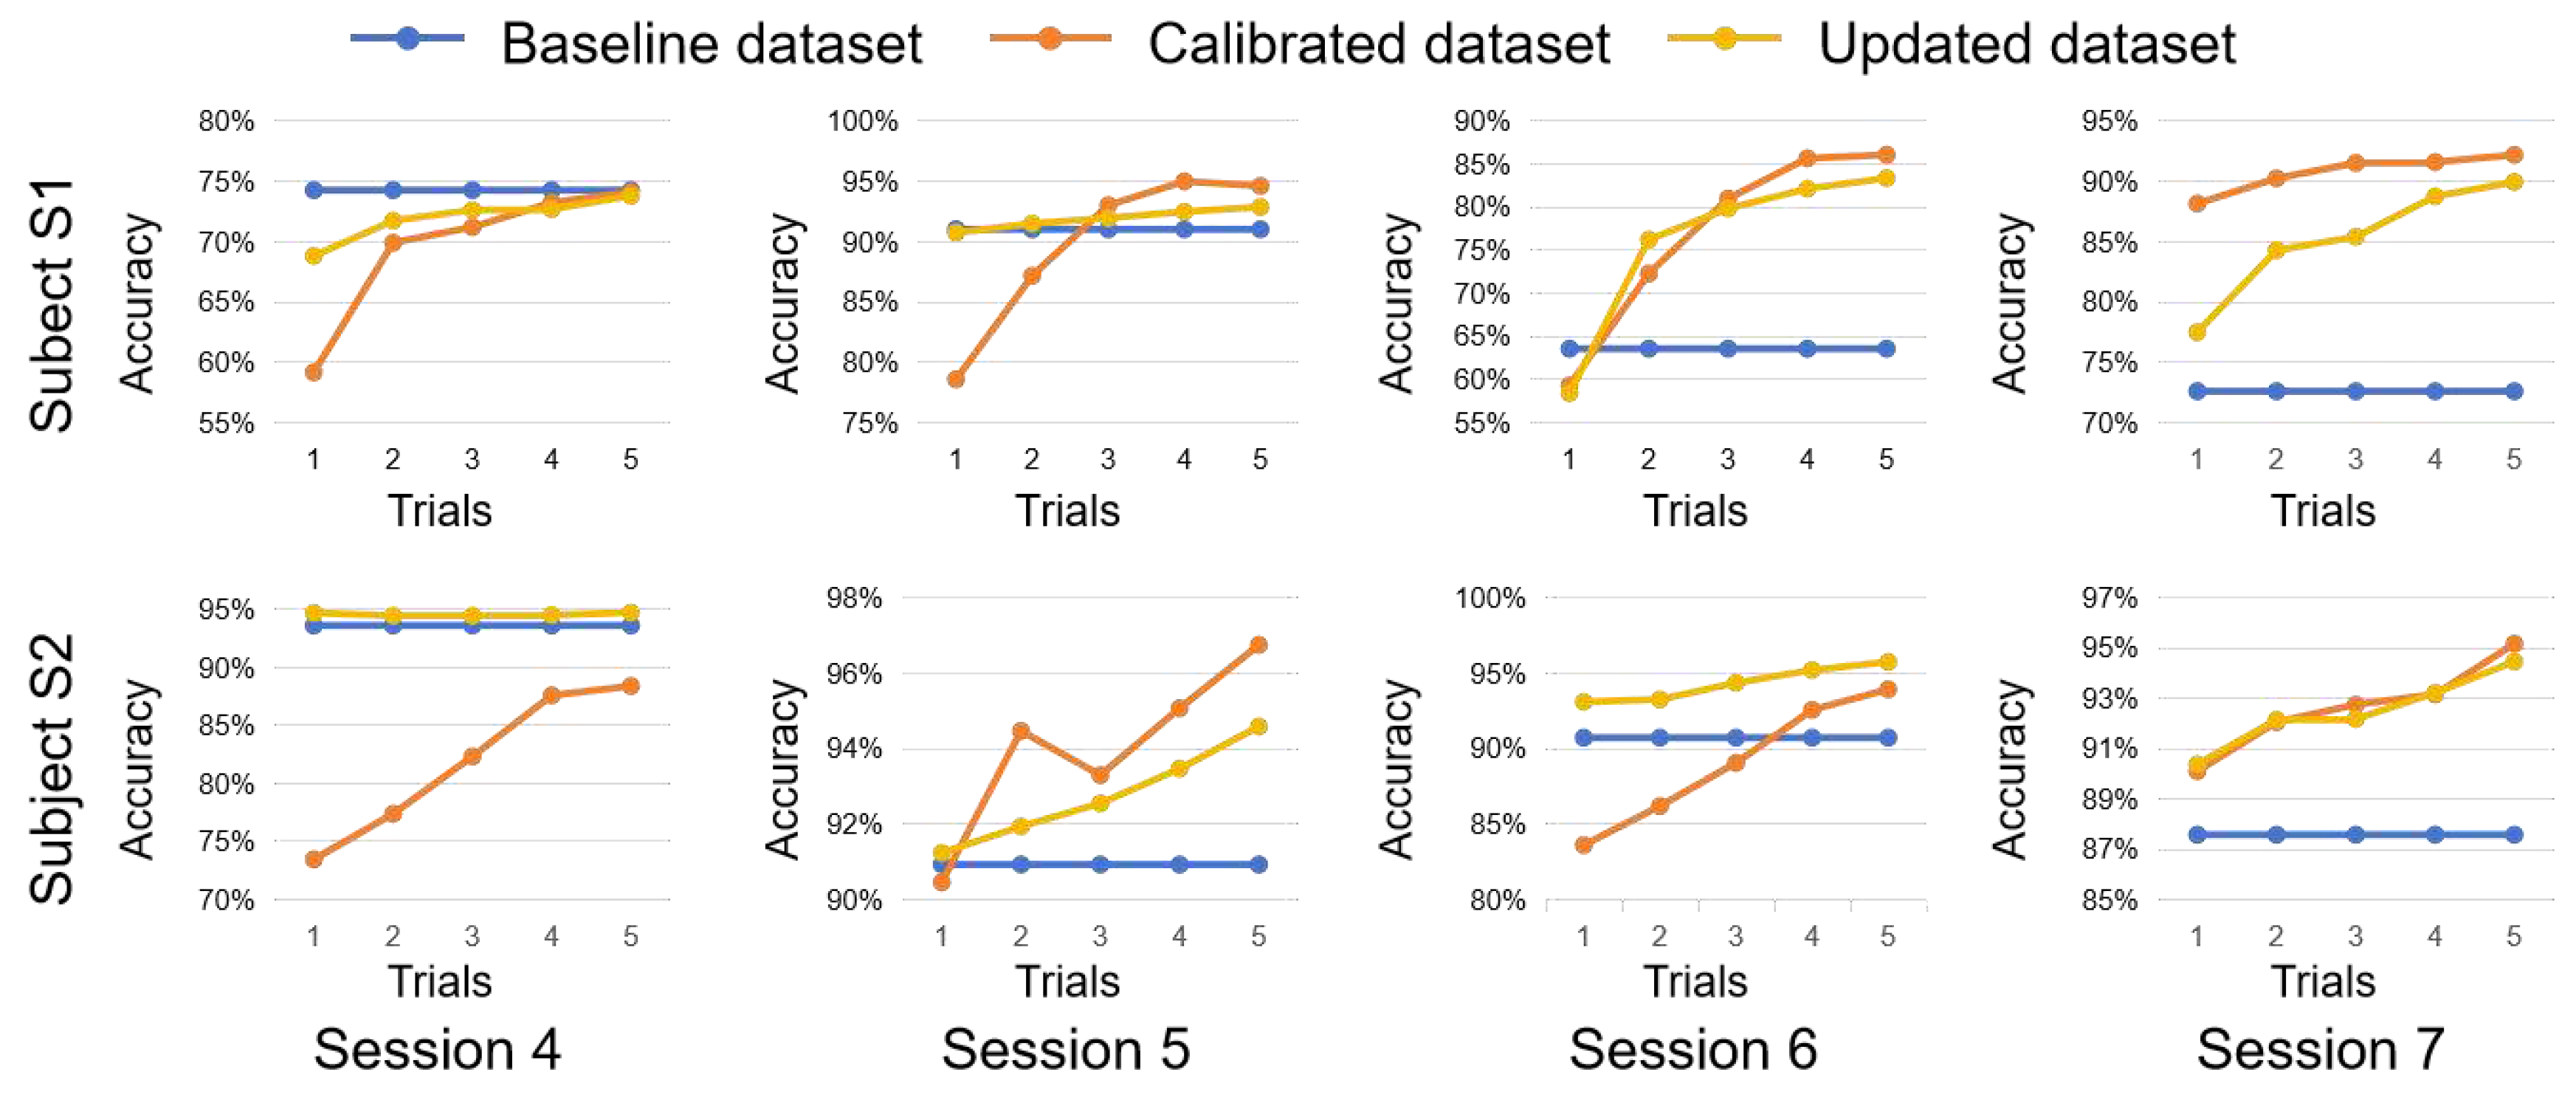
Figure 6.
Effects of the amount of training data on gesture recognition. The quantity of training data increased from 1 session to 6 sessions, with data collected from 1 to 20 trials.
Figure 6.
Effects of the amount of training data on gesture recognition. The quantity of training data increased from 1 session to 6 sessions, with data collected from 1 to 20 trials.
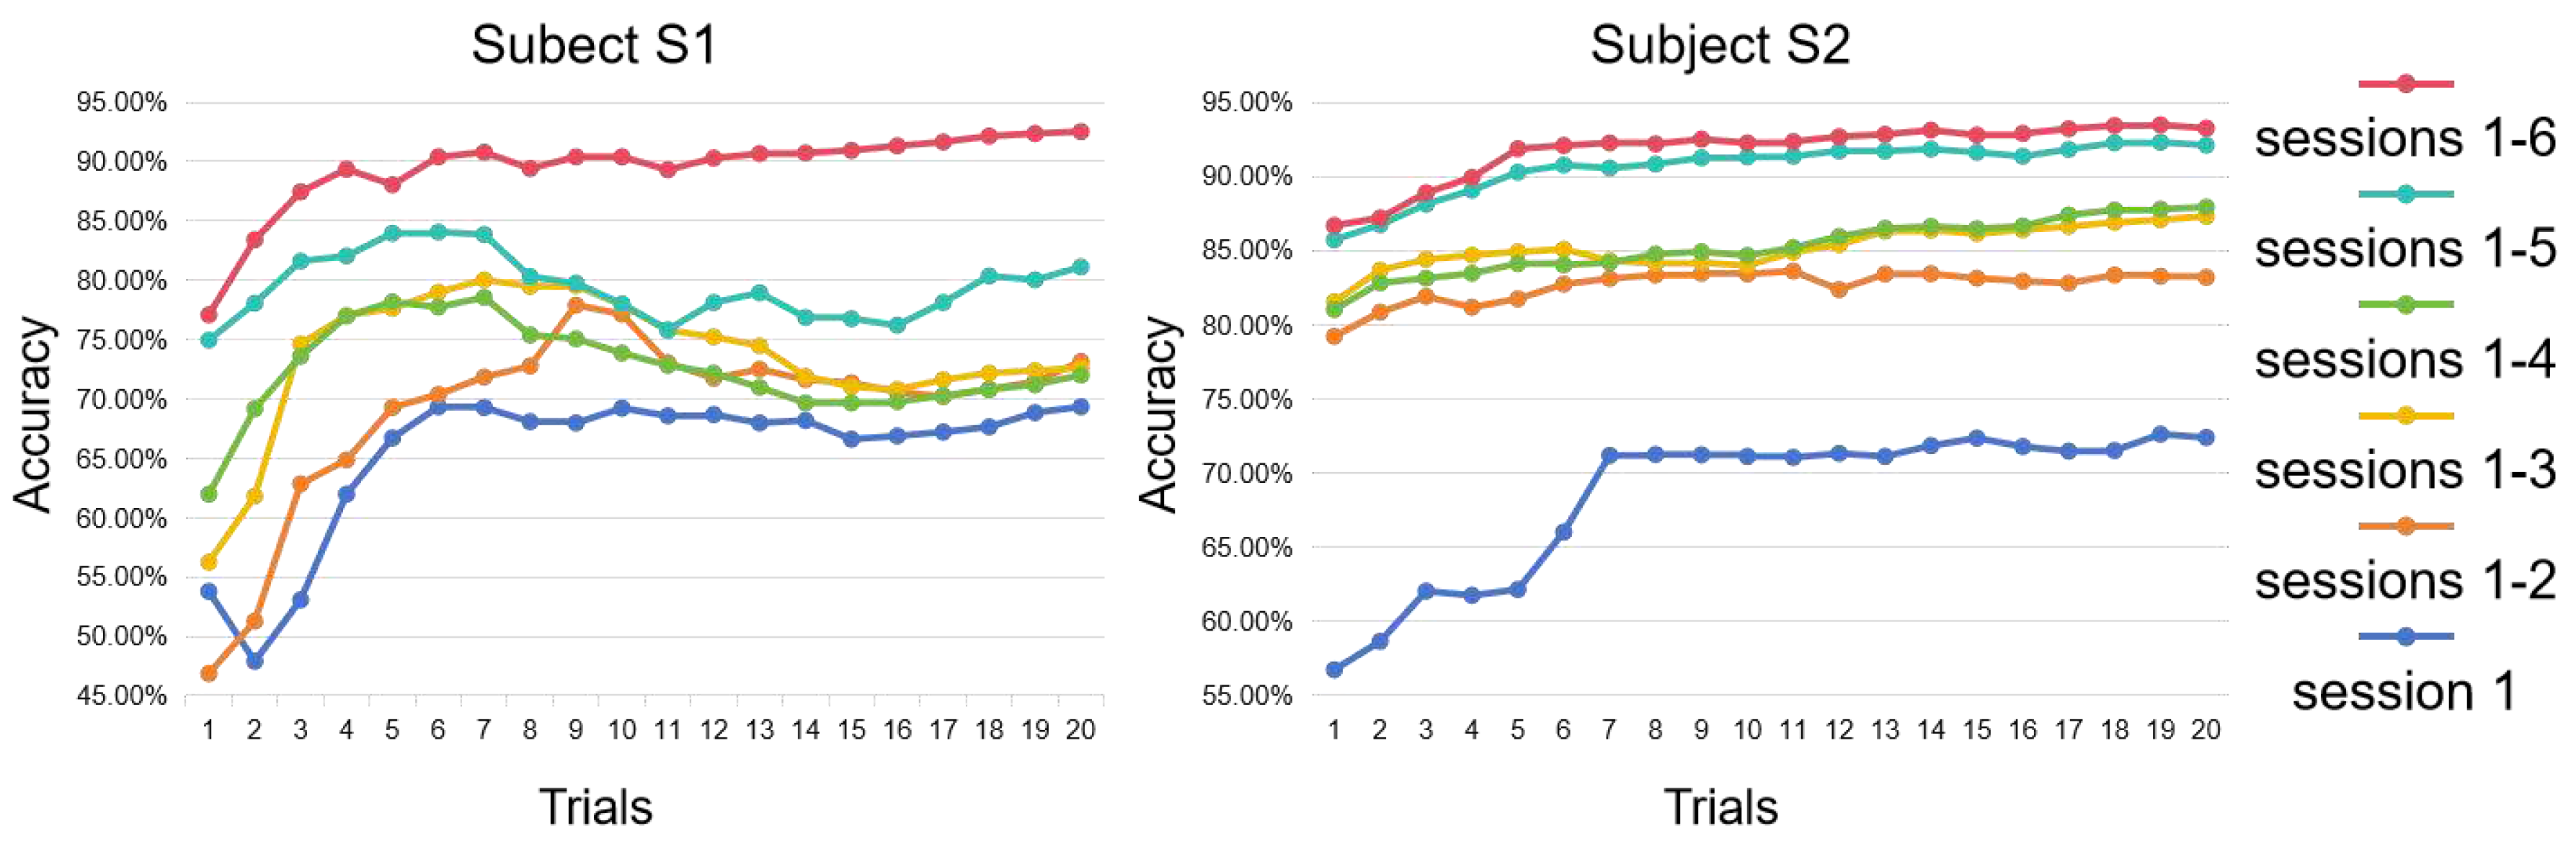

Table 1.
Feature extraction.
| Feature Extraction | Feature Set | Feature Name |
|---|---|---|
| Intra-channel (Feature number: 14*8 = 112) |
Time Domain | Short-term Energy of Sub-bands (80-150Hz, 150-300Hz, 300-450Hz) |
| Root Mean Square [20] | ||
| Waveform Length [20] | ||
| Mean Absolute Value [20] | ||
| Zero Crossings [20] | ||
| Frequency Domain | Mean Amplitude Spectrum [21] | |
| Autoregressive Coefficients [22] |
1st Autoregressive Coefficient | |
| 2nd Autoregressive Coefficient | ||
| 3rd Autoregressive Coefficient | ||
| 4th Autoregressive Coefficient | ||
| Constant | ||
| Inter-channel (Feature number:28) |
Pearson’s Correlation Coefficient | Corr_x_y (x=1:7; y=x+1:8) |
Table 2.
Overall Performance and Eventual Improvement for Different Datasets.
| Subject | Dataset | Calibration Trials | Average | ||||
|---|---|---|---|---|---|---|---|
| 1 | 2 | 3 | 4 | 5 | |||
| S1 | Baseline | 75.37% | |||||
| Calibrated | 71.31% | 79.91% | 84.18% | 86.37% | 86.75% | 81.70% | |
| Updated | 73.87% | 80.94% | 82.45% | 84.01% | 84.99% | 81.25% | |
| Cumulative | 75.21% | 81.67% | 82.62% | 83.52% | 84.62% | 81.53% | |
| Improvement | -0.16% | +6.30% | +7.25% | +8.15% | +9.25% | +6.16% | |
| S2 | Baseline | 90.71% | |||||
| Calibrated | 84.41% | 87.53% | 89.36% | 92.10% | 93.56% | 89.40% | |
| Updated | 92.35% | 92.95% | 93.39% | 94.10% | 94.88% | 93.53% | |
| Cumulative | 92.79% | 93.26% | 93.58% | 94.25% | 94.82% | 93.74% | |
| Improvement | +2.08% | +2.55% | +2.87% | +3.54% | +4.11% | +3.03% | |
Disclaimer/Publisher’s Note: The statements, opinions and data contained in all publications are solely those of the individual author(s) and contributor(s) and not of MDPI and/or the editor(s). MDPI and/or the editor(s) disclaim responsibility for any injury to people or property resulting from any ideas, methods, instructions or products referred to in the content. |
© 2023 by the authors. Licensee MDPI, Basel, Switzerland. This article is an open access article distributed under the terms and conditions of the Creative Commons Attribution (CC BY) license (http://creativecommons.org/licenses/by/4.0/).
Copyright: This open access article is published under a Creative Commons CC BY 4.0 license, which permit the free download, distribution, and reuse, provided that the author and preprint are cited in any reuse.


