Submitted:
08 December 2023
Posted:
11 December 2023
You are already at the latest version
Abstract
The main apple production areas of the Loess Plateau, China limited information on soil and leaf K, Ca, Mg, and micronutrients and their relationships in these orchards. Therefore, we collected soil and leaf samples from the main apple production areas of the Loess Plateau and analyzed them to assess soil and leaf K, Ca, Mg, Cu, Mn, Zn, and Fe as well as to visualize their relationships. The investigated apple orchards in the Loess Plateau exhibited low soil Mn, moderate soil K, Zn, Fe, and high Cu and deficiency of leaf Fe, Moderate of leaf K, Cu, and Zn, high of leaf Ca, Mg, and excessive in leaf Mn. Moreover, soil pH negatively correlated with soil K, Cu, Zn, and Fe and positively related to exchangeable Mg, leaf Mg, and leaf Ca. Exchangeable Ca was negatively related to soil Mg, Cu, Mn, and Fe. Meanwhile, exchangeable K also negative correlation with leaf Mg, indicating the importance of soil pH and exchangeable Ca as an indication of apple produc-tion. In addition, available Zn also negative correlation with leaf Ca and leaf Zn. Soil micronu-trient contents in Shaanxi province trend lower than in other provinces, suggesting that soil Mn and Zn deficiency may be a limiting factor for apple production. Consequently, it is suggested that the soil pH be reduced in the Loess Plateau, replenishing soil organic matter and micronutrients, controlling soil Ca and Mg, and the Loess Plateau must pay attention to controlling K fertilizer application to avoid soil exchangeable cation and enhancing organic fertilizer application to improve soil micronutrients (Zn, Mn, and Fe) are highly necessary and it is necessary to enhance leaf Fe.
Keywords:
soil nutrient
; leaf nutrient
; nutrient diagnosis
; apple orchard
1. Introduction
One of the most important fruits currently produced and consumed worldwide is the apple, and China's apple harvesting area accounts for 45.0% of the world, The Loess Plateau is the largest apple-producing region in China [1,2], which also produces 27.0% of the world's apple production and the Loess Plateau is China's highest apple-producing region [3]. As a result, it is the world's largest apple-producing region [4]. However, The Loess Plateau's apple yield (14.4 tons/hectare (t/ha)) is lower than the national (18.6 t/ha) and global (16.8 t/ha) averages [1]. Because of the good climatic circumstances and ap-pealing economic benefits, the cultivation area has rapidly increased [5]. The apple industry on the Loess Plateau has developed rapidly and excessively applied chemical fertilizer, the application of fertilizer is seriously unreasonable and has accounted for the problem of nutrients and yield loss continuous adoption of this practice leads to a serious nutrient imbalance in the soil, and low nutrient efficiency affects crop performance [6]. Chemical fertilizers have been used excessively in Chinese apple orchards over the last two decades [7]. Notably, the average annual rates applied in the Loess Plateau apple production region have risen to 1220 kg N ha−1, 685 kg P2O5 ha−1, and 920 kg K2O h−1 year−1 [8], especially in K fertilizer. High chemical fertilizer inputs cause soil acidification, macronutrient enrichment, and imbalance [9]. Additionally, nutrient imbalances in apple orchards have been observed in recent years due to inadequate soil fertility and long-term imbalances created by such a fertilization process [10,11,12].
Potassium (K), Calcium (Ca), Magnesium (Mg), and Micronutrients play essential roles in the sustainability of agriculture [13]. The availability of K, Ca, and Mg in agricultural soils varies significantly [14,15] and It is dependent on various soil parameters, including pH and the amount of exchangeable K, Ca, and Mg in the soil [16]. Soil K, Ca, and Mg deficiencies are caused by either low absolute concentrations in the soils or nutrient imbalances [17]. Therefore, assessing the concentrations and stoichiometry of K, Ca, and Mg in soils and plant tissues is critical for a better understanding of nutritional status and developing effective fertilizer management for sustainable crop production [18,19].
Moreover, Micronutrient deficiency is common in intensively cultivated soils due to crop production removal [20], while lowering micronutrient inputs from chemical fertilizers [21]. High soil pH may affect the availability of micronutrients such as Cupper (Cu), Iron (Fe), Manganese (Mn), and Zinc (Zn) [22,23,24]. Understanding soil fertility and leaf nutrients provides the foundation for fertilizer recommendations, which is critical for increasing apple fruit quantity and quality, Fertilizer recommendations for apples and other crops are based on soil and leaf test calibration [25,26]. In addition, K imbalance, K shortage, and Mg insufficiency are common in different apple-growing regions of China, affecting productivity [27]. Soil K, Ca, and Mg deficiency are caused by either low absolute concentrations of these elements in the soil or nutrient imbalances and interactions produced by comparable ions in the soil [17]. Consequently, assessing the concentrations and equilibrium of K, Ca, and Mg in soils and plant tissues is critical for a better understanding of nutrient status and developing efficient fertilizer management strategies for sustainable crop production [18,19].
In China, the soil and leaf nutrients in a Chinese apple orchard have been studied [28,29,30,31,32,33,34,35,36] and, in The Loess Plateau soil nutrients and leaf nutrients in apple orchards also have been investigated [31,36,37]. Unfortunately, Soil or leaf nutrient levels have always been reported in the results and the result always ignored determining critical elements for apple growth such as Ca, Mg, and Micronutrients (Fe, Mn, Cu, and Zn), and none of them used the results to determine a soil nutrient and leaf nutrient status to evaluate soil and leaf nutrients. Consequently, there is still room for improvement because most soil fertility research has been limited to assessing the Ca and Mg contents, while little attention has been paid to the micronutrient (Fe, Mn, Cu, and Zn) contents, which are nevertheless crucial for maintaining the balance of nutrients and for the sustainable production of perennial crops such as apple. Although many studies have addressed the soil nutrients and leaf nutrients in the Loess Plateau apple orchard, only a few studies on the relationship between soil fertility and leaf nutrients in apple orchards have been conducted. Thus, in the context of widespread and severe overfertilization, large-scale investigations of soil fertility and leaf nutrients in apple orchards in the Loess Plateau in relation to multiple important parameters still need to be conducted to ensure the sustainable development of apple production in the Loess Plateau. We hypothesized that ensuring the significant variations in the concentrations of soil and leaf K, Ca, Mg, and Micronutrients (Cu, Mn, Zn, and Fe) and their relationships in the Loess Plateau, China. This information is necessary for the successful administration of these nutrients on China's Loess Plateau and elsewhere. Therefore, the objectives of this research were to assess the soil and leaf nutrient status of the main apple production in the Loess Plateau, by analyzing 8 soil parameters (soil pH, Exchangeable K, Ca, Mg, Available Cu, Mn, Zn, and Fe) and 7 leaf nutrients (Total K, Ca, Mg, Cu, Mn, Zn, and Fe) of 160 apple orchards including 5 provinces (Shaanxi, Shanxi, Henan, Gansu, and Ningxia province), and to evaluate their relationships to inform management decisions for improved K, Ca, Mg, and Micronutrients nutrition in the main apple production of the Loess Plateau, China.
2. Materials and Methods
2.1. Study Site and Climate Conditions
Based on their geographical locations, the Loess Plateau apple production provinces were sampled for this study (Table 1), the study site has an annual temperature of 11.3, a significant temperature difference between day and night, and an elevation of 880 m on average. The region is rain-fed and not irrigated, and all orchards are handled conventionally. The average annual precipitation is 506 mm, with the majority falling from July to September due to long daylight hours, and the loess plateau is the only source of water for cultivation. Most of the apple trees planted in the research regions are Fuji apple (Malus pumila Mil.) orchards, and the apple tree was planted during a ten-year period.
2.2. Soil Sampling and Analysis
Extensive soil and leaf sampling was performed in the following five provinces in late July and early August 2022: 64 orchards in Shaanxi province, 32 orchards in Shanxi province, 31 orchards in Henan province, 21 orchards in Gansu province, and 10 orchards in Ningxia province). Most of the samples were collected in Shaanxi province, which is the main apple-producing region in China's Loess Plateau. Soil samples were collected using a stainless-steel auger from 4 separate sites close to the outer canopy of each apple tree at 0–20 and 20–40 cm soil depths. Each sample was formed from random apple orchard samples that were mixed to make one representative sample for examination and sealed in a plastic bag. The soil samples were then immediately carried into the laboratory and dried in the shade at room temperature, roots and debris were removed, and the samples were sieved (2 mm) and analyzed to assess different chemical characteristics. The samples were analyzed for soil pH, Exchangeable K, Ca, Mg, Available Cu, Mn, Zn, and Fe. Soil pH was assessed in 1:2.5 soil: water (w/v) suspension using a DELTA320 pH meter [38]. Exchangeable cations (K+, Ca2+, and Mg2+), 2.50 grams of air-dried soil, and 25 mL of 1 M ammonium acetate (NH4OAc) solution were placed in Erlenmeyer flask (50 mL), shaken for 30 minutes, and then filtered through 11 cm NO.5 filter paper and analyzed by AAS (Atomic Absorption Spectrophotometer) for the soil exchangeable K, Ca, and Mg [38]. Micronutrients (Fe2+, Mn2+, Cu2+, and Zn2+) were extracted using a DTPA extractant containing 0.05 M diethylenetriaminepentaacetic acid (DTPA) and analyzed using an AAS (Atomic Absorption Spectrophotometer) [38].
2.3. Leaf Sampling and Analysis
Leaf samples were collected from the same locations at which soil samples were obtained after the fruit maturation stage in 2022. From the upper, middle, and lower parts of an apple tree's eastern, western, southern, and northern aspects, the seventh to ninth leaves counted from the base of the outer crown long shoot (>40 cm) were taken, and 20-30 leaves were picked from each tree. The leaf samples were then combined and decontaminated by being washed in tap water, 0.1 mol/L HCL, and distilled water before being dried at 70 °C for 72 hours. The samples were ground to a fine powder and stored for examination after passing through a 30-mesh screen. Total K, Ca, Mg, Cu, Mn, Zn, and Fe levels were determined in leaf samples. For total K, the samples were digested with concentrated sulfuric acid (H2SO4, AR, 98%) and H2O2 (GR, >= 30%). Total K concentration was determined using an AAS (Atomic Absorption Spectrophotometer) [38]. The samples were digested with concentrated HNO3 and H2O2 digestion using a microwave oven to determine total Ca, Mg, Cu, Mn, Zn, and Fe. The concentration was determined using an AAS (Atomic Absorption Spectrophotometer) [38].
2.4. Data Analysis
The primary data in this study was organized and calculated using Microsoft Excel 2020 software (Microsoft Corporation, 2020). Differences among provinces followed by different letters are significant at the 0.05 level (LSD). Pearson correlation was tested at p < 0.05 and determined using the corrplot R module in R version 4.3.0 software (R Core Team, Indianapolis, Indiana, USA) and graphs were created using OriginPro program 2023.10 (OriginLab Corporation, Northampton, Massachusetts, USA).
3. Results
3.1. Soil pH, Exchangeable K, Ca, Mg, and Micronutrients Status and Spatial Distribution of the Main Apple Production Areas in the Loess Plateau, China
The soil K, Ca, Mg, and micronutrients evaluated at two depths (0–20 and 20–40 cm soil depth) with Shaanxi, Shanxi, Henan, Gansu, and Ningxia Province, the average content of soil pH, exchangeable K, Ca, Mg, available Cu, Mn, Zn, and Fe were 8.56, 269.36 mg kg−1, 5.14 g kg−1, 0.20 g kg−1, 1.11 mg kg−1, 4.46 mg kg−1, 0.94 mg kg−1, and 5.94 mg kg−1, respectively (Table 2). Most of the soils were characterized by high pH and medium Ca, indicating that the soils in The Loess Plateau’s apple orchards were calcareous. Moreover, 29.1% and 26.1% of the orchards had excess soil exchangeable K and Mg, respectively. In contrast, 27.4%, 63.8%, 20.1%, and 32.2% of the soils were low in exchangeable K, available Mn, Zn, and Fe, respectively and over 25.00% of the soil samples were deficiency in exchangeable K and available Zn (Table 2). Additionally, 38.9%, 45.4%, 36.2%, 31.3%, and 52.0% of the soils were medium in exchangeable Mg, available Cu, Mn, Zn, and Fe, respectively, and 15.7% and 33.5% of the soils were high in exchangeable Mg and available Cu, respectively (Table 2). The soil pH values of the main apple production areas in The Loess Plateau were concentrated in the range of 7.14 to 9.33 with an average 8.55 of 0–20 cm soil depth and ranged of 7.27 to 9.31 with an average 8.57 of 20–40 cm soil depth (Table 3), indicating that the soil of the main apple production areas in The Loess Plateau was alkaline. The mean values of soil pH at 0–20 cm soil depth followed the order in Ningxia> Shaanxi> Gansu> Shanxi> Henan province. Likewise, the mean values of pH at 20–40 cm soil depth in Ningxia also was higher than in other provinces (Table 3).
One unanticipated finding was that in the exchangeable K of five Provinces, there were significant differences in the exchangeable K, especially in Shanxi was excessive of ex-changeable K (Table 3). The study areas had high exchangeable K contents, which were concentrated in the range of 71.13 to 677.70 mg kg−1 with an average of 294.78 mg kg−1 in 0–20 cm soil depth and 48.29 to 697.80 mg kg−1 with the average 243.93 mg kg−1 in 20–40 cm soil depth (Table 3). Highly differences between the exchangeable K, the highest of exchangeable K was found in Shanxi province at 0–20 cm soil depth and the lowest was found in Ningxia province. Meanwhile, at 20–40 cm soil depth of the highest exchangeable K and the lowest were also recorded in Shanxi and Ningxia provinces, respectively (Table 3).
Additionally, the soil exchangeable Ca levels in most orchards were sufficient (Table 2). The exchangeable Ca was relatively similar at both depths sampled, exchangeable Ca varied from 3.12 to 6.41 g kg−1 with an average of 5.15 g kg−1 in 0–20 cm soil depth and 3.24 to 6.65 g kg−1 with an average of 5.12 g kg−1 in 20-40 cm soil depth. The highest of exchangeable Ca was found in Shaanxi and the lowest exchangeable Ca was in Henan province at 0–40 cm soil depth (Table 3). However, in most of the study areas an apparent exchangeable Ca sufficient was indicated by the relatively moderate levels of exchangeable Ca.
Furthermore, the soil exchangeable Mg contents in most orchards also were sufficient (Table 2), the exchangeable Mg varied considerably across in the main apple production areas in The Loess Plateau, with exchangeable Mg between 0.08 to 0.55 g kg−1 with the average was 0.20 g kg−1 in 0–20 cm soil depth and ranged from 0.09 to 0.44 g kg−1 with an average 0.20 g kg−1 in 20–40 cm soil depth (Table 3). Moreover, the highest exchangeable Mg was found in Ningxia province and the lowest was found in Shaanxi province. Meanwhile, at 20–40 cm soil depth of the highest exchangeable Mg was also recorded in Ningxia province and the lowest exchangeable Mg was also in Shaanxi province (Table 3).
The soil available Cu in most orchards was sufficient in soil ranging from 0.20 to 6.54 mg kg−1 with an average of 1.07 mg kg−1 in 0–20 cm soil depth and 0.15 to 8.87 mg kg-1 with an average of 1.14 mg kg−1 in 20–40 cm soil depth (Table 3). The highest soil available Cu was found in Henan province at 0–20 cm soil depth and the lowest available Cu was in Ningxia province. Meanwhile, at 20–40 cm soil depth of the highest available Cu and the lowest were recorded in Henan and Ningxia provinces, respectively (Table 3).
The study area had low soil available Mn contents (Table 2), which were concentrated in the range of 1.43 to 11.36 mg kg−1 with an average of 4.49 mg kg−1 in 0–20 cm soil depth and 1.63 to 9.49 mg kg−1 with an average 4.43 mg kg-1 in 20–40 cm soil depth, The highest of available Mn (6.14 mg kg−1) was found in Gansu province and the lowest available Mn was in Shaanxi province at 0–40 cm soil depth (Table 3).
For soil available Zn varied considerably across the main apple production areas in the Loess Plateau, the soil available Zn in 0–20 cm soil depth in the orchards of Henan province was 4.2 times higher than those of the Shaanxi province (Table 3). Soil available Zn values were concentrated in the range of 0.11 to 3.30 mg kg−1 with an average of 0.99 mg kg−1 in 0–20 cm soil depth and 0.13 to 3.67 mg kg−1 with an average of 0.99 mg kg−1 in 20–40 cm soil depth (Table 3). Henan province had the highest soil available Zn, followed by Shanxi> Ningxia> Gansu> Shaanxi provinces. The highest of available Zn in 20–40 cm soil depth was found in Henan province and the lowest available Zn was recorded in Gansu province (Table 3).
In addition, the observation of soil available Fe were similar trend of value in 0–20 cm soil depth and 20–40 cm soil depth (Table 3). Soil available Fe values were concentrated in the range 2.08 to 16.58 mg kg−1 with an average of 5.99 mg kg−1 in 0–20 cm soil depth and 2.29 to 12.98 mg kg−1 with an average of 5.88 mg kg−1 in 20–40 cm soil depth. However, in the most of study areas, an apparent available Fe moderate was indicated by the relatively low levels of available Fe across 0–20 cm soil depth and the highest of available Fe in 0–40 cm soil depth was found in Henan province and the lowest available Fe was recorded in Shaanxi province (Table 3).
The distribution pattern of each soil parameter at deficiency, low, medium, high, and excess levels for the five provinces coincided with the statistical results mentioned above (Figure 1 and Table 2). According to the grading of soil nutrient classification standards for apple orchards in the Loess Plateau by Zhang et. al. [37] (Table 4), we graded soil samples from apple orchards in the Loess Plateau regions. The exchangeable K of 69.6% and 45.2% out of soil samples at 0–20 cm soil depth samples in Shanxi and Henan were excessive levels, respectively, and 65.2% and 32.0% of the 20-40 cm soil depth samples in Shanxi and Henan also were excessive level, respectively (Figure 1a,b). In contrast, 60.0% of the samples were deficient in Ningxia province at 0–20 cm soil depth (Figure 1a). 59.3% and 80.0% of 20–40 cm soil depth was deficient in Shanxi and Ningxia provinces, respectively. Moreover, 52.0% of 20–40 cm soil depth was low in Gansu province (Figure 1b).
The exchangeable Ca contents of 100% out of the soil samples were medium, most of soils were characterized by medium level, indicating that the soils in five provinces were calcareous soil (Figure 1a,b). The results of soil exchangeable Mg distribution soil depth were summarized in Figure 2. Results suggested that exchangeable Mg content of 32.3%, 41.9%, 43.8%, and 40.0% out of the orchards had excessive in Shanxi, Henan, Gansu, and Ningxia provinces, respectively at 0–20 cm soil depth. Meanwhile, 37.5%, 35.5%, 40.0%, and 60.0% of the orchards had excessive in Shanxi, Henan, Gansu, and Ningxia provinces, respectively at 20–40 cm soil depth (Figure 1a,b). In contrast, 50.8%, 31.3%, 25.8%, 53.3%, and 30.0% of the samples were low exchangeable Mg in Shaanxi, Shanxi, Henan, Gansu, and Ningxia provinces, respectively (Figure 1a,b). Therefore, the results indicate that the content of exchangeable Mg in the main apple production areas in the Loess Plateau was high level.
As shown in Figure 1a,b, the available Cu of 45.3%, 58.1%, 76.2%, and 20.0% out of the soil samples were medium levels in Shaanxi, Shanxi, Gansu, and Ningxia provinces, respectively in 0–20 cm soil depth and 38.7%, 56.7%, 39.4%, 71.4%, and 20.0% out of the soil samples were medium in Shaanxi, Shanxi, Henan, Gansu, and Ningxia province, respectively in 20–40 cm soil depth. While 31.3%, 35.5%, 56.0%, 23.8%, and 20.0% of the soil samples were high level in Shaanxi, Shanxi, Henan, Gansu, and Ningxia provinces, respectively in 0–20 cm soil depth and 32.3%, 33.3%, 39.4%, 28.6%, and 20.0% of the soil samples were high in Shaanxi, Shanxi, Henan, Gansu, and Ningxia provinces, respectively in 20–40 cm soil depth. We graded soil available Mn content of 89.4%, 43.8%, 48.4%, 28.6%, and 50.0% out of the orchard had low level in Shaanxi, Shanxi, Henan, Gansu, and Ningxia provinces, respectively at 0–20 cm soil depth. Meanwhile, 88.9%, 53.1%, 58.1%, 66.7%, and 50.0% out of the orchard had low level in Shanxi, Shanxi, Henan, Gansu, and Ningxia provinces, respectively at 20–40 cm soil depth (Figure 1a,b). Furthermore, 56.3%, 51.7%, 71.4%, and 50.0% of the samples were medium level in Shanxi, Henan, Gansu, and Ningxia provinces, respectively at 0–20 cm soil and 46.9%, 41.9%, 66.7%, and 50.0% of the samples were medium levels in Shanxi, Henan, Gansu, and Ningxia provinces, respectively at 20–40 cm soil depth (Figure 1a, b). Hence, the results indicate that the content of available Mn in the main apple production areas in The Loess Plateau was moderate to low level.
As shown in Figure 1, the available Zn at 0–20 cm soil depth 70.9% of Shaanxi province orchards had deficiency levels and 39.7% also had deficiency levels in Shaanxi province at 20–40 cm soil depth. Meanwhile, 19.4%, 37.5%, 33.3%, and 44.4% of the orchard had low levels in Shaanxi, Shanxi, Gansu, and Ningxia provinces, respectively at 0–20 cm soil depth. Additionally, 37.9%, 67.7%, 43.5%, 26.4%, and 55.0% of the orchard had low level in Shaanxi, Shanxi, Gansu, and Ningxia province, respectively at 20–40 cm soil depth. Although, soil available Zn varied considerably across the main apple production areas in the Loess Plateau. Nevertheless, the results indicate that the content of available Zn in the main apple production areas in the Loess Plateau was medium (Figure 1a,b).
Results suggested that available Fe content of 32.3%, 56.3%, 48.2%, 80.9% and 40.0% out of the orchard had medium levels in Shaanxi, Shanxi, Henan, Gansu, and Ningxia provinces, respectively at 0–20 cm soil depth. Meanwhile, 50.0%, 66.7%, 63.3%, 57.1%, and 50.0% out of the orchard had medium levels in Shanxi, Shanxi, Henan, Gansu, and Ningxia provinces, respectively at 20–40 cm soil depth. Furthermore, 50.8%, 25.0%, and 30.0% of the samples were low levels in Shaanxi, Shanxi, and Ningxia province, respectively at 0–20 cm soil depth and 43.6%, 23.3%, 42.9%, and 40.0% of the samples were low level in Shaanxi, Shanxi, Gansu, and Ningxia provinces, respectively at 20–40 cm soil depth (Figure 1a,b). Hence, the results indicate that the content of available Fe in the main apple production areas in the Loess Plateau was medium to low level.
3.2. Evaluation of Leaf K, Ca, Mg, and Micronutrients Status and Spatial Distribution of the Main Apple Production Areas in the Loess Plateau, China
The leaf nutrient status evaluation with Shaanxi, Shanxi, Henan, Gansu, and Ningxia Provinces. The main apple production areas in the Loess Plateau, the average content of total K, Ca, Mg, Cu, Mn, Zn, and Fe were 19.76 g kg−1, 24.43 g kg−1, 3.64 g kg−1, 24.90 mg kg−1, 119.37 mg kg−1, 23.35 mg kg−1, and 87.46 mg kg−1, respectively (Table 5). The Leaf nutrients evaluation with Shaanxi, Shanxi, Henan, Gansu, and Ningxia Province, the main apple production areas in the Loess Plateau, China. We found that 32.4%, 33.6%, 24.8%, and 72.2% of the orchard were excessive in leaf K, Ca, Mg, and Mn, respectively and 38.7% and 28.5% of the orchard were high in leaf Ca and Mg. Moreover, 46.3% of the orchards were medium in leaf K (Table 5). In contrast, 66.2% of the orchards showed deficiency leaf Fe, and 68.0% and 40.0% of the orchards were low in leaf Cu and Zn (Table 5).
These results showed that the total K content varied from 8.51 to 33.69 g kg−1 with an average was 19.17 g kg−1, while the total K of Ningxia province was higher than another province and the lowest total K was observed in Shanxi province (Table 6). Furthermore, the content of total Ca varied from 10.12 to 39.73 g kg−1 with an average was 24.43 g kg−1. Shaanxi had the highest leaf Ca concentration, followed by Ningxia> Henan> Shanxi> Gansu province (Table 6). Surprisingly, the total Mg in the orchards of Ningxia province were 2.9 times higher than that Shanxi province, a significant difference was observed between province for total Mg, the total Mg in five provinces were summarized in Table 5. Results suggested that the total Mg content varied from 0.43 to 7.26 g kg−1 with the average was 3.64 g kg−1. However, the highest total Mg was observed in Ningxia province and the lowest total Mg was observed in Shanxi province (Table 6).
The total Cu varied considerably across in the main apple production areas, total Cu content within leaves was inconsistent with that of the soil in the main apple production areas in The Loess Plateau. No significant difference was observed between provinces for total Cu, the content of total Cu varied from 7.56 to 145.82 mg kg−1 with an average was 24.90 g kg−1. Shaanxi province had the highest leaf Cu concentration, followed by Henan> Shanxi> Gansu> Ningxia province (Table 6). For the leaf Mn, the content of total Mn varied from 43.66 to 202.55 mg kg−1 with an average was 119.37 mg kg−1. The contents of total Mn were very high of leaf Mn, Shannxi had the highest leaf Mn concentration, followed by Shanxi> Henan> Ningxia> Gansu province (Table 6). While the total Zn was significantly different for each province, the total Zn contents varied from 8.65 to 79.19 mg kg−1 with an average of 23.35 mg kg−1 (Table 6). There were different greater under each province, the highest of the total Zn was found in Henan province and the lowest of total Zn was observed in Shanxi province (Table 6). Likewise, the total Fe was significantly different in each province, Deficiency of leaf Fe levels was observed in almost all the orchards. The total Fe contents varied from 20.23 to 187.38 mg kg−1 with an average of 87.46 mg kg−1. The highest total was observed in Ningxia province and the lowest total Fe was observed in Henan province (Table 6).
According to the grading of leaf nutrient classification standards for apple orchard in The Loess Plateau by An et al. [31] and Li et al. [39] (Table 7), The distribution pattern of each leaf nutrient at deficiency, low, medium, high, and excess levels for the five provinces agreed well with the statistical results of leaf nutrient concentrations (Figure 2 and Table 5). We graded leaf total K content of 51.6%, 73.3%, 34.5%, 30.0%, and 40.0% of the leaf samples were medium in Shanxi, Shaanxi, Henan, Gansu, and Ningxia provinces, respectively and 22.6%, 13.63%, 51.7%, 45.0%, and 40.0% of the leaf samples were excessive in Shaanxi, Shanxi, Henan, Gansu, and Ningxia provinces, respectively. In addition, 19.05%, 66.67%, 55.17%, 50%, and 50.0% of the leaf samples were high in Shanxi, Shaanxi, Henan, Gansu, and Ningxia province, respectively and 47.62%, 27.59%, and 40.0% of the leaf samples were excessive in Shanxi, Henan, Gansu, and Ningxia provinces, respectively (Figure 2). We graded leaf total Mg content of 17.5%, 41.4%, 20.0%, and 70.0% of the leaf samples were excess in Shaanxi, Henan, Gansu, and Ningxia provinces, respectively and 26.9%, 24.1%, 60.0% and 30.0% of the leaf samples also were high in Shaanxi, Henan, Gansu, and Ningxia provinces, respectively. In contrast, 80.0% of the leaf samples were low in Shanxi province (Figure 2).
Shaanxi province, where 12.2% of the orchards showed excessive leaf Cu levels. In contrast, leaf Cu levels in 65.3%, 92.9, 50.0%, 53.3%, and 100% of samples were low in Shaanxi, Shanxi, Henan, Gansu, and Ningxia Provinces, respectively (Figure 2). We graded leaf total Mn content shown in Figure 2, we found 82.5%, 100%, and 76.0% of the leaf samples were excessive in Shaanxi, Shanxi, and Henan provinces, respectively. Therefore, the results indicate that the content of total Mn in the main apple production areas in The Loess Plateau was excessive, especially in Shaanxi, Shanxi, and Henan provinces. We graded leaf total Zn content of 32.1% of the leaf Zn was high levels in Henan province. In contrast, 47.6% and 35.2% of the leaf Zn were low in Shaanxi and Shanxi province and 50.0% of the leaf Zn also was deficient in Shaanxi province. Consequently, these results suggest that the leaf Zn in the main apple production areas in The Loess Plateau was present in eedium to low levels (Figure 2). Leaf total Fe content of 77.9%, 82.1%, 60.0%, and 30.0% out of the leaf samples were deficiency in Shaanxi, Henan, Gansu, and Ningxia provinces, respectively. Therefore, the results indicate that the content of total Fe in the main apple production areas in The Loess Plateau was deficiency, especially in Henan, Shaanxi, and Gansu province and Low in Shanxi and Ningxia province.
3.3. Relationship between Soil Nutrients and Leaf Nutrients for the Main Apple Production Areas in the Loess Plateau, China
Pearson’s correlation analysis was conducted to analyzed the relationship between soil nutrients and leaf nutrients (Figure 3). The results implied that soil pH and soil ex-changeable Ca are important parameters related to the other chemical properties in 0–20 and 20–40 cm soil depth. The analysis of the relationship between selected soil properties and leaf nutrients in 0–40 cm soil depth is shown in Figure 3. Soil pH contents of the 0–20 cm soil depth in the orchards of the Loess Plateau had an extremely significant negative correlation with exchangeable K, available Cu, Zn, and Fe (p < 0.001). Moreover, soil pH had a significant negative correlation with Available Mn (p < 0.05). Meanwhile, Soil pH contents of the 20–40 cm soil depth also had an extremely significant negative correlation with available Mn, Zn, and Fe (p < 0.001). While negatively associated with exchangeable K and available Cu (p < 0.01). On the contrary, soil pH contents of the 0–20 cm soil depth in the orchards of the Loess Plateau had a highly significant positive correlation with Exchangeable Mg (p < 0.01) and an extremely significant positive correlation with leaf Mg (p < 0.001). Moreover, soil pH also had a significant positive correlation with leaf Ca (p < 0.05). A similar trend in soil pH contents of the 20–40 cm soil depth was also observed in Exchangeable Mg (p < 0.05), leaf Mg (p < 0.001), and leaf Ca (p < 0.05).
Similarly, an extremely significant negative correlation was also found between exchangeable Ca with available Cu, Mn, and Fe (p < 0.001) and a highly negative correlation with exchangeable Mg (p < 0.01) in 0–20 soil depth. Meanwhile, a significant negative correlation was also found with available Fe and Mn, both parameters were negatively associated with exchangeable Ca contents of the 20–40 cm soil depth (p < 0.01 and p < 0.05, respectively). Additionally, exchangeable K had a highly significant negative correlation with leaf Mg (p < 0.01) in 0–20 cm soil depth and an extremely significant negative correlation with leaf Mg (p < 0.001) in 20–40 cm soil depth. In contrast, exchangeable K had a significant positive correlation with available Cu (p < 0.01), available Mn (p < 0.05), leaf K (p < 0.05), and leaf Cu (p < 0.05) in 0–20 cm soil depth. In addition, exchangeable Mg had a highly significant positive correlation with available Mn (p < 0.05), leaf Mg (p < 0.01), and leaf Mn (p < 0.01) in 0–20 cm soil depth. Likewise, exchangeable Mg contents of the 20–40 cm soil depth had a significant positive correlation with leaf Mg (p < 0.01) and leaf Mn (p < 0.05) except for available Mn not observed in 20–40 cm soil depth. By contrast, exchangeable Mg had a highly significant negative correlation with leaf Zn (p < 0.01) in 20–40 cm soil depth. The correlation coefficients between available Cu of the 0–40 cm soil shown in Figure 3, there was an extremely significant positive correlation with available Mn and Fe (p < 0.001) and available Cu had a significant positive correlation with leaf Mn (p < 0.05) in 0–20 cm soil depth, but available Cu had significant positive correlation with leaf Zn (p < 0.05) in 20-40 cm soil depth.
Moreover, available Mn had an extremely significant positive correlation with available Zn and Fe (p < 0.001) in 0–20 cm soil depth and available Mn contents of the 20–40 cm soil depth had an extremely significant positive correlation with available Fe (p < 0.001). available Zn had an extremely significant positive correlation with Fe (p < 0.001) in 0–40 cm soil depth. By contrast, Figure 3 shows that the amount of available Zn in the orchards of the Loess Plateau had an extremely significant negative correlation with leaf Ca (p < 0.001) in 0–40 cm soil depth. More importantly, available Zn had a highly significant negative correlation with leaf Ca (p < 0.001) and leaf Zn (p < 0.01) in 0–40 cm soil depth. Additionally, leaf K had a significant positive correlation with leaf Ca (p < 0.05) and leaf Fe (p < 0.05) in 0–20 cm soil depth. Whereas in 20–40 cm soil depth, Leaf K had positively correlated with leaf Cu (p < 0.05). Leaf Ca had a positive correlation with leaf Zn (p < 0.001) and leaf Mg (p < 0.05) in 0–20 cm soil depth. A similar trend in leaf Ca was also observed positively related to leaf Zn (p < 0.001) but not observed with leaf Mg in 20–40 cm soil depth. Moreover, Leaf Mg had an extremely significant positive correlation with leaf Mn (p < 0.001) in 0–20 and 20–40 cm soil depth. By contrast, leaf Mg high significant negative correlation was also found between leaf Cu (p < 0.01) in 0–40 cm soil depth. However, leaf Fe did not significant correlation with soil nutrients in 0–40 cm soil depth. Surprisingly for leaf Fe was no significant correlation with soil nutrients in 0–40 cm soil depth.
4. Discussion
4.1. Soil pH, Exchangeable K, Ca, and Mg of Apple Orchard in the Loess Plateau
In The Loess Plateau, the soil nutrient status evaluation at two depths of soil depth with Shaanxi, Shanxi, Henan, Gansu, and Ningxia provinces was characterized by high pH, indicating that the soil of apple orchards was alkaline, which is in accordance with Dong et al. [37] and Zheng et al. [36] who is reported the soil pH in the Loess Plateau were alkaline and calcareous soils. According to the soil nutrient grading standard (Table 5), the soil of the Loess Plateau apple production region exhibited a medium exchangeable K and Ca, and high Mg in soil of the Loess Plateau. The results obtained were supported by Wang et al. [40], Dong et al. [37], and Ge et al. [29], who determined that K and Ca were sufficient, with high Mg in the Loess Plateau soil.
However, although the soil exchangeable K was sufficient in most orchards. The observed exchangeable K varied considerably across the main apple production areas of The Loess Plateau, especially in Shanxi and Ningxia provinces. This variance in exchangeable K content in soils is mostly due to changes in parent material, climate, and moisture regimes, all of which influence native and applied K transformations [41]. Furthermore, the amount of K fertilizer added, soil-crop management practices used, and crop uptake affect exchangeable K status in the soil. As shown in Figure 1, The soil samples at 0–40 cm soil depth in Shanxi province were excessive (>350 mg kg−1) in exchangeable K, the reason for this is generally due to K-rich parent materials and recurrent high K fertilizer applications [8]. In contrast, most of the soil samples at 0–40 cm soil depth in Ningxia province were deficient in exchangeable K, in agreement with K uptake may be less affected by a rise in soil Mg concentration due to this effective K+ uptake mechanism [42]. The variation in exchangeable K content in the Loess Plateau soils is mostly accounted for by differences in parent material, climate, and moisture regimes, all of which influence native Thus, the survey areas of the main apple production areas in the Loess Plateau should pay attention to K fertilizer and the higher available K level in soil may be impacting Ca absorption, and the bitter pit, caused by low Ca concentration in fruit, was common in this apple growing location [43].
Similarly in the soil exchangeable Ca content in the main apple production areas in The Loess Plateau was sufficient, in most of the study areas an apparent exchangeable Ca sufficient was indicated by the relatively medium levels of exchangeable Ca. The soil Ca contents of 100% out of the soil samples were medium, most of soil were characterized by medium level, indicating that the soils in The Loess Plateau were calcareous soil (Figure 2a,b), supports the previous finding that soil exchangeable Ca in The Loess Plateau was sufficient for apple tree [29]. A higher trend of soil pH at surface and subsurface depth might be due to the presence of high CaCO3 content at the respective depths and the average soil exchangeable Ca content (5.14 g kg−1) was similar to previous survey results [29,37].
On the other hand, the exchangeable Mg varied considerably across the main apple production areas in the Loess Plateauhe content exchangeable Mg was high level (0.19–0.24 g kg−1), there are relative differences of the province, the average content of soil exchangeable Mg (0.20 g kg−1 ) were higher than values of 108 ‘Fuji’ orchards in 12 dominant apple-producing counties in the Loess Plateau production region [37]. Most of the soil exchangeable Mg content in the main apple production areas in the Loess Plateau, especially in Ningxia and Shanxi were observed in excessive Mg (Table 3) in agreement with Ghafoor et al. [44] and Karajeh et al. [45], soils with high amounts of exchangeable Mg2+ can have their productivity increased by raising the levels of Ca2+ on the cation exchange complex to offset the effects of Mg2+, while soils with neutral or high pH levels usually have sufficient Mg.
4.2. Soil Cu, Mn, Zn, and Fe of Apple Orchard in the Loess Plateaus
Micronutrient deficiencies may affect plant growth, yield, and quality, risking human and animal health and productivity [46,47,48]. Fertilizers and cropping practises that absorb crop residue into the soil also influence micronutrient availability in the soil [49]. Our results showed that the apple orchards in the Loess Plateau were low Mn, moderate soil Zn, Fe, and high Cu. However, we found that the soil Cu content was high, which is consistent with previously reported results in this region [34]. High Cu levels were obtained from applied organic matter, and high Cu levels hinder the formation of new branches on apple trees and decrease the amount of active Fe in leaves [50].
The soil available Zn content (0.94 mg kg−1) was a similar trend with the values of 108 'Fuji' orchards in 12 dominant apple-producing counties in the Loess Plateau production region [37]. Although, soil available Zn was generally sufficient at 0–20 and 20–40 cm soil depths. As shown in Figure 2, 70.9% of soil samples in Shaanxi province orchards had deficiency at 0-20 cm soil depth, and 39.7% also had deficiency level in Shaanxi province at 20–40 cm soil depth. For soil available Zn varied considerably across the main apple production areas in the Loess Plateau, the soil available Zn in 0–20 cm soil depth in the orchards of Henan province were 4.2 times higher than those of the Shaanxi province, According to Hou et al. [51], the soil Zn status of apple orchards in Shaanxi province indicates that Zn deficiency may be a limiting factor for apple yield. As a result, increasing Zn concentration is important, especially in orchards with highly diseased plants. The soil available Fe content (5.94 mg kg−1) was generally moderate, which is consistent with previous studies on the soil nutrient status of apple orchards in the Loess Plateau [37]. However, 50.8% and 25.0% out of the samples were low level in Shaanxi, and Shanxi province, respectively at 0–20 cm soil depth and 43.6%, 23.3% out of the samples were low level in Shaanxi and Shanxi province, respectively at 20–40 cm soil depth (Figure 2a,b), agree with Wang et al. [40], who is reported soil total Fe levels in some orchards in, Shanxi, and Shaanxi were low. Micronutrient availability in soil is influenced by a variety of complex chemical processes and interactions. Because of the critical roles they play in fruit production, substantial research is required for micronutrient management in the Loess Plateau, China.
4.3. Leaf K, Ca, and Mg of Apple Orchard in the Loess Plateau
Based on the leaf nutrient classification standards for apple orchards in the Loess Plateau by Li et al. [39] and Guiyang et al. [31], we found that the leaf K content was high, As shown in Table 3, our results showed that the apple orchard in the Loess Plateau were sufficient in leaf K. Moreover, 32.4% of the orchards observed excessive leaf K, the excessive application of readily K fertilizers has resulted in extremely high leaf K levels in most apple orchards. Most of the leaf Ca contents in the Loess Plateau were sufficient, which is consistent with previously reported results in this region [29,31].
The relatively high Mg in most orchards, 28.5% and 24.8% of the leaf samples were high and excessive in leaf Mg. The soi exchangeable Mg in the Loess Plateau was high, thus causing extremely high leaf Mg of the orchard in the Loess Plateau. This result may be explained by the relatively high leaf Mg levels in most orchards were closely related to excessive leaf N levels. Leaf Mg levels in the Red Fuji apple trees increased as the amounts of soil application of N fertilizers increased [52].
4.4. Leaf Cu, Mn, Zn, and Fe of Apple Orchard in the Loess Plateaus
In the Loess Plateau, the content of leaf Zn was low, especially in Shaanxi and Shanxi provinces. These results are consistent with province studied [29,31], therefore it is necessary to enhance Zn content, especially in orchards with low and deficiency of leaf Zn. The contents of total Mn were very high leaf Mn, As shown in Figure 2, we found 82.5%, 100%, and 76.0% of the leaf samples were excessive in Shaanxi, Shanxi, and Henan provinces, respectively in agreement with previously studied Wang et al. [31] who corroborated the research performed very high of leaf Mn in the Loess Plateau. Additionally, in agreement with Mn uptake by the apple tree was often excessive and accompanied by a Fe deficiency [53]. This effect is consistent with the excessive leaf Mn and deficiency leaf Fe in The Loess Plateau apple orchard in the current study. In The Loess Plateau, the contents of leaf Fe were deficient, the lack of Fe in leaves was corroborated by research performed by Li et al. [39] and Guiyang et al. [31], who concluded that Fe was the limiting factor in apple production in the Loess Plateau. Zhang et al. [37] also reported that The Fe content of Fuji apple leaves in Jiaodong Peninsula was low, the leaf Mn content was high, and leaf Mn poisoning appeared in some orchards. Meanwhile, the soil of the Loess Plateau was calcareous, with a high pH value and high HCO3- concentration, and the apple orchard from that region showed Fe-deficient chlorosis [30,31]. Thus, the authors suggested the application of Fe fertilizer be reasonably increased. However, our results showed that the orchards in the Loess Plateau were adequate in terms of their total leaf Fe despite their soil Fe deficiency (Table 3 and Table 4). In contrast, the content of leaf Cu was higher than that of Ge et al. [29]. These discrepancies in nutrient concentrations may have an etiological root in previous imbalanced fertilizer applications. As a result of these findings, fertilizer containing Fe and Zn should be recommended to increase quality in the Loess Plateau apple growing region, nevertheless, Mn should be avoided and should pay more attention to Cu fertilization. Overall, soil-applied fertilizer utilization is low in calcareous and alkaline soils because of high nitrogen fixing and lower nutrient mobility [54,55]. In contrast, foliar spray is the fastest way to cope with the deficiency and translocate micronutrients in plant organs.
4.5. Relationship between Soil Nutrients and Leaf Nutrients for the Main Apple Production Areas in the Loess Plateau, China
The correlations between the various soil and leaf nutrient parameters were statistically significant, the observation was general closely between in 0–20 cm soil depth and 20–40 cm soil depth. (Figure 3a,b). Notably, a significant relationship was established between soil fertility measures rather than soil leaf characteristics. The soil base cation and available micronutrient concentrations were found to be positively and negatively correlated with soil pH [56]. Most importantly, Soil pH and exchangeable Ca may be the most important variables for indicating soil fertility of the main apple production areas in The Loess Plateau, because both were significantly correlation with other chemical properties. Our investigation indicated that soil pH in 0–40 cm soil depth negatively correlated with several soil elements (K, Cu, Zn, and Fe) and positively related to exchangeable Mg, leaf Mg, and leaf Ca in 0–40 cm soil depth. The soil exchangeable cation and available micronutrient concentrations were suggested to be positively and negatively correlated with soil pH, respectively [23,56].
A negative correlation between soil pH and soil-available micronutrients (Figure 3a,b), an increase in soil pH has the potential to decrease the availability of certain micronutrient metals. [57,58,59]. Micronutrients are commonly lacking in high-pH soils and are frequently available in acidic soils. Soil pH is an important factor that influences the solubility and availability of plant nutrients. Indeed, the solubility of micronutrients was suggested to decrease 100-fold (for Mn and Zn) and 1000-fold (for Fe) with a one-unit increase in soil pH [24]. High soil pH can limit the availability of micronutrients such as Fe and Zn [22,60]. Consequently, the pH of the soil is the most important factor in limiting micronutrient availability. However, the influence of soil K availability under-regulated pH varies between soil types, particularly between temperate and tropical or subtropical soils. This demonstrated that increasing soil pH with lime will most likely release exchangeable sites by removing Al3+ ions and improving soil K availability. [61,62]. In addition, crop K uptake decreased significantly when the application rate of lime was higher than 3 t/ha for wheat and rice in sub-tropical soil [63]. However, soil pH also was positively related to exchangeable Mg, leaf Mg, and leaf Ca in 0–40 cm soil depth, Thus, the result suggests that maintaining an appropriate and stable soil pH is central to the sustainable soil nutrient management of the main apple production areas in The Loess Plateau.
A strong correlation was observed between exchangeable Ca with soil elements (Mg, Cu, Mn, and Fe) in 0–40 cm soil depth. Exchangeable Ca was negatively related to exchangeable Mg, Available Cu, Mn, and Fe. These results agree with Wacal et al. [64] reported that increased soil exchangeable Ca and Mg levels resulted in decreased K concentrations in sesame leaf tissue cultivated on converted paddy uplands in Japan. Similarly, soil Mg availability and plant absorption are controlled by Ca and K availability, and by Ca/Mg [65]. Osemwota et al. (2007) also reported the influence of soil Ca/Mg ratio on soil Mg availability and Mg concentration in maize cultivated in forest and derived savanna ecological zones of Nigeria was also observed. Meanwhile, Micronutrients, on the other side of hand, play an important role in plant development and health, soil calcareousness and alkaline pH are all factors in micronutrient deficiency [66,67].
Exchangeable K had a highly significant negative correlation with leaf Mg (p < 0.01) in 0–20 cm soil depth and an extremely significant negative correlation with leaf Mg (p < 0.001) in 20–40 cm soil depth (Figure 3a,b). Especially in Shanxi province, leaf Mg leaf Mg tends to be reduced more consistently by high exchangeable K. Moreover, many investigations have shown that Mg2+ and K+ have a strong antagonistic interaction, with increased K+ concentrations inhibiting Mg2+ uptake. The Mg content of rice (Oryza sativa L.) has been found to be lower [68] and cowpea crops (Vigna unguiculata L. Walp.) at higher K+ concentrations [69]. Increased K concentrations in roots have been reported to depress Mg translocation from roots to shoots, leading to low leaf Mg [70,71]. The antagonism between K+ and Mg2+ may occur in the processes involved in nutrient uptake and translocation within the plant. Competition for similar transporters on the cell membrane is the main reason for antagonism between K+ and Mg2+ [68,72,73]. Therefore, the presence of abundant K+ in the solution prevents Mg uptake [74]. The basic reason for antagonism between K+ and Mg2+ is competition for comparable transporters on the cell membrane [75,76]. Our results showed that soil exchangeable Mg is relatively high in most orchard, most research involving K, Ca, and Mg have explored a two-way, or even three-way interaction with increased (or decreased) rates of either of the three nutrients causing a concurrent decrease (or increase) in the other two, resulting in a stable cationic to [42]. Excessive application of high rates of K, antagonistically interferes with plant Mg uptake, thus enhancing the risk of Mg deficiency.
More importantly, available Zn had a highly significant negative correlation with leaf Ca (p < 0.001) and leaf Zn (p < 0.01) in 0–20 cm soil depth, In agreement with Davis-Carter et al. [77], leaf Zn increased during increased soil Zn rates, while leaf Zn fell with rising pH levels, and soil Zn treatment decreased leaf calcium in some cases in peanuts. However, no relations of leaf K and Ca concentrations with exchangeable K and Ca in soils of The Loess Plateau, there are reports of the contribution of non-exchangeable K towards K nutrition of the crops [78,79]. Therefore, there is a need to study the internal K, Ca, and Mg use mechanisms of apples to have a better understanding of the relationships of soil and leaf K, Ca, and Mg concentrations in The Loess Plateau for their efficient management.
5. Conclusions
Our results showed that the apple orchards in the main apple productions of the Loess Plateau were characterized by high soil pH, moderate Ca, and high Mg, indicating that the soils were calcareous. The investigated apple orchards in the Loess Plateau exhibited low Mn, moderate soil K, Zn, Fe, and high Cu and deficiency of leaf Fe, Moderate leaf Cu, and Zn, as well as high Ca, Mg, and excessive in leaf Mn. The observation soil property was generally closely between 0–20 cm soil depth and 20–40 cm soil depth. Except for soil exchangeable K and Available Zn, these results are consistent with the large variation for those nutrients, which may be attributed to the unbalanced application of K and Zn fertilizers in the main apple production areas in The Loess Plateau, China, and in the Loess Plateau region.
Moreover, Soil pH in 0–40 cm soil depth negatively correlated with several soil elements (K, Cu, Zn, and Fe) and positively related to exchangeable Mg, leaf Mg, and leaf Ca. Moreover, exchangeable K was positively and significantly correlated with leaf Mg in 0–40 cm soil depth, especially in 20–40 cm soil depth and A strong correlation was observed between exchangeable Ca with soil element (Mg, Cu, Mn, and Fe) in 0-40 cm soil depth, indicating the importance of soil pH and exchangeable Ca as an indication of apple production.
However, soil micronutrient contents in Shaanxi province trend lower than in other provinces, suggesting that soil Mn and Zn deficiency may be a limiting factor for apple production. Consequently, it is suggested that the soil pH be reduced in the Loess Plateau, replenishing soil organic matter and micronutrients, controlling soil Ca and Mg, and the Loess Plateau must pay attention to controlling K fertilizer application to avoid soil enchantable cation and enhancing organic fertilizer application to improve soil micronutrients (Zn, Mn, and Fe) are highly necessary and it is necessary to enhance Fe content, especially in orchards with low and deficiency of leaf Fe for the sustainable management of apple orchards in the Loess Plateau.
Author Contributions
Conceptualization, E.S. and B.Z.; methodology, E.S. and B.Z.; formal analysis, E.S.; investigation, E.S. and T.F.; writing-original draft preparation, E.S.; writing-review and editing, E.S., T.F., T.S., Z.Z., W.Z. and B.Z.; visualization, B.Z.; supervision, B.Z.; project administration, B.Z.; funding acquisition, B.Z. and W.Z. All authors have read and agreed to the published version of the manuscript.
Funding
This study was supported by China Agriculture Research System of MOF and MARA (CARS-27), the Major Project of Science and Technology of Shaanxi (2020zdzx03-02-01), and the National Natural Science Foundation of China (42007093).
Institutional Review Board Statement
Not applicable.
Informed Consent Statement
Not applicable.
Data Availability Statement
All data generated or analyzed during this study are included in this manuscript.
Conflicts of Interest
The authors declare no conflict of interest.
References
- FAO (Food and Agriculture Organization). Statistical Databases. Availabe online: http://www.fao.org (accessed on 20 November 2023).
- NBSC (National Bureau of Statistics of China). National Database. Availabe online: http://www.stats.gov.cn (accessed on (accessed on 20 November 2023).
- Han, M. Theory and practice of apple development regulation in the Loess Plateau. China Agriculture, Beijing 2015.
- Zhang, H. My opinion on the Loess Plateau is the core producing region of high-quality apple in China. China Fruits 2019, 1, 114116. [Google Scholar] [CrossRef]
- Yuan, B.; Zhang, Y.; Chen, C. Spatial pattern evolution and its driving factors for apple industry in China: Based on micro perspective of farmers’ decision making. Journal of Arid Land Resources and Environment 2017, 31, 32–37. [Google Scholar] [CrossRef]
- Ge, S.; Zhu, Z.; Jiang, Y. Long-term impact of fertilization on soil pH and fertility in an apple production system. Journal of soil science and plant nutrition 2018, 18. [Google Scholar] [CrossRef]
- Liu, Z.; Ma, P.; Zhai, B.; Zhou, J. Soil moisture decline and residual nitrate accumulation after converting cropland to apple orchard in a semiarid region: Evidence from the Loess Plateau. CATENA 2019, 181, 104080. [Google Scholar] [CrossRef]
- Hu, D.; Jin, L.; Wu, R. Assessing current conditions of fertilization on apple orchard in the Loess Plateau. Shanxi J. Agric. Sci. 2017, 63, 44–49. [Google Scholar]
- Han, J.; Shi, J.; Zeng, L.; Xu, J.; Wu, L. Effects of nitrogen fertilization on the acidity and salinity of greenhouse soils. Environmental Science and Pollution Research 2015, 22, 2976–2986. [Google Scholar] [CrossRef]
- Ge, S.; Jiang, Y.; Wei, S.; Fang, X. Nitrogen balance under different nitrogen application rates in young apple orchards. Plant Nutrition and Fertilizer Science 2011, 17, 949–955. [Google Scholar] [CrossRef]
- Shu, H. Development status of fruit industry in China and several problems to be studied. Engineering Science 2003, 5, 45–48. [Google Scholar]
- Yang, Y.; Guo, S.; Ma, Y.; Chen, S.; Sun, W. Changes of orchard soil carbon, nitrogen and phosphorus in gully region of Loess Plateau. Plant Nutrition and Fertilizer Science 2008, 14, 685–691. [Google Scholar]
- Alloway, B.J. Micronutrients and crop production: An introduction. In Micronutrient deficiencies in global crop production; Springer, 2008; pp. 1–39. [Google Scholar] [CrossRef]
- Jodral-Segado, A.; Navarro-Alarcon, M.; De La Serrana, H.L.-G.; Lopez-Martinez, M. Calcium and magnesium levels in agricultural soil and sewage sludge in an industrial area from Southeastern Spain: relationship with plant (Saccharum officinarum) disposition. Soil and Sediment Contamination: An International Journal 2006, 15, 367–377. [Google Scholar] [CrossRef]
- Li, X.; Zhang, Y.; Wang, W.; Khan, M.R.; Cong, R.; Lu, J. Establishing grading indices of available soil potassium on paddy soils in Hubei province, China. Scientific Reports 2018, 8, 16381. [Google Scholar] [CrossRef] [PubMed]
- Tisdale, S.L.; Nelson, W.L.; Beaton, J.D. Soil fertility and fertilizers; Collier Macmillan Publishers, 1985. [Google Scholar]
- Rhodes, R.; Miles, N.; Hughes, J.C. Interactions between potassium, calcium and magnesium in sugarcane grown on two contrasting soils in South Africa. Field Crops Research 2018, 223, 1–11. [Google Scholar] [CrossRef]
- Di Palo, F.; Fornara, D.A. Plant and soil nutrient stoichiometry along primary ecological successions. PLOS ONE 2017, 12, e0182569. [Google Scholar] [CrossRef] [PubMed]
- Piao, H.-C.; Li, S.-L.; Yan, Z.; Li, C. Understanding nutrient allocation based on leaf nitrogen isotopes and elemental ratios in the karst region of Southwest China. Agriculture, Ecosystems & Environment 2020, 294, 106864. [Google Scholar] [CrossRef]
- Bitondo, D.; FO, T.; Ngoucheme, M.; AD, M. Micronutrient concentrations and environmental concerns in an intensively cultivated typic dystrandept in Mount Bambouto, Cameroon. Open Journal of Soil Science 2013, 2013. [Google Scholar] [CrossRef]
- Fageria, N.; Slaton, N.; Baligar, V. Nutrient management for improving lowland rice productivity and sustainability. Advances in agronomy 2003, 80, 63–152. [Google Scholar]
- Lucena, J.J. Effects of bicarbonate, nitrate and other environmental factors on iron deficiency chlorosis. A review. Journal of Plant Nutrition 2000, 23, 1591–1606. [Google Scholar] [CrossRef]
- Reisenauer, H. Determination of plant-available soil manganese. In Proceedings of Manganese in Soils and Plants: Proceedings of the International Symposium on ‘Manganese in Soils and Plants’ held at the Waite Agricultural Research Institute, The University of Adelaide, Glen Osmond, South Australia, August 22–26, 1988 as an Australian Bicentennial Event; pp. 87-98. [CrossRef]
- Rengel, Z. GENOTYPIC DIFFERENCES IN MICRONUTRIENT USE EFFICIENCY IN CROPS. Communications in Soil Science and Plant Analysis 2001, 32, 1163–1186. [Google Scholar] [CrossRef]
- Behera, S.; Rao, B.; Suresh, K.; Manoja, K. Soil nutrient status and leaf nutrient norms in oil palm (Elaeis guineensis Jacq.) plantations grown on southern plateau of India. Proceedings of the National Academy of Sciences, India Section B: Biological Sciences 2016, 86, 691–697. [Google Scholar] [CrossRef]
- Römheld, V. Chapter 11 ‐ Diagnosis of Deficiency and Toxicity of Nutrients. In Marschner’s Mineral Nutrition of Higher Plants (Third Edition), Marschner, P., Ed. Academic Press: San Diego, 2012. 299–312. [CrossRef]
- Halvin, J.L.; Beaton, J.; Tisdale, S.; Nelson, W. Soil fertility and fertilizers: an introduction to nutrient management. Pretice Hall, New Jersey 2005.
- Futian, P.; Yuanmao, J. Characteristics of N, P, and K nutrition in different yield level apple orchards. Scientia Agricultura Sinica 2006. [Google Scholar]
- Ge, S.; Zhu, Z.; Peng, L.; Chen, Q.; Jiang, Y. Soil Nutrient Status and Leaf Nutrient Diagnosis in the Main Apple Producing Regions in China. Horticultural Plant Journal 2018, 4, 89–93. [Google Scholar] [CrossRef]
- Guiyang, A.; Chonghui, F.; Zhihui, D.; Junyi, Y.; Fengchan, D.; Lianrang, S. Analysis of effective factors of nutrient content in apple leaves. Acta Horticulturae Sinica 2006, 33, 12. [Google Scholar]
- Guiyang, A.; Lianrang, S.; Zhihui, D.; Junyi, Y.; Fengchan, D. Studies on the Standard Range of Apple Leaf Nutritional Elements in ShaanxiProvince. Acta Horticulturae Sinica 2004, 31, 81. [Google Scholar]
- Liu, D.; Liu, H.; Liu, G.; Guo, D.; Guo, Y.; Zhang, H. The contents of the microelements in leaves of apple and correlativity with firmness of fruit in West-He'nan area. Acta Agric Boreali-occidentalis Sin 2007, 16, 138–141. [Google Scholar]
- Liu, Z.; Zhang, G.; Zhao, Z. Soil Nutrients of Apple Orchards in Major Production Area of Shaanxi. JOURNAL-NORTHWEST FORESTRY UNIVERSITY 2006, 21, 50. [Google Scholar]
- Wang, G.-y.; Zhang, X.-z.; Wang, Y.; Xu, X.-f.; Han, Z.-h. Key minerals influencing apple quality in Chinese orchard identified by nutritional diagnosis of leaf and soil analysis. Journal of Integrative Agriculture 2015, 14, 864–874. [Google Scholar] [CrossRef]
- Zhang, Q.; Wei, Q.; Jiang, R.; Liu, X.; Liu, H.; Wang, X. Correlation analysis of fruit mineral nutrition contents with several key quality indicators in'Fuji'apple. Acta Horticulturae Sinica 2011, 38, 1963–1968. [Google Scholar]
- Zheng, Z.; Wang, Y.; Shi, L.; Gong, Q.; Zheng, W.; Zhao, Z.; Zhai, B. Contents and distribution of soil organic matter and nitrogen, phosphate, potassium in the main apple production regions of Shaanxi Province. J. Plant Nutr. Fert 2017, 23, 1191–1198. [Google Scholar] [CrossRef]
- Dong, Z.; Li-wei, Z.; Ming-yu, H.; Chen-xi, G.; Wen-wen, L.; Juan-juan, M. Studies of the standard range of the soil nutrients in apple orchard in Loess Plateau. Acta Horticulturae Sinica 2016, 43, 121. [Google Scholar] [CrossRef]
- Bao, S. Soil and agricultural chemistry analysis. Beijing: China agriculture press: 2000.
- Gangli, L.; Runyu, S.; Juan, S. Studies on the nutritional ranges in some deciduous fruit trees. Acta Horticulturae Sinica (China) 1987. [Google Scholar]
- WANG, G.-y.; ZHANG, X.-z.; Yi, W.; XU, X.-f.; HAN, Z.-h. Key minerals influencing apple quality in Chinese orchard identified by nutritional diagnosis of leaf and soil analysis. Journal of Integrative Agriculture 2015, 14, 864–874. [Google Scholar] [CrossRef]
- Akbas, F.; Gunal, H.; Acir, N. Spatial variability of soil potassium and its relationship to land use and parent material. 2017. [CrossRef]
- Mengel, K.; Kirkby, E. Principles of plant nutrition., 5th edn (Kluwer Academic Publishers: Dordrecht, The Netherlands). 2001.
- Nie, P.; Yu, X.; Wang, Z.; Xue, X.; Wang, J. Effects of different calcium foliage fertilizers and spraying period on apple bitter pit disease and fruit quality. J. Hebei Agric. Sci 2017, 21, 47–49. [Google Scholar]
- Ghafoor, A.; Shahid, M.I.; Saghir, M.; Murtaza, G. Use of high-Mg brackish water on phosphogypsum and FYM treated saline-sodic soil. I. Soil improvement. Pakistan Journal of Agricultural Sciences 1992, 29, 180–184. [Google Scholar]
- Karajeh, F.; Karimov, A.; Mukhamedjanov, V.; Vyshpolsky, F.; Mukhamedjanov, K.; Ikramov, R.; Palvanov, T.; Novikova, A. Improved on-farm water management strategies in Central Asia. Agriculture in Central Asia: Research for Development. ICARDA, Aleppo, Syria, and Center for Development Research, Bonn 2004, 76-89.
- Cakmak, I. Plant nutrition research: Priorities to meet human needs for food in sustainable ways. Plant and Soil 2002, 247, 3–24. [Google Scholar] [CrossRef]
- Malakouti, M. Zinc is a neglected element in the life cycle of plants. Middle Eastern and Russian Journal of Plant Science and Biotechnology 2007, 1, 1–12. [Google Scholar]
- Marschner, H. Mineral nutrition of higher plants 2nd edn. Institute of Plant Nutrition University of Hohenheim: Germany 1995. [CrossRef]
- Wei, X.; Hao, M.; Shao, M.; Gale, W.J. Changes in soil properties and the availability of soil micronutrients after 18 years of cropping and fertilization. Soil and Tillage Research 2006, 91, 120–130. [Google Scholar] [CrossRef]
- LIU, C.; SHI, Y.; MA, L.; YE, Y.; YANG, J.; ZHANG, F. Effect of excessive copper on growth and metabolism of apple trees. Journal of Plant Nutrition and Fertilizers 2000, 6, 451–456. [Google Scholar] [CrossRef]
- Hou, L.; Liu, Z.; Zhao, J.; Ma, P.; Xu, X. Comprehensive assessment of fertilization, spatial variability of soil chemical properties, and relationships among nutrients, apple yield and orchard age: A case study in Luochuan County, China. Ecological Indicators 2021, 122, 107285. [Google Scholar] [CrossRef]
- Feng, H.; Li, B.; Zhang, L.; Jin, H.; Li, H.; Han, M. Influences of different rates of nitrogen on fruit quality, photosynthesis and element contents in leaves of red Fuji apples. Acta Agriculturae Boreli-occidentalis Sinica 2008, 17, 229–232. [Google Scholar]
- Ye, Y.-l.; Zhang, F.-s.; Jiang, X.-l.; Yu, Z.-f.; Wu, C.-n. Effects of different iron fertilizer on apple tree internal bark necrosis. JOURNAL-SHANDONG AGRICULTURAL UNIVERSITY 2003, 34, 68–73. [Google Scholar]
- Boaretto, A.E.; Boaretto, R.; Muraoka, T.; Nascimento Filho, V.F.d.; Tiritan, C.; Mourão Filho, F.d.A.A. Foliar micronutrient application effects on citrus fruit yield, soil and leaf Zn concentrations and 65Zn mobilization within the plant. In Proceedings of International Symposium on Foliar Nutrition of Perennial Fruit Plants 594; pp. 203–209. [CrossRef]
- Zekri, M.; Obreza, T.A. Micronutrient deficiencies in citrus: iron, zinc, and manganese; University of Florida Cooperative Extension Service, Institute of Food and …: 2003.
- Wang, R.; Dungait, J.A.; Buss, H.L.; Yang, S.; Zhang, Y.; Xu, Z.; Jiang, Y. Base cations and micronutrients in soil aggregates as affected by enhanced nitrogen and water inputs in a semi-arid steppe grassland. Science of the total environment 2017, 575, 564–572. [Google Scholar] [CrossRef]
- Alloway, B.J. Zinc in soils and crop nutrition. 2008.
- Lindsay, W.L. Chemical equilibria in soils; John Wiley and Sons Ltd.: 1979.
- Sims, J.T. Soil pH effects on the distribution and plant availability of manganese, copper, and zinc. Soil Science Society of America Journal 1986, 50, 367–373. [Google Scholar] [CrossRef]
- Rengel, Z. Cycling of micronutrients in terrestrial ecosystems. In Nutrient cycling in terrestrial ecosystems, Springer: 2007; pp. 93-121. [CrossRef]
- Han, T.; Cai, A.; Liu, K.; Huang, J.; Wang, B.; Li, D.; Qaswar, M.; Feng, G.; Zhang, H. The links between potassium availability and soil exchangeable calcium, magnesium, and aluminum are mediated by lime in acidic soil. Journal of Soils and Sediments 2019, 19, 1382–1392. [Google Scholar] [CrossRef]
- Scanlan, C.A.; Brennan, R.F.; D’Antuono, M.F.; Sarre, G.A. The interaction between soil pH and phosphorus for wheat yield and the impact of lime-induced changes to soil aluminium and potassium. Soil research 2017, 55, 341–353. [Google Scholar] [CrossRef]
- Xiaopu, Z.; Genbao, Z. Effect of continuous liming on crop growth and their absorption of nutrients. Acta Pedologica Sinica (China) 1987. [Google Scholar]
- Wacal, C.; Ogata, N.; Basalirwa, D.; Sasagawa, D.; Ishigaki, T.; Handa, T.; Kato, M.; Tenywa, M.M.; Masunaga, T.; Yamamoto, S. Imbalanced soil chemical properties and mineral nutrition in relation to growth and yield decline of sesame on different continuously cropped upland fields converted paddy. Agronomy 2019, 9, 184. [Google Scholar] [CrossRef]
- Fageria, V. Nutrient interactions in crop plants. Journal of plant nutrition 2001, 24, 1269–1290. [Google Scholar] [CrossRef]
- Rashid, A.; Rafique, E.; Bughio, N.; Yasin, M. Micronutrient deficiencies in rainfed calcareous soils of Pakistan. IV. Zinc nutrition of sorghum. Communications in soil science and plant analysis 1997, 28, 455–467. [Google Scholar] [CrossRef]
- Shah, Z.; Shahzad, K. Micronutrients status of apple orchards in Swat valley of North West Frontier Province of Pakistan. Soil Environ 2008, 27, 123–130. [Google Scholar]
- Ding, Y.; Luo, W.; Xu, G. Characterisation of magnesium nutrition and interaction of magnesium and potassium in rice. Annals of Applied Biology 2006, 149, 111–123. [Google Scholar] [CrossRef]
- Narwal, R.; Kumar, V.; Singh, J. Potassium and magnesium relationship in cowpea (Vigna unguiculata (L.) Walp.). Plant and Soil 1985, 86, 129–134. [Google Scholar] [CrossRef]
- Karlen, D.; Ellis Jr, R.; Whitney, D.; Grunes, D. Influence of Soil Moisture and Plant Cultivar on Cation Uptake by Wheat with Respect to Grass Tetany 1. Agronomy Journal 1978, 70, 918–921. [Google Scholar] [CrossRef]
- Wilkinson, S.; Grunes, D.; Sumner, M. Nutrient interactions in soil and plant nutrition. Handbook of soil science 2000, 89–112. [Google Scholar]
- Kamiya, T.; Yamagami, M.; Hirai, M.Y.; Fujiwara, T. Establishment of an in planta magnesium monitoring system using CAX3 promoter-luciferase in Arabidopsis. Journal of experimental botany 2012, 63, 355–363. [Google Scholar] [CrossRef] [PubMed]
- Shewmaker, G.E.; Johnson, D.A.; Mayland, H.F. Mg and K effects on cation uptake and dry matter accumulation in tall fescue (Festuca arundinacea). Plant and soil 2008, 302, 283–295. [Google Scholar] [CrossRef]
- Maathuis, F.J. Physiological functions of mineral macronutrients. Current opinion in plant biology 2009, 12, 250–258. [Google Scholar] [CrossRef] [PubMed]
- Farhat, N.; Elkhouni, A.; Zorrig, W.; Smaoui, A.; Abdelly, C.; Rabhi, M. Effects of magnesium deficiency on photosynthesis and carbohydrate partitioning. Acta physiologiae plantarum 2016, 38, 145. [Google Scholar] [CrossRef]
- Ohno, T.; Grunes, D. Potassium-magnesium interactions affecting nutrient uptake by wheat forage. Soil Science Society of America Journal 1985, 49, 685–690. [Google Scholar] [CrossRef]
- Davis-Carter, J.; Parker, M.; Gaines, T. Interaction of soil zinc, calcium, and pH with zinc toxicity in peanuts. In Proceedings of Plant-Soil Interactions at Low pH: Proceedings of the Second International Symposium on Plant-Soil Interactions at Low pH, 24–29 June 1990, Beckley West Virginia, USA. pp. 339–347. [CrossRef]
- Rao, C.S.; Srinivas, K. Potassium dynamics and role of non-exchangeable potassium in crop nutrition. Indian J. Fertil 2017, 13, 80–94. [Google Scholar]
- Steiner, F.; Lana, M.d.C. Contribution of non-exchangeable K in soils from Southern Brazil under potassium fertilization and successive cropping. Revista Ciência Agronômica 2018, 49, 547–557. [Google Scholar] [CrossRef]
Figure 1.
Soil exchangeable K, Ca, Mg, and Micronutrient distribution of five provinces of the main apple production in the Loess Plateau: (a) 0–20 cm soil depth; (b) 20–40 cm soil depth. Based on the standard classification of apple soil nutrients in The Loess Plateau, China from Zhang et al. [37]. The red color represents deficiency, the orange represents low, the yellow represents medium, the green represents high, and the brown color represents excessive levels of soil nutrients.
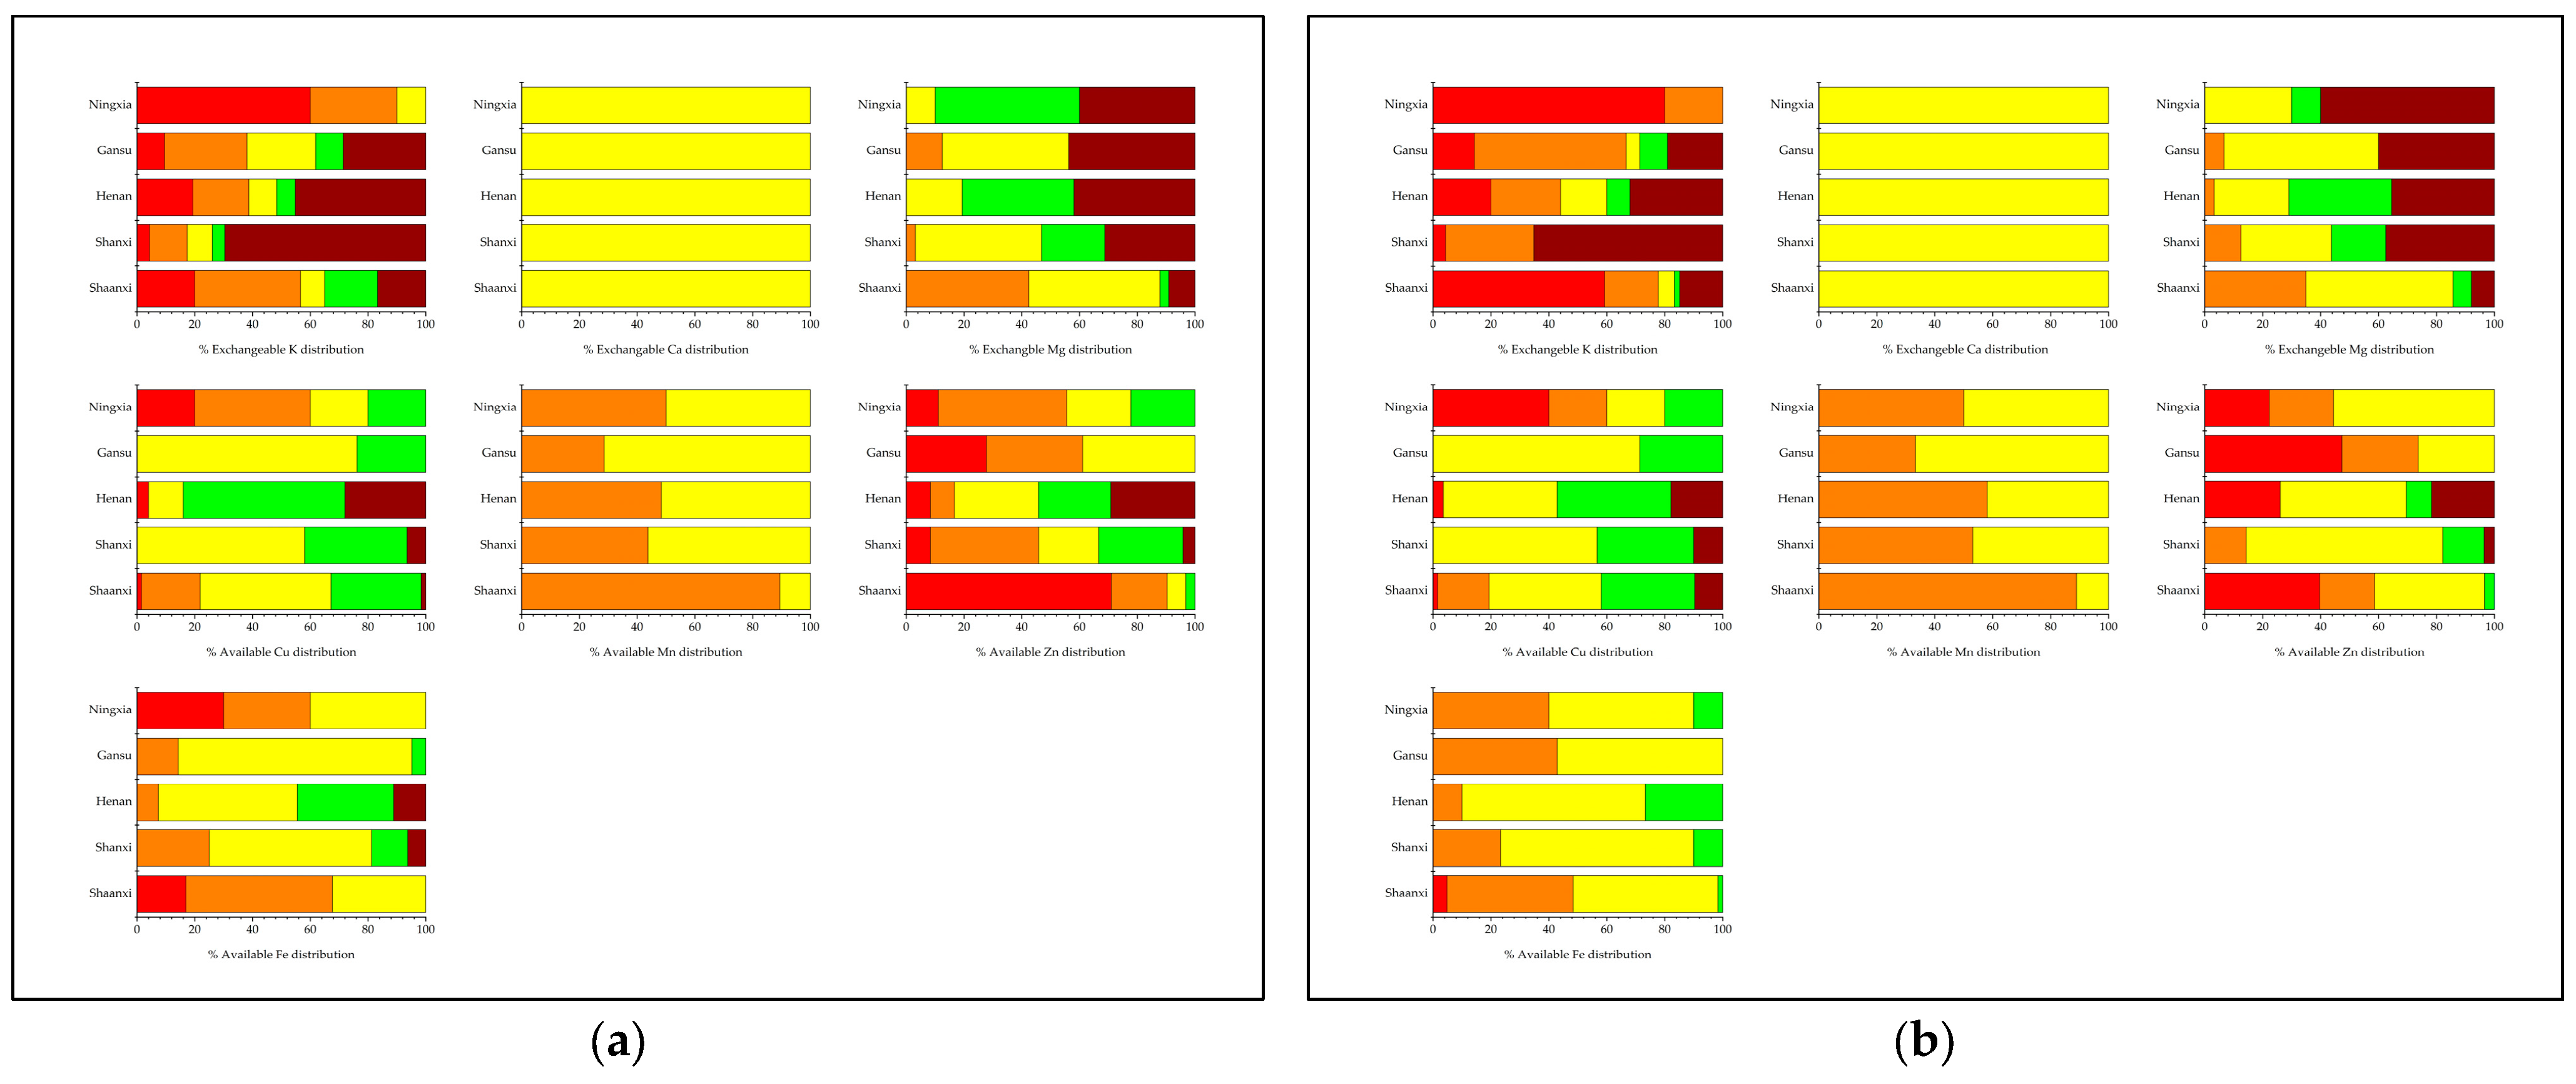
Figure 2.
Leaf nutrient distribution of five provinces of the main apple production in the Less Plateau. Based on leaf nutrients classification standards from Li et al. [39] and Guiyang et al. [31]. The red color represents deficiency, the orange represents low, the yellow represents me dium, the green represents high, and the brown color represents excessive levels of leaf nutrients.
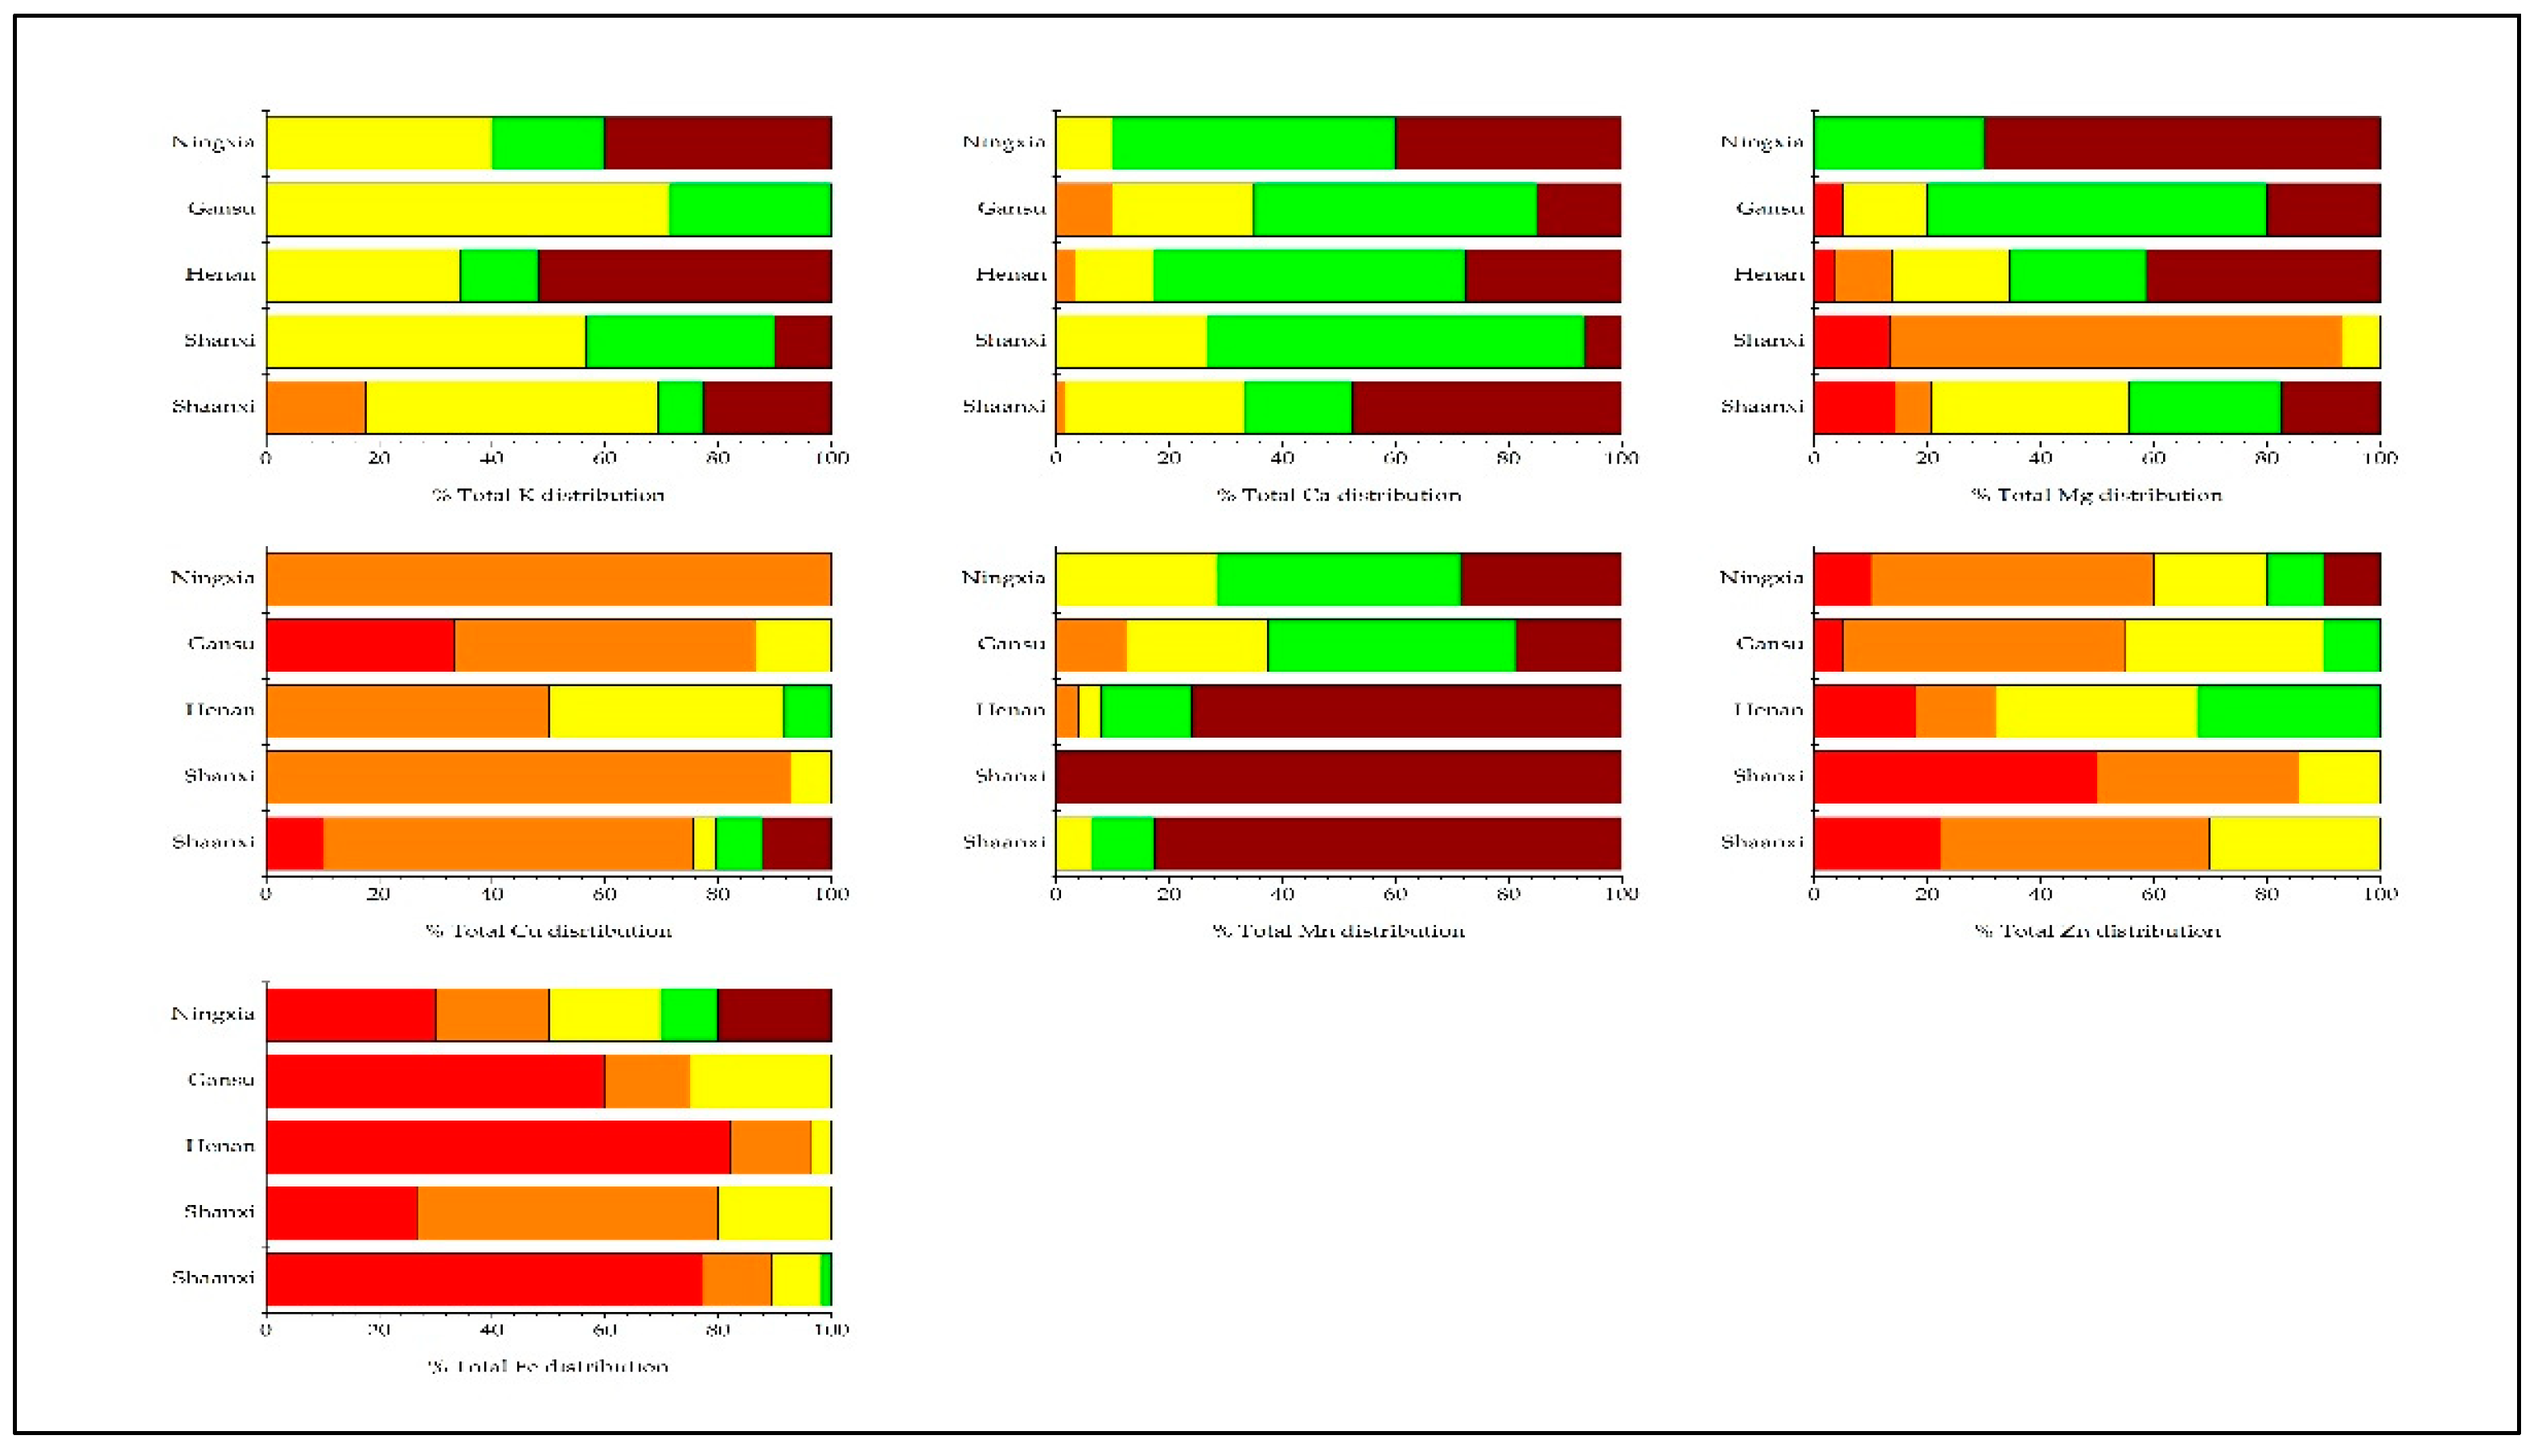
Figure 3.
Pearson correlations between soil nutrients and leaf nutrients of the main apple production in the Loess Plateau: (a) 0–20 cm soil depth; (b) 20–40 cm soil depth. E. indicates the Exchangeable, A. indicates the available soil nutrient, and T. indicates the total leaf nutrient. The hollow dark rectangles indicate significant correlations between the same element for soil and leaf. The red and blue colors of the circles indicate the negative and positive signs of the correlations, respectively. Significant (p < 0.05), highly significant (p < 0.01) and extremely significant (p < 0.001).
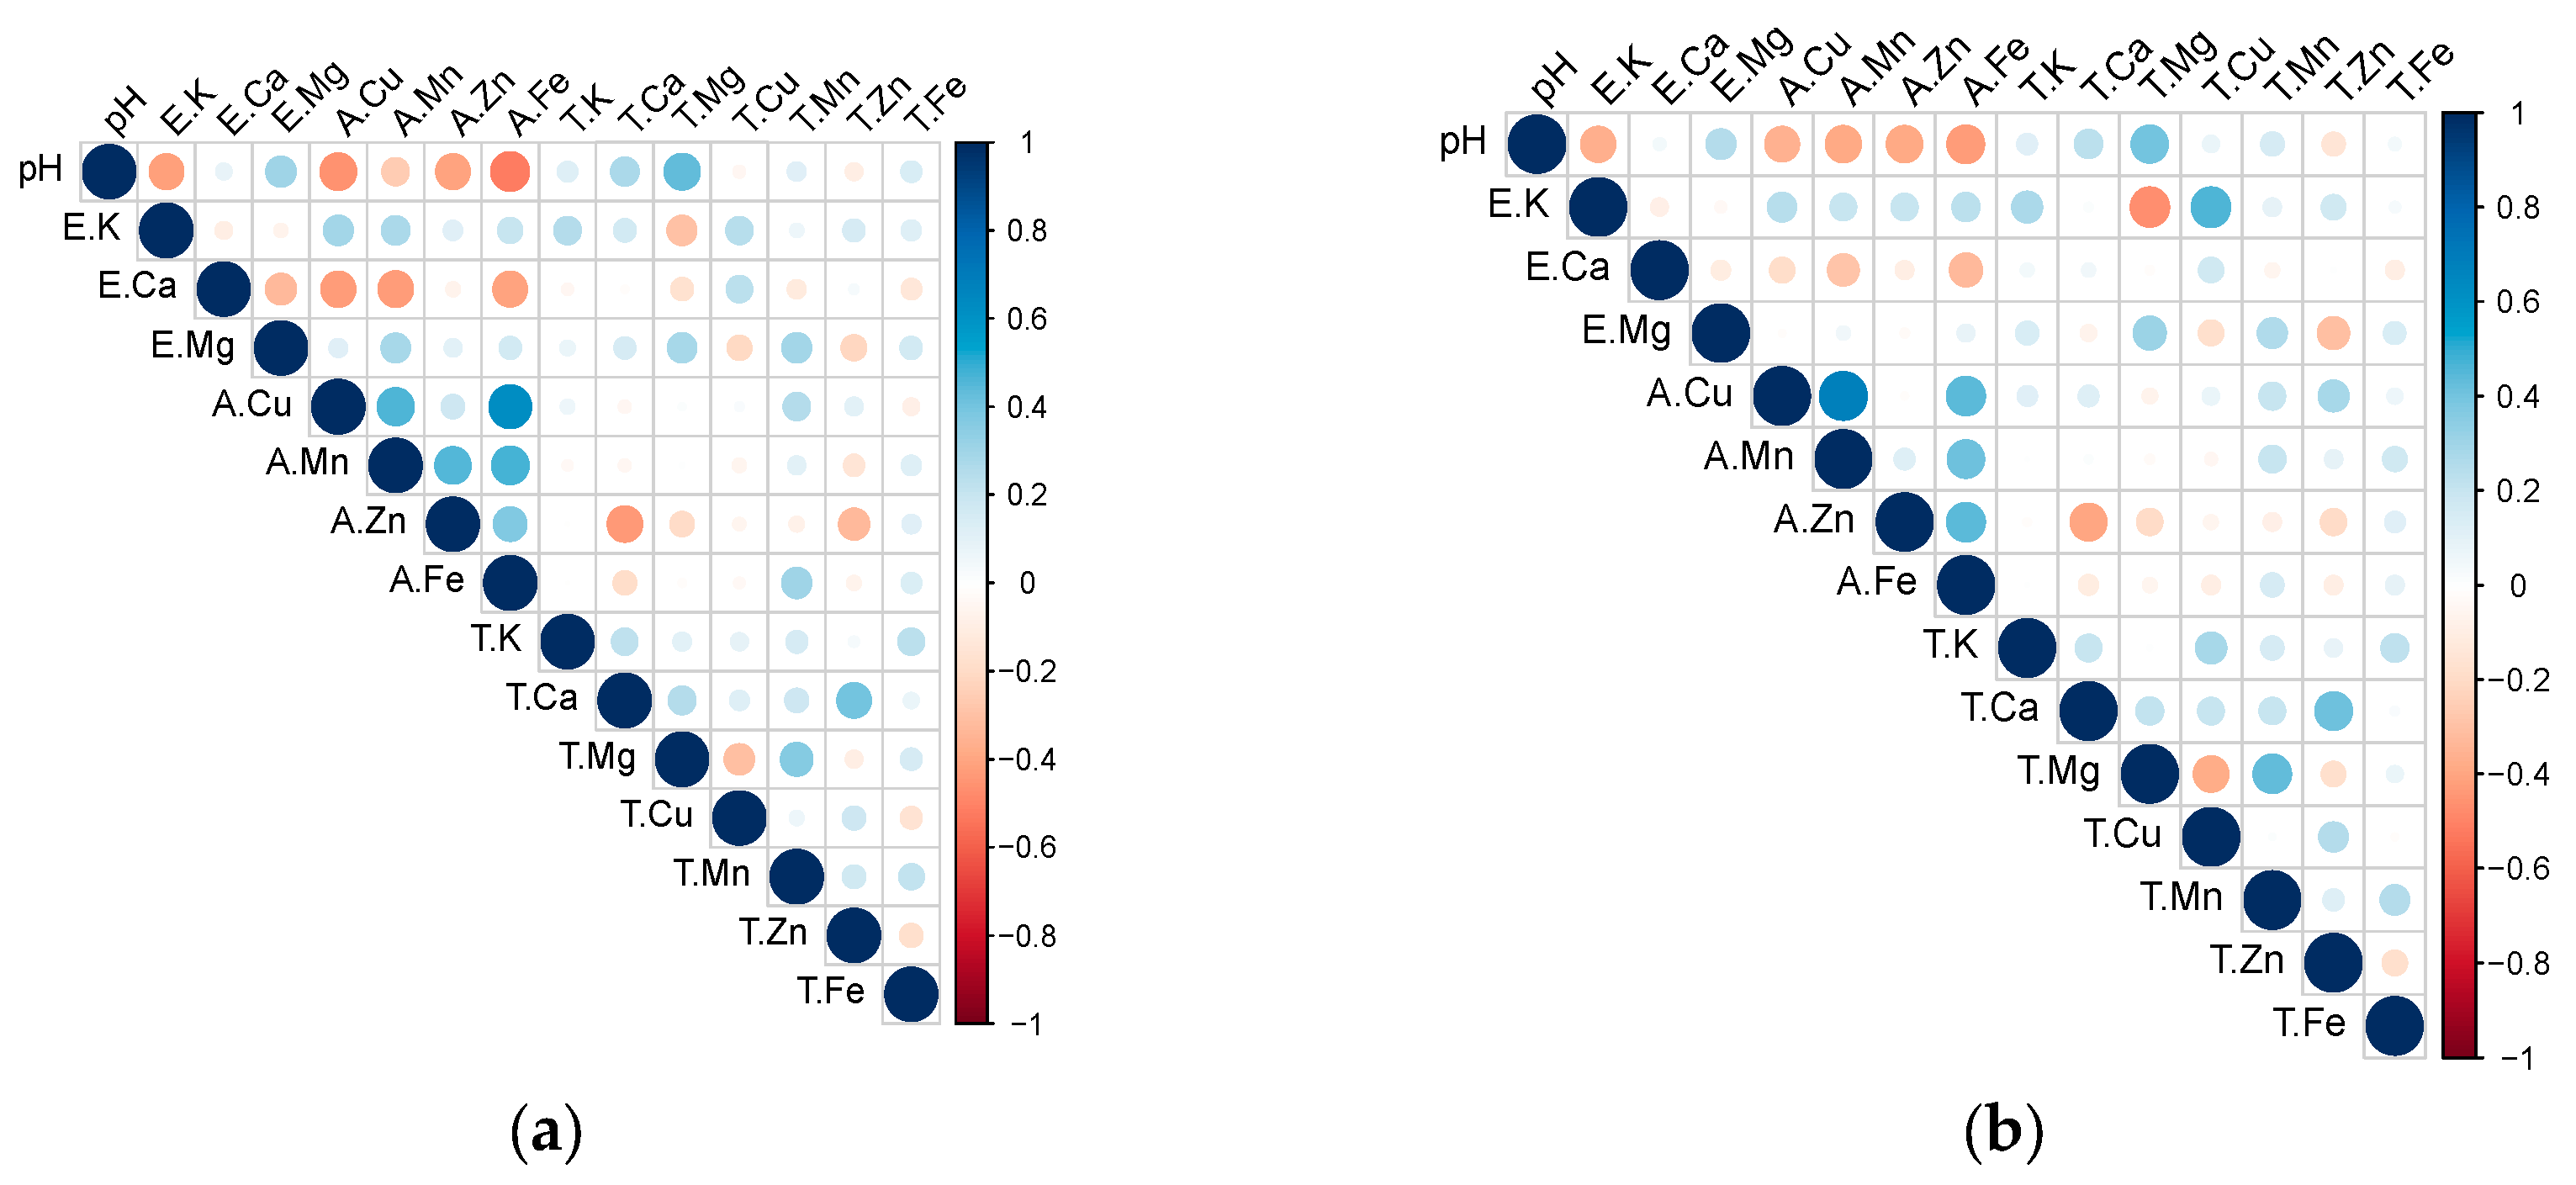

Table 1.
Geographical location of the sampling in the Loess Plateau apple production of China.
| Province | Latitude (N) | Longitude (E) |
|---|---|---|
| Shaanxi | 35°21′~37°71′ | 109°40′~110°30′ |
| Shanxi | 34°52′~36°13′ | 111°09′~110°73′ |
| Henan | 34°41′~34°36′ | 110°94′~116°36′ |
| Gansu | 35°54′~34°56′ | 105°73′~115°95′ |
| Ningxia | 37°49′~38°65′ | 105°84′~116°14′ |
Table 2.
Soil nutrient status of five provinces of the main apple production in the Loess Plateau.
| Soil property | Mean | Deficiency Frequency (%) |
Low Frequency (%) |
Medium Frequency (%) |
High Frequency (%) |
Excess Frequency (%) |
|---|---|---|---|---|---|---|
| Soil pH | 8.56 | - | - | - | - | - |
| Exchangeable K (mg kg—1) | 269.36 | 27.7 | 27.4 | 8.5 | 7.4 | 29.1 |
| Exchangeable Ca (g kg—1) | 5.14 | - | - | 100 | - | - |
| Exchangeable Mg (g kg—1) | 0.20 | - | 19.3 | 38.9 | 15.7 | 26.1 |
| Available Cu (mg kg—1) | 1.11 | 3.3 | 9.9 | 45.4 | 33.5 | 7.9 |
| Available Mn (mg kg—1) | 4.46 | - | 63.8 | 36.2 | - | - |
| Available Zn (mg kg—1) | 0.94 | 34.4 | 20.1 | 31.3 | 9.1 | 5.1 |
| Available Fe (mg kg—1) | 5.94 | 5.4 | 32.2 | 52.0 | 8.8 | 1.6 |
Frequency (%) based on the standard classification of apple soil nutrients in The Loess Plateau.
Table 3.
The comparison of five provinces in soil nutrient of the main apple production in the Loess Plateau.
Table 3.
The comparison of five provinces in soil nutrient of the main apple production in the Loess Plateau.
| Soil property | Soil depth (cm) |
Province | Mean | Sample range | CV (%) | ||||
|---|---|---|---|---|---|---|---|---|---|
| Shaanxi | Shanxi | Henan | Gansu | Ningxia | |||||
| Soil pH | 0-20 | 8.67 ± 0.31b | 8.28 ± 0.29c | 8.27 ± 0.33c | 8.64 ± 0.27b | 9.01 ± 0.29a | 8.55 | 7.14–9.33 | 3.57 |
| 20-40 | 8.67 ± 0.25b | 8.25 ± 0.29d | 8.50 ± 0.21c | 8.62 ± 0.27bc | 8.92 ± 0.35a | 8.57 | 7.27–9.31 | 3.04 | |
| Exchangeable K (mg kg—1) | 0-20 | 258.25 ± 126.22c | 404.12 ± 141.63a | 326.47 ± 173.92b | 304.40 ± 123.83bc | 147.74 ± 69.15d | 294.78 | 71.13–677.70 | 46.54 |
| 20-40 | 185.65 ± 134.04cd | 390.70 ± 171.00a | 292.87 ± 157.02b | 237.61 ± 101.60bc | 111.97 ± 51.12d | 243.93 | 48.29–697.80 | 56.34 | |
| Exchangeable Ca (g kg—1) | 0-20 | 5.75 ± 0.44a | 4.69 ± 0.39b | 4.23 ± 0.60c | 5.70 ± 0.29a | 4.50 ± 0.29bc | 5.15 | 3.12–6.41 | 8.64 |
| 20-40 | 5.66 ± 0.41a | 4.65 ± 0.26b | 4.29 ± 0.57c | 5.72 ± 0.32a | 4.54 ± 0.62bc | 5.12 | 3.24–6.65 | 8.35 | |
| Exchangeable Mg (g kg—1) | 0-20 | 0.16 ± 0.10c | 0.22 ± 0.08a | 0.24 ± 0.08a | 0.20 ± 0.15ab | 0.26 ± 0.07a | 0.20 | 0.08–0.55 | 42.53 |
| 20-40 | 0.16 ± 0.07b | 0.21 ± 0.07a | 0.23 ± 0.07a | 0.23± 0.11a | 0.26 ± 0.07a | 0.20 | 0.09–0.44 | 39.28 | |
| Available Cu (mg kg—1) | 0-20 | 0.87 ± 0.47bc | 1.11 ± 0.59b | 1.90 ± 1.46 a | 0.92 ± 0.34bc | 0.57 ± 0.24c | 1.07 | 0.20–6.54 | 67.96 |
| 20-40 | 1.12 ± 0.85b | 1.08 ± 0.52b | 1.65 ± 1.59a | 0.88 ± 0.21bc | 0.54 ± 0.37c | 1.14 | 0.15–8.37 | 63.23 | |
| Available Mn (mg kg—1) | 0-20 | 3.30 ± 1.40c | 5.04 ± 1.04b | 5.10 ± 1.31b | 6.14 ± 1.83a | 5.29 ± 1.36ab | 4.49 | 1.43–11.36 | 30.77 |
| 20-40 | 3.53 ± 1.27b | 5.24 ± 1.49a | 4.76 ± 1.28a | 5.20 ± 1.73a | 4.87 ± 1.24a | 4.43 | 1.63–9.49 | 31.34 | |
| Available Zn (mg kg—1) | 0-20 | 0.43 ± 0.40d | 1.22 ± 0.73b | 1.80 ± 0.89a | 0.71 ± 0.29cd | 1.07 ± 0.66bc | 0.89 | 0.11–3.30 | 66.12 |
| 20-40 | 0.76 ± 0.47b | 1.37 ± 0.57a | 1.44 ± 1.07a | 0.65 ± 0.44b | 1.04 ± 0.40ab | 0.99 | 0.13–3.67 | 62.90 | |
| Available Fe (mg kg—1) | 0-20 | 4.46 ± 1.37d | 7.20 ± 2.98b | 8.65 ± 3.36a | 6.06 ± 1.56bc | 4.63 ± 1.91cd | 5.99 | 2.08–16.58 | 37.86 |
| 20-40 | 5.07 ± 1.42 c | 6.43 ± 2.01b | 7.37 ± 1.99a | 5.51 ± 1.55bc | 5.50 ± 2.37bc | 5.88 | 2.29–12.98 | 29.82 | |
±, SDs. Different letters indicate significant differences between five provinces for each given parameter at (p < 0.05); CV, Coefficient of variation.
Table 4.
The standard classification of apple soil nutrients in The Loess Plateau, China.
| Soil properties | Deficiency | Low | Medium | High | Excessive |
|---|---|---|---|---|---|
| Exchangeable K (mg kg—1) | <150 | 150–250 | 250–300 | 300–350 | >350 |
| Exchangeable Ca (g kg—1) | <2 | 2–3 | 3–7 | 7–10 | >10 |
| Exchangeable Mg (g kg—1) | <0.06 | 0.06–0.12 | 0.12–0.18 | 0.18–0.24 | >0.24 |
| Available Cu (mg kg—1) | <0.30 | 0.30–0.50 | 0.50–1.00 | 1.00–2.00 | >2.00 |
| Available Mn (mg kg—1) | <1.00 | 1.00–5.00 | 5.00–5.00 | 15.00–30.00 | >30.00 |
| Available Zn (mg kg—1) | <0.50 | 0.50–0.80 | 0.80–1.80 | 1.80–2.50 | >2.50 |
| Available Fe (mg kg—1) | <3.00 | 3.00–5.00 | 5.00–9.00 | 9.00–13.00 | >13.00 |
Based on soil nutrients classification of apple standards from Zhang et al. [37].
Table 5.
Leaf nutrient status of five provinces of the main apple production in the Loess Plateau.
| Leaf nutrient | Mean | Deficiency Frequency (%) |
Low Frequency (%) |
Medium Frequency (%) |
High Frequency (%) |
Excessive Frequency (%) |
|---|---|---|---|---|---|---|
| Total K (g kg—1) | 19.76 | - | 11.0 | 46.3 | 10.3 | 32.4 |
| Total Ca (g kg—1) | 24.43 | - | 2.9 | 24.8 | 38.7 | 33.6 |
| Total Mg (g kg—1) | 3.64 | 9.5 | 13.9 | 23.4 | 28.5 | 24.8 |
| Total Cu (mg kg—1) | 24.90 | 10.3 | 68.0 | 10.3 | 5.2 | 6.2 |
| Total Mn (mg kg—1) | 119.37 | - | 2.4 | 8.7 | 16.7 | 72.2 |
| Total Zn (mg kg—1) | 23.35 | 20.7 | 40.0 | 29.6 | 8.9 | 0.7 |
| Total Fe (mg kg—1) | 87.46 | 66.2 | 18.5 | 12.3 | 1.5 | 1.5 |
Frequency (%), based on the standard classification of apple leaf nutrients in The Loess Plateau.
Table 6.
Leaf nutrient status of five provinces of the main apple production in the Loess Plateau, China.
Table 6.
Leaf nutrient status of five provinces of the main apple production in the Loess Plateau, China.
| Leaf nutrients | Province | Mean | Sample rang | CV (%) | ||||
|---|---|---|---|---|---|---|---|---|
| Shaanxi | Shanxi | Henan | Gansu | Ningxia | ||||
| Total K (g kg—1) | 18.70 ± 5.66b | 17.70 ± 3.03b | 21.55 ± 4.23a | 20.53 ± 6.32ab | 22.73 ± 6.15a | 19.76 | 8.51–33.69 | 26.83 |
| Total Ca (g kg—1) | 26.17 ± 7.66a | 22.33 ± 3.31b | 23.36 ± 3.91b | 21.74 ± 6.11b | 25.13 ± 3.83ab | 24.43 | 10.12–39.73 | 25.36 |
| Total Mg (g kg—1) | 3.39 ± 1.51c | 1.81 ± 0.34d | 4.25 ± 1.50b | 4.10 ± 1.03b | 5.28 ± 0.93a | 3.64 | 0.43–7.26 | 36.53 |
| Total Cu (mg kg—1) | 32.13 ± 40.03a | 17.32 ± 4.82a | 22.34 ± 12.86a | 16.01 ± 11.41a | 12.85 ± 3.08a | 24.9 | 7.56–145.82 | 119.12 |
| Total Mn (mg kg—1) | 130.01 ± 33.64a | 126.83 ± 14.79a | 121.78 ± 31.88a | 80.42 ± 19.08b | 88.08 ± 21.06b | 119.37 | 43.66–202.55 | 24.77 |
| Total Zn (mg kg—1) | 19.78 ± 6.27cd | 16.10 ± 5.23d | 32.56 ± 15.81a | 24.24 ± 10.74bc | 28.40 ± 20.86ab | 23.35 | 8.65–79.19 | 46.99 |
| Total Fe (mg kg—1) | 79.54 ± 31.13c | 103.68 ± 22.24b | 71.82 ± 25.15c | 99.22 ± 25.22b | 128.55 ±40.27a | 87.46 | 20.03–187.38 | 33.13 |
±, SDs. Different letters indicate significant differences between five provinces for each given parameter at (p < 0.05); CV, Coefficient of variation.
Table 7.
The standard classification of apple leaf nutrients in The Loess Plateau, China.
| Leaf nutrient | Deficiency | Low | Medium | High | Excessive |
|---|---|---|---|---|---|
| Total K (g kg—1) | <8.0 | 8.0–14.0 | 14.0–20.00 | 20.0–22.0 | >22.0 |
| Total Ca (g kg—1) | <7.5 | 7.5–0.0 | 10.0–20.00 | 20.0–26.0 | >26.0 |
| Total Mg (g kg—1) | <1.5 | 1.5–2.2 | 2.2–3.5 | 3.5–4.8 | >4.8 |
| Total Cu (mg kg—1) | <10 | 11–19 | 19–50 | 50–100 | >100 |
| Total Mn (mg kg—1) | <40 | 40–50 | 50–80 | 80–00 | >100 |
| Total Zn (mg kg—1) | <15 | 15–23 | 23–45 | 45–75 | >75 |
| Total Fe (mg kg—1) | <100 | 100–119 | 119–150 | 150–180 | >180 |
Disclaimer/Publisher’s Note: The statements, opinions and data contained in all publications are solely those of the individual author(s) and contributor(s) and not of MDPI and/or the editor(s). MDPI and/or the editor(s) disclaim responsibility for any injury to people or property resulting from any ideas, methods, instructions or products referred to in the content. |
© 2023 by the authors. Licensee MDPI, Basel, Switzerland. This article is an open access article distributed under the terms and conditions of the Creative Commons Attribution (CC BY) license (http://creativecommons.org/licenses/by/4.0/).
Copyright: This open access article is published under a Creative Commons CC BY 4.0 license, which permit the free download, distribution, and reuse, provided that the author and preprint are cited in any reuse.


