
Submitted:
06 December 2023
Posted:
07 December 2023
You are already at the latest version
Abstract
The textile industry produces high volumes of colored effluents that require multiple treatments to remove non-adsorbed dyes which could be recalcitrant due to their complex chemical structure. Most of the studies have dealt with the biodegradation of mono or diazo dyes but rarely with poly-azo dyes. Therefore, the aim of this paper was to study the biodegradation of a four azo-bond dye (Sirius grey) and to optimize its decolorization conditions. Laccase-containing cell free supernatant from the culture of a newly isolated fungal strain, Coriolopsis gallica strain BS9, was used in the presence of 1-hydroxybenzotriazol (HBT) to optimize the dye decolorization conditions. A Box-Benken design with 4 factors namely: pH, enzyme concentration, HBT concentration and dye concentration, was performed to determine optimal conditions for the decolorization of Sirius grey. The optimal conditions were pH 5, 1 U/mL of laccase, 1 mM of HBT, and 50 mg/L of initial dye concentration ensuring a decolorization yield and rate of 87.56 % and 2.95 %/min respectively. Decolorized dye solution showed a decrease of its phytotoxicity (Germination index GI = 80 %) compared to the non-treated solution (GI = 29 %).
This study suggests that laccase-mediator system could be a promising alternative for dyes removal from textile wastewaters.
Keywords:
laccase
; Sirius-grey
; azo dyes
; 1-hydroxybenzotriazole
; decolorization
; mediator
1. Introduction
Dyeing clothes is a prehistoric process. This process involved the application of early natural dyes for furs and textiles of vegetable origin, though some dyes were of animal origin. More complex coloring materials were developed over thousands of years. The woad (natural indigo) for example was obtained from the plant Indigofera tinctoria, and the Tyrian purple was extracted from the gland of a purple snail and developed by the Phoenicians, whereas the Alizarine was taken out from madder Campeachi wood [1]. By the end of the 19th and early 20th centuries the synthetic dyes industry was established in many countries and thousands of dye molecules have been synthesized and produced at a large scale [2].
Despite the chemical diversity of dyes, dye molecules share a common chemical structure. In fact, each dye molecule has four components namely a chromophore group, an auxochrome group, a solubilizing group, and a matrix. The chromophore groups are responsible for the absorption of the light energy and the creation of the dye's color through the excitation of electrons. The auxochrome groups help with the dye fixation into the support, while, the solubilizing ones ensure the solubility of the molecule in water or organic solvents. The remaining parts of the dye molecule form the matrix or the skeleton [1].
Dyes are classified according to several parameters including: color, chemical structure, application, manufacturer, synthesis route, fastness, and date invented. However, based on their chemical structure and the chromophore groups, the following dye families were identified: azo, anthraquinone, nitroso, nitro, indigoid, cyanine, phthalocyanine, and triphenylmethane [3].
Azo dyes are characterized by two aromatic groups linked to each other by an azo bond (-N=N-). They are classified based on the number of azo linkages mono azo dyes, diazo dyes, etc. the number of azo groups varies from 1 to 4. Other than textile industries, this family of dyes is used in various fields such as pharmaceuticals, cosmetics, food, paint, paperwork, etc. Their success is mostly due to the stability of coloring, the ease of a coupling reaction between the dyes and the support, the high molar extinction coefficient (capacity to absorb light), the flexibility of the coloring structure, and their adaptability to a variety of applications [4,5,6].
Approximately 70% of the dyes, used in the textile industry, are of the azo type. However, during the coloring process, non-adsorbed dyes are estimated between 15 and 20% and are discharged into the wastewater [7,8,9]. Due to their toxicities, industries using this type of dyes are currently attempting to minimize their negative impact on the environment. This includes improving their binding to the matrix or their degradation once discharged into industrial wastewater, using biological or physicochemical processes.
Many studies have demonstrated that the released sewage contains, other than dyes, toxic molecules like heavy metals. Once released in the environment, the wastewater may affect both the human health and ecosystem [10,11,12,13]. Many health issues including cancer, chronic diseases, and skin irritation have been associated with exposure to azo dyes [10]. Besides, the death of aquatic organisms and the stunting of plant growth were mentioned as a consequence of the release of untreated textile wastewater [14]. To treat sewage from the textile industry, many attempts have been made and many physicochemical methods were developed (e.g., filtration, adsorption, coagulation/flocculation). Those treatments were mostly used at the outset. Nevertheless, their unwanted outcomes like the formation of secondary mud, the limited efficacy, and the high cost, has prompted industries to look for alternative biological methods that are especially eco-friendly and low-cost and where plants or microorganisms and/or their enzymes can be used [15]. Yeast [16], bacteria [15,17,18,19], algae [20], and fungi [21] have widely been used for this purpose. Several studies demonstrated the efficiency of white-rot fungi such as Trametes versicolor [22], T. trogii [23,24], and C. gallica [7,25], and other fungi like Aspergillus niger [26] in the removal of textile dyes using their enzymes or biomasses.
White-rot fungi secrete a number of oxidoreductases that are involved in lignin depolymerization [27,28]. These oxidoreductases encompass heme-containing peroxidases (manganese, lignin, and versatile peroxidases) and copper-dependent polyphenol oxidases named laccases (E.C. 1.10.3.2). Laccases from white-rot fungi exhibit a higher redox potential (0.720-0.790 V) compared to other fungal, bacterial, or plant laccases (0.400-0.700 V). High redox potential laccases do not oxidize lignin directly but through small aromatic compounds (laccase-mediators) that can attack lignin after their oxidation in the active site [29,30,31]. Although laccases are widely used, their efficiency in removing pollutants is sometimes limited; this has prompted the use of a laccase-mediator system to enhance the laccase activity. Mediators allowed the active center of the enzyme to interact with large molecules of substrates or substrates with a high redox potential. Several laccase mediators have been studied including mediators of natural molecules (e.g., 3-hydroxy-anthranilic acid, syringaldehyde, vanillin etc.) or synthetic molecules such as HBT, TEMPO, Violoric acid etc.) [32].
In this paper, we aim to study the biodegradation of the four azo-bond dye Sirius grey by the laccase mediator system and to optimize its decolorization conditions using a response surface methodology approach.
2. Materials and Methods
2.1. Chemicals
2.2. Media and culture conditions
Potato-Dextrose-Agar (PDA) medium was used for a short-term conservation of the fungal strain. After growth at 30 °C, plates were stored at 4 °C, and sub-cultured monthly. Laccase production by C. gallica was performed in liquid medium as described by Zouari-Mechichi et al. [24]. Media were inoculated by glass-beads homogenized mycelium (1%) and laccase production was induced by CuSO4 at a final concentration of 300 μM. Cultures were incubated at 30 °C and 160 rpm, and when maximum laccase production was reached (8–10 days), laccase-rich supernatant was separated from biomass by filtration on 3 M filter paper and stored at -20 °C until utilization.
2.3. Fungal strain isolation and identification
2.3.1. Isolation
The fungus used in this study was the newly isolated strain BS9. To isolate this strain, a piece of fungal crust growing on a decayed Eucalyptus (Eucalyptus globulus Labill.) wood was inoculated on a PDA medium and incubated at 28 °C, the growing mycelium was transferred several times on the same solid medium until a pure culture was obtained. The culture was tested for laccase activity production on a PDA medium supplemented with 0.01% of guaiacol. When oxidized the non-colored substrate turns orange, indicating the production of a phenol oxidase activity.
2.3.2. Fungal DNA extraction, amplification and sequencing
Total genomic DNA was extracted from fungal culture using DNA extraction kit EM13 (Blirt S.A., Gdańsk, Poland) according to the manufacturer's instructions. The internal transcribed spacer (ITS) was selected as markers for molecular identification purposes. ITS is widely considered as a universal fungal barcode of first choice [33]. The following primers pair was used: ITS1F (5'-CTT GGT CAT TTA GAG GAA GTA A-3') and ITS4R (5'-TCC TCC GCT TAT TGA TAT GC-3') for ITS amplification [34]. PCR mix consisted of: 10 µL of 2x TaqNova-RED PCR Master Mix (Blirt S.A., Gdańsk, Poland), 4 µL of water, 1.5 µL of each forward and reverse primers in 10 µM concentration, and 3 µL of template DNA for a final reaction volume of 20 µL. Presence of the expected product was checked on 1% agarose gel with Midori Green (Nippon Genetics Europe, Düren, Germany) PCR products were cleaned using DNA purification kit EM26 (Blirt S.A., Gdańsk, Poland) and bidirectionally sequenced using BigDye™ Terminator v3.1 Cycle Sequencing Kit (Thermofisher Scientific, Waltham, MA, USA). The product was cleaned using Zetadex-50 Fine (EMP BIOTECH GMBH, Berlin, Germany) and sent to the external company Genomed (Warsaw, Poland) for reading. The obtained sequences were deposited in the GenBank database under the accession number: OR234862.
2.3.3. Phylogenetic analysis
The obtained reads were assembled using the CAP3 algorithm implemented in UGENE v.37.0 [35]. Resulting consensus sequences were compared with the NCBI nucleotide database using BLASTn algorithm for preliminary taxonomic placement. Additional 9 reference sequences were retrieved from GenBank to prepare a phylogenetic tree (Table 2). All sequences were aligned using the muscle algorithm as implemented in the SeaView program [36]. Subsequently, the alignments were trimmed in the trimAl program using the automated algorithm [37]. The phylogenetic tree was calculated using the maximum likelihood approach in RAxML software [38] using the GTR+G+I substitution model. The tree robustness was assessed by bootstrap analyses with 1000 replicates. The isolate was assigned to species based on its position on the phylogenetic tree.
2.4. Enzyme assay
Laccase assay was performed with 10 mM 2,6-dimethoxyphenol (DMP) as substrate in 100 mM tartrate buffer, pH 5 (ε469 nm = 27,500 M−1 cm−1) [39]. One unit of laccase activity was defined as the amount of enzyme oxidizing 1μmol of substrate per minute.
2.5. Dye decolorization experiments
All experiments were performed in 2 mL disposable cuvettes containing 1.5 mL final reaction volume. The reaction mixture contained 100 mM tartrate buffer pH 3 to 6, HBT, 50 mg/L of dye, and culture filtrate (0.5 U/mL laccase). The reaction was initiated by the addition of culture filtrate. The decolorization was followed by measuring the absorbance of the dye solution at the maximum wavelength as indicated in Table 1. All experiments were performed in triplicates; controls did not contain laccase. The incubation was carried out for all experiments at 30 °C for 4 hours. pH of the tartrate buffer, dye concentration, HBT concentration, and enzyme concentration were the independent variables parameters that were optimized in this study. The decolorization was calculated as (Equation (1)):
where Absorbance t0 is the absorbance of the reaction mixture at the maximum wavelength of the dye before incubation with the enzyme and Absorbance tf is the absorbance of the reaction mixture after incubation 1.5 mL reaction mixture in 100 mM tartrate buffer. The decolorization rate was determined as followed (Equation (2)):
2.6. Box–Behnken design
As mentioned before, the Sirius grey decolorization yield in percentage (designated as y1), and its decolorization rate in percentage of color removal per minute (designated y2) were considered as the experimental studied responses (Equation (1) and (2), respectively).
The aim of this study was the determination of the diverse influences of the four reaction studied factors namely: HBT concentration (mM), pH, initial dye concentration (mg/L), and initial enzyme concentration (U/mL), on the studied responses: Decolorization yield (%) and rate (%/min). Table 3 presents the values of coded and uncoded levels used in this work.
Since each response can be influenced by one or more factors, the multivariate study using the Response Surface Methodology (RSM), with Box–Behnken design, can be beneficial. In fact, the use of this methodology provides the possibility to determine the best polynomial multivariable model involving the coefficients calculation and statistical tests on one hand, and the accurate identification of the optimum responses and the carrying out of the relative conditions on the other hand.
27 tested runs, repeated in triplicates, were analyzed via the Box–Behnken design and presented in Table 4 experimental responses values as function of experimental conditions.
The adopted model in this case had the following form with four studied factors (Equation (3)):

where ŷk are the modeled studied responses: decolorization yield of Sirius grey after 4 hours in % (k = 1), and decolorization rate in % of color removal/min (k = 2); β0, βi, βii and βij are the model’s intercepts, linear, quadratic and interactions coefficients, respectively; xi is the coded level of variable factors, n is the number of factors (n = 4)
2.7. Design of experiments and statistical analysis
The experimental Design, the model’s coefficients determinations, statistical analysis of the model quality and of the different factors’ influences, figures drawings, and the optimization protocol were carried out within Minitab® 19.2020.1 Statistical Software (64-bit) (© 2020 Minitab, LLC All rights reserved). The models’ coefficients were determined using the least-squares method. Analysis of variance (ANOVA) was used to identify the level of significance of the studied model and the tested factors and their interactions with a confidence level at 95% (p < 0.05). The coefficient of determination (R2), the adjusted coefficient of determination (R2adj), and root mean square error (RMSE) were chosen to quantify the model fitting quality.
2.8. Phytotoxicity assay
A phytotoxicity assay of the treated and untreated dye solutions was carried out using radish seeds (Raphanus sativus). A Whatman filter paper was initially soaked with 2 mL of sterile distilled water then 5 mL of treated and untreated dye solution were poured. Ten seeds were distributed on the paper and the Petri dishes were incubated in the dark at 22 °C for 7 days. Germination index (GI) was calculated according to Equation (4):
3. Results
3.1. Fungi isolation and identification
A pure culture, designated strain BS9, was obtained after growth of mycelia from fungal crust collected on decayed wood. The internal transcribed spacer (ITS) regions of fungal rDNA have been successfully used for species identification (Figure 2). Blast analysis showed that strain BS9 shares more than 99% similarity of the whole ITS region with C. gallica CBS 547.50 and several other C. gallica strains represented in GenBank. Based on this and on the morphological characteristics of the collected fungi, strain BS9 was assigned to the species C. gallica.
3.2. Laccase-like enzymes detection and production
Strain BS9 was tested first for its capacity to produce laccase-like enzymes on PDA medium in the presence of 5 mM 2,6-dimethxyphenol as laccase substrate. After fungal growth, the non-colored PDA medium turned orange around the mycelium, indicating the presence of 2,6-DMP oxidizing enzymes. For laccase like enzymes production, strain BS9 was cultivated in M7 medium. Enzyme production was induced by 300 µM of CuSO4 on the 3rd day of cultivation. Laccase production increased from day 5 (500 U/L) to reach its maximum on day 10 with 3767 U/L.
3.3. Dye decolorization by crude laccase from C. gallica
The capacity of the crude laccase from strain BS9 to decolorize the dye Sirius grey (50 mg/L) was first tested under non optimized conditions in the presence and the absence of laccase mediator (1-hydroxybenzotriazole). Results showed that the laccase could decolorize the dye Sirius grey to a lower extent (48%) without HBT, but when 1 mM of HBT was added to the reaction mixture, the decolorization increased up to 81% in 4 hours.
3.4. Optimization of dye decolorization conditions
To increase the efficiency of the process and decrease its cost, the dye decolorization conditions were optimized using a response surface methodology approach. Four essential parameters that are known to influence substrate oxidation by laccase were tested to optimize this process. These parameters were: pH, dye concentration, HBT concentration and enzyme concentration. Two responses were recorded: dye decolorization yield and rate. The obtained experimental results of decolorization yields and rates ranged between 40.14 ± 2.03% (Run 22) – 87.02 ± 1.33% (Run 18), and 1.29 ± 0.06%/min (Run 6)– 3.63 ± 0.12%/min (Run 23), respectively (Table 4). In fact, among 27 conditions, we have 20 presenting a yield higher than 55% of decolorization. Moreover, the decolorization rates ranging between 1.29 ± 0.06%/min – 3.63 ± 0.12%/min are very interesting to study the rapidity of the process, i.e., the kinetics of the decolorization. Those results can reveal the adequacy of the selected levels range for all factors (called also independent variables) in the beginning of this study. In addition, it is clear that all results of decolorization yields and rates are repetitive since their standard deviation is very low (0.04 – 2.81% and 0.01–0.24%/min, respectively). This proves that the process of the enzymatic decolorization of Sirius grey can be considered stable and without technical problems such as feasibility.
3.5. Modeling dye decolorization yield
Equation (5) presents the model coefficients relative to the decolorization yield of Sirius grey ():
where , , , are the coded levels (see Table 3) of initial HBT concentration, pH, initial dye concentration, and initial enzyme concentration.
Table 5 presents the ANOVA results of Sirius grey decolorization yield (Equation (5)) and of each factor and interaction. It is clear that the regression using the determined model presents a high degree of significance since p < 0.001 (see first row of Table 5). This is confirmed by the high values of R2 = 91.63% and R2Adj = 89.86%, and by the low value of RMSE = 4.29% (in terms of percentage of decolorization yield).
In addition, the coefficients in Equation (5) indicated a highly significant influences of the selected factors on the Sirius grey decolorization, as confirmed by the importance of their values (in decreasing order – see Equation (5) and Table 5): (1) initial HBT concentration in linear (Coefficient = 8.84 ; p < 0.001) and in quadratic (Coefficient = -3.52; p = 0.002<0.05) term; (2) initial enzyme concentration in linear (Coefficient = 7.14; p < 0.001) and in quadratic (Coefficient = -4.84; p < 0.001) term; (3) initial dye concentration only in linear term (Coefficient = -5.78; p < 0.001); and pH in linear (Coefficient = 2.44 ; p = 0.001<0.05) and in quadratic (Coefficient = -19.69; p < 0.001) term. Moreover, three interactions among six present a very significant effect on the studied decolorization yield. All these significant interactions involved the pH of the reaction mixture. Interaction were as follows: initial HBT concentration × pH (p = 0.012 < 0.05); pH × initial dye concentration (p = 0.009 < 0.05); pH × initial enzyme concentration (p = 0.036 < 0.05).
The statistical analyses presented in Table 5 were confirmed graphically using Pareto chart (Figure 3).
3D response surface diagrams (Figure 4), shows that operating at relatively high HBT concentrations, regardless of the other influencing factors, increased the decolorization yield. The interaction between HBT and pH (Figure 4a) shows that the maximum decolorization yield (80%) was reached for 1 mM of HBT and for a pH range between 4 and 5. In addition, increasing the HBT from 0.2 to 1 mM enhanced the yield of decolorization regardless of the dye concentration (Figure 4b). This was also the case for the HBT concentration and Enzyme concentration where the responses become higher when both HBT concentration and Enzyme concentration were increased from 0.2 to 1 mM and from 0.2 to 1 U/mL, respectively (Figure 4c).
The effect of pH combined with Dye concentration was shown in Figure 4d. The maximum of decolorization yield was obtained for a pH range between 4 and 5 and for the lowest Dye concentration value. The same parabolic behavior was obtained while combining the effect of pH and Enzyme concentration where 80% of the decolorization yield was reached for the same range of pH and for the highest Enzyme concentration (1 U/mL) (Figure 4e). Increasing the enzyme concentration from 0.2 to 1 U/mL while minimizing the concentration of Dye from 150 to 50 mg/L had a positive effect on the response as shown in Figure 4f. All the above behaviors are already described with the corresponding coefficients in the determined model (see Equation (5)).
3.6. Modeling dye decolorization rate
Equation (6) presents the model coefficients relative to the Sirius grey decolorization rate ():
where , , , are the coded levels of initial HBT concentration, pH, initial dye concentration, and initial enzyme concentration.
ANOVA results corresponding to the integrality-determined model of Sirius grey decolorization rate (Equation (6)) and to each factor as well as factor interactions are presented in Table 6. The value of p < 0.001 confirms that the corresponding regression has an interesting degree of significance. The high values of R2 = 92.48% and R2Adj = 90.88%, and the low value of RMSE = 0.173%/min confirm the regression/model quality.
ANOVA test analysis (Table 6) and Pareto chart (Figure 5) already show the significant influence of the tested factors on the decolorization rate (in linear and quadratic terms). In fact, all factors influence linearly the decolorization rate of Sirius grey (p < 0.001). Only the quadratic influence of pH (Coeff. = 0.37; p < 0.001) and Enzyme concentration (Coeff. = 0.12; p <0.001) are considered significant on the Sirius grey decolorization rate. Moreover, only the interaction between pH and Enzyme concentration is significant (p < 0.001). This was confirmed by Pareto Chart analysis (Figure 5).
Figure 6 presents the 3D-surfaces response of Sirius grey decolorization rate. Those graphics translate the results of the model describing the dependence of the decolorization rate (as a response) to the studied variables. It seems that the suitable pH to maximize the decolorization rate was 3 (Figure 6a,d,e). In fact, Figure 6a showed that processing the decolorization at pH 3 and at any level of HBT concentration yielded a constant and higher decolorization rate. Moreover, the same behavior was observed at pH 3 and at any Dye concentration. It decreased as the pH increased from 4 to 6 as shown in Figure 6d. Decreasing the pH from 6 to 3 while increasing the enzyme concentration improved the decolorization rate to reach 3.5%/min for 1 U/mL of enzyme and pH 3 (Figure 6e). However, increasing the HBT concentration while maintaining the pH and enzyme concentration constant (at 4.5 and 0.6 U/mL, respectively), regardless of the dye concentration, improved the decolorization rate (Figure 6b). According to Figure 6c, the decolorization rate reached its maximum (2.9%/min) when the HBT concentration increased from 0.2 to 1 mM and the enzyme concentration increased from 0.2 U/mL to 1 U/mL. The interaction between Dye concentration and Enzyme concentration presented in Figure 6f shows that maximizing the Enzyme concentration to 1 U/mL improved the rate of decolorization at different dye concentrations (50, 100, 150 mg/L). The impact of dye concentration was noticeable when processing at a low enzyme concentration. However, this distinction became less significant at higher concentrations.
3.7. Optimization of responses
Figure 7 represents the results of the optimization of responses. In fact, better decolorization is defined by maximum values of both responses: decolorization yield and decolorization rate. Indeed, a high Sirius grey decolorization could be obtained by fixing initial HBT concentration to a maximum value (1 mM), pH to 5, initial dye concentration to a minimum value (50 mg/L) and initial enzyme concentration to maximum (1 U/mL). In this case, the decolorization yield reached 87.56% and the decolorization rate 2.95%/min. In order to experimentally confirm the optimization results, the decolorization reaction was performed under optimal conditions in triplicates. The obtained results were 83.50±0.50% and 3.69±0.11%/min, for decolorization yield and rate, respectively.
3.8. Evaluation of the toxicity of treated and untreated dye
Phytotoxicity tests were performed using radish seeds which were incubated in treated and untreated dye solutions. Germination indexes were calculated in order to the inhibition caused by the dye or its degradation products. Distilled water was used as control. Figure 8 show that the treatment of the dye by a cell-free supernatant of C. gallica helps to decrease the phytotoxicity of Sirius grey by increasing GI from 29 ± 3.75% to 78.95 ± 18.84%. These results indicate that although Sirius grey is phototoxic, its degradation does not yield toxic metabolites.
4. Discussion
Strain BS9 shares more than 99% similarity of its ITS1-ITS4 region of rDNA with members of the species C. gallica. This fungus is known for its capacity to grow on several woods to produce ligninolytic enzymes [7,40]. Based on this fact, C. gallica was also shown to degrade many pollutants including dyes [7,25], hydrocarbons [41], phenols [42] and bisphenol A [43]. Recently, C. gallica was shown to be able to degrade antibiotics [44]. In the same work a proteomic analysis showed the presence of one major secreted laccase, although the presence of several laccase genes in the genome.
Decolorization of a wide range of synthetic and textile dyes using laccases from basidiomycetes has been investigated in recent years [45]. For this reason, we used C. gallica for the decolorization of Sirius grey; the latter belongs to the azo compounds that contain one or more azo groups (N=N) and most of them are xenobiotics [46]. By using the culture filtrate from C. gallica, 48% decolorization of Sirius grey was achieved. This decolorization yield was improved by adding 1 mM of HBT to the reaction mixture. Under these conditions, the decolorization yield increased to 81%. Therefore, the use of a mediator (such as HBT) is necessary, especially for certain laccase with low redox potential or in case the substrate is highly recalcitrant. Indeed, laccase mediators are low molecular weight molecules with a significant redox potential, enabling it to act as an electron messenger between the substrate and the enzyme [47,48].
The experimental design that was performed, used four variable factors namely: initial enzyme concentration, initial dye concentration, initial HBT concentration and pH. Ben Ayed et al. [7] found that these factors had significant effect on Reactive black 5 (RB5) decolorization using a laccase-like activity of cell free supernatant from C. gallica. The optimized conditions obtained for laccase concentration, HBT concentration and pH were 1 U/ml, 50 mg/L, 1 mM and pH 5, respectively with a maximum decolorization yield of 87%.
In this study, the crude laccase of C. gallica was used in the decolorization experiments, and the presence of 4 azo groups in the Sirius grey, makes its treatment more challenging. The decolorization rate obtained here (87% after 4 hours) is significant when compared to the results reported by Daassi et al. [25]. In their study, they used partially purified C. gallica laccase for the treatment of three different groups of dyes. However, the RB5 and Bismarck brown R (BBR), which are diazoic dyes, did not show significant decolorization rate. Concerning BBR, the rate was approximately 47.1% over 24 hours, whereas for RB5, this rate did not exceed 70%, even after 24 hours of incubation in the presence of 1 mM HBT.
To identify the influence of the interactions between studied factors on decolorization yield and rate, 3D-surface responses were designed (Figure 4). Increasing the HBT concentration to its highest level (1 mM) followed by the increase of pH to 4-5 resulted in enhancing decolorization yield to a level of 80% (Figure 4a). This effect was observed in the interactions between pH × dye concentration and pH × enzyme concentration (Figure 4d,e, respectively). However, increasing the pH beyond 5 led to a reduction of decolorization yield and this aligns with Forootanfar et al. [49] observations. These findings were explained by the fact that hydroxide anions could bind to the enzyme at acid pH and this affects negatively the electrons transfer. In contrast, Aksu and Tezer [50] considered the possibility of basic azo dyes to become charged positively at higher pH and this affects their interactions with the mediator and enzyme. The effect of this interaction on the decolorization rate showed that the highest rate was achieved at pH 3, independently of the other factors concentration (Figure 6a,d,e). This can be explained by the fact that pH 3 matches with the optimum pH for the used enzyme, allowing the decolorization to reach a high speed. This aligns with previous studies claiming that fungal laccases are active at 3-5 pH range [7,51]. In addition, the stability of the dye can be affected at pH 3 increasing even more the rate of decolorization as reported before by Yin et al. [52] and Ben Ayed et al. [7].
Figure 4b shows the interaction HBT concentration × Dye concentration at pH 4.5 and 0.6 U/mL of Enzyme. Increasing the HBT concentration to its maximum level at different dye concentrations resulted in an increase in the decolorization rate from values less than 1.80%/min (for 0.2 mM of HBT and 150 mg/L of Dye) to values more than 2.25% (for 1 mM of HBT and 50, 100 and 150 mg/L of Dye). This means that higher HBT concentrations improved the dye oxidation by laccase. However, at 150 mg/L dye concentration (and 1 mM of HBT), the decolorization yield decreased slightly and this was likely due to enzyme and HBT saturation. As a matter of fact, excessive dye concentration can lead to enzyme inhibition and/or unproductive reactions by intensifying competition for the enzyme’s active sites and substrate saturation. This hypothesis about enzyme-substrate concentration was discussed by Benzina et al. [53]. The effect of saturation can also be seen in the Enzyme concentration × HBT concentration interaction (Figure 4c). In fact, increasing HBT concentration up to 0.8 mM and that of the enzyme to 0.8 U/mL could led to an increase in the decolorization yield reaching 85%, but a higher concentration of enzyme and HBT led to a slight decrease attaining 80%. Accordingly, the presence of the enzyme and the mediator facilitates an efficient dye cleavage.
The effect of the interaction Dye concentration × Enzyme concentration on the decolorization yield is depicted in Figure 4f. it can be see that treating high dye concentrations at low enzyme levels (and at HBT concentration of 0.6 mM) might cause a saturation effect of the enzyme and therefore of the decolororization yield. However, when the substrate concentration was decreased while increasing that of the enzyme, the decolorization yield was enhanced. This suggests that higher enzyme concentrations provide more active sites for the degradation of of the dye.
With regard to the decolorization rate, Figure 6 represents the effects of factors interactions. Figure 6b illustrates the interaction between HBT and dye concentrations. The lowest decolorization rate (1.8%/min) was observed for a minimal HBT concentration (0.2 mM) and a maximum concentration of Sirius grey concentration (150 mg/L). Conversely, a high response (2.2%/min) was obtained with a maximum mediator level (1 mM of HBT) and at different dye concentrations, or at low concentrations of both dye and HBT. These results were expected since they, aligning with the mediator role in improving electron transfer between the enzyme and substrate, and enhancing the treatment rate [54,55]. In fact, higher dye concentrations necessitate greater mediator concentrations to accelerate the decolorization rate. The need of mediator was also shown in the interaction HBT concentration × Enzyme concentration (Figure 6c). Indeed, this interaction showed that a higher response of approximately 3%/min was reached at higher concentrations of both factors (1 mM of HBT and 1 U/mL of Enzyme). So, as the levels of the enzyme and mediator was increased, the rate of dye decolorization was accelerated. The Dye concentration × Enzyme concentration interaction presented in Figure 6f exhibited linearity, showcasing a high response (2.8%/min) at 1 U/mL of laccase for various dye concentrations, maintaining a pH of 4.5 and 0.6 mM of HBT. Increasing enzyme concentration means increasing the active site number which boosts the decolorization rate [56].
As textile industry effluents could be used for the irrigation of some crops [57,58], it is necessary to evaluate their phytotoxicity. In the present study, the toxicity of the treated and untreated Sirius grey solution was evaluated by measuring the germination index of radish seeds. It was found that the Germination Index (%IG) was significantly increased after treatment of Sirius grey by the supernatant of C. gallica compared to the dye solution. This indicates that the treatment with laccase has effectively minimized the toxicity of the dye to lower levels compared to that of untreated dye.
5. Conclusions
Basidiomycetes secrete a range of oxidases, including laccases and peroxidases that could transform a number of pollutants including recalcitrant dyes to non-toxic molecules. Because of the high redox potential of dye molecules or their incapacity to reach active sites, small redox mediators are often required for optimal decolorization. In addition, several other reaction parameters including: pH, dye concentration, enzyme concentration have also to be optimized. In this study, it was shown that response surface methodology was an effective method to reach a high decolorization rate of the recalcitrant 4 azo bonds dye: Sirius grey. This study confirmed that the laccase-HBT system could be a promising tool for the decolorization and the detoxification of textile dyes.
Author Contributions
Conceptualization, T.M. and H.Z.M.; methodology, H.Z.M software, B.H.; validation, B.H., T.M. and H.Z.M.; investigation, J.B., B.H. and H.Z.M. writing—original draft preparation, J.B., H.Z.M.; and T.M.; writing—review and editing, A.A., T.M., B.H. ; supervision, T.M.;. funding acquisition, T.M. and A. A. All authors have read and agreed to the published version of the manuscript.
Funding
This research was funded by the projects PHC-Utique CMCU 22/G0814 and PHC-Maghreb 23MAG31.
Informed Consent Statement
This article does not contain any studies with human participants or animal experiments.
Data Availability Statement
The authors declare data transparency.
Acknowledgments
The authors would like thank Dr. Ghazza Masmoudi and Sami Naifar for revising the manuscript and Julia Pawlowska, Alicja Okrasińska for performing the identification and phylogeny of the fungal strain
Conflicts of Interest
The authors declare no conflict of interest
References
- Clark, M. Handbook of Textile and Industrial Dyeing: Principles, Processes and Types of Dyes; Elsevier, 2011; ISBN 0-85709-397-5.
- Abel, A. The History of Dyes and Pigments: From Natural Dyes to High Performance Pigments. In Colour Design; Elsevier, 2012; pp. 433–470 ISBN 978-1-84569-972-7.
- Benkhaya, S.; M’rabet, S.; Lgaz, H.; El Bachiri, A.; El Harfi, A. Dyes: Classification, Pollution, and Environmental Effects. In Dye Biodegradation, Mechanisms and Techniques; Muthu, S.S., Khadir, A., Eds.; Sustainable Textiles: Production, Processing, Manufacturing & Chemistry; Springer Singapore: Singapore, 2022; pp. 1–50 ISBN 9789811659317.
- Benkhaya, B.; El Harfi, S.; El Harfi, A. Classifications, Properties and Applications of Textile Dyes: A Review. Appl. J. Environ. Eng. Sci. 2017, Vol 3, Appl.00000J. Envir. Eng. Sci. 3 N°3(2017) 311-320 Pages. [CrossRef]
- Benkhaya, S.; M’ Rabet, S.; El Harfi, A. A Review on Classifications, Recent Synthesis and Applications of Textile Dyes. Inorg. Chem. Commun. 2020, 115, 107891. [Google Scholar] [CrossRef]
- Mokhtar, A.; Abdelkrim, S.; Boukoussa, B.; Hachemaoui, M.; Djelad, A.; Sassi, M.; Abboud, M. Elimination of Toxic Azo Dye Using a Calcium Alginate Beads Impregnated with NiO/Activated Carbon: Preparation, Characterization and RSM Optimization. Int. J. Biol. Macromol. 2023, 233, 123582. [Google Scholar] [CrossRef] [PubMed]
- Ben Ayed, A.; Hadrich, B.; Sciara, G.; Lomascolo, A.; Bertrand, E.; Faulds, C.B.; Zouari-Mechichi, H.; Record, E.; Mechichi, T. Optimization of the Decolorization of the Reactive Black 5 by a Laccase-like Active Cell-Free Supernatant from Microorganisms 2022, 10, 1137. [CrossRef]
- Brüschweiler, B.J.; Merlot, C. Azo Dyes in Clothing Textiles Can Be Cleaved into a Series of Mutagenic Aromatic Amines Which Are Not Regulated Yet. Regul. Toxicol. Pharmacol. 2017, 88, 214–226. [Google Scholar] [CrossRef] [PubMed]
- Ramzan, U.; Shakoori, F.R.; Zahid, M.T.; Majeed, W.; Zahra, I.; Abbas, S.Z.; Hedfi, A.; Hassan, S.; Shakoori, A.R.; Mutery, A.A. Biodegradation and Decolorization of Textile Azo Dyes by Paramecium Caudatum Isolated from Industrial Wastewater. Water 2022, 14, 3553. [Google Scholar] [CrossRef]
- Chung, K.-T. Azo Dyes and Human Health: A Review. J. Environ. Sci. Health Part C 2016, 34, 233–261. [Google Scholar] [CrossRef] [PubMed]
- Kant, R. Textile Dyeing Industry an Environmental Hazard. Nat. Sci. 2012, 04, 22–26. [Google Scholar] [CrossRef]
- Sarkar, S.; Banerjee, A.; Halder, U.; Biswas, R.; Bandopadhyay, R. Degradation of Synthetic Azo Dyes of Textile Industry: A Sustainable Approach Using Microbial Enzymes. Water Conserv. Sci. Eng. 2017, 2, 121–131. [Google Scholar] [CrossRef]
- Souza, M.C.O.; González, N.; Herrero, M.; Marquès, M.; Rovira, J.; Nadal, M.; Barbosa, F.; Domingo, J.L. Screening of Regulated Aromatic Amines in Clothing Marketed in Brazil and Spain: Assessment of Human Health Risks. Environ. Res. 2023, 221, 115264. [Google Scholar] [CrossRef] [PubMed]
- Lellis, B.; Fávaro-Polonio, C.Z.; Pamphile, J.A.; Polonio, J.C. Effects of Textile Dyes on Health and the Environment and Bioremediation Potential of Living Organisms. Biotechnol. Res. Innov. 2019, 3, 275–290. [Google Scholar] [CrossRef]
- Saratale, R.G.; Saratale, G.D.; Chang, J.S.; Govindwar, S.P. Bacterial Decolorization and Degradation of Azo Dyes: A Review. J. Taiwan Inst. Chem. Eng. 2011, 42, 138–157. [Google Scholar] [CrossRef]
- Dammak, I.; Ben Atitallah, I.; Louati, I.; Hadrich, B.; Mechichi, T. Optimization of Reactive Black 5 Decolorization by the Newly Isolated Saccharomyces Cerevisiae X19G2 Using Response-Surface Methodology. 3 Biotech 2022, 12, 142. [Google Scholar] [CrossRef]
- Moyo, S.; Makhanya, B.P.; Zwane, P.E. Use of Bacterial Isolates in the Treatment of Textile Dye Wastewater: A Review. Heliyon 2022, 8, e09632. [Google Scholar] [CrossRef] [PubMed]
- Louati, I.; Elloumi-Mseddi, J.; Cheikhrouhou, W.; Hadrich, B.; Nasri, M.; Aifa, S.; Woodward, S.; Mechichi, T. Simultaneous Cleanup of Reactive Black 5 and Cadmium by a Desert Soil Bacterium. Ecotoxicol. Environ. Saf. 2020, 190, 110103. [Google Scholar] [CrossRef] [PubMed]
- Louati, I.; Hadrich, B.; Nasri, M.; Belbahri, L.; Woodward, S.; Mechichi, T. Modelling of Reactive Black 5 Decolourization in the Presence of Heavy Metals by the Newly Isolated Pseudomonas Aeruginosa Strain Gb30. J. Appl. Microbiol. 2019, 126, 1761–1771. [Google Scholar] [CrossRef]
- Ghazal, F.; Mahdy, E.-S.; Abdelfattah, M.; EL-Sadany, A.; Doha, N. The Use of Microalgae in Bioremediation of the Textile Wastewater Effluent. Nat. Sci. 2018, 16, 98–104. [Google Scholar]
- Ghariani, B.; Hadrich, B.; Louati, I.; Mtibaà, R.; Daâssi, D.; Rodriguez-Couto, S.; Nasri, M.; Mechichi, T. Porous Heat-Treated Fungal Biomass: Preparation, Characterization and Application for Removal of Textile Dyes from Aqueous Solutions. J. Porous Mater. 2019, 26, 1475–1488. [Google Scholar] [CrossRef]
- Amaral, P.F.F.; Fernandes, D.L.A.; Tavares, A.P.M.; Xavier, A.B.M.R.; Cammarota, M.C.; COutinho, J.A.P.; Coelho, M.A.Z. Decolorization of Dyes from Textile Wastewater by Trametes Versicolor. Environ. Technol. 2004, 25, 1313–1320. [Google Scholar] [CrossRef] [PubMed]
- Daâssi, D.; Zouari-Mechichi, H.; Frikha, F.; Martinez, M.J.; Nasri, M.; Mechichi, T. Decolorization of the Azo Dye Acid Orange 51 by Laccase Produced in Solid Culture of a Newly Isolated Trametes Trogii Strain. 3 Biotech 2013, 3, 115–125. [Google Scholar] [CrossRef] [PubMed]
- Zouari-Mechichi, H.; Mechichi, T.; Dhouib, A.; Sayadi, S.; Martínez, A.T.; Martínez, M.J. Laccase Purification and Characterization from Trametes Trogii Isolated in Tunisia: Decolorization of Textile Dyes by the Purified Enzyme. Enzyme Microb. Technol. 2006, 39, 141–148. [Google Scholar] [CrossRef]
- Daâssi, D.; Rodríguez-Couto, S.; Nasri, M.; Mechichi, T. Biodegradation of Textile Dyes by Immobilized Laccase from into Ca-Alginate Beads. Int. Biodeterior. Biodegrad. 2014, 90, 71–78. [Google Scholar] [CrossRef]
- Alihosseini, F.; Azimi, S.H.; Mostajeran, M.; Feiz, M. Removal of Different Vat Dyes by Aspergillus niger: A Comparative Study Focusing on the Molecular Structure. J. Microbiol. Methods 2023, 208, 106720. [Google Scholar] [CrossRef] [PubMed]
- Grace Barrios-Gutiérrez, S.; Inés Vélez-Mercado, M.; Rodrigues Ortega, J.; Da Silva Lima, A.; Luiza Da Rocha Fortes Saraiva, A.; Leila Berto, G.; Segato, F. Oxidative Machinery of Basidiomycetes as Potential Enhancers in Lignocellulosic Biorefineries: A Lytic Polysaccharide Monooxygenases Approach. Bioresour. Technol. 2023, 386, 129481. [Google Scholar] [CrossRef] [PubMed]
- Singh, A.K.; Iqbal, H.M.N.; Cardullo, N.; Muccilli, V.; Fernández-Lucas, J.; Schmidt, J.E.; Jesionowski, T.; Bilal, M. Structural Insights, Biocatalytic Characteristics, and Application Prospects of Lignin-Modifying Enzymes for Sustainable Biotechnology. Int. J. Biol. Macromol. 2023, 242, 124968. [Google Scholar] [CrossRef] [PubMed]
- Cañas, A.I.; Camarero, S. Laccases and Their Natural Mediators: Biotechnological Tools for Sustainable Eco-Friendly Processes. Biotechnol. Adv. 2010, 28, 694–705. [Google Scholar] [CrossRef] [PubMed]
- Mate, D.M.; Alcalde, M. Laccase Engineering: From Rational Design to Directed Evolution. Biotechnol. Adv. 2015, 33, 25–40. [Google Scholar] [CrossRef] [PubMed]
- Singh, G.; Kaur, K.; Puri, S.; Sharma, P. Critical Factors Affecting Laccase-Mediated Biobleaching of Pulp in Paper Industry. Appl. Microbiol. Biotechnol. 2015, 99, 155–164. [Google Scholar] [CrossRef]
- Fillat, U.; Prieto, A.; Camarero, S.; Martínez, Á.T.; Martínez, M.J. Biodeinking of Flexographic Inks by Fungal Laccases Using Synthetic and Natural Mediators. Biochem. Eng. J. 2012, 67, 97–103. [Google Scholar] [CrossRef]
- Schoch, C.L.; Seifert, K.A.; Huhndorf, S.; Robert, V.; Spouge, J.L.; Levesque, C.A.; Chen, W.; Fungal Barcoding Consortium; Fungal Barcoding Consortium Author List; Bolchacova, E.; et al. Nuclear Ribosomal Internal Transcribed Spacer (ITS) Region as a Universal DNA Barcode Marker for Fungi. Proc. Natl. Acad. Sci. 2012, 109, 6241–6246. [CrossRef]
- White; Bruns, T.; Lee, S.; Taylor, J. White, T. J., T. D. Bruns, S. B. Lee, and J. W. Taylor. Amplification and Direct Sequencing of Fungal Ribosomal RNA Genes for Phylogenetics. In; 1990; pp. 315–322 ISBN 978-0-12-372180-8.
- Okonechnikov, K.; Golosova, O.; Fursov, M. ; the UGENE team Unipro UGENE: A Unified Bioinformatics Toolkit. Bioinformatics 2012, 28, 1166–1167. [Google Scholar] [CrossRef] [PubMed]
- Gouy, M.; Guindon, S.; Gascuel, O. SeaView Version 4: A Multiplatform Graphical User Interface for Sequence Alignment and Phylogenetic Tree Building. Mol. Biol. Evol. 2010, 27, 221–224. [Google Scholar] [CrossRef]
- Capella-Gutiérrez, S.; Silla-Martínez, J.M.; Gabaldón, T. trimAl: A Tool for Automated Alignment Trimming in Large-Scale Phylogenetic Analyses. Bioinformatics 2009, 25, 1972–1973. [Google Scholar] [CrossRef]
- Kozlov, A.M.; Darriba, D.; Flouri, T.; Morel, B.; Stamatakis, A. RAxML-NG: A Fast, Scalable and User-Friendly Tool for Maximum Likelihood Phylogenetic Inference. Bioinformatics 2019, 35, 4453–4455. [Google Scholar] [CrossRef] [PubMed]
- Muñoz, C.; Guillén, F.; Martínez, A.T.; Martínez, M.J. Induction and Characterization of Laccase in the Ligninolytic Fungus Pleurotus Eryngii. Curr. Microbiol. 1997, 34, 1–5. [Google Scholar] [CrossRef] [PubMed]
- Daâssi, D.; Zouari-Mechichi, H.; Belbahri, L.; Barriuso, J.; Martínez, M.J.; Nasri, M.; Mechichi, T. Phylogenetic and Metabolic Diversity of Tunisian Forest Wood-Degrading Fungi: A Wealth of Novelties and Opportunities for Biotechnology. 3 Biotech 2016, 6, 46. [Google Scholar] [CrossRef] [PubMed]
- Daâssi, D.; Nasraoui-Hajaji, A.; Bawasir, S.; Frikha, F.; Mechichi, T. Biodegradation of C20 Carbon Clusters from Diesel Fuel by: Optimization, Metabolic Pathway, Phytotoxicity. 3 Biotech 2021, 11, 214. [Google Scholar] [CrossRef] [PubMed]
- Daâssi, D.; Lozano-Sánchez, J.; Borrás-Linares, I.; Belbahri, L.; Woodward, S.; Zouari-Mechichi, H.; Mechichi, T.; Nasri, M.; Segura-Carretero, A. Olive Oil Mill Wastewaters: Phenolic Content Characterization during Degradation by Chemosphere 2014, 113, 62–70. [CrossRef]
- Daâssi, D.; Prieto, A.; Zouari-Mechichi, H.; Martínez, M.J.; Nasri, M.; Mechichi, T. Degradation of Bisphenol A by Different Fungal Laccases and Identification of Its Degradation Products. Int. Biodeterior. Biodegrad. 2016, 110, 181–188. [Google Scholar] [CrossRef]
- Ben Ayed, A.; Akrout, I.; Albert, Q.; Greff, S.; Simmler, C.; Armengaud, J.; Kielbasa, M.; Turbé-Doan, A.; Chaduli, D.; Navarro, D.; et al. Biotransformation of the Fluoroquinolone, Levofloxacin, by the White-Rot Fungus. J. Fungi 2022, 8, 965. [Google Scholar] [CrossRef]
- Nozaki, K.; Beh, C.H.; Mizuno, M.; Isobe, T.; Shiroishi, M.; Kanda, T.; Amano, Y. Screening and Investigation of Dye Decolorization Activities of Basidiomycetes. J. Biosci. Bioeng. 2008, 105, 69–72. [Google Scholar] [CrossRef]
- Misal, S.A.; Gawai, K.R. Azoreductase: A Key Player of Xenobiotic Metabolism. Bioresour. Bioprocess. 2018, 5, 17. [Google Scholar] [CrossRef]
- Baldrian, P. Fungal Laccases – Occurrence and Properties. FEMS Microbiol. Rev. 2006, 30, 215–242. [Google Scholar] [CrossRef] [PubMed]
- Khlifi, R.; Mechichi, T.; Sayadi, S.; Dhouib, A. Effect of Natural Mediators on the Stability of Trametes Trogii Laccase during the Decolourization of Textile Wastewaters. J. Microbiol. Seoul Korea 2012, 50, 226–234. [Google Scholar] [CrossRef]
- Forootanfar, H.; Rezaei, S.; Zeinvand-Lorestani, H.; Tahmasbi, H.; Mogharabi, M.; Ameri, A.; Faramarzi, M.A. Studies on the Laccase-Mediated Decolorization, Kinetic, and Microtoxicity of Some Synthetic Azo Dyes. J. Environ. Health Sci. Eng. 2016, 14, 7. [Google Scholar] [CrossRef] [PubMed]
- Aksu, Z.; Tezer, S. Biosorption of Reactive Dyes on the Green Alga Chlorella Vulgaris. Process Biochem. 2005, 40, 1347–1361. [Google Scholar] [CrossRef]
- Kumar, R.; Kaur, J.; Jain, S.; Kumar, A. Optimization of Laccase Production from Aspergillus Flavus by Design of Experiment Technique: Partial Purification and Characterization. J. Genet. Eng. Biotechnol. 2016, 14, 125–131. [Google Scholar] [CrossRef] [PubMed]
- Yin, Q.; Zhou, G.; Peng, C.; Zhang, Y.; Kües, U.; Liu, J.; Xiao, Y.; Fang, Z. The First Fungal Laccase with an Alkaline pH Optimum Obtained by Directed Evolution and Its Application in Indigo Dye Decolorization. AMB Express 2019, 9, 151. [Google Scholar] [CrossRef]
- Benzina, O.; Frikha, F.; Zouari-Mechichi, H.; Woodward, S.; Belbahri, L.; Mnif, E.; Mechichi, T. Enhanced Decolourization of the Azo Dye Sirius Rose BB by Laccase–HBT System. 3 Biotech 2012, 2, 149–157. [Google Scholar] [CrossRef]
- Gu, Y.; Yuan, L.; Jia, L.; Xue, P.; Yao, H. Recent Developments of a Co-Immobilized Laccase–Mediator System: A Review. RSC Adv. 2021, 11, 29498–29506. [Google Scholar] [CrossRef]
- Munk, L.; Andersen, M.L.; Meyer, A.S. Influence of Mediators on Laccase Catalyzed Radical Formation in Lignin. Enzyme Microb. Technol. 2018, 116, 48–56. [Google Scholar] [CrossRef] [PubMed]
- Robinson, P.K. Enzymes: Principles and Biotechnological Applications. Essays Biochem. 2015, 59, 1–41. [Google Scholar] [CrossRef] [PubMed]
- Hassan, J.; Rajib, Md.M.R.; Sarker, U.; Akter, M.; Khan, Md.N.-E.-A.; Khandaker, S.; Khalid, F.; Rahman, G.K.M.M.; Ercisli, S.; Muresan, C.C.; et al. Optimizing Textile Dyeing Wastewater for Tomato Irrigation through Physiochemical, Plant Nutrient Uses and Pollution Load Index of Irrigated Soil. Sci. Rep. 2022, 12, 10088. [Google Scholar] [CrossRef] [PubMed]
- Singh, R.; Rathore, D. Effects of Fertilization with Textile Effluent on Germination, Growth and Metabolites of Chilli (Capsicum Annum L) Cultivars. Environ. Process. 2021, 8, 1249–1266. [Google Scholar] [CrossRef]
Figure 1.
Chemical structure of Sirius grey GB (Direct black 76) the 4 azo bonds and 4 sulfonate groups dye.
Figure 1.
Chemical structure of Sirius grey GB (Direct black 76) the 4 azo bonds and 4 sulfonate groups dye.
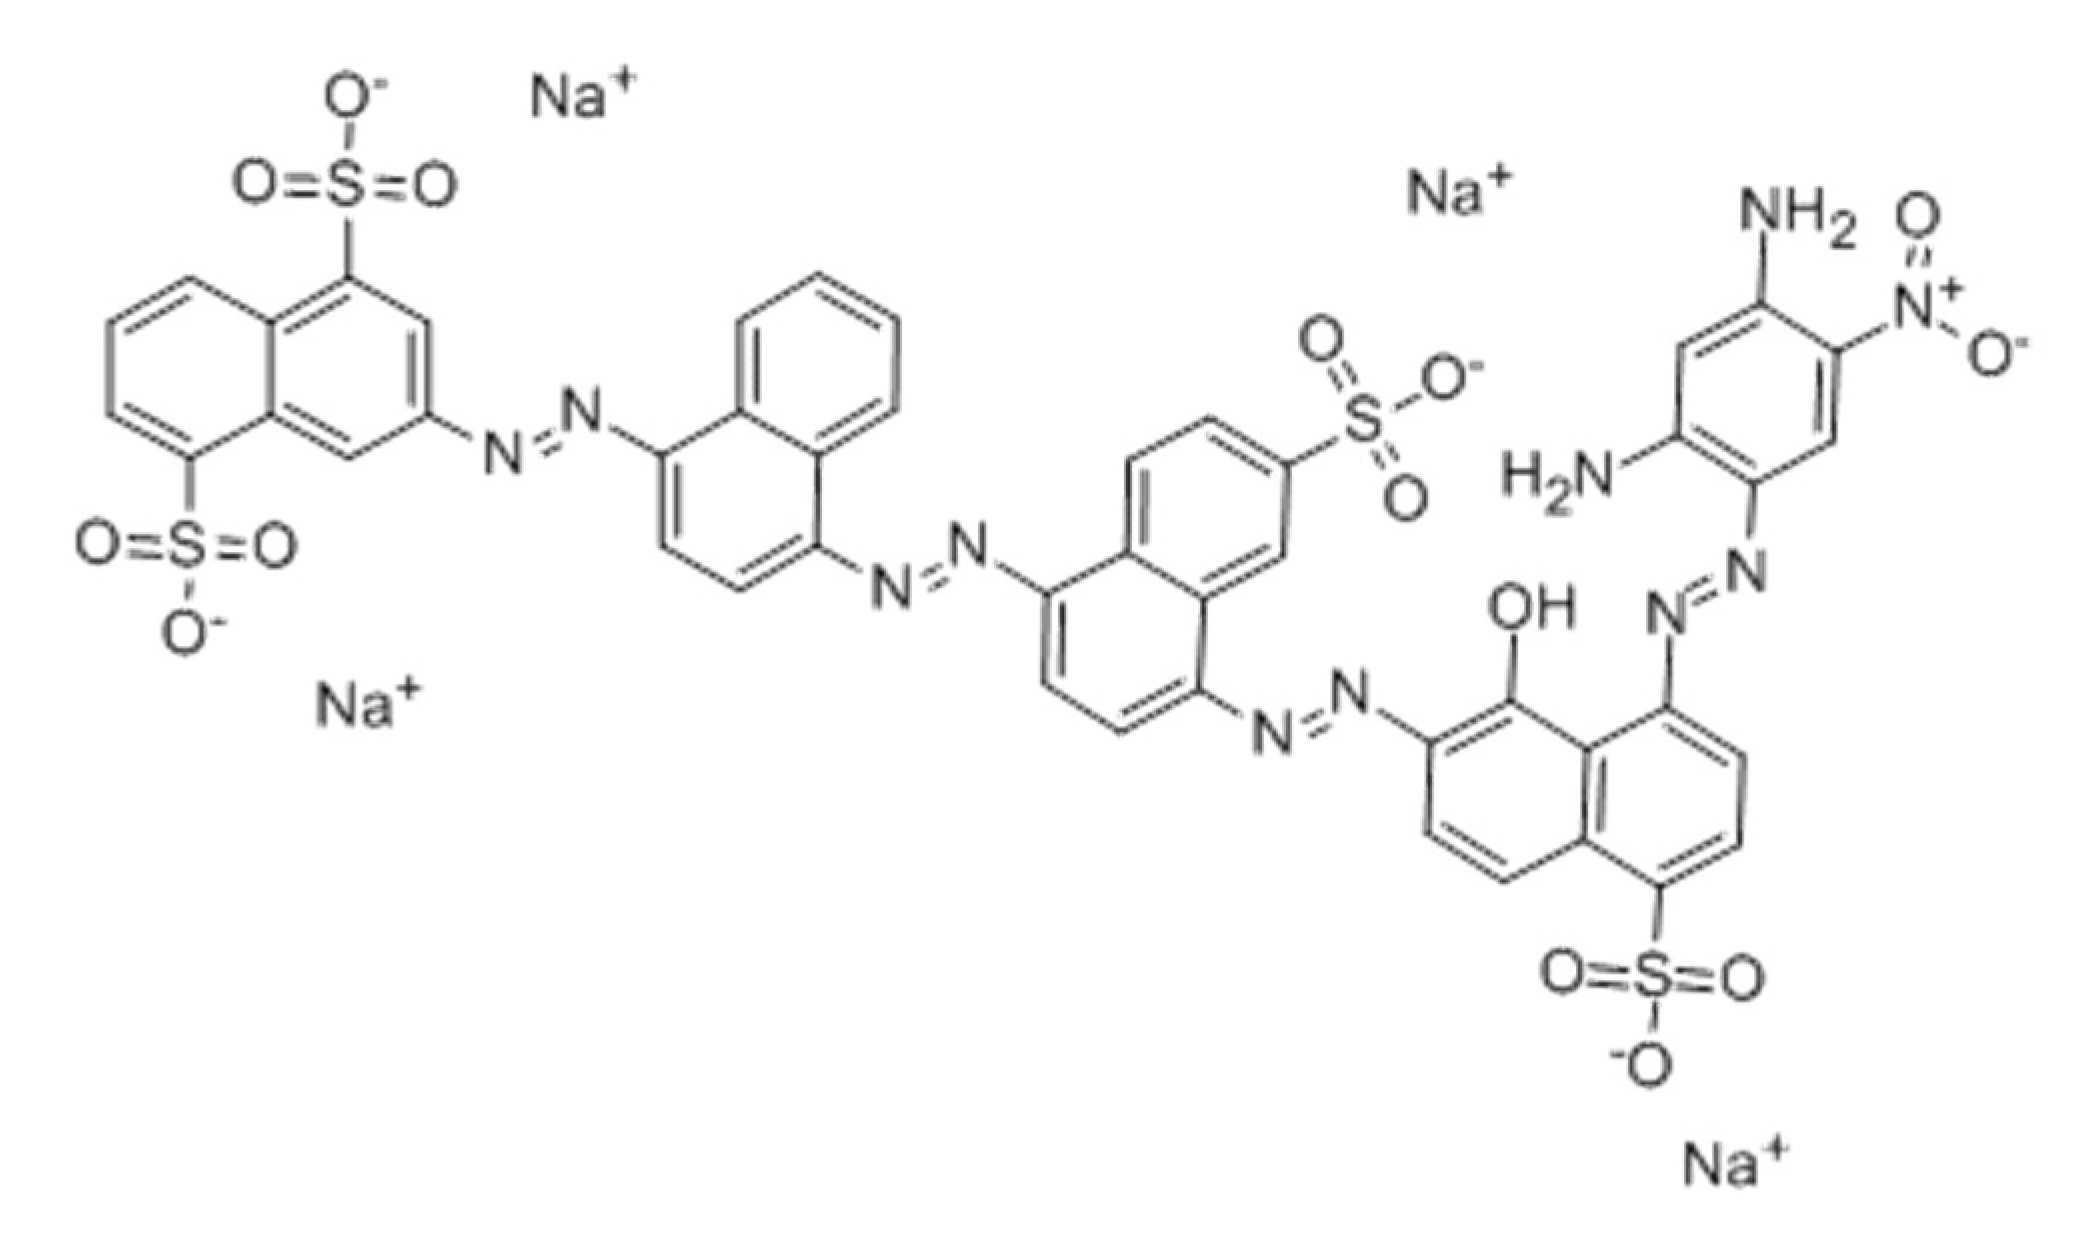
Figure 2.
Phylogenetic tree based on ITS rDNA sequences compared to references sequences from Genbank showing the relationship of strain BS9 to its closest strains.
Figure 2.
Phylogenetic tree based on ITS rDNA sequences compared to references sequences from Genbank showing the relationship of strain BS9 to its closest strains.
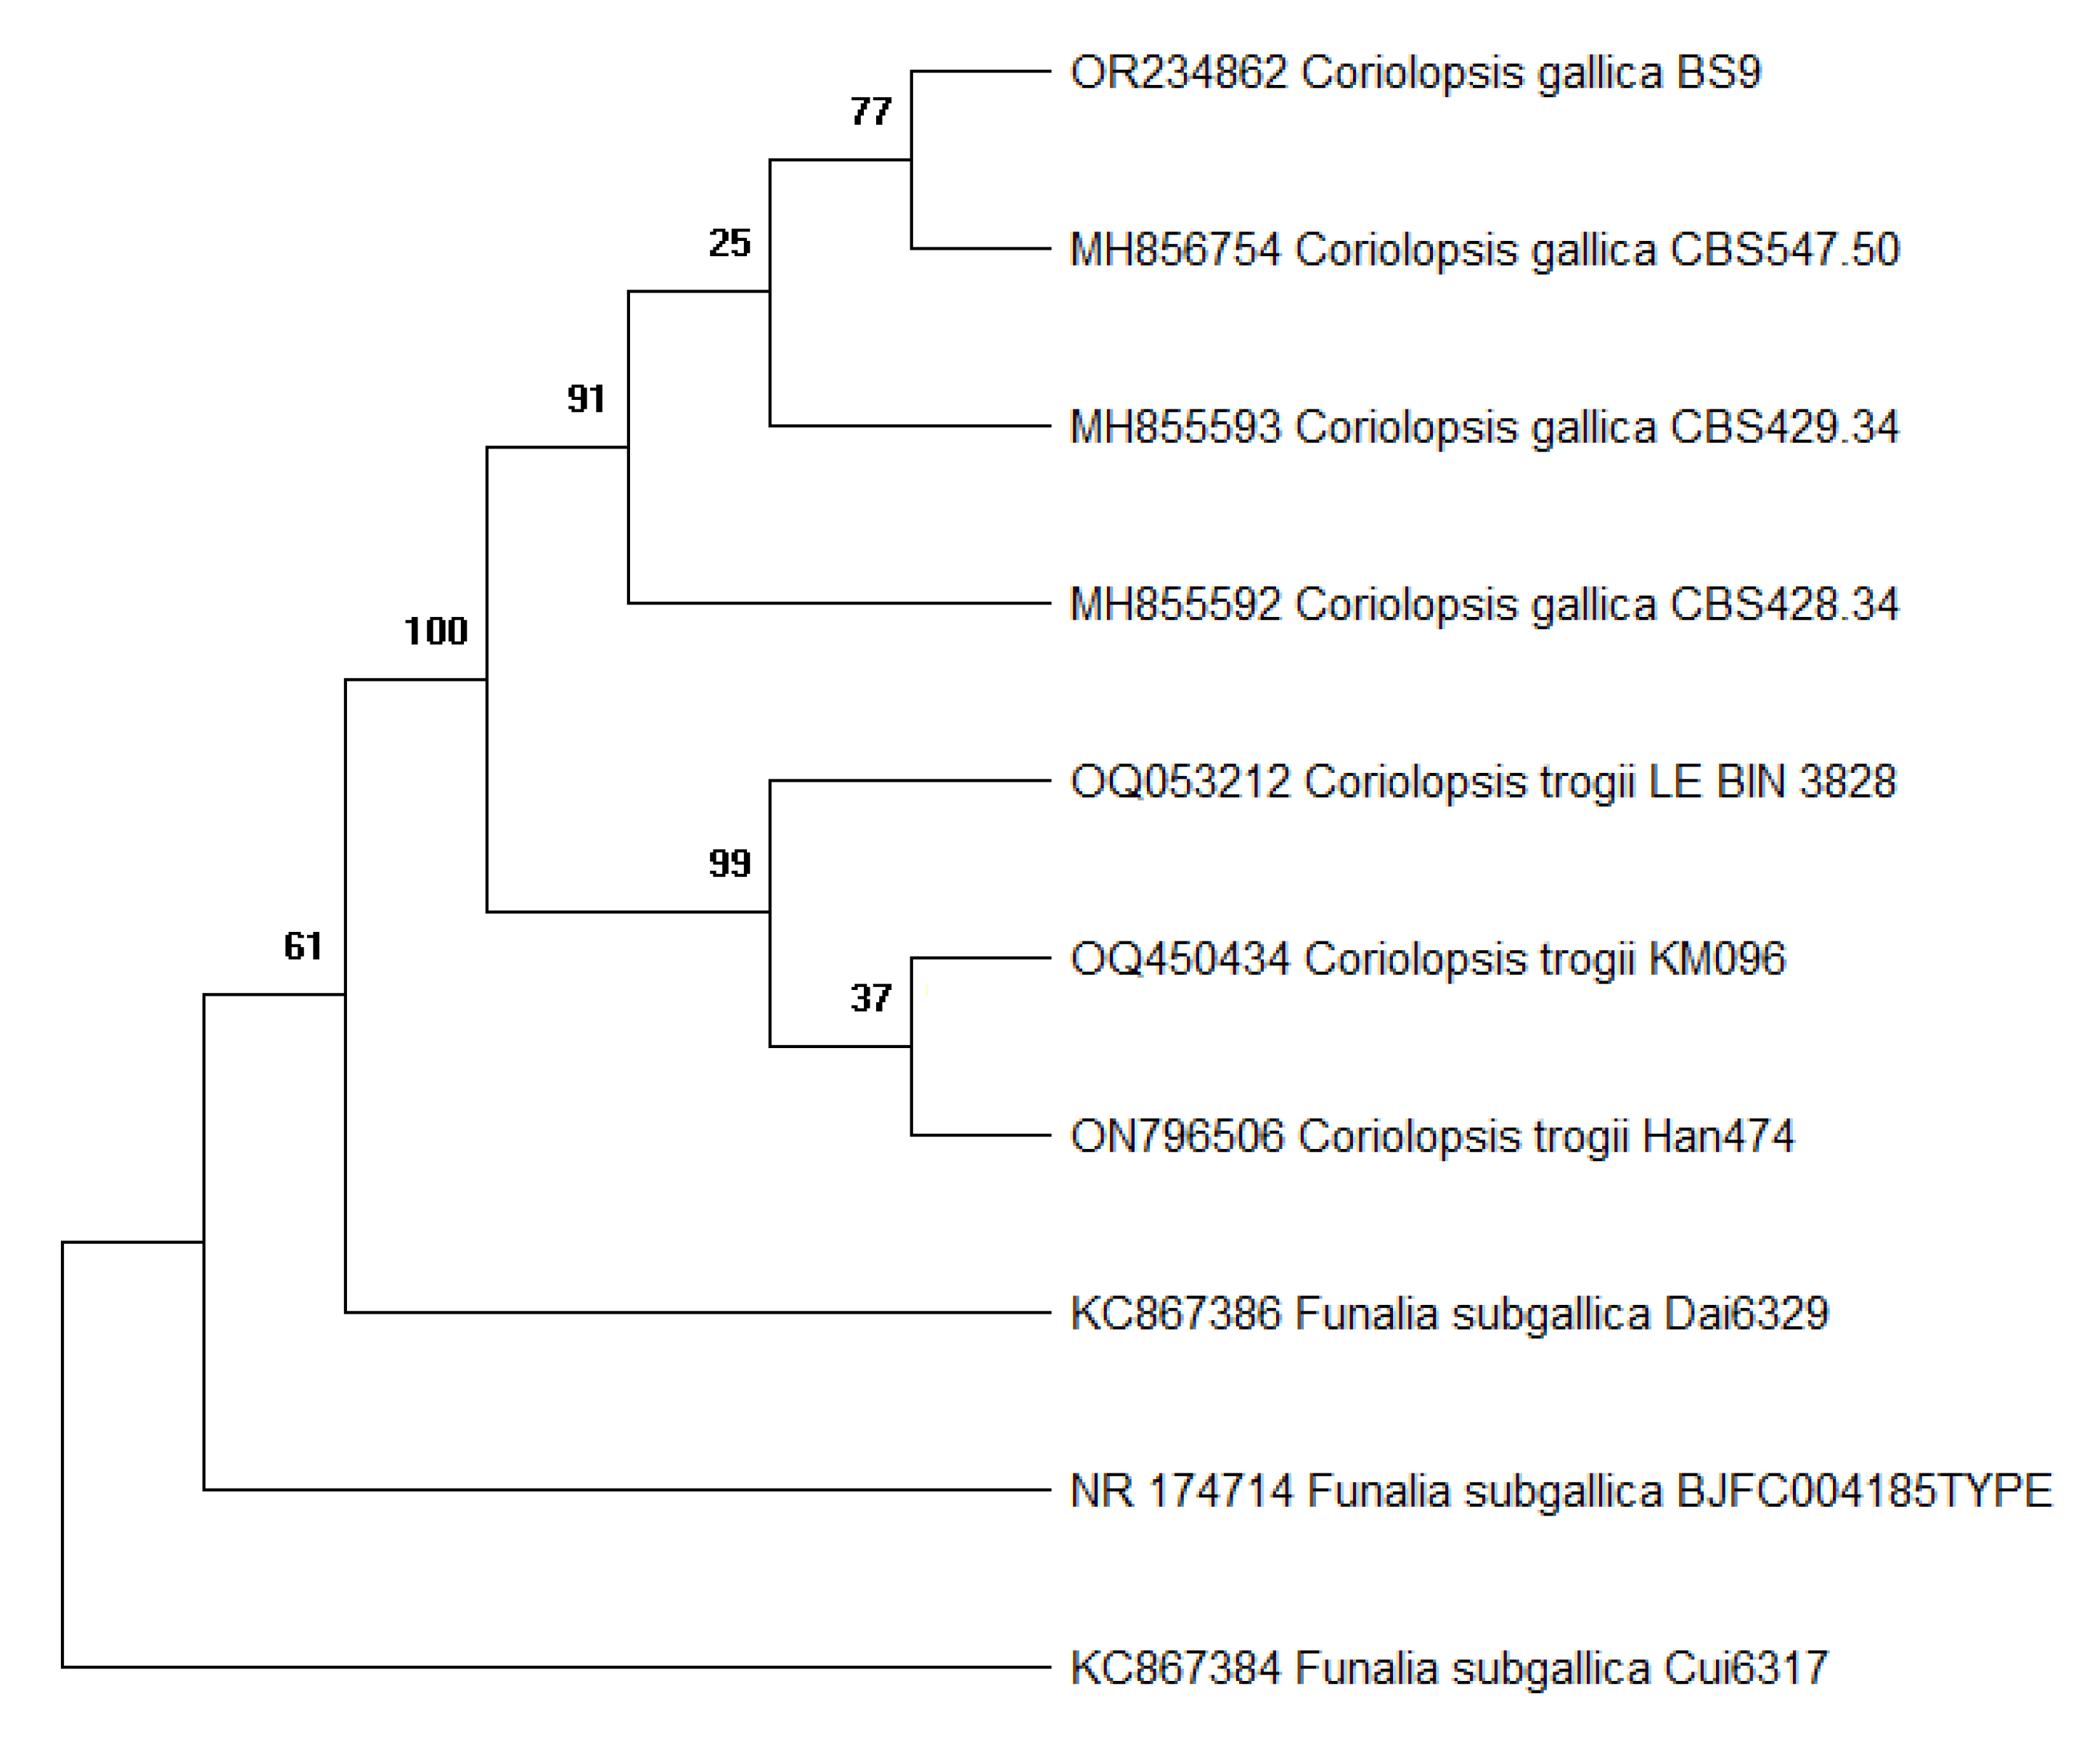
Figure 3.
Pareto chart of the standardized effects of the Sirius grey decolorization yield (%) (p < 0.05).
Figure 3.
Pareto chart of the standardized effects of the Sirius grey decolorization yield (%) (p < 0.05).
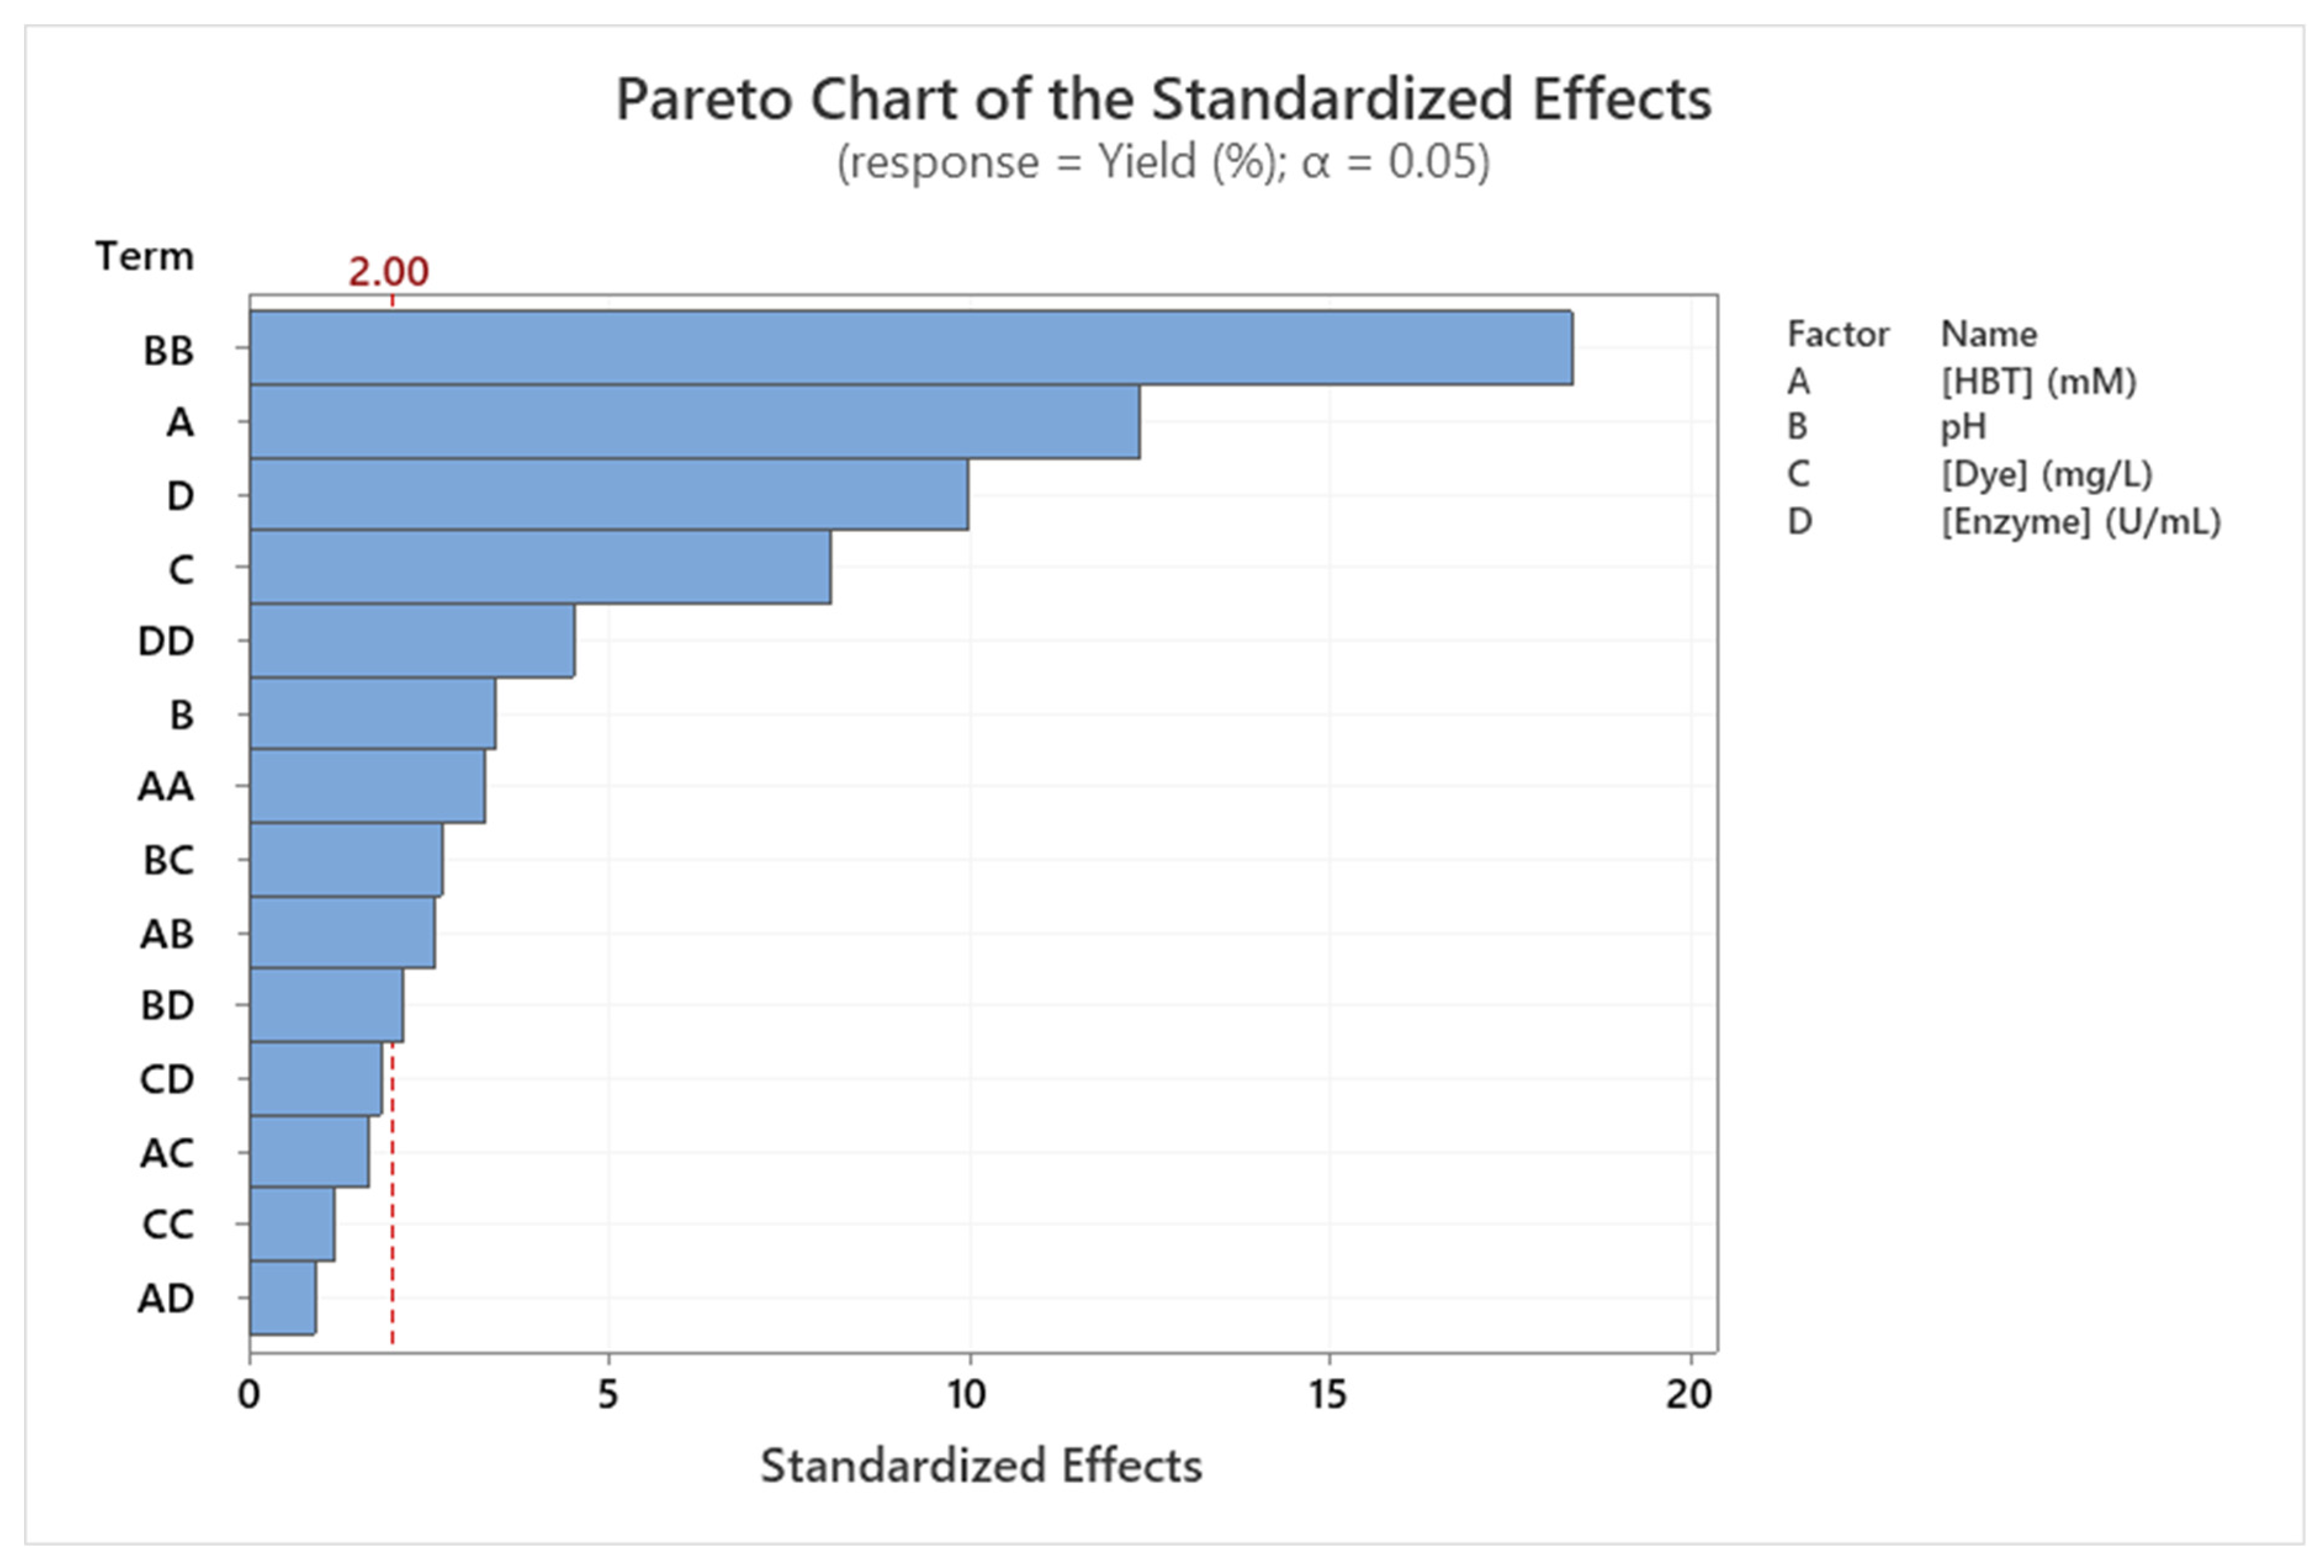
Figure 4.
3D-Surfaces response of Sirius grey decolorization yield as function of: (a) [HBT] and pH; (b) [HBT] and [Dye]; (c) [HBT] and [Enzyme]; (d) pH and [Dye]; (e) pH and [Enzyme] (f) [Dye] and [Enzyme]. All other factors are fixed at central level.
Figure 4.
3D-Surfaces response of Sirius grey decolorization yield as function of: (a) [HBT] and pH; (b) [HBT] and [Dye]; (c) [HBT] and [Enzyme]; (d) pH and [Dye]; (e) pH and [Enzyme] (f) [Dye] and [Enzyme]. All other factors are fixed at central level.
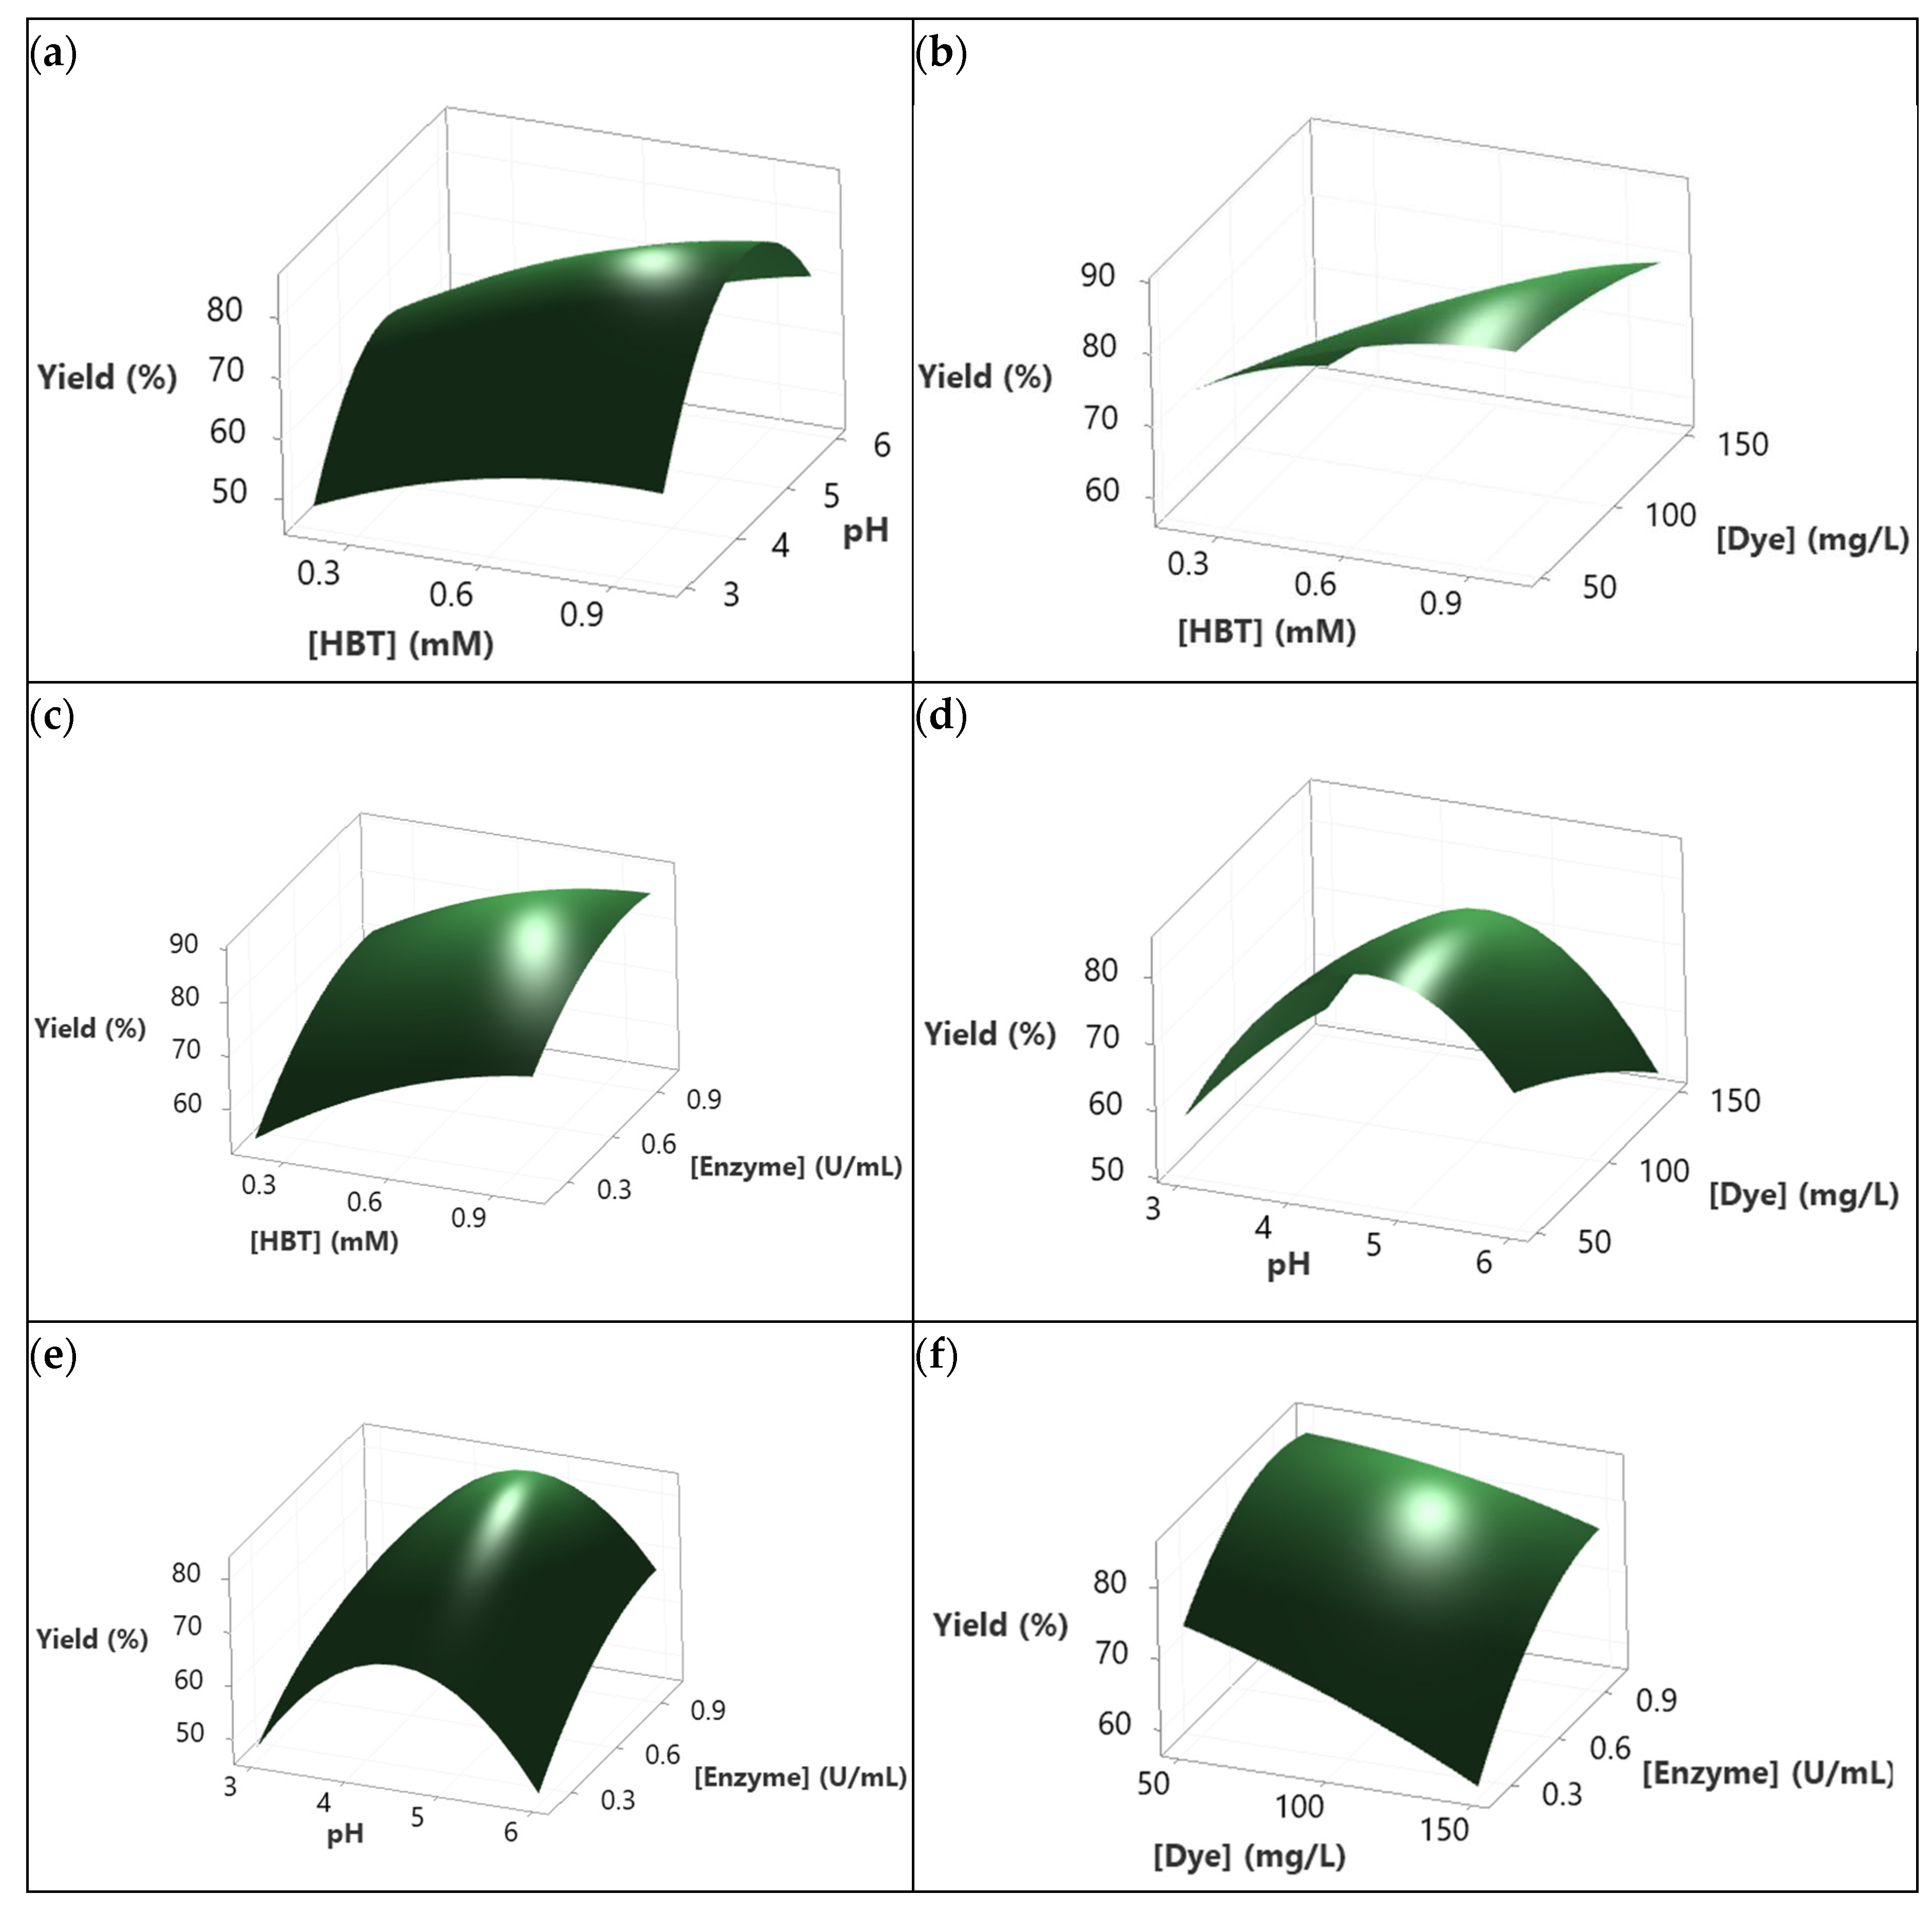
Figure 5.
Pareto chart of the standardized effects of the Sirius grey decolorization rate (%/min) (p < 0.05).
Figure 5.
Pareto chart of the standardized effects of the Sirius grey decolorization rate (%/min) (p < 0.05).
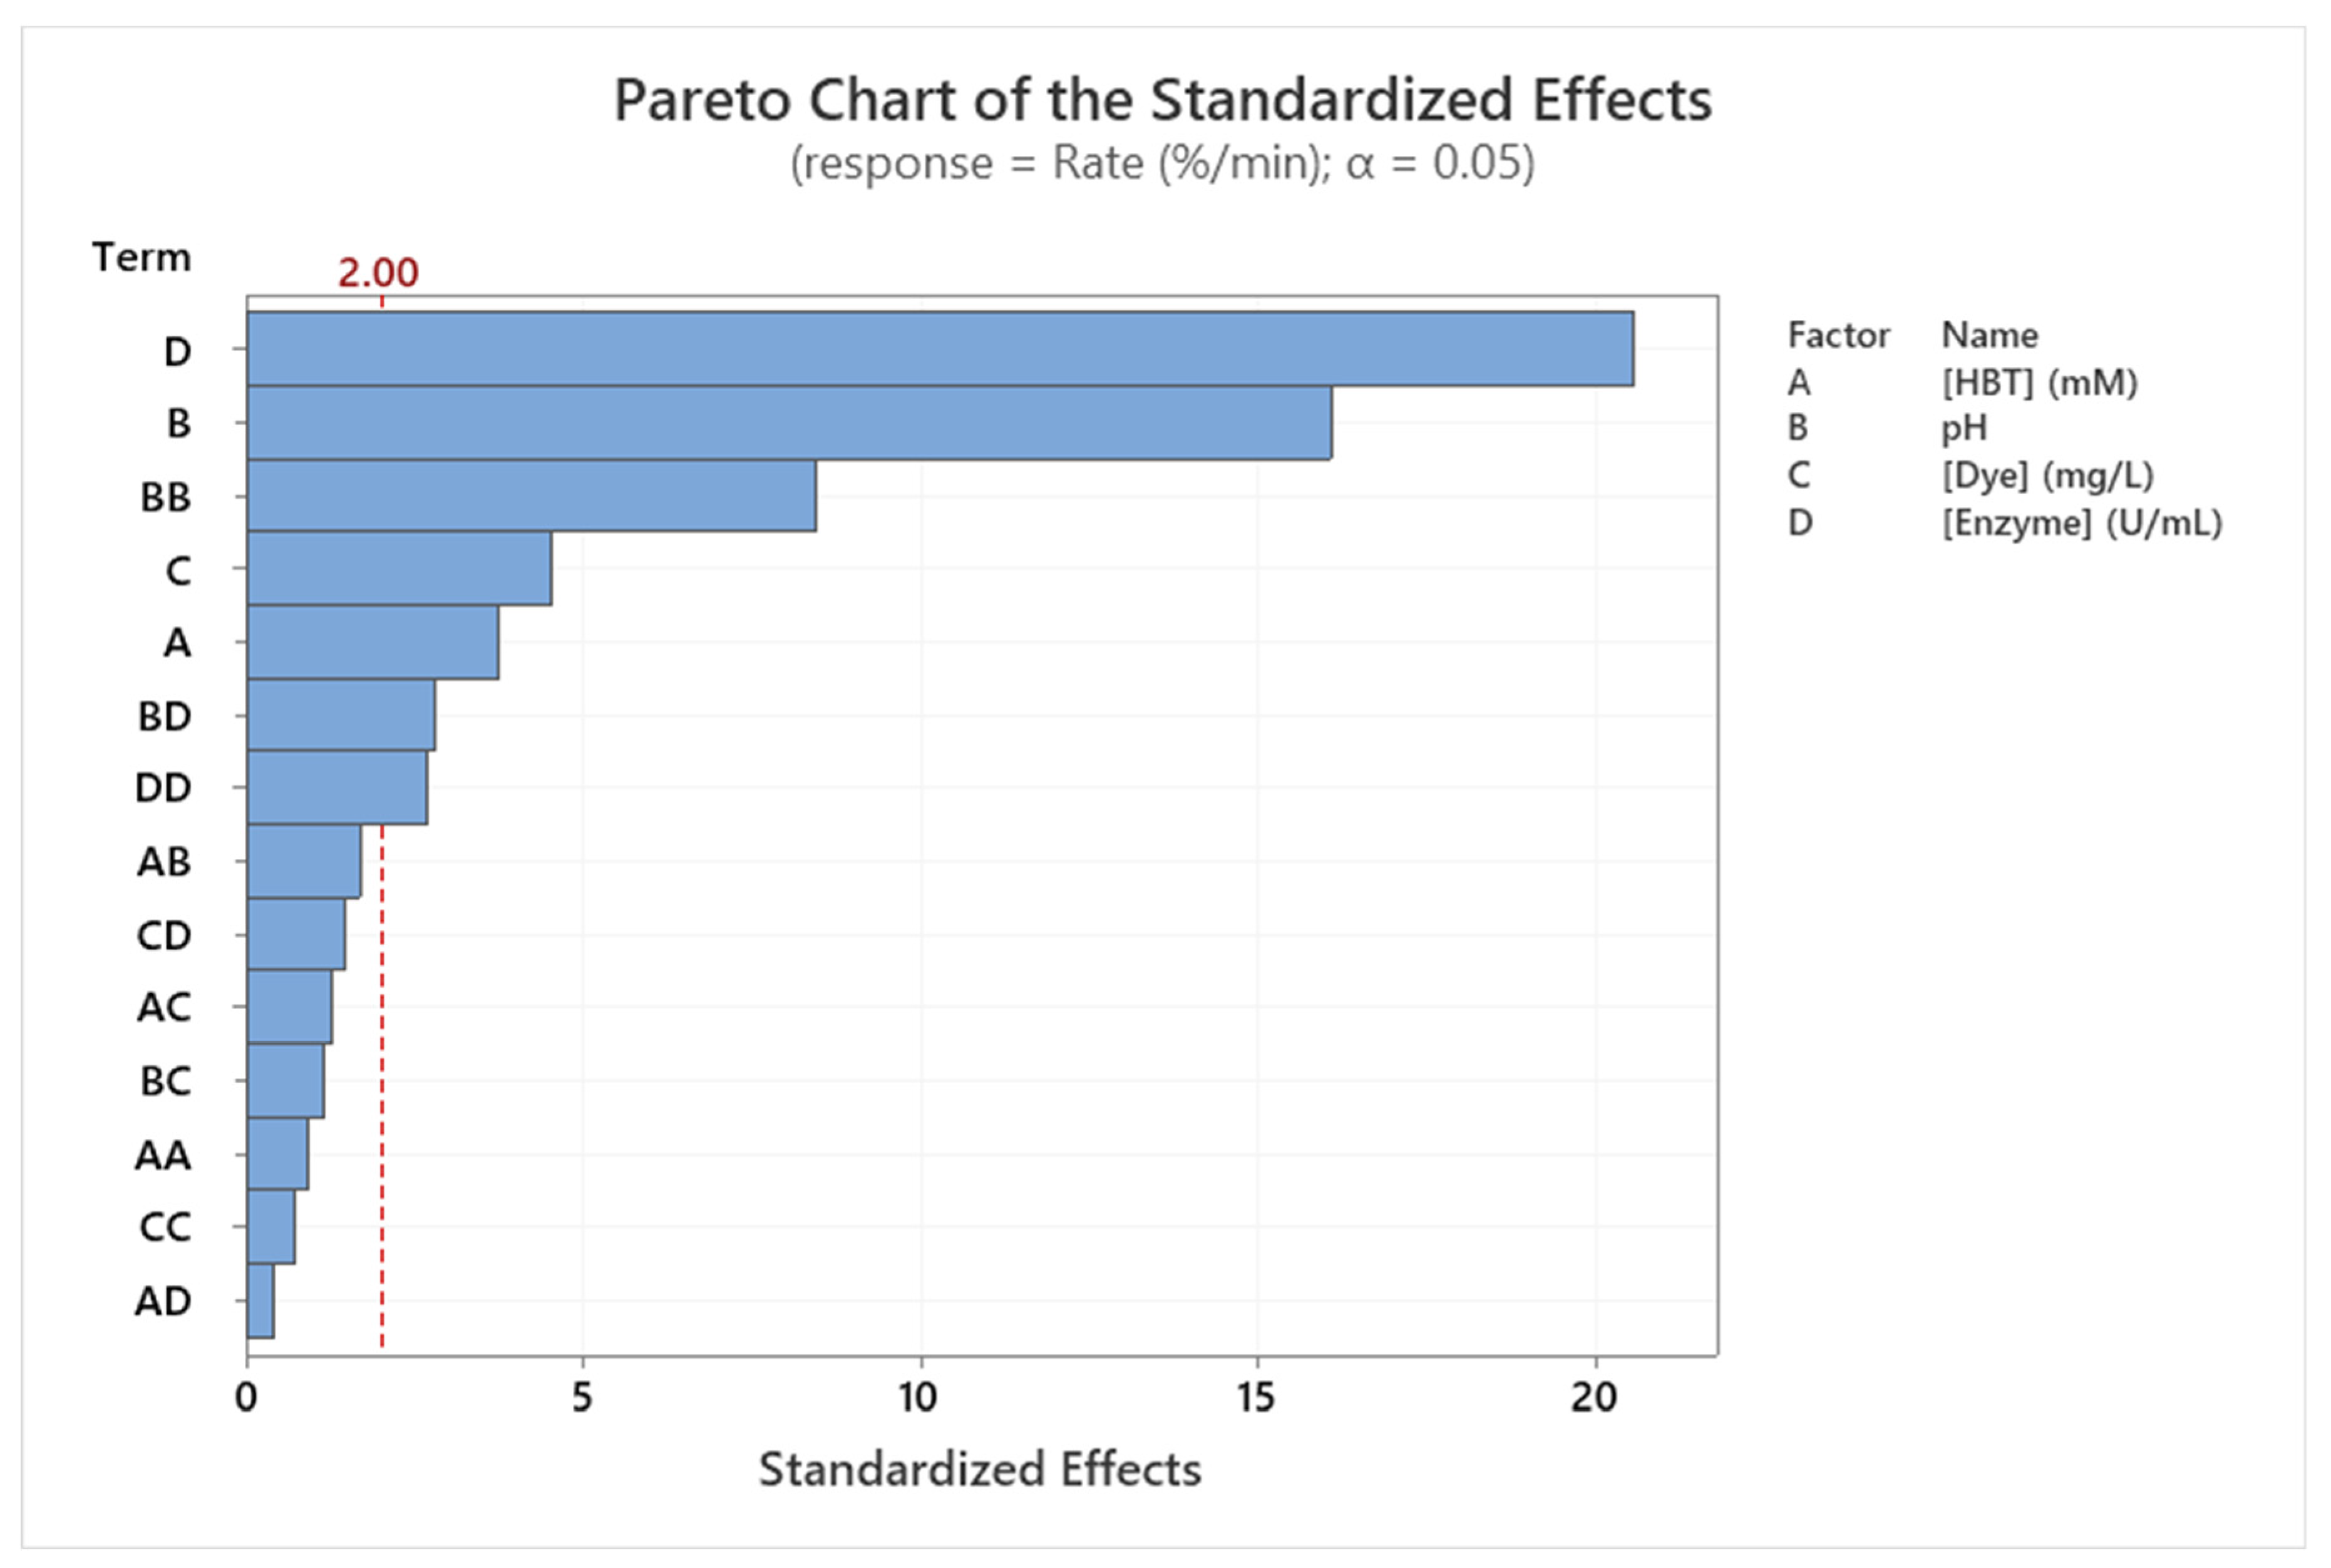
Figure 6.
3D-Surfaces response of Sirius grey decolorization rate as function of: (a) [HBT] and pH; (b) [HBT] and [Dye]; (c) [HBT] and [Enzyme]; (d) pH and [Dye]; (e) pH and [Enzyme]; (f) [Dye] and [Enzyme]. All other factors are fixed at central level.
Figure 6.
3D-Surfaces response of Sirius grey decolorization rate as function of: (a) [HBT] and pH; (b) [HBT] and [Dye]; (c) [HBT] and [Enzyme]; (d) pH and [Dye]; (e) pH and [Enzyme]; (f) [Dye] and [Enzyme]. All other factors are fixed at central level.
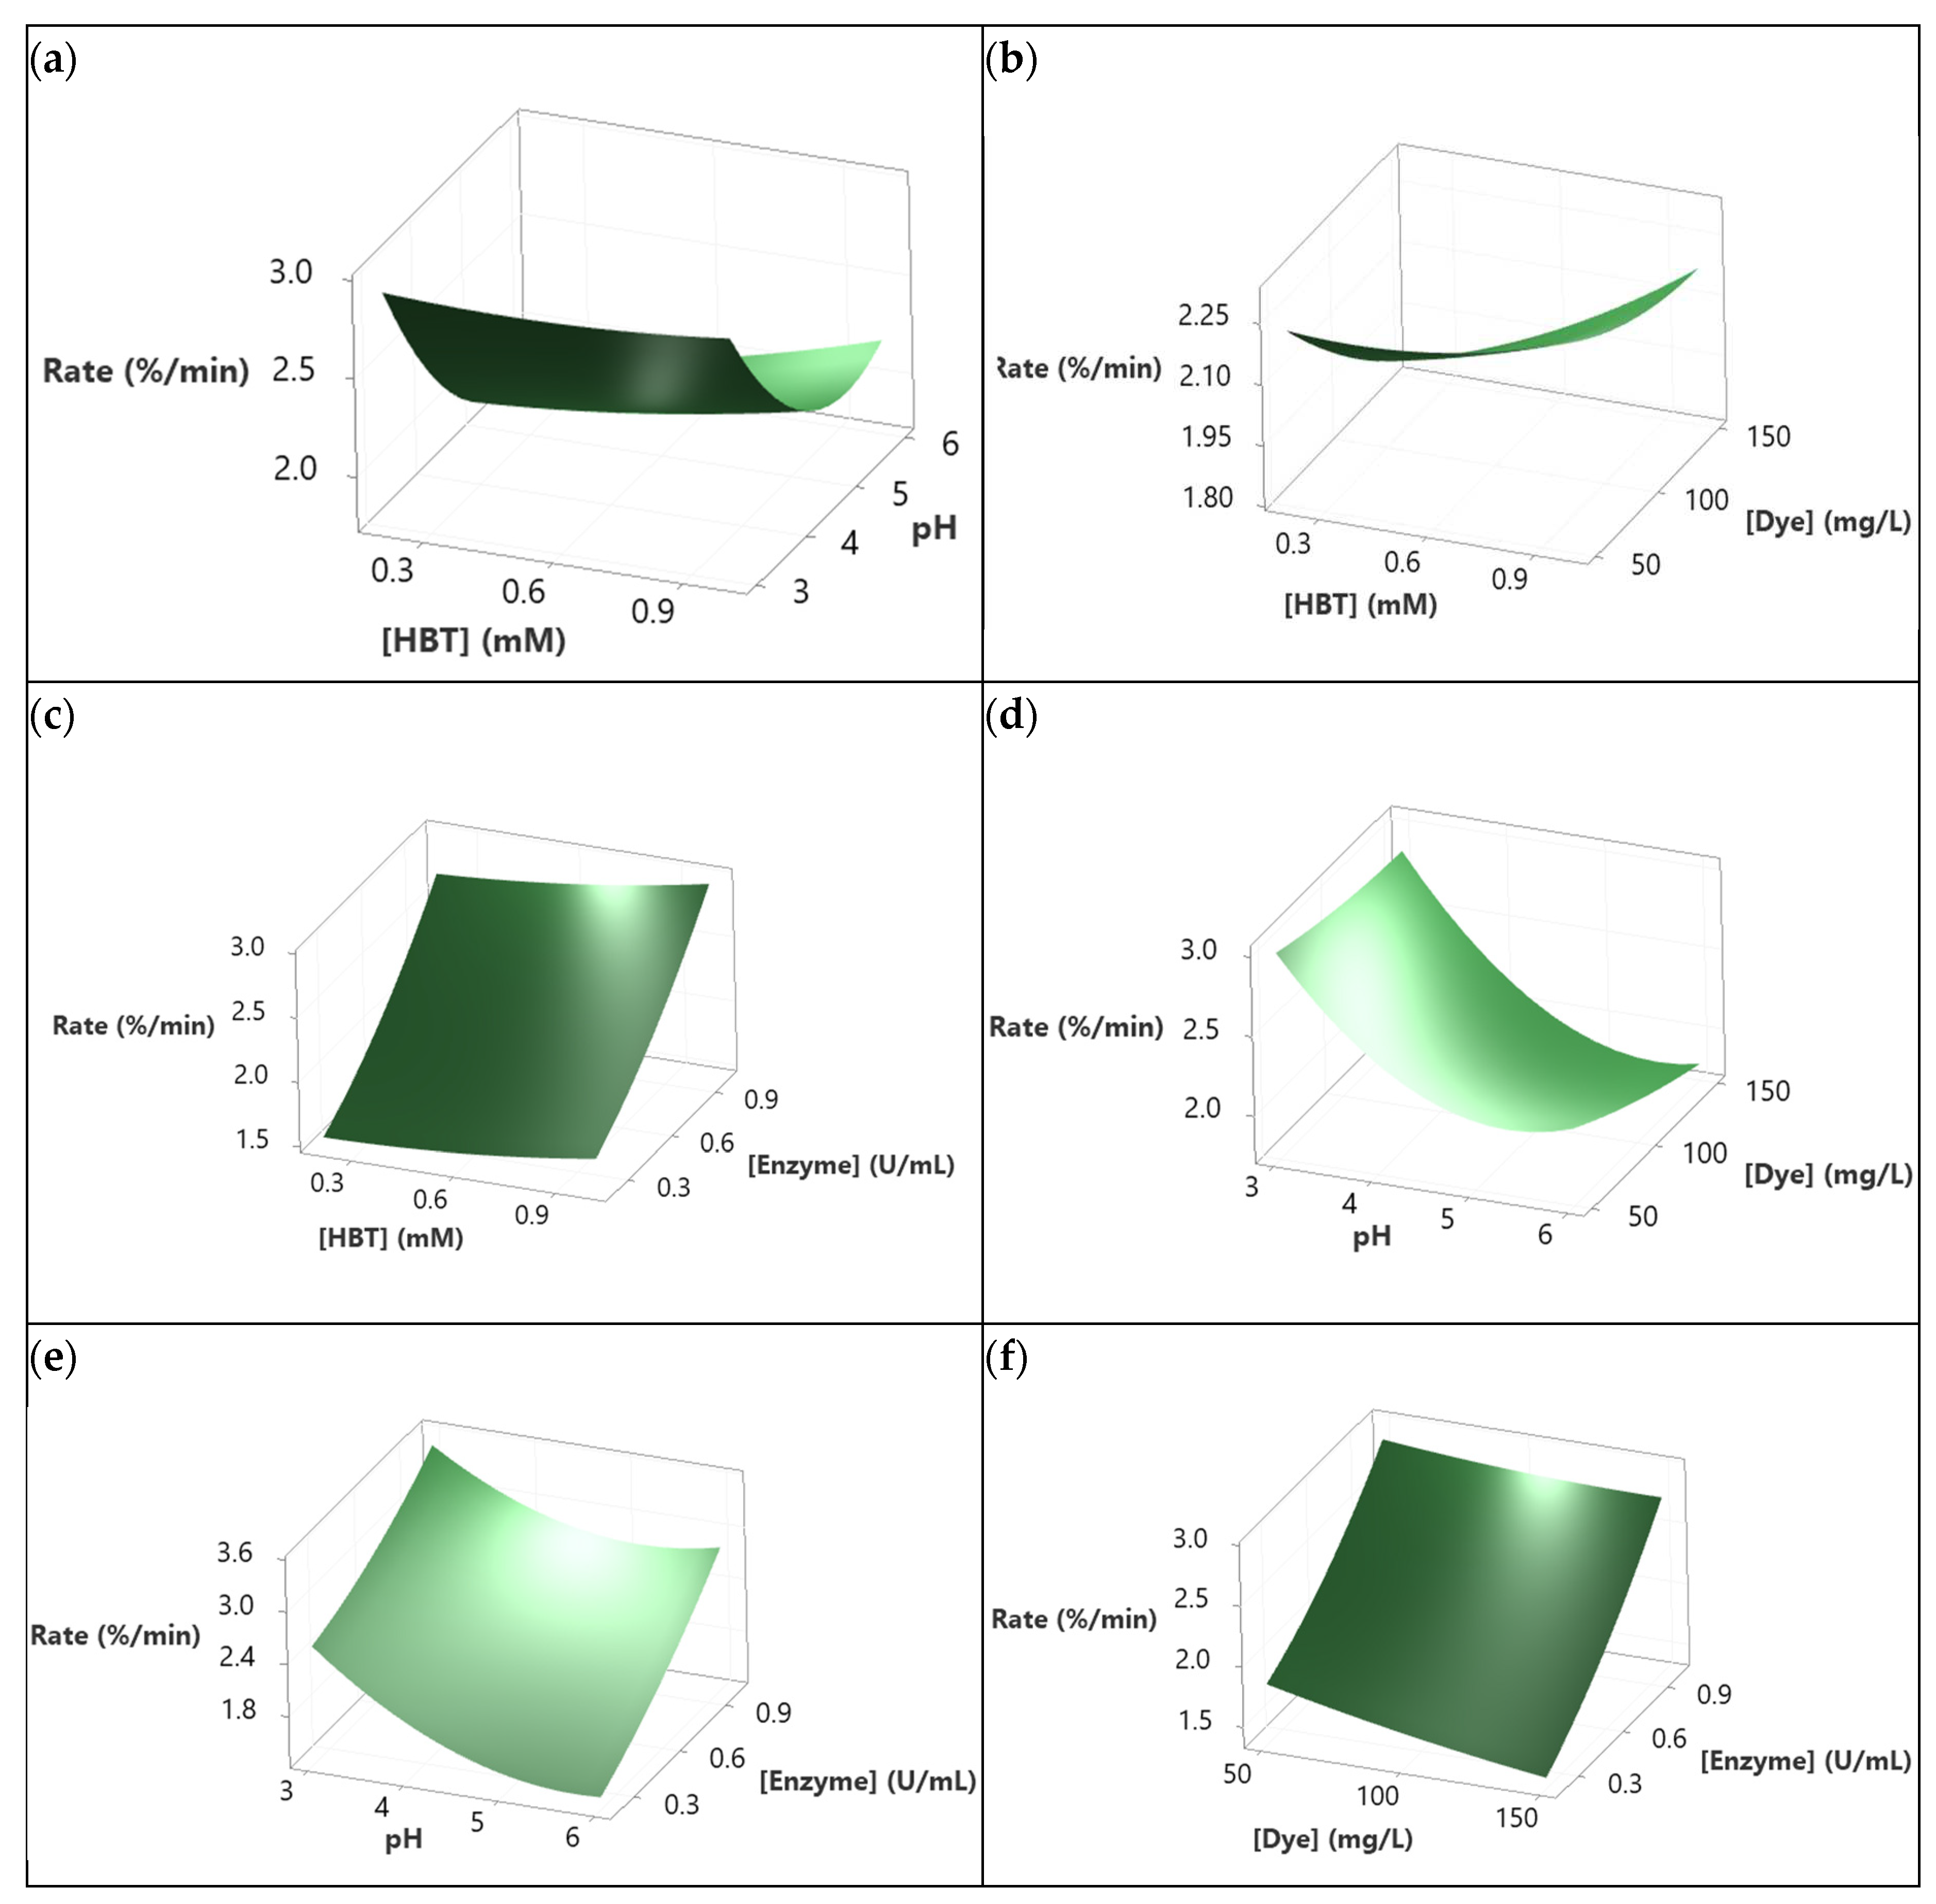
Figure 7.
Optimal conditions determination for Sirius grey decolorization.
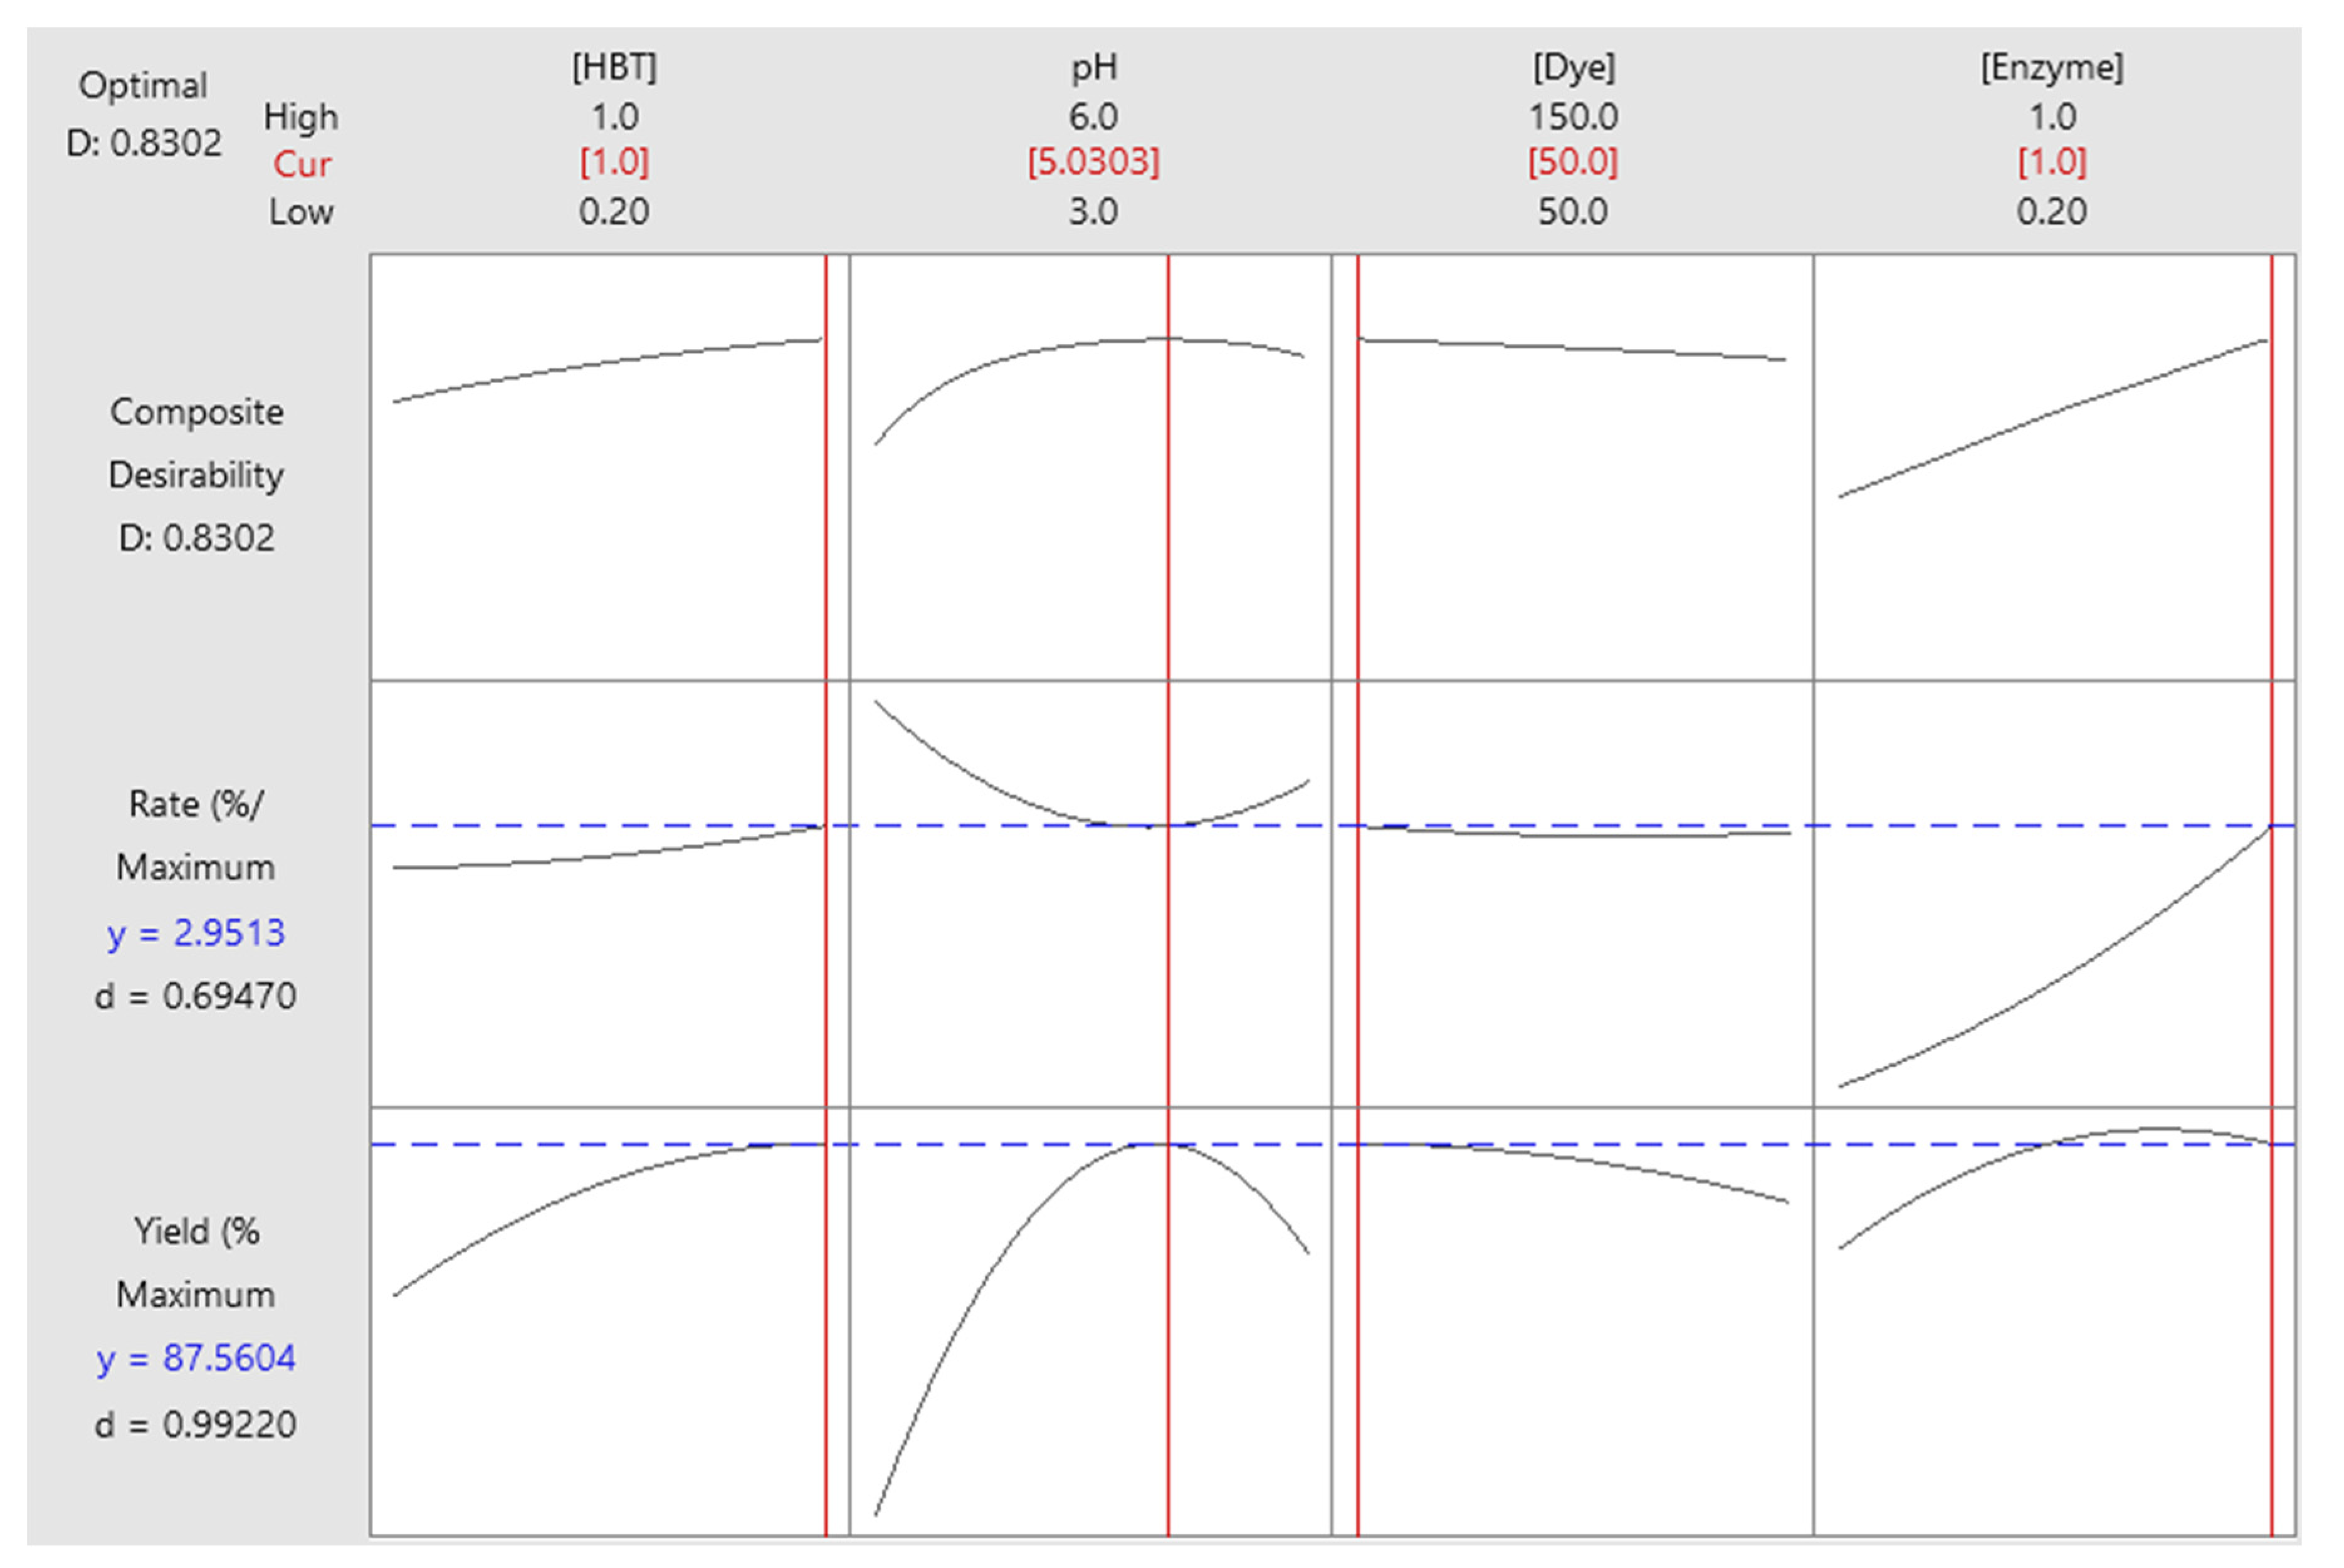
Figure 8.
Effects of treated and non-treated Sirius grey solutions on the germination index of Raphanus sativus (T: treated; NT: non-treated).
Figure 8.
Effects of treated and non-treated Sirius grey solutions on the germination index of Raphanus sativus (T: treated; NT: non-treated).
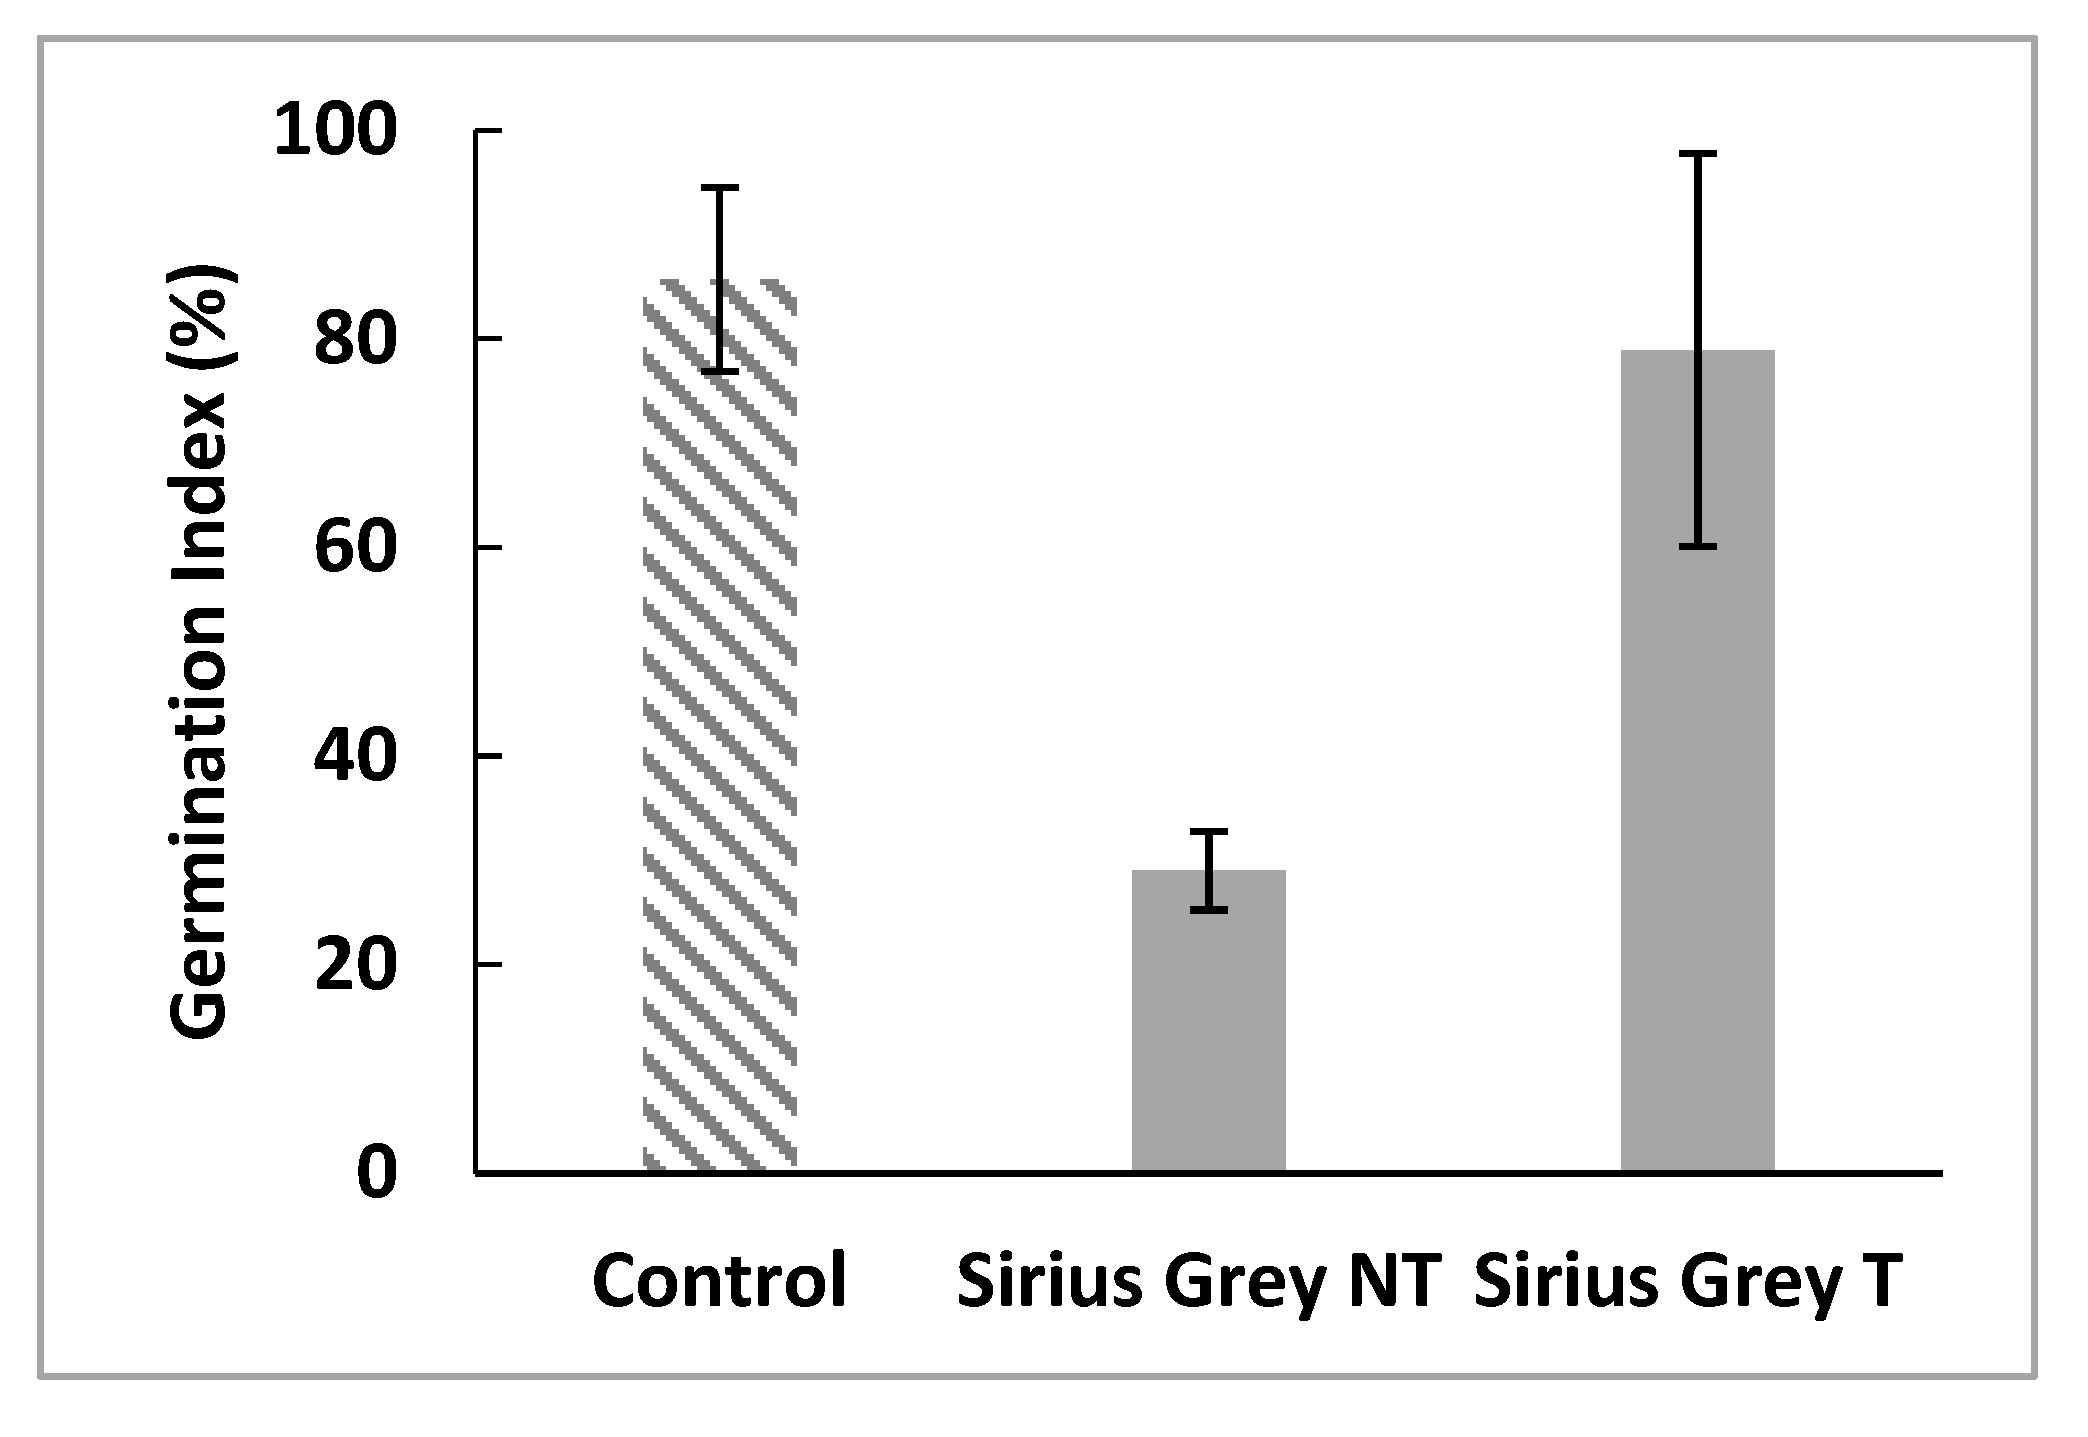

Table 1.
Properties of the azo dye Sirius Grey GB (Direct Black 76).
| Properties | Sirius grey GB |
|---|---|
| CAS number | 6409-87-6 |
| Molecular weight (g mol−1) | 1193.99 |
| EC Number | 241-164-5 |
| CI | 35865 |
| Empirical formula | C46H27N11O15S4.4Na |
| Other names | Direct black 76 |
| λmax (nm) | 610 |
| Number azo bonds | 4 |
Table 2.
GenBank sequences used to calculate the phylogenetic tree.
| Species | Culture collection designation | ITS accession number |
|---|---|---|
| C. gallica | BS9 | OR234862 |
| C. gallica | CBS547.50 | MH856754 |
| C. gallica | CBS429.34 | MH855593 |
| C. gallica | CBS428.34 | MH855592 |
| C. trogii | LE-BIN_3828 | OQ053212 |
| C. trogii | KM096 | OQ450434 |
| C. trogii | Han474 | ON796506 |
| Funalia subgallica | Dai6329 | KC867386 |
| F. subgallica | Cui6317 | KC867384 |
| F. subgallica | BJFC004185 | NR_174714 |
Table 3.
Coded and uncoded levels of tested factors.
| Coded levels | -1 | 0 | +1 | |
|---|---|---|---|---|
| Factor | ||||
| Initial HBT concentration (mM) | 0.2 | 0.6 | 1 | |
| pH | 3 | 4.5 | 6 | |
| Initial dye concentration (mg/L) | 50 | 100 | 150 | |
| Initial enzyme concentration (U/mL) | 0.2 | 0.6 | 1 | |
Table 4.
Box-Behnken’s design of experiment applied to the decolorization process of Sirius Grey after 4h of enzyme incubation and obtained responses.
Table 4.
Box-Behnken’s design of experiment applied to the decolorization process of Sirius Grey after 4h of enzyme incubation and obtained responses.
| Run | [HBT] * | pH * | [Dye] * | [Enzyme] * | : yield (%) | : rate (%/min) |
|---|---|---|---|---|---|---|
| 1 | -1 | -1 | 0 | 0 | 49.91 ± 2.73 | 2.93 ± 0.15 |
| 2 | 1 | -1 | 0 | 0 | 53.23 ± 1.41 | 2.87 ± 0.16 |
| 3 | -1 | 1 | 0 | 0 | 56.07 ± 0.53 | 1.81 ± 0.02 |
| 4 | 1 | 1 | 0 | 0 | 72.14 ± 0.09 | 2.09 ± 0.01 |
| 5 | 0 | 0 | -1 | -1 | 77.63 ± 0.90 | 1.81 ± 0.08 |
| 6 | 0 | 0 | 1 | -1 | 60.25 ± 0.88 | 1.29 ± 0.06 |
| 7 | 0 | 0 | -1 | 1 | 85.04 ± 1.28 | 2.90 ± 0.24 |
| 8 | 0 | 0 | 1 | 1 | 76.74 ± 1.39 | 2.67 ± 0.02 |
| 9 | -1 | 0 | 0 | -1 | 49.71 ± 1.63 | 1.43 ± 0.20 |
| 10 | 1 | 0 | 0 | -1 | 77.67 ± 0.04 | 1.68 ± 0.06 |
| 11 | -1 | 0 | 0 | 1 | 62.78 ± 0.77 | 2.63 ± 0.06 |
| 12 | 1 | 0 | 0 | 1 | 86.15 ± 0.14 | 2.96 ± 0.03 |
| 13 | 0 | -1 | -1 | 0 | 55.32 ± 0.93 | 2.68 ± 0.02 |
| 14 | 0 | +1 | -1 | 0 | 68.12 ± 2.81 | 2.13 ± 0.07 |
| 15 | 0 | -1 | +1 | 0 | 51.41 ± 1.03 | 2.82 ± 0.09 |
| 16 | 0 | +1 | +1 | 0 | 50.97 ± 0.52 | 2.03 ± 0.03 |
| 17 | -1 | 0 | -1 | 0 | 73.49 ± 1.05 | 2.38 ± 0.13 |
| 18 | 1 | 0 | -1 | 0 | 87.02 ± 1.33 | 2.51 ± 0.16 |
| 19 | -1 | 0 | +1 | 0 | 58.07 ± 0.80 | 1.83 ± 0.12 |
| 20 | 1 | 0 | +1 | 0 | 79.86 ± 1.53 | 2.21 ± 0.12 |
| 21 | 0 | -1 | 0 | -1 | 49.51 ± 1.01 | 2.82 ± 0.07 |
| 22 | 0 | +1 | 0 | -1 | 40.14 ± 2.03 | 1.37 ± 0.22 |
| 23 | 0 | -1 | 0 | +1 | 64.32 ± 1.21 | 3.63 ± 0.12 |
| 24 | 0 | +1 | 0 | +1 | 65.57 ± 1.33 | 2.74 ± 0.02 |
| 25 | 0 | 0 | 0 | 0 | 79.69 ± 1.01 | 2.17 ± 0.22 |
| 26 | 0 | 0 | 0 | 0 | 79.01 ± 0.51 | 1.98 ± 0.08 |
| 27 | 0 | 0 | 0 | 0 | 79.19 ± 0.83 | 2.04 ± 0.11 |
* Factor levels are presented in coded values.
Table 5.
ANOVA results of Sirius grey decolorization yield.
| Source | DF | SS | MS | F | p |
|---|---|---|---|---|---|
| Regression | 14 | 13290.4 | 949.3 | 51.63 | < 0.001 *** |
| Linear | 4 | 6062.2 | 1515.5 | 82.43 | < 0.001 *** |
| A: Initial [HBT] | 1 | 2810.8 | 2810.8 | 152.87 | < 0.001 *** |
| B: pH | 1 | 214.7 | 214.7 | 11.68 | 0.001 *** |
| C: Initial [Dye] | 1 | 1200.9 | 1200.9 | 65.31 | < 0.001 *** |
| D: Initial [Enzyme] | 1 | 1835.8 | 1835.8 | 99.85 | < 0.001 *** |
| Square | 4 | 6761.1 | 1690.3 | 91.93 | < 0.001 *** |
| A × A | 1 | 197.8 | 197.8 | 10.76 | 0.002 ** |
| B × B | 1 | 6202.5 | 6202.5 | 337.34 | < 0.001 *** |
| C × C | 1 | 26.5 | 26.5 | 1.44 | 0.234 |
| D × D | 1 | 374.7 | 374.66 | 20.38 | < 0.001 *** |
| Interaction | 6 | 467.1 | 77.86 | 4.23 | 0.001 *** |
| A × B | 1 | 121.9 | 121.92 | 6.63 | 0.012 * |
| A × C | 1 | 51.3 | 51.25 | 2.79 | 0.100 |
| A × D | 1 | 15.8 | 15.80 | 0.86 | 0.357 |
| B × C | 1 | 131.6 | 131.61 | 7.16 | 0.009 ** |
| B × D | 1 | 84.6 | 84.64 | 4.60 | 0.036 * |
| C × D | 1 | 61.9 | 61.93 | 3.37 | 0.071 |
| Error | 66 | 1213.5 | 18.39 | ||
| Total | 80 | 14503.9 |
DF: degree of freedom; SS: sum of squares; MS: mean square; F: Fisher value; p: probability value; *** Very highly significant (p < 0.001); ** Very significant(p < 0.010); * Significant (p < 0.050).
Table 6.
ANOVA results of Sirius grey decolorization rate.
| Source | DF | SS | MS | F | p |
|---|---|---|---|---|---|
| Regression | 14 | 24.348 | 1.739 | 57.96 | < 0.001*** |
| Linear | 4 | 21.498 | 5.375 | 179.11 | < 0.001*** |
| A: Initial [HBT] | 1 | 0.420 | 0.420 | 13.99 | < 0.001*** |
| B: pH | 1 | 7.767 | 7.767 | 258.85 | < 0.001*** |
| C: Initial [Dye] | 1 | 0.612 | 0.612 | 20.41 | < 0.001*** |
| D: Initial [Enzyme] | 1 | 12.699 | 12.699 | 423.19 | < 0.001*** |
| Square | 4 | 2.369 | 0.592 | 19.73 | < 0.001*** |
| A × A | 1 | 0.026 | 0.026 | 0.86 | 0.357 |
| B × B | 1 | 2.137 | 2.137 | 71.22 | < 0.001*** |
| C × C | 1 | 0.015 | 0.015 | 0.51 | 0.479 |
| D × D | 1 | 0.214 | 0.214 | 7.14 | 0.009** |
| Interaction | 6 | 0.481 | 0.080 | 2.67 | 0.022* |
| A × B | 1 | 0.086 | 0.086 | 2.85 | 0.096 |
| A × C | 1 | 0.048 | 0.048 | 1.61 | 0.209 |
| A × D | 1 | 0.005 | 0.005 | 0.18 | 0.672 |
| B × C | 1 | 0.041 | 0.041 | 1.36 | 0.248 |
| B × D | 1 | 0.236 | 0.236 | 7.88 | 0.007** |
| C × D | 1 | 0.065 | 0.065 | 2.15 | 0.147 |
| Error | 66 | 1.981 | 0.030 | ||
| Total | 80 | 26.329 |
DF: degree of freedom; SS: sum of squares; MS: mean square; F: Fisher value; p: probability value; *** Very highly significant (p < 0.001); ** Very significant(p < 0.010); * Significant (p < 0.050).
Disclaimer/Publisher’s Note: The statements, opinions and data contained in all publications are solely those of the individual author(s) and contributor(s) and not of MDPI and/or the editor(s). MDPI and/or the editor(s) disclaim responsibility for any injury to people or property resulting from any ideas, methods, instructions or products referred to in the content. |
© 2023 by the authors. Licensee MDPI, Basel, Switzerland. This article is an open access article distributed under the terms and conditions of the Creative Commons Attribution (CC BY) license (http://creativecommons.org/licenses/by/4.0/).
Copyright: This open access article is published under a Creative Commons CC BY 4.0 license, which permit the free download, distribution, and reuse, provided that the author and preprint are cited in any reuse.


