Submitted:
05 December 2023
Posted:
07 December 2023
You are already at the latest version
Abstract
Surface processes such as coatings, corrosion, photocatalysis, and tribology are greatly diversified by acid-base interaction at the surface overlayer. This study focuses on the action of metallic copper surface as an electron donor/acceptor related to inactivation of viruses; it was found that regarding Cu2O or Cu materials electrostatic interaction plays a major role in virus inactivation. We applied TPPE method to clarify the mechanism of electron transfer (ET) occurring at light irradiated copper surfaces. The TPPE characteristics was strongly influenced by the environments, which correspond to the temperature and environment dependence of the total count of emitted electrons in the incident light wavelength scan (PE total count, NT), the photothreshold, and further the activation energy (E) analyzed from Arrhenius plot of NT values obtained in the temperature-increase and subsequent temperature-decrease processes. In this study we reexamined the dependence of the TPPE data from two types of Cu metal surfaces: Sample A, which was mechanically abraded in alcohols, water, and air, and Sample C, which was only ultrasonically cleaned in these liquids. The NT for both Samples slowly increased with increasing temperature, reached a maximum (NTmax) at 250C (maximum temperature, Tmax), and after that decreased. For Sample A the NTmax value decreased in the order H2O > CH3OH > C2H5OH > (CH3)2CHOH > C3H7OH, although the last alcohol gave Tmax = 100C, while with Sample C the NTmax value decreased in the order: C3H7OH > (CH3)2CHOH > C2H5OH > CH3OH > H2O. Interestingly, both orders of the liquids were completely opposite: this means that Cu surface can possess two-way character. The NT intensity was found to be strongly associated with the change of the hydroxyl group (Cu-OH) to the oxide oxygen (O2) in the O1s spectra in the XPS measurement. The difference between the above orders was explained by the acid-base interaction mode of the Cu-OH group with the adsorbed molecule on the surfaces. The H2O adsorbed on Sample A produces the electric dipole Cu-OH+---:OH2 (--- hydrogen bond), while the C3H7OH and (CH3)2CHOH adsorbed on Sample C produce ROH+---:O(H)-Cu (R = alkyl groups). Gutmann’s acceptor number (AN) representing the basicity of the liquid molecules was found to be related to the TPPE characteristics: (CH3)2CHOH (33.5), C2H5OH (37.1), CH3OH (41.3), H2O (54.8) (the AN of C3H7OH could not be confirmed). With Sample A the values of NTmaxa and EaUp1 both increased with increasing AN (Up1 means the 1st temperature-increase process). On the other hand, with Sample C the values of NTmaxc and EcUp1 both decreased with increasing AN. These findings suggest that Sample A acts as an acid, while Sample C functions as a base. However, in the case of both types of Samples A and C the NTmax values were found to increase with increasing EUp1. It was explained that the EUp1 values depending on the liquids originate from the difference in the energy level of the hydroxyl group radical at the surface denoted. This is able to attract electrons in the neighborhood of the Fermi level of the base metal by tunnelling. After that due to Auger emission electrons are released, leading to the ET in the overlayer. These electrons are considered to have a strong ability of reducibility.
Keywords:
TPPE
; Copper surface
; Electron transfer
; Photoelectron emission
; Abrasion
; Ultrasonic cleaning
; Temperature scan
; Wavelength scan
; Alcohols and water
; Acid and base interaction
; Activation energy
; Acc
1. Introduction
Excellent reviews on the function of metallic materials to deactivate viruses and bacteria have been reported [1,2,3]. The review [1] focuses on chemical nature of metals in inactivation of viruses; however, researchers in different fields hold dissimilar views on the antiviral mechanisms; they hope that the review helps researchers in various fields to select suitable substrates for antiviral materials based on the chemical nature of metal elements. Further, emphasis is placed on the fact that the strong reducibility of metal nanoparticles may be the main reason for their efficient inactivation of viruses. This fact has prompted our attention to study how the chemical nature of reducibility on metallic copper may be related to the behavior of ET on copper metals adsorbed with alcohols, water, and air. In the reviews [1,2] it is described that there are two substances that can destroy viral proteins: hydroxyl radicals and superoxide ions, which are generated by Cu released from CuI in water; reactive hydroxyl radicals can be generated in a Fenton-type reaction. It is well known that corrosion requires both a continuous ionic path and electrical connection between the anode and cathode on the same location. The review [3] outlines that on atmospheric corrosion of copper surface oxidized in air, which corresponds to the environment of sample surfaces used in the present experiment, there is a thin film of aqueous solution, which enable corrosion processes to proceed. The typical cathodic reaction during copper corrosion is the oxygen reduction reaction. The mechanism produces hydrogen peroxide (H2O2) as an intermediate. This may result in the metal ion and hydrogen peroxide at the same or nearby sites. Further from the cathodic reduction of copper oxides (CuO and Cu2O) in a strongly alkaline electrolyte [4] it is assumed that there is the limiting thickness of the Cu2O layer. This results from competition of the disproportionation reaction (Cu + CuO →Cu2O) and the CuO formation (Cu2O + (1/2)O2 →2CuO), and it is suggested that Cu(OH)2 plays an initial key role in the growth of the corrosion layer.
Surface processes are further diversified by acid-base interaction at the surface overlayer. Acid-base reactions between adsorbate and metal oxide or hydroxide/metal are strongly influenced by electron donor/acceptor governing the ET behavior at surface overlayer. We developed an extremely sensitive surface analysis technique of ET using photoelectron emission (PE), which is measured as a function of temperature. This method is called temperature programmed photoelectron emission (TPPE). We have reported several papers on the TPPE [5,6,7,8,9,10,11]. The photoelectric threshold and the intensity of a maximum PE appearing in the PE stimulation spectra for Cu metals was found to be markedly influenced by the presence of the oxide film [7]. The PE total count for copper surfaces abraded in organic liquids was found to be pronouncedly influenced by the functionality of the organics [8]. Further, the TPPE feature for the surfaces of 17 commercial metals was correlated with their surface chemical structure measured by XPS [9,10]. The metals used were distinctly classified into two main groups (A and B): the former indicated a temperature dependent PE total count, while the latter indicated a virtually temperature independent PE total count. The A group included Al, Pt, Pb, Cu, Ag, Au, and Ni; the B group included Ta, Ti, Mo, Pd, W, Fe, Co, Zn, Nb, and Sn [9,10]. Further, we have found that when a copper electrode was used in the electrochemical reduction of carbon dioxide, the copper surface exhibiting an increased PE total count tended to produce a greater amount of CH4 as the reduction product [11].
The purpose of the present study is to clarify the TPPE characteristics of metallic copper samples mechanically abraded in alcohols, water, and air, and ultrasonically cleaned in the liquids and further its relation to the properties of the liquids. We have already reported that two types of copper surfaces showed completely different TPPE behavior, but although it is of great interest, the reason why it occurs was not fully understood [5]. In this study in view of the importance of the surface treatment of metallic copper we tried to account for the mechanism of the TPPE based on the acid-base interaction.
First, we describe the important points of the TPPE method and briefly feature the present understanding of the TPPE results.
- (1)
-
The species and interaction modes appearing in the TPPE method are as follows:(a) the key functional group: −OH group adsorbed on the metal surface and its polarity; (b) the electron density of the oxygen of −OH group, which depends on the negative electric potential and the intensity of irradiated light; (c) the orientation of adsorbate molecules due to the acid-base interaction in the adsorption on the −OH group; (d) the formation of electric dipoles between the −OH group and adsorbate molecules; (e) the change of the components of O1s spectra before and after TPPE measurement.
- (2)
-
The dependence of TPPE on temperature and environment is quantified using PE stimulation spectra [5,6]. The following data and its relationship to the properties of the adsorbate molecules are obtained:
- (a)
- The total count of emitted electrons in the incident light wavelength scan (PE total count, NT), which may correspond to the transport distance of electrons released from the base metal.
- (b)
- The photothreshold representing the minimum photon energies needed to remove an electron from the surface of a material. But in this study the values were not estimated.
- (c)
- The activation energies of NT for all Cu samples were obtained from Arrhenius type equation of NT = A0NT exp (−ΔE/kT), where A0NT indicates the pre-exponential factor, k Boltzmann factor, and T Kelvin). This expression was applied to NT values in the temperature-increase and subsequent temperature-decrease processes.
- (d)
- The relation of activation energies of ΔEUp1 (Up1 indicates the 1st temperature increase process) to Gutmann’s acceptor number (AN) representing basicity and the reciprocal of dielectric constant (ε/ε0) of the used liquids is examined. Regarding contact killing of viruses by metals, the action of electrons accumulated in the neighborhood of the reaction cite is considered to be most essential according to ref. [1], because of the increase of the reducibility of the metal. As the electron emission mechanism will be described in detail later, electrons in the base metal are captured by hydroxyl group radicals adsorbed at the surface and then Auger emission occurs, giving rise to a PE stimulation spectrum. ΔE is considered to correspond to the trap depth of the hydroxyl group radical to attract electrons from the base metal. Further, we are interested in the relation of AN to 1/(ε/ε0) of the liquids, which represents the effect of the liquids to shield coulombic attractive force between positive and negative ions. It was found that the 1/(εε0) decreases with increasing AN for the liquids. The dependence of ΔE on 1/(ε/ε0) is clarified for the liquids.
- (3)
-
The relation of the TPPE to the XPS results is featured as follows:
- (a)
- Two components of O1s spectra: −OH (hydroxyl group) and O2−(oxide) are of great importance.
- (b)
- The increase of NT in PE stimulation spectra is confirmed to be strongly related to the increase of the intensity of −OH before the TPPE measurement. After the TPPE measurement only O2− component appears and the NT disappears. Although the detailed mechanism of the −OH group adsorbed at the surface is not clear, it is considered that it has the character of radical having the ability to attract electrons by tunnelling from the base metal, followed by Auger emission. The PE stimulation spectra appears as a result of the Auger emission. The ability for the hydroxyl group radical to attract electrons is influenced by the acid-base interaction between the −OH group and the liquids adsorbed around the −OH group, producing different ΔE.
2. Materials and Methods
2.1. Materials
Rolled copper sheets (Nilaco, thickness 0.1 mm, purity 99.9 %)) were used. The size of metal samples was 30×20 mm2 (for TPPE) and 3×3 mm2 (for XPS). Prior to use these sheets were pretreated by successively ultrasonic cleaning in n-hexane (5 min), distilled water (5 min), acetone (5 min), and distilled water (5 min). The volume of each liquid used was 50 ml, respectively. Finally, the samples were dried in a vacuum for 10 min. Before TPPE measurement a pretreated metal sheet was subjected to abrasion or ultrasonic cleaning in liquids of methanol (CH3OH), ethanol (C2H5OH), 1-propanol (C3H7OH), 2-propanol ((CH3)2CHOH) (all reagent grade), distilled water, and also for abrasion in ambient air. The treatment of metal sheets was conducted as follows: First a metal sheet was immersed in 50 ml of each liquid described above or exposed to ambient air in a glass beaker, and then was abraded by rotating an iron screw on the sheet surface at the rate of 300 rpm using an external magnetic stirrer at room temperature. The abrasion periods were 5, 10, and 30 min. The ultrasonic cleaning alone in the liquids was also performed for 5 min using an ultrasonic cleaner (Branson 1210J). After that the metal sheets were dried in a vacuum for 10 min.
2.2 TPPE and XPS
Figure 1 shows the arrangement of TPPE measurement apparatus [5]. It consists of the following parts: a UV light source (D2 lamp,30W), a monochromator, an electron counter with anode, the voltage of which was set at 1400 V, and a sample holder having a Nichrome wire heater. A −94 V negative potential relative to the grounded grid (denoted by a dotted line in Figure 1) was applied to the holder using a battery to accelerate and collect emitted electrons. The negative potential applied to the sample holder should be noticed to act the same action as the cathodic reduction in corrosion. The counter gas was Q gas (He and ~1% isobutane (iso-C4H10 ))and its flow rate was ~100 bubbles min−1. The PE intensity (indicated in the unit of count min−1) was measured by varying the wavelength of the light from 300 to 170 nm at the rate of 20 nm min−1. A spot of 0.5×5 mm2 on the sample was illuminated by the light. We call the curve of the PE intensity vs. wavelength a PE stimulation spectrum. For one sample the PE spectra were measured 12 times at different temperatures in the temperature-increase and subsequent temperature- decrease processes between 25 and 350°C (Usually the data for the temperature-increase process was employed). The measurement temperature was successively changed at the interval of 50 °C.
The XPS spectra of Cu2p, CuLMM, O1s, and C1s before and after TPPE measurement were measured on a Shimadzu ESCA 750 spectrometer with an X-ray source of Mg Kα (8 kV and 30 mA), and processed with an ESCAPAC 760 analyzer. It should be noted that before and after the TPPE measurement the samples were once exposed to ambient air to move the samples to the XPS spectrometer. The start-stop energy and the response factor for the XPS spectra used to obtain the elemental composition were as follows: Cu2p (965−925 eV, 24.1), Ols (540−528 eV, 2.9), and C1s (300−280 eV, 1.0). The binding energy of these spectra was corrected by assigning the main carbon component to the binding energy of 285 eV.
3. Results and Discussion
3.1. PE stimulation Spectra and TPPE Plot
Figure 2 shows typical PE stimulation spectra at 250°C for Cu abraded in CH3OH for various periods [5]. The intensity of PE increases progressively and reaches a maximum, followed by a decrease with decreasing wavelength of the light (or increasing photon energy). The PE intensity of the peak in the PE stimulation spectrum decreases and interestingly shifts to a shorter wavelength with increasing abrasion period. We call the total number of emitted electrons in the PE stimulation spectra PE total count (NT).
Figure 3 shows the TPPE plots of NT vs temperature during the 1st and 2nd temperature-increase and subsequent temperature-decrease processes for copper samples (Sample A) abraded for 10 min in various environments: (1) H2O, (2) CH3OH, (3) C2H5OH, (4) (CH3)2CHOH, (5) C3H7OH, and (6) ambient air. This plot is called TPPE plot. It should be noted that in TPPE plot, the corrected values of NT were used by deducting the natural count (1000 counts). The TPPE plot in the Up1 process exhibits a markedly different behavior from that in other processes; that is, in each environment the value of NT remains low at the initial stage, starts to increase at 100°C, and reaches a maximum at 250°C, followed by a decrease, except the TPPE plot for C3H7OH, which gives the maximum at 100°C, being completely different from other environments. Therefore, we have paid much attention in the TPPE plot in the Up1 process. For the abraded Cu samples the effect of the abrasion periods (5, 10, and 30 min) on the TPPE characteristics is featured as follows [5]. In the cases of H2O, CH3OH, and C2H5OH there was little difference in the NT values at low temperature, but the growth of NT values with increasing temperature was suppressed with an increase of the abrasion period, producing the most pronounced difference at 250−300°C. The values of NT became very small at 350°C. A striking observation in these cases is that the NT value yielded a distinct maximum at 250−300°C. This maximum tended to appear at higher temperature and clearly the level of the maximum NT for CH3OH and C2H5OH lowered with increasing abrasion period, although in the case of H2O, the maximum decreased in the order: 10 min > 5 min > 30 min. In the case of the abraded samples two small broad peaks appear around 100°C and 250−300°C for C3H7OH, and one peak appears at 300°C for (CH3)2CHOH, resulting in a very small effect of the abrasion period on the TPPE plot. Concerning the state of the metal surfaces it was found that the surface abraded in C3H7OH becomes apparently bare compared to that in CH3OH. In the case of air, the TPPE plots of the abraded surfaces for the abrasion periods yielded a similar shape with a maximum around 250−300°C. This result shows that the TPPE was nearly constant independently of the abrasion period.
Figure 4 shows the TPPE plots of NT vs temperature during the 1st and 2nd temperature-increase and subsequent temperature-decrease processes for copper samples (Sample C) ultrasonically cleaned for 5 min in various liquids: (1) H2O, (2) CH3OH, (3) C2H5OH, (4) (CH3)2CHOH, and (5) C3H7OH. In the case of CH3OH, and C2H5OH, the NT values for samples only ultrasonically cleaned were comparable with those for the 10-min abraded samples. In the case of H2O, the NT for 10-min abrasion sample was greatly larger than that for the sample ultrasonically cleaned in the liquid. In the cases of C3H7OH and (CH3)2CHOH, interestingly a great difference was observed in the levels of NT values between the ultrasonically cleaned and abraded samples; that is, the TPPE plot for the ultrasonically cleaned sample exhibited a distinct maximum at 250°C, while that for the abraded samples gave a decreased level in the entire temperature range.
Here, it should be noted that TPPE plots in the processes other than Up 1, that is, those in Down 1, and Up 2 and Down 2 scans shown in Figure 3 and Figure 4 will be referred to later. Down 1 scan was applied for all the environments, and the Up 2 and Down 2 scans for H2O (Figure 3) and C3H7OH (Figure 4), which yielded the largest NT value, in each case. It is confirmed that in these processes the NT values slowly increases with decreasing temperature and the levels of the NT values are almost similar. We will describe the mechanism for PE occurring through Cu2O.
3.2. Dependence of TPPE Plots on Environments
Figure 5 shows the dependence of TPPE plots for copper samples subjected to ultrasonic cleaning and 10-min abrasion on the alcohols and water including the data points for air. In each sample the TPPE plots exhibit a similar trend for the environments except that for 10-min abrasion in C3H7OH. The PE total count (NT) slowly increases, reaches a maximum, and then decreases. In the case of 10-min abrasion (Sample A) the NT value at 250°C considerably decreased in the order H2O > CH3OH > C2H5OH > (CH3)2CHOH > C3H7OH. On the other hand, in the case of ultrasonic cleaning (Sample C) the NT value decreased in the order: C3H7OH > (CH3)2CHOH > C2H5OH > CH3OH > H2O. The orders of two samples were completely opposite. This finding triggered the present study.
3.3. XPS Spectra and XPS Characteristics
Figure 6 shows XPS spectra before and after TPPE measurement for copper sheets subjected to only ultrasonic cleaning for 5 min in the liquids and mechanical abrasion for different periods of 5 min, 10 min, and 30 min in the liquids and ambient air: (a, b) H2O, (c, d) CH3OH, (e, f) C2H5OH, (g, h) (CH3)2CHOH, (i, j) C3H7OH, (k, l) ambient air. We paid attention to three points of CuLMM, O1s, and the shake-up satellite structure 6−10 eV above the main Cu2p peak.
The XPS spectra and characteristics are summarized as follows [5].
- (1)
- The atomic ratio of O1s/Cu2p for Cu ultrasonically cleaned alone in the liquids tended to decrease in the order H2O ≈ CH3OH > C2H5OH > (CH3)2CHOH ≈ C3H7OH. This may be related to the order of the amount of H2O being adsorbed on the surfaces after cleaning in each liquid because the adsorption of H2O most strongly decreases the NT as shown in Figure 5 (below). However, in the other cases there was little relation between the NT and the order of O1s/Cu2p and C1s/Cu2p.
- (2)
- The assignment of the XPS spectra before and after TPPE measurement in Figure 6 were conducted based on refs. [12,13,14,15] and our previous reports [7,9]. The assignment of the XPS spectra on copper and oxygen is summarized as follows. The binding energy for the oxidation state of Cu is known as follows: 932.5 eV (Cu0 and Cu+) and 933.5 eV(Cu2+) for Cu2p3/2; 335 eV (Cu0) and 337 eV (Cu+ and Cu2+) for CuLMM; a strong shake-up satellite structure 6−10 eV above the main Cu2p peak in Cu2+ compounds. Concerning the Ols peak, Evans [13] suggested that two components appearing at 529.9 eV and 532.5 eV for the oxygen chemisorbed copper can be assigned to oxygen bonded directly to copper and oxygen adsorbed onto the initial Cu-O structure, respectively. McIntyre et al. [14] also suggested that the oxygen component of higher binding energy component includes the species such as OH, Cu(OH)2, and H2O. Recently the XPS spectra of tarnished copper plates of phosphor bronze (C1220) (Cu purity: > 99.9 %) was reported [15]. The binding energies of the Cu2p, the satellite, and O1s peaks were given as follows: Cu (932.6 eV), Cu2O (932.7 eV), and CuO (933.1 eV) for the Cu2p peak; 943~948 eV (Cu2O) and 940~945 eV (CuO) for the satellite peak; 531.7 eV (Cu(OH)2), 530.7 eV (Cu2O), and 529.8 eV (CuO) for the O1s peak [15].
- (3)
- Regarding CuLMM for every sample abraded and ultrasonically cleaned before TPPE measurement in Figure 6, metallic Cu clearlyappeared at 335 eV, but after TPPE measurement the metallic Cu greatly diminished for almost all samples. This finding suggested that the appearance of the metallic component before the TPPE measurement may be related to the increase in the PE intensity, but the detail of the mechanism remained unclear.
- (4)
- For the O1s peak shown in Figure 6, two components of Cu(OH)2 and Cu2O appearing at higher and lower binding energies, respectively, were preferential, but CuO component was negligible. Regarding CuO, the reaction of Cu2O + (1/2)O2 → CuO is considered to be unlikely because of the lack of O2 in the present experiment. The two components were observed for every sample before TPPE measurement, but after TPPE measurement in almost all cases the lower binding energy component became more preferential than the higher binding component, although for samples of 10-min abrasion in H2O and ultrasonic cleaning in air both components were still preferential. This finding suggested that the change from the OH component (hydroxyl group) to the O2− component (oxide ion) partially occurred being accompanying with the desorption of H2O. Here, we suppose that this OH has a property of a radical, having the ability to attract electrons from the base metal by tunnelling followed by Auger emission, leading to the PE under light irradiation, although the mechanism of TPPE is not fully understood. We emphasize that this process becomes a key point in the increase in the TPPE intensity, as described later.
- (5)
- We examine to clarify how the Cu2p3/2 and the satellite peaks can be associated with the adsorption of oxygen. Here, the binding energies for the observed spectra are represented by actually measured values in the experiment. In Figure 6, for a sample of 10-min abrasion in H2O before TPPE measurement a sharp main Cu2p peak at 935 eV, which can be assigned to Cu and Cu2O, and a broad shoulder peak at 937 eV in the higher binding energy region of the main Cu2p peak, which may originate from Cu(OH)2, were observed, and the satellite peak was clearly observed at 940−948 eV, which may be originated from Cu(OH)2 because the satellite grew with the increase in the shoulder peak. On the other hand, for a sample of ultrasonic cleaning in H2O before TPPE measurement in Figure 6, the sharp main peak was observed, but the satellite peak was very small. Similar behavior was observed for samples abraded in (CH3)2CHOH and air before TPPE measurement. In the case of samples abraded and ultrasonically cleaned in H2O, (CH3)2CHOH, and air after TPPE measurement the satellite peak was very small except samples abraded in H2O and ultrasonically cleaned in CH3OH. For both types of samples abraded and ultrasonically cleaned in C2H5OH and C3H7OH before and after TPPE measurement the satellite peak was almost negligible. This finding may suggest that the TPPE observed for C2H5OH and C3H7OH has little relation to the Cu(OH)2 component as the source of the satellite appearing in Cu2p peak. Finally, it is considered that the chemical structure of the metal surfaces before TPPE measurement is composed of adsorbate (alcohols, H2O, air)/Cu(OH)2/Cu2O/metallic Cu.
3.4. TPPE Characteristics for Sample A and Sample C and Their Relation to the Properties of Liquids
Figure 7 and Figure 8 show Arrhenius plots of ln(NTa) and ln(NTc) vs. 1/T (K−1) for Sample A and Sample C, respectively. TPPE characteristics for Sample A and Sample C are given in Table 1 and Table 2, respectively.
In Table 3 and Figure 9, the relation between the reciprocal of dielectric constant (ε/ε0)and acceptor number (AN) of the liquids are shown.
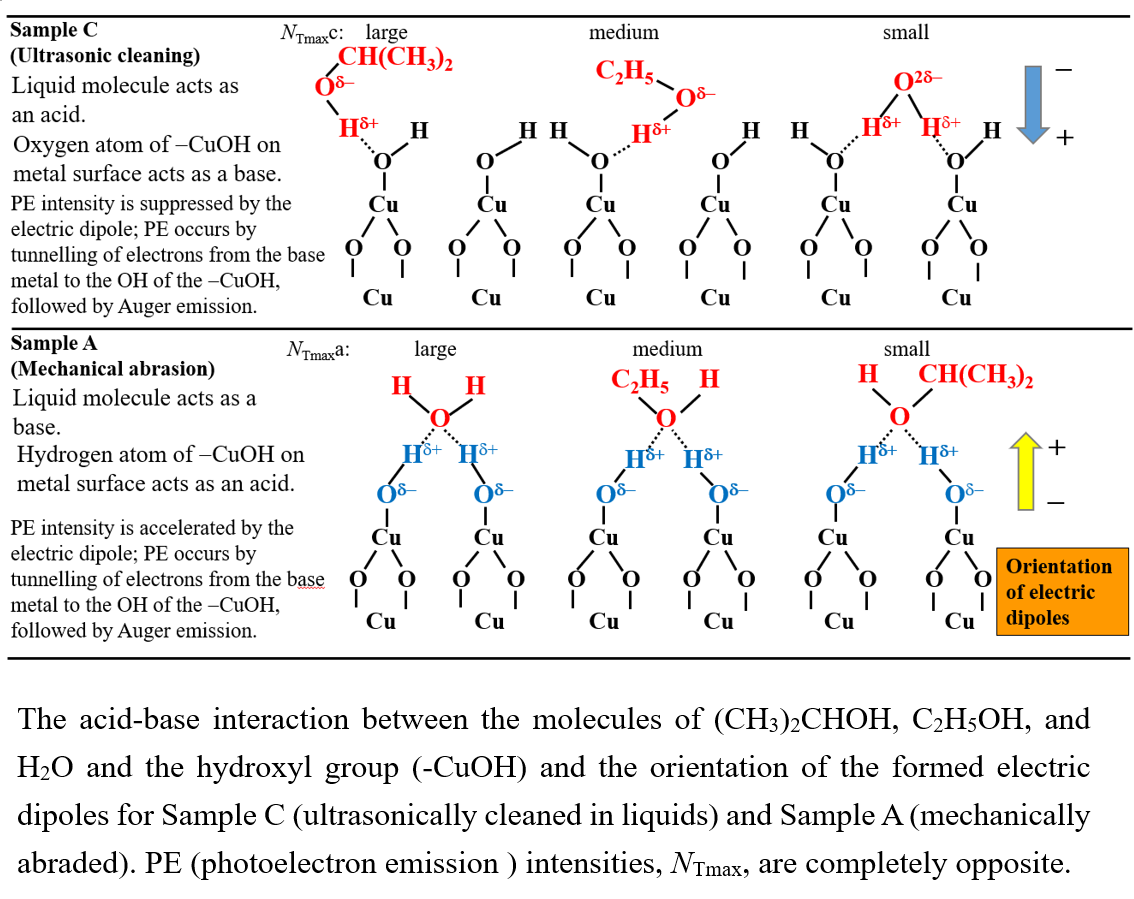
Figure 10 and Figure 11 show the relation between the TPPE characteristics and the properties of the liquids: NTmaxa, ΔEaUp1, AN, and 1/ε/ε0 for Sample A and NTmaxc, ΔEcUp1, AN, and 1/ε/ε0 for Sample C, respectively. At first, in Figure 12, we consider the adsorption of the molecules of alcohols and water on the surface hydroxyl group (Cu−OH) at the surface. It should be noted that Cu(OH)2 has been reported to play an initial key role in growth of the corrosion layer [4]. We consider that the acid-base property of Cu−OH can be determined by the electron density of the oxygen atom of the Cu−OH on the surface. We think that the oxide film of Sample A is much thinner than that of Sample C. Due to the bias of the negative potential and the light irradiation during the TPPE measurement, it is considered that the electron density of the oxygen of Sample A is low, but that of Sample C is high, the former acting as an acid, the latter as a base.
As a result, the Cu−OH of Sample A more strongly interacts with more basic liquid molecules, while that of Sample C more strongly acts with more acidic liquid molecules. Figure 12 shows the orientation of the electric dipole produced by the adsorbed molecule. As the property of the liquids, we used Gutmann’s acceptor number (AN) representing the basicity of the liquid molecules: (CH3)2CHOH (33.5), C2H5OH (37.1), CH3OH (41.3), and H2O (54.8). This was well related to the TPPE characteristics. With Sample A the values of NTmaxa and ΔEaUp1 (Up1 and Down1 mean the 1st temperature-increase and subsequent temperature-decrease processes, respectively) both increased with increasing AN (Table 1 and Figure 10). On the other hand, with Sample C the values of NTmaxc and ΔEcUp1 both decreased with increasing AN (Table 2 and Figure 11). Interestingly the characteristics of the TPPE for Sample A and Sample C take completely opposite trends to AN of the liquids. As another property of the liquids, we used the values of 1/ (ε/ε0). It is clear that the values of 1/ (ε/ε0) decreases with increasing AN (Table 3 and Figure 9). This suggests that the effect of electric charges in liquids having a higher value of AN is small. In Figure 10 and Figure 11 the relation of NTmaxa vs. AN, ΔEaUp1 vs. AN, and ΔEaUp1 vs 1/ε/ε0 for Sample A is completely opposite to that of NTmaxc vs. AN, ΔEcUp1vs AN, ΔEcUp1 vs. 1/ε/ε0 for Sample C. However, the relation of NTmaxa vs. ΔEaUp1 is similar to that of NTmaxc vs. ΔEcUp1, although the order of the liquids at the data points is opposite. It remains unclear why NTmax increases with increasing ΔEcUp1.
In ref. [2], regarding contact killing it is reported that a few general principles appear clear: higher copper content of alloys, higher temperature, and higher relative humidity increased the efficacy of contact killing. The behavior of electrons observed in the TPPE experiment may be related to the efficacy of contact killing by metallic Cu.
3.5. TPPE Mechanism and Its Relation to Activation Energy
We propose a model of PE based on the tunnelling of electron to the hydroxyl group radical (−Cu-OH●), followed by Auger emission and further the activation energy of PE, which is provided by the heat produced when −Cu-OH● attracted electrons from the base metal. Ramsey [16] emphasized that a model for exoemission due to chemisorption of electronegative gases on metals based on electron tunnelling followed by Auger emission is very promising.
The reason why we adopt the electron tunnelling model is described as follows: Reactive hydroxyl radical (OH) can be generated in a Fenton-type reaction [1,2]. The OH radical has a relatively great tendency to attract electrons to itself. This radical can be considered as one of electronegative gases. The electron affinity of OH is reported to be 1.83 eV [17]. In Figure 10d for Sample A, it was found that the NTmaxa values increase with increasing ΔEaUp1 in the 1st temperature-increase process. This relationship is completely inconsistent with the observation that the total count of electrons emitted during the Up1 scan decreases with increasing activation energy (ΔEUp1) for scratched Fe surfaces in Fig.10 of ref. [18]. The PE mechanism in the copper surfaces is more complicated. We think that the activation energies in the present copper surfaces cannot be explained by the ET taking place over energy barrier of the overlayer. A key reaction step on the surface during the TPPE measurement is represented by the partial change of the O1s spectra from OH component (Cu(OH)2) to O2−component (Cu2O).
Figure 13 shows a simple energy level diagram based upon electron tunnelling to adsorbed hydroxyl followed by Auger emission. According to the review of atmospheric corrosion [4], the chemical reactions can be represented by Equations (1)−(4),
Cu + H2O+ (1/2)O2 → Cu(OH)2
Cu(OH)2 → H2O + CuO
Cu + CuO → Cu2O
Cu2O + (1/2)O2 → CuO
In the thin film on the sample surface during the TPPE measurement, referring to the XPS results shown in Figure 6, Equations (1), (2), and (3) play an essential role for producing OH and O2−, where the Cu shows the route where the initial Cu atom is successively involved in the reactions. Equation (4) is not considered. The OH radical may be created at the spot composed of Cu, Cu(OH)2, and CuO under the light irradiation. This situation may be represented as the electron affinity curve of negative ion of OH approaching close to the surface under the control of the image force. We consider that the tunnelling of electrons at the Fermi level of the base metal to the OH trap level to attract electrons, producing heat in the same way as heat of adsorption used in surface chemistry. The depth of the trap level is influenced by the acid-base interaction of the liquids adsorbed near the OH. The produced heat as well as the irradiated light excites electrons from the Fermi level, leading to the PE stimulation spectrum. The activation energies obtained from the TPPE measurement corresponds to the depth of trap level.
3.6. TPPE in the Down1, Up2, and Down2 Scan Processes and Activation Energy
The TPPE plots during all the temperature-scan processes for Sample A and Sample C have been shown in Figure 3 and Figure 4, respectively. The values of ΔEaDown1, ΔEaUp2, and ΔEaDown2 for Sample A, and ΔEcDown1, ΔEcUp2, and ΔEcDown2 for Sample C are given in Table 1 and Table 2, respectively. It is seen that these values are negative and almost independent of the liquids, and further the absolute values of ΔEaDown1 were considerably smaller than those of ΔEaUp1. Regarding the electrical resistance of Cu2O (p-type semiconductor), it is found that the electrical resistance (ohm⋅cm) increases with decreasing temperature [19]. For the electrical resistance we obtained the activation energy of −0.774 eV by applying Arrhenius plot to the data in Fig. 13.3 of ref. [19]. The conductivity (σ) of Cu2O was investigated by Juse and Kurtschatow [20]. These authors found that the conductivity increases with increasing oxygen content of Cu2O. It was found that the conductivity of Cu2O can be represented by a formula (5), where ε1 = 0.7
eV, A1 ~100 cm−1⋅ohm−1, both being independent of the oxygen content, and ε2 varies between 0.129 and 0.134 eV, while A2 depends strongly on the oxygen content. For specimens with about 0.1 % by weight of excess oxygen, A2 ~ 0.3 cm−1⋅ohm−1. These authors suggested that the first term represents the conductivity of pure Cu2O, and that the second term represents the conductivity due to excess oxygen [20,21]. In the present TPPE experiment, we think that the adsorbates on the sample surface were fully desorbed by the temperature-increase scan to 350°C, leaving adsorbed oxygen. Comparing to the activation energies of the electrical resistance of −0.774 eV in ref. [19] and of the conductivity of ε1 = 0.7 eV [20,21], it is seen that the experimental values of TPPE obtained in the present experiment are remarkably small: for Sample A, ΔEaDown1 varies between −0.133 and −0.169 eV; ΔEaUp2 = −0.131 eV; ΔEaDown2 = −0.214 eV; for Sample C, ΔEcDown1 varies between −0.101 and −0.175 eV; ΔEcUp2 = −0.158 eV; ΔEcDown2 = −0.222 eV. We think that the PE from the base metal can be controlled by the electrical resistance or the conductivity of the overlayer. Therefore, the small values may be due to excess oxygen content in the Cu2O formed on the copper surfaces.
σ= A1e−ε1/ kT + A2e−ε2/ kT
Acknowledgments
The authors gratefully acknowledge Mr. Masakazu Honma and Suguru Kohno, who were the former students of the author, for performing the experiments of TPPE and XPS.
References
- Tian, H; He, B.; Yin, Y.; Liu, L.; Shi, J.; Hu, L.; Jiang, G. Chemical nature of metals and metal-based materials in inactivation of viruses. Nanomaterials 2022, 12(14), 2345. [CrossRef]
- Grass, G.; Rensing, C.; Solioz, M. Metallic copper as an antimicrobial surface. Appl. Environ. Microbiol. 2011, 77(5): 1541–1547. [CrossRef]
- Scully, J. R. The COVID-19 Pandemic, Part 1: Can antimicrobial copper-based alloys help suppress infectious transmission of viruses originating from human contact with high-touch surfaces? Corrosion, 2020, 76 (6): 523–527. [CrossRef]
- Nakayama, S; Notoya, T.; Osakai, T. Highly selective determination of copper corrosion products by voltammetric reduction in a strongly alkaline electrode. Anal. Sci. 2012, 28, 323-331. [CrossRef]
- Momose, Y.; Kohno, S; Honma, M.; Kamosawa, T. Temperature programmed photoelectron emission analysis of copper surfaces subjected to cleaning and abrasion in organic liquids. Proc. 2nd International conference in processing materials for properties (TMS, Warrendale, Pa. 2000) pp. 285-290.
- Momose, Y. Exoemission from processed solid surfaces and gas adsorption. Springer Series in Surface Sciences, Vol. 73. (Springer, 2023), pp.210-213. [CrossRef]
- Terunuma, Y.; Takahashi, K.; Yoshizawa, T.; Momose, Y. Temperature dependence of the photoelectron emission from intentionally oxidized copper," Appl. Surf. Sci. 1997, 115, 317-325. [CrossRef]
- Terunuma, Y.; Honma, M.; Takahashi, K.; Momose, Y. Photoelectron emission from copper freshly abraded in organic liquids, J. Surf. Finishing Soc. Jpn. 1996, 47, 1075-1081. (in Japanese). [CrossRef]
- Momose, Y.; Honma, M.; Kamosawa, T. Temperature-programmed photoelectron emission technique for metal surface analysis. Surf. lnterface Anal. 2000, 30, 364-367. [CrossRef]
- Kamosawa, T.; Honma, M.; Momose, Y. Observation of real metal surfaces by temperature programmed photoelectron emission technique-temperature dependence of the amount of emitted electrons and its relationship to XPS analysis-, J. Sur. Einishing Soc. Jpn. 2000, 51, 836-843 (in Japanese). [CrossRef]
- Momose, Y.; Sato, K.; Ohno, O. Electrochemical reduction of CO2 at copper electrodes and its relationship to the metal surface characteristics. Surf. lnterface Anal. 2002, 34, 615-618. [CrossRef]
- Wagner, C. D. et al. Handbook of X-ray photoelectron spectroscopy. 1979, Eden Prairie MN, Perkin-Elmer.
- Evans, S. Oxidation of the group IB metals studied by X-ray and ultraviolet photoelectron spectroscopy. J. Chem Soc. Faraday Trans. II, 1975, 71, 1044-1057. [CrossRef]
- McIntyre, N. S.; Sunder, S.; Shoesmith, D. W.; Stanchell, F. W. Chemical information from XPS-applications to the analysis of electrode surfaces. J. Vac. Sci. Technol. 1981, 18 (3), 714-721. [CrossRef]
- Morohashi, H.; Shibuya, K.; Amaki, Y. Surface analysis of tarnished copper plate, Report of the Industrial Research Institute of NIIGATA Prefecture, 2021, No.50 2020, pp. 68-71.
- Ramsey, J. A. Jpn. J. Appl. Phys. 1985, 24, Supplement 24-4, 32-37. [CrossRef]
- Huheey, J. E. in Inorganic Chemistry, Principles of Structure and Reactivity, 3rd edn. Harper & Row, New York (1983). Japanese translation by G. Kodama, H. Nakazawa, Tokyo Kagaku Dojin (Tokyo, 1984), p. 52.
- Momose, Y.; Suzuki, D.; Tsuruya, K.; Sakurai, T.; Nakayama, K. Friction 2018, 6(1), 98-115. [CrossRef]
- Kittel, C. Introduction to Solid State Physics, 2nd edn. John Wiley & Sons, New York (1956), Japanese translation by Uno, R.; Tsuya, N.; Morita, A.; Yamashita, J., Maruzen (Tokyo, 1963), p.300.
- Juse, W, P.; Kurtschatow, B. W. Phys. Zeits. d. Sowjetunion, 1933, 2, 463.
- Mott, N. F.; Gurney, R. W. Electronic Processes in Ionic Crystals, 2nd edn. Clarendon, Oxford (1957), pp. 163-164.
Figure 1.
The temperature programmed photoelectron emission (TPPE) measurement apparatus.
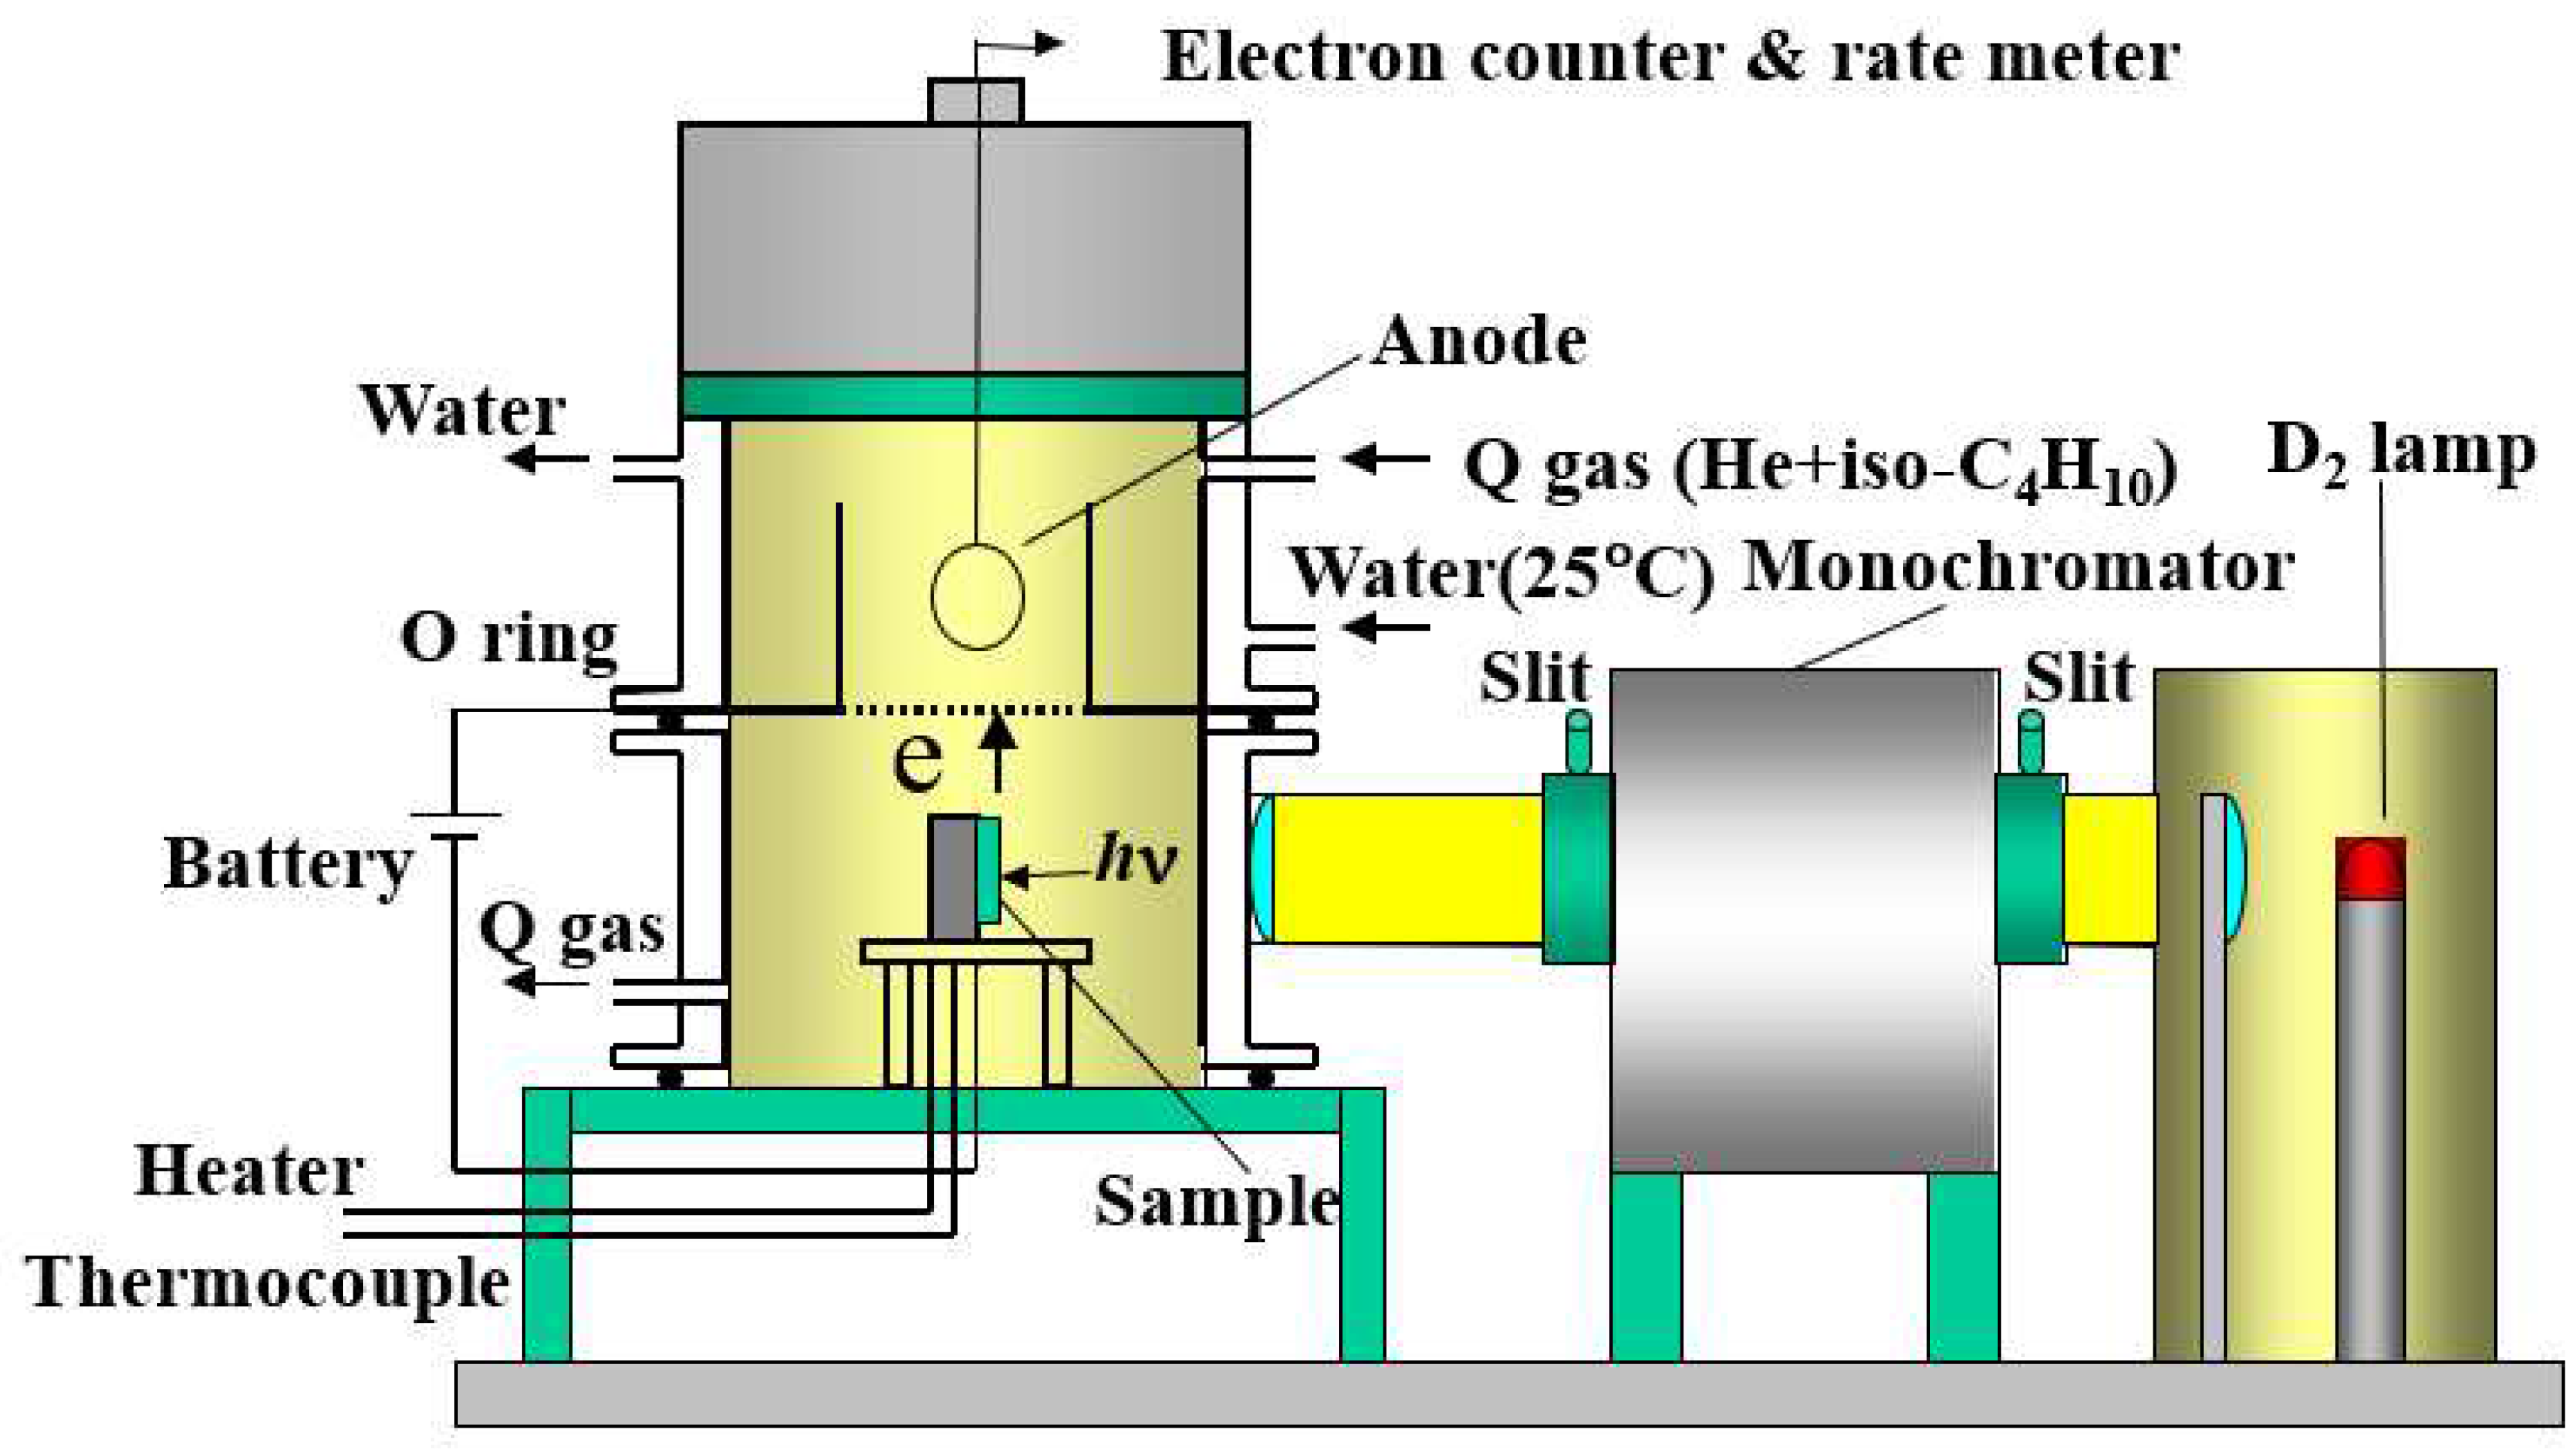
Figure 2.
Typical PE stimulation spectra at 250°C for copper samples abraded in CH3OH: abrasion time: (a) 5 min, (b) 10 min, (c) 30 min.
Figure 2.
Typical PE stimulation spectra at 250°C for copper samples abraded in CH3OH: abrasion time: (a) 5 min, (b) 10 min, (c) 30 min.
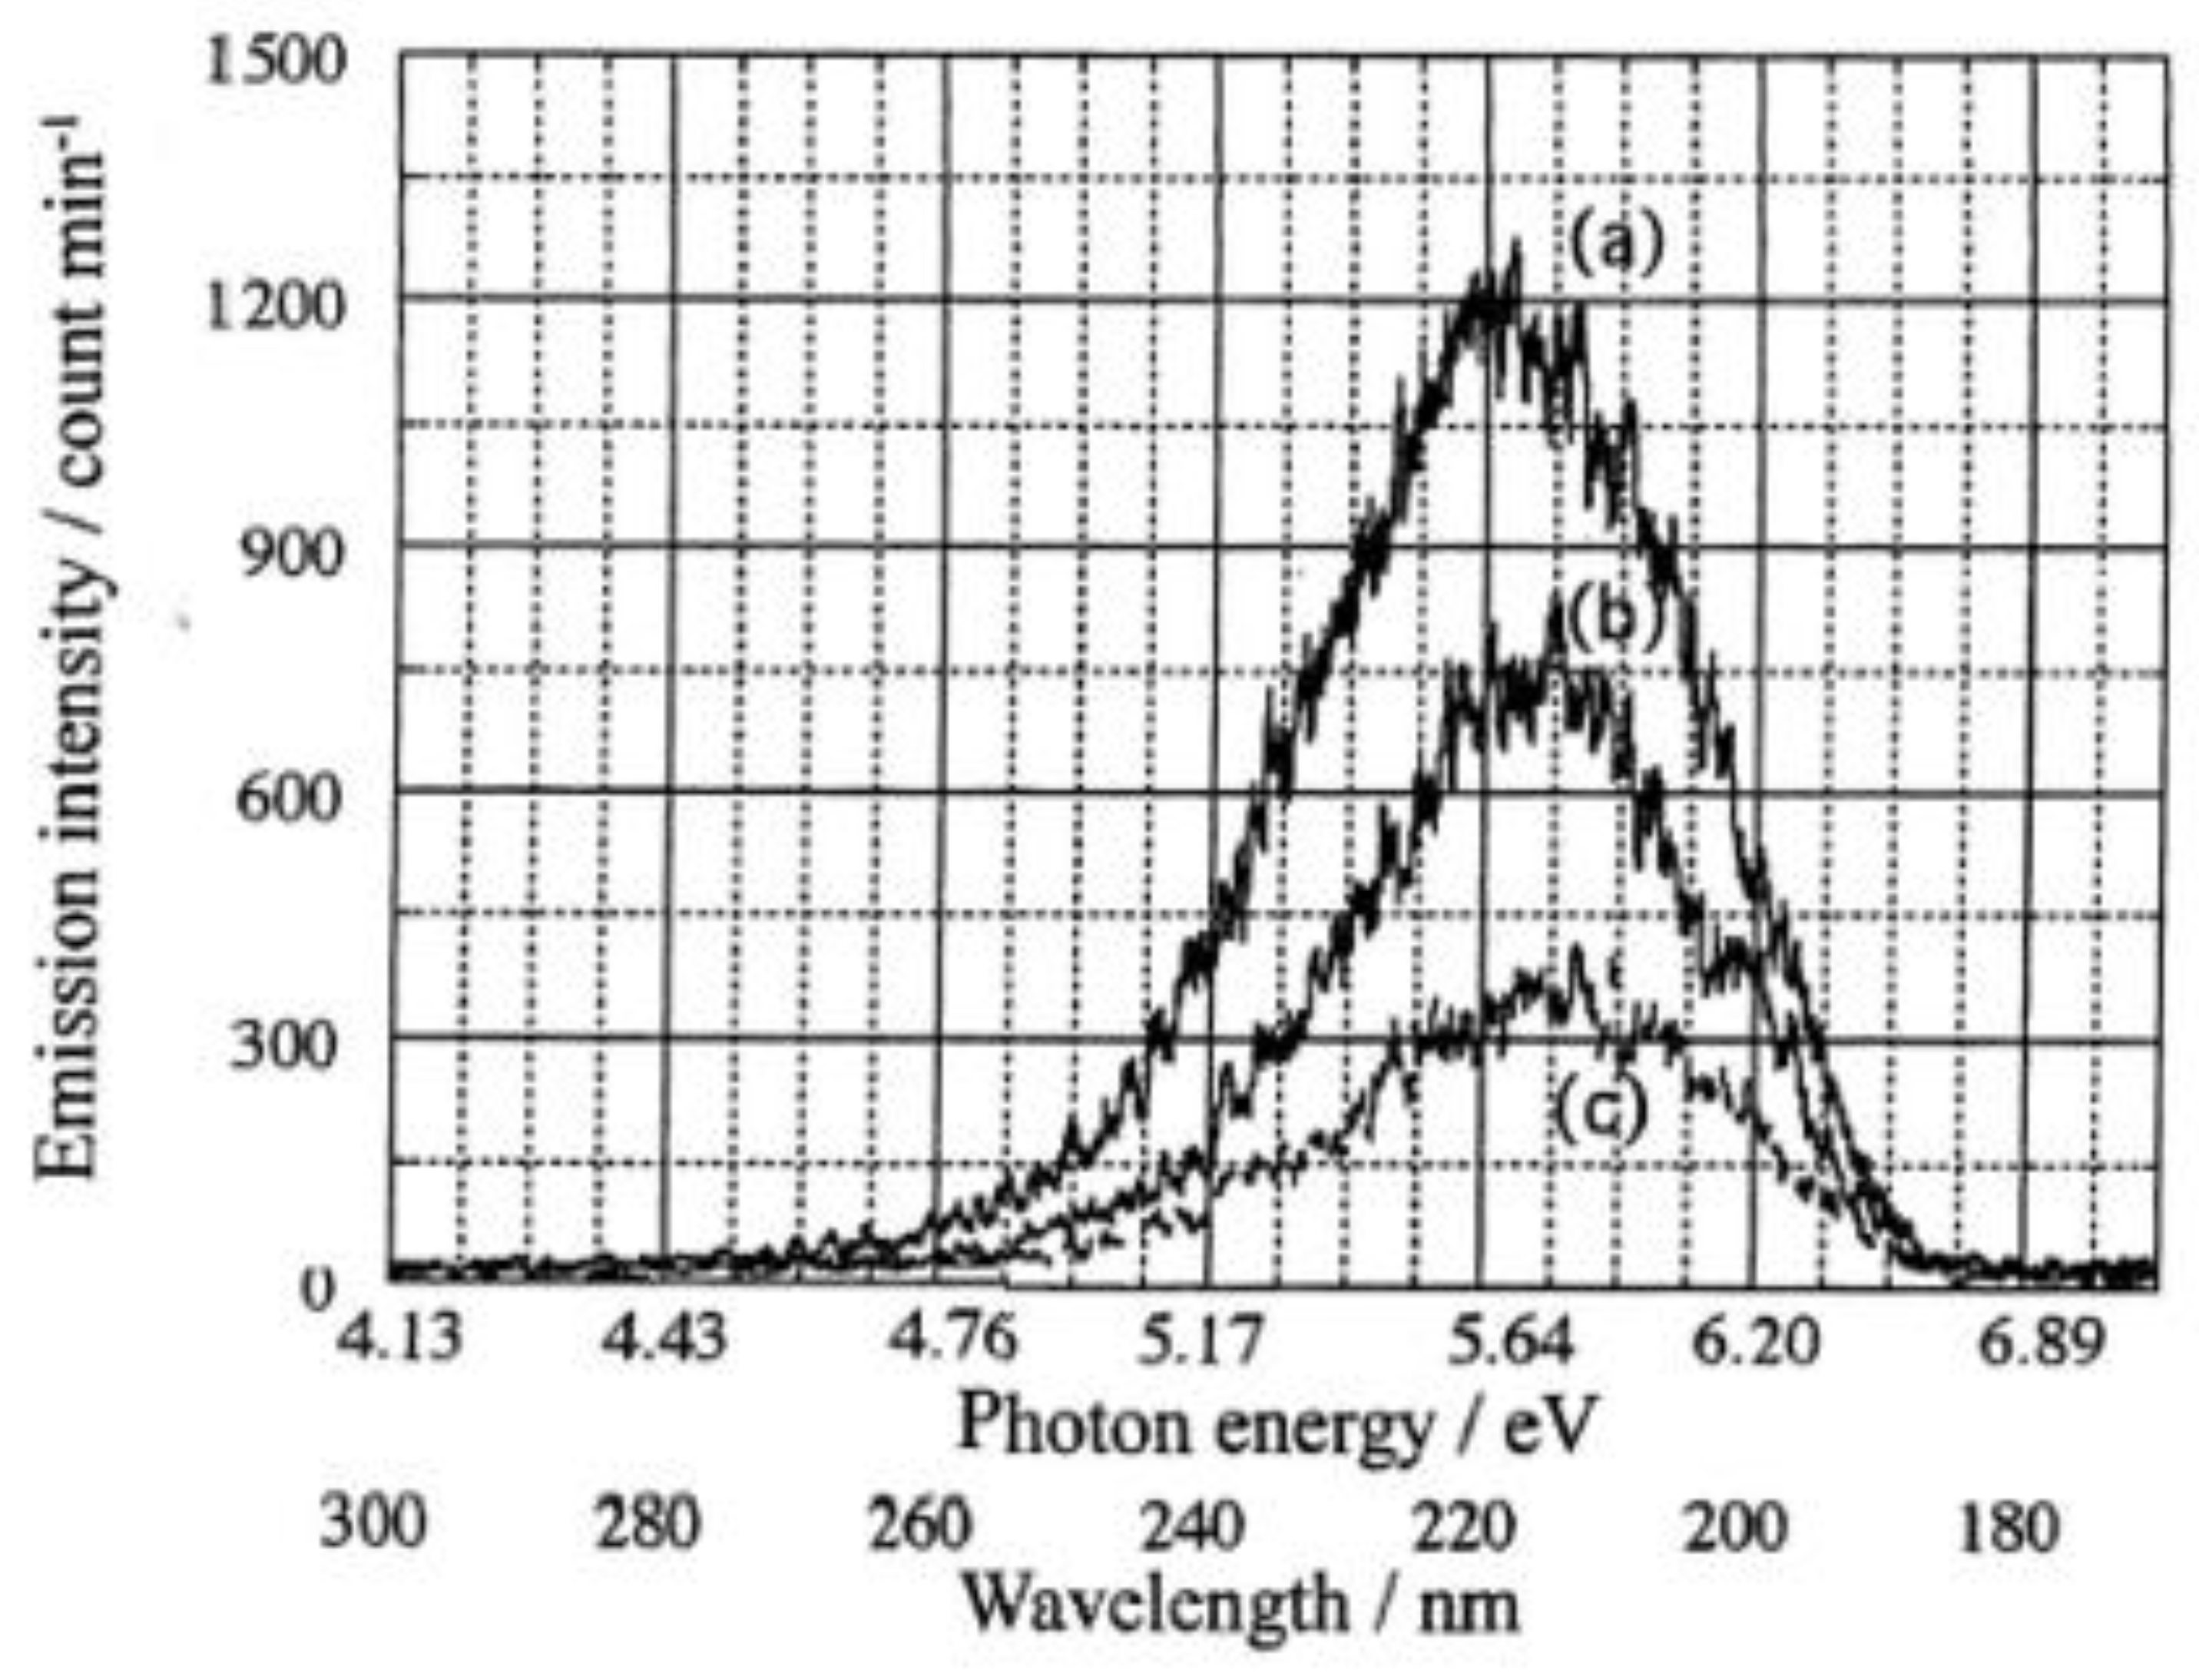
Figure 3.
[Sample A] Plots of PE total count (NT) during the 1st and 2nd temperature-increase and subsequent temperature-decrease processes for copper samples abraded in various liquids and in ambient air for 10 min, which are named (a) (Up1) and (b) (Down 1), and (c) (Up2) and (d) (Down 2), respectively, versus measurement temperature: (1) H2O, (2) CH3OH, (3) C2H5OH, (4) (CH3)2CHOH, (5) C3H7OH, and (6) ambient air. It is noted that the measurement of the 2nd temperature-increase and subsequent temperature-decrease processes were carried out only for H2O.
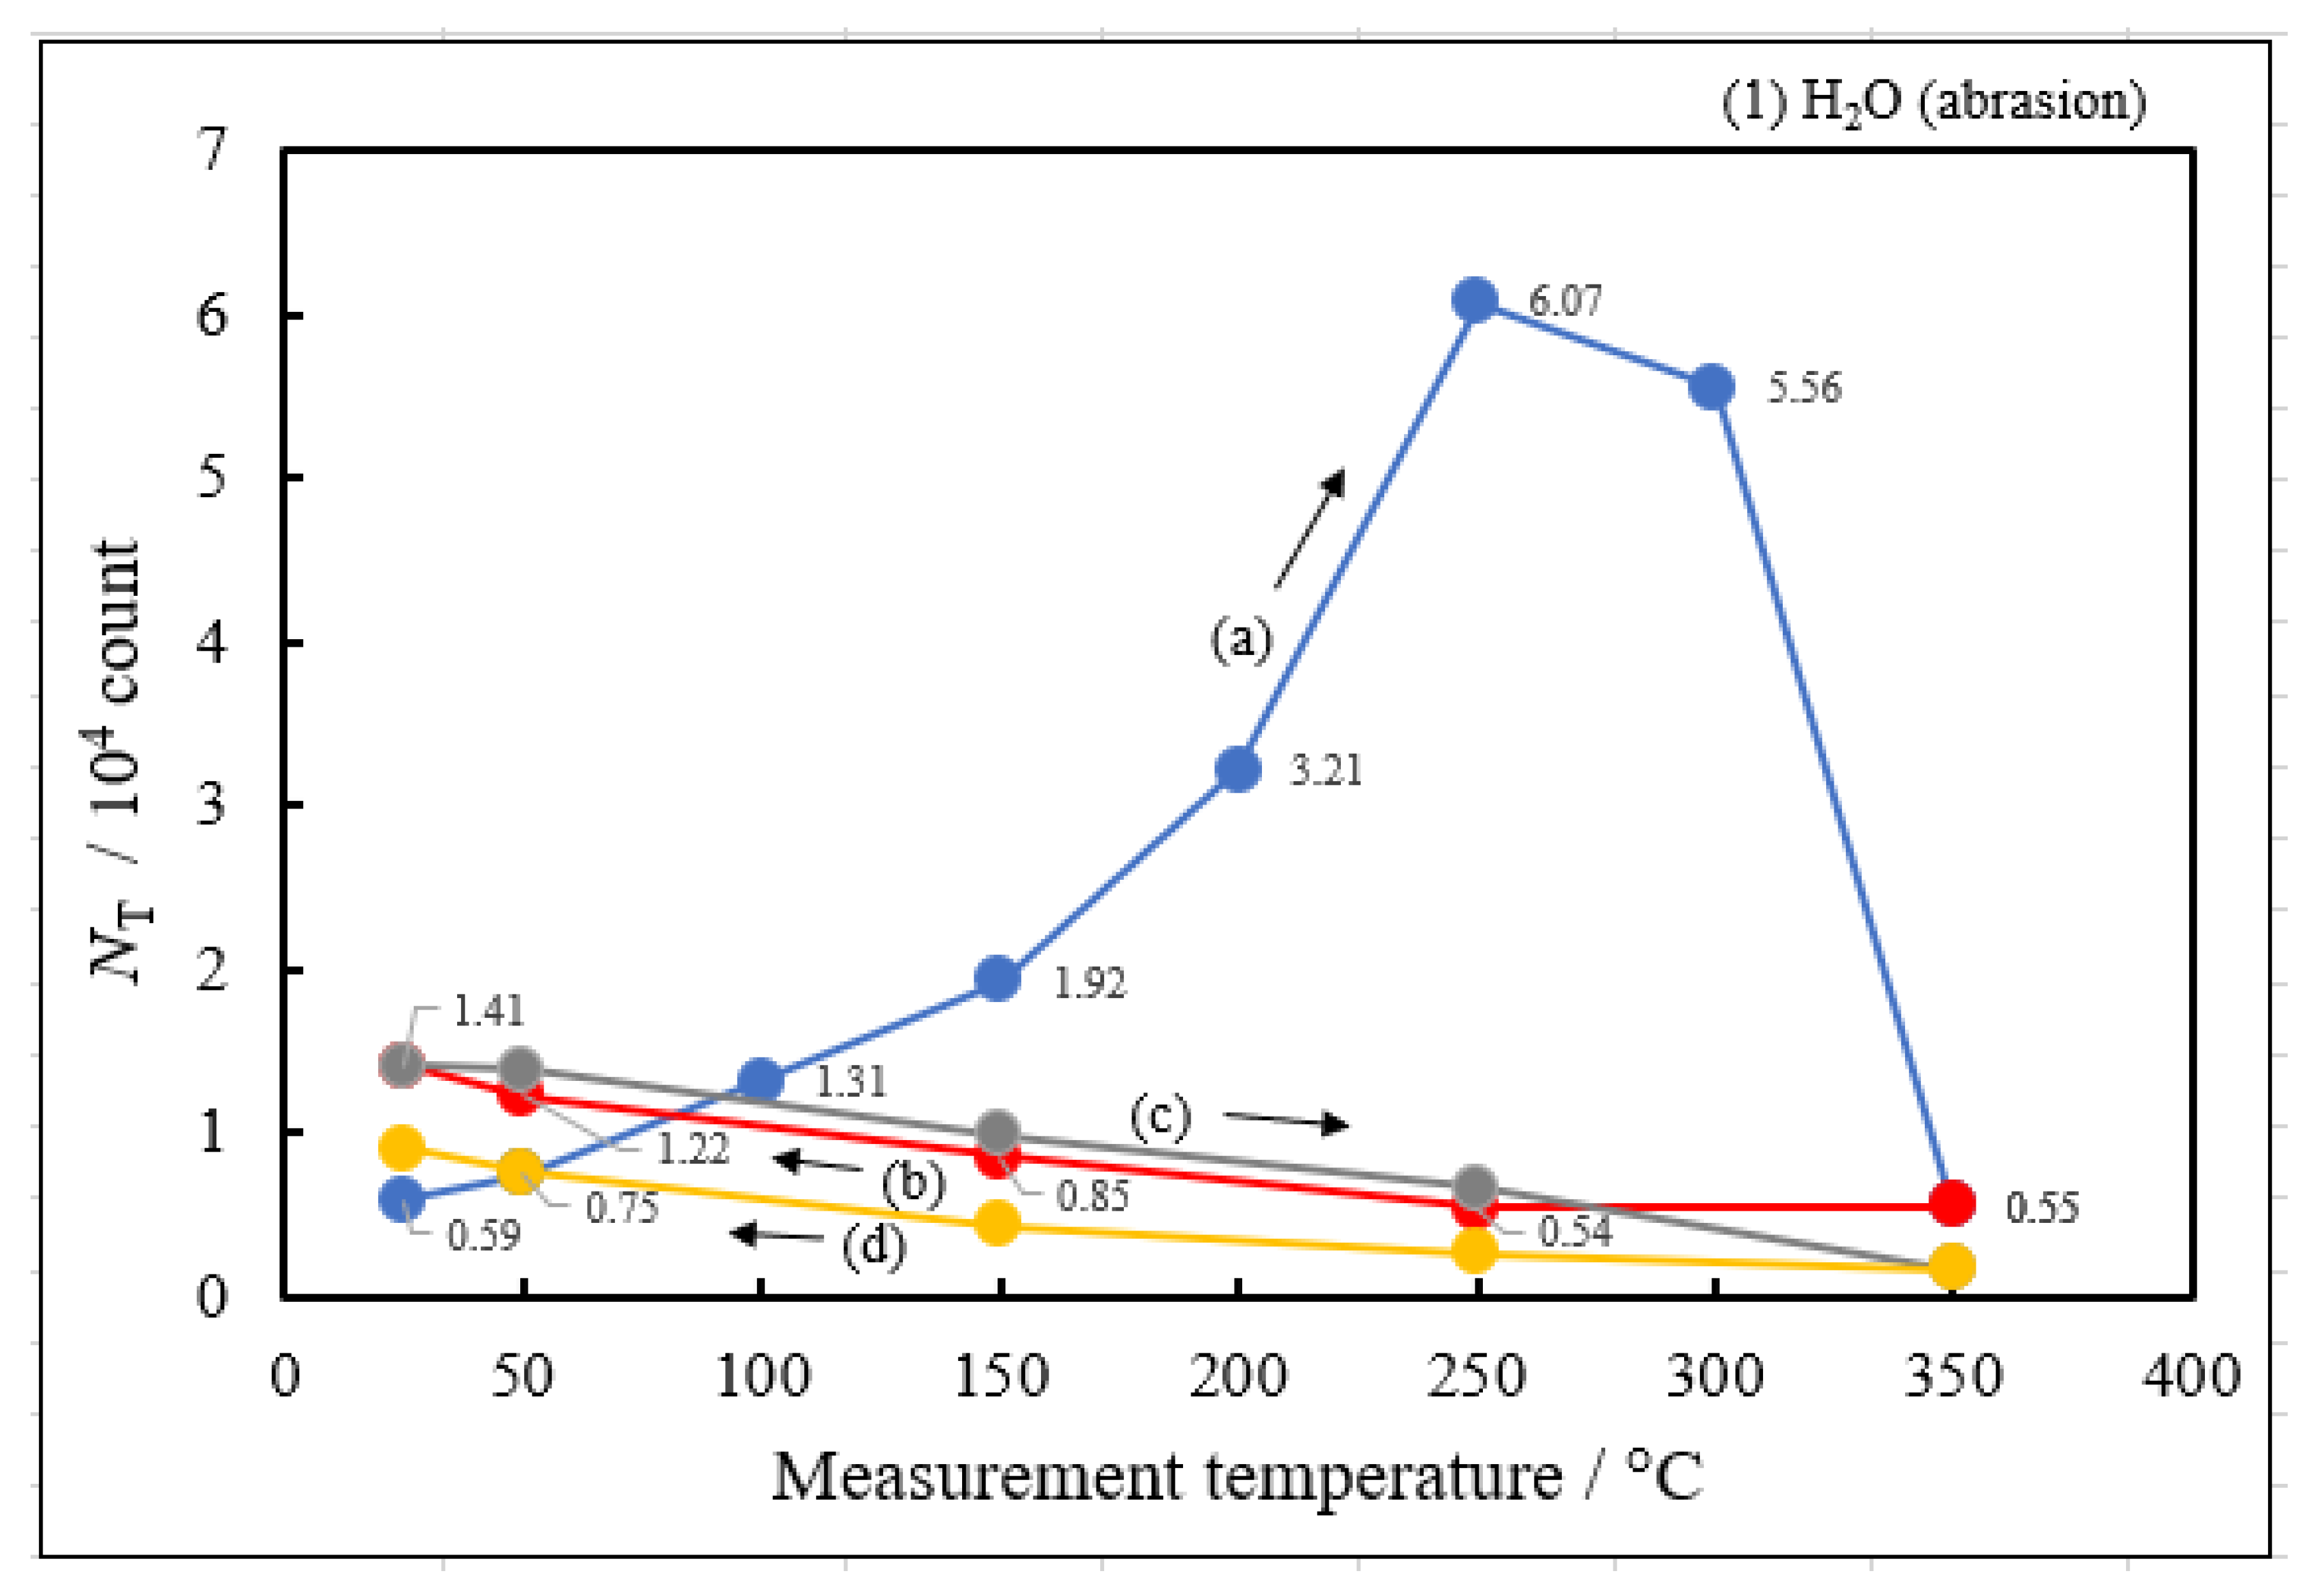
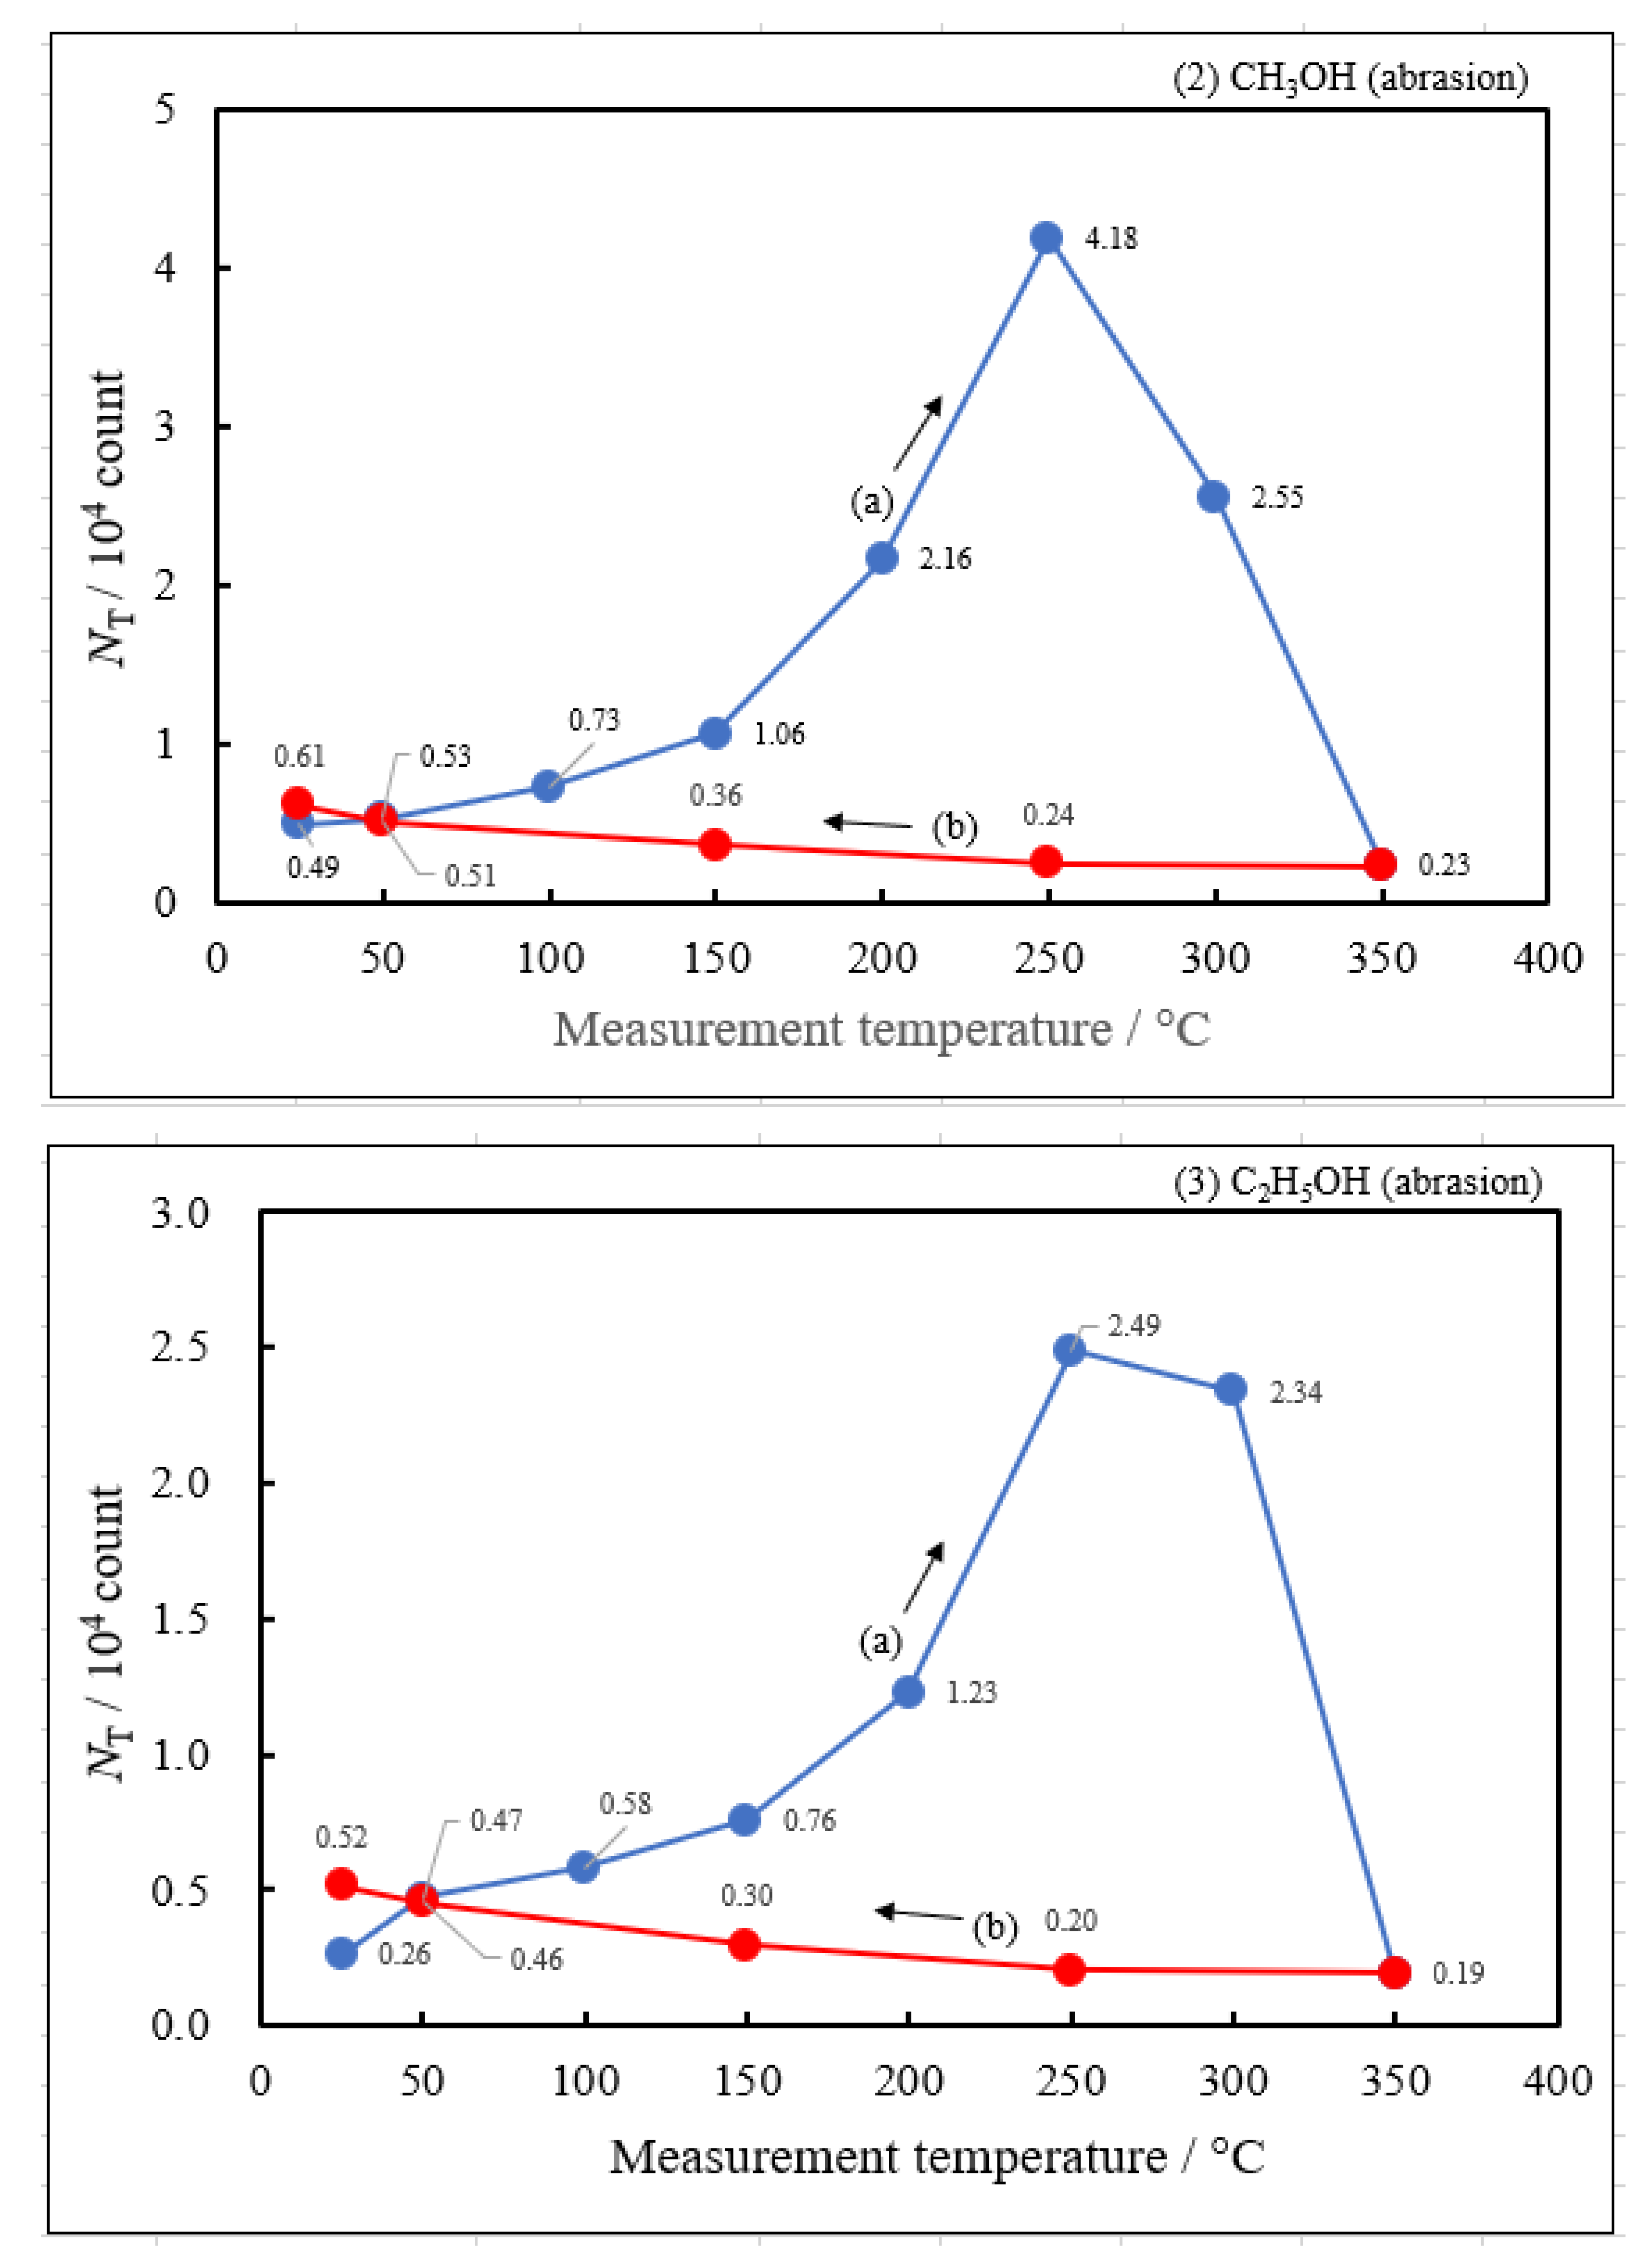
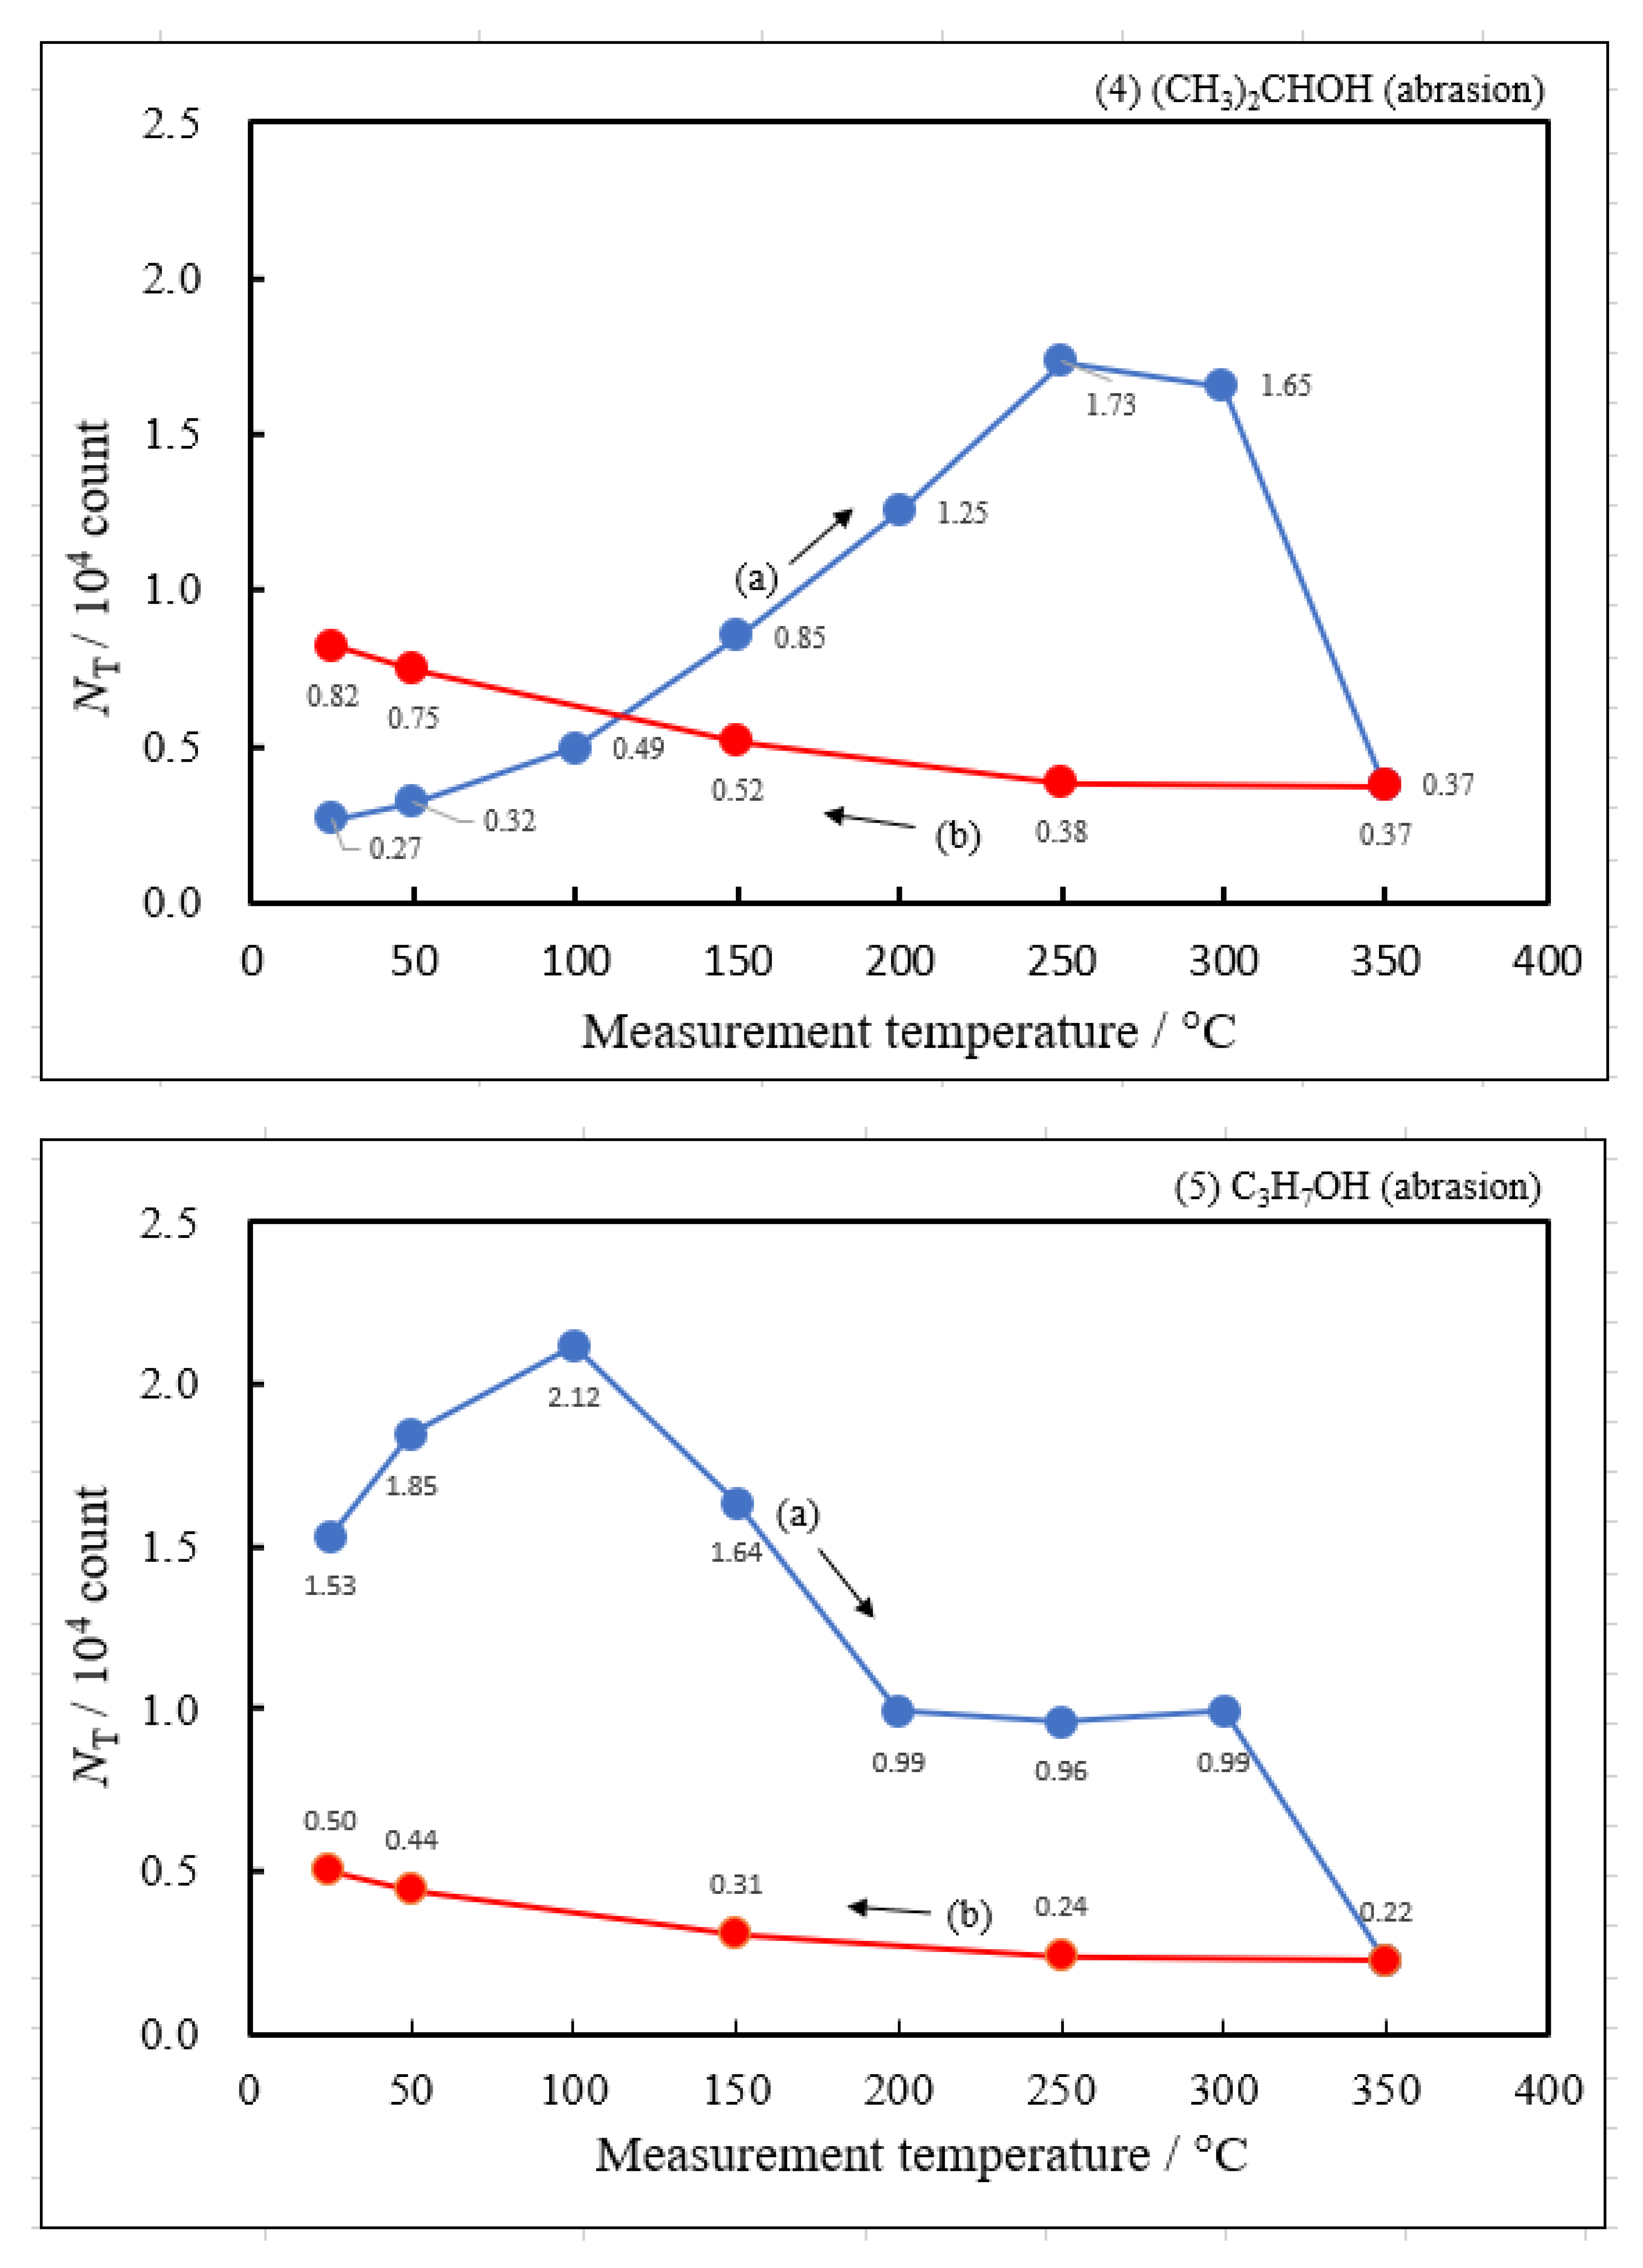
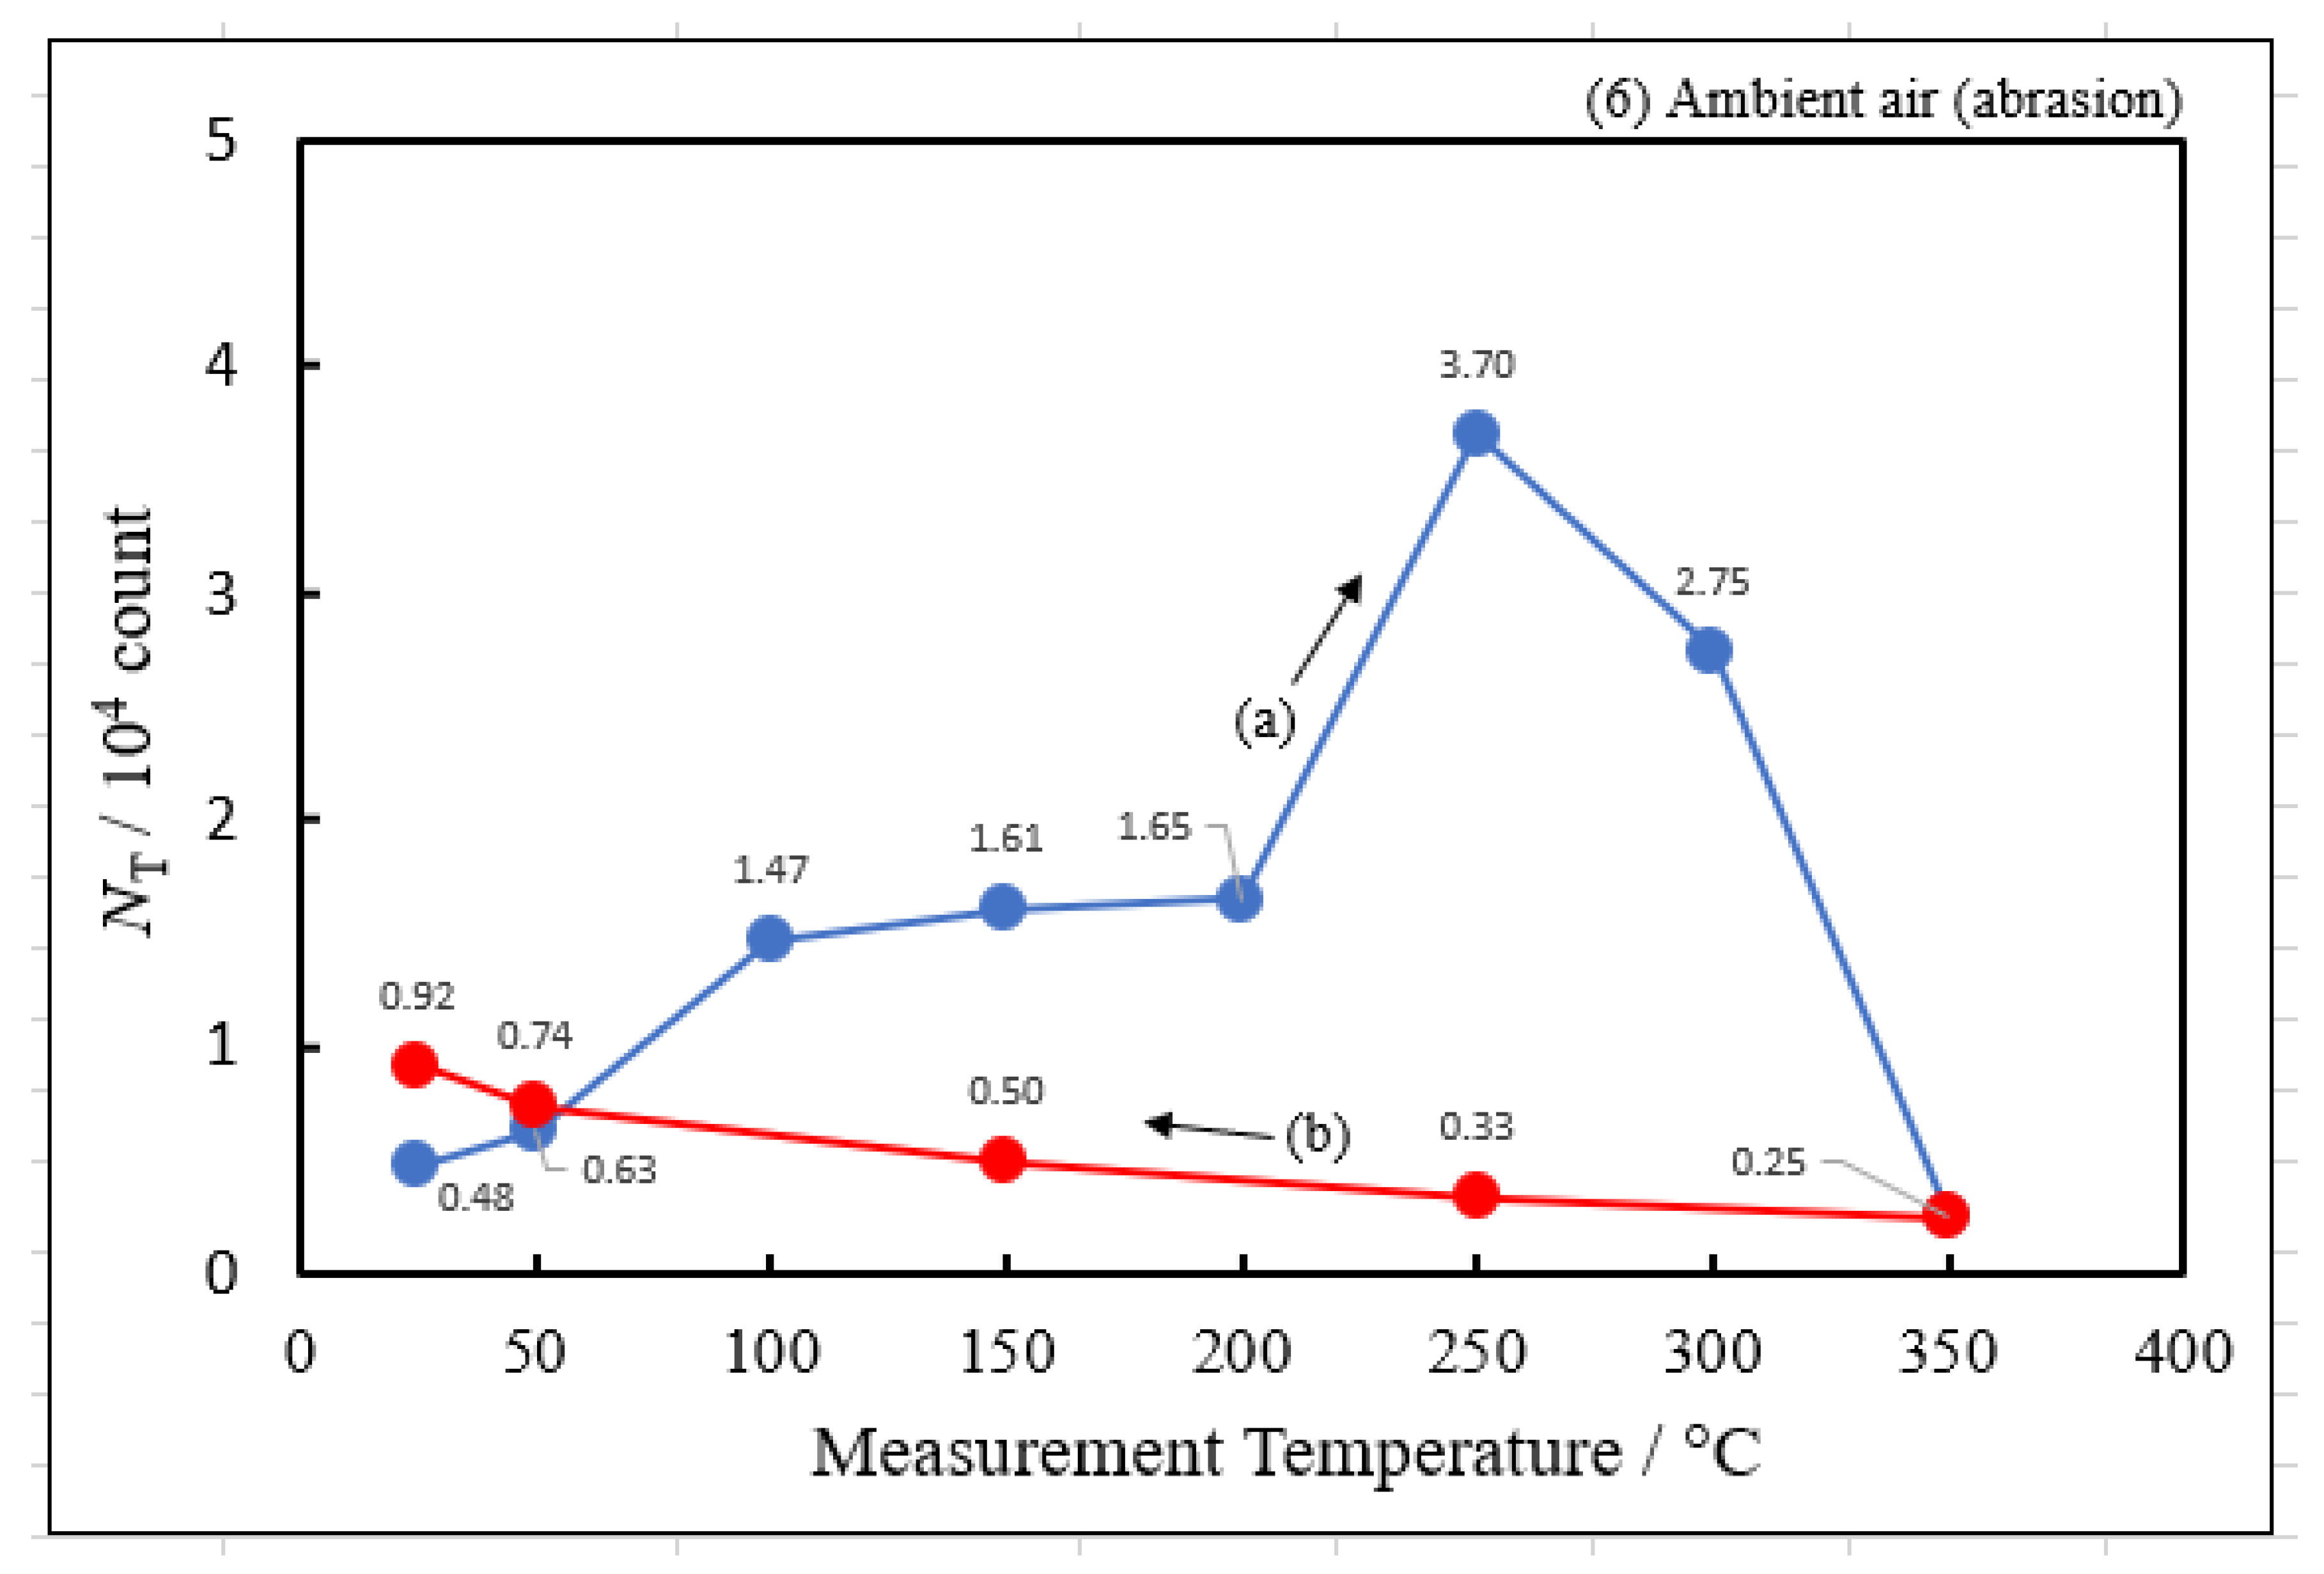
Figure 4.
[Sample C] Plots of PE total count (NT) during the 1st and 2nd temperature-increase and subsequent temperature-decrease processes for copper samples ultrasonically cleaned in various liquids for 5 min, which are named (a) (Up1 scan) and (b) (Down1 scan), and (c) (Up2 scan) and (d) (Down2 scan), respectively, versus measurement temperature: (1) H2O, (2) CH3OH, (3) C2H5OH, (4) (CH3)2CHOH, and (5) C3H7OH. It is noted that the measurement of the 2nd temperature-increase and subsequent temperature-decrease processes were carried out only for C3H7OH.
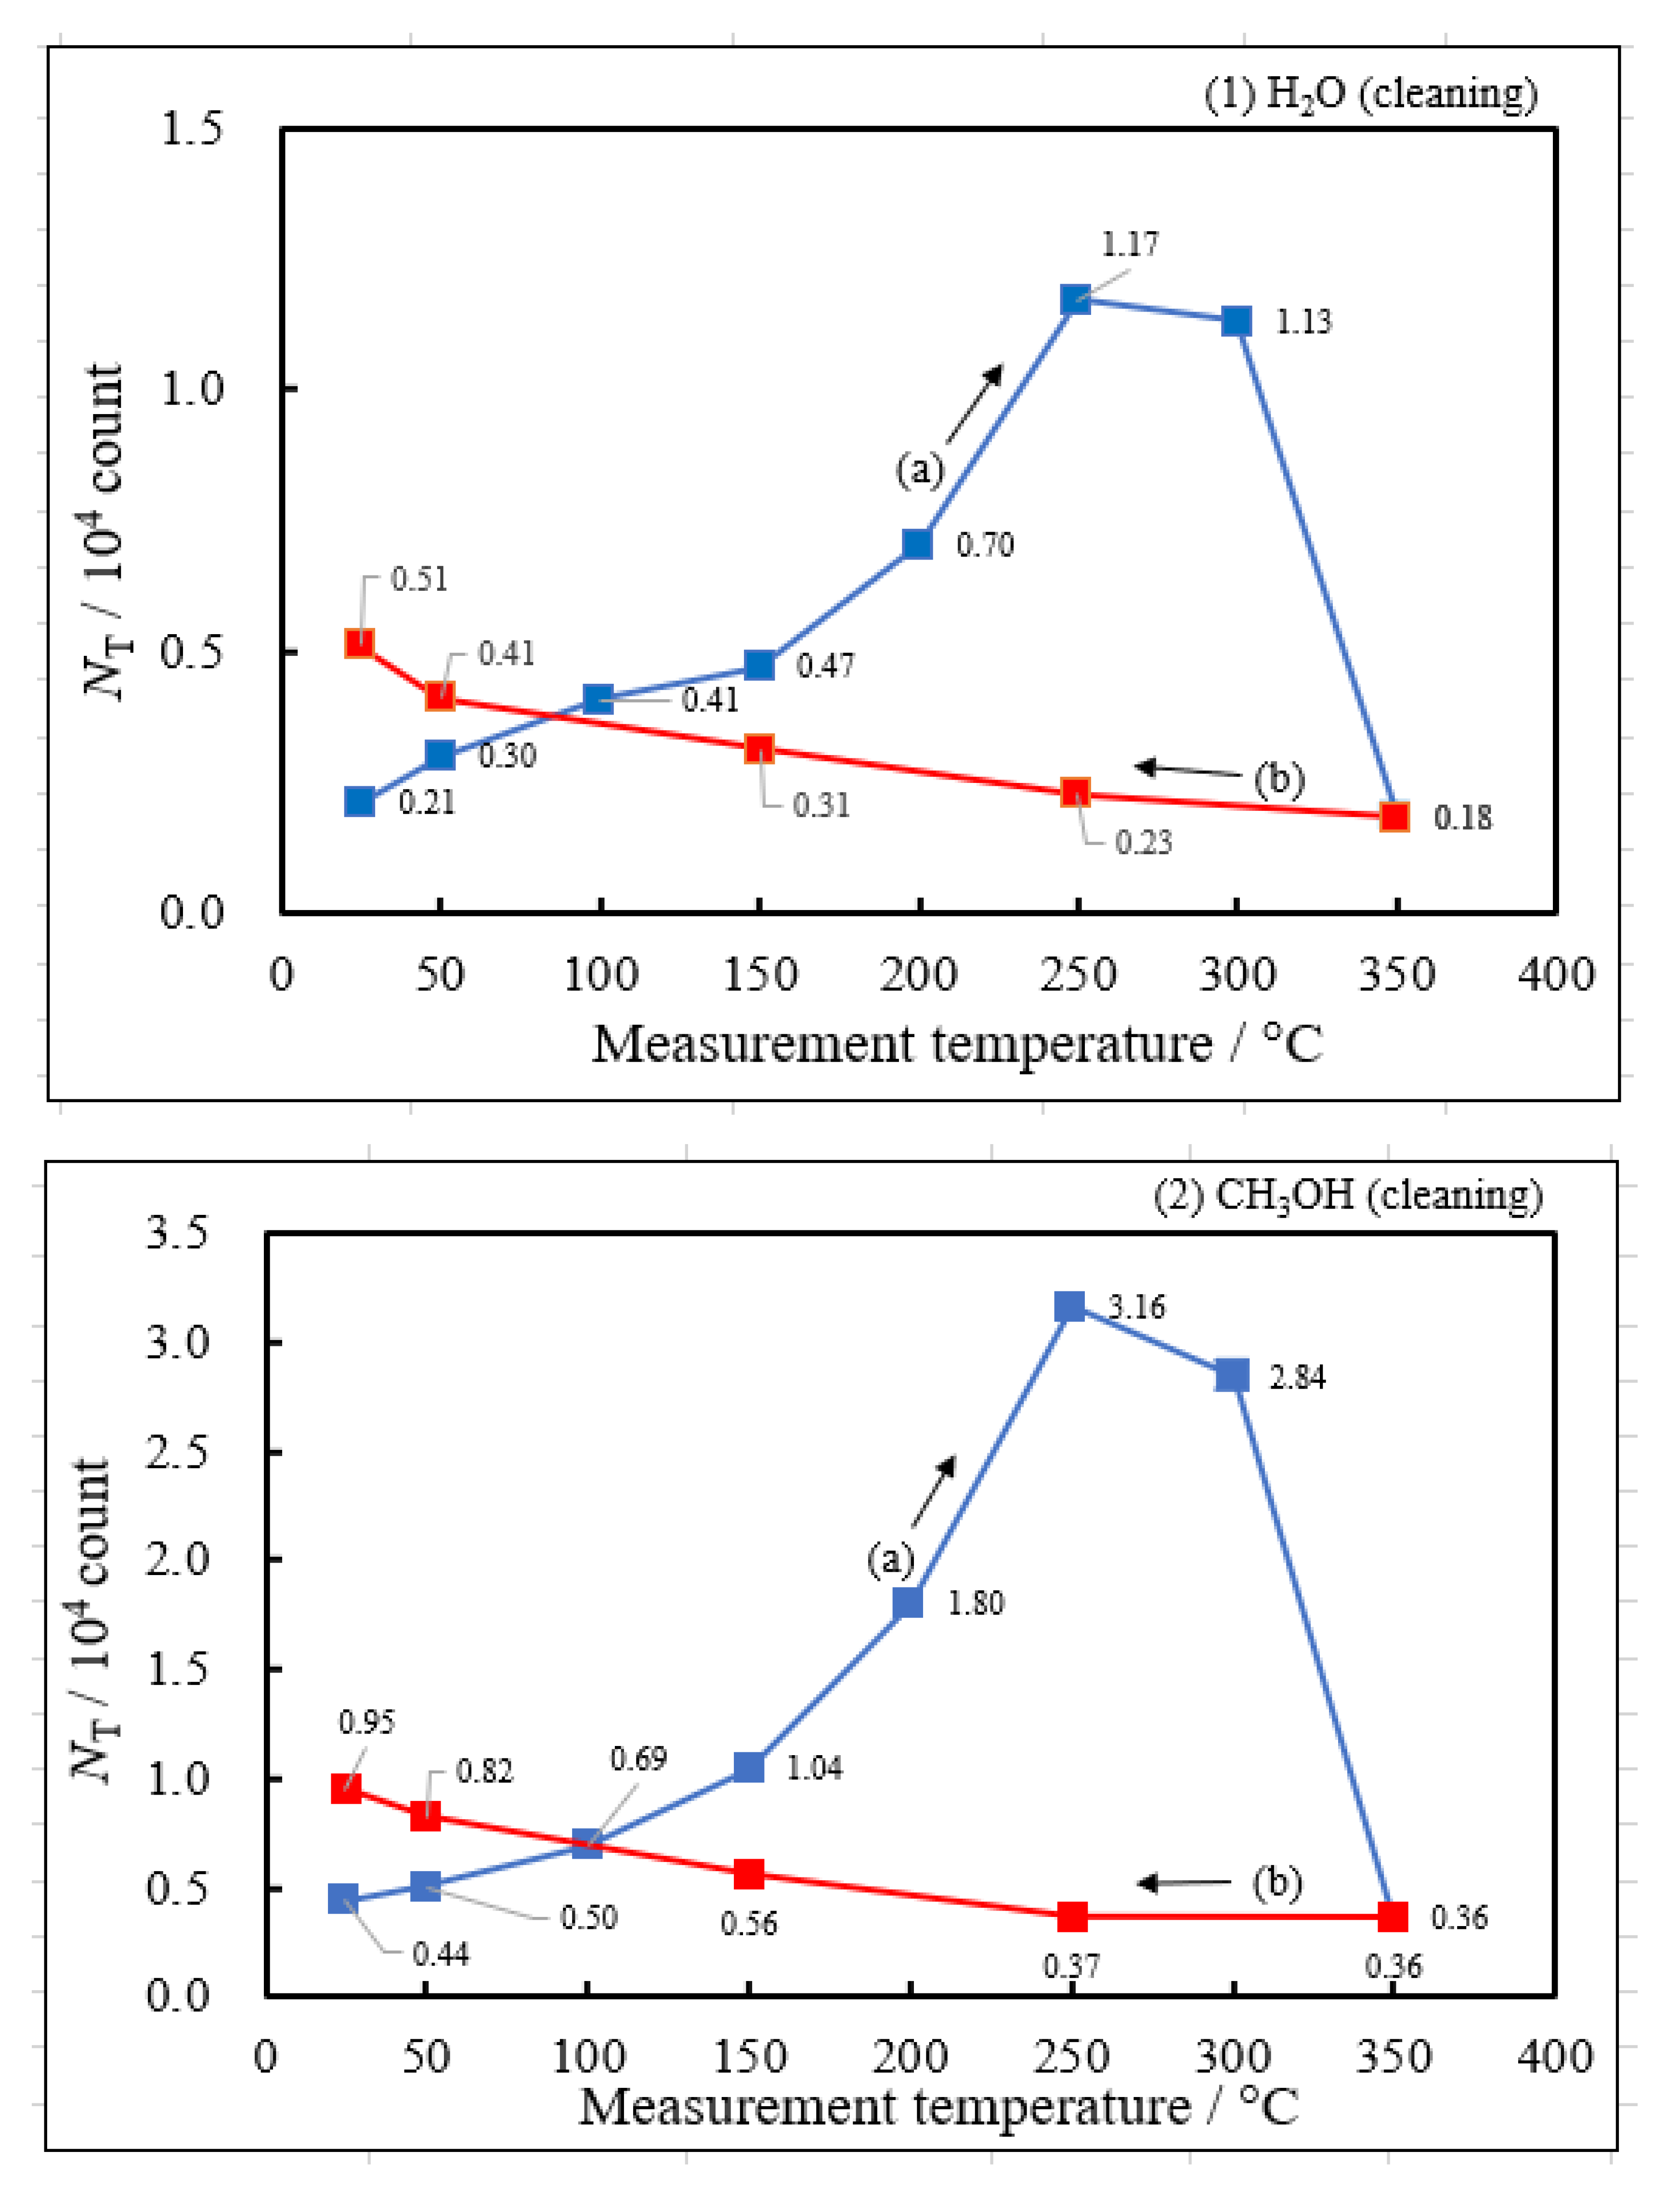
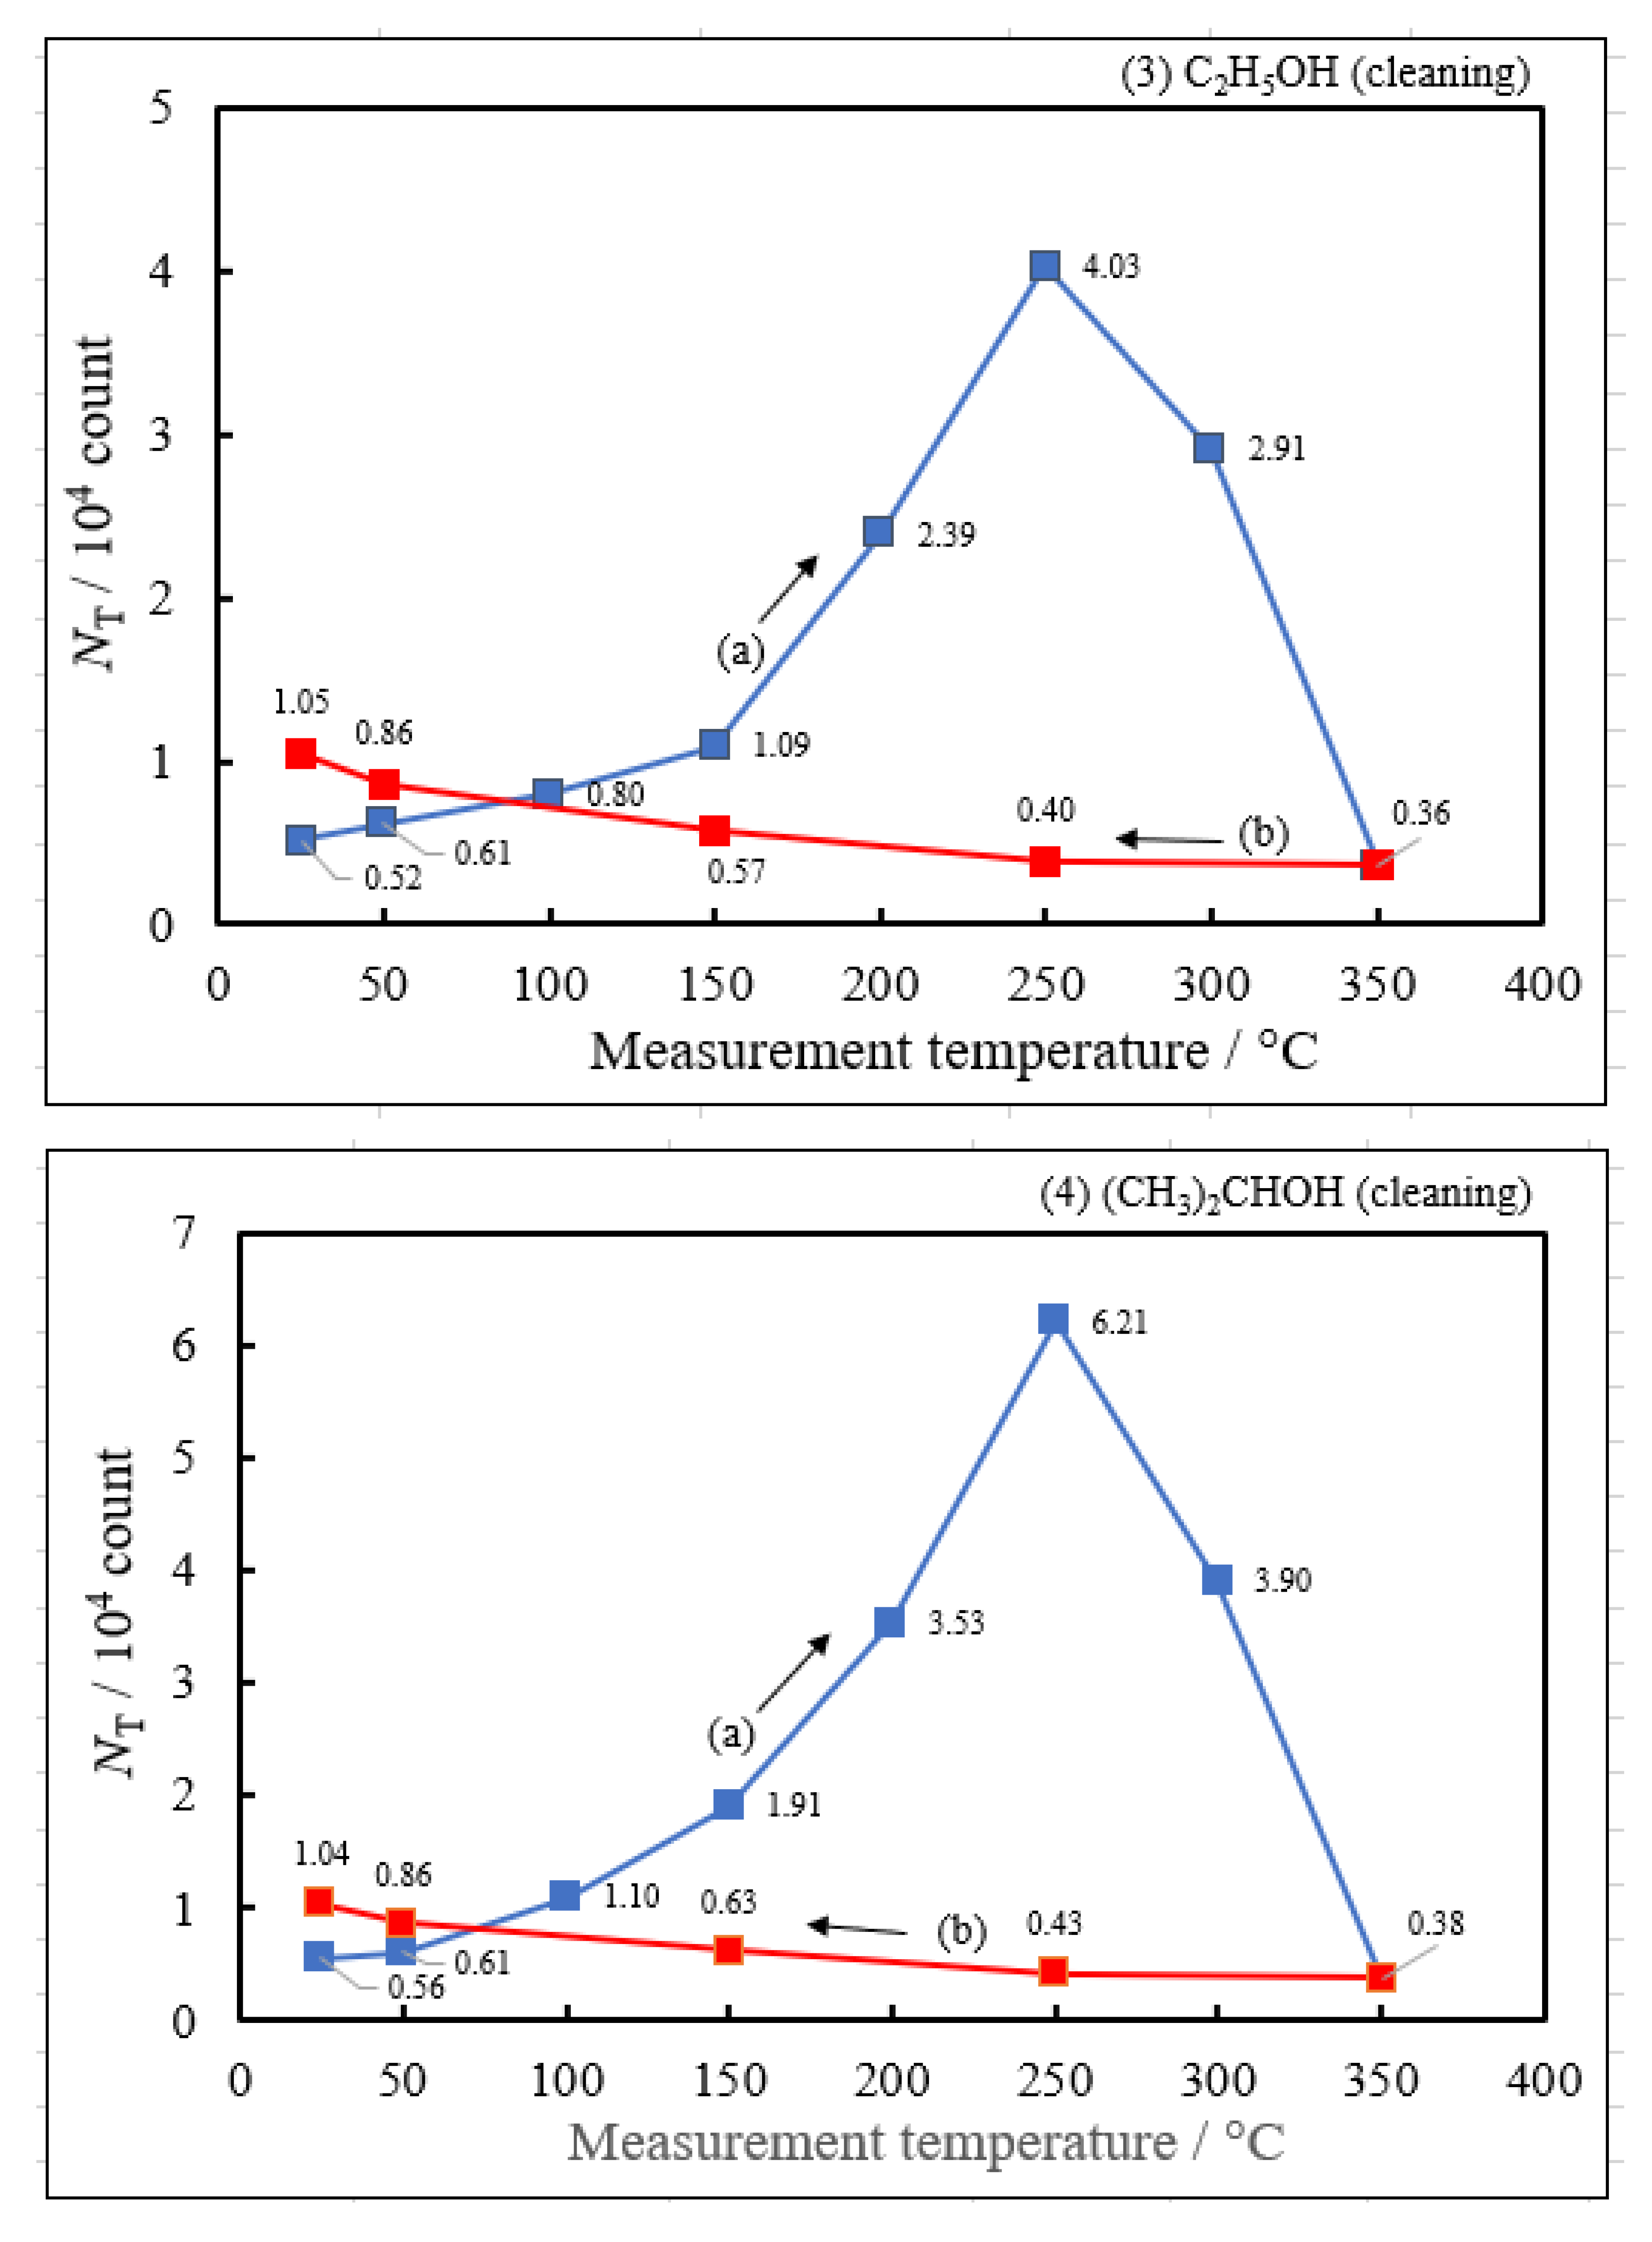
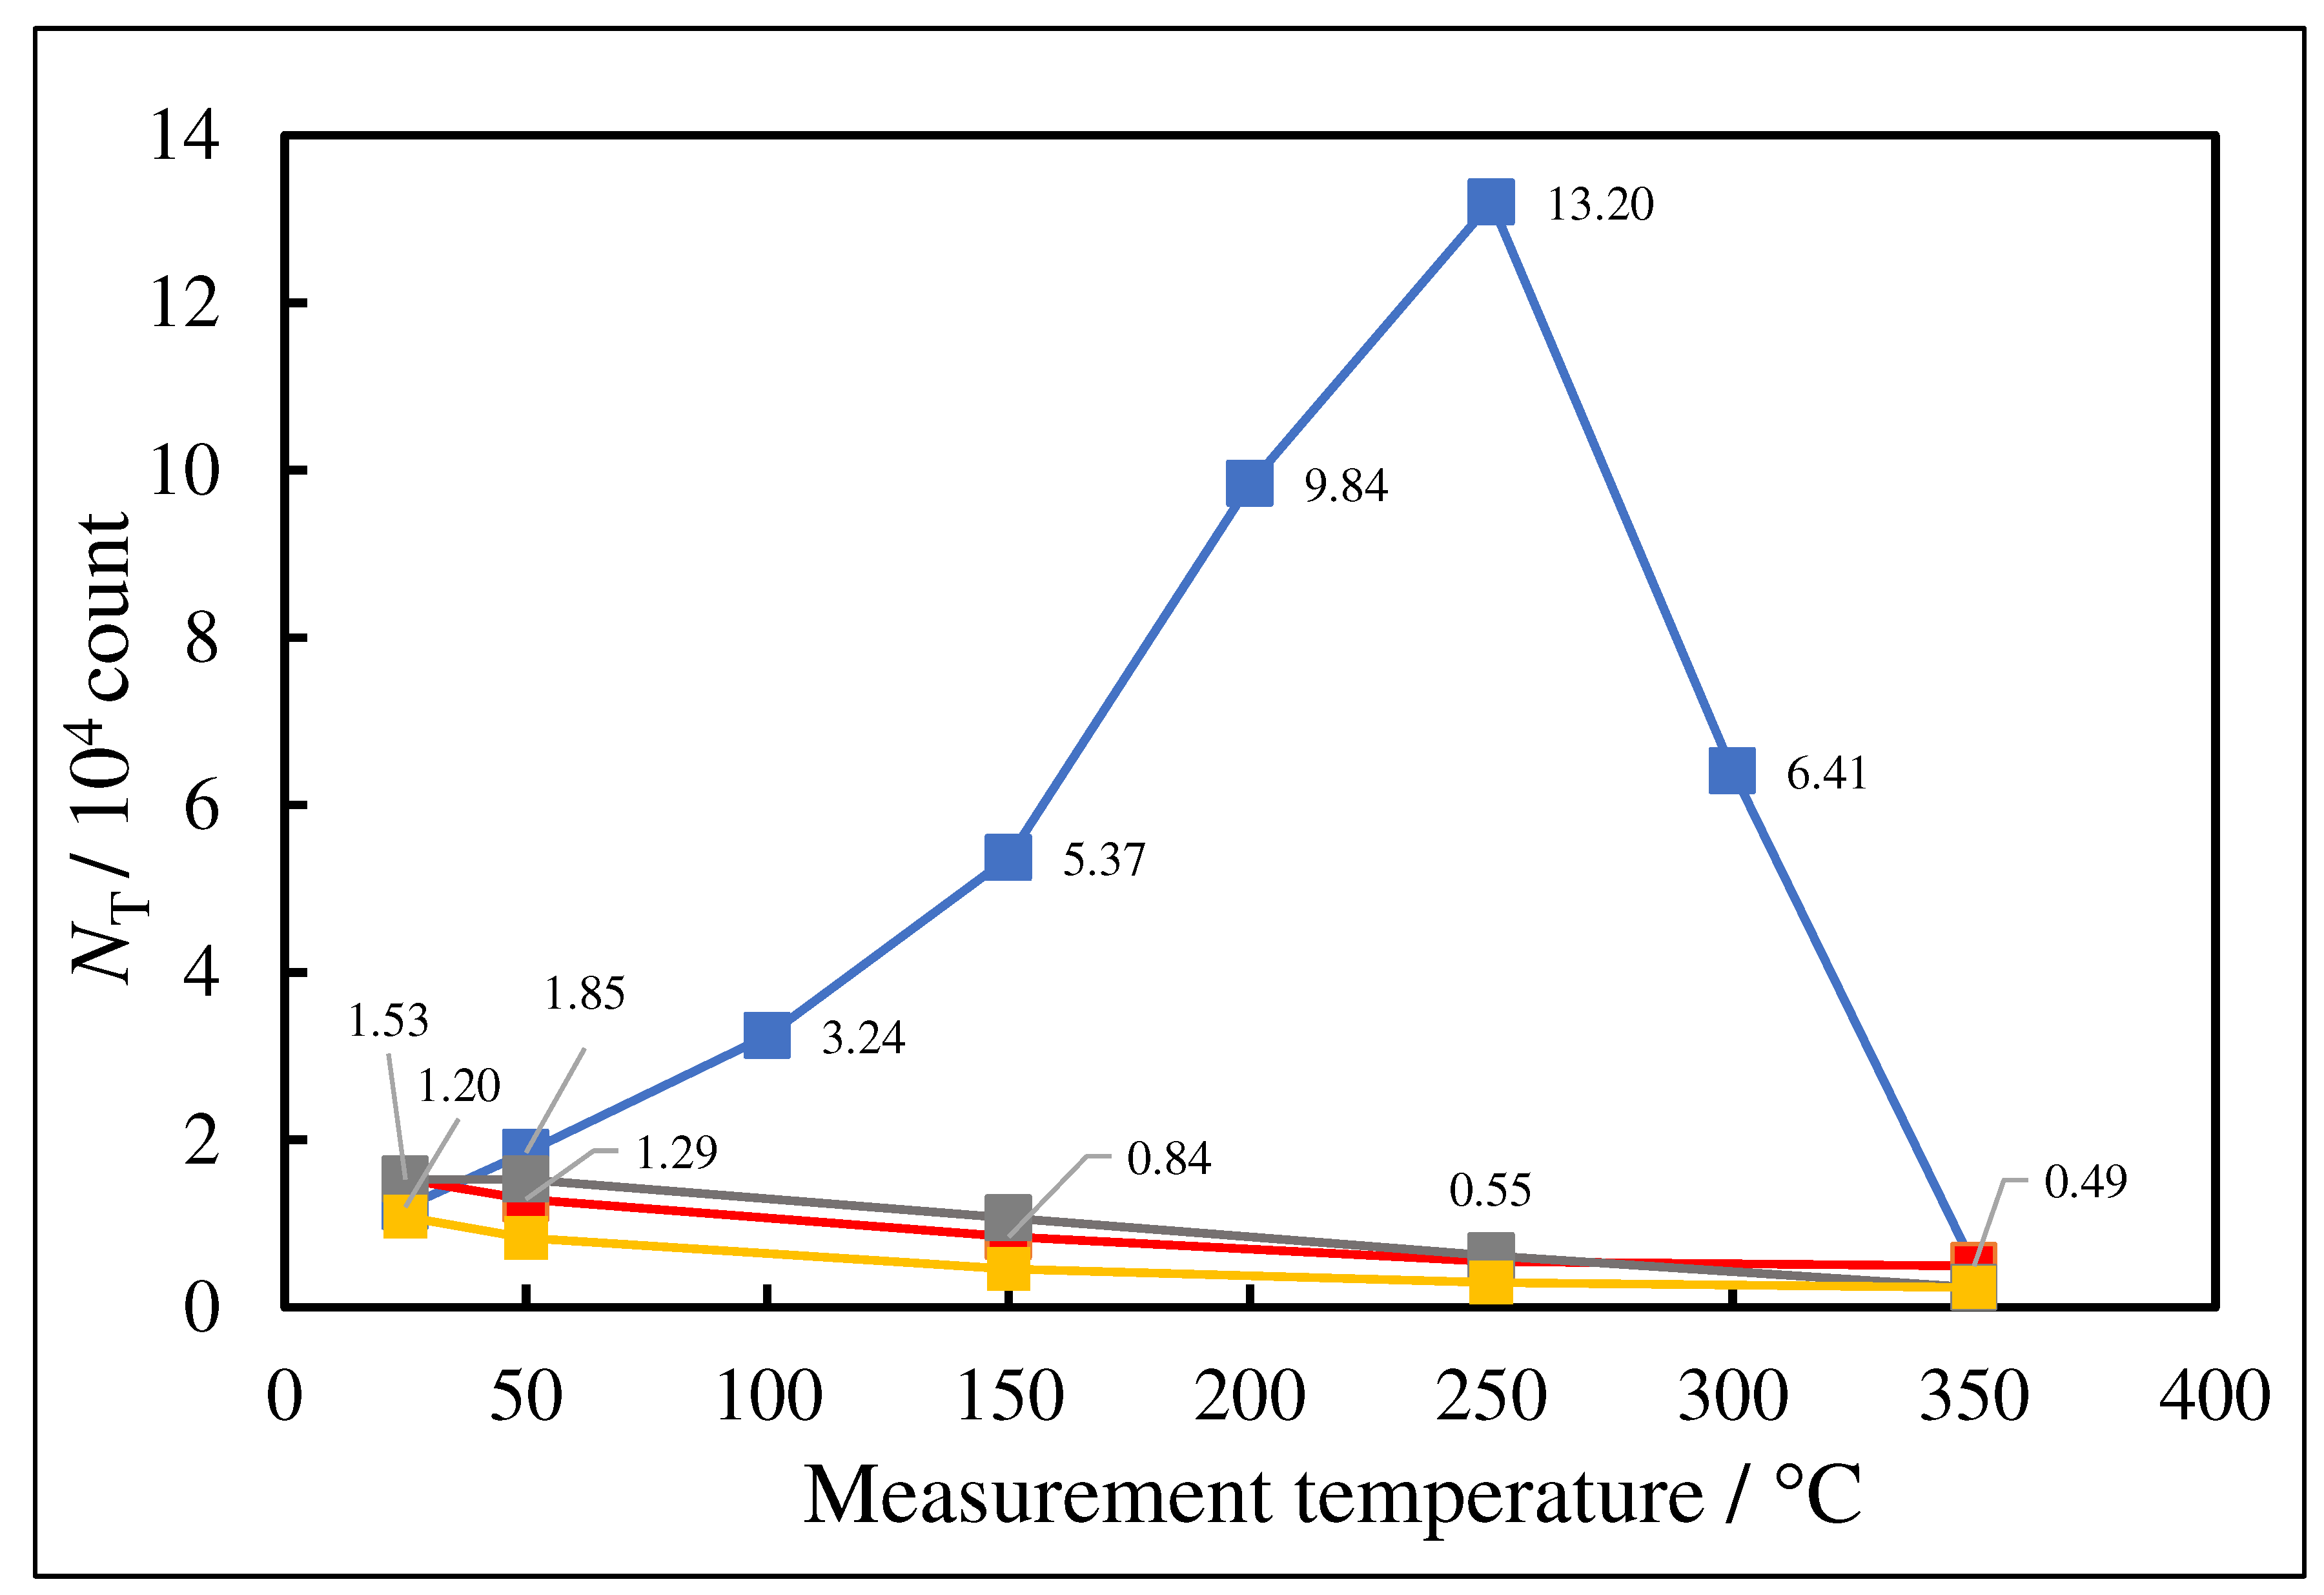
Figure 5.
Dependence of NT vs. temperature (TPPE plot) for copper samples subjected to 10-min abrasion (Sample A, above) and ultrasonic cleaning alone (Sample C, below) on the liquids and air: (a) H2O, (b) CH3OH, (c) C2H5OH, (d) (CH3)2CHOH, (e) C3H7OH, (f) ambient air.
Figure 5.
Dependence of NT vs. temperature (TPPE plot) for copper samples subjected to 10-min abrasion (Sample A, above) and ultrasonic cleaning alone (Sample C, below) on the liquids and air: (a) H2O, (b) CH3OH, (c) C2H5OH, (d) (CH3)2CHOH, (e) C3H7OH, (f) ambient air.
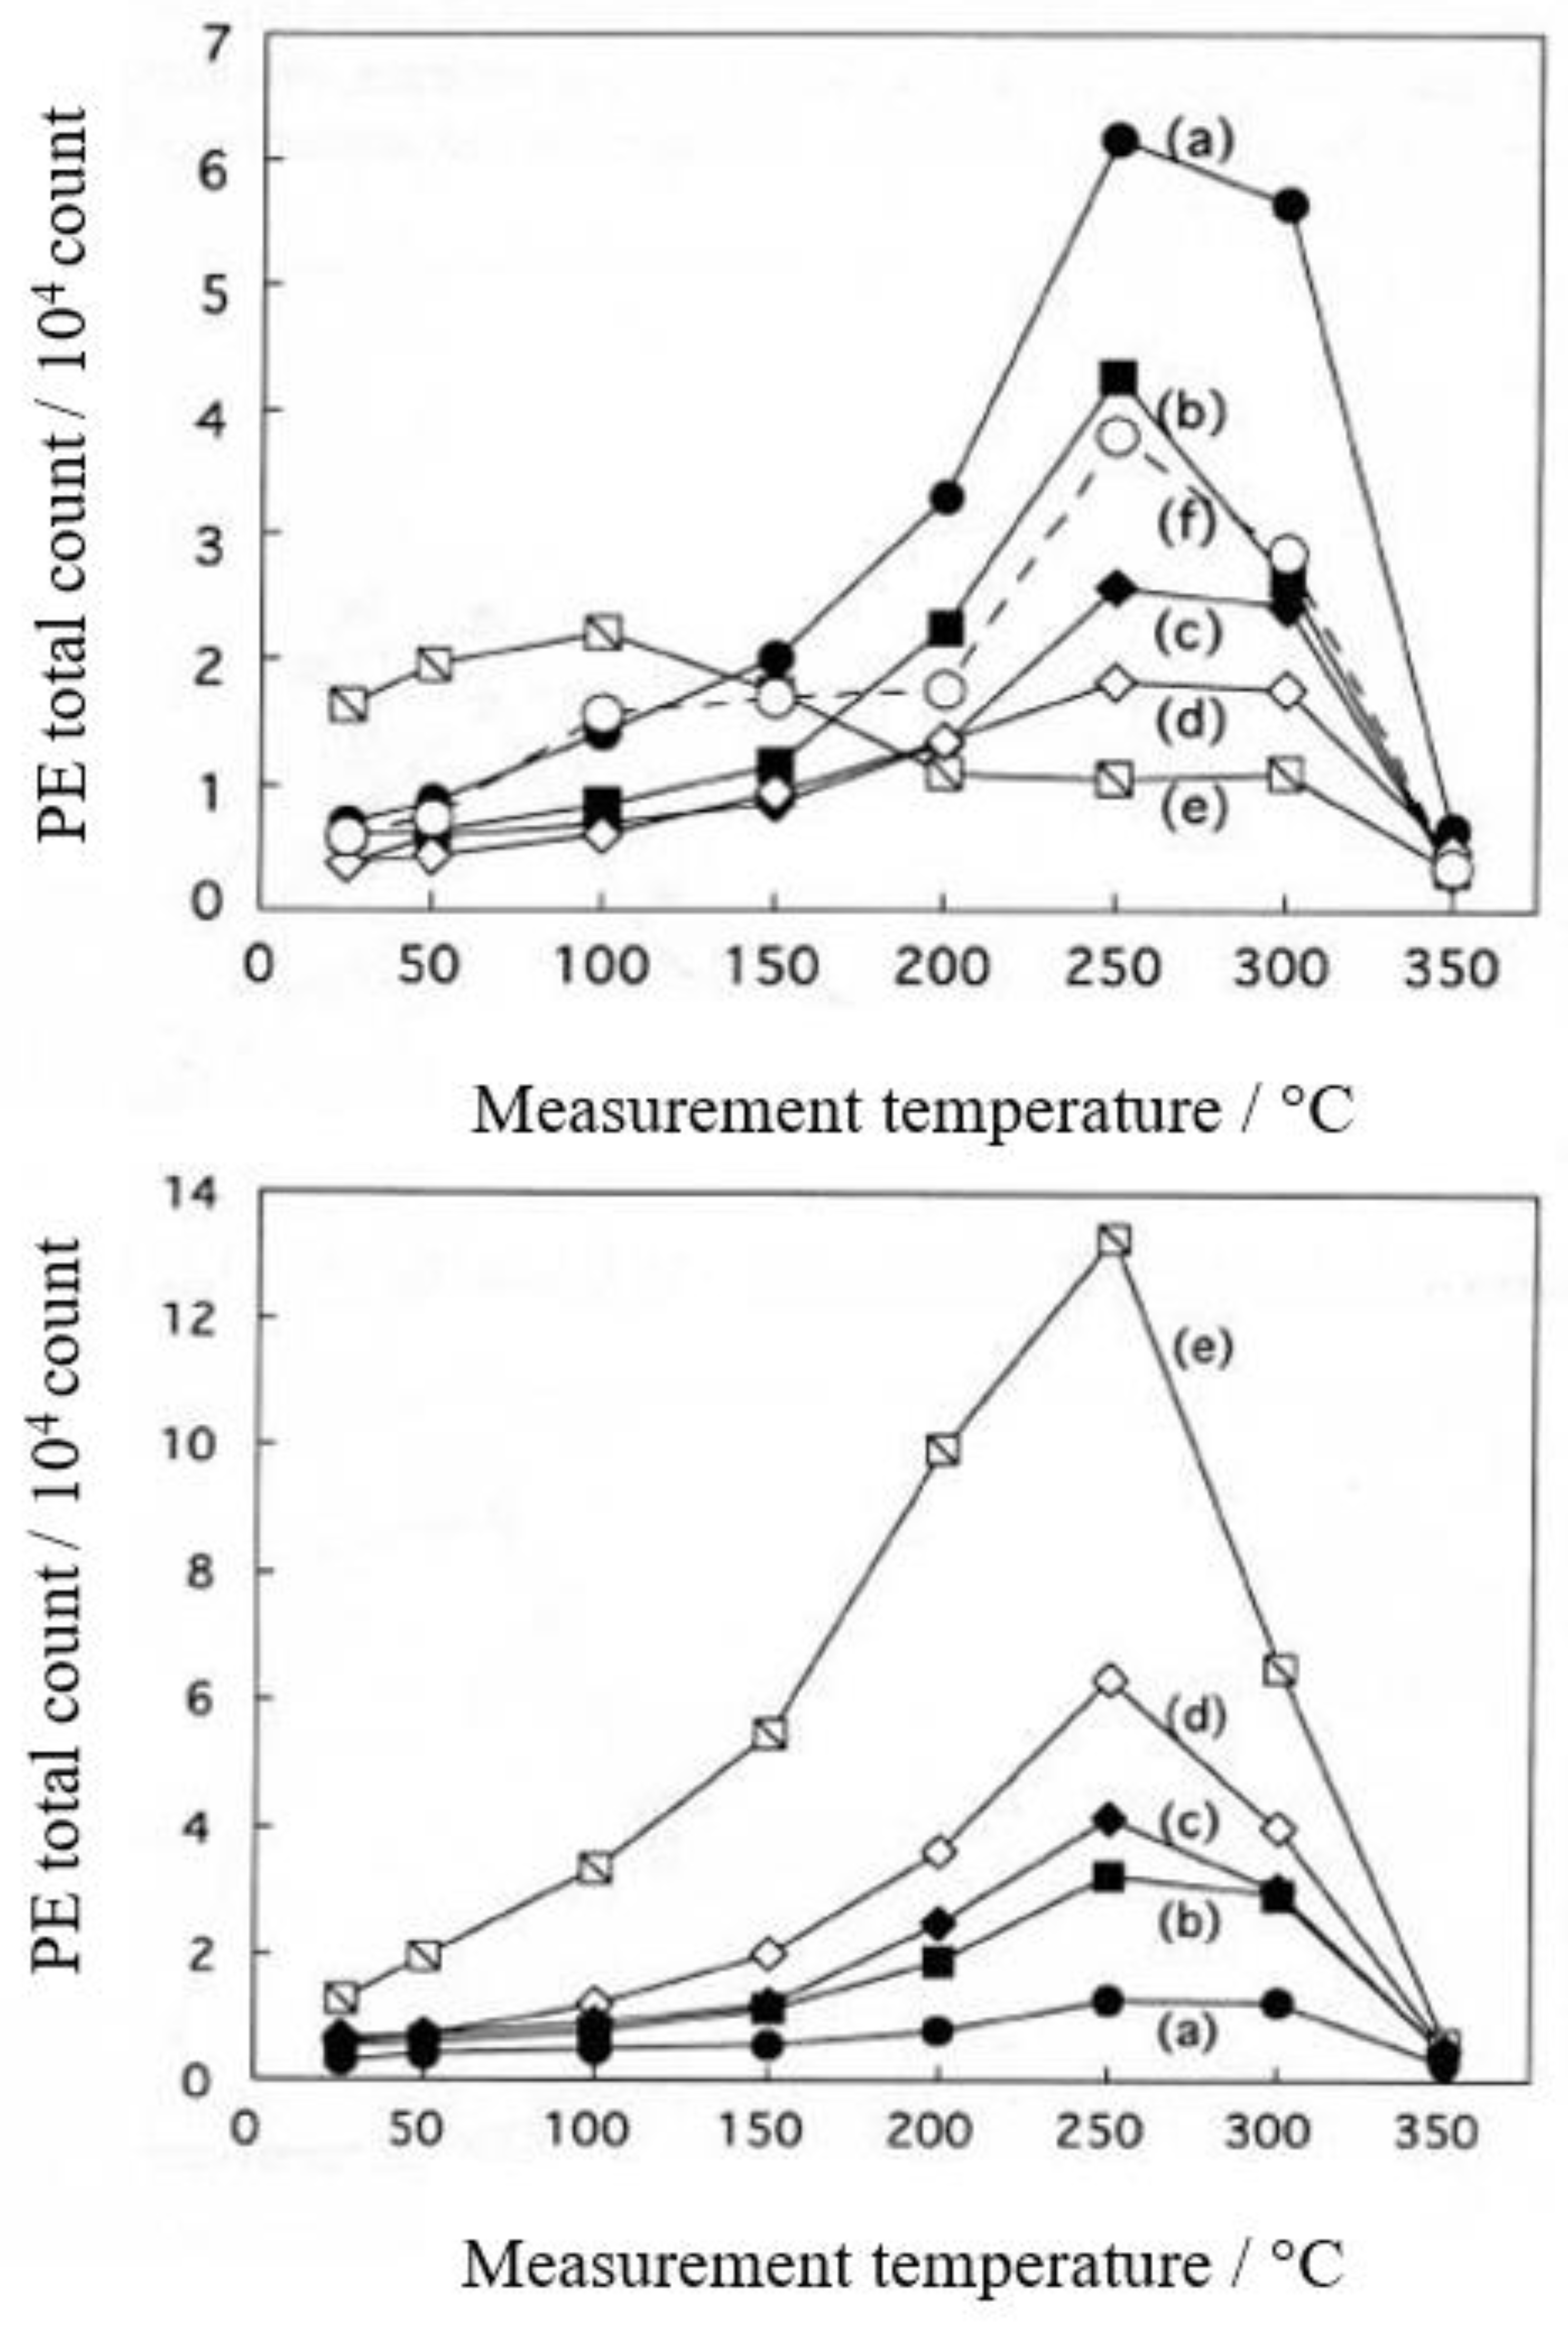
Figure 6.
[Samples A and C] XPS spectra before and after TPPE measurement for copper sheets subjected to only ultrasonic cleaning in liquids and mechanical abrasion by a steel screw for certain periods in liquids and ambient air: liquids and air: (a, b) H2O, (c, d) CH3OH, (e, f) C2H5OH, (g, h) (CH3)2CHOH, (i, j) C3H7OH, (k, l) ambient air; treatment time: (a) after only ultrasonic cleaning for 5 min; (b) 5-min abrasion; (c) 10-min abrasion; (d) 30-min abrasion. The samples were pretreated by ultrasonic cleaning in n-hexane, water, acetone, and then water, followed by drying in vacuum.
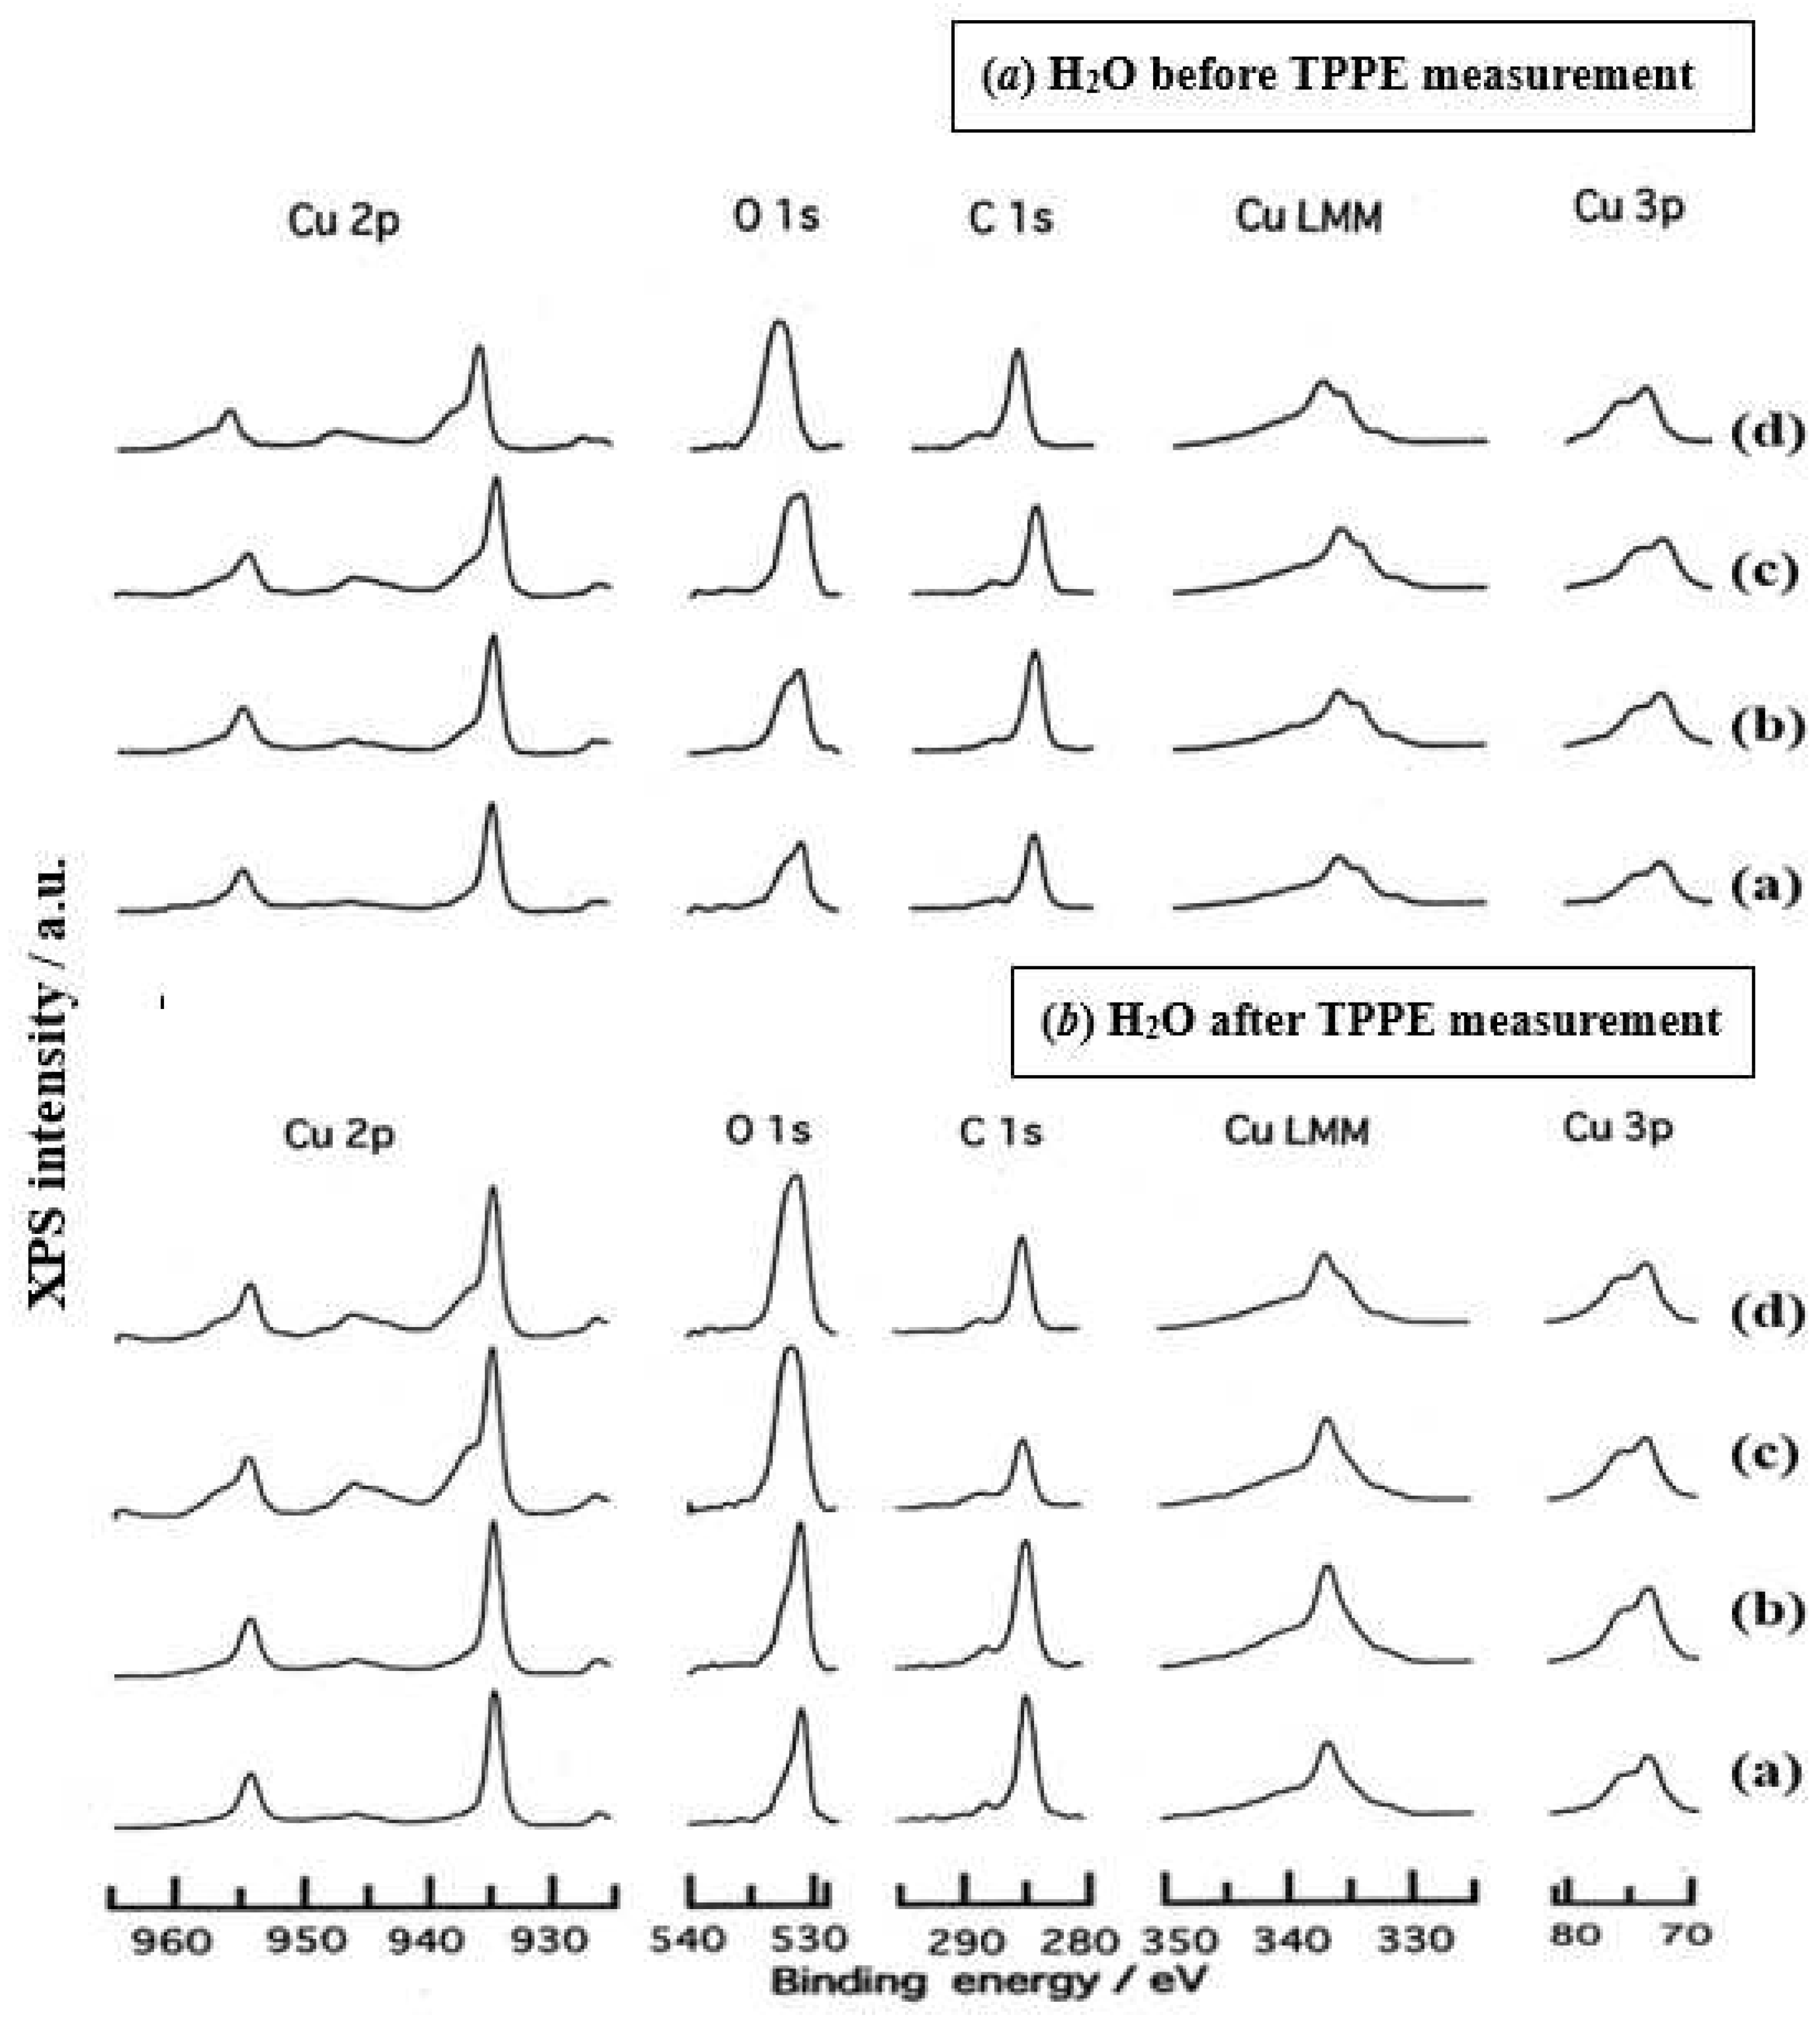
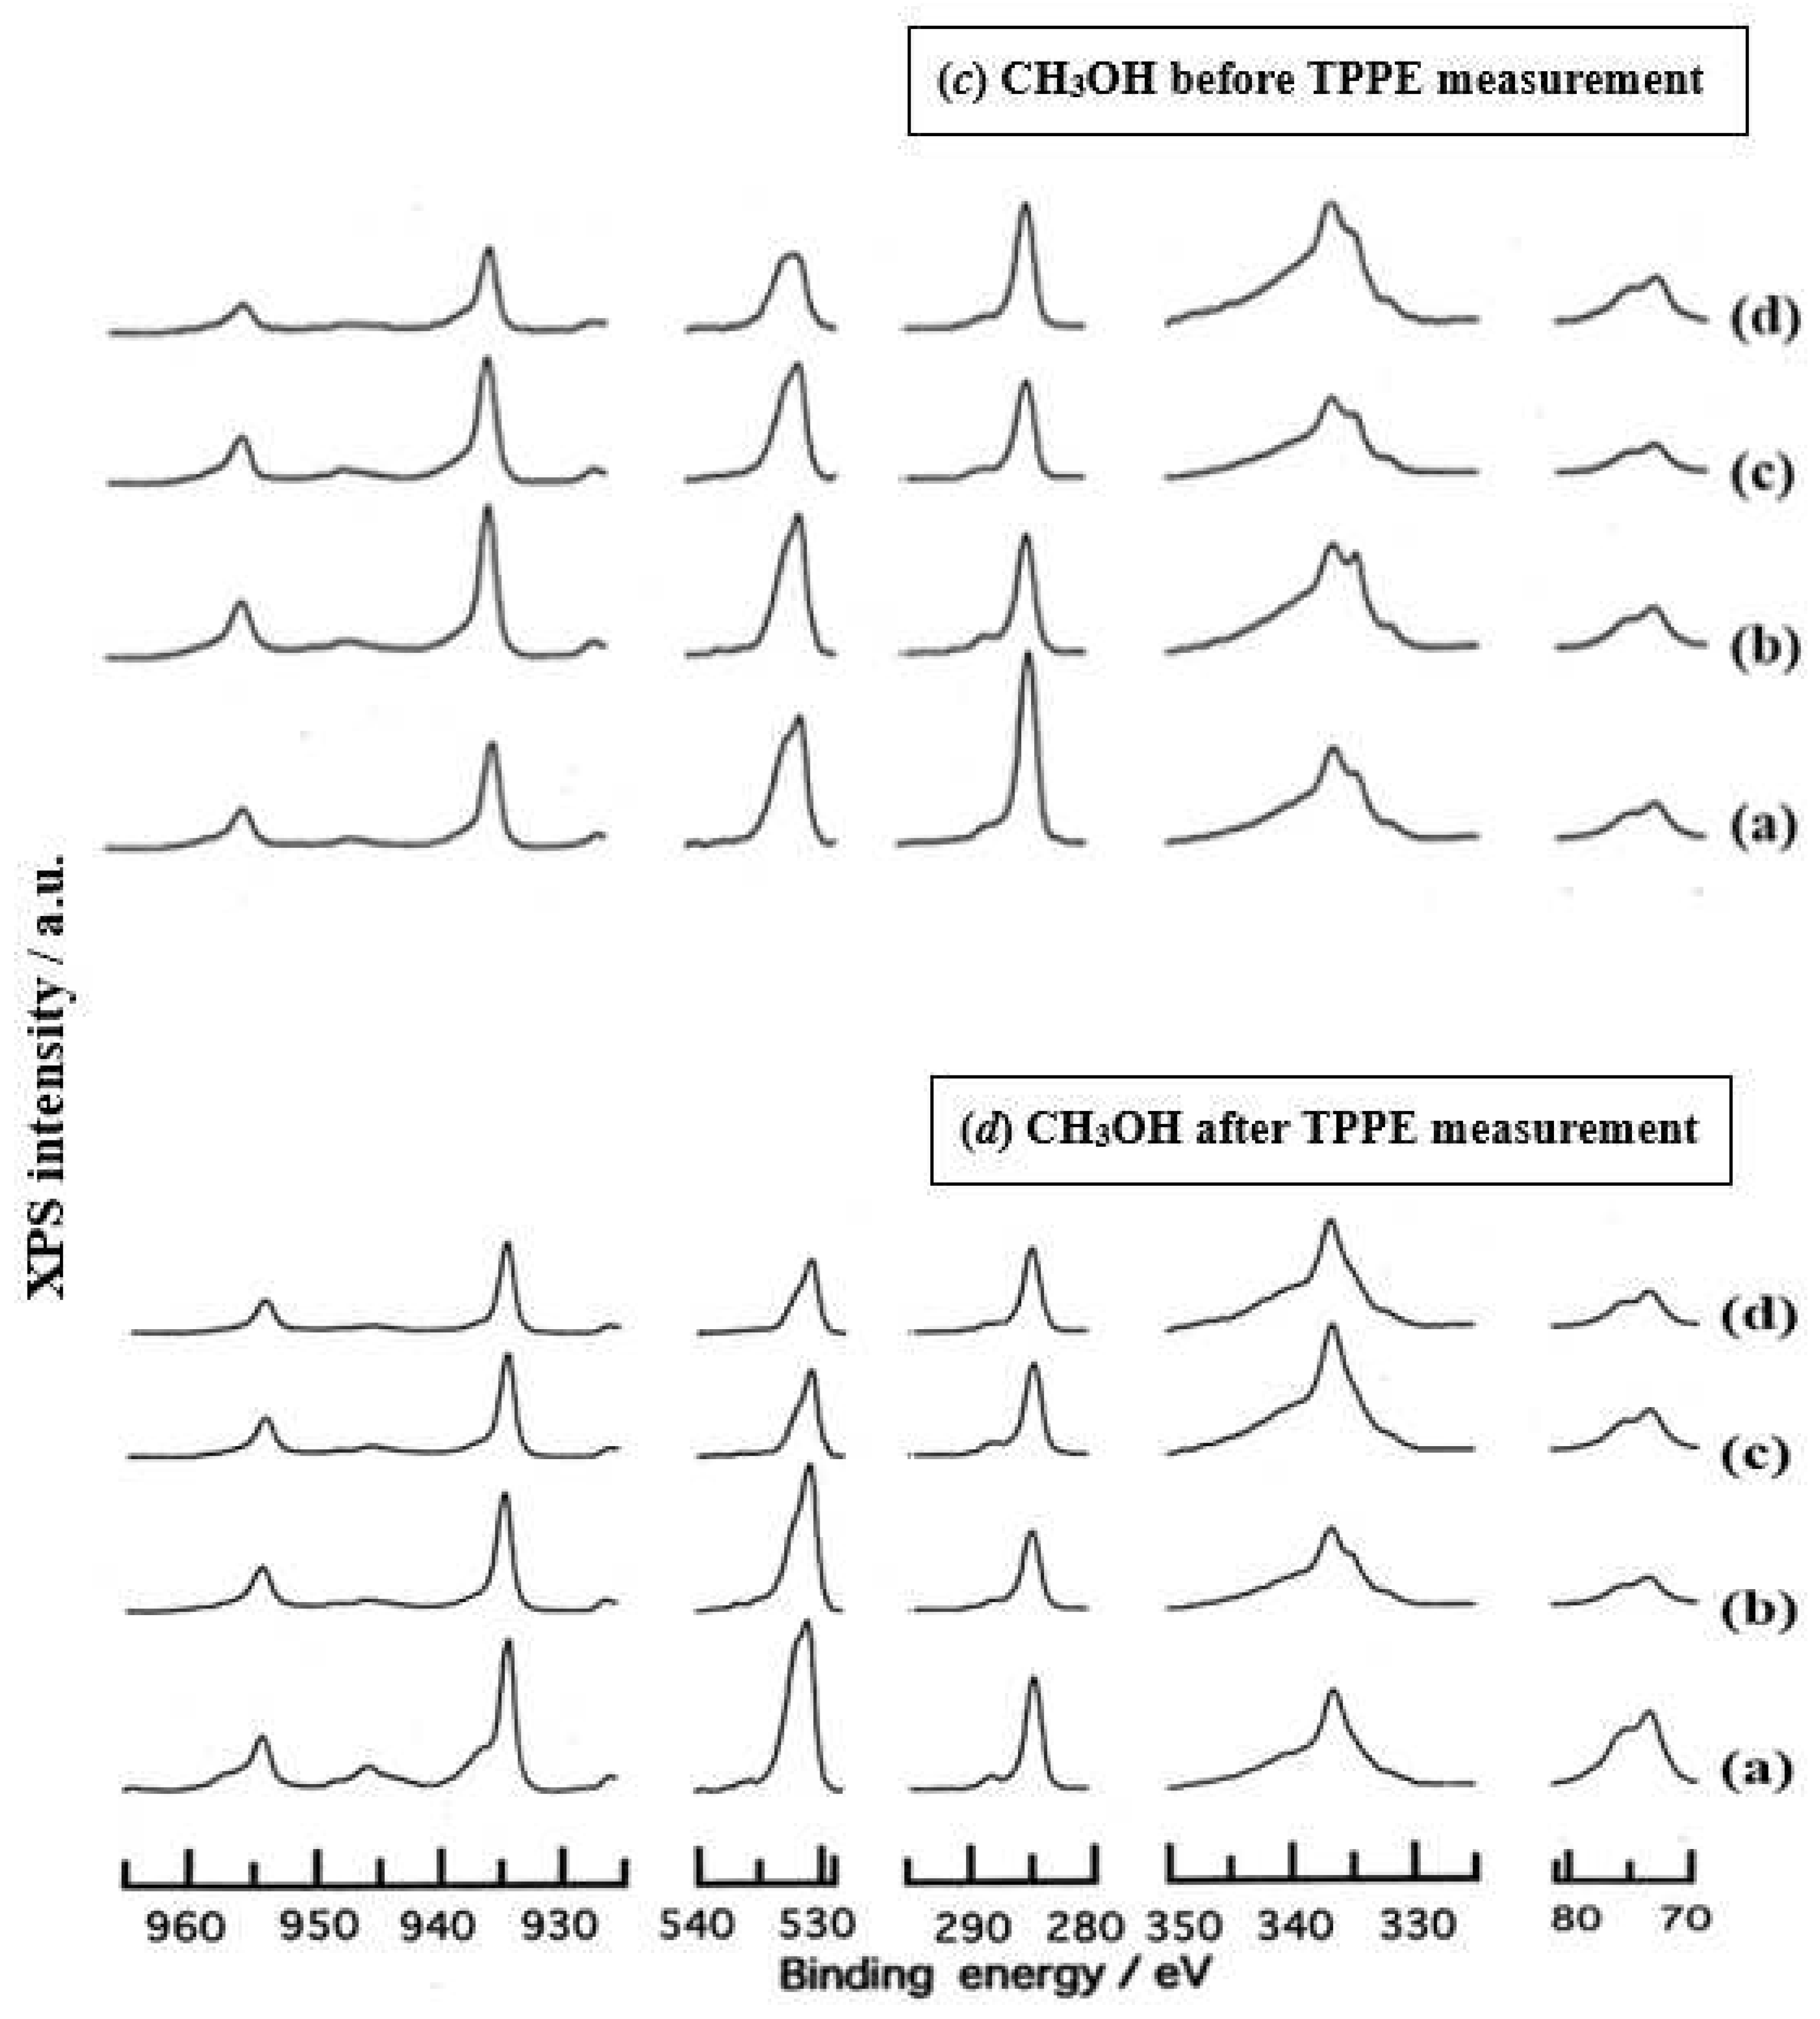
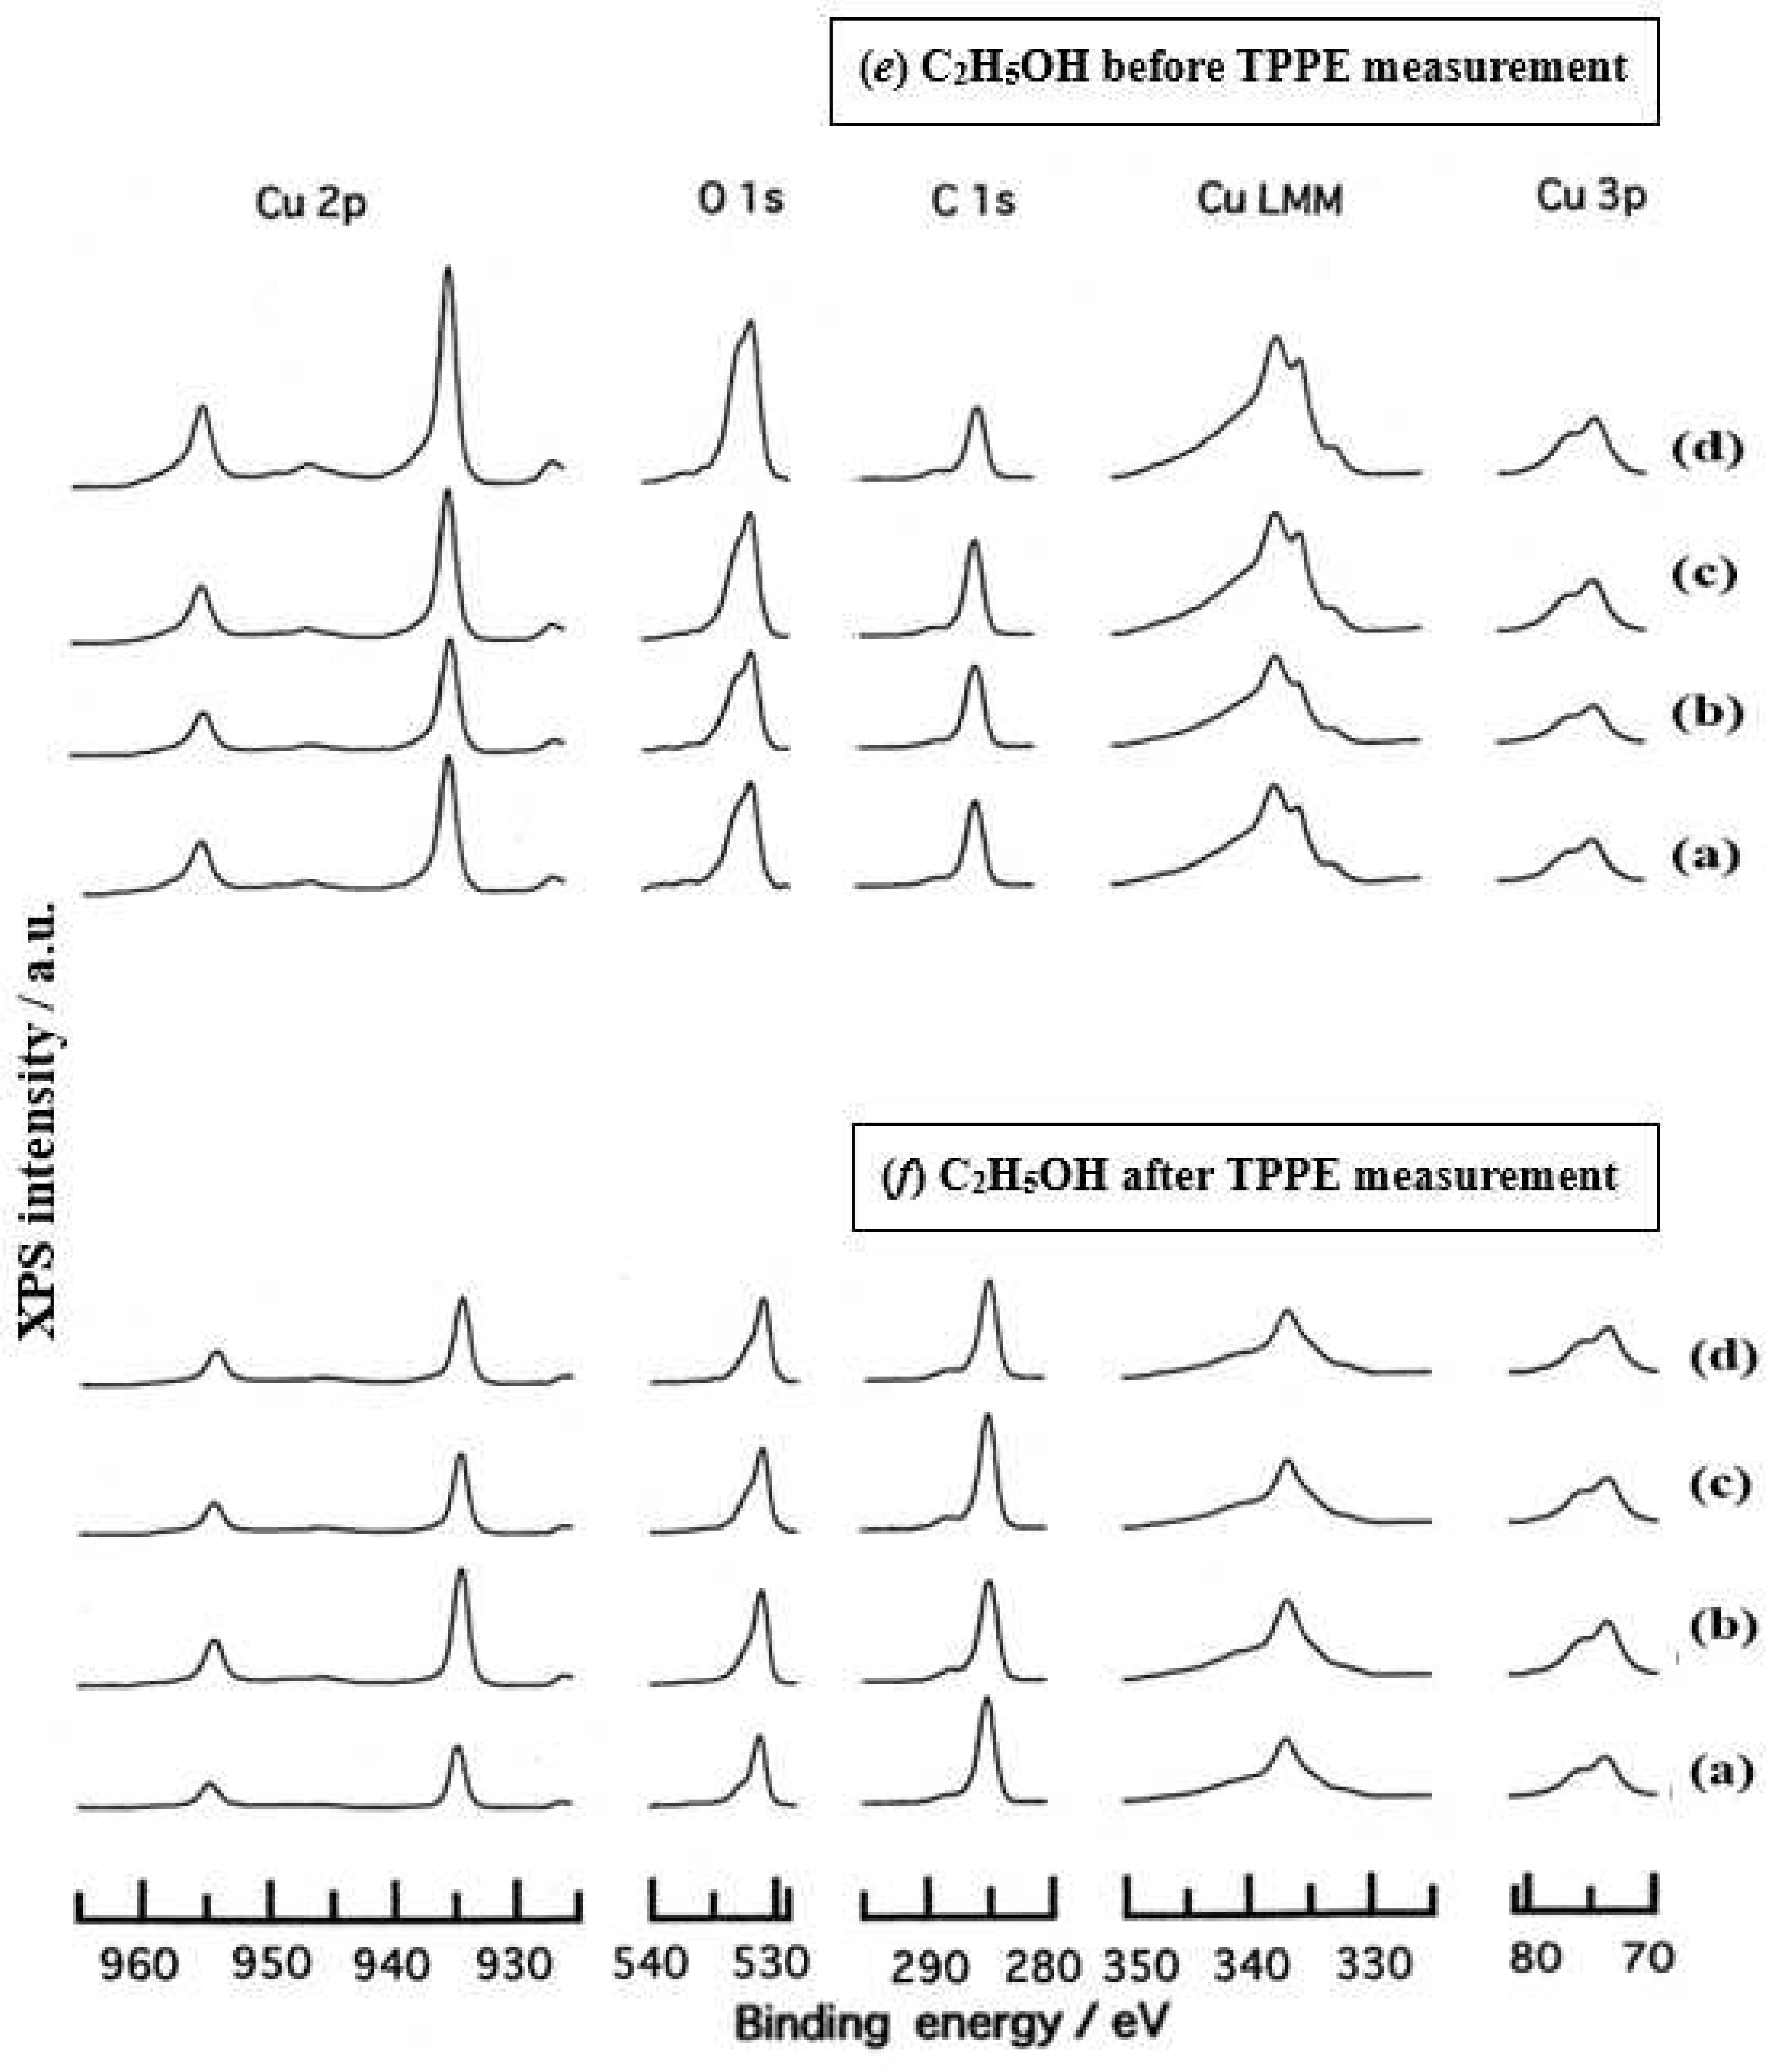
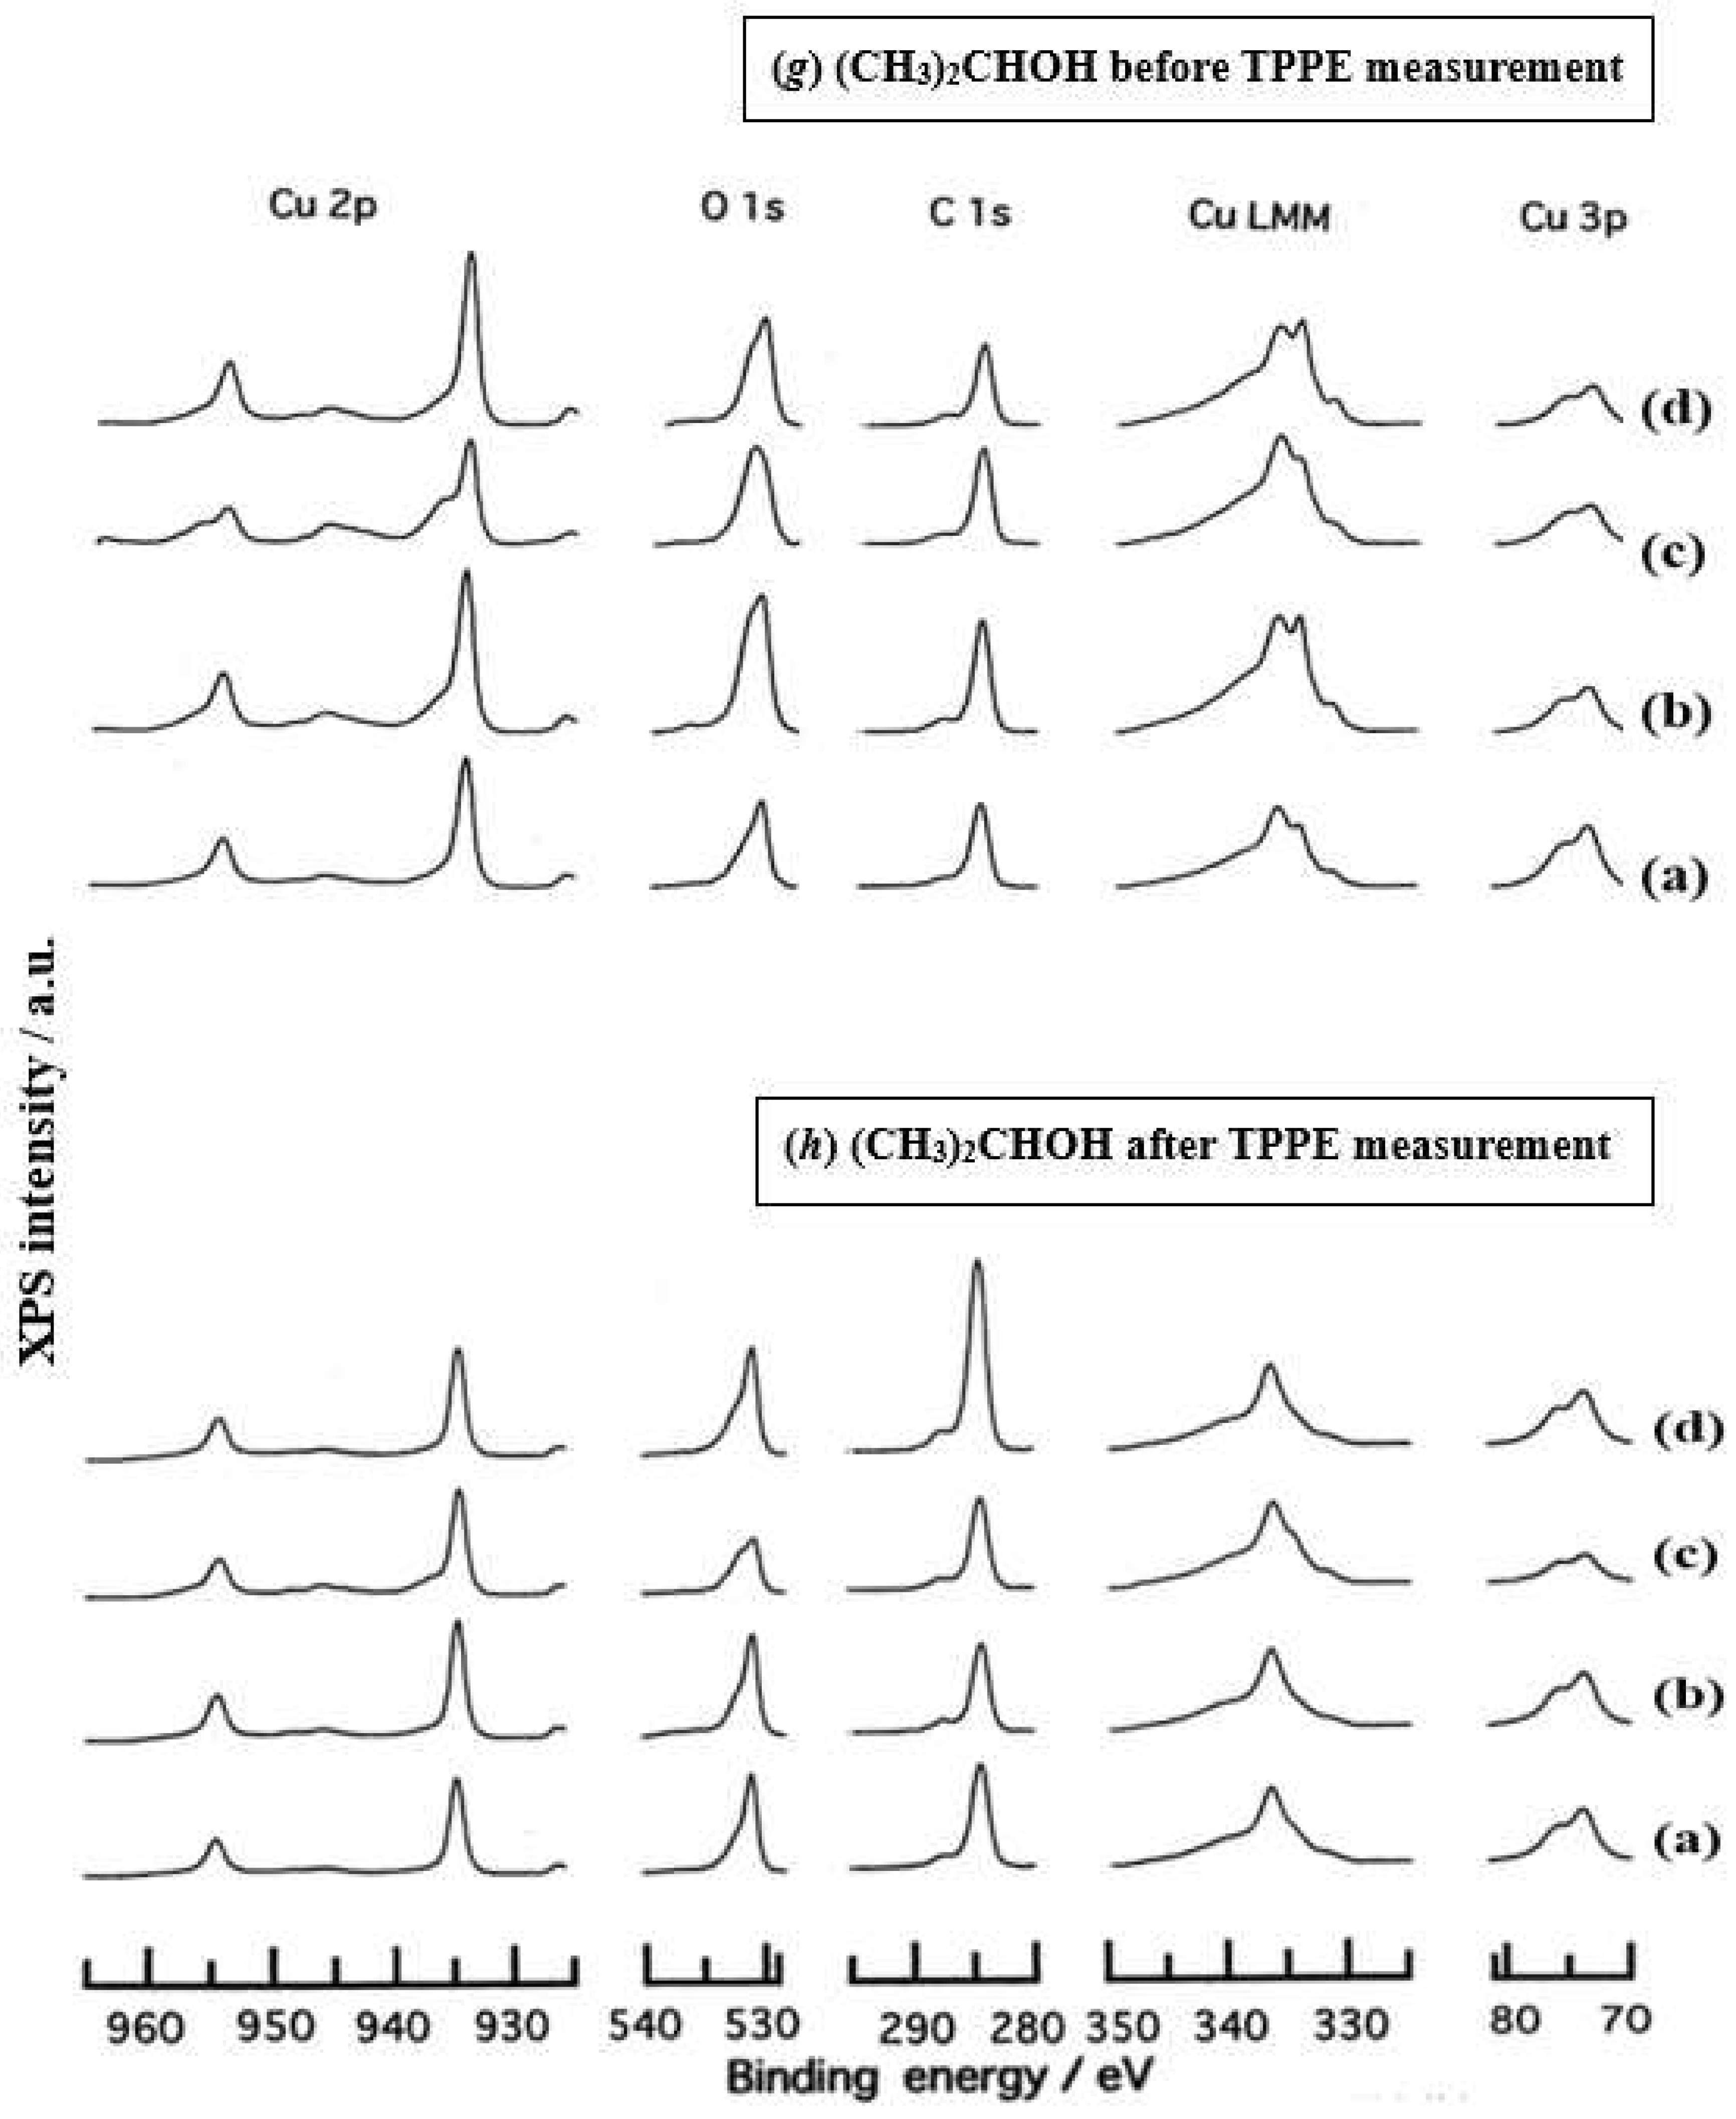
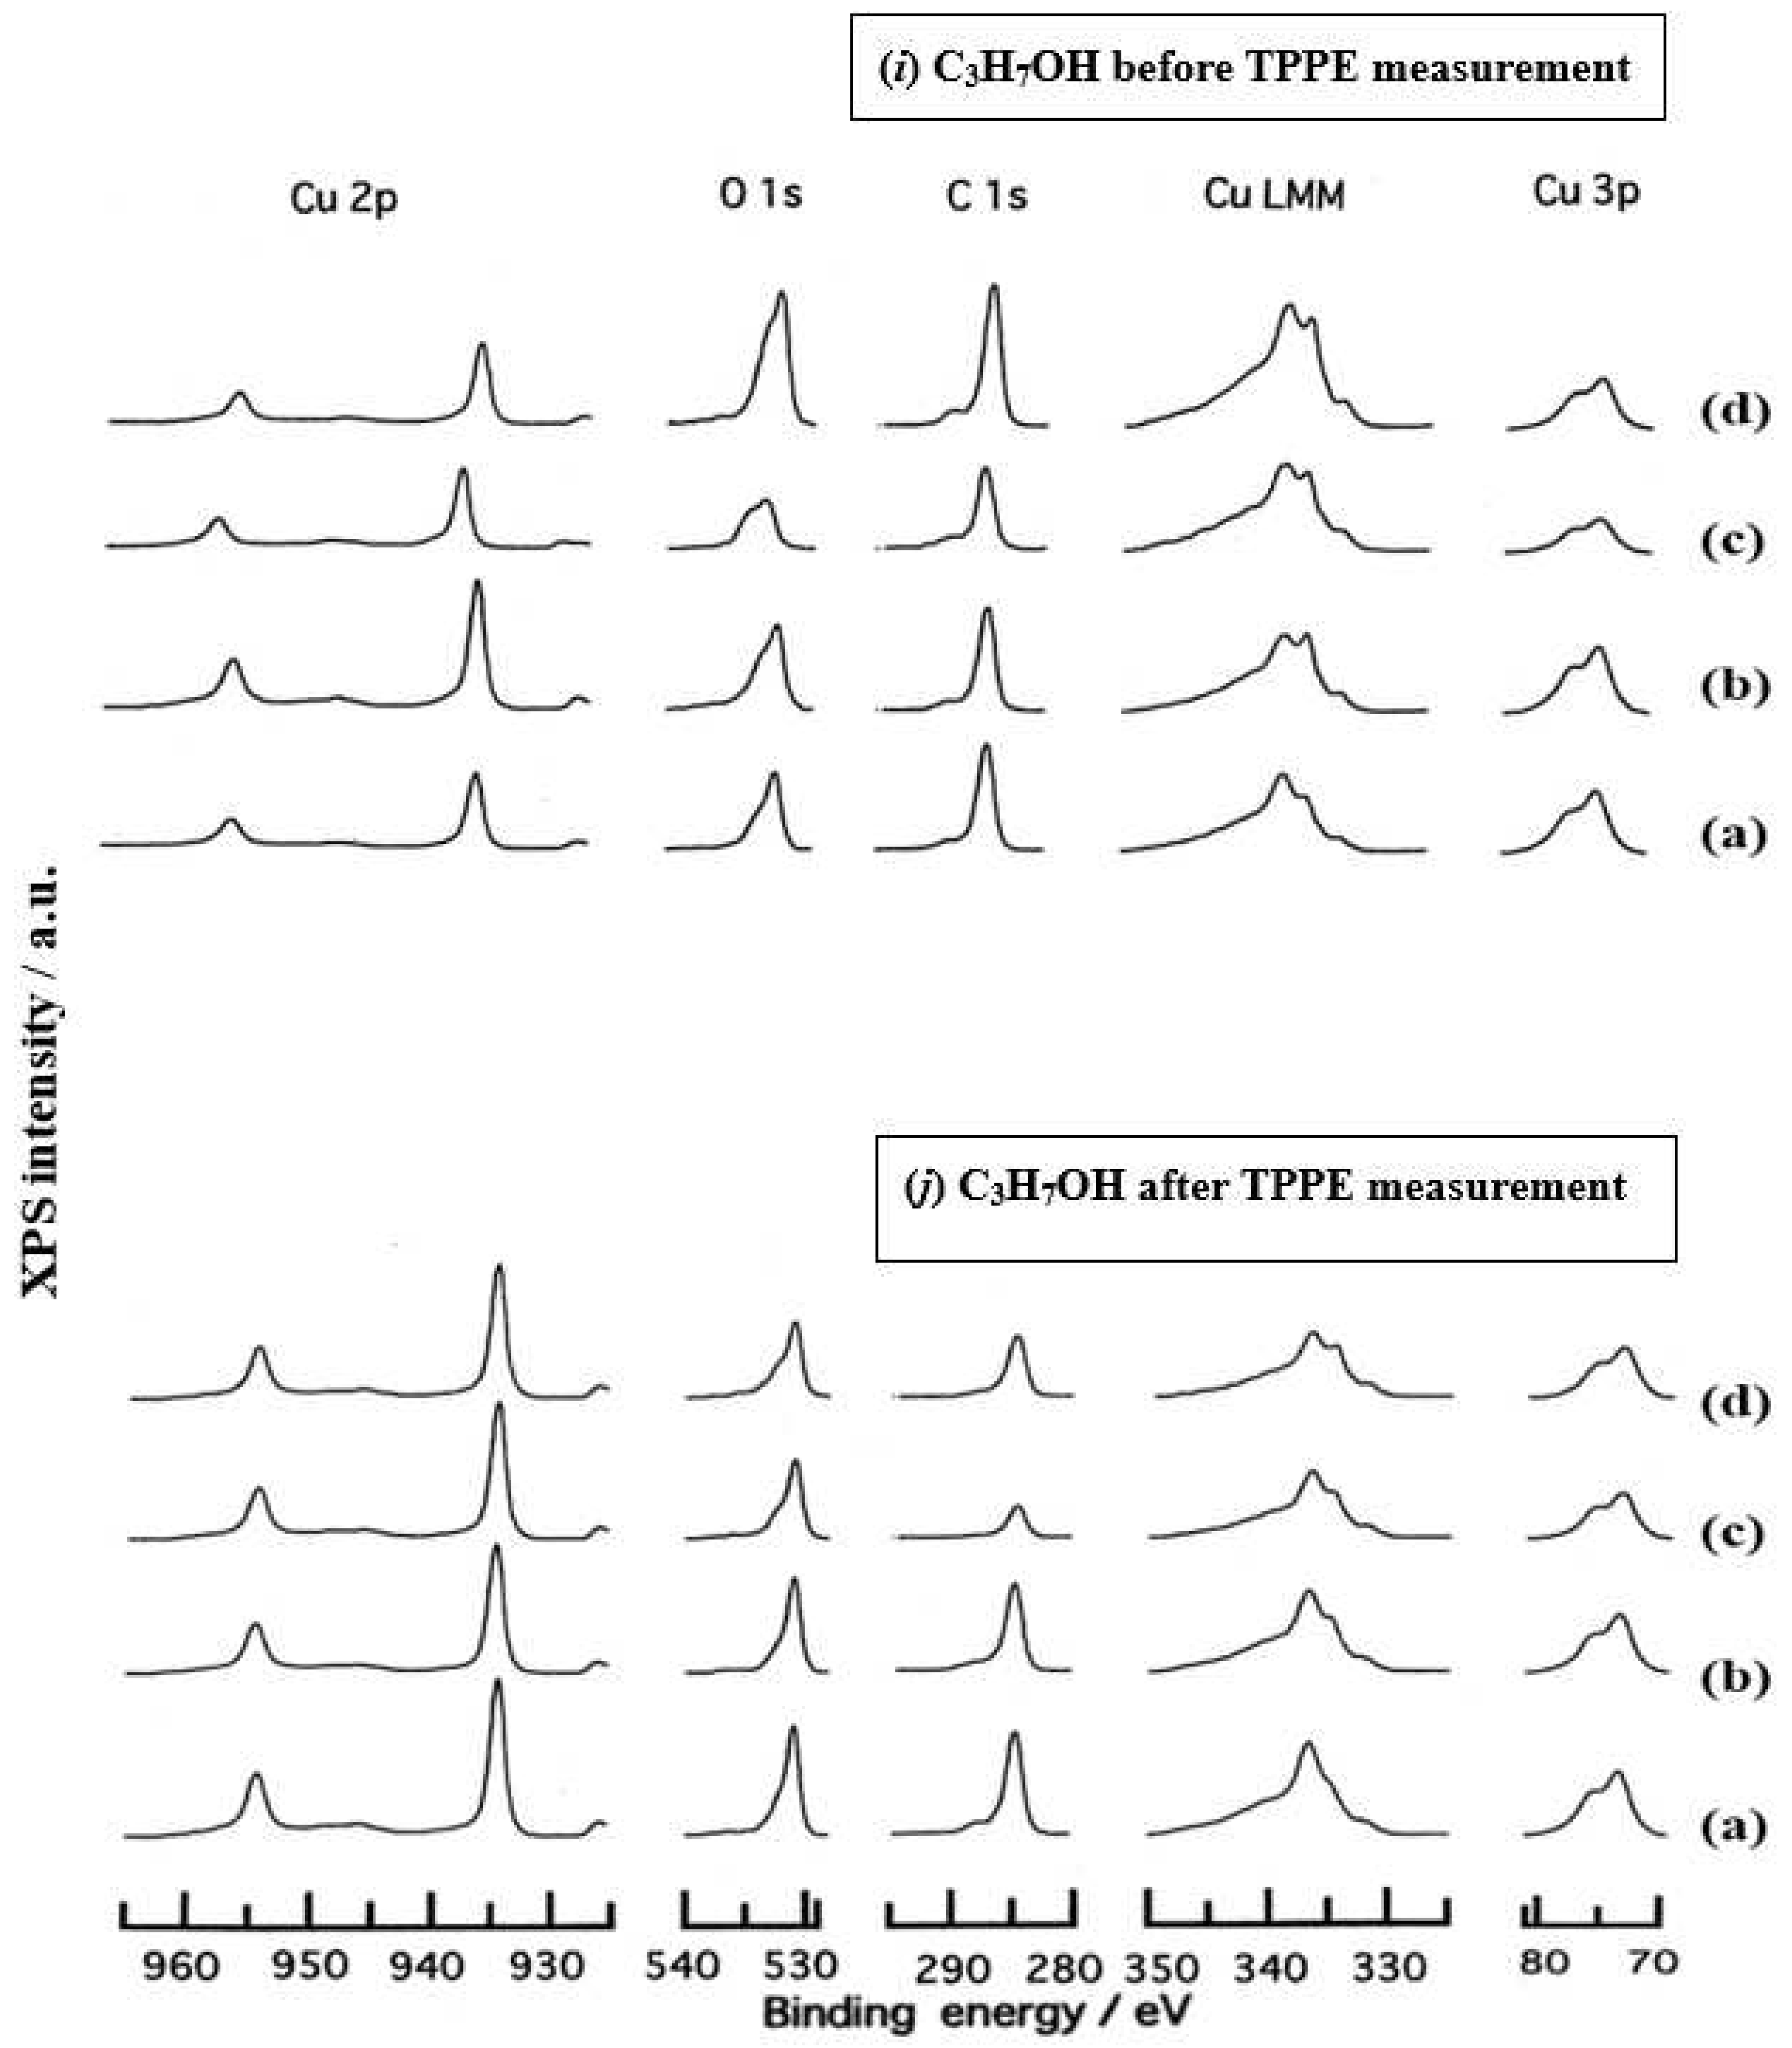
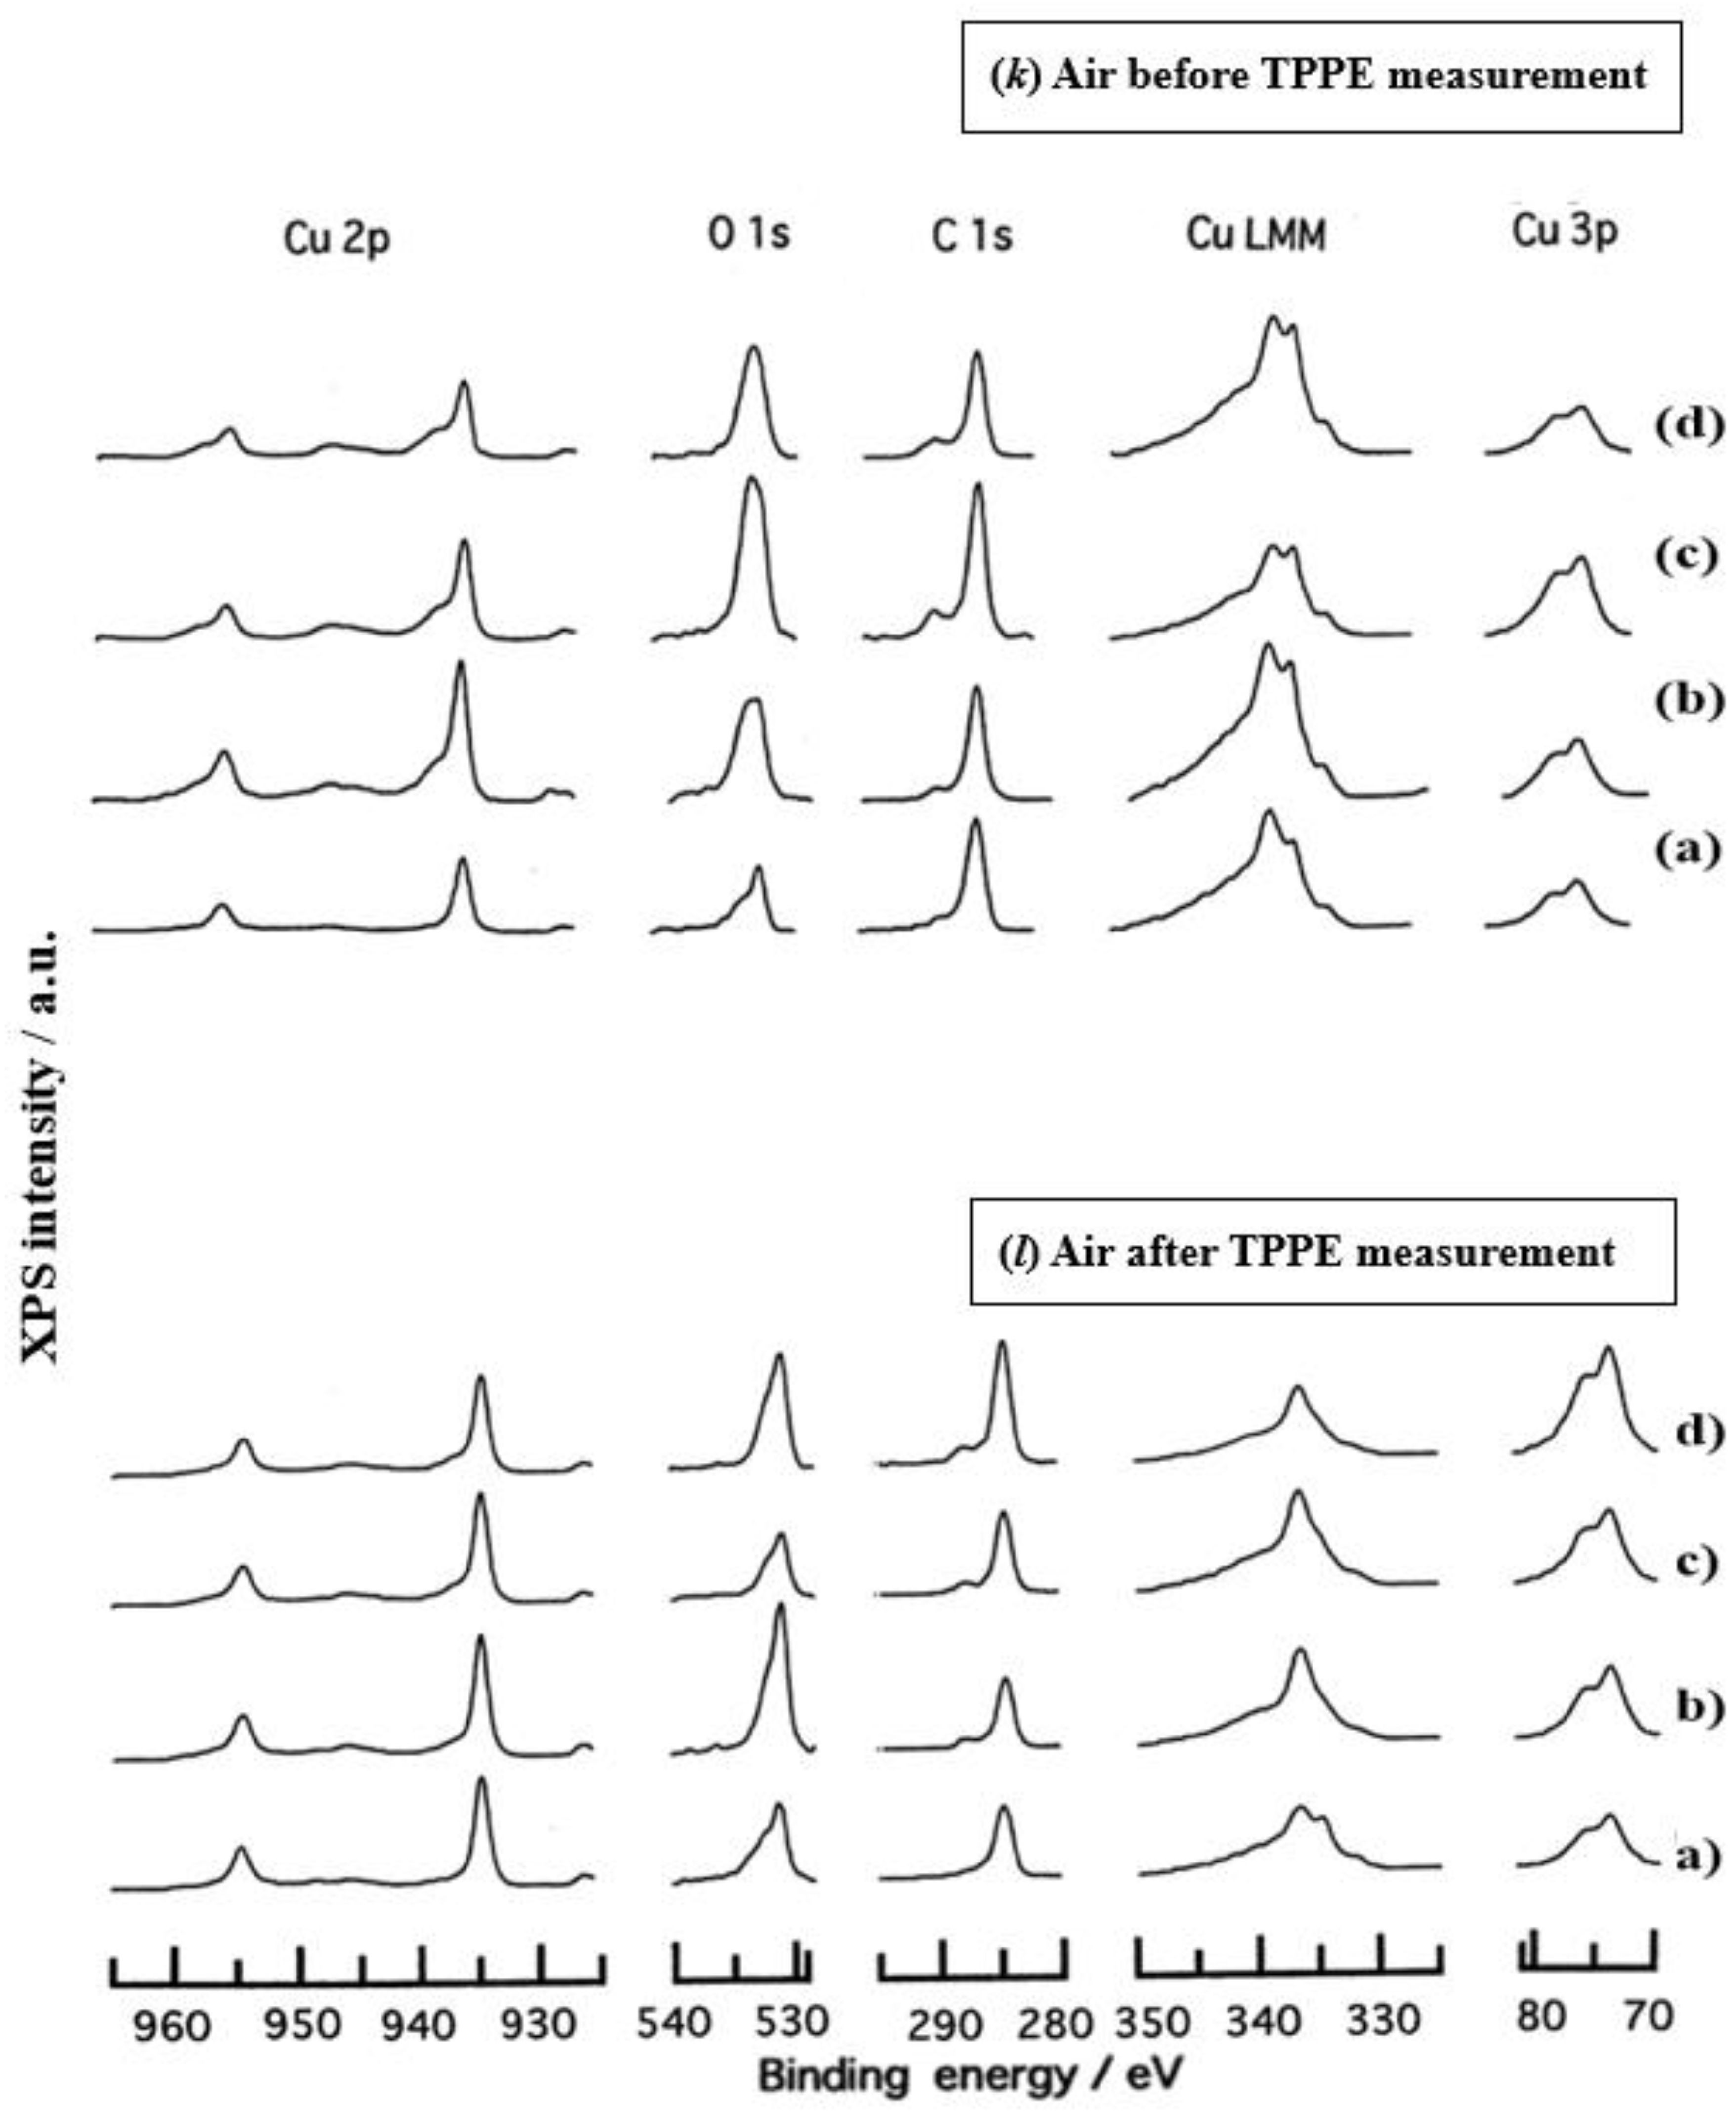
Figure 7.
[Sample A] Arrhenius type plots of ln(NTa) versus the reciprocal of measurement temperature (1/T) for copper samples abraded in liquids and air: (1) H2O; (2) CH3OH: (3) C2H5OH; (4) (CH3)2HOH; (5) C3H7OH; (6) Ambient air. From the equation, represented by NTa = A0NTa×exp(−ΔEa/kT), ΔEa and A0NTa were obtained. Among the NTa data by the wavelength scan from 300 to 170 nm at different temperatures in the temperature range of 25−350°C during temperature-increase and subsequent temperature-decrease processes the NTa values in the temperature range of 25−250°C were used for Up1 and Down1 scans representing the 1st temperature-increase and subsequent temperature-decrease processes, respectively.
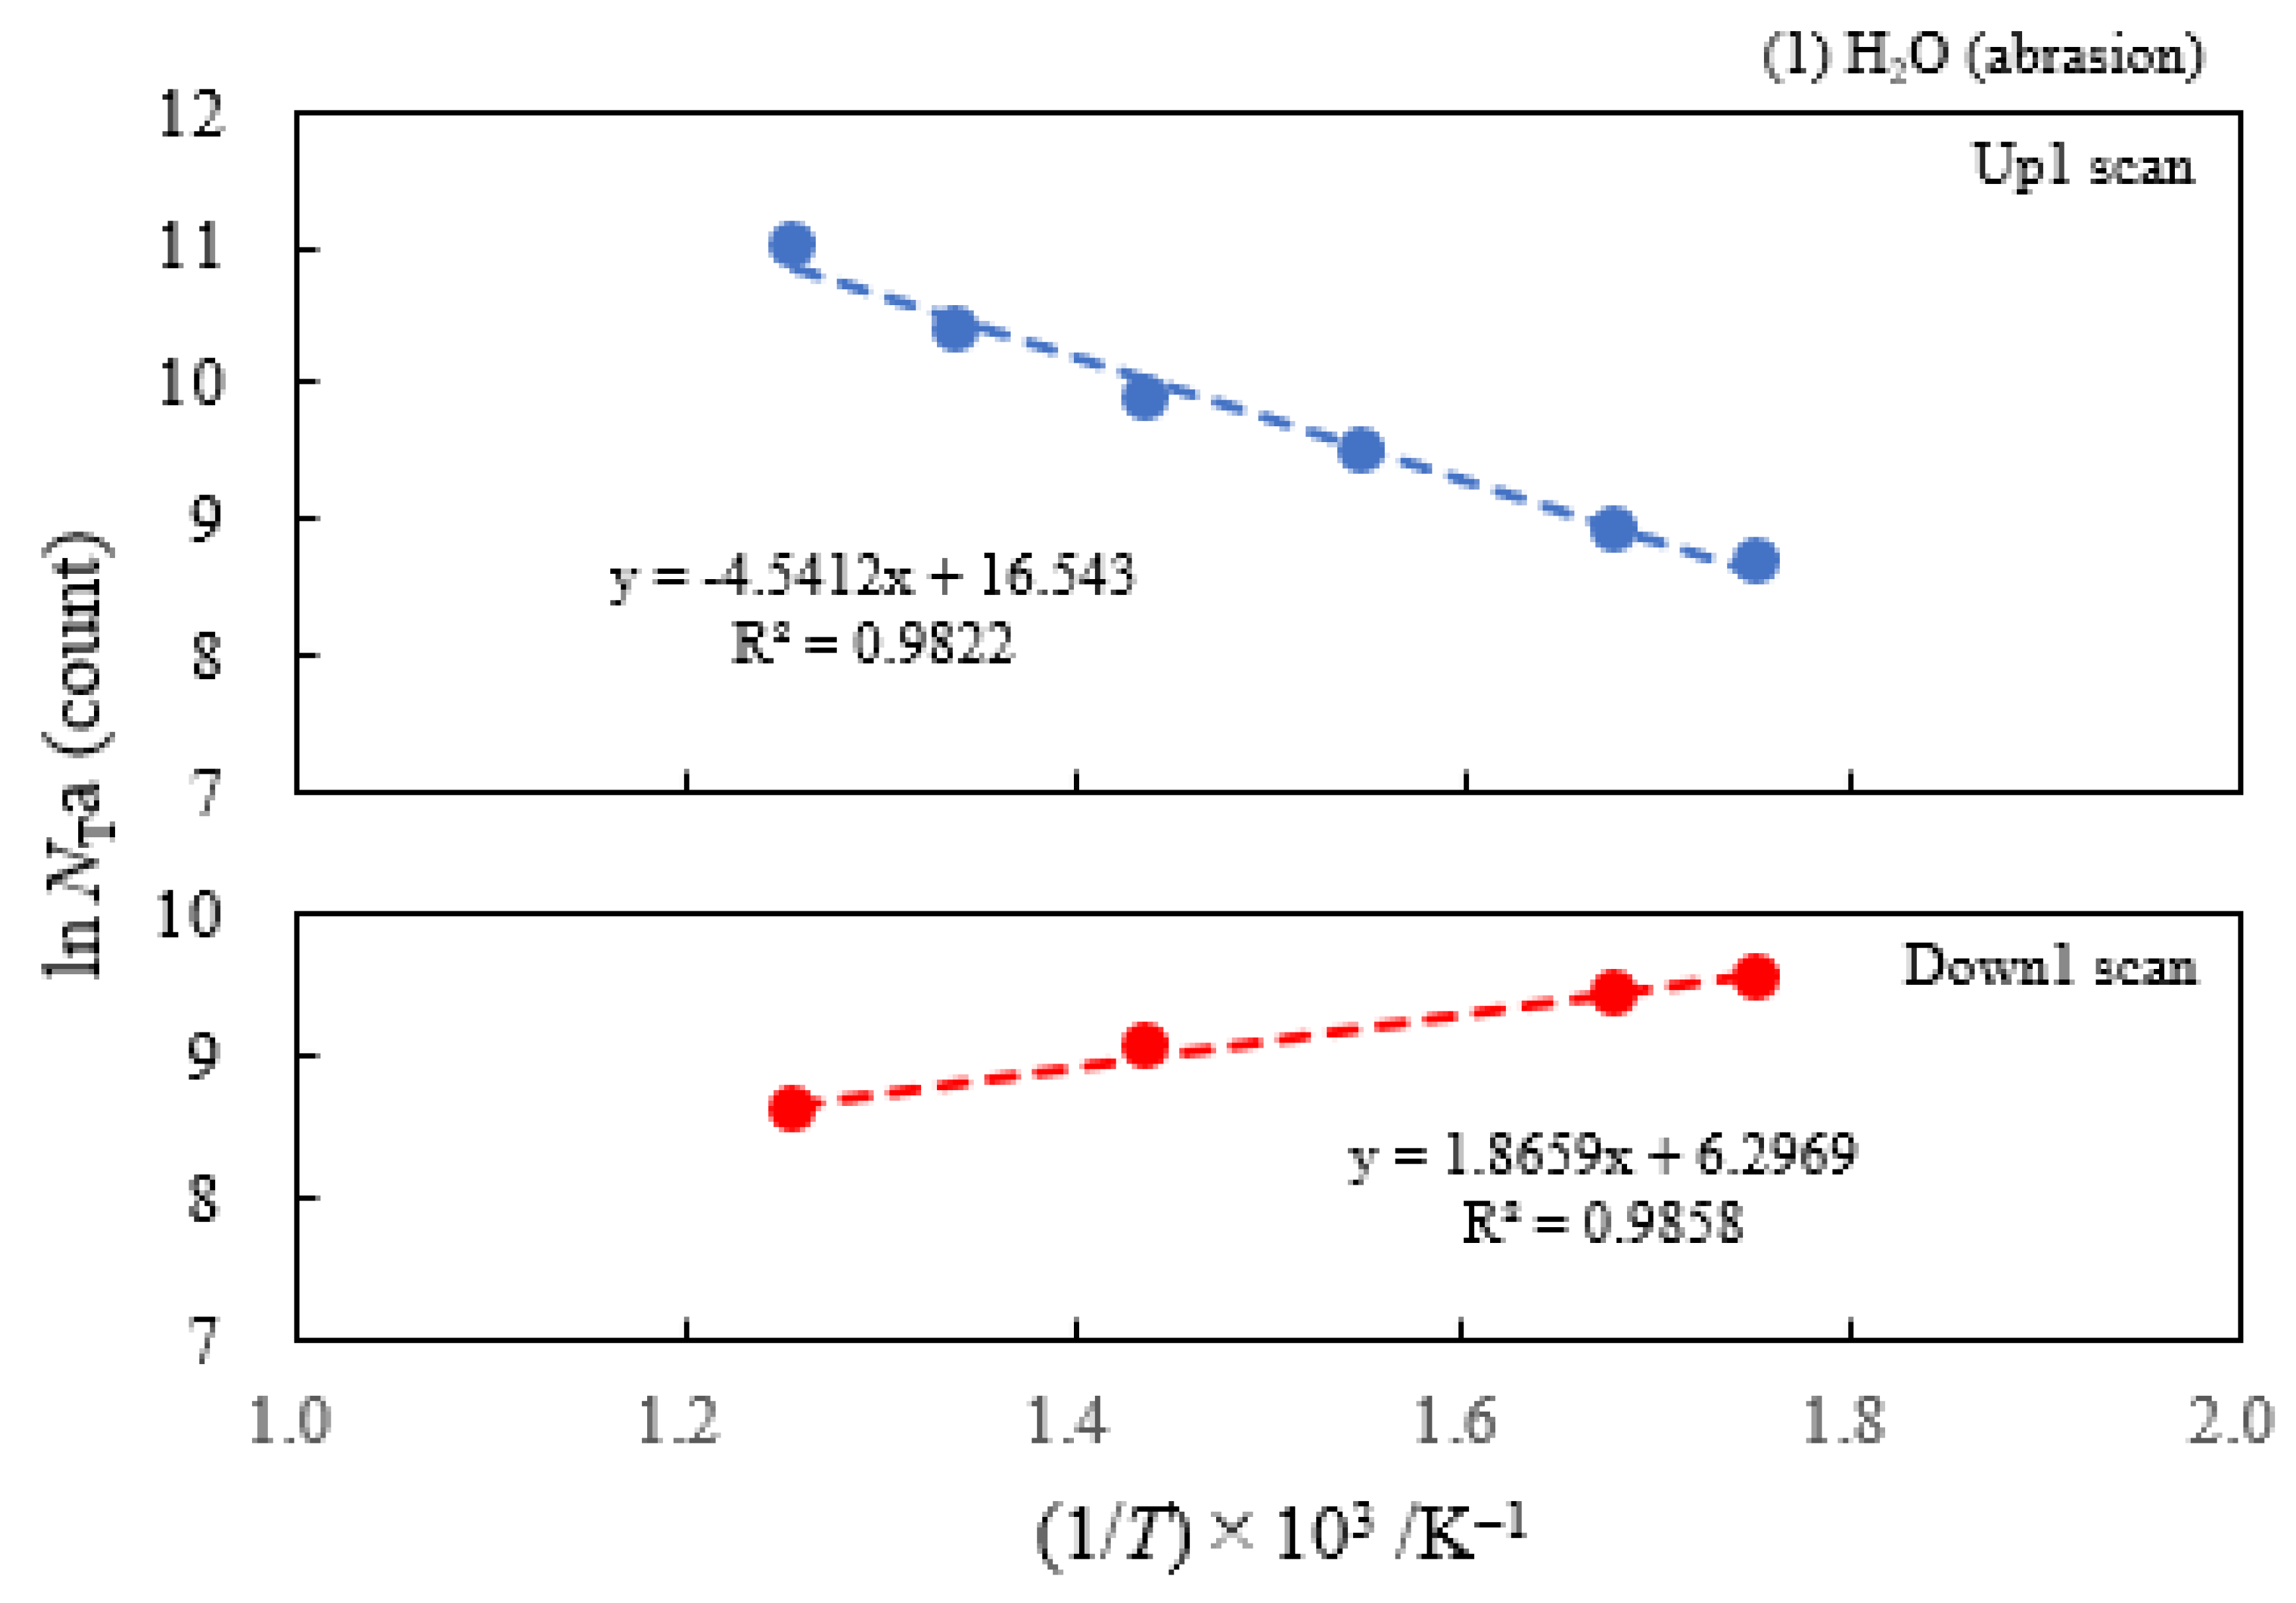
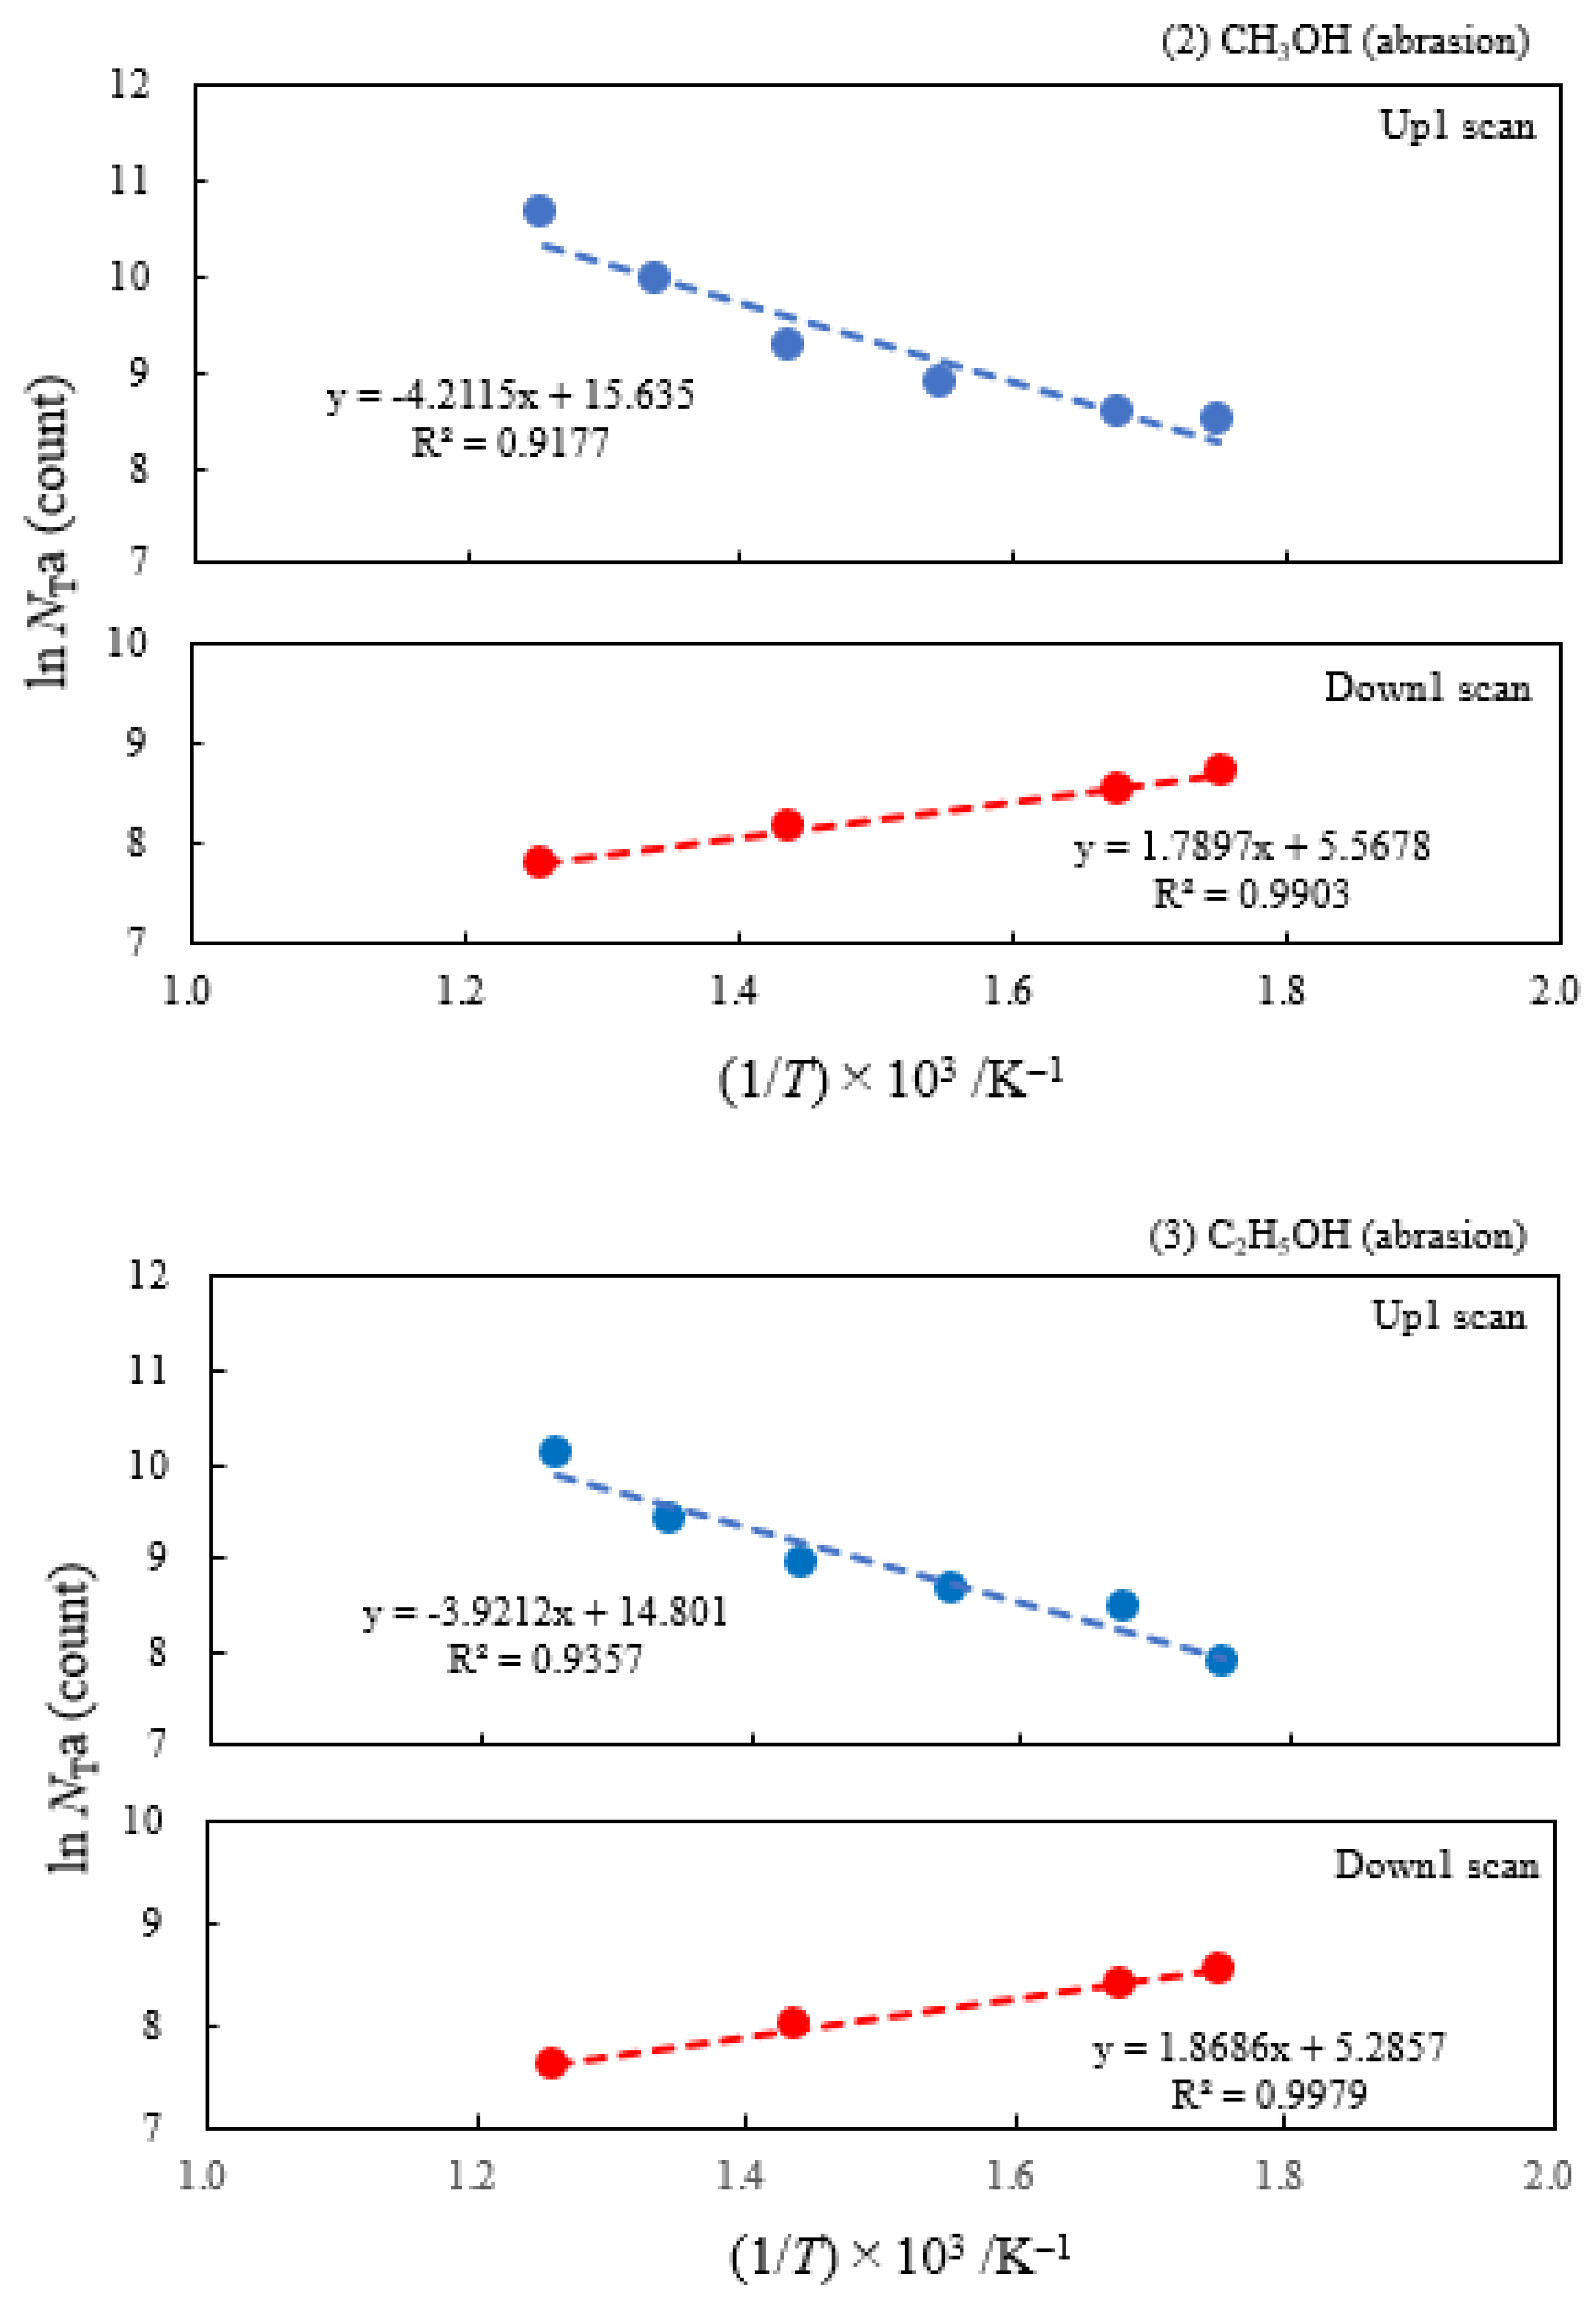
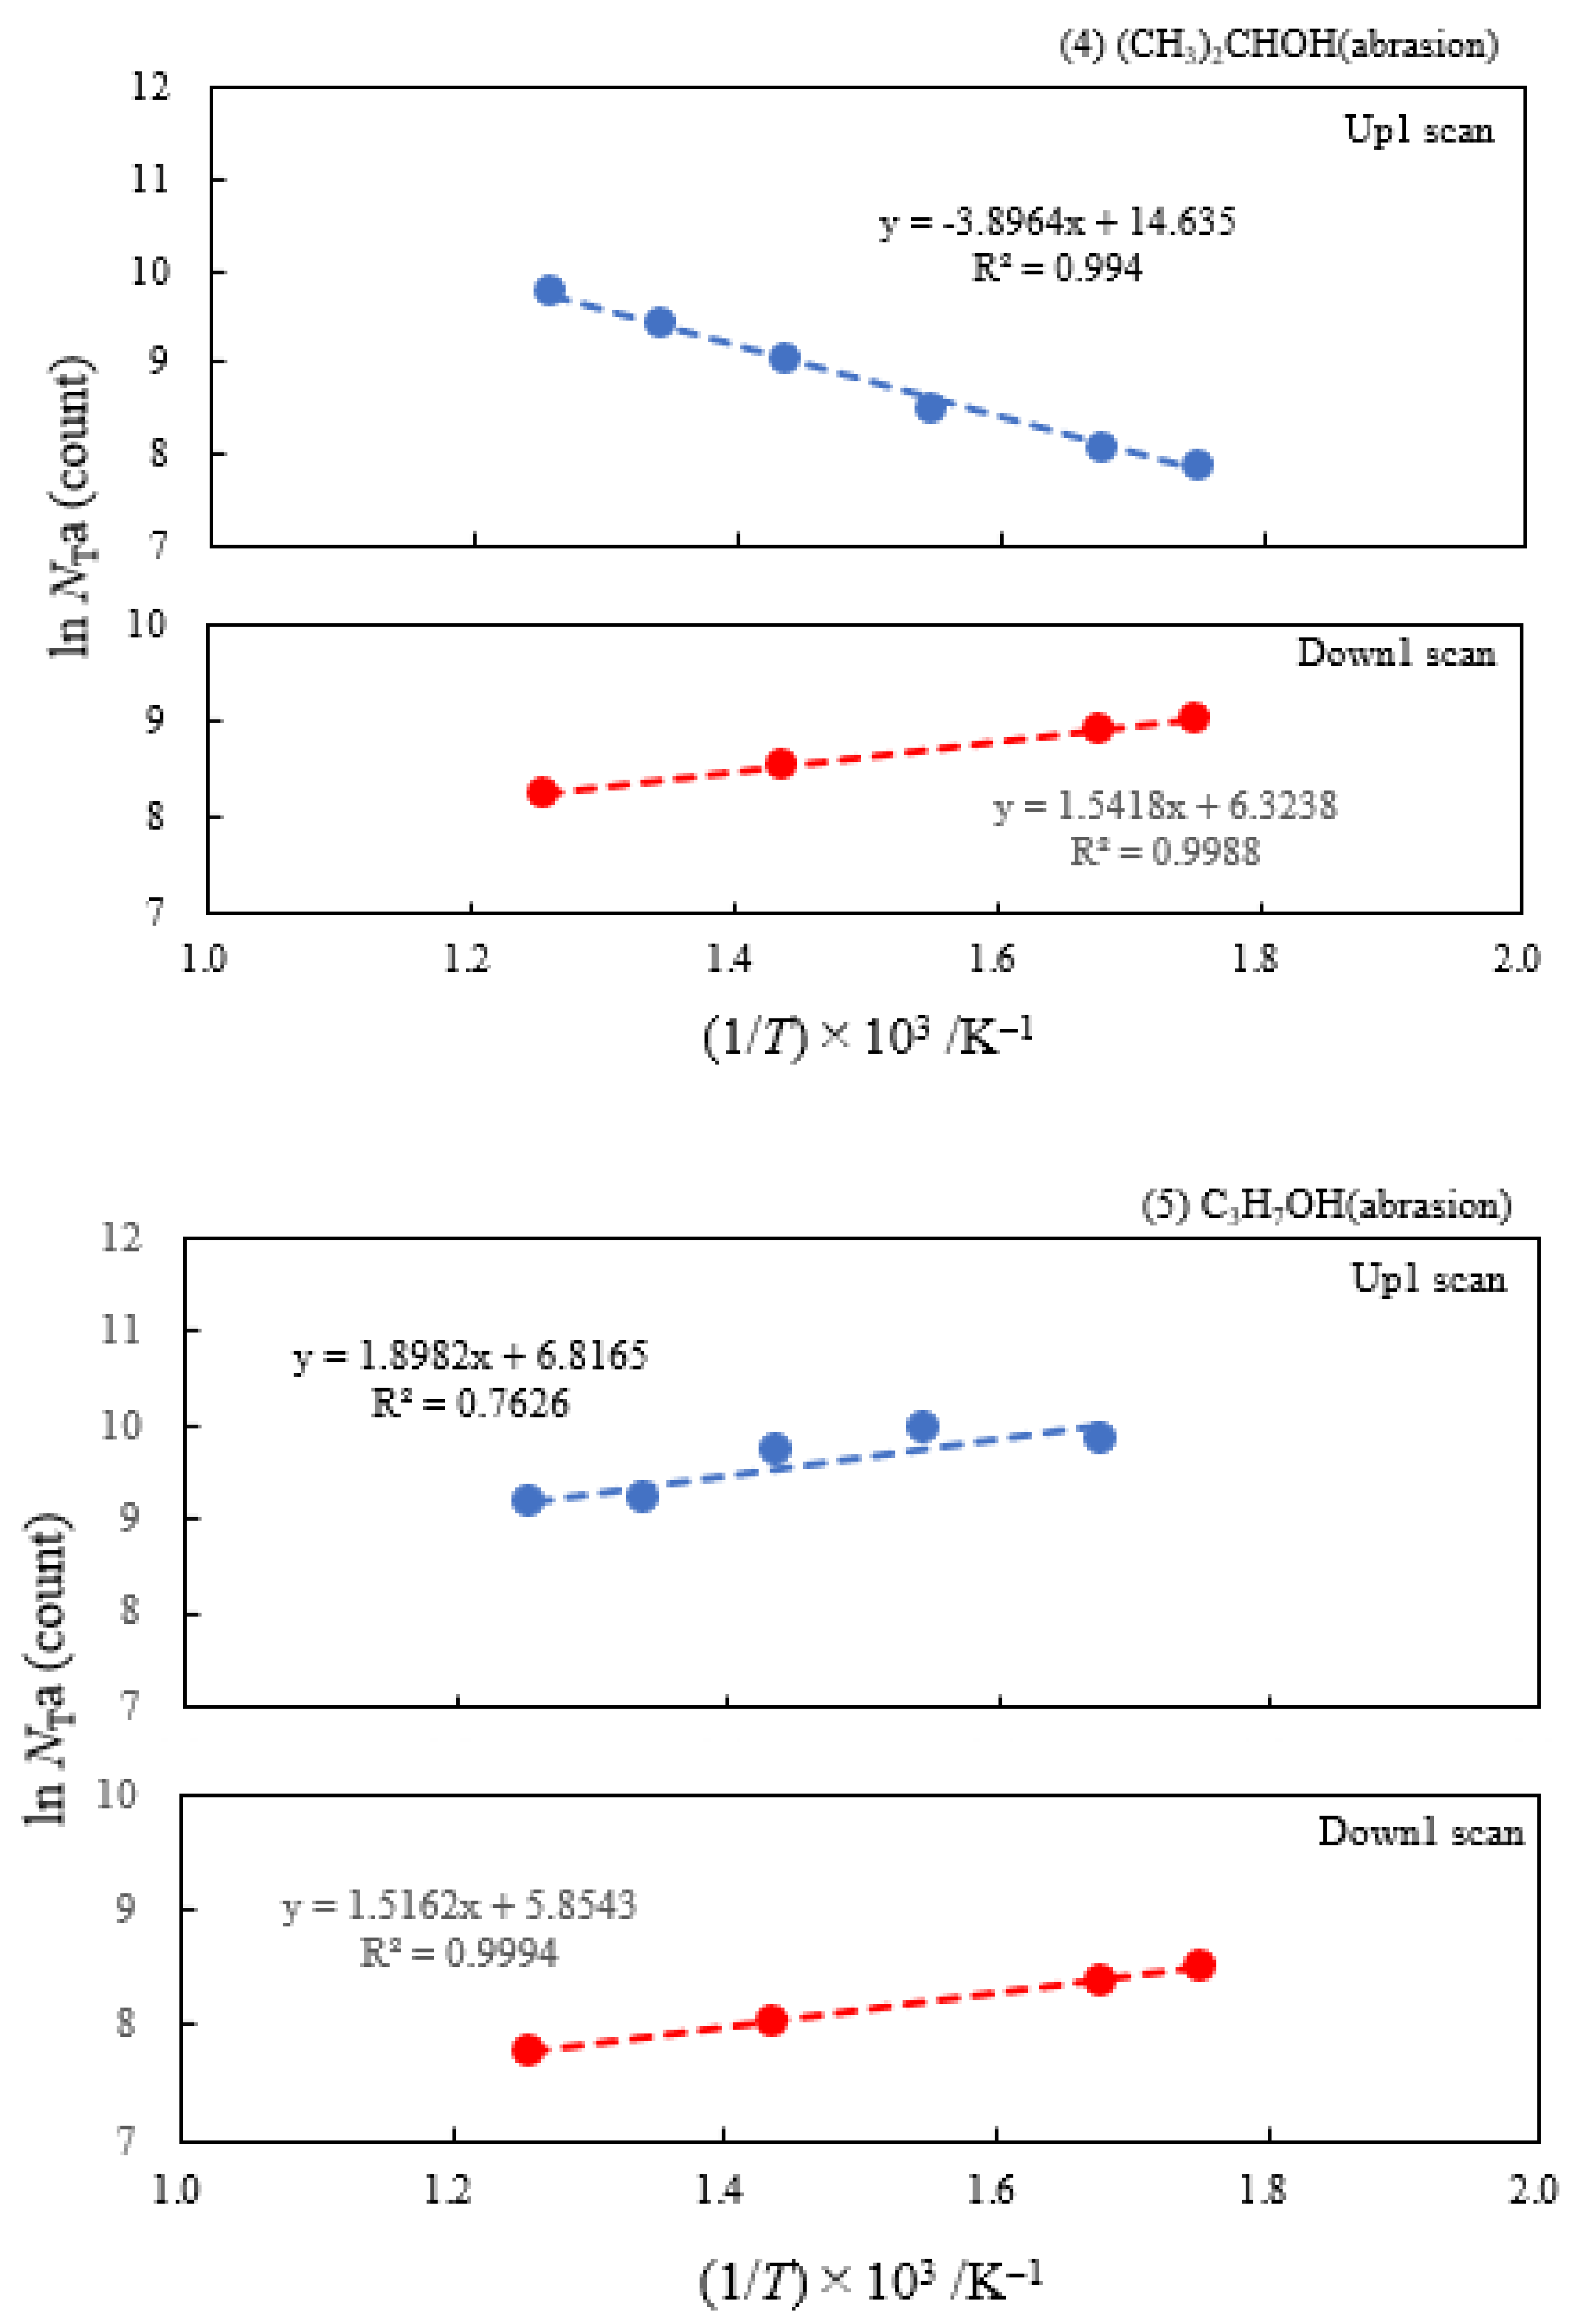
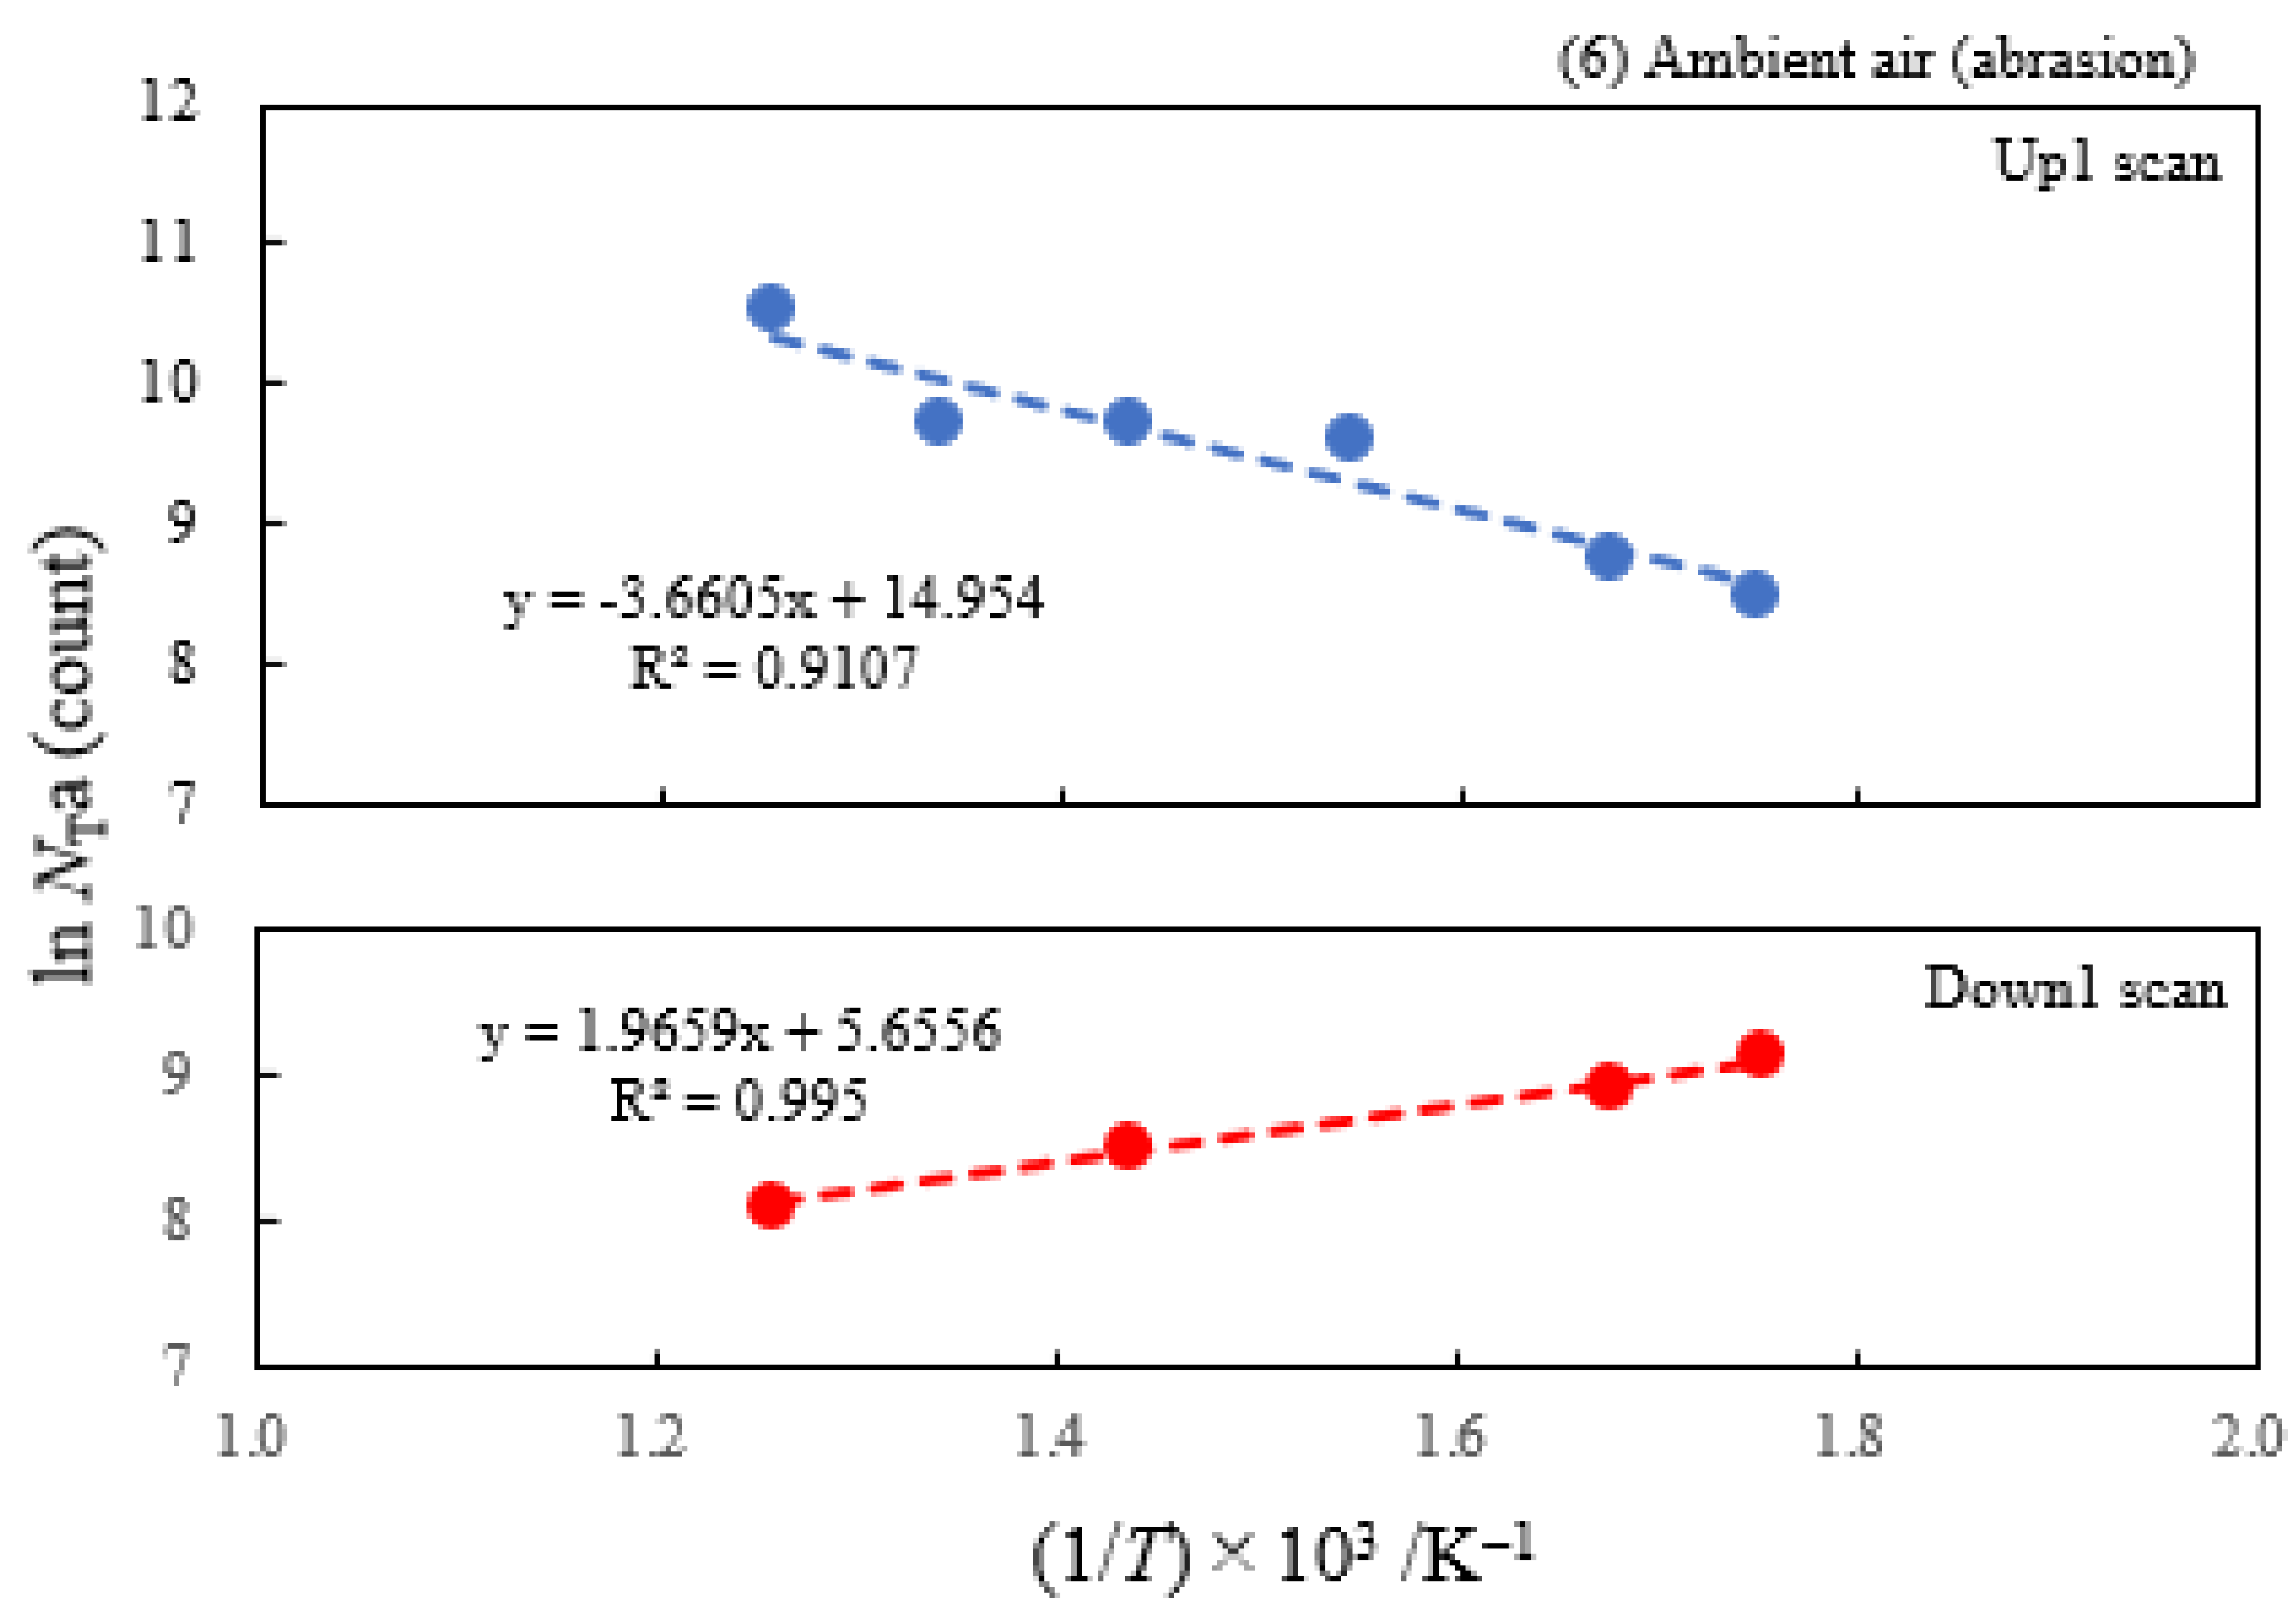
Figure 8.
[Sample C] Arrhenius type plots of ln(NTc) versus the reciprocal of measurement temperature (1/T) for copper samples subjected to ultrasonic cleaning in liquids: (5) C3H7OH; (4) (CH3)2CHOH; (3) C2H5OH; (2) CH3OH; (1) H2O. From the equation, represented by NTc = A0NTc×exp(−ΔEc/kT), ΔEc and A0NTc were obtained. Among the NTc data during the wavelength scan from 300 to 170 nm at different temperatures in the temperature range of 25−350°C during temperature-increase and subsequent temperature-decrease processes the NTc values in the temperature range of 25−250°C were used for Up1 and Down1 scans representing the 1st temperature-increase and subsequent temperature-decrease processes, respectively.
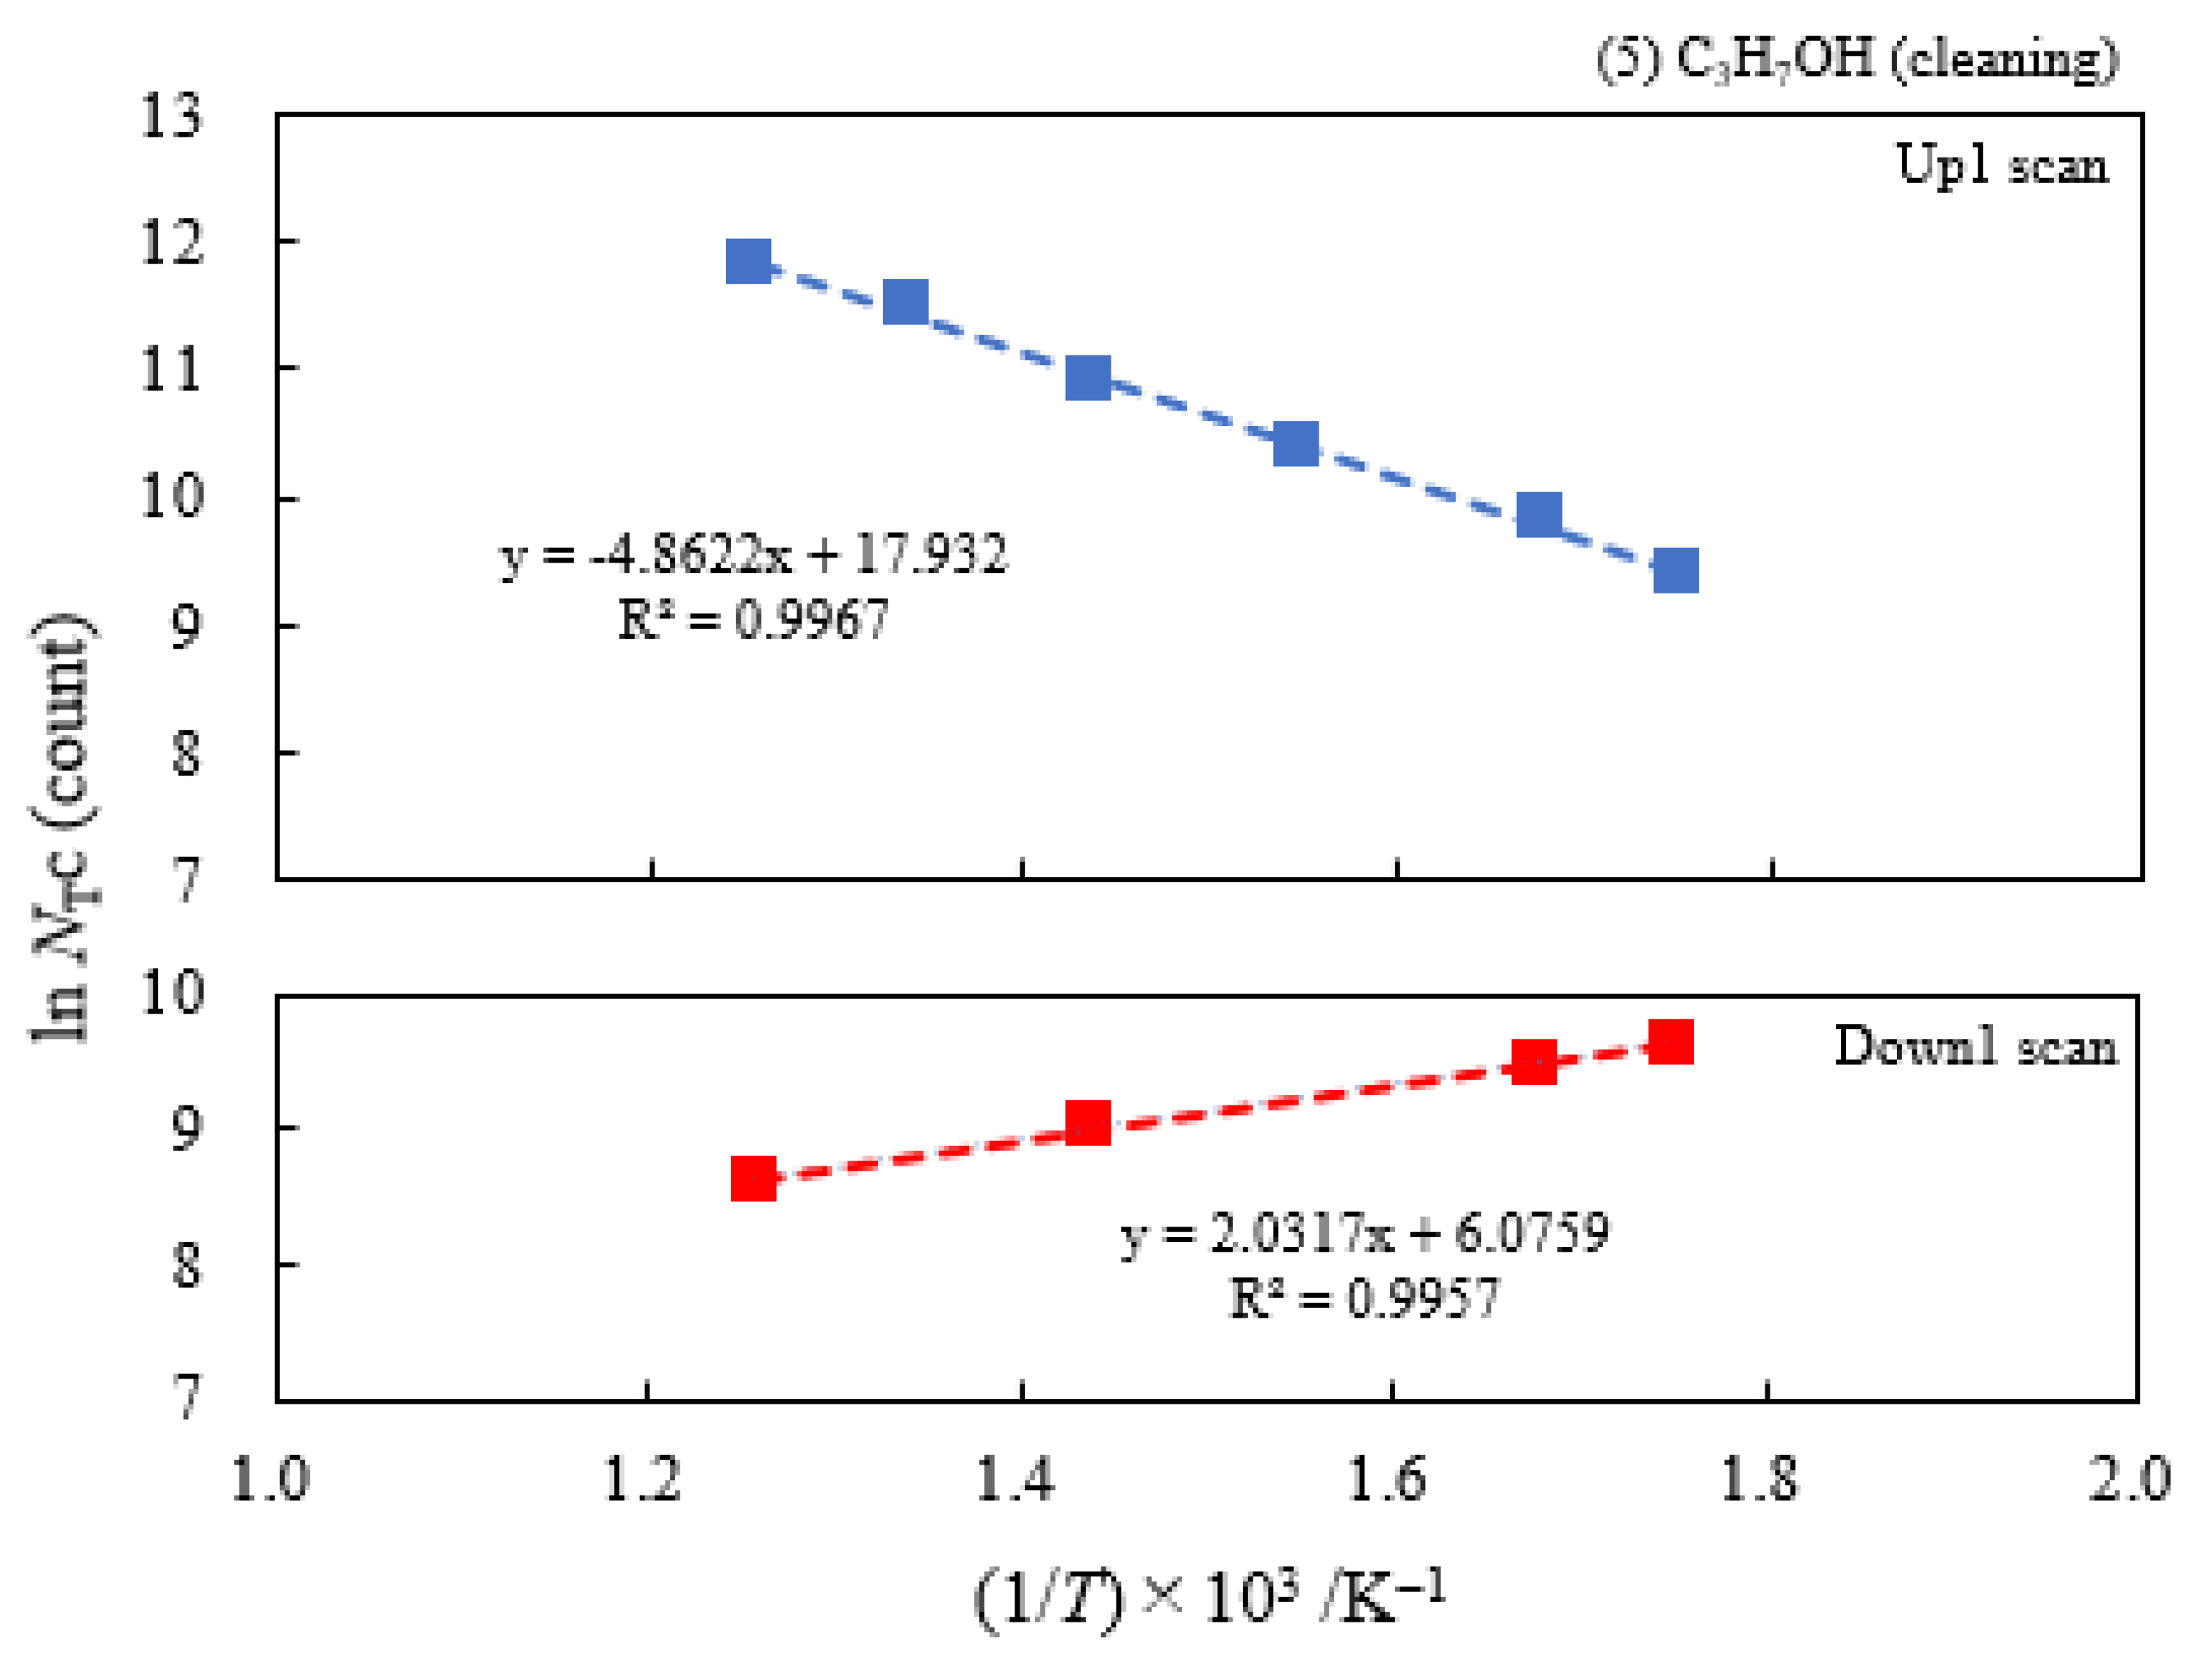
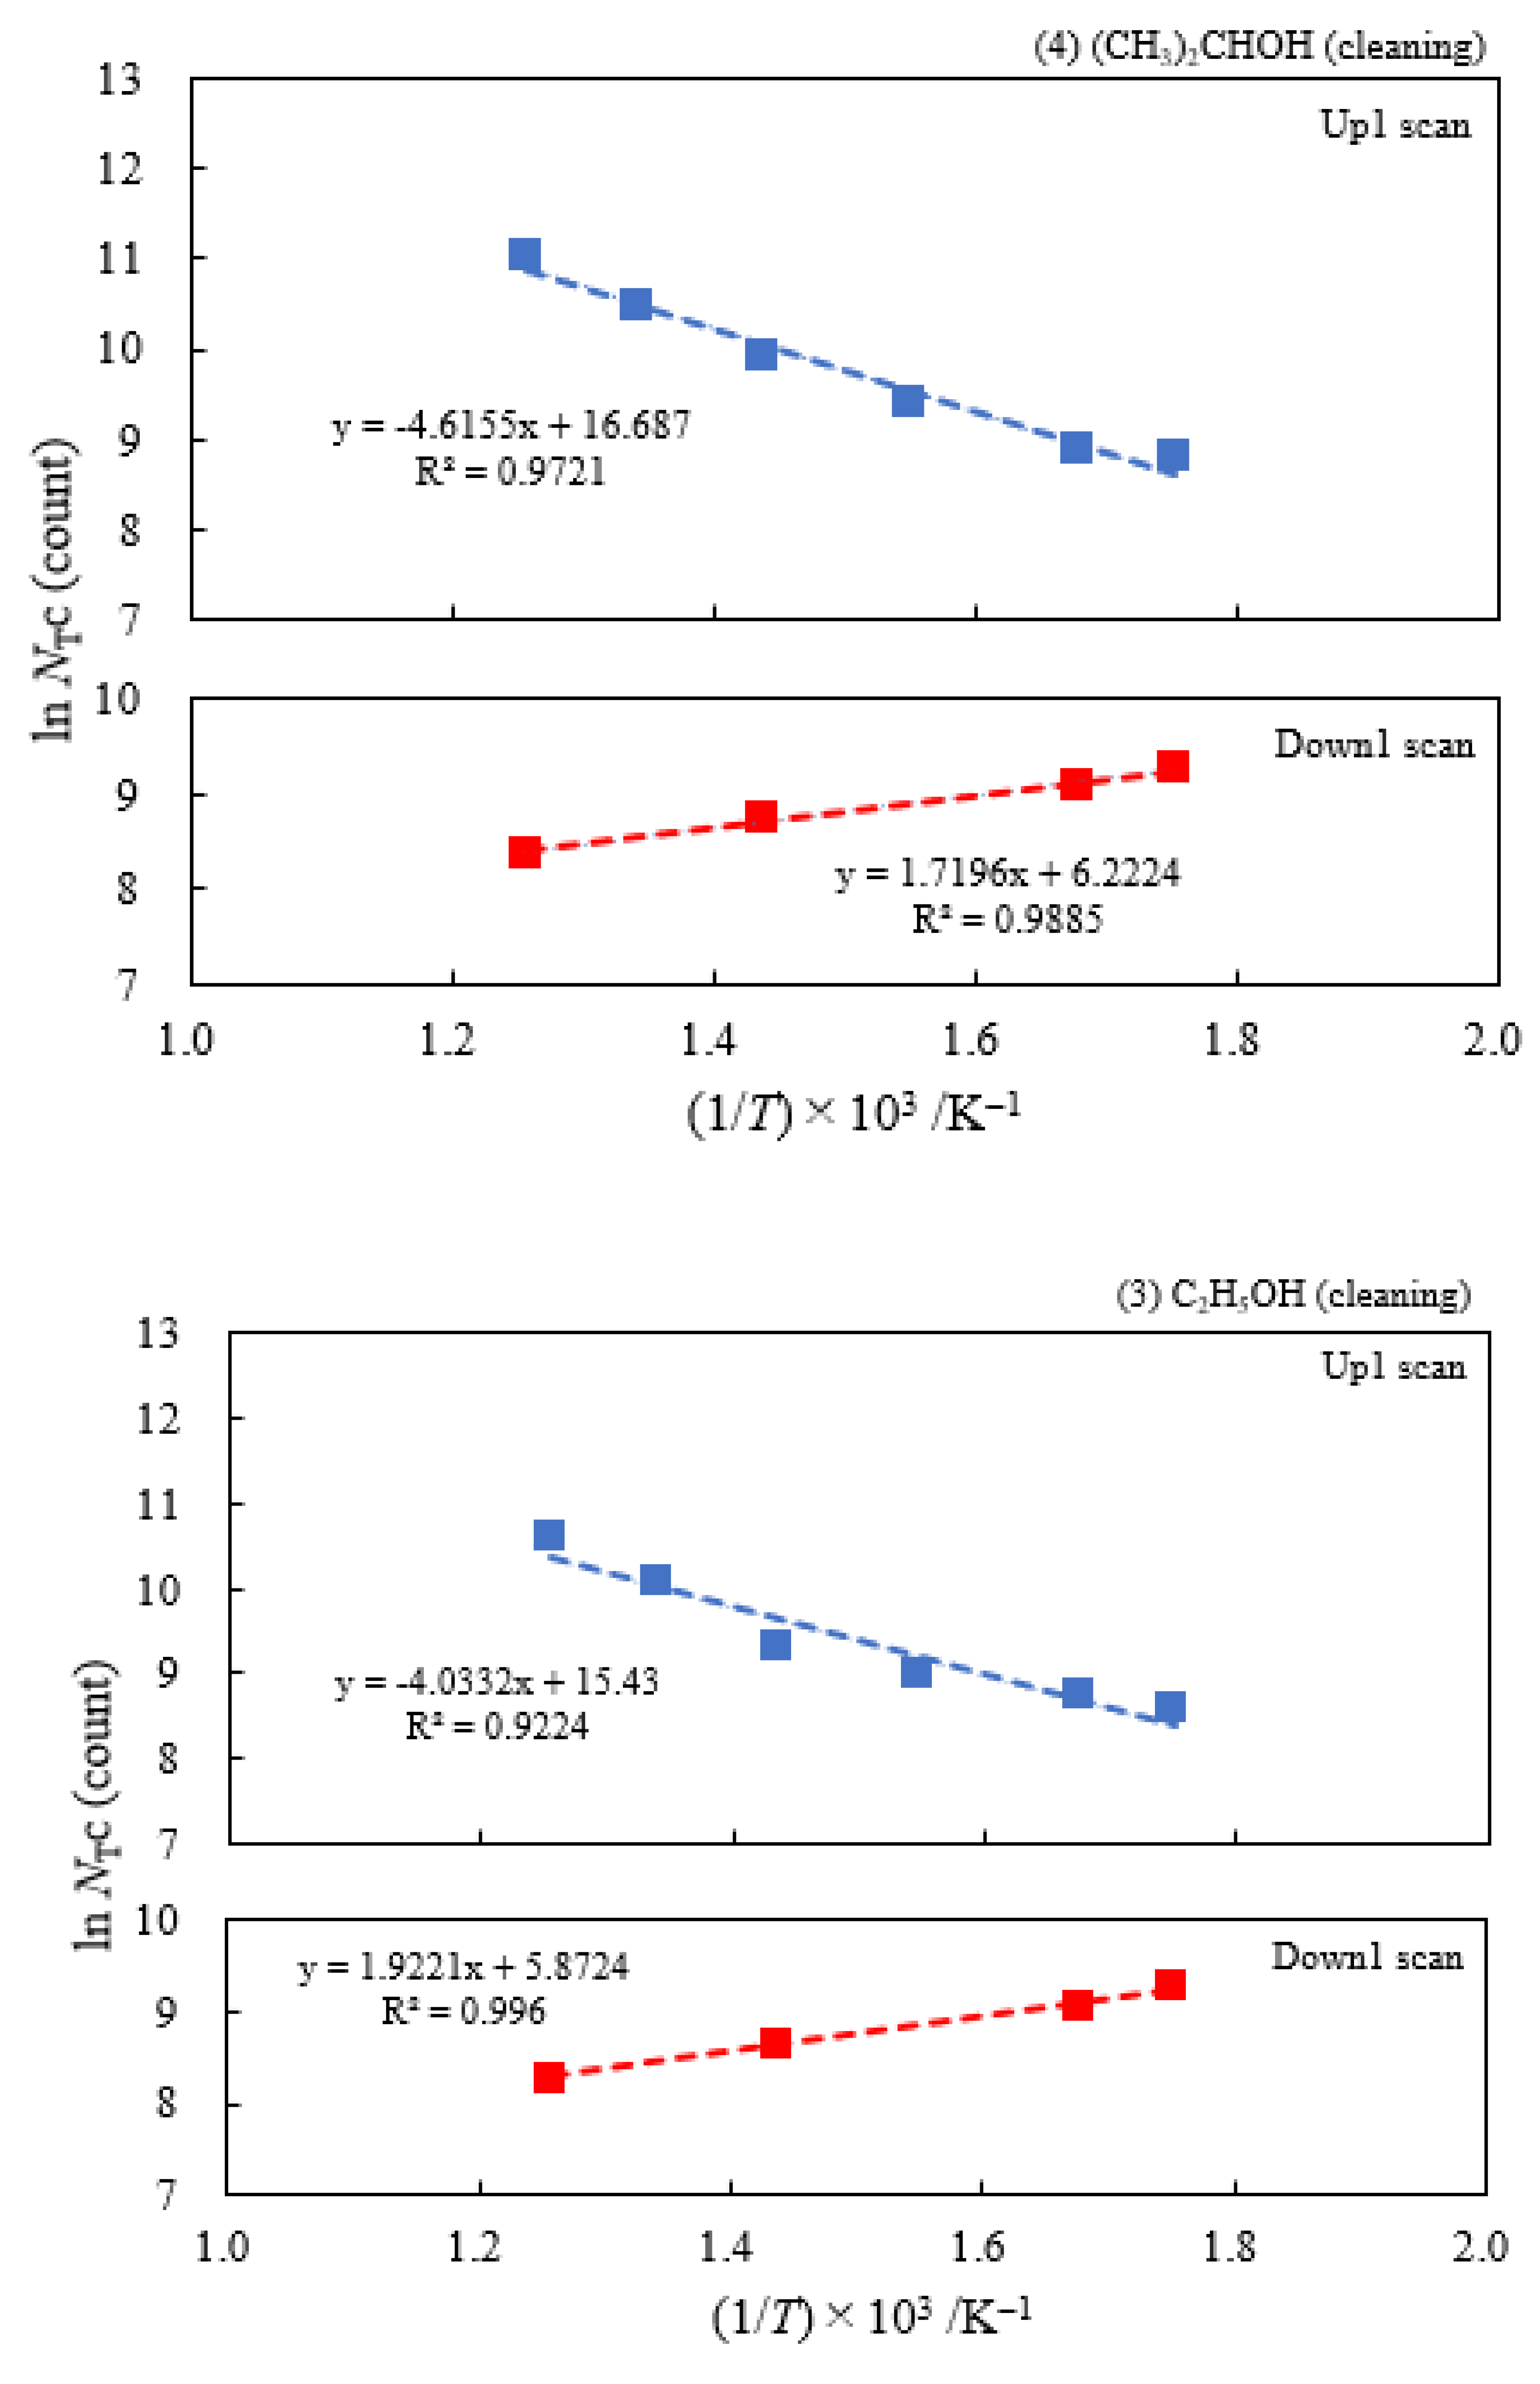
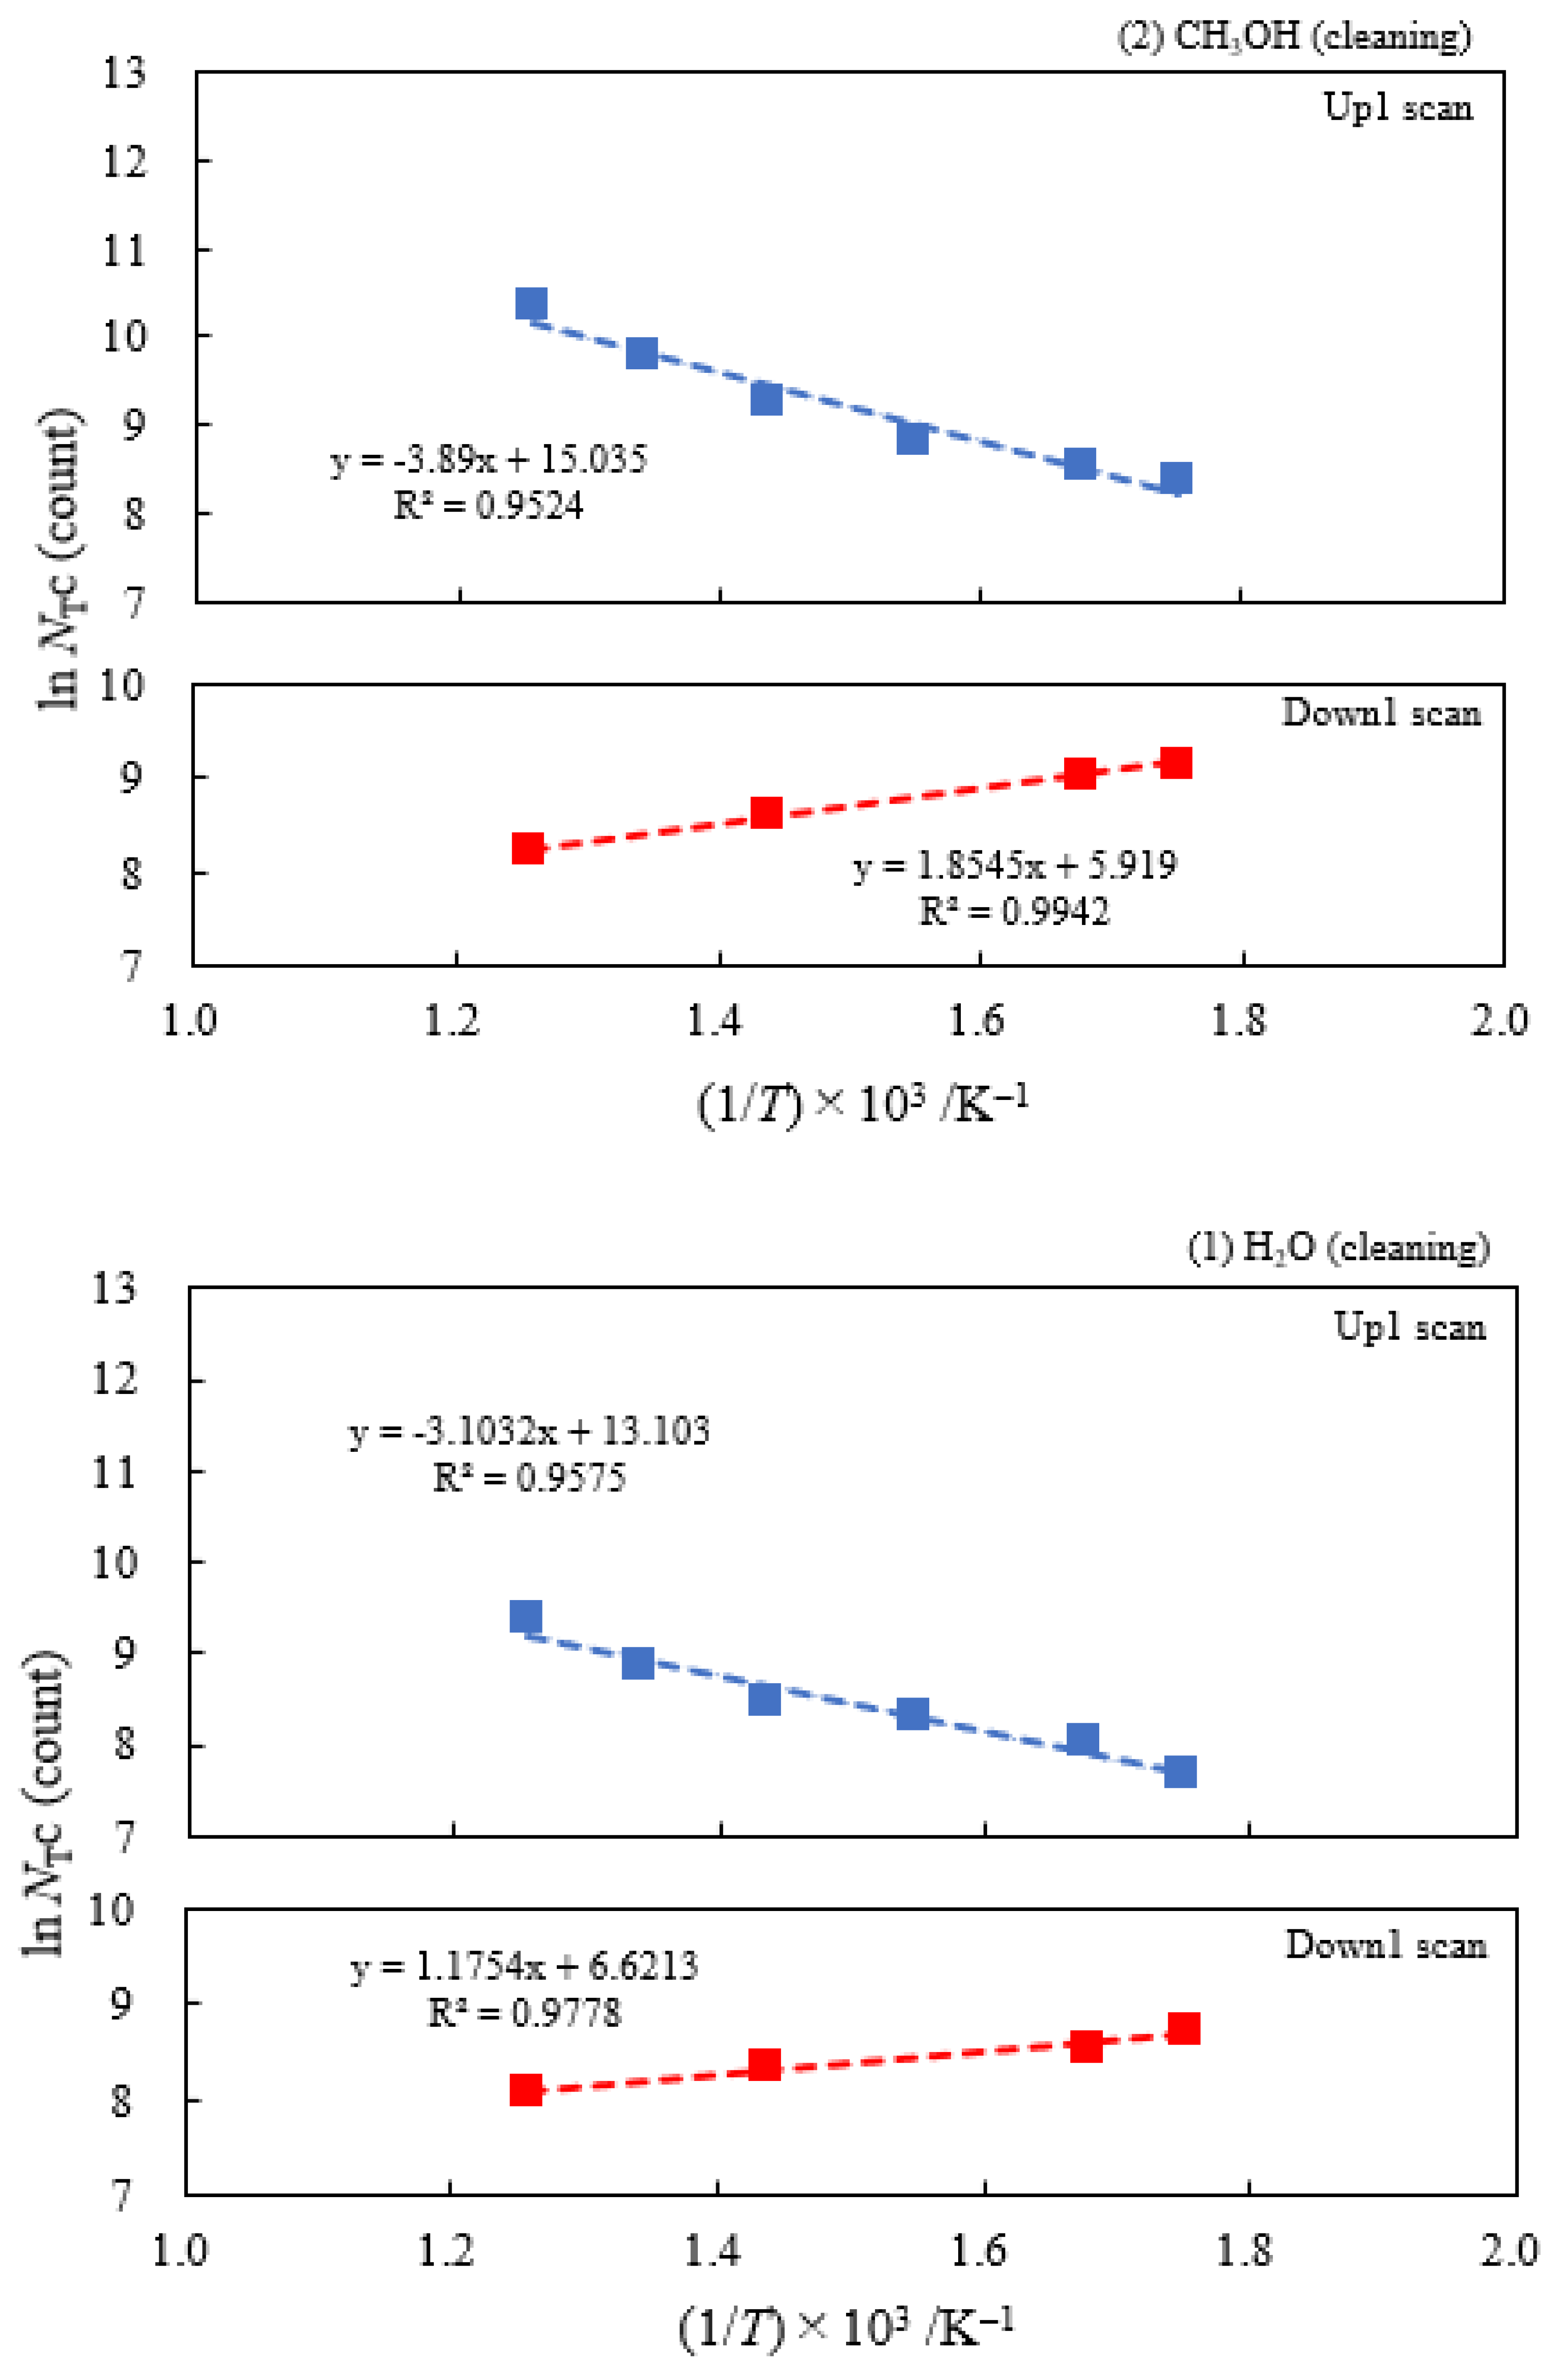
Figure 9.
Relation between the reciprocal of dielectric constant (ε/ε0) and acceptor number (AN) of the liquids.
Figure 9.
Relation between the reciprocal of dielectric constant (ε/ε0) and acceptor number (AN) of the liquids.
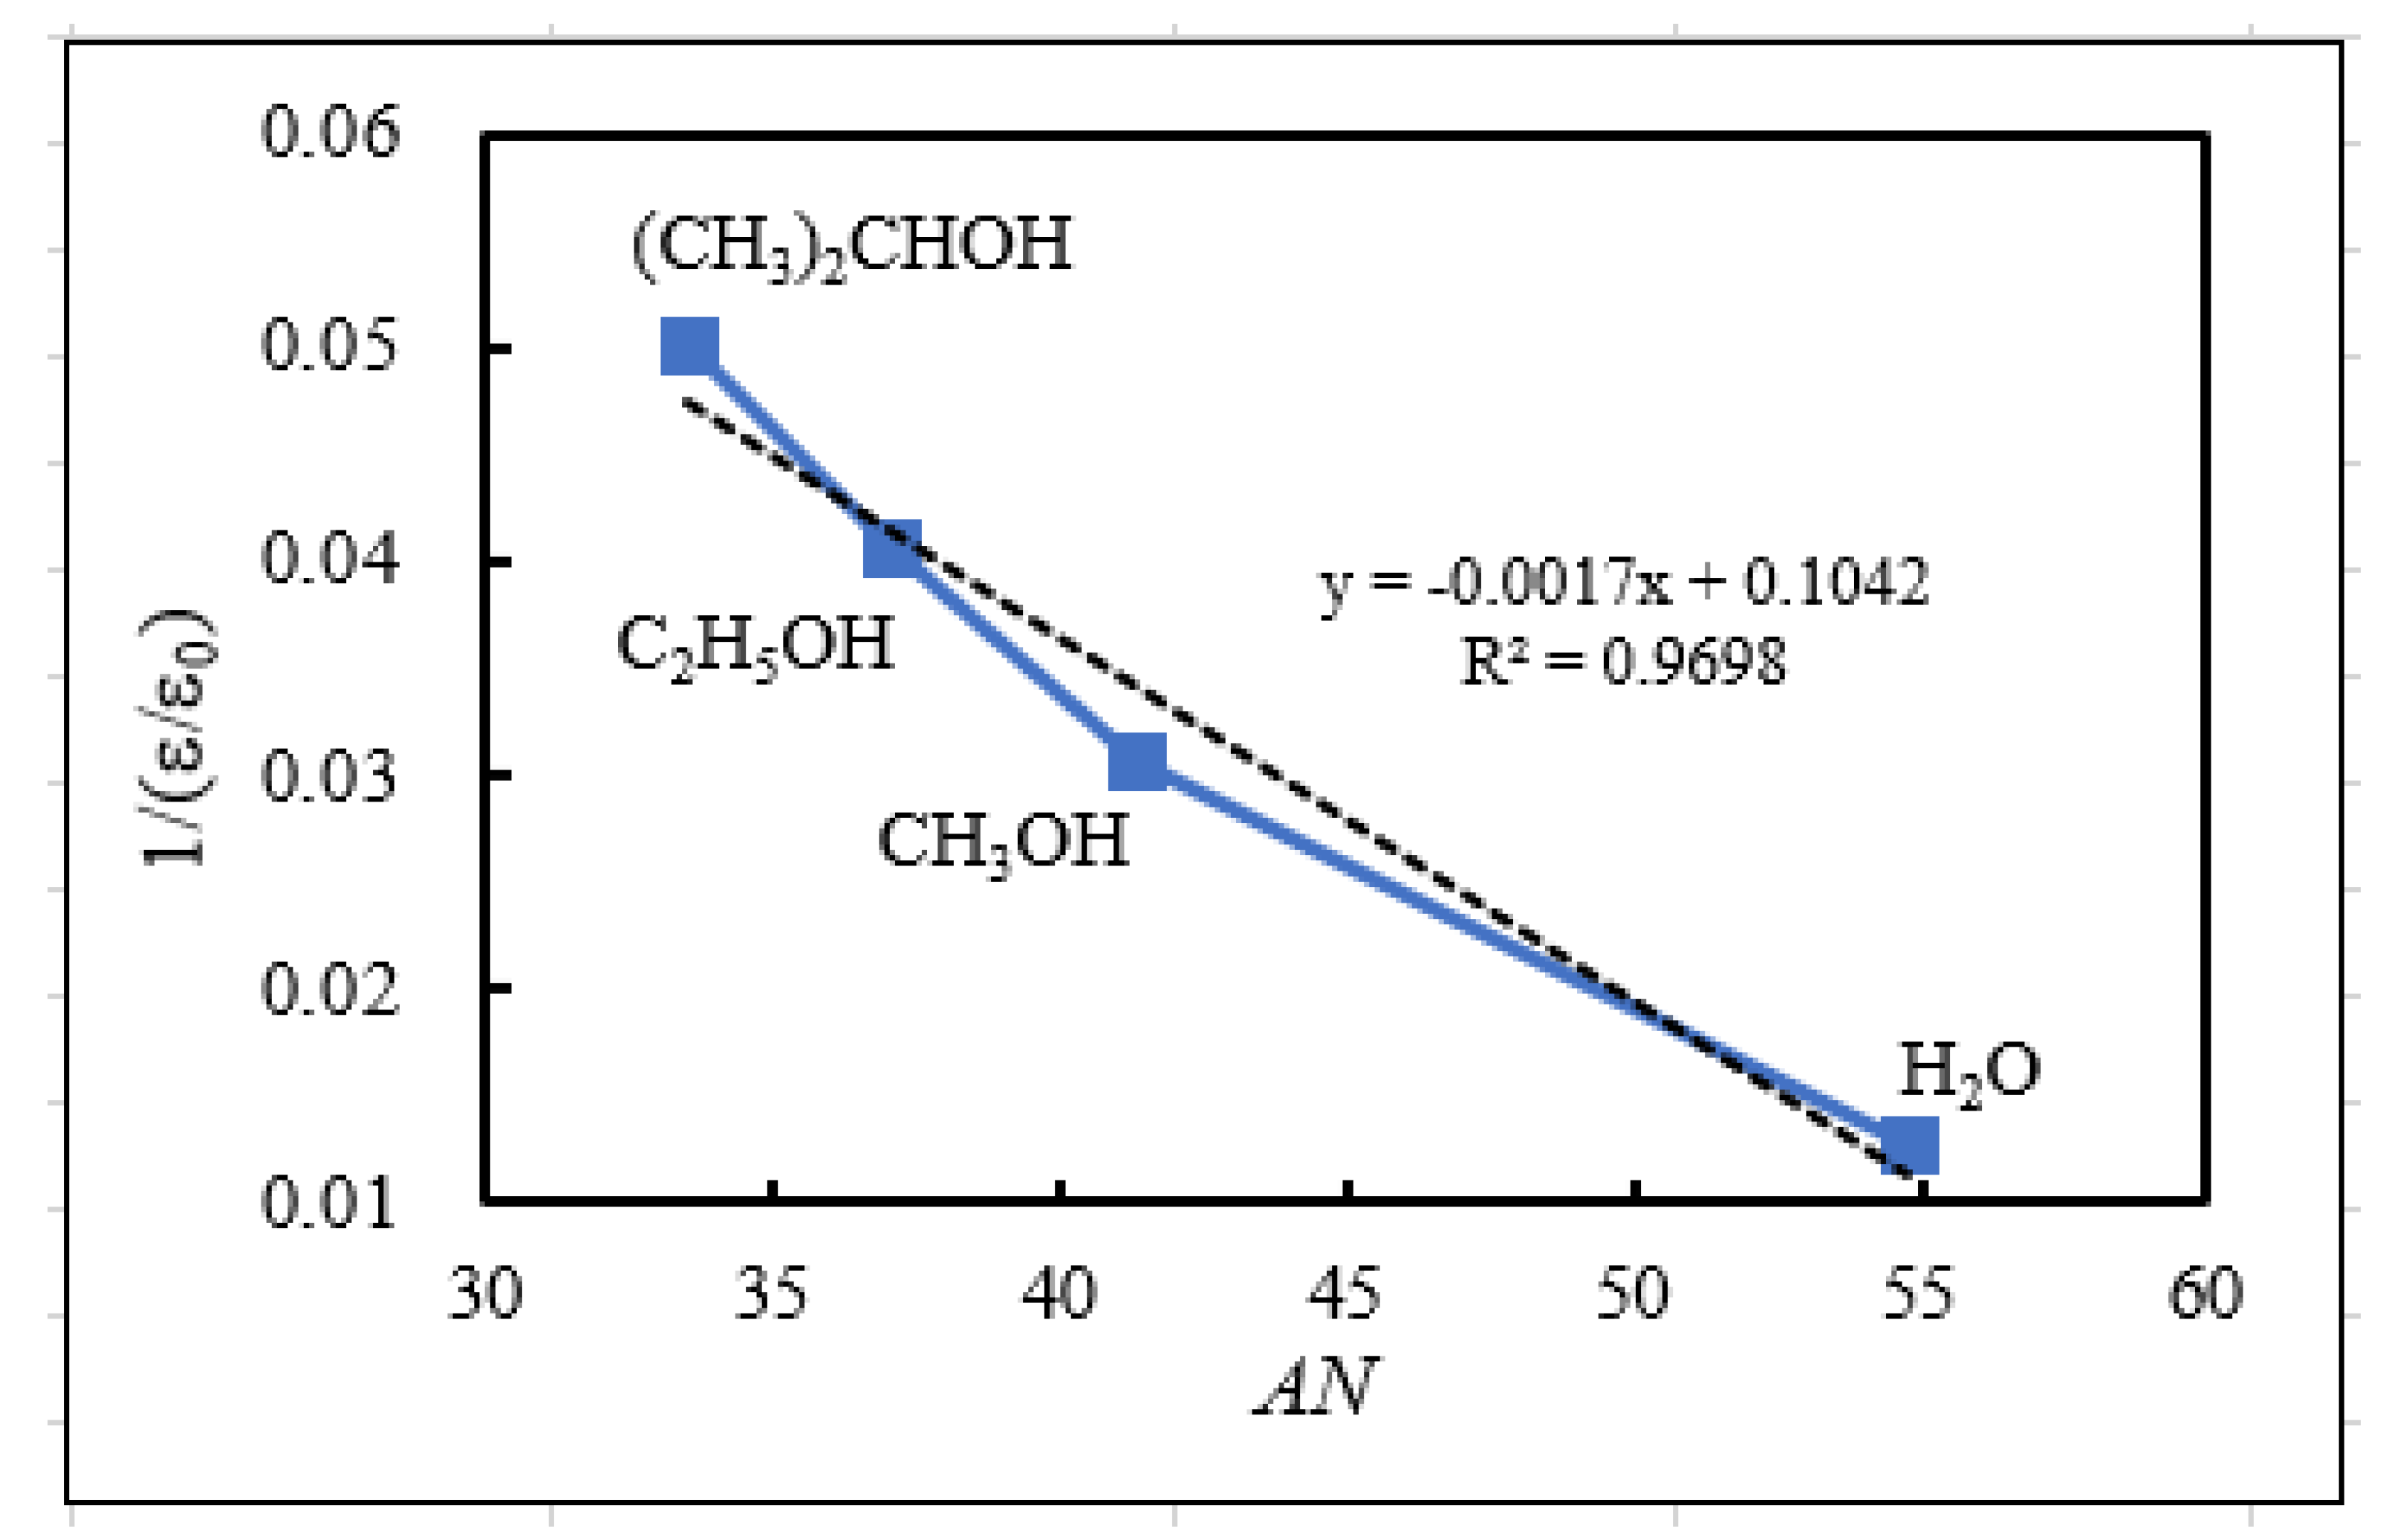
Figure 10.
[Sample A] TPPE characteristics of copper sheets subjected to 10-min abrasion in liquids and the property of liquids: (a) Relation between the maximum value of NTa (NTmaxa) during the Up1 scan and the acceptor number (AN) of the liquids; (b) Relation between the activation energy of photoelectron emission (ΔEaUp1) during Up1 scan and the acceptor number (AN) of the liquids; (c) Relation between ΔEaUp1 and the reciprocal of dielectric constant (ε/ε0) of the solvents; (d) Relation between the value of NTmaxa and ΔEaUp1. The data comes from Table 1.
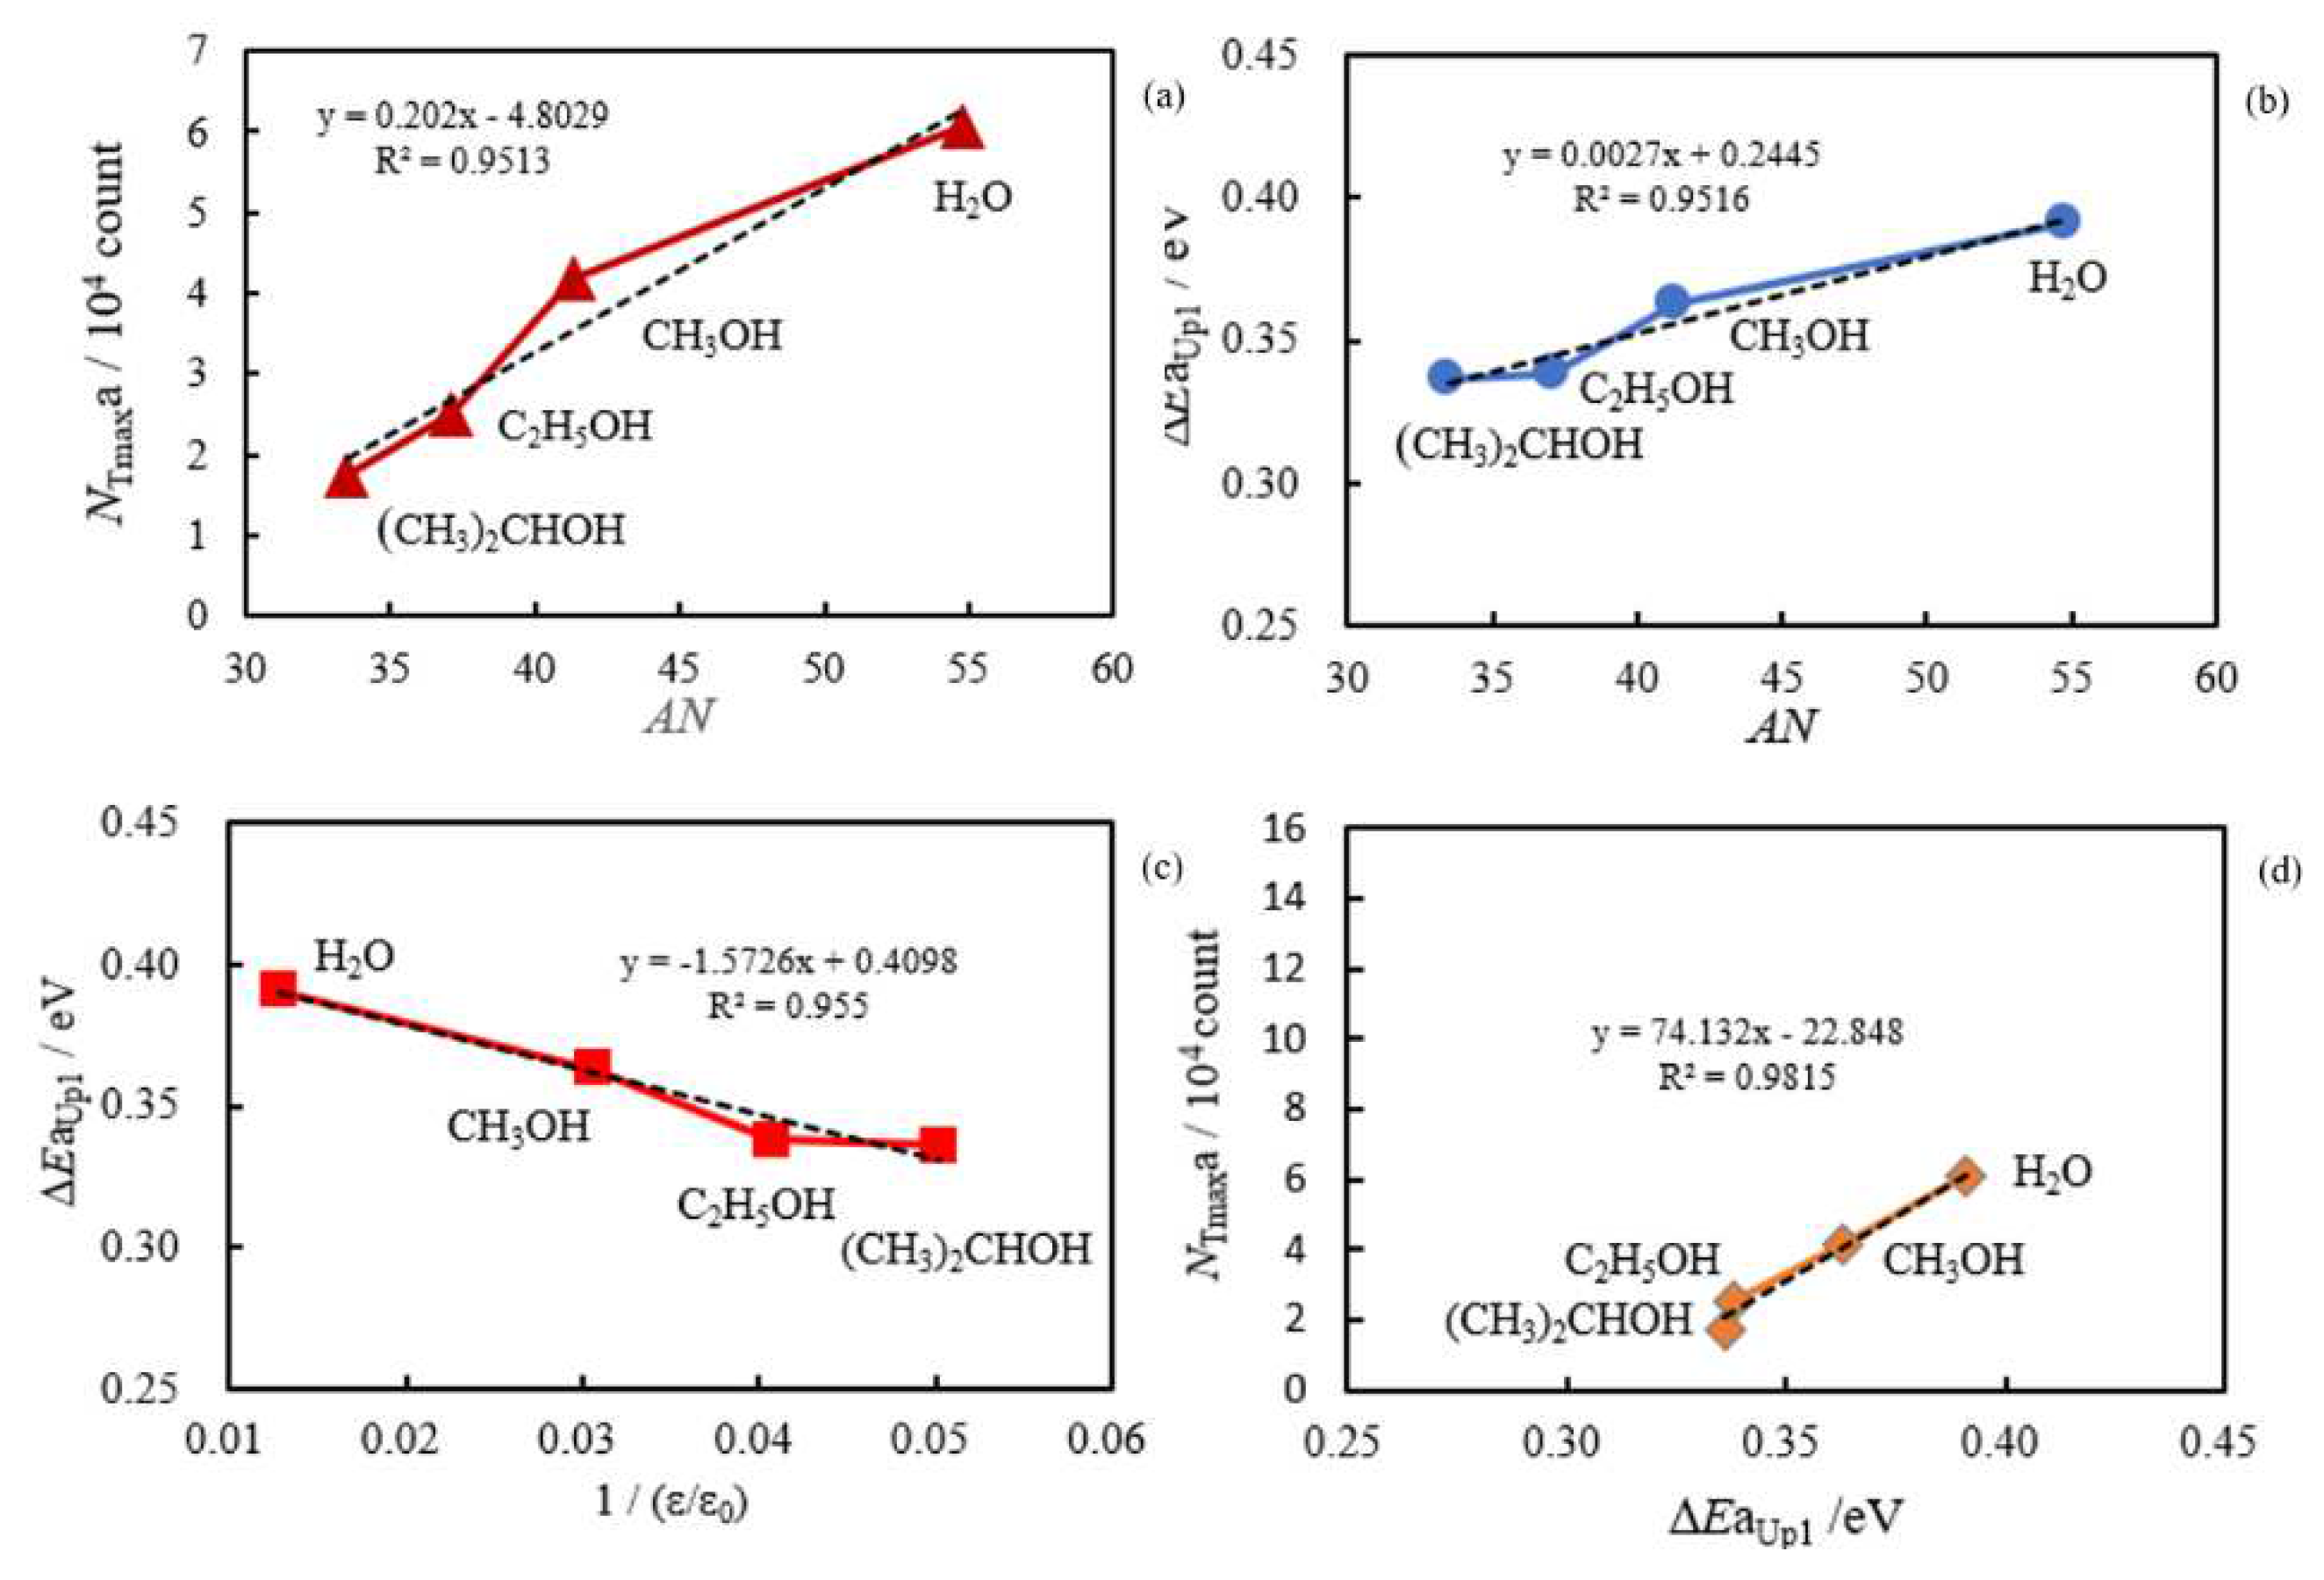
Figure 11.
[Sample C] TPPE characteristics of copper sheets subjected to 5-min ultrasonic cleaning in the liquids and the property of the liquids: (a) Relation between the maximum value of NTc (NTmaxc) and the acceptor number (AN) of the liquids; (b) Relation between ΔEcUp1 and AN of the liquids; (c) Relation between ΔEcUp1 and the reciprocal of dielectric constant (ε/ε0) of the liquids; (d) Relation between the value of NTmaxc during Up1 scan and ΔEcUp1. The data comes from Table 2.
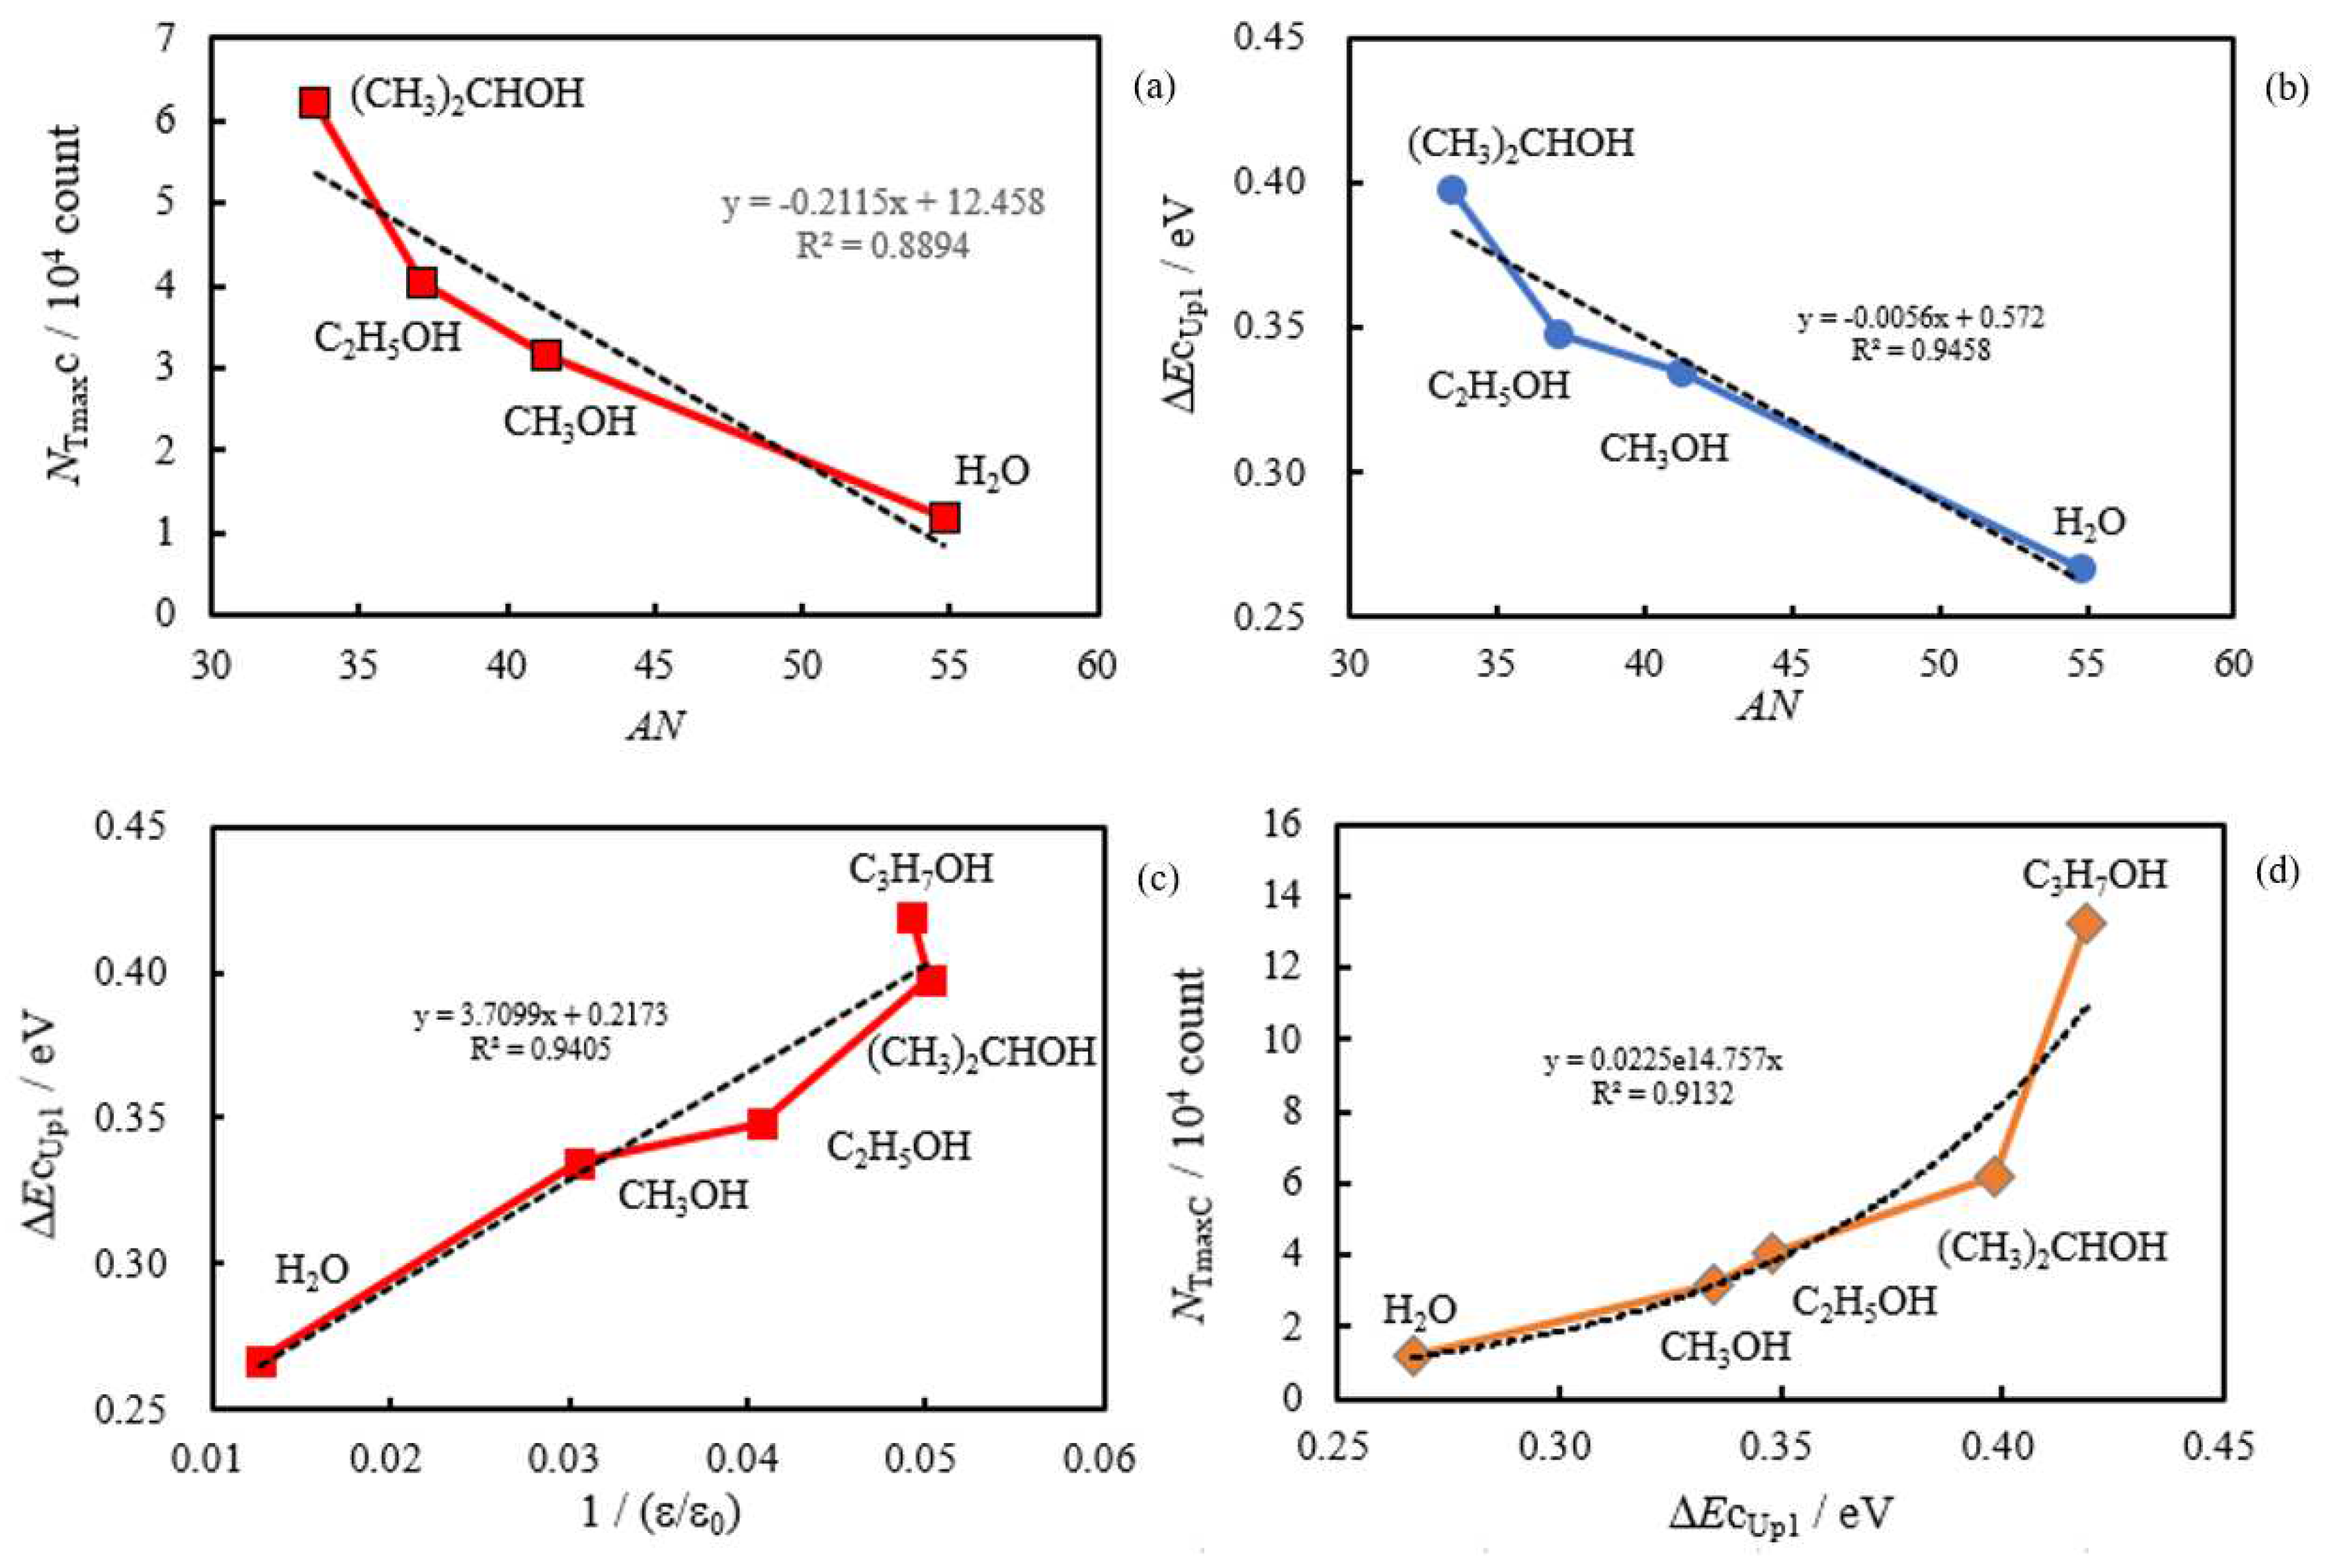
Figure 12.
Examples of the acid-base interaction modes between the molecules of (CH3)2CHOH, C2H5OH, and H2O and the surface hydroxyl group (-CuOH) and the orientation of the formed electric dipoles for Sample C and Sample A.
Figure 12.
Examples of the acid-base interaction modes between the molecules of (CH3)2CHOH, C2H5OH, and H2O and the surface hydroxyl group (-CuOH) and the orientation of the formed electric dipoles for Sample C and Sample A.
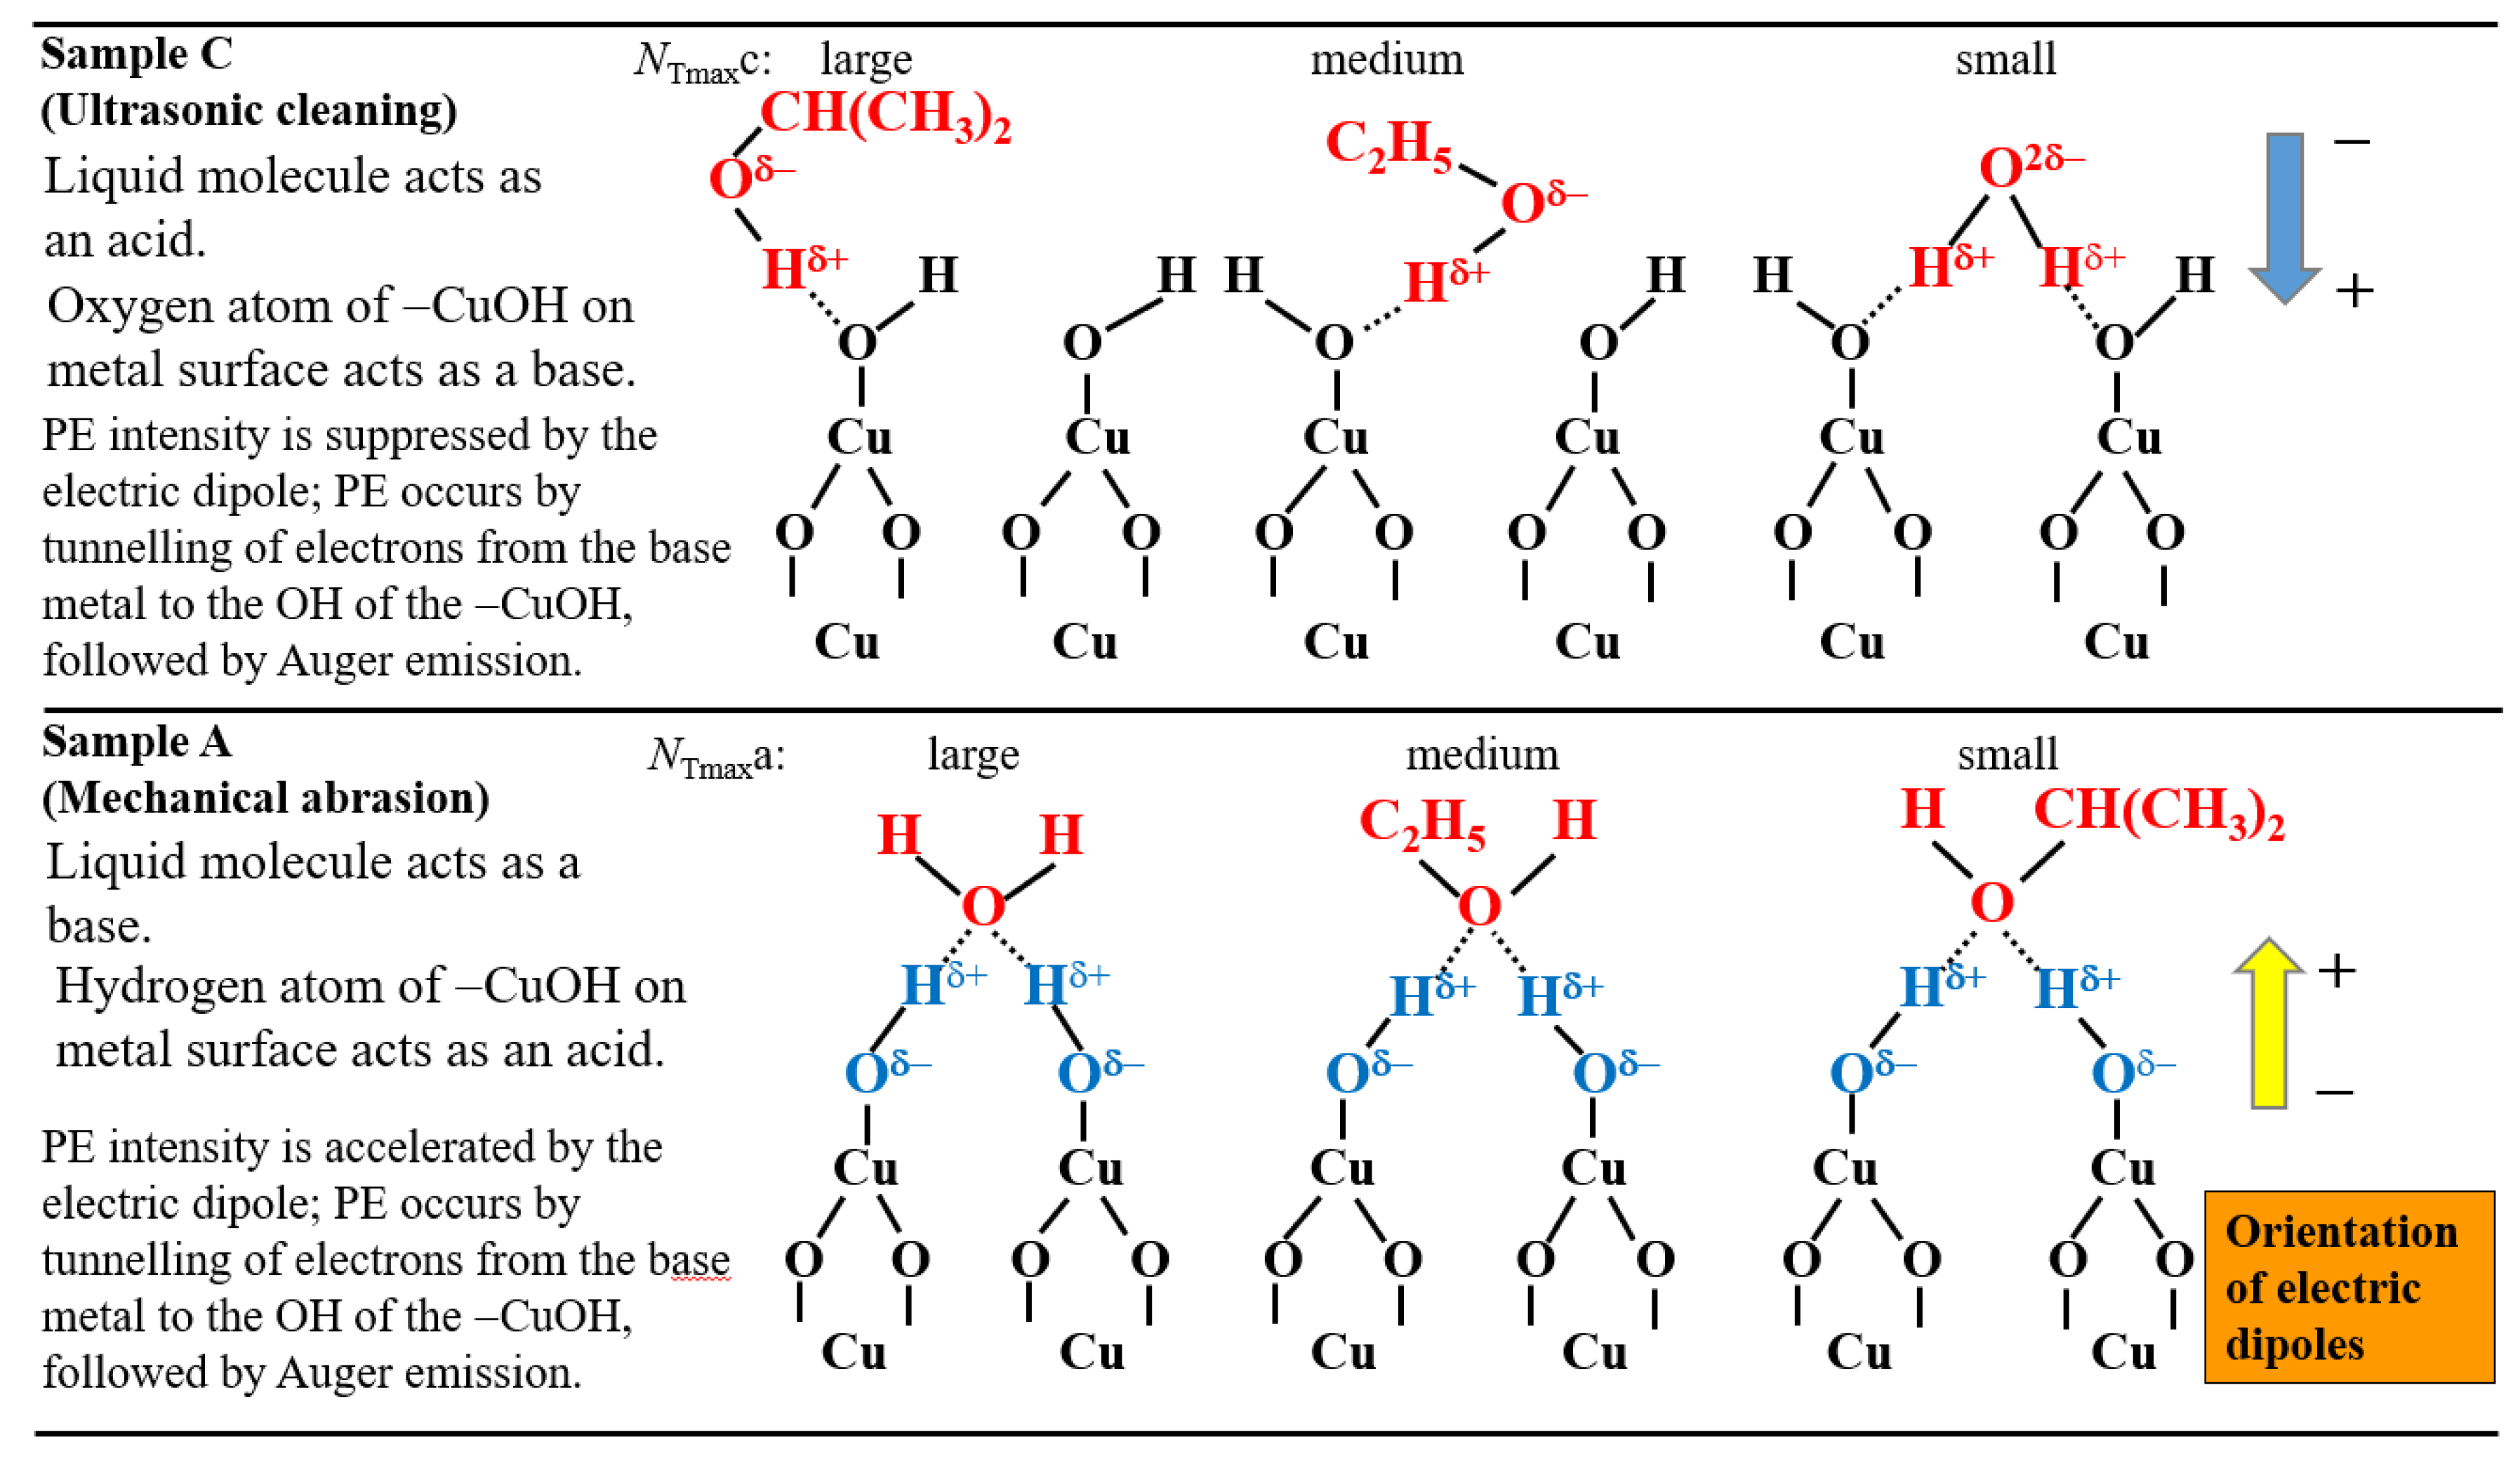
Figure 13.
A simple energy level diagram based upon electron tunnelling to trap (B) of adsorbed hydroxyl radical (B) followed by Auger emission: the depth of the trap increases in the order: (CH3)2CHOH < C2H5OH < CH3OH < H2O for Sample A and H2O < CH3OH < C2H5OH < (CH3)2CHOH < C3H7OH for Sample C; f work function; E0A (electron affinity for OH alone) = 1.83 eV; E’A electron affinity of OH adsorbed on the Cu surface in the liquids; EF Fermi level.
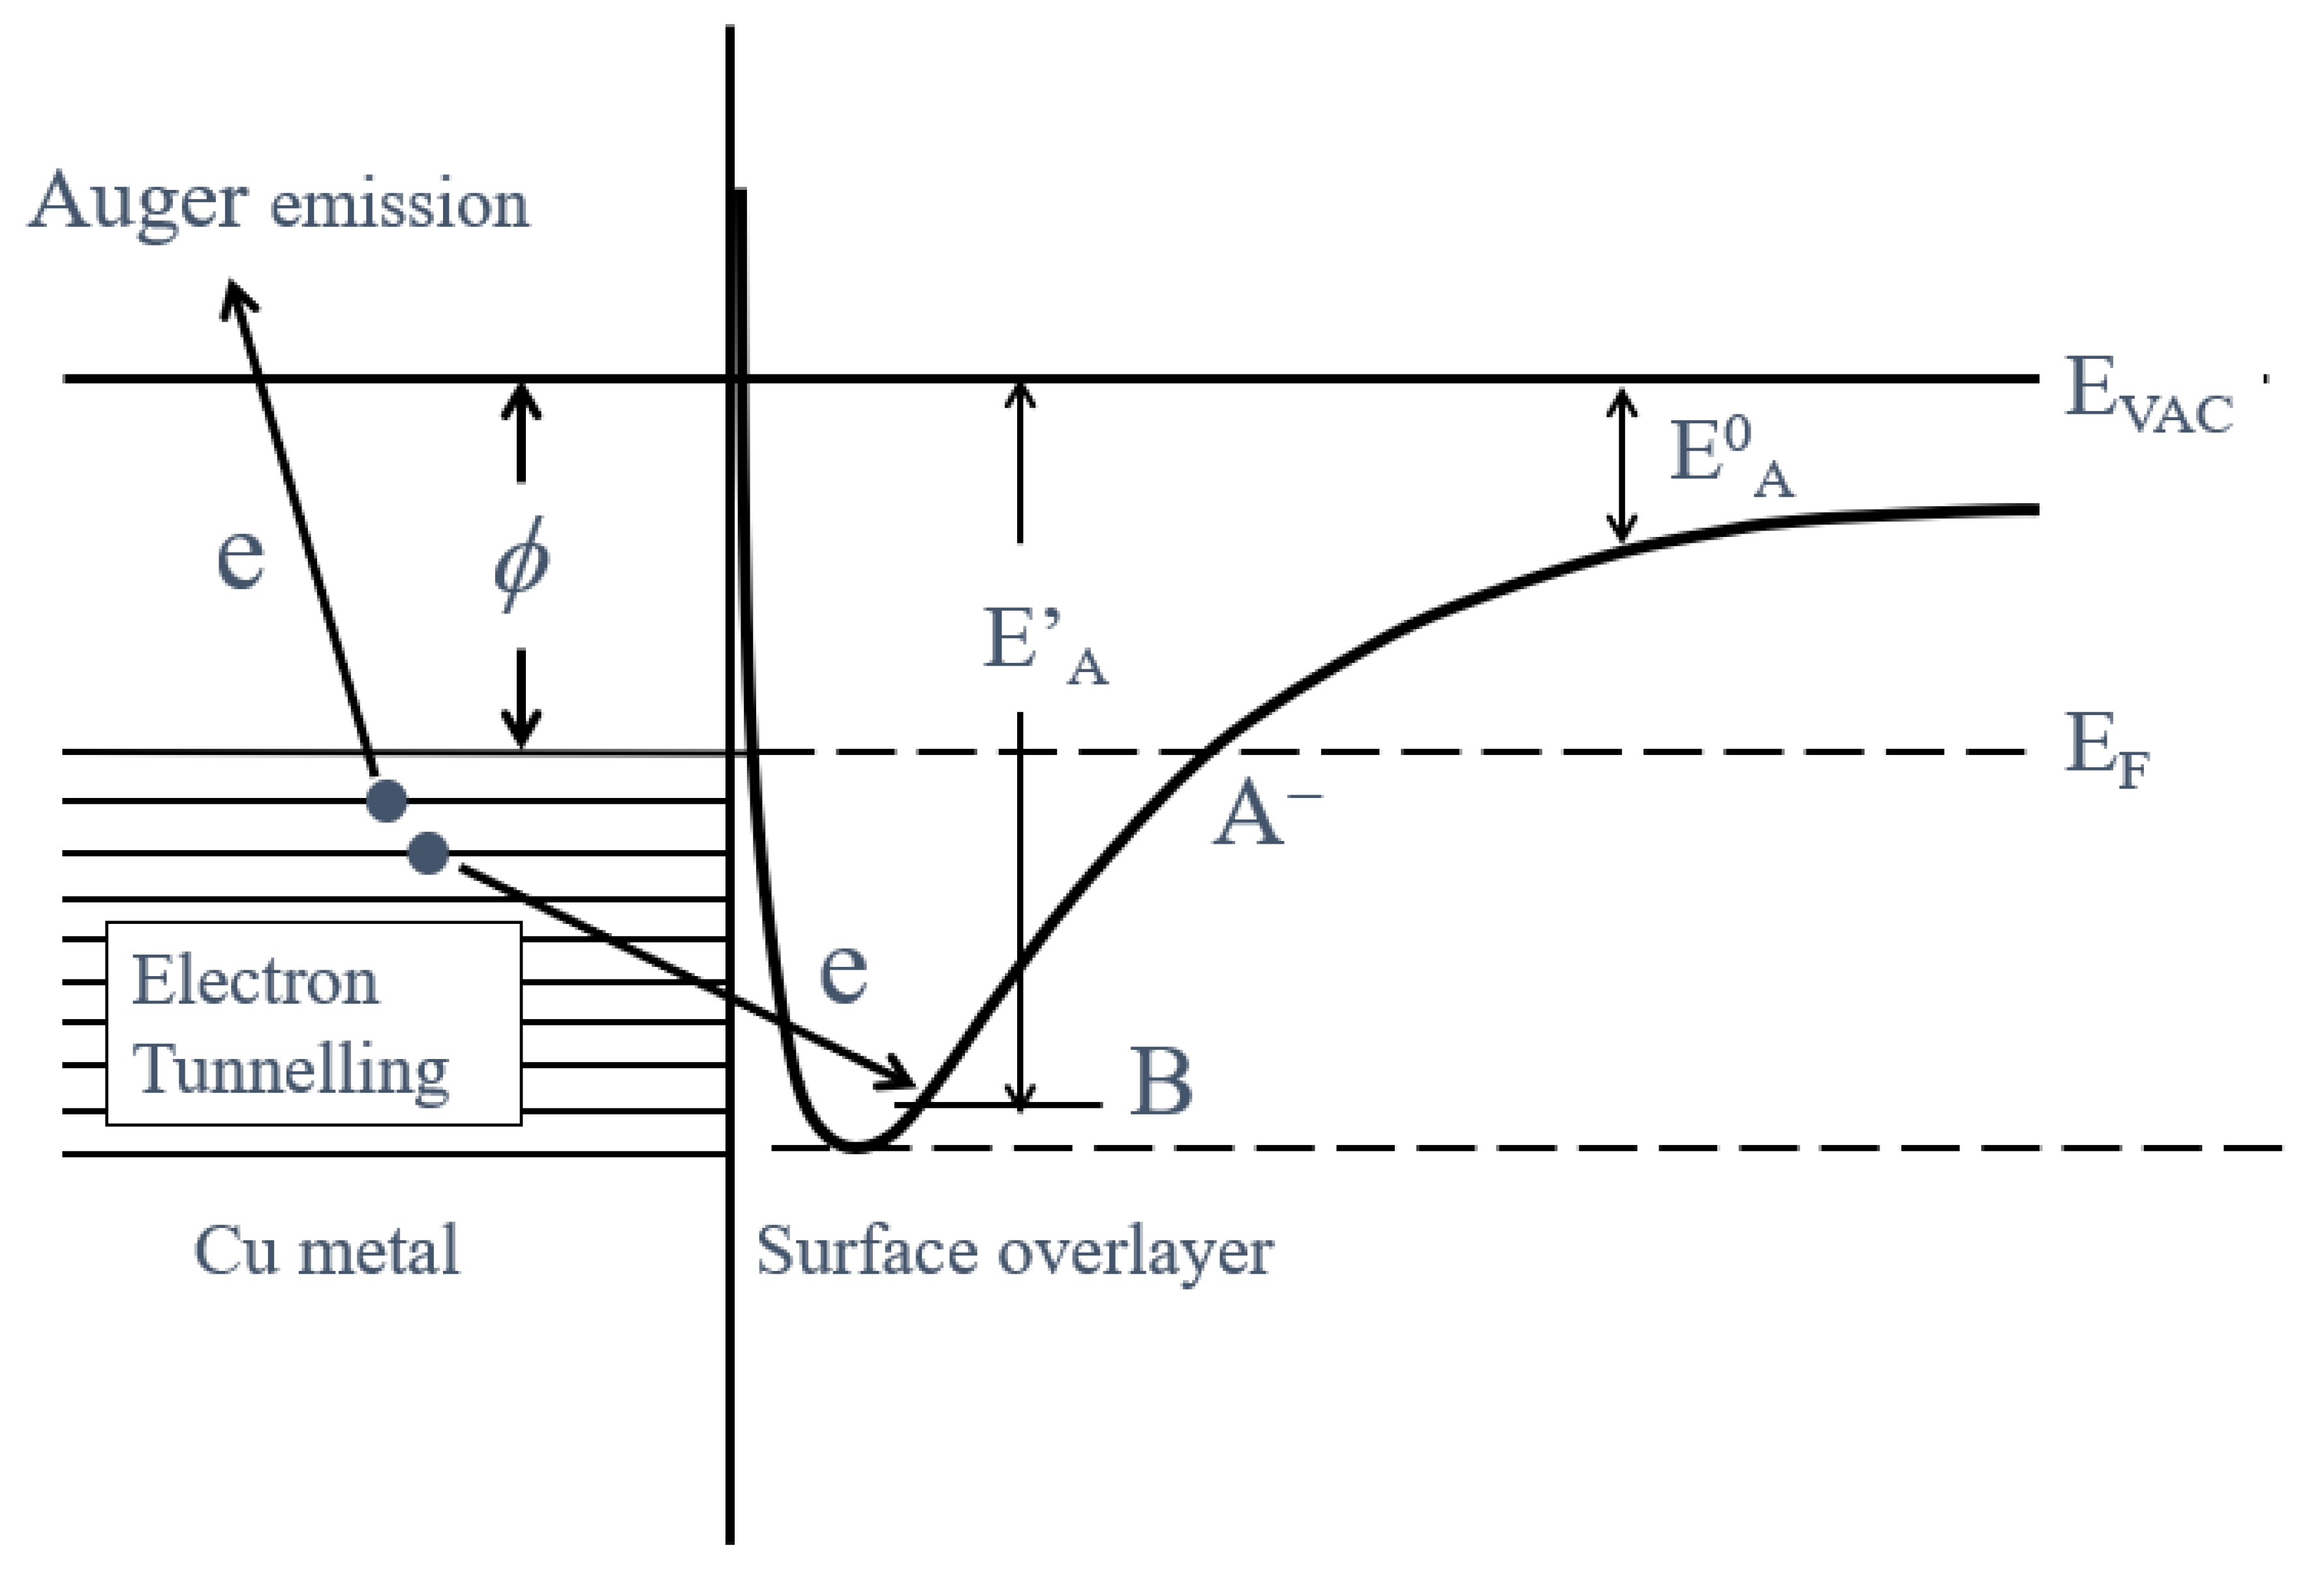

Table 1.
[Sample A] Temperature Programmed Photoelectron Emission (TPPE) characteristics for copper sheets subjected to 10-min abrasion in liquids and ambient air: Activation energy (ΔEa) and pre-exponential factor (A0NTa) derived from the total number of emitted electrons (NTa) as a function of temperature and the maximum value of NTa (NTmaxa) and its temperature (Tmaxa). The ΔEa and A0NTa values were obtained from the plots of Arrhenius type equation, NTa = A0NTa×exp(−ΔEa/kT), versus measurement temperature. Among the NTa data by the wavelength scan from 300 to 170 nm at measurement temperatures in the temperature range of 25−350°C during temperature-increase and subsequent temperature-decrease processes the NTa values in the temperature range of 25−250°C were used for the plots. Up1 and Down1 indicate the 1st temperature-increase and subsequent temperature-decrease processes, respectively. Up2 and Down2 correspond to the 2nd temperature-increase and subsequent temperature-decrease processes after the 1st ones. The solvents of (1) to (4) are arranged in the order of NTmaxa.
| Liquids and ambient air as environments used for abrading | Maximum of NTa during the Up1 process | Temperature of NTmaxa during the Up1 process | Activation energy in 1st temperature-increase process | Activation energy in 1st temperature-decrease process | Pre-exponential factor in 1st temperature-increase process | Activation energy in 2nd temperature-increase process | Activation energy in 2nd temperature-decrease process |
| NTmaxa / 104count | Tmaxa / °C | ΔEaUp1 / eV | ΔEaDown1 / eV | A0NTa / count | ΔEaUp2 / eV | ΔEaDown2 / eV | |
| (1) Water | 6.07 | 250 | 0.391 | −0.161 | 1.53×10⁷ | −0.131 | −0.214 |
| (2) Methanol | 4.18 | 250 | 0.363 | −0.154 | 6.17×10⁶ | ||
| (3) Ethanol | 2.49 | 250 | 0.338 | −0.161 | 2.68×10⁶ | ||
| (4) 2-Propanol | 1.73 | 250 | 0.336 | −0.133 | 2.27×10⁶ | ||
| (5) 1-Propanola) | 2.12 | 100 | -0.164 | −0.131 | 9.13×10² | ||
| (6) Ambient air | 3.70 | 250 | 0.315 | −0.169 | 3.12×10⁶ |
a) The NT a values in the Up1 scan increased with increasing temperature, passed through a maximum at the temperature of 100°C, and then slowly decreased, reaching a constant level. In this case the NTa values in the temperature range of 50−250°C were used.
Table 2.
[Sample C] Temperature Programmed Photoelectron Emission (TPPE) characteristics for copper sheets subjected to 5-min ultrasonic cleaning in liquids: Activation energy of photoelectron emission (ΔEc) and pre-exponential factor (A0NTc) obtained from Arrhenius type plots, NTc = A0NTc×exp(−ΔEc/kT), in the temperature range of 25−250°C using the total number of emitted electrons (NTc) as a function of temperature, and the maximum value of NTc (NTmaxc) and its temperature (Tmaxc). The solvents are arranged in the order of NTmaxc.
| Liquids used for cleaning | Maximum of NTc during the Up1 scan | Temperature of NTmaxc during the Up1 scan | Activation energy in 1st temperature-increase process | Activation energy in 1st temperature-decrease process | Pre-exponential factor in 1st temperature-increase process | Activation energy in 2nd temperature-increase process | Activation energy in 2nd temperature-decrease process |
| NTmaxc / 104count | Tmaxc /°C | ΔEcUp1 / eV | ΔEcDown1 / eV | A0NTc / count | ΔEcUp2 / eV | ΔEcDown2 / eV | |
| (5) 1-Propanol | 13.2 | 250 | 0.419 | −0.175 | 6.13×10⁷ | −0.158 | −0.222 |
| (4) 2-Propanol | 6.21 | 250 | 0.398 | −0.148 | 1.77×10⁷ | ||
| (3) Ethanol | 4.03 | 250 | 0.348 | −0.166 | 5.03×10⁶ | ||
| (2) Methanol | 3.16 | 250 | 0.335 | −0.160 | 3.39×10⁶ | ||
| (1) Water | 1.17 | 250 | 0.267 | −0.101 | 4.90×10⁵ |
Table 3.
Relation between Acceptor number and Dielectric constant of liquids.
| Liquids used for abrading and ultrasonic cleaning | Acceptor numbera)b) | Dielectric constant (25°C)d) | Reciprocal of dielectric constant |
| AN | e/e0 | 1/ (e/e0) | |
| (1) Water (H2O) | 54.8 | 78.39 | 0.0128 |
| (2) Methanol (CH3OH) | 41.3 | 32.70 | 0.0306 |
| (3) Ethanol (C2H5OH) | 37.1 | 24.55 | 0.0407 |
| (4) 2-Propanol (CH3)2CHOH) | 33.5c) | 19.92 | 0.0502 |
| (5) 1-Propanol (C3H7OH) | 20.33 | 0.0492 |
a) V. Gutmann, Ion pairing and outer sphere effect. Chimia. 31, 1−7 (1977) b) J. E. Huheey, in Inorganic Chemistry, Principles of Structure and Reactivity, 3rd edn. Harper & Row, New York (1983). Japanese translation by G. Kodama, H. Nakazawa, Tokyo Kagaku Dojin (Tokyo, 1984), pp.340−341 c) K. Khosravi, T.T. Niaki, S.H. Ahmadi, Acceptor number induced NMR chemical shift in chloroform. Asian J. d) J. A. Riddick, W. B. Bunger, Organic Solvents, 3rd edn. Wiley-Interscience, New York (1970).
Disclaimer/Publisher’s Note: The statements, opinions and data contained in all publications are solely those of the individual author(s) and contributor(s) and not of MDPI and/or the editor(s). MDPI and/or the editor(s) disclaim responsibility for any injury to people or property resulting from any ideas, methods, instructions or products referred to in the content. |
© 2023 by the authors. Licensee MDPI, Basel, Switzerland. This article is an open access article distributed under the terms and conditions of the Creative Commons Attribution (CC BY) license (http://creativecommons.org/licenses/by/4.0/).
Copyright: This open access article is published under a Creative Commons CC BY 4.0 license, which permit the free download, distribution, and reuse, provided that the author and preprint are cited in any reuse.


