Submitted:
05 December 2023
Posted:
06 December 2023
You are already at the latest version
Abstract
Background: Eukaryotes whole-genome sequencing is crucial for species identification, gene detection and protein-annotation. Oxford Nanopore sequencing serves as an affordable and rapid platform for sequencing eukaryotes, however the relatively higher error rates require computational and bioinformatic efforts to produce more accurate genome assemblies. Here, we evaluated the effect of read correction tools on eukaryotes genome completeness, gene detection and protein-annotation. Methods: Reads generated by ONT of four eukaryotes, C. albicans, C. gattii, S. cerevisiae, and P. falciparum, were assembled using minimap2 and underwent three rounds of read correction using flye, medaka and racon. The generates consensus FASTA files were compared for total length (bp), genome completeness, gene detection, and protein-annotation by QUAST, BUSCO, BRAKER1 and InterProScan, respectively. Results: genome completeness was dependent on assembly method rather than read correction tool, however, medaka performed better than flye and racon. Racon significantly performed better than flye and medaka in gene detection, while both racon and medaka significantly performed better than flye in protein-annotation. Conclusion: We show that three rounds of read correction significantly affects gene detection and protein-annotation which are dependent on assembly quality in preference to assembly completeness.
Keywords:
Eukaryotes
; ONT
; read correction
; gene detection
; protein annotation
1. Introduction
Oxford Nanopore Technology (ONT), a third-generation sequencing technology, serves as a platform to sequence small to large and multiplex genomes and is currently widely used globally, especially in low- and mid-income countries, due to its simplicity, feasibility, and sustainability in both medical research and clinical settings [1,2]. The main advantage of ONT is the generation of real-time analysis using the user-friendly interface, EPI2ME Agent, with no bioinformatic expertise is required, allowing rapid and fast detection of microbe identification and antimicrobial resistant genes (AMR) [3,4]. The agile and simple library preparation for ONT sequencing without the biased PCR amplification step is another major advantage [5]. Furthermore, ONT overcomes the problems observed in next-generation sequencing (NGS) in sequencing genomic repeats and the production of incompletely assembled genomes [6]. ONT sequencing generates ‘long-enough’ reads to exceed the length of repeated regions and generates near-complete assemblies in which the location of resistant genes can be detected – i.e., chromosomal vs plasmid [7,8].
Despite the advantages of ONT and the rapid advancement of the technology since its development, the major shortcoming of this technology is the production of relatively high error rates (~10-15%) when compared to NGS [9]. Although increasing the depth of ONT reads can produce contiguous assembled genomes, the errors accumulate as the sequencing depth increases [10]. ONT reads often require read correction with short reads to generate complete and robust genome assemblies. The hybrid assemblies using both long and short sequencing reads (with sufficient depth of both reads), enhance the accuracy of genomes for downstream analysis [11]. However, having access to both long and short sequencing platforms, and the performance of two sequencing experiments on a single sample, is impractical–especially in low- and middle-income countries and in clinical settings where prompt diagnoses are important.
Computational and bioinformatics tools are a reasonable and low-cost option to reduce error-rate post assembly. These tools use varied algorithms that are designed to identify and resolve sequencing errors to not only produce a complete but also an accurate genome assembly, though the output of the read correction step is reliant on the applied methods and their specific parameters [12].
Several studies are benchmarking freely available read correction tools and their impact on downstream analysis [13,14,15,16]. However, the majority of benchmarking studies focus on prokaryotes’ genome assemblies rather than eukaryotes. Whilst ONT has become an important platform for eukaryotic DNA sequencing, allowing an in-depth analysis of complex eukaryotic DNA sequences for virulence factors and gene annotation, there is a need to benchmark the impact of read correction tools on eukaryotic genomes and their downstream analysis.
In this study, we retrieved ONT sequencing reads from the Sequencing Read Archive – NCBI of four pathogenic eukaryotes: Candida albicans, Cryptococcus gattii, Saccharomyces cerevisiae, and Plasmodium falciparum, and evaluated the impact of three read correction tools: flye, medaka, and racon, on genome length, fragmentation and completeness, accurate gene structure annotation, and analysed and classified eukaryotic functional proteins.
2. Materials and Methods
The sequencing reads (FASTQ) of four eukaryotic species, C. albicans, C. gattii, S. cerevisiae, and P. falciparum (n=6 each), were retrieved from the SRA – NCBI (Supplementary Table S1). The sequencing reads were all generated using ONT ligation sequencing kit (LSK-109) with R9 flow cells. The FASTQ reads were then filtered based on quality (Q score >10) using NanoFilt (version 2.6.0) [17]. The adapters and read barcodes were then trimmed by Porechop (version 0.2.1) (https://github.com/rrwick/Porechop).
The filtered and trimmed FASTQ reads were then aligned against a reference genome sequence (Supplementary Table S2) using Minimap2 (version 2.17-r941) [18] in combination with bcftools (version 1.5) (https://samtools.github.io/bcftools/) and bedtools (version 2.30) (https://bedtools.readthedocs.io/en/latest/) to remove missing and/or low-coverage sites/nucleotides. Qualimap (version 2.2.2-dev) [19] was used to detect the mapping percentage in the BAM files generated in the minimap2 procedure. Reads with >75% coverage mapping against the reference genome were further analysed (Supplementary Table S3). The consensus FASTA files generated went through three rounds of read correction process with flye (version 2.8.3-b1695) with – polish-target parameter, medaka (version 0.11.0) (https://github.com/nanoporetech/medaka) and racon (version 1.4.10) with – no-trimming parameter [20,21].
The quality of generated consensus FASTA files from minimap2, flye, medaka, and racon (n= 24 per species, n= 96 in total) were assessed by QUAST (version 5.0.2) using the LG parameter. The total length (bp) total aligned (bp), and GC%, were evaluated [22].
The sum of genome completeness, duplication rate and genome fragmentation, and missing genes were evaluated by Universal Single-Copy Orthologues (BUSCO) (version 5.2.2) [23]. Accurate eukaryotic gene structure annotation of the consensus FASTA files was assessed with BRAKER1 (version 3.0.3) with GeneMark-ET. The generated GFF3 files containing complete coding DNA (CDs), forwards CDs, reverse CDs, mRNA, and introns, were then visualized with pycirclize (version 0.5.1) (https://github.com/moshi4/pyCirclize) [24,25,26,27]. InterProScan (European Molecular Biology Laboratory’s European Bioinformatics Institute) (version 5.63-95.0) was used to fully analyse and classify eukaryotic functional proteins using ProSiteProfiles analysis [28]. All consensus FASTA files, codes, and commands are available at https://github.com/hussainsafar/eukaryotes_read_correction
Statistical analysis was performed with Benferroni’s multiple comparison one-way ANOVA by GraphPad Prism (California, USA) (version 8.0.1) to determine significant differences (p < 0.05, p<0.001) existing among the consensus FASTA files generated by minimap2 before and after read correction with flye, medaka and racon, in gene and protein detection/prediction by BRAKER1 and InterProScan.
3. Results and Discussion
Eukaryotic whole genome sequencing provides comprehensive insights into their complex genomes. ONT sequencing is a practical long-read sequencing platform that enables rapid and cost-effective identification of strains, as well as detection of virulence factors and proteins, in both research and clinical settings. However, the relatively higher error rates produced by ONT reads require computational and bioinformatics efforts to produce contiguous and accurate eukaryotic genome assemblies. In this study, we examined the effect of three rounds of read corrections using flye, medaka, and racon after assembling ONT reads to a reference genome using minimap2.
QUAST analysis was performed to assess the quality and accuracy of genome assemblies pre and post three rounds of read correction. The total length (bp) was significantly (p<0.05) (Table 1) higher after read alignment with minimap2 against the reference genomes than after read correction of all four eukaryotic species examined in this study. Nevertheless, the median total length after read correction was the lowest after correction with flye and significantly (p<0.05) improved post the second and third rounds of correcting with medaka and racon, respectively (Table 1). The improvement of assemblies’ total length is a common feature. Studies have reported improvements up to 57% in genome assemblies, however in this study we noticed improvements of 9.36% only [8,16]. The variation in improvement percentage depends upon various factors, for example, organism sequenced, DNA library preparation, and genome assembly and read correction tools used. Although the total aligned (bp) was highest after minimap2 assembly, it was not significant (p>0.05) (Table 1) when compared to assemblies after read correction. The total aligned was the highest after the second round of read correction with medaka and was the lowest after the third read correction with racon. The GC% was significantly higher (p<0.05) (Table 1) after read correcting with flye and decreased after the second and third rounds of read correcting. We have noticed similar outcomes previously, in line with other studies, that although medaka and racon had significantly lower GC%, both read correction tools performed better in the overall genome assembly, especially when combined [16,29,30,31].
BUSCO provides a quantitative measure of genome completeness to evaluate the quality of genome annotation. Among the four eukaryotic species examined in this study, medaka showed improvement over minimap2 only in C. albicans assembled genomes regarding genome completeness (Figure 1a). When comparing the read correction tools, medaka was also more superior than flye and racon in genome completeness in all four species samples (Figure 1). These results are in line with Sigova et al. [32]. In their study, they reported that read correction with medaka is superior to read correction with racon in fungal pathogens. In addition, the percentage of genome completeness significantly decreases (by ~40%) when a reference is added, even after using six read correction tools [32]. Genome completeness is majorly affected by sequencing methods and genome assembly tools rather than read correction tools [33]. The higher number of genome completeness observed in uncorrected assemblies in this study is due to minimap2 assembly, which is a reference-based alignment method. Other studies using de-novo genome assembly methods show -with sufficient sequencing depth- the advantages of using read correction tools in BUSCO analysis.
BRAKER1 is a bioinformatic tool commonly utilized for gene prediction in eukaryotic genomes using GeneMark-ET. Ideally, eukaryotic genome assemblies are combined with RNA-seq data to improve the accuracy of gene prediction. However, the availability of combining both DNA and RNA-seq data is not often available in real scenarios. Here, we performed BRAKER1 analysis on assembled and corrected genomes to evaluate the total number of CDs, forward CDs, reverse CDs, mRNA, and introns (Figure 2, Figure 3, Figure 4 and Figure 5). The total numbers of CDs, forwards CDs, and reverse CDs were significantly higher after the third round of read correction with racon (p<0.05 vs minimap2, p<0.001 vs flye, and p<0.05 vs medaka) (Figure 2, Figure 3, Figure 4, Figure 5 and Figure 6). Surprisingly, the total number of CDs increased after the first round of read correction with flye but decreased after the second round of read correction with medaka (Figure 2, Figure 3, Figure 4 and Figure 5). In the samples of C. albicans, C. gattii, and P. falciparum, the total number of CDs after read correction with racon was higher than flye by 55273, 176705, and 63178 respectively. However, the total number of CDs in the samples of S. cerevisiae was lower after read correction with racon. The effect of genome assembly and read correction pipelines on the S. cerevisiae genome has been well characterized by [33]. The authors concluded that although read correction improved contiguity and coverage, sequencing depth and choice of sequencing method affects S. cerevisiae genome annotation [33]. The number of introns showed a parallel significance pattern to the total number of CDs. The total number of introns was significantly higher after read correction with racon (p<0.05 vs minimap2, p<0.001 vs flye and medaka) (Figure 2, Figure 3, Figure 4, Figure 5 and Figure 6) in the samples of C. albicans, C. gattii and P. falciparum, but not S. cerevisiae. Similarly, Shin et al. [34] found that applying the read correction tools Nanopolish to reads assembled by the Canu-SMARTdenovo method increased the detection of CDs and introns when using MAKER2 as an annotation tool. Interestingly, the number of introns after the first round of read correction with flye was significantly higher (p<0.05) than after genome assembly with minimap2 (Figure 6). On the contrary, the number of mRNA coding genes was the highest after genome assembly with minimap2. Among the three rounds of read correction, the highest number of mRNA coding genes was detected after the second round of read correction with medaka, which was only significant against racon (p<0.05) (Figure 2, Figure 3, Figure 4, Figure 5 and Figure 6).
Based on the results of BRAKER1 gene prediction accuracy, we investigated the effect of read correction tools on protein annotation by InterProScan with ProSiteProfiles analyses, describing protein domains, families, and functional sites. The overall hits of protein annotation were improved with each round of read correction in all four species, with racon being the top-performing read correction tool (Figure 7a). Several protein annotations were only detected after applying a read correction to the assembled genomes, such as TGF-beta binding (IPR017878), colipase family (IPR001981), and Cytochrome c class II (IPR002321) in C. gattii samples; streptavidin (IPR005468), Cytochrome c, class II (IPR002321), and GATA-type zinc finger (IPR000679) in S. cerevisiae; and platelet-derived growth factor (PDGF) (IPR000072), coronaviridae zinc-binding (CV ZBD) (IPR000072), GATA-type zinc finger (IPR000679), and C-terminal cystine knot (IPR006207) in P. falciparum samples (Figure 7a). Protein annotation hits of IPR002321 detected by medaka were significantly (p<0.05) higher than minimap2, flye, and racon in C. albicans, whereas protein annotation hits of IPR00724 and IPR001002 detected by medaka were significantly (p<0.05) higher than minimap2, and protein annotation hits of IPR002321 detected by medaka and racon were significantly (p<0.05) higher than minimap2 and flye (Figure 7b). In S. cerevisiae samples, protein annotation hits of IPR007112 detected by racon were significantly higher than hits detected by minimap2 (Figure 7b). Protein annotation hits of IPR001938 detected by medaka were significantly (p<0.05) higher than hits detected by flye in P. falciparum samples (Figure 7b).
To our knowledge, this is the first study to evaluate the effect of read correction tools for long-reads on gene prediction using BRAKER1 and protein annotation using InterProScan. Although BUSCO analysis showed superior genome completeness to uncorrected assemblies, BRAKER1 gene detection and protein annotation using InterProScan with ProProfiles analysis, we found that read correction tools offer advantages over uncorrected assemblies. In this study, we showed that genome accuracy after three rounds of read correction is more vital for gene prediction and protein annotation than genome completeness. We proved that gene prediction accuracy relies on the quality of assembled genomes after read correction rather than the quantity or the number of present genes after genome assembly. In other words, a more accurate genome assembly leads to more reliable gene prediction and protein annotation [35,36].
Supplementary Materials
The following supporting information can be downloaded at: www.mdpi.com/xxx/s1, Table S1: The SRA numbers of sequencing reads (FASTQ) of four eukaryotic species, C. albicans, C. gattii, S. cerevisiae, and P. falciparum (n=6 each), were retrieved from the SRA – NCBI; Table S2: NCBI references used for the four eukaryotic species, C. albicans, C. gattii, S. cerevisiae, and P. falciparum, Table S3: Read mapping coverage percentage against the appropriate reference genome as detected by qualimap.
Author Contributions
Conceptualization, HAS; methodology, HAS and FA; software, HAS; validation, ASM; formal analysis, HAS.; investigation, HAS; resources, HAS; data curation, HAS and FA; writing—original draft preparation, HAS; writing—review and editing, FA and ASM; visualization, HAS and FA; supervision, ASM; funding acquisition, ASM. All authors have read and agreed to the published version of the manuscript.
Funding
This research received no funding.
Conflicts of Interest
The authors declare no conflict of interest.
References
- Runtuwene, L.R., Tuda, J.S.B., Mongan, A.E. et al. Nanopore sequencing of drug-resistance-associated genes in malaria parasites, Plasmodium falciparum, Sci Rep, 2018, 8. [CrossRef]
- Stevanovski, I., Chintalaphani, S.R., Gamaarachchi, H. et al. Comprehensive genetic diagnosis of tandem repeat expansion disorders with programmable targeted Nanopore sequencing, Sci Adv, 2022, 8. [CrossRef]
- Charalampous, T., Kay, G.L., Richardson, H. et al. Nanopore metagenomics enables rapid clinical diagnosis of bacterial lower respiratory infection, Nat Biotechol, 2019, 37, pp. 783–792. [CrossRef]
- Cheng, H., Sun, Y., Yang, Q. et al. A rapid bacterial pathogen and antimicrobial resistance diagnosis workflow using Oxford Nanopore adaptive sequencing method, Brief Bioinform, 2022, 23. [CrossRef]
- Zhao, W. Zeng, W., Pang, B. et al. Oxford nanopore long-read sequencing enables the generation of complete bacterial and plasmid genomes without short-read sequencing, Front Microbiol, 2023, 14. [CrossRef]
- Salzberg, S.L. Phillippy, A.M., Zimin, A. et al. Gage: A critical evaluation of genome assemblies and assembly algorithms, Genome Res, 2011, 22, pp. 557–567. [CrossRef]
- Ashton, P.M. Nair, S., Dallman, T. et al. Minion Nanopore sequencing identifies the position and structure of a bacterial antibiotic resistance island, Na Biotechol, 2014, 33, pp. 296–300. [CrossRef]
- Wang, Y., Zhao, Y., Bollas, A. et al. Nanopore sequencing technology, Bioinformatics and Applications, Nat Biotechnol, 2021, 39, pp. 1348–1365. [CrossRef]
- Delahaye, C. and Nicolas, J. Sequencing DNA with nanopores: Troubles and biases, PLOS ONE, 2021, 16. [CrossRef]
- Sutton, J.M., Millwood, J.D., Case McCormack, A. et al. Optimizing Experimental Design for Genome Sequencing and Assembly with Oxford Nanopore Technologies, Gigabyte, 2021, pp. 1–26. [CrossRef]
- Brown, C.L. Keenum, I.M., Dai, Det. al. Critical evaluation of short, long, and hybrid assembly for contextual analysis of antibiotic resistance genes in complex environmental metagenomes, Sci Rep, 2021, 11. [CrossRef]
- Dohm, J.C. Peters, P., Stralis-Pavese, N. et al. Benchmarking of long-read correction methods, NAR Genom Bioinform, 2020, 2. [CrossRef]
- Cherukuri, Y. and Janga, S.C. Benchmarking of de novo assembly algorithms for Nanopore Data reveals optimal performance of OLC approaches, BMC Genomics, 2016, 17(S7). [CrossRef]
- Juraschek, K. Borowiak, M., Tausch, S.H. et al. Outcome of different sequencing and assembly approaches on the detection of plasmids and localization of antimicrobial resistance genes in commensal escherichia coli, Microorganisms, 2021, 9, p. 598. [CrossRef]
- Wick, R.R. and Holt, K.E. Benchmarking of long-read assemblers for prokaryote whole genome sequencing, F1000Res, 2021, 8, p. 2138. [CrossRef]
- Safar, H.A., Alatar, F. Nasser, K. et al. The impact of applying various de novo assembly and correction tools on the identification of genome characterization, drug resistance, and virulence factors of clinical isolates using ONT sequencing, BMC Biotechnol, 2023, 23. [CrossRef]
- De Coster, W. D’Hert, S., Schultz, D.T. et al. NanoPack: Visualizing and processing long-read sequencing data, Bioinformatics, 2018, 34, pp. 2666–2669. [CrossRef]
- Li, H. Minimap2: Pairwise alignment for nucleotide sequences, Bioinformatics, 2018, 34, pp. 3094–3100. [CrossRef]
- García-Alcalde, F., Okonechnikov, K., Carbonell, J. et al. Qualimap: Evaluating next-generation sequencing alignment data, Bioinformatics, 2012, 28, pp. 2678–2679. [CrossRef]
- Kolmogorov, M. Yuan, J., Lin, Y. et al. Assembly of long, error-prone reads using repeat graphs, Nat Biotechnol, 2019, 37, pp. 540–546. [CrossRef]
- Vaser, R. Sović, I., Nagarajan, N. et al. Fast and accurate de Novo Genome Assembly from long uncorrected reads, Genome Res, 2017, 27, pp. 737–746. [CrossRef]
- Mikheenko, A. Prjibelski, A., Saveliev, V. et al. Versatile Genome Assembly evaluation with Quast-LG, Bioinformatics, 2018, 34, pp. i142–i150. [CrossRef]
- Manni, M. Berkeley, M.R., Seppey, M. et al. Busco: Assessing genomic data quality and beyond, Curr Proto, 2021, 1. [CrossRef]
- Stanke, M. Schöffmann, O., Morgenstern, B. et al. Gene prediction in eukaryotes with a generalized hidden markov model that uses hints from external sources, BMC Bioinformatics, 2006, 7. [CrossRef]
- Buchfink, B., Xie, C., Huson, D.H. Fast and sensitive protein alignment using diamond, Nat Methods, 2014, 12, pp. 59–60. [CrossRef]
- Hoff, K.J., Lange S., Lomsadze, A. et al. Braker1: Unsupervised RNA-seq-based genome annotation with Genemark-ET and Augustus, Bioinformatics, 2015, 32, pp. 767–769. [CrossRef]
- Hoff, K.J., Lomsadze, A., Borodovsky, M. et al. Whole-genome annotation with Braker, Methods Mol Biol, 2019, pp. 65–95. [CrossRef]
- Jones, P., Binns, D., Chang, H.Y. et al. InterProScan 5: Genome-scale protein function classification, Bioinformatics, 2014, 30, pp. 1236–1240. [CrossRef]
- Chen, Z., Erickson, D.L. and Meng, J. Benchmarking long-read assemblers for genomic analyses of bacterial pathogens using Oxford Nanopore sequencing, Int J Mol Sci, 2020, 21, p. 9161. [CrossRef]
- Senol Cali, D., Kim, J.S., Ghose, S. et al. Nanopore sequencing technology and tools for Genome Assembly: Computational analysis of the current state, bottlenecks and Future Directions, Brief Bioinform, 2018, 20, pp. 1542–1559. [CrossRef]
- Lee, J.Y., Kong, M., Oh, J. et al. Comparative evaluation of nanopore polishing tools for microbial genome assembly and polishing strategies for downstream analysis, Sci Rep, 2021, 11. [CrossRef]
- Sigova, E.A., Pushkova, E.N., Rozhmina, T.A. et al. Assembling quality genomes of flax fungal pathogens from Oxford Nanopore Technologies Data, J Fungi (Basel), 2023, 9, p. 301. [CrossRef]
- Zhang, X., Liu, C.G., Yang, S.H. et al. Benchmarking of long-read sequencing, assemblers and Polishers for yeast genome, Brief Bioinform, 2022, 23. [CrossRef]
- Shin, S.C. Kim, H., Lee, J.H. et al. Nanopore sequencing reads improve assembly and gene annotation of the parochlus steinenii genome, Sci Rep, 2019, 9. [CrossRef]
- Steward, C.A., Parker, A.P.J., Minassian, B.A. et al. Genome annotation for clinical genomic diagnostics: Strengths and weaknesses, Genome Med, 2017, 9. [CrossRef]
- Wingfield, B.D. Berger, D.K., Coetzee, M.P.A. et al. Ima genome-f17, IMA Fungus, 2022, 13. [CrossRef]
Figure 1.
BUSCO analysis detecting genome completeness, fragmented genes, and missing genes in (a) C. albicans, (b) C. gattii, (c) S. cerevisiae, and (d) P. falciparum samples. mm = uncorrected minimap2, mmf = minimap2 corrected with flye, mmfm = minimap2 corrected with flye+medaka, and mmfmr = minimap2 corrected with flye+medaka+racon.
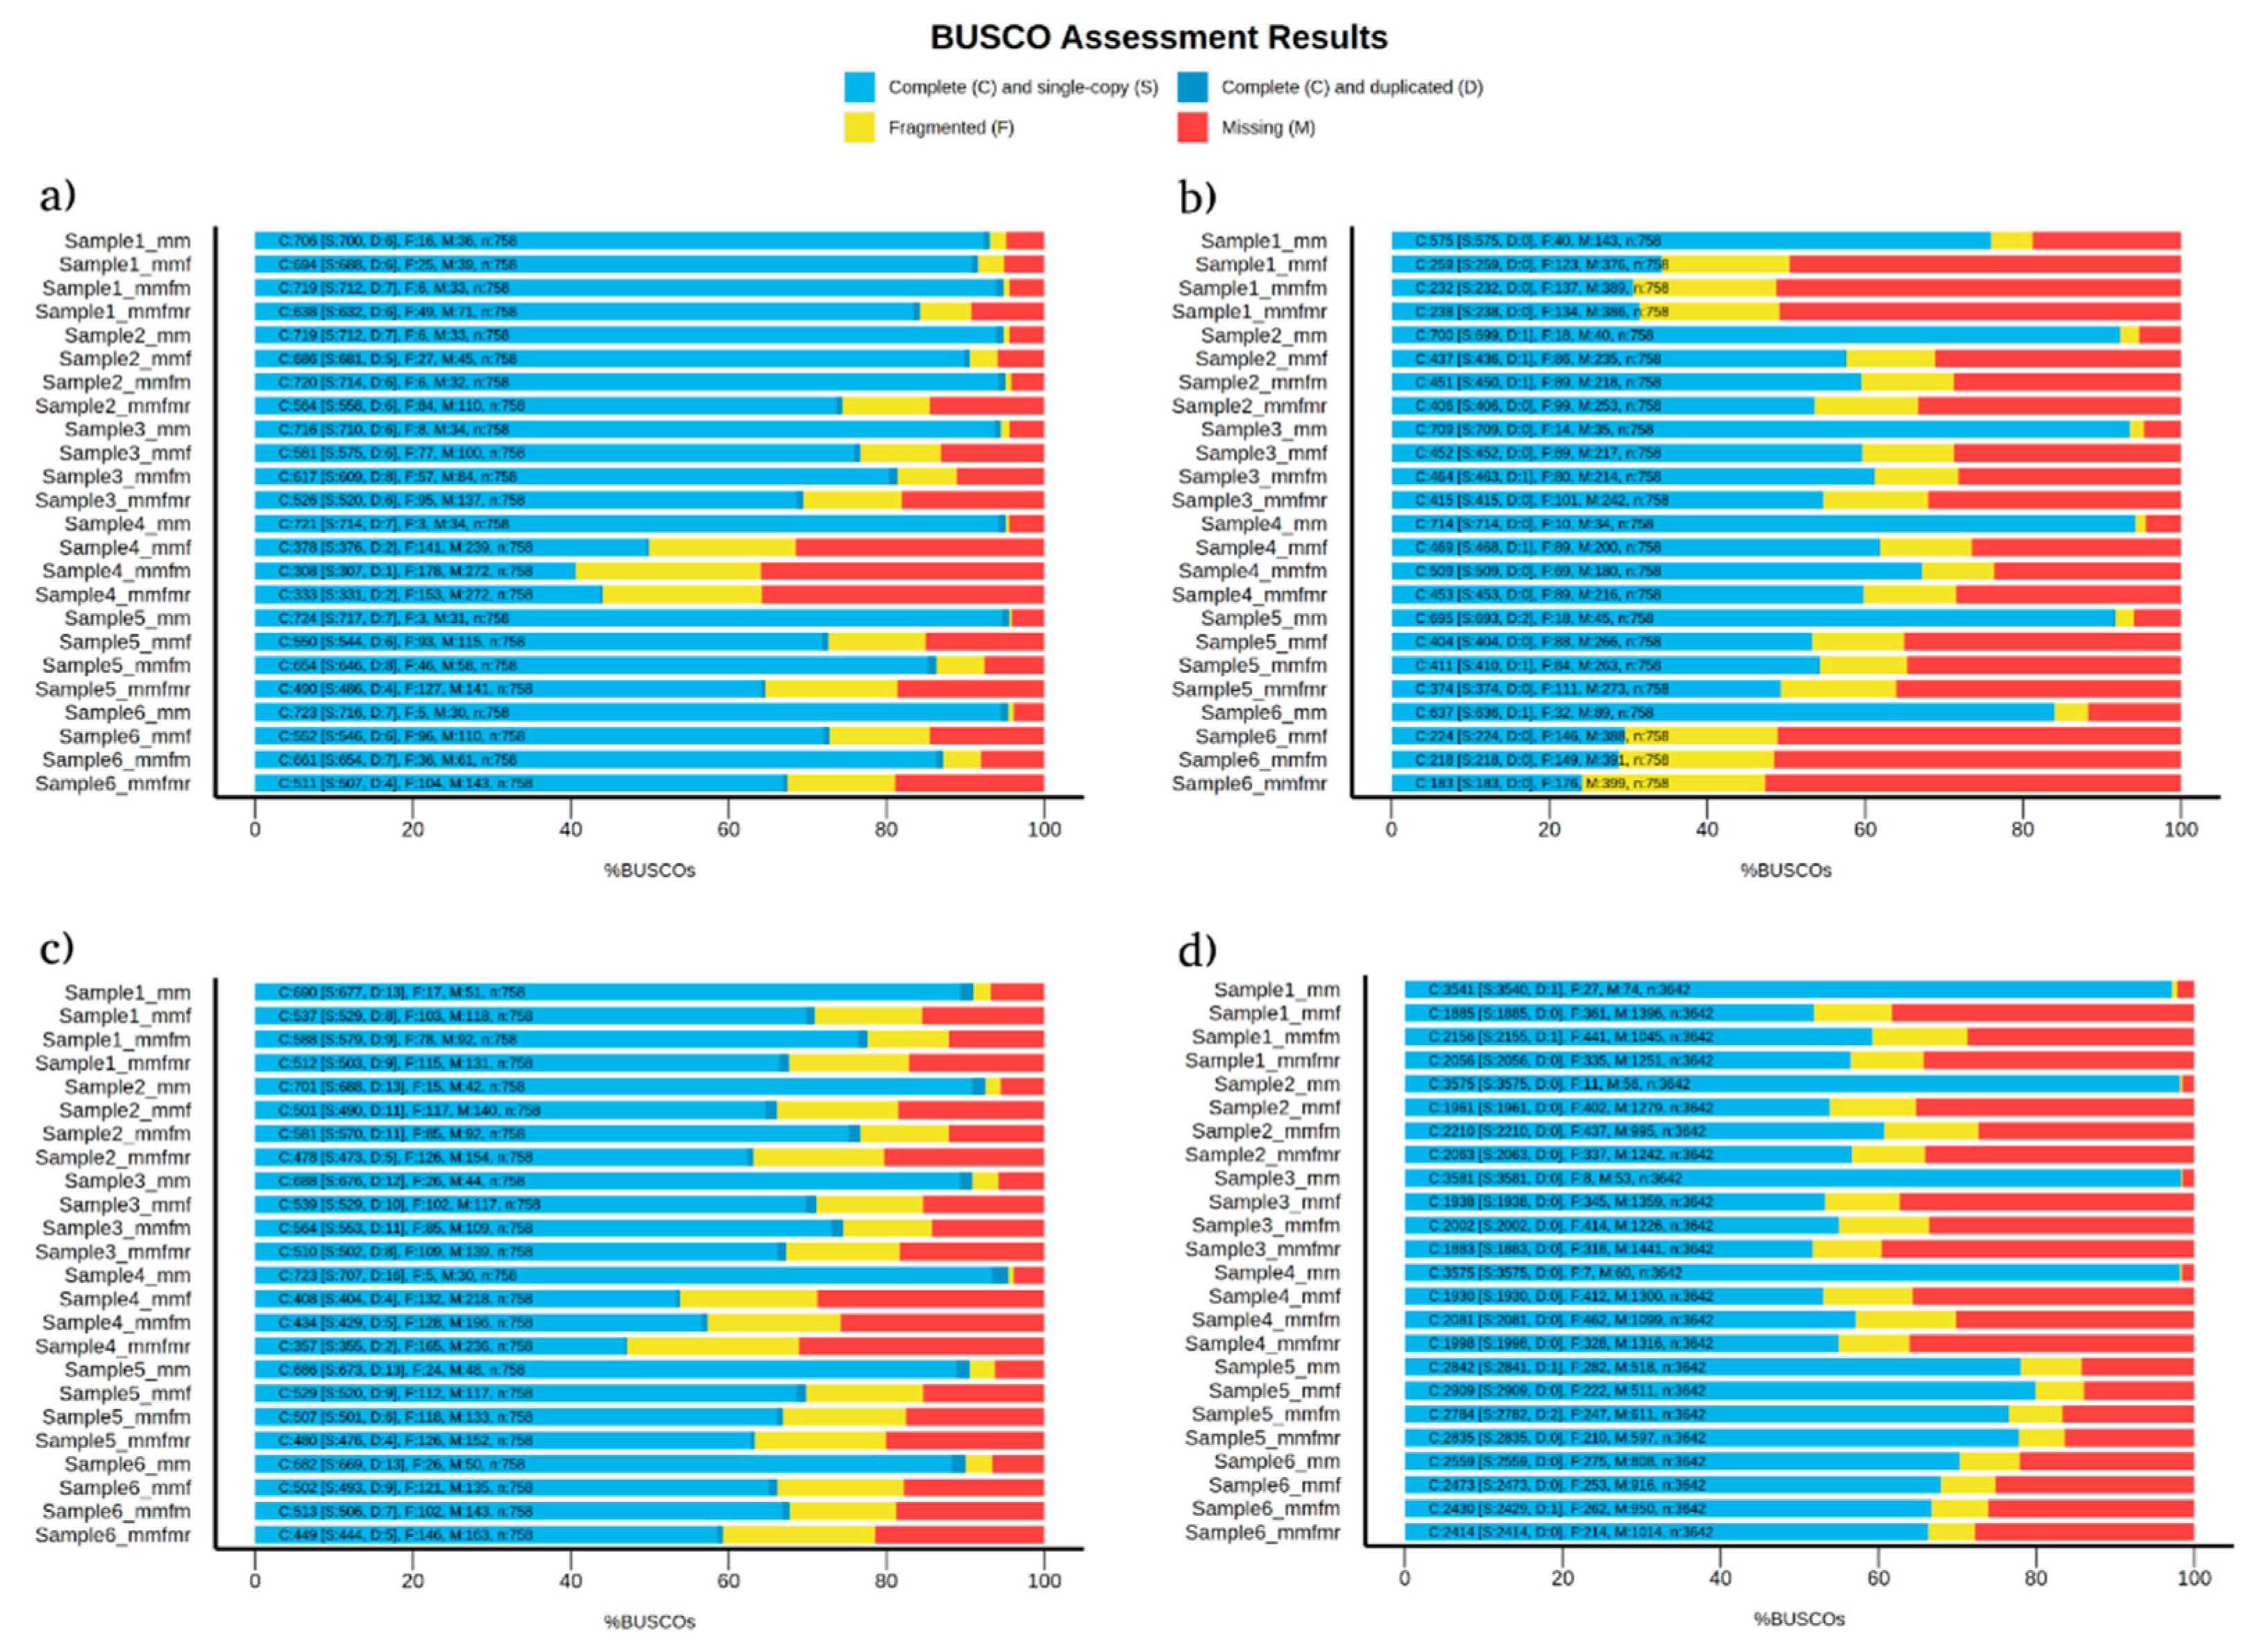
Figure 2.
BRAKER1 analysis detecting forwards CDs, reverse CDs, mRNA, and intron in C. albicans species. (a) sample 1, (b) sample 2, (c) sample 3, (d) sample 4, (e) sample 5, and (f) sample 6.
Figure 2.
BRAKER1 analysis detecting forwards CDs, reverse CDs, mRNA, and intron in C. albicans species. (a) sample 1, (b) sample 2, (c) sample 3, (d) sample 4, (e) sample 5, and (f) sample 6.
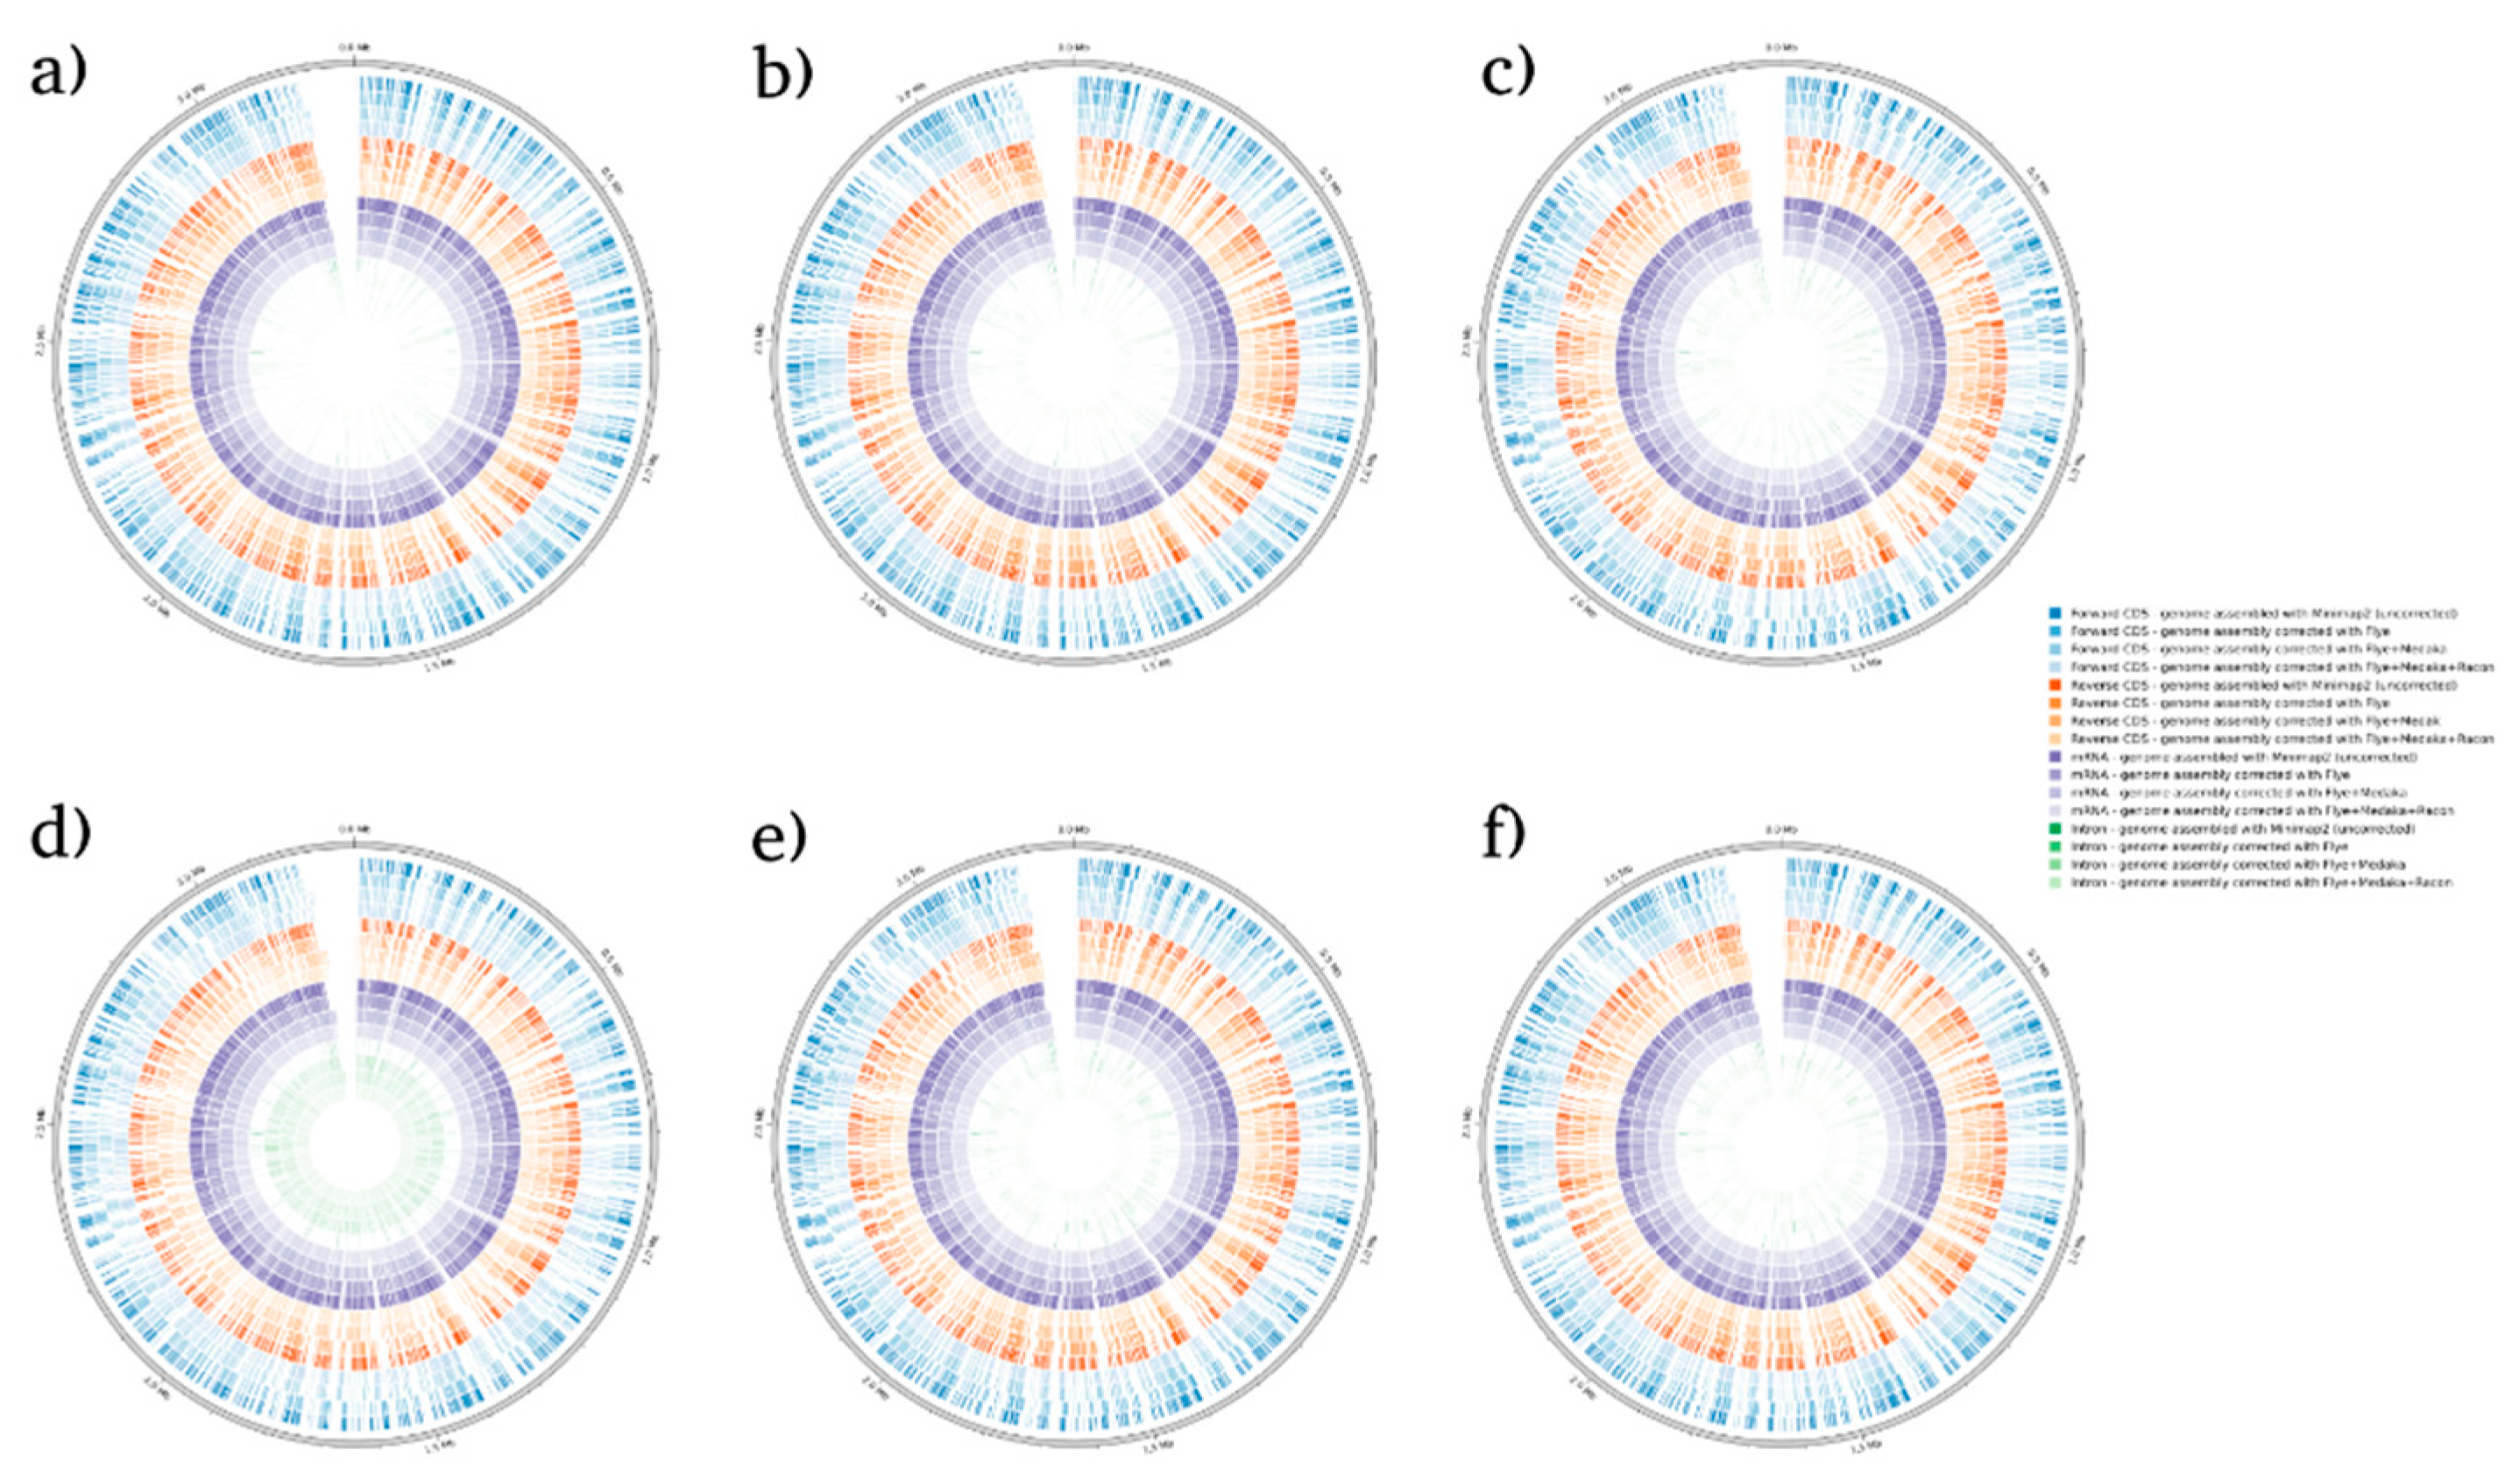
Figure 3.
BRAKER1 analysis detecting forwards CDs, reverse CDs, mRNA, and intron in C. gattii species. (a) sample 1, (b) sample 2, (c) sample 3, (d) sample 4, (e) sample 5, and (f) sample 6.
Figure 3.
BRAKER1 analysis detecting forwards CDs, reverse CDs, mRNA, and intron in C. gattii species. (a) sample 1, (b) sample 2, (c) sample 3, (d) sample 4, (e) sample 5, and (f) sample 6.
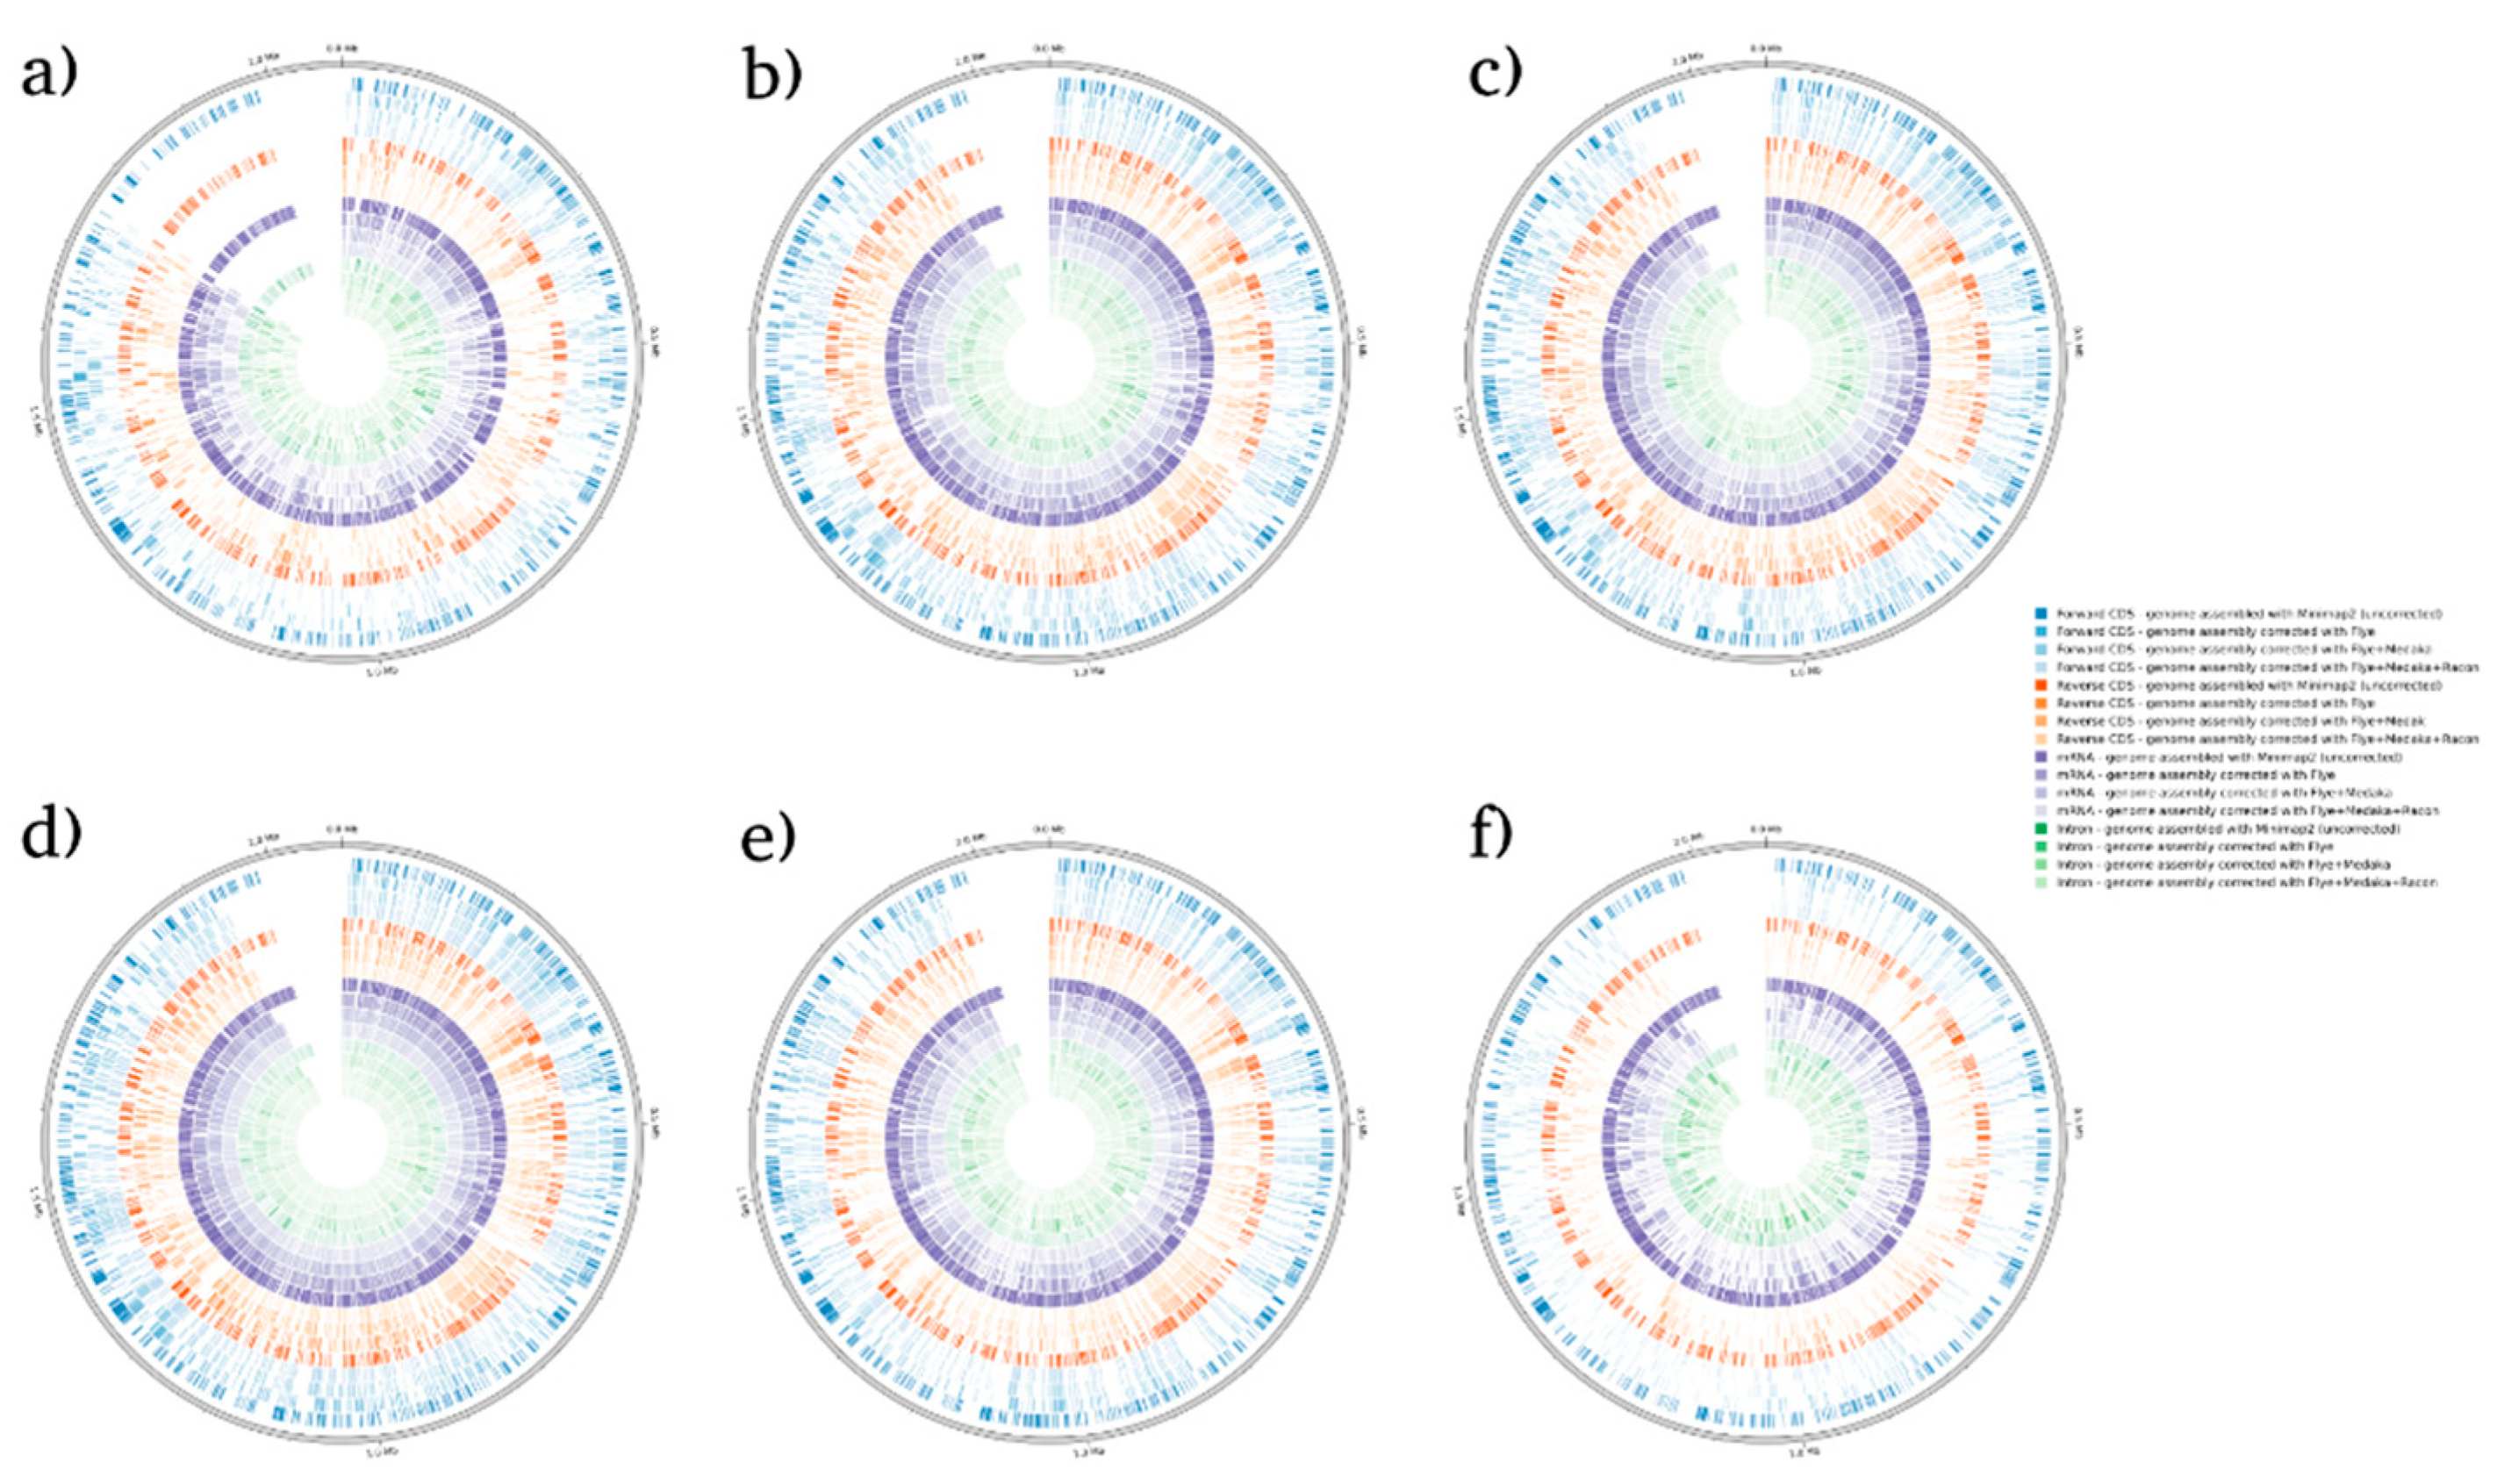
Figure 4.
BRAKER1 analysis detecting forwards CDs, reverse CDs, mRNA, and intron in S. cerevisiae species. (a) sample 1, (b) sample 2, (c) sample 3, (d) sample 4, (e) sample 5, and (f) sample 6.
Figure 4.
BRAKER1 analysis detecting forwards CDs, reverse CDs, mRNA, and intron in S. cerevisiae species. (a) sample 1, (b) sample 2, (c) sample 3, (d) sample 4, (e) sample 5, and (f) sample 6.
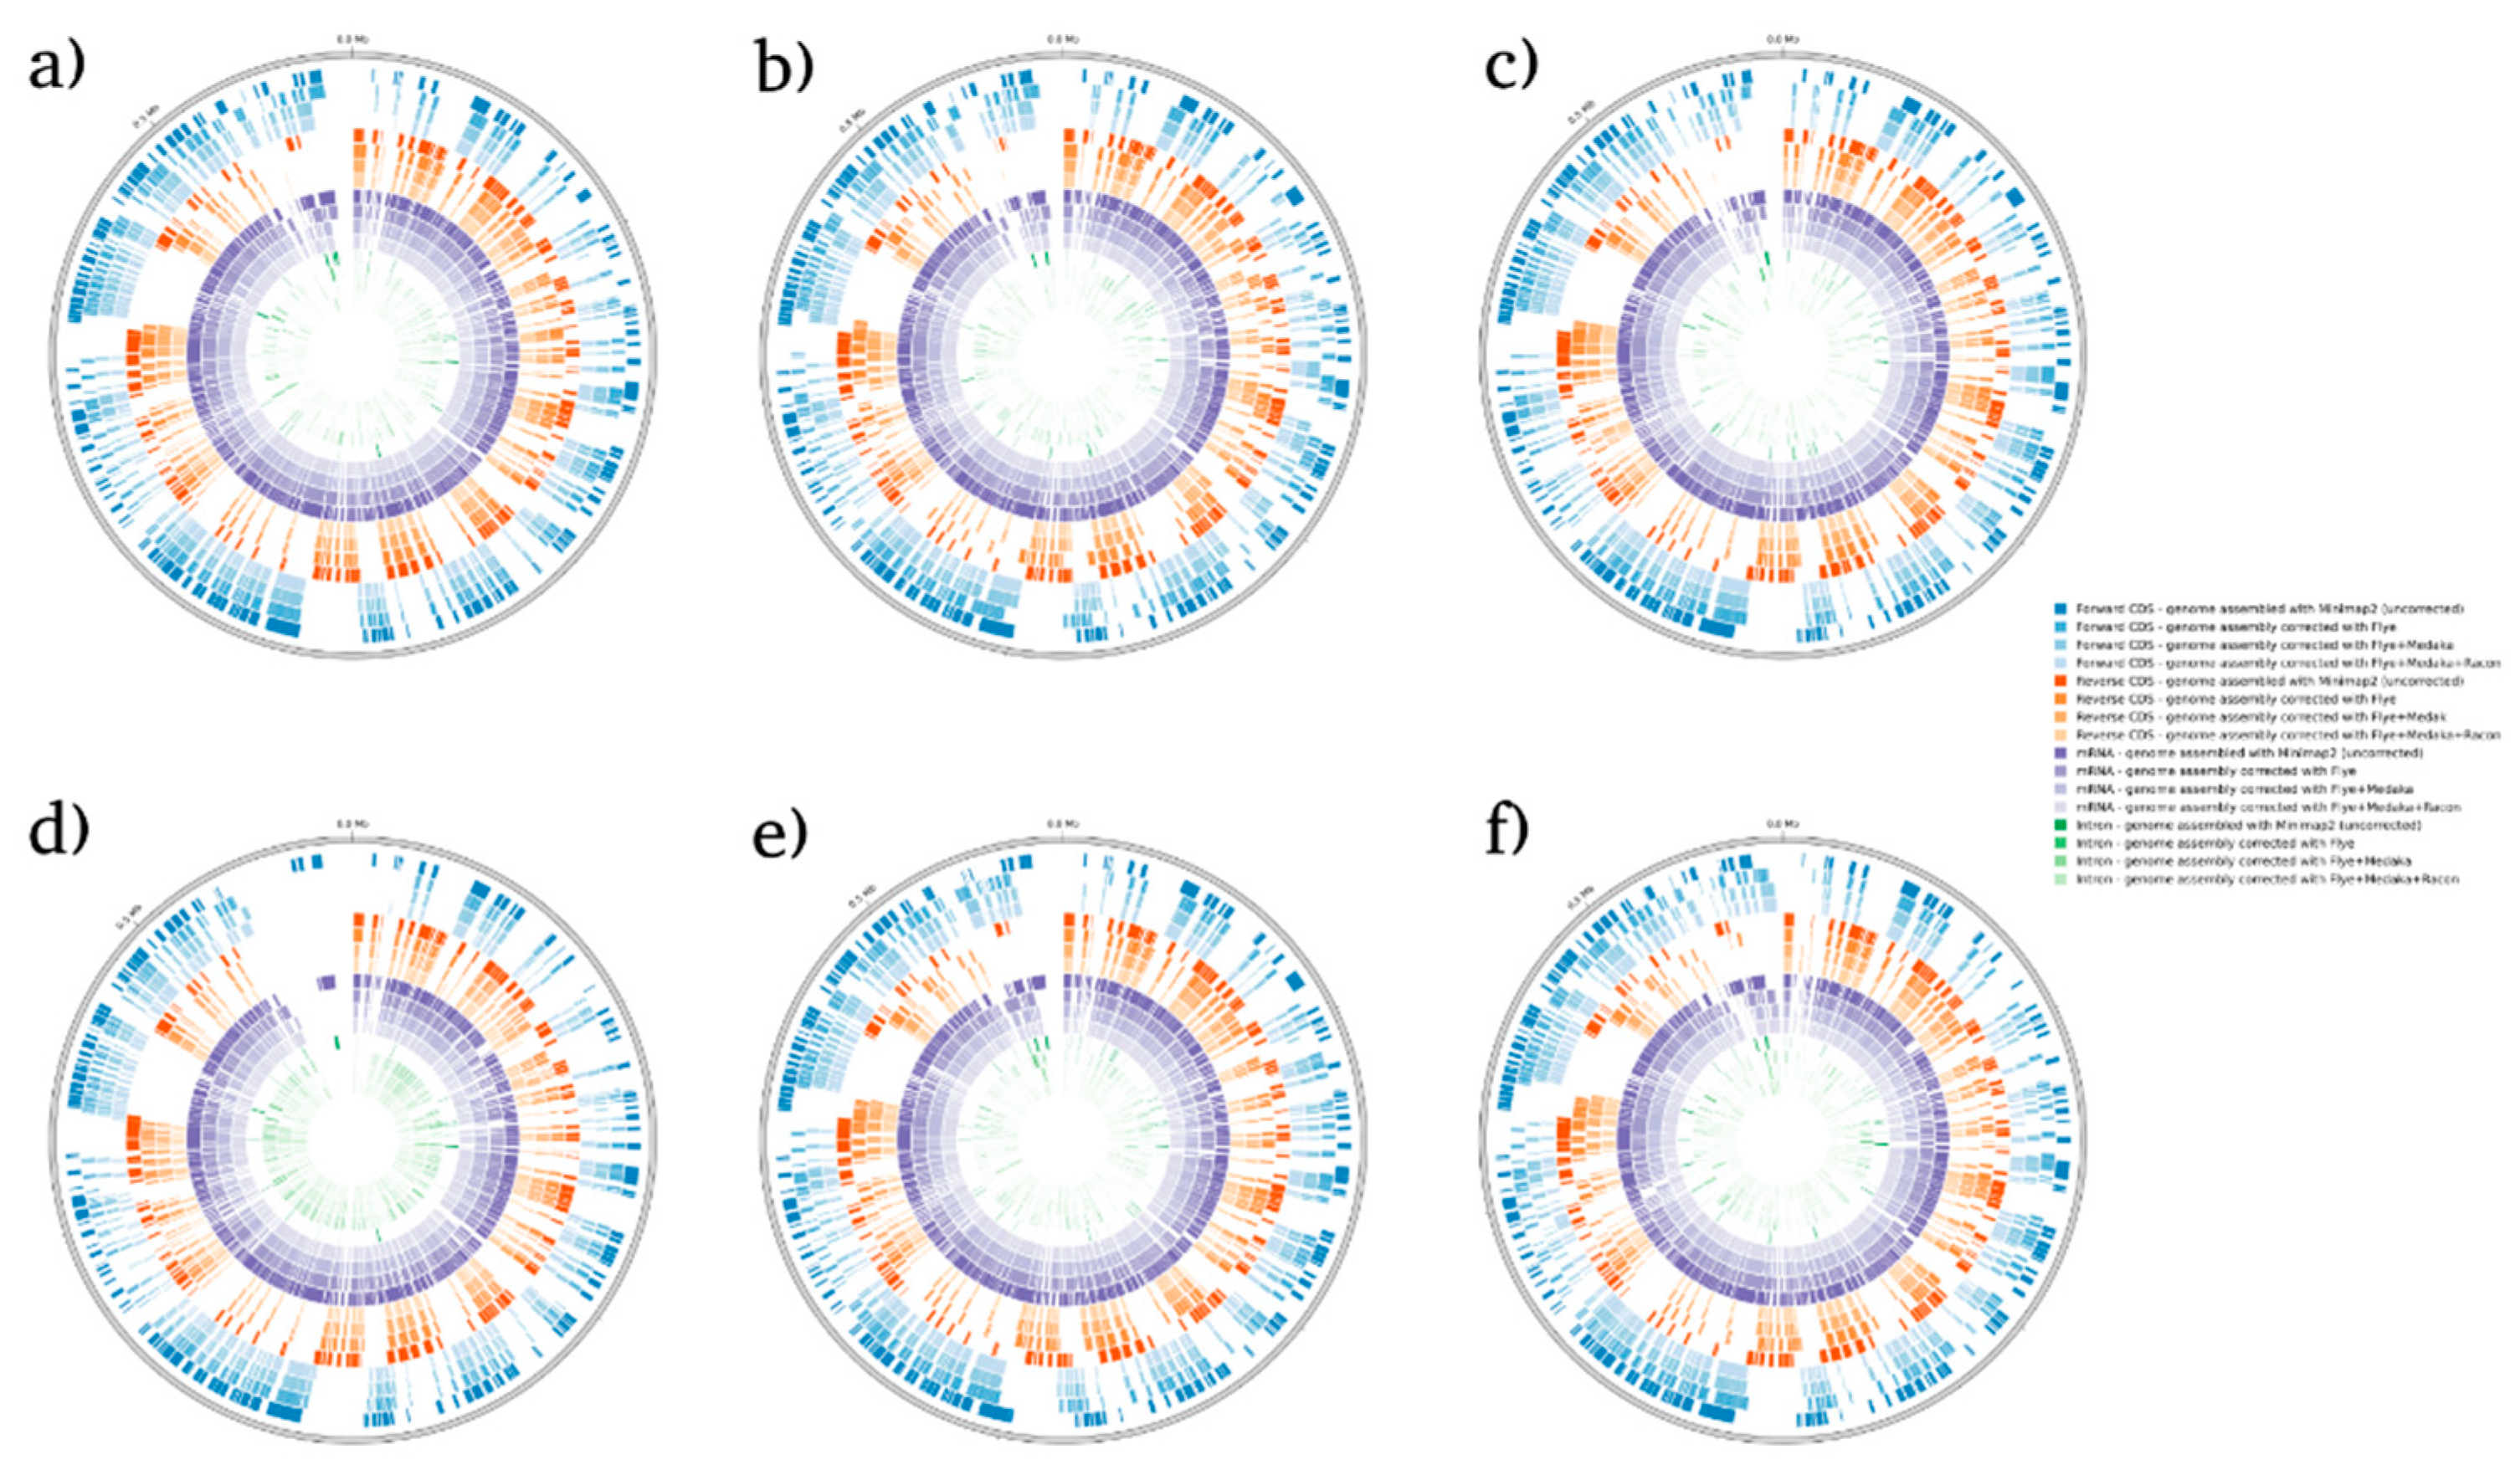
Figure 5.
BRAKER1 analysis detecting forwards CDs, reverse CDs, mRNA, and intron in P. falciparum species. (a) sample 1, (b) sample 2, (c) sample 3, (d) sample 4, (e) sample 5, and (f) sample 6.
Figure 5.
BRAKER1 analysis detecting forwards CDs, reverse CDs, mRNA, and intron in P. falciparum species. (a) sample 1, (b) sample 2, (c) sample 3, (d) sample 4, (e) sample 5, and (f) sample 6.
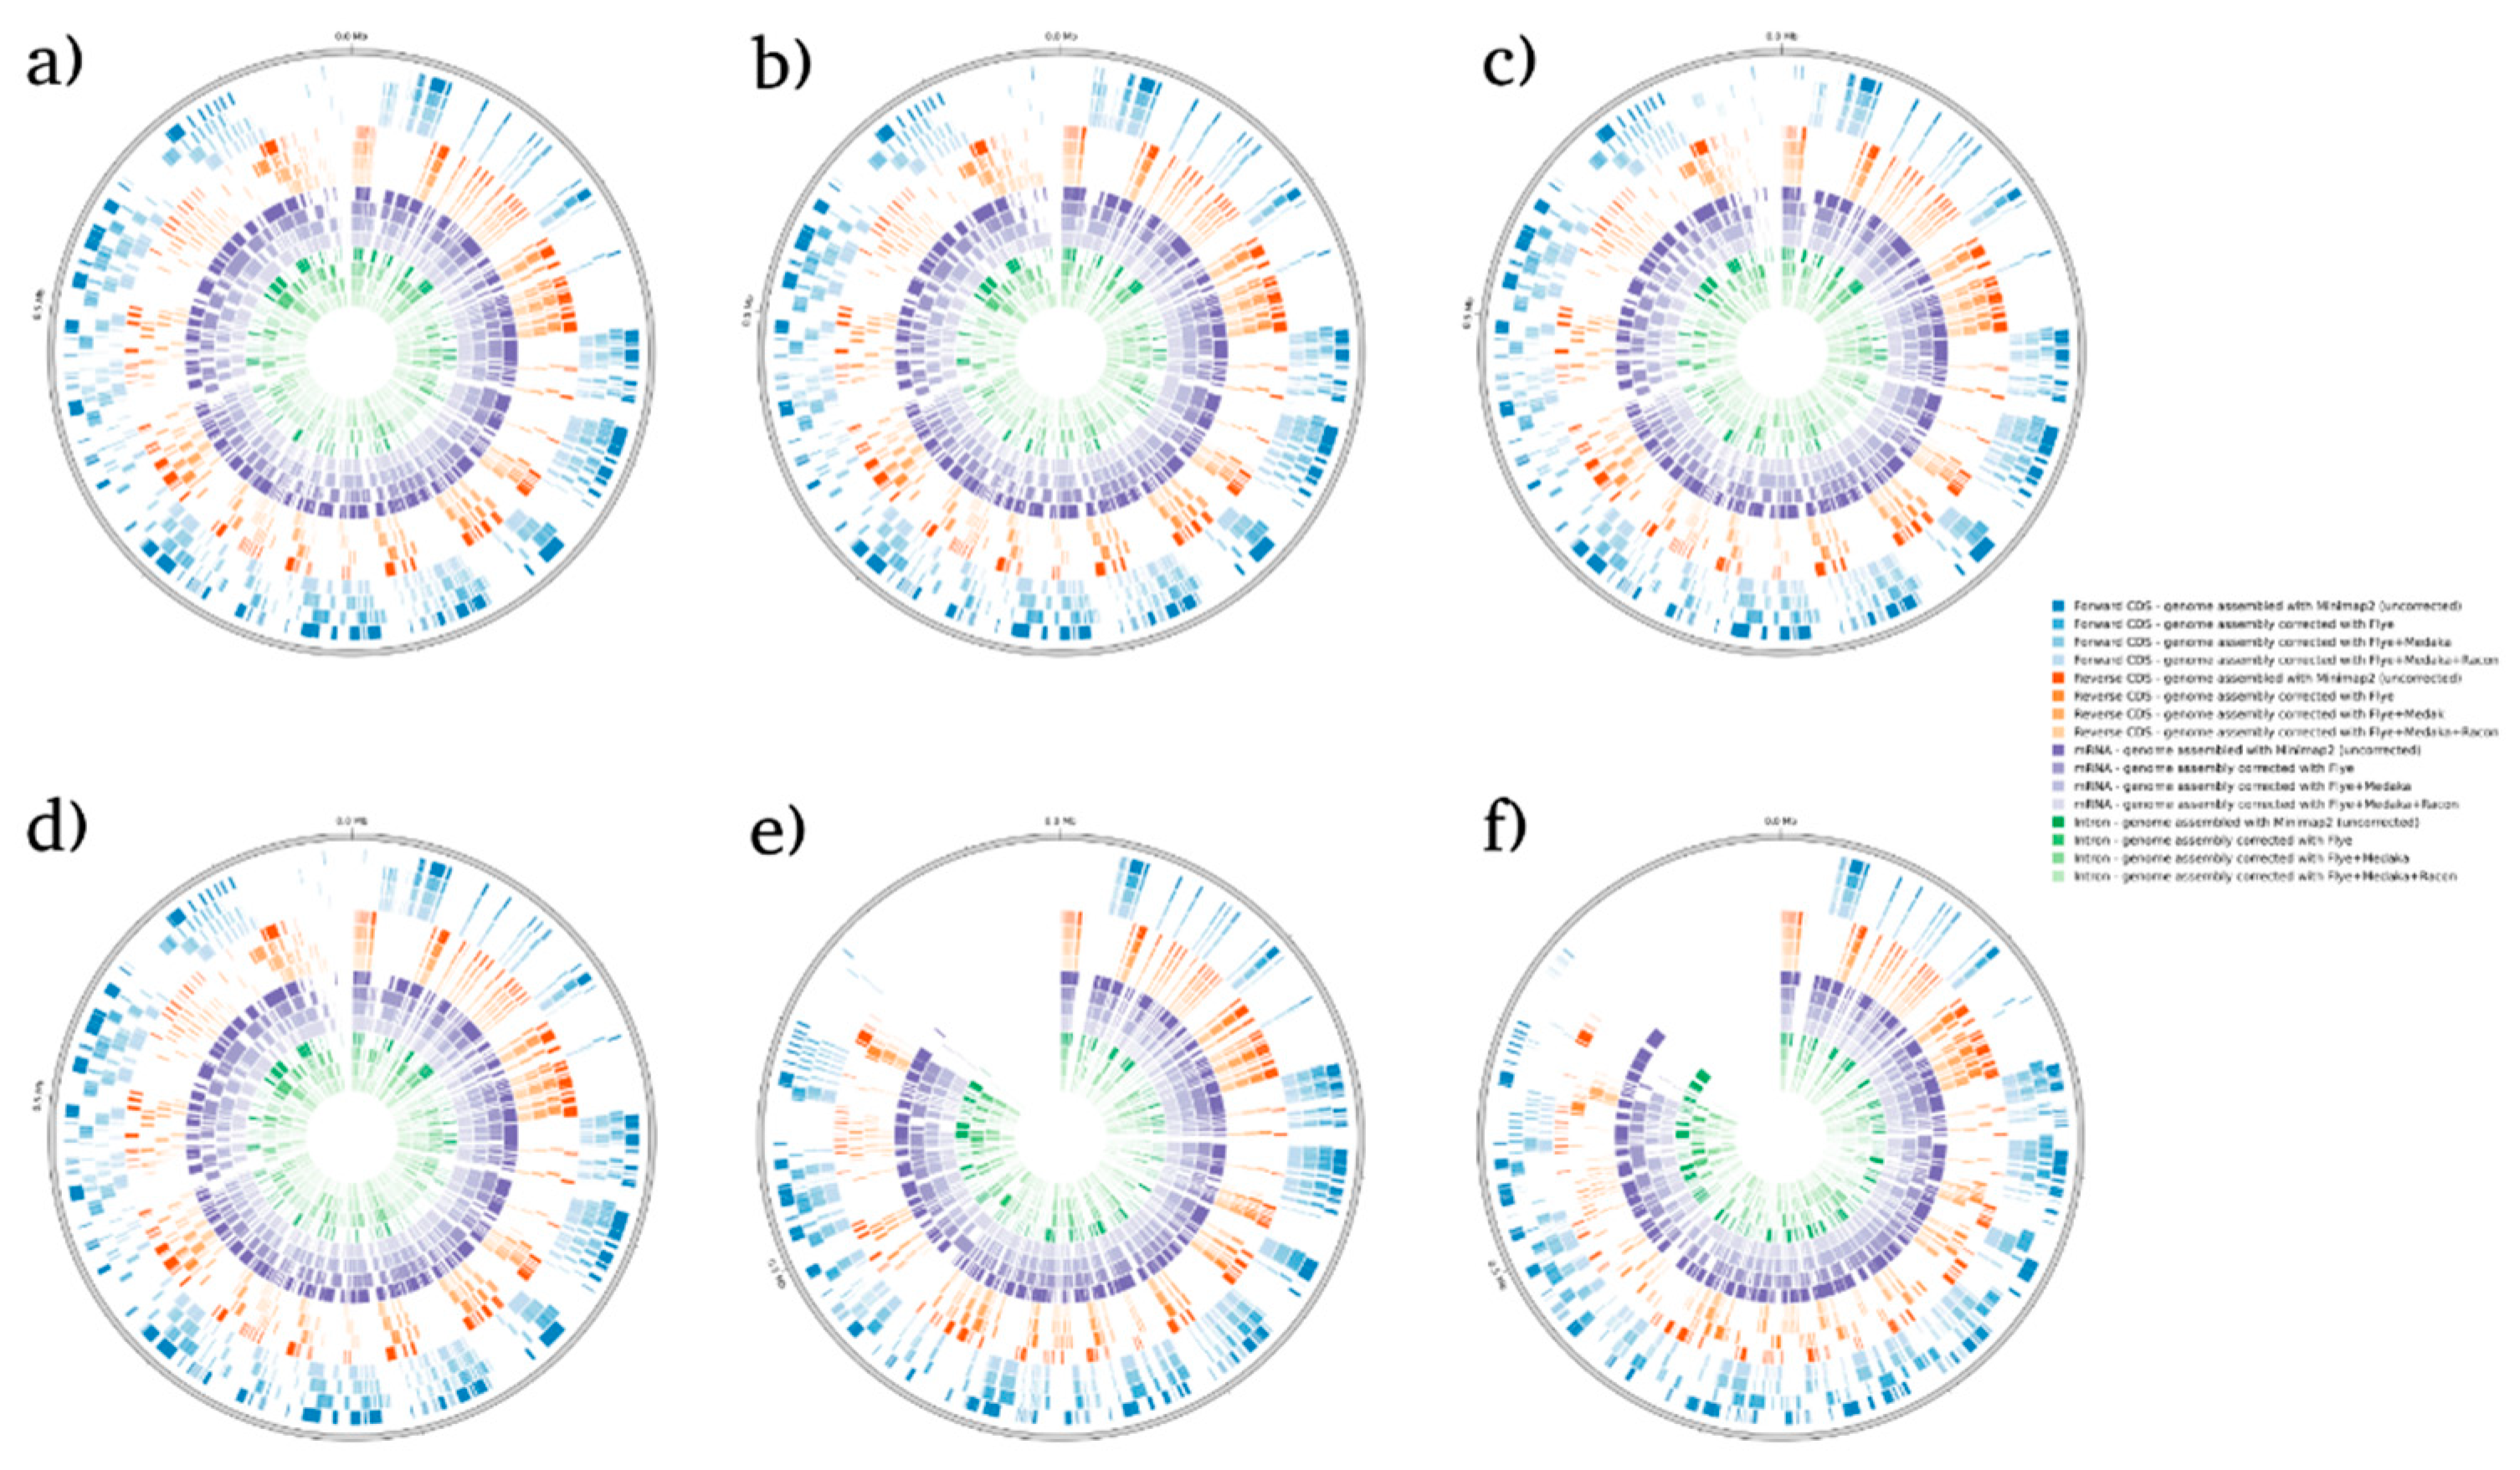
Figure 6.
Heatmap statistical analysis for BRAKER1 results. Benferroni’s multiple comparison one-way ANOVA was performed to determine significant differences (p<0.05, p<0.001) among minimap2 before and after read correction with flye, medaka and racon.
Figure 6.
Heatmap statistical analysis for BRAKER1 results. Benferroni’s multiple comparison one-way ANOVA was performed to determine significant differences (p<0.05, p<0.001) among minimap2 before and after read correction with flye, medaka and racon.
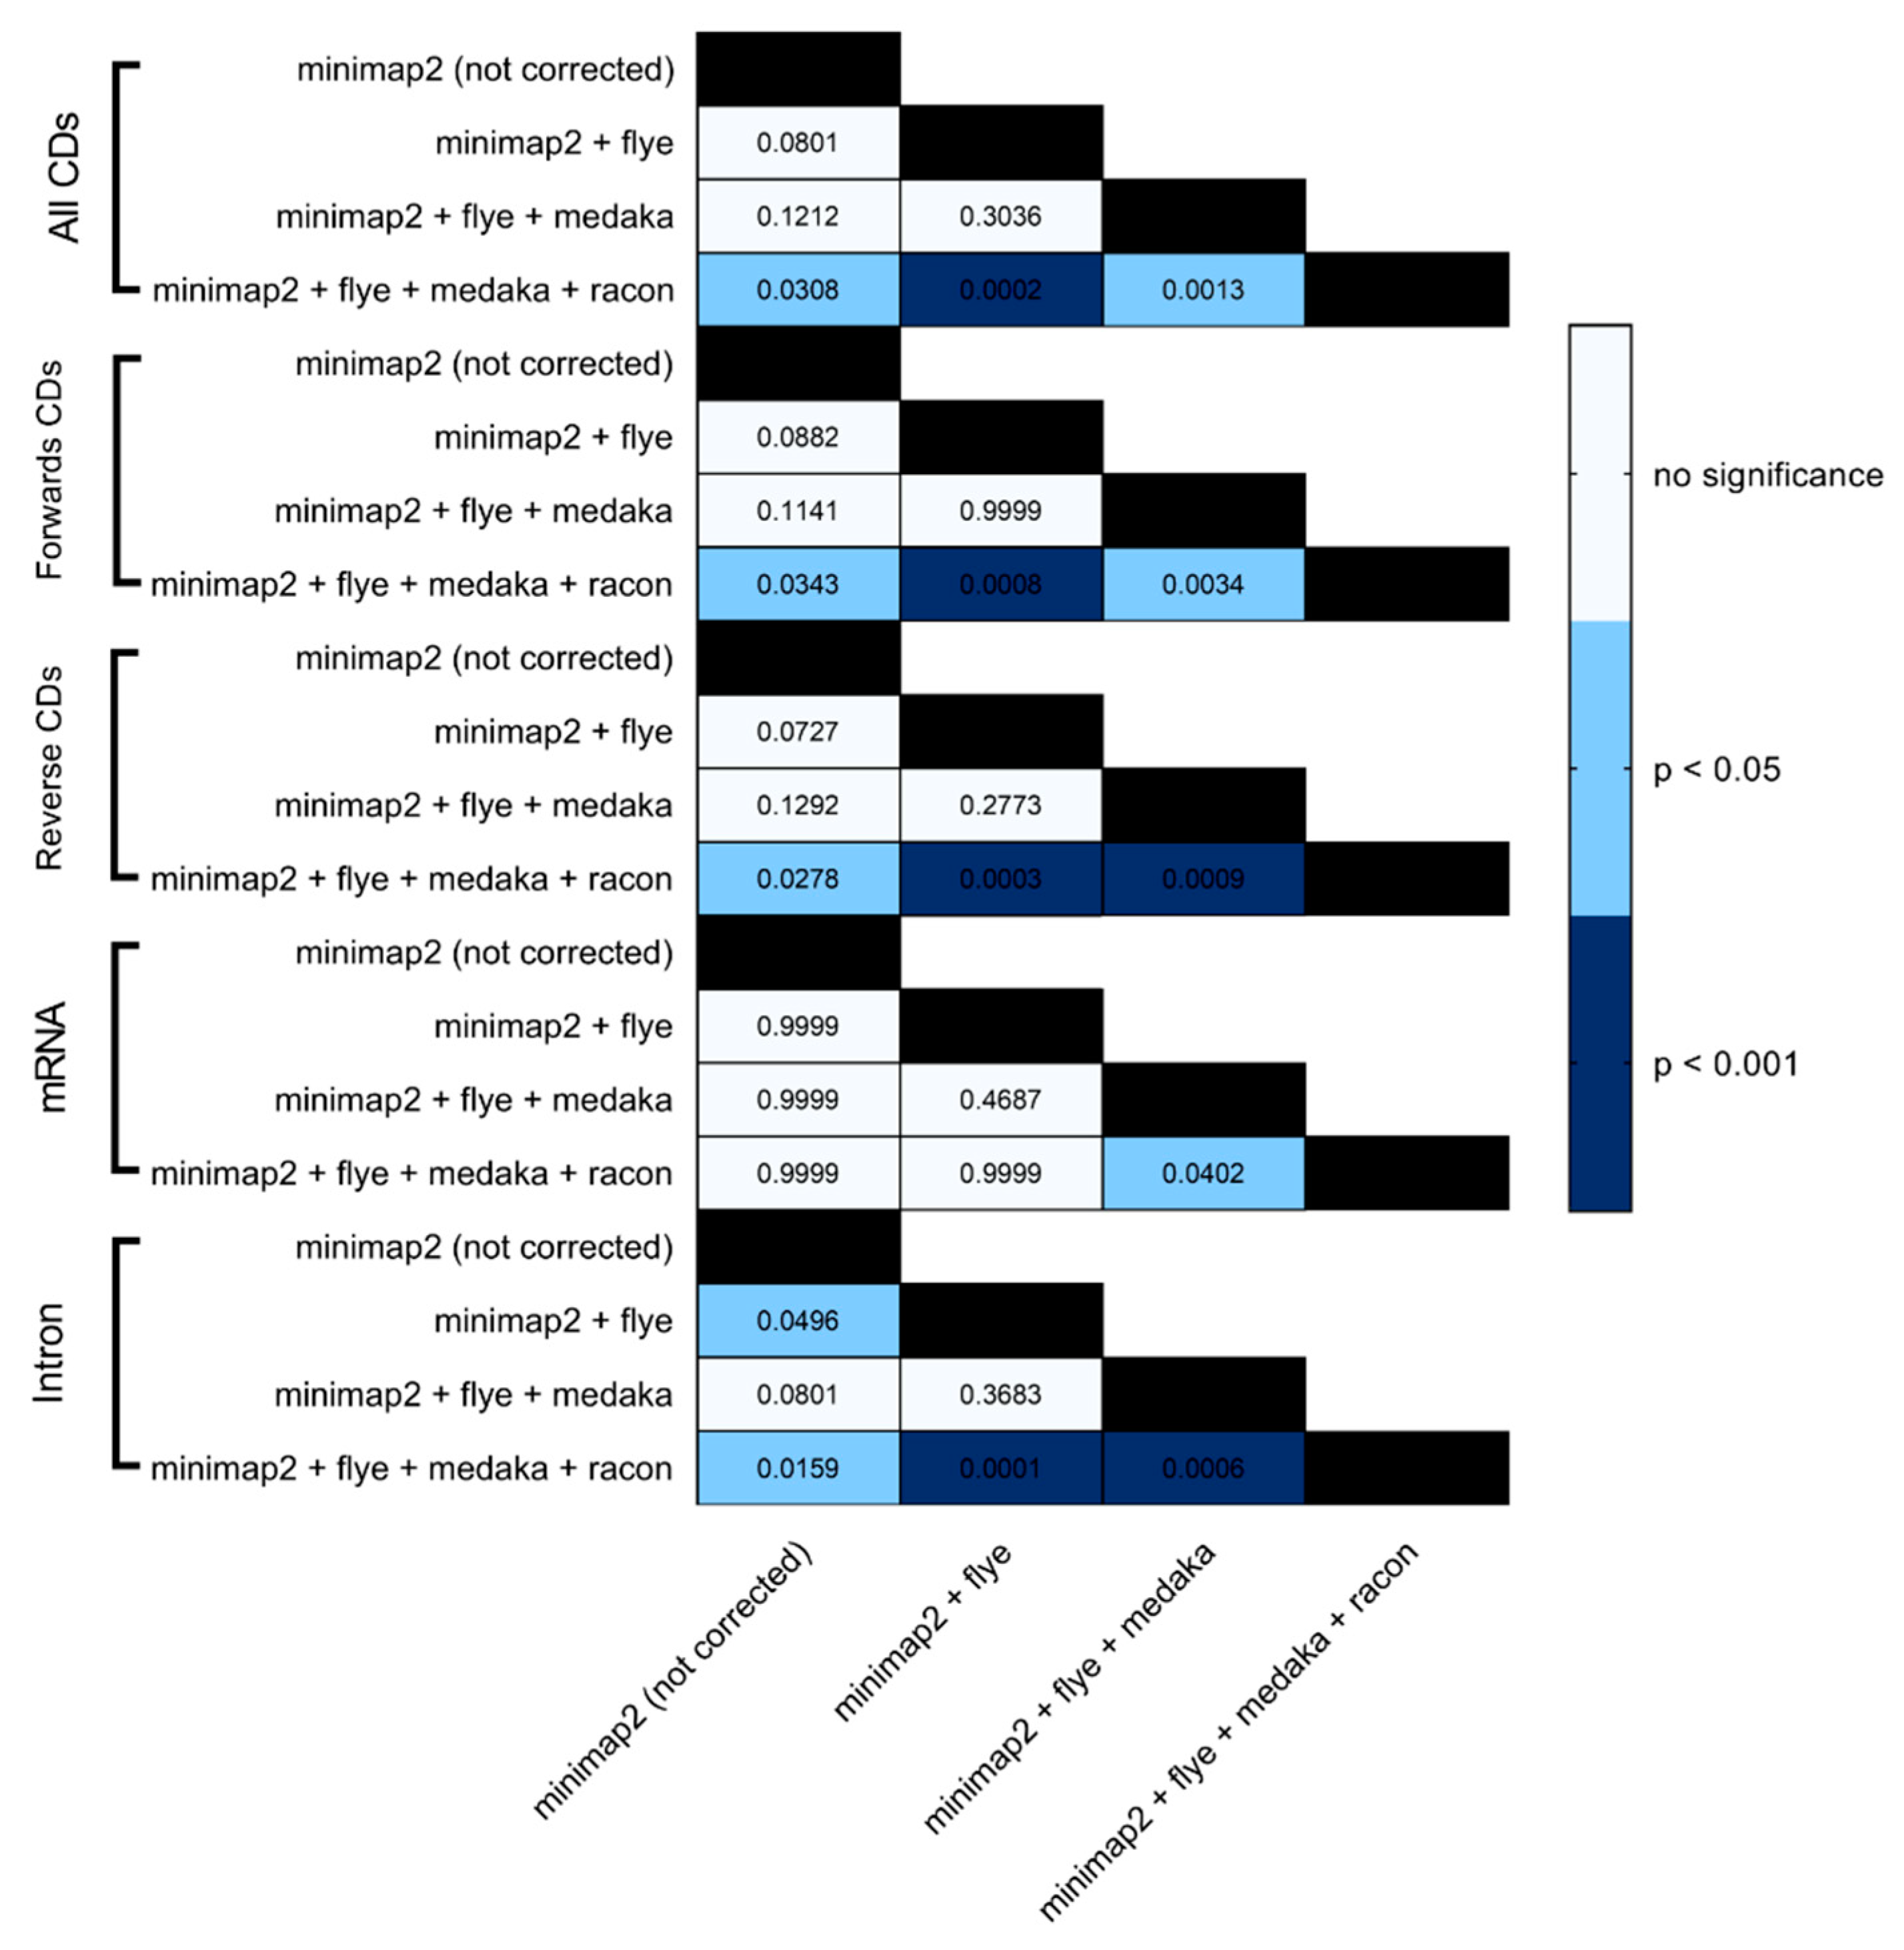
Figure 7.
InterProScan analysis using ProProfile analysis for protein annotation in C. albicans, C. gattii, S. cerevisiae, and P. falciparum, (a) number of hits detected, and (b) the significant differences among read correction methods.
Figure 7.
InterProScan analysis using ProProfile analysis for protein annotation in C. albicans, C. gattii, S. cerevisiae, and P. falciparum, (a) number of hits detected, and (b) the significant differences among read correction methods.
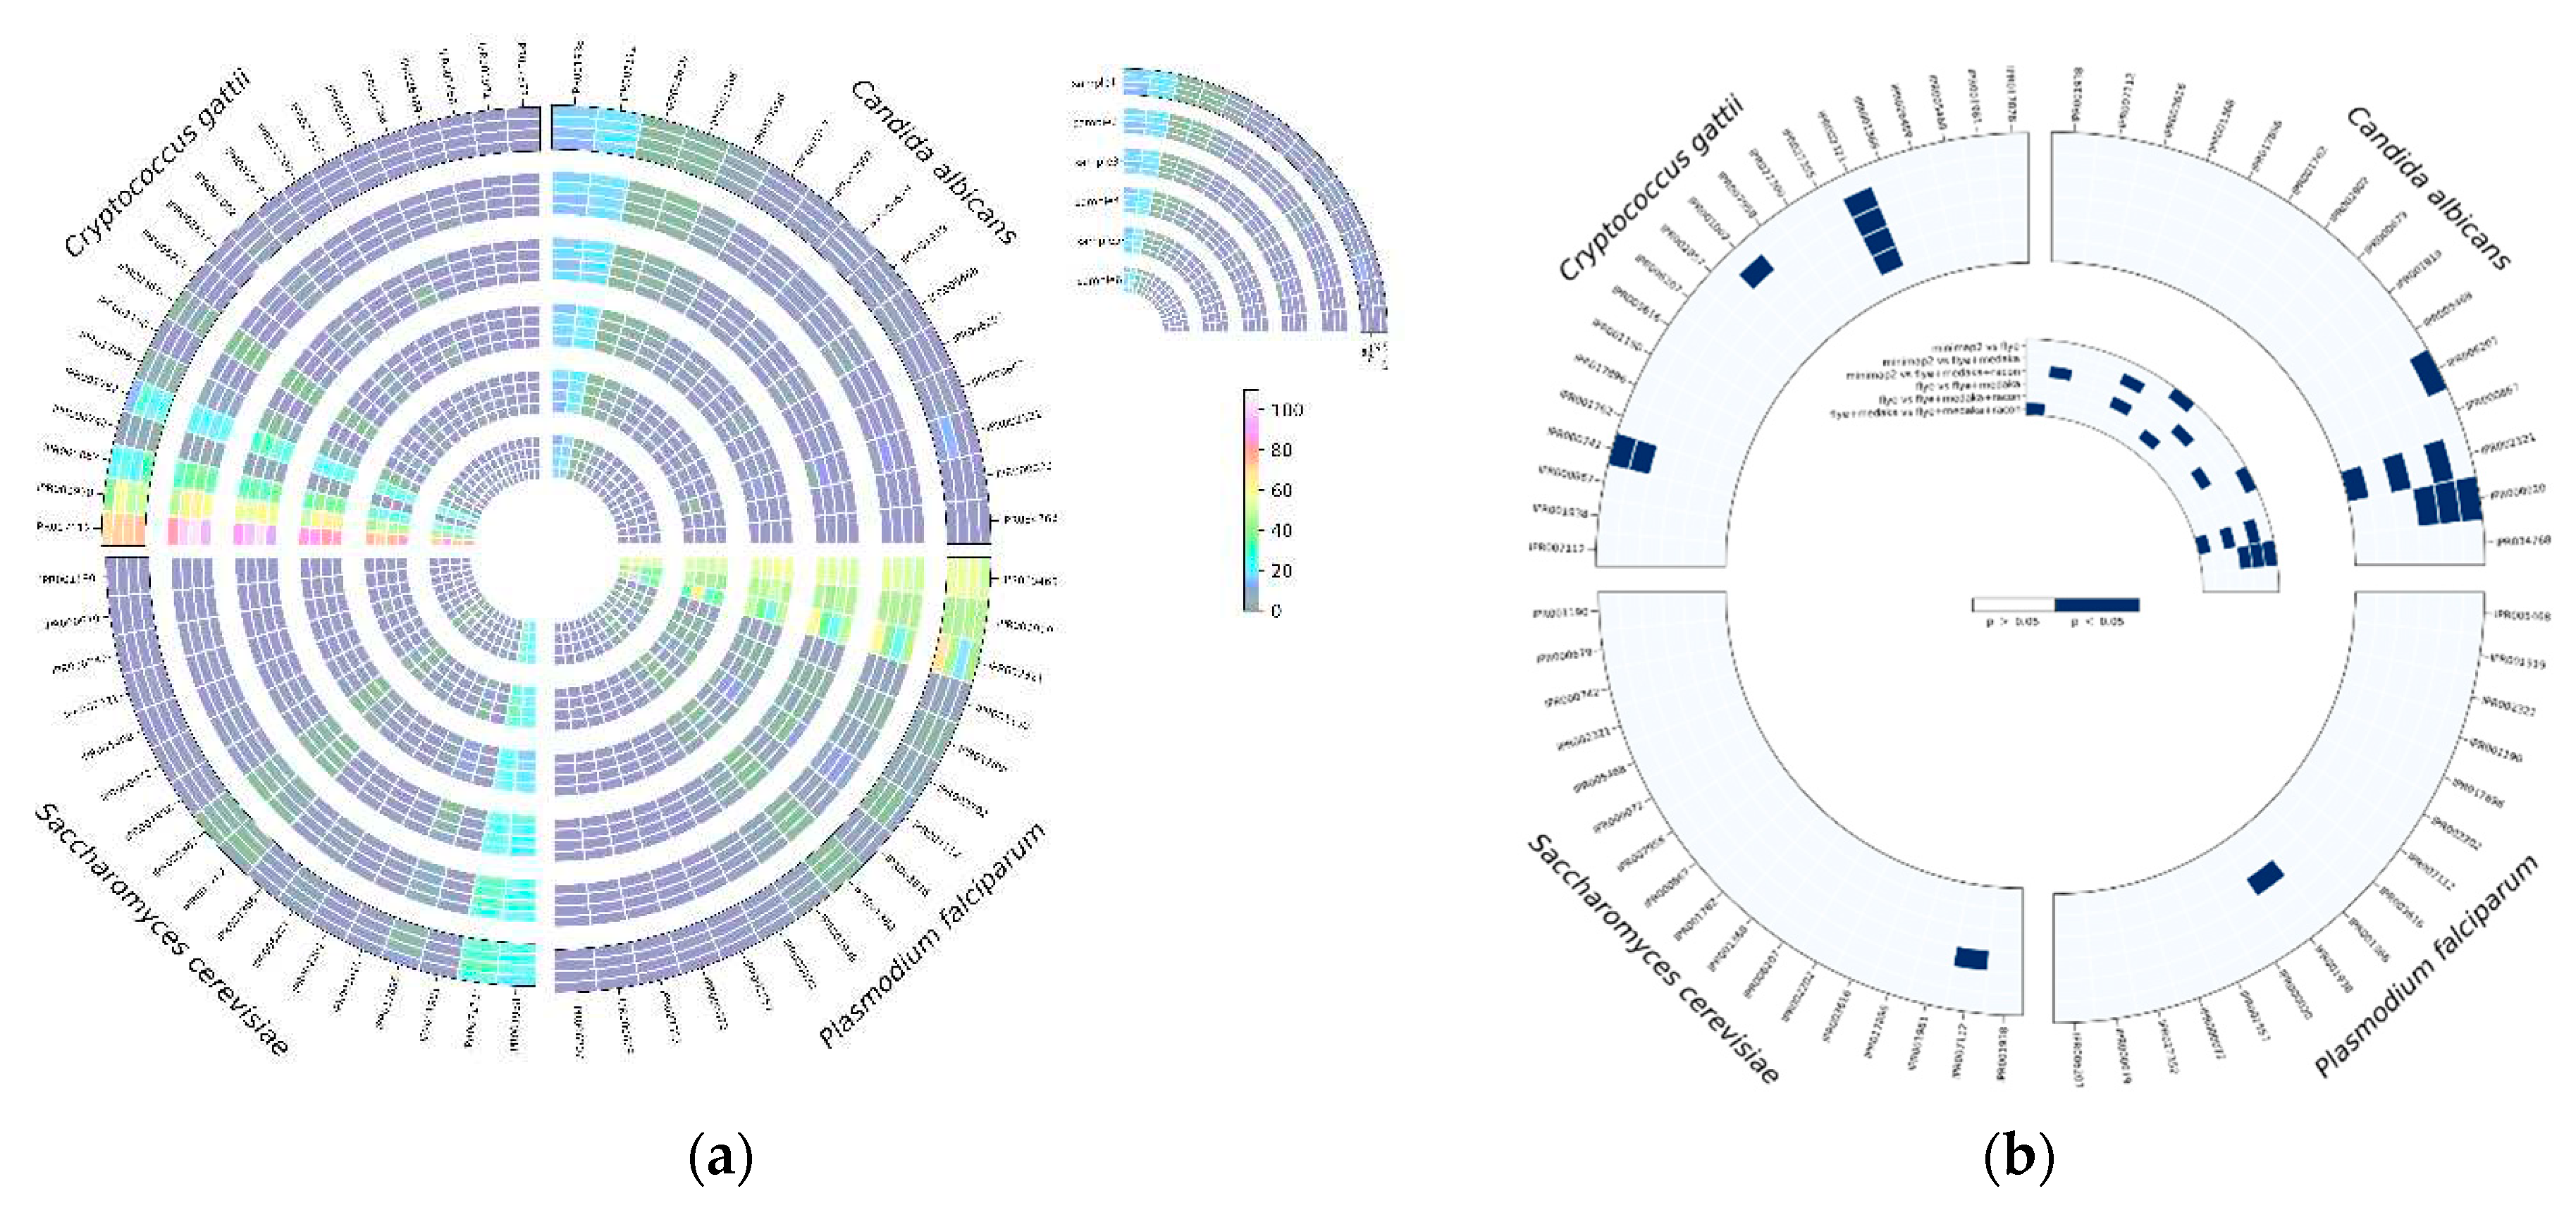

Table 1.
Total length (bp), total aligned (bp), and GC% of ONT sequencing reads aligned with Minimap2 before and after applying as read correction tools.
Table 1.
Total length (bp), total aligned (bp), and GC% of ONT sequencing reads aligned with Minimap2 before and after applying as read correction tools.
| Correction tool | Minimap2 (not corrected) | Flye | Flye + Medaka | Flye + Medaka + Racon | |||||||||
| Total length (bp) | Total aligned (bp) | GC% | Total length (bp) | Total aligned (bp) | GC% | Total length (bp) | Total aligned (bp) | GC% | Total length (bp) | Total aligned (bp) | GC% | ||
| C. albicans | Sample 1 | 14268731 | 14255757 | 33.45 | 14272767 | 14231426 | 33.49 | 14317735 | 14250916 | 33.43 | 14319429 | 14255001 | 33.43 |
| Sample 2 | 14251618 | 14238188 | 33.46 | 14298244 | 14246769 | 33.5 | 14341847 | 14262678 | 33.43 | 14356382 | 14250132 | 33.42 | |
| Sample 3 | 14275154 | 14217242 | 33.42 | 14240646 | 14111615 | 33.51 | 14320530 | 14166519 | 33.38 | 14312009 | 14138998 | 33.4 | |
| Sample 4 | 14280549 | 14226612 | 33.4 | 14263763 | 14211021 | 33.34 | 14345200 | 14272900 | 33.2 | 14318448 | 14241382 | 33.17 | |
| Sample 5 | 14268190 | 14182812 | 33.4 | 14218801 | 14102192 | 33.48 | 14287333 | 14155066 | 33.33 | 14304631 | 14158562 | 33.29 | |
| Sample 6 | 14267575 | 14183870 | 33.41 | 14206012 | 14097160 | 33.5 | 14265963 | 14144176 | 33.37 | 14275276 | 14126308 | 33.33 | |
| C. gattii | Sample 1 | 18374056 | 13963456 | 47.95 | 15618076 | 3018791 | 45.87 | 15848723 | 1127999 | 45.39 | 15649875 | 979468 | 45.62 |
| Sample 2 | 18373936 | 16738202 | 47.87 | 17275771 | 2829797 | 47.74 | 17401496 | 3193078 | 47.65 | 17335832 | 2478663 | 47.64 | |
| Sample 3 | 18373817 | 16748750 | 47.87 | 17249122 | 2811973 | 47.77 | 17403823 | 2993154 | 47.66 | 17331969 | 2314973 | 47.69 | |
| Sample 4 | 18373586 | 16911300 | 47.86 | 17292994 | 3406667 | 47.78 | 17435803 | 3916947 | 47.7 | 17395149 | 2892625 | 47.71 | |
| Sample 5 | 18371784 | 17309929 | 47.88 | 17667739 | 10488842 | 47.95 | 17746664 | 10916558 | 47.91 | 17719423 | 10110195 | 47.82 | |
| Sample 6 | 18374011 | 15590434 | 47.88 | 17093485 | 3649510 | 47.47 | 17283501 | 3129355 | 47.09 | 17341085 | 2347707 | 47.07 | |
| S. cerevisiae | Sample 1 | 11900917 | 11786751 | 38.26 | 11756094 | 11627598 | 38.37 | 11762061 | 11614289 | 38.27 | 11770518 | 11610040 | 38.24 |
| Sample 2 | 11927452 | 11786979 | 38.22 | 11817583 | 11391169 | 38.31 | 11835515 | 11392663 | 38.24 | 11841970 | 11389993 | 38.23 | |
| Sample 3 | 11867150 | 11717686 | 38.28 | 11714984 | 11611725 | 38.37 | 11728646 | 11591392 | 38.3 | 11734569 | 11542743 | 38.2 | |
| Sample 4 | 12048365 | 11746218 | 38.27 | 11701491 | 11557641 | 38.31 | 11744219 | 11530244 | 38.26 | 11726032 | 11472823 | 38.12 | |
| Sample 5 | 11848014 | 11728342 | 38.26 | 11844556 | 11579727 | 38.37 | 11847283 | 11568021 | 38.25 | 11841609 | 11544386 | 38.21 | |
| Sample 6 | 11898828 | 11680204 | 38.27 | 11650537 | 11518215 | 38.35 | 11683391 | 11519687 | 38.23 | 11676382 | 11483435 | 38.13 | |
| P. falciparum | Sample 1 | 23184099 | 23030452 | 19.3 | 22783133 | 22726603 | 19.63 | 23110345 | 23037187 | 19.36 | 23277887 | 23197642 | 19.16 |
| Sample 2 | 23244418 | 23191818 | 19.33 | 22846745 | 22827099 | 19.64 | 23103471 | 23077430 | 19.44 | 23251109 | 23206304 | 19.29 | |
| Sample 3 | 23278091 | 23119804 | 19.27 | 22794879 | 22740838 | 19.59 | 23071068 | 22992830 | 19.36 | 23170782 | 23115122 | 19.2 | |
| Sample 4 | 23266743 | 23186289 | 19.33 | 22843636 | 22817074 | 19.64 | 23082452 | 23052262 | 19.44 | 23222395 | 23183221 | 19.29 | |
| Sample 5 | 23167744 | 22187311 | 19.55 | 22597393 | 22360095 | 19.53 | 22902857 | 22526387 | 19.36 | 22879437 | 22148919 | 19.29 | |
| Sample 6 | 23193836 | 20645915 | 19.63 | 21278952 | 20848467 | 19.64 | 22021131 | 21099604 | 19.32 | 21995137 | 20265232 | 19.27 | |
Disclaimer/Publisher’s Note: The statements, opinions and data contained in all publications are solely those of the individual author(s) and contributor(s) and not of MDPI and/or the editor(s). MDPI and/or the editor(s) disclaim responsibility for any injury to people or property resulting from any ideas, methods, instructions or products referred to in the content. |
© 2023 by the authors. Licensee MDPI, Basel, Switzerland. This article is an open access article distributed under the terms and conditions of the Creative Commons Attribution (CC BY) license (http://creativecommons.org/licenses/by/4.0/).
Copyright: This open access article is published under a Creative Commons CC BY 4.0 license, which permit the free download, distribution, and reuse, provided that the author and preprint are cited in any reuse.


