Submitted:
01 December 2023
Posted:
04 December 2023
You are already at the latest version
Abstract
To investigate the variation patterns of spectral characteristics of main branches in fruit trees due to uneven distribution of growth, pruning, and fruit quality, as well as to determine the optimal fruit vi-bration harvesting, a vibration differential model of tree branches was constructed using the concen-trated mass method. A three-dimensional model of the fruit tree was built using finite element software. The spectral characteristics of each branch were obtained using the linear sweep frequency method. The method of changing the mass of each branch was employed to simulate the variation in branch mass. The frequency of occurrence, mean acceleration, and coefficient of variation of the inherent frequencies were used as evaluation indicators. The results revealed that when the vibration frequency of the fruit tree was at the peak frequency in the tree trunk spectrum, the frequency of occurrence and mean accel-eration were optimal. And the coefficient of variation of branch acceleration was less than 1, indicating a moderate dispersion. Additionally, reducing the branch mass resulted in an increase in the peak fre-quency of the tree trunk spectrum. Therefore, the growth, pruning, and uneven distribution of the branches in fruit trees can alter the spectral characteristics. When harvesting fruit by vibration, selecting the peak frequency in the trunk vibration spectrum as the excitation force frequency yields the best fruit detachment.
Keywords:
fruit tree model
; linear sweep frequency
; forest fruit harvesting
; branch spectrum
; fruit tree vibration simulation
1. Introduction
Forest fruits play a vital role in people's daily lives as they provide various nutritional substances. The entire process of forest fruit production involves activities such as fertilization, pruning, spraying, and harvesting[1,2,3,4,5]. Among these, harvesting is the final step in forest fruit production. Vibration harvesting technology, as the most commonly used technique in forest fruit harvesting, is primarily applied to vibration harvesting of industrially processed fruits and various types of nuts.
So far, vibration harvesting technology has been applied to the harvesting of fruits such as jujubes, citrus fruits, walnuts, pistachios, pecans, and coffee beans[6,7,8,9,10,11,12,13]. Various types of forest fruit vibration harvesting machines have been developed, categorized into crown vibration harvesters and trunk vibration harvesters based on the different vibration modes[6,7,14]. When a fruit tree is subjected to a vibration stimulus, both the branches and fruits will vibrate. The fruit undergoes pendulum motion relative to the branches, and when the fruit experiences an inertial force due to the magnitude of acceleration and its own mass, the fruit stem will break when the inertial force exceeds the adhesion force of the stem, resulting in fruit detachment and successful harvest[13,15,16,17,18].
The magnitude of the inertial force of the fruit is typically related to the structure of the fruit tree and the parameters of the excitation force[19,20]. Among them, the exciter serves as the core device of the forest fruit vibration harvester generates an excitation force that induces forced vibrations in the tree when clamped to the fruit tree, frequency, amplitude, and spatial structure of the excitation force affect the acceleration of branch vibration. And the selection of excitation force frequency depends on the spectral characteristics of the fruit tree vibration[6,7,19,21,22].
Due to the differences in the size of fruit tree crowns and the spatial distribution of branches, there are significant variations in the vibration spectral characteristics of different crown types[8,23]. Additionally, the spatial distribution of branches varies among individual fruit trees, resulting in inconsistent vibration spectral characteristics for each branch. Furthermore, the growth of fruit trees and the number and positions of fruit-bearing branches differ from tree to tree. Moreover, to ensure more balanced light exposure for each branch and to prevent excessive crown size, pruning of the crown is carried out annually, resulting in differences in the spatial shape of pruned and unpruned crowns. All these factors contribute to changes in the spectral characteristics of fruit trees.
In order to investigate the changes in spectral characteristics and vibration frequency selection methods of fruit trees during pruning, growth, and fruit development, a vibration model of tree branches was constructed. By simulating the variation in branch mass through changing the mass at the end of fruit trees, sinusoidal sweeping was performed to obtain the vibration spectral characteristics of each branch. By studying the spectra of the trunk and branches, the frequency at which the natural frequency exceeds the acceleration threshold for fruit detachment, the mean acceleration, and the coefficient of variation were used as evaluation indices. It was found that regardless of the structural changes in fruit trees, the maximum peak frequency in the trunk spectrum can represent the overall vibration performance of the fruit tree. The natural frequency count and mean acceleration of the maximum peak frequency are both maximized, and the acceleration coefficient of variation is less than 1, indicating a moderate degree of variability. Therefore, detecting the frequency of the trunk can provide the inherent frequency of the fruit tree, and using the maximum peak frequency of the trunk as the excitation frequency can improve the vibration harvesting performance of orchard fruits.
2. Materials and Methods
During the vibration harvesting process of a fruit tree, there is significant variation in the vibration of different branches within the same tree. To study the differences in vibration between branches and select appropriate excitation frequencies, a modeling approach for branch vibrations was employed. For instance, consider a walnut tree shown in Figure 1-a. To simplify the modeling process, branches of the third level and higher with small mass and scale were neglected, disregarding their geometric shape and concentrating their mass at the end of second-level branches. Thus, the fruit tree was simplified to an ideal model with only second-level branches, as depicted in Figure 1-b. Each branch level was treated as a beam structure, decomposing the fruit tree into several beam structures, and each branch level was equivalent to a variable cross-section rod, as shown in Figure 1-c.
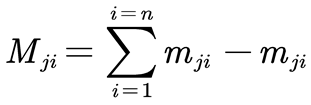
According to the energy transfer principles[24], the branches were projected along the x-direction of the fruit tree trunk to obtain an ideal equivalent model of the branches, as shown in Figure 1-d. In the model, meji represents the mass of branches and fruits connected to the branch excluding the second-level branch ji; Mji represents the concentrated mass of second-level branches connected to the branch i, excluding the second-level branch ji as shown in Equation (1). Mj represents the mass of all other branches connected to the first-level branch i excluding the branch i itself, as shown in Equation

For ease of analysis, branch ji was simplified as a typical "Euler-Bernoulli beam". The contact between the fruit tree and the ground was simplified as fixed geometric constraints. The potential energy T of the system, representing the deformation energy of the tree trunk structure, is expressed as Equation (3).
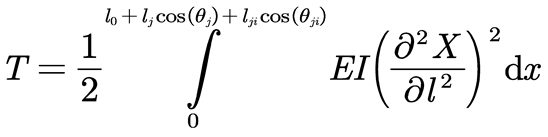
In the equation: E represents the elastic modulus of the fruit tree, and I represents the moment of inertia of the trunk section. The sum of the kinetic energy of the trunk and the canopy is the system's kinetic energy V, expressed as Equation (4).

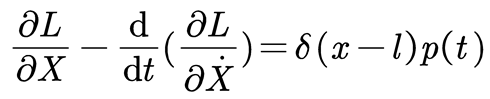
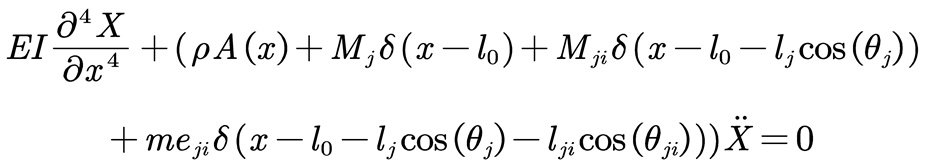
In the equation: ρ represents the density of the beam, A(l) is the cross-sectional area of the trunk, and δ(x-L) is the distribution function of the concentrated mass of the canopy. By performing partial integration on Equation (4), combining it with Equation (3), and setting L = V - T, according to the Lagrange equation (5), the differential vibration model of the branch is obtained as shown in Equation (6).
This section may be divided by subheadings. It should provide a concise and precise description of the experimental results, their interpretation, as well as the experimental conclusions that can be drawn.
The simplified model of the branch is a cantilever beam structure, which needs to satisfy the boundary conditions given by Equation (7). By using the modal superposition method, the analytical solution for the vibration differential equation of the fruit tree can be obtained as shown in Equation (8).
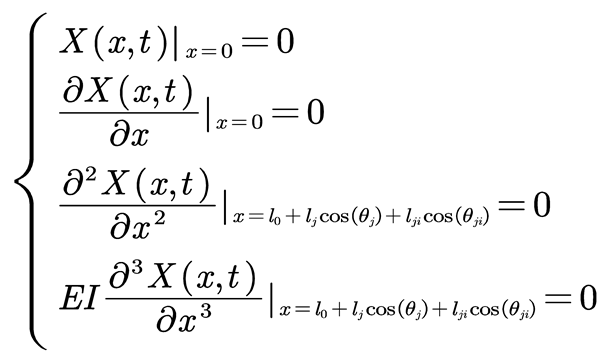
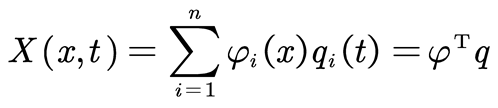
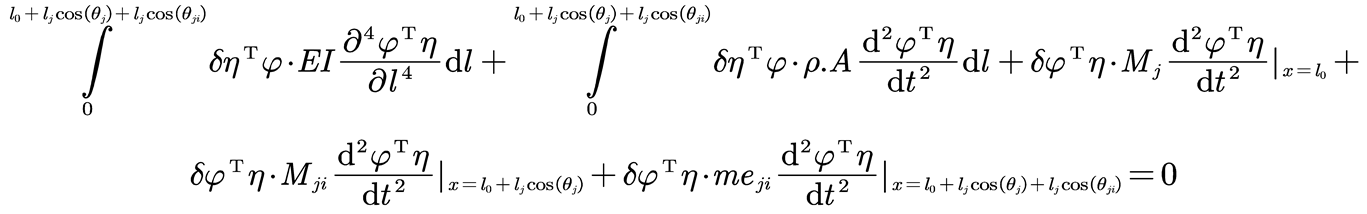
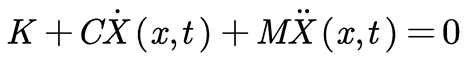
In the equation: φ=[φ1 φ2 … φn]T represents the mode functions, η=[η1 η2 … ηn]T represents the generalized coordinates. According to the Galerkin method, based on Equation (9), the branch differential model is discretized, and the discretized branch vibration equation is obtained as shown in Equation (10).
In Equation (10), the modal mass Mlp is expressed by Equation (11), the modal damping Clp is expressed by Equation (12), and the modal stiffness Klp is expressed by Equation (13).


Through the construction of a differential model for the branches of fruit trees, it was discovered that there are variations in the vibration model parameters for each branch of the fruit tree. The modal mass Mlp, modal damping Clp, and modal stiffness Klp of each branch are influenced by the respective lengths lj,lji, and the masses Mj,Mji,meji of each level of the branch. To further analyze the interplay of vibration characteristics among the different branches, a three-dimensional model of the fruit tree was constructed, and finite element software was used to simulate the vibration process of the fruit tree branches.
Using three-dimensional software, the fruit tree was modeled by simplifying branches outside the secondary branches into concentrated masses. The simplified three-dimensional model is illustrated in Figure 2-a. Based on the material characteristics of wood, the material properties of the fruit tree were defined as shown in Table 1 [25,26,27]. To facilitate the analysis of the vibration characteristics of each branch of the fruit tree, it was assumed that the wood had no damping. Mesh partitioning was performed, with the minimum length of the mesh elements set to 5mm and the maximum mesh length to 90mm to improve computational accuracy. Since the displacement of the fruit tree relative to the ground is minimal, for ease of analysis, the fruit tree and the ground were considered as fixed constraints, as depicted in Figure 2-b. A sinusoidal sweep excitation force of 3000N was applied to the fruit tree, sweeping across a frequency range of 0-40 Hz. This was done to obtain the frequency spectrum characteristics of each branch.
In order to investigate the differences in the vibration processes of various branches, the equivalent masses at the tips of each branch were considered consistent. The branches were divided into two groups based on secondary branches, with branches A1, A2, A3, A4 located on the same primary branch, and an equivalent concentrated mass (me) sphere radius R1 = 200 mm. Branches A5, A6, A7 were located on another primary branch with an equivalent concentrated mass (me) sphere radius R2 = 200 mm, as shown in Figure 2-c, forming the first group for simulation experiments. For the second group of simulation experiments, branches A1, A2, A3, A4 had concentrated mass sphere radii set to R1 = 100 mm, while branches A5, A6, A7 retained an equivalent concentrated mass (me) sphere radius of R2= 200 mm, as depicted in Figure 2-d. The mass (Mj) of branches A1, A2, A3, A4 remained unchanged, but the concentrated mass (me) and the equivalent concentrated mass (Mji) of the secondary branches decreased. The concentrated mass (Mj) of branches A5, A6, A7 was reduced as well. The equivalent sphere mass radii for both groups of branches were set to R1 = R2 = 100 mm, resulting in a reduction in the concentrated mass (Mj), equivalent concentrated mass (Mji) of secondary branches, and the mass at the tips of the branches (me) for all branches.
| Table 2 Material parameters of fruit trees and exciter | ||||
| Elasticity modulus (GPa) | Density (Kg/m) | Poisson ratio | ||
| Fruit tree | 8.5 | 1.451 | 0.316 | |
3. Results
By conducting linear frequency sweeps on this three-dimensional model, the frequency spectrum characteristics of various branches and the trunk were obtained, as shown in Figures 3, 4, and 5. When all branch-tip mass radii were set to 200 mm, the frequency spectrum characteristics of the various branches are depicted in Figure 3.
The energy distribution on different points of the branches is not uniform. Significant variations in amplitude are observed at different natural frequencies. The amplitudes of natural frequencies between 8-15 Hz are relatively high for all branches. In the 0-5 Hz range, the peak amplitudes of natural frequencies for all branches are relatively low. Between 5-8 Hz, the amplitudes of natural frequencies for all branches are very small, almost approaching zero.
From Figure 3-c to 3-i, it can be observed that there are significant differences in the amplitudes of natural frequencies among the various branches. For instance, branch A4 exhibits a maximum acceleration amplitude of 1426.28 ms-2, while branch A7 only has a maximum acceleration amplitude of 129.38 ms-2.
Authors should discuss the results and how they can be interpreted from the perspective of previous studies and of the working hypotheses. The findings and their implications should be discussed in the broadest context possible. Future research directions may also be highlighted.
When the branch-tip mass radii for branches A1,A2,A3 and A4 are all R1=100 mm, and branches A5, A6, and A7 have concentrated mass radii at the tip with R2=200 mm, the frequency spectrum characteristics of the various branches are presented in Figure 4.
For branches A1, A2, A5, A6, and A7, there are significant acceleration amplitudes at their respective natural frequencies within the 11-16 Hz range. On the other hand, branches A3 and A4 exhibit relatively large acceleration amplitudes at their respective natural frequencies within the 5-9 Hz range. The variations in acceleration amplitudes corresponding to different natural frequencies are distinct, and there are no prominent features in the amplitude-frequency characteristics among different branches.
When all branch-tip mass radii are 100 mm, the frequency spectrum characteristics of various branches are shown in Figure 5. Branches A1, A2, A3, A4, and A7 exhibit significant vibration responses at their natural frequencies, which correspond to frequencies in the range of 14 to 19 Hz. Branch A5 shows strong vibrations in the 5-8 Hz and 14-19 Hz ranges, while branch A6 exhibits significant amplitude in the natural frequencies within the 5-11 Hz and 14-19 Hz ranges. The vibration responses of these branches are prominent in these frequency bands.
Through the analysis of Figures 3, 4, and 5, it is evident that there are significant differences in the spectral characteristics of all branches. Altering the mass of fruit tree branches results in changes in the spectral characteristics of all branches. In the vibration model of fruit tree branches constructed in this study, changing the concentrated mass at the branch tips (me) and the concentrated masses of primary branches (Mj) and secondary branches (Mji) will also cause changes. This, in turn, affects the modal mass and modal stiffness in the vibration differential model of the branches, ultimately leading to changes in the modal frequencies of the branches. Consequently, the branch vibration model is consistent with experimental results, indicating that the model constructed in this study can reflect the vibration characteristics of various branches. Furthermore, in the absence of internal damping in the fruit tree material, each branch and the trunk share the same natural frequency. Therefore, by monitoring the vibration characteristics at any point on the trunk, it is possible to obtain the natural frequencies of the entire tree.
Additionally, the annual growth, pruning, and fruit distribution of fruit trees lead to changes in the mass of various branches, resulting in alterations in the natural frequencies of the fruit tree each year. Therefore, during each vibration harvesting operation in orchards, it is essential to adjust the operating frequency and excitation force amplitude of the vibrator to enhance the vibration harvesting performance of the fruit trees.
4. Discussion
In order to select the optimal natural frequencies for fruit trees, the frequency at which the acceleration exceeds 120 ms-2 in different branches of the tree is chosen as the first evaluation criterion [4,13,16,17,28]. Typically, the acceleration of fruit detachment falls within the range of 0 to 120 ms-2. The greater the frequency count (n) of natural frequencies, the more branches resonate at that particular frequency due to excitation forces. This results in a shorter duration for fruit vibration harvesting. The mean vibration acceleration of different branches at their respective natural frequencies serves as the second evaluation criterion. The mean acceleration of tree branches reflects the overall vibration intensity of the fruit tree. The larger the mean acceleration at each natural frequency, the easier it is for fruits to detach from the branches at that frequency, and the higher the rate of fruit removal. The coefficient of variation in acceleration at natural frequencies across different branches is used as the third evaluation criterion. The coefficient of variation in acceleration at the natural frequencies of tree branches reflects the degree of dispersion or variation in branch vibration acceleration at those specific frequencies. Exactly, when the coefficient of variation in branch acceleration at different natural frequencies is smaller, it indicates that the distribution of vibration energy among the branches is more uniform at those frequencies.
When all branch tip mass radii are 200 mm, the acceleration amplitude evaluation metrics corresponding to various natural frequencies are depicted in Figure 6. Among these frequencies, the 16th natural frequency exhibits the highest frequency of occurrence across different branches, with a frequency count of n=7. The 16th frequency also boasts the maximum mean amplitude at 486.32ms-2. Conversely, the 17th natural frequency demonstrates the smallest coefficient of variation. Through comprehensive analysis, it is concluded that the 16th natural frequency, with a value of 10.32 Hz, serves as the most suitable excitation frequency.
When the mass radii at the tip of branches A1, A2, A3, and A4 are all R1=100mm, and branches A5, A6, A7 have concentrated mass radii at the tip with R2=200mm, the acceleration amplitude evaluation metrics corresponding to various natural frequencies are depicted in Figure 7. Among these frequencies, the 15th and 16th natural frequencies exhibit the highest frequency of occurrence across different branches, with a frequency count of n=7. The 15th frequency also boasts the maximum mean amplitude at 563.75 ms-2. Conversely, the 16th natural frequency demonstrates the smallest coefficient of variation. Through comprehensive analysis, it is concluded that the 15th natural frequency, with a corresponding value of 11.92 Hz, serves as the most suitable excitation frequency for harvesting.
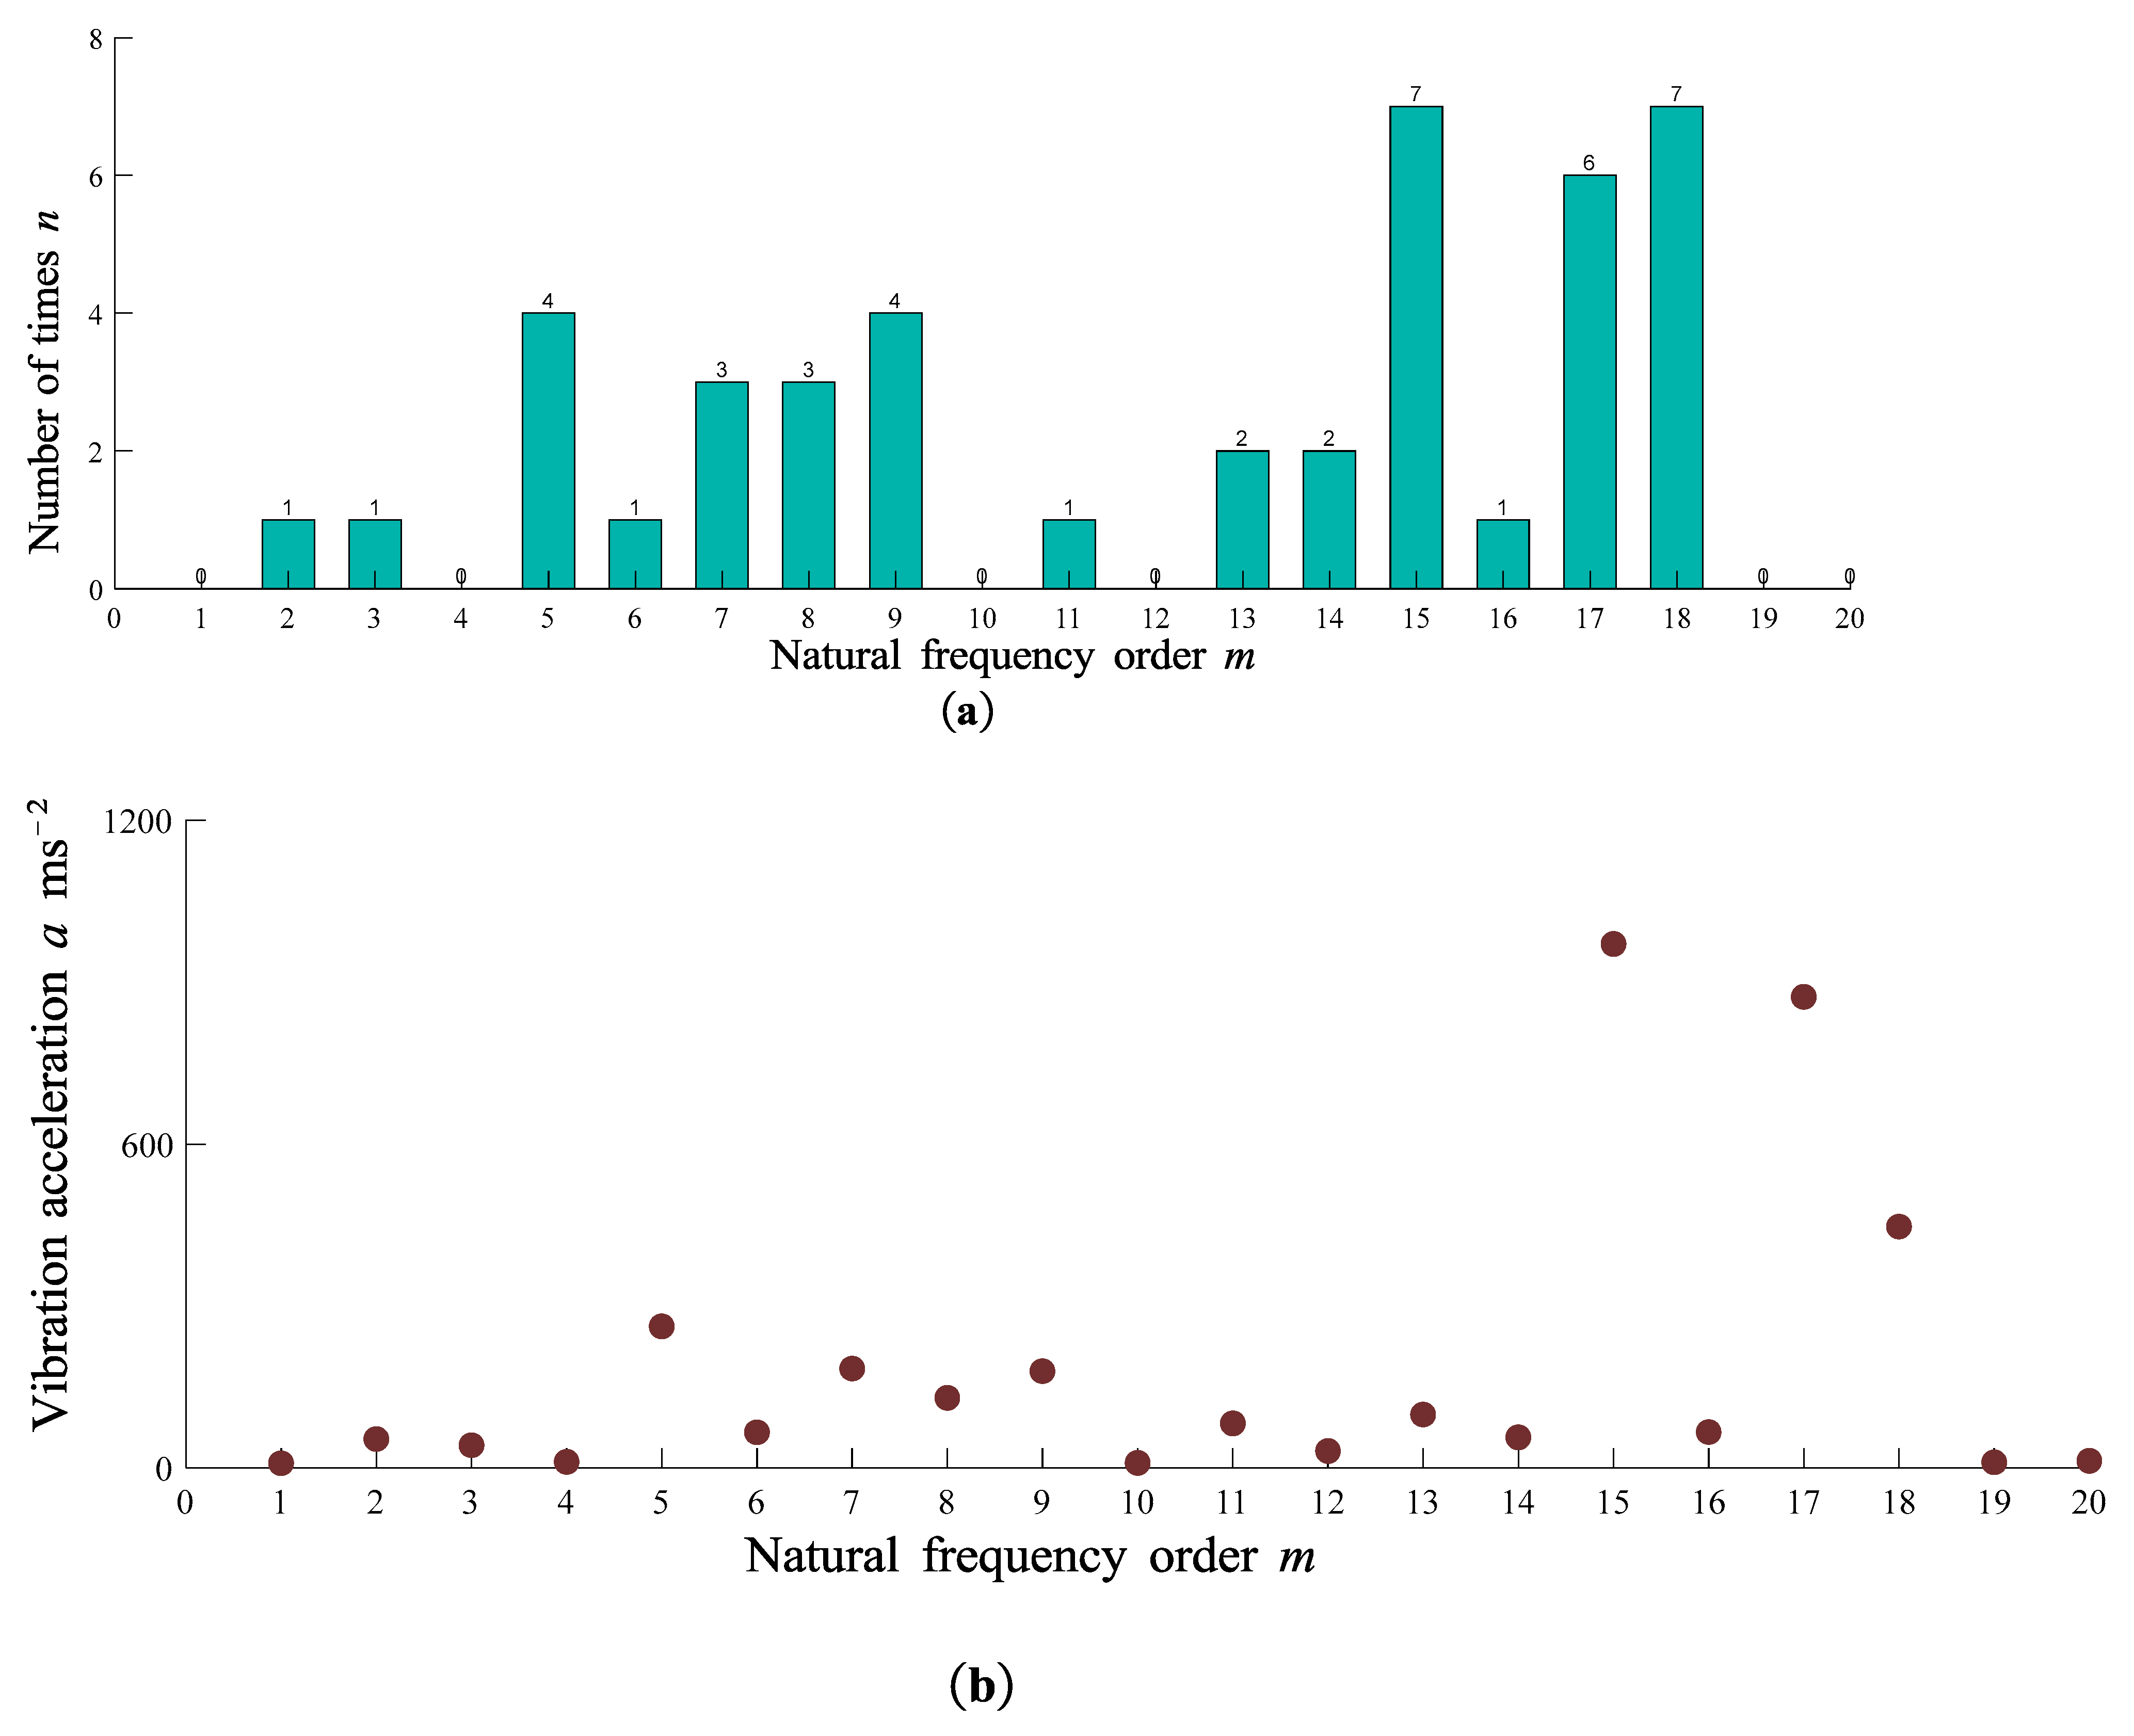
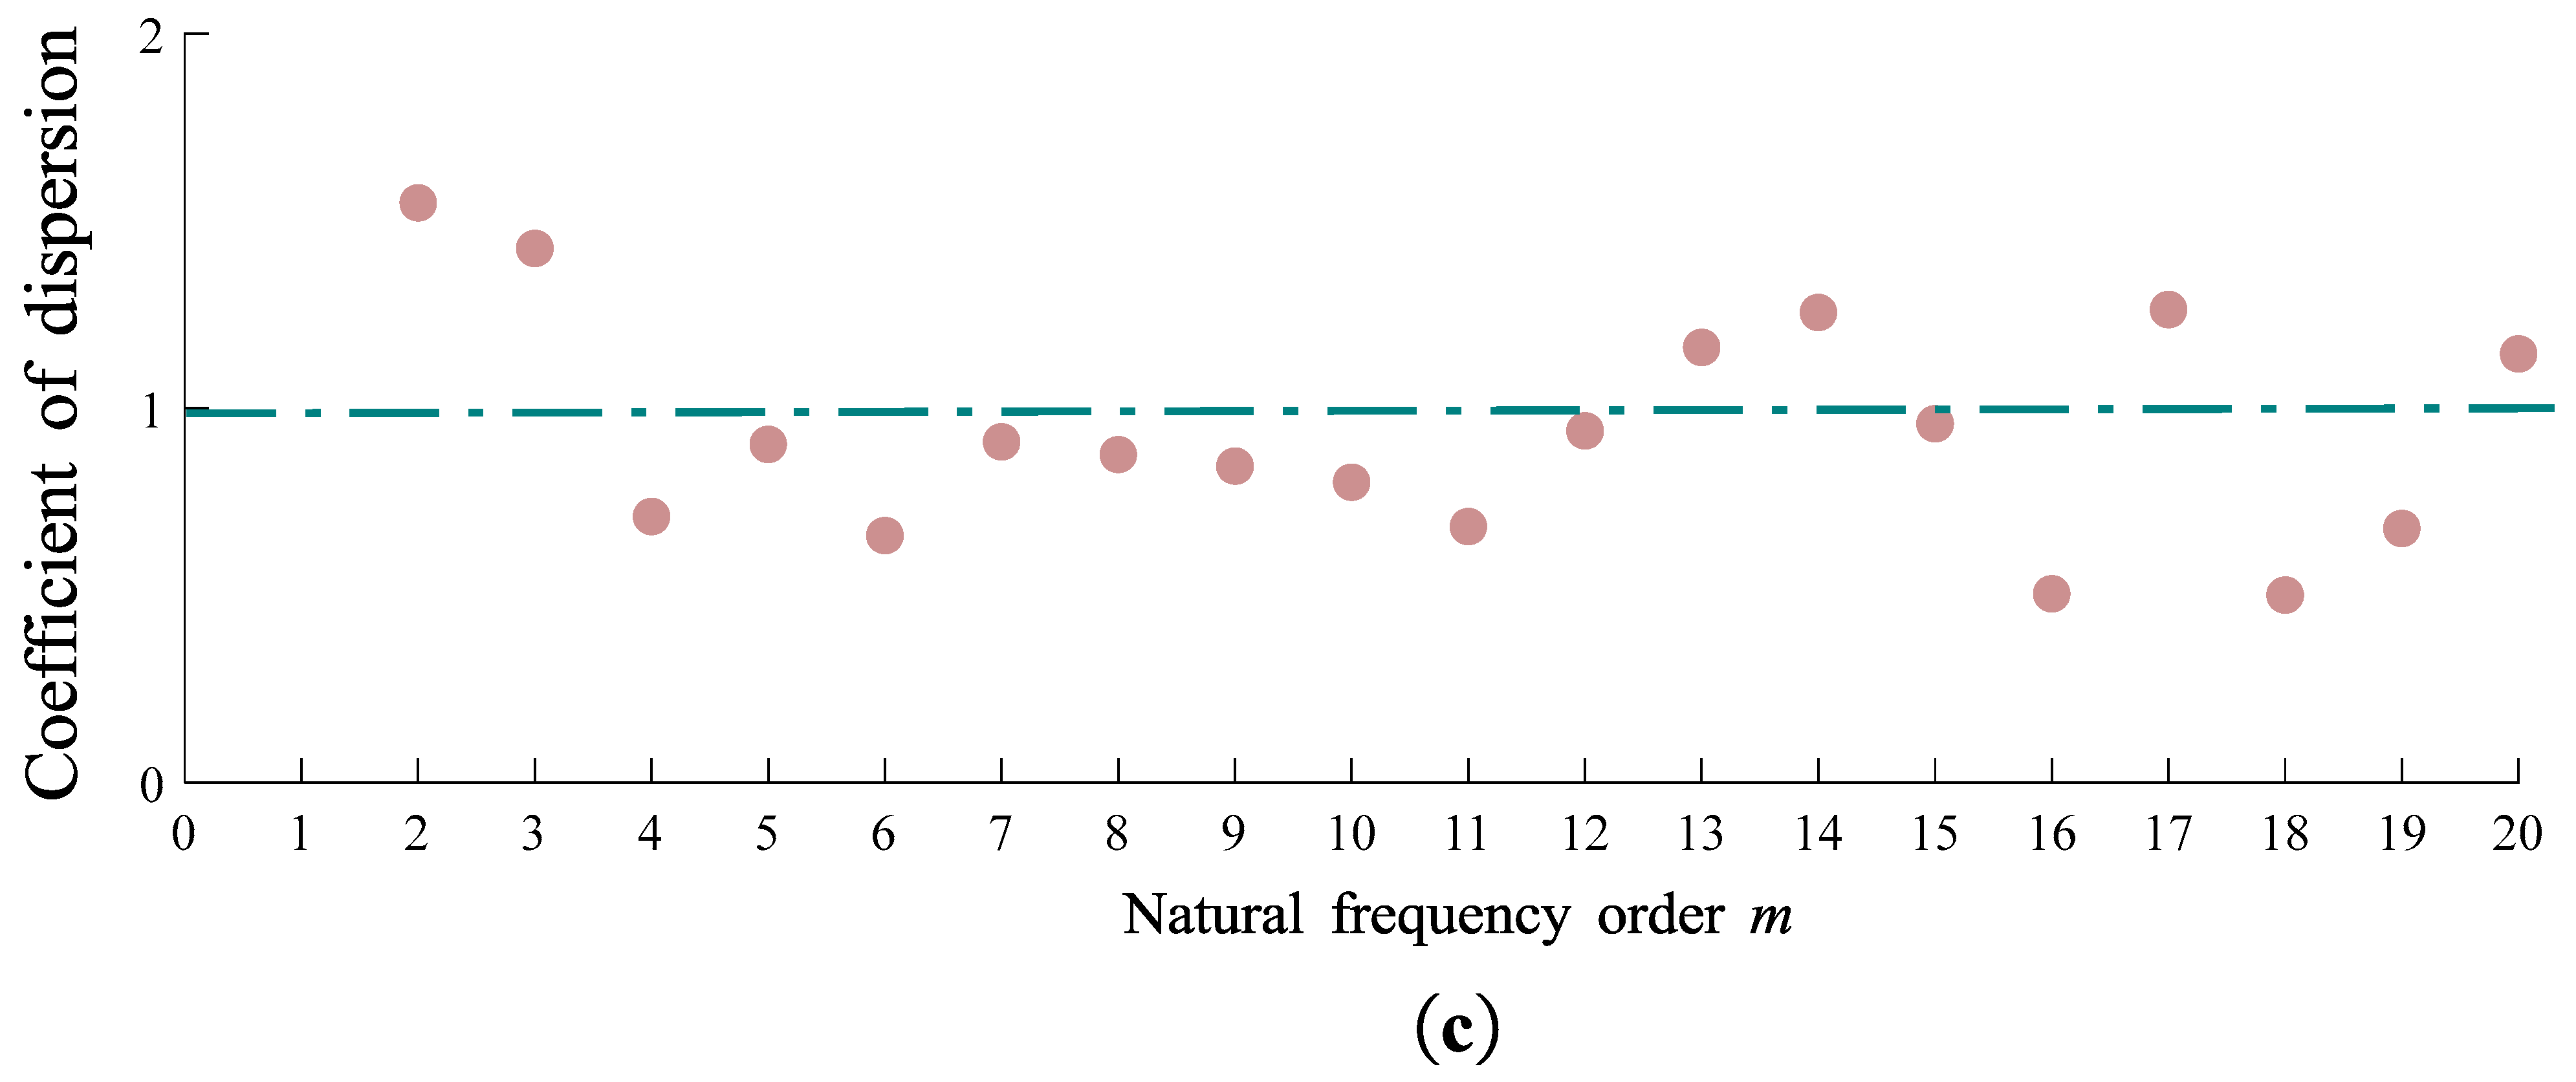
When all branch tip mass radii are 100mm, the acceleration amplitude evaluation metrics corresponding to various natural frequencies are depicted in Figure 8. Among these frequencies, the 15th and 18th natural frequencies exhibit the highest frequency of occurrence across different branches, with a frequency count of n=7. The 15th frequency also boasts the maximum mean amplitude at 1052.95 ms-2. Conversely, the 16th natural frequency demonstrates the smallest coefficient of variation. Through comprehensive analysis, it is concluded that the 15th natural frequency, with a corresponding frequency value of 14.55 Hz, serves as the most suitable excitation frequency.
Combining Figure 3-b, Figure 4-b, and Figure 5-b, it is observed that the optimal vibration frequency for fruit trees corresponds to the peak frequency in the trunk vibration spectrum. Furthermore, as the concentrated mass (me) at the tips of the branches decreases, the optimal vibration modal frequency of the entire fruit tree shows an increasing trend.
5. Conclusions
A model for simulating the vibration of fruit tree branches was constructed, revealing variations in branch vibration due to differences in spatial distribution and mass of each branch. When disregarding damping in fruit trees, the natural frequencies of individual branches and the trunk are the same. Therefore, the natural frequencies of the entire fruit tree can be determined through the trunk.
By statistically analyzing the natural frequencies of different-order fruit trees and evaluating them based on the frequency of occurrence, mean acceleration, and coefficient of variation of acceleration when the fruit separates from the branches, it was found that at the maximum peak frequency in the trunk's frequency spectrum, the mean vibration acceleration of individual branches is the highest, and the energy distribution is relatively uniform. This frequency is deemed more suitable as the operational frequency for vibration harvesting in orchards.
Author Contributions
“Conceptualization, Haobo Jiao. and Juming Luo.; methodology, .; software, Haobo Jiao.; validation, Aifei Tang., Haobo Jiao. and Chen Ma.; formal analysis, Lihong Wang.; investigation, Haobo Jiao.; resources, Li hongWang.; data curation, Haobo Jiao.; writing—original draft preparation, Haobo Jiao.; writing—review and editing, Chengsong Li.; visualization,Juming Luo.; supervision, Haobo Jiao.; project administration, Chengsong Li.; funding acquisition, Yaping Li. All authors have read and agreed to the published version of the manuscript.”
Funding
This research was funded by the National Natural Science Foundation of China, grant number 52265036.
Acknowledgments
Thanks to Zhang Cong for his support in vibration simulation software operation technology; Thanks to Tang Yin for reading my first draft and suggesting revisions ;Thanks to Xiang Chunlan for their research support.
Conflicts of Interest
The authors declare no conflict of interest.
References
- Gardonio, P.; Zilletti, M. Sweeping tuneable vibration absorbers for low-mid frequencies vibration control. J Sound Vib 2015, 354, 1–12. [Google Scholar] [CrossRef]
- Castro-Garcia, S.; Castillo-Ruiz, F.J.; Jimenez-Jimenez, F.; Gil-Ribes, J.A.; Blanco-Roldan, G.L. Suitability of Spanish 'Manzanilla' table olive orchards for trunk shaker harvesting. Biosyst Eng 2015, 129, 388–395. [Google Scholar] [CrossRef]
- Yao, J.B.; Tang, B.P.; Zhao, J. A study on the quick measuring method of linear dynamic range of receiver. Measurement 2015, 59, 237–240. [Google Scholar] [CrossRef]
- Liu, T.H.; Luo, G.; Ehsani, R.; Toudeshki, M.; Zou, X.J.; Wang, H.J. Simulation study on the effects of tine-shaking frequency and penetrating depth on fruit detachment for citrus canopy-shaker harvesting. Comput Electron Agr 2018, 148, 54–62. [Google Scholar] [CrossRef]
- Pu, Y.J.; Toudeshki, A.; Ehsani, R.; Yang, F.Z.; Abdulridha, J. Selection and experimental evaluation of shaking rods of canopy shaker to reduce tree damage for citrus mechanical harvesting. Int J Agr Biol Eng 2018, 11, 48–54. [Google Scholar] [CrossRef]
- Lin, H.; Sun, L.H. Vibration responses characteristics of a Ginkgo biloba tree excited under harmonic excitation. Plos One 2021, 16. [Google Scholar] [CrossRef] [PubMed]
- Niu, Z.J.; Xu, Z.; Deng, J.T.; Zhang, J.; Pan, S.J.; Mu, H.T. Optimal vibration parameters for olive harvesting from finite element analysis and vibration tests. Biosyst Eng 2022, 215, 228–238. [Google Scholar] [CrossRef]
- He, L.; Liu, X.; Du, X.; Wu, C. In-situ identification of shaking frequency for adaptive vibratory fruit harvesting. Comput Electron Agr 2020, 170. [Google Scholar] [CrossRef]
- Homayouni, T.; Gholami, A.; Toudeshki, A.; Afsah-Hejri, L.; Ehsani, R. Estimation of proper shaking parameters for pistachio trees based on their trunk size. Biosyst Eng 2022, 216, 121–131. [Google Scholar] [CrossRef]
- Zhou, J.; Xu, L.Y.; Zhao, J.W.; Hang, X.C.; Zhou, H.P. Effective excitation conditions for the intense motion of the ginkgo seed-stem system during mechanical vibration harvesting. Biosyst Eng 2022, 215, 239–248. [Google Scholar] [CrossRef]
- Wang, W.Z.; Lu, H.Z.; Zhang, S.M.; Yang, Z. Damage caused by multiple impacts of litchi fruits during vibration harvesting. Comput Electron Agr 2019, 162, 732–738. [Google Scholar] [CrossRef]
- Ortiz, C.; Torregrosa, A.; Castro-Garcia, S. Comparison of a Lightweight Experimental Shaker and an Orchard Tractor Mounted Trunk Shaker for Fresh Market Citrus Harvesting. Agriculture-Basel 2021, 11. [Google Scholar] [CrossRef]
- Ortiz, C.; Torregrosa, A.; Castro-Garcia, S. Citrus Fruit Movement Assessment Related to Fruit Damage during Harvesting with an Experimental Low-Frequency-High-Amplitude Device. Agronomy-Basel 2022, 12. [Google Scholar] [CrossRef]
- Zhuo, P.; Li, Y.X.; Jiao, H.B.; Wang, P.; Li, C.S.; Niu, Q.; Wang, L.H. Analysis and experimental study on vibration response characteristics of mechanical harvesting of jujube. Comput Electron Agr 2022, 203. [Google Scholar] [CrossRef]
- Xuan, Y.; Xu, L.Y.; Liu, G.H.; Zhou, J. The vibrational response of simulated Ginkgo biloba fruit based on their frequency spectrum characteristics. Plos One 2020, 15. [Google Scholar] [CrossRef] [PubMed]
- Castro-Garcia, S.; Sola-Guirado, R.R.; Gil-Ribes, J.A. Vibration analysis of the fruit detachment process in late-season 'Valencia' orange with canopy shaker technology. Biosyst Eng 2018, 170, 130–137. [Google Scholar] [CrossRef]
- Santos, F.L.; Scinocca, F.; Marques, D.D.; Velloso, N.S.; Villar, F.M.D. Modal properties of macaw palm fruit-rachilla system: An approach by the stochastic finite element method (SFEM). Comput Electron Agr 2021, 184. [Google Scholar]
- Castro-Garcia, S.; Blanco-Roldan, G.L.; Ferguson, L.; Gonzalez-Sanchez, E.J.; Gil-Ribes, J.A. Frequency response of late-season 'Valencia' orange to selective harvesting by vibration for juice industry. Biosyst Eng 2017, 155, 77–83. [Google Scholar] [CrossRef]
- Xuan, Y.; Xu, L.Y.; Liu, G.H.; Zhou, J. The Potential Influence of Tree Crown Structure on the Ginkgo Harvest. Forests 2021, 12. [Google Scholar] [CrossRef]
- Giachetti, A.; Zini, G.; Giambastiani, Y.; Bartoli, G. Field Measurements of Tree Dynamics with Accelerometers. Forests 2022, 13, 13. [Google Scholar] [CrossRef]
- Sola-Guirado, R.R.; Castro-Garcia, S.; Blanco-Roldan, G.L.; Gil-Ribes, J.A.; Gonzaez-Sachez, E.J. Performance evaluation of lateral canopy shakers with catch frame for continuous harvesting of oranges for juice industry. Int J Agr Biol Eng 2020, 13, 88–93. [Google Scholar] [CrossRef]
- Lang, Z. Dynamic modelling structure of a fruit tree for inertial shaker system design. Biosyst Eng 2006, 93, 35–44. [Google Scholar] [CrossRef]
- Pezzi, F.; Caprara, C. Mechanical grape harvesting: Investigation of the transmission of vibrations. Biosyst Eng 2009, 103, 281–286. [Google Scholar] [CrossRef]
- Ma, Z.S.; Ding, Q.; Tang, Y. Operational modal analysis of a liquid-filled cylindrical structure with decreasing filling mass by multivariate stochastic parameter evolution methods. Int J Mech Sci 2020, 172. [Google Scholar] [CrossRef]
- Zhong, W.; Deng, Z.; Wei, Q.; Chen, G.; Huang, X. Multi-scale numerical analysis on failure behavior of wood under different speed loading conditions. China test 2016, 42, 79–84. [Google Scholar]
- Wang, B.S.; He, M.; Li, C.S.; Wang, L.H.; Meng, H.W. Microstructure and biomechanical characterisation of jujube branches. Biosyst Eng 2020, 194, 165–176. [Google Scholar] [CrossRef]
- Chahal, A.; Ciolkosz, D.; Puri, V.; Jacobson, M.; Liu, J.D. Mechanical characteristics of wood-bark interface of shrub willow. Ind Crop Prod 2021, 162. [Google Scholar] [CrossRef]
- Wei, J.; Yang, G.Y.; Yan, H.; Jing, B.B.; Yu, Y. Rigid-flexible coupling simulation and experimental vibration analysis of pistachio tree for optimal mechanized harvesting efficiency. Mech Adv Mater Struc 2021, 28, 2360–2369. [Google Scholar] [CrossRef]
Figure 1.
Construction of fruit tree model: (a) Fruit tree in the field; (b) Model simplified of fruit tree; (c) Model simplified of branches; (d) Equivalent model of branches.
Figure 1.
Construction of fruit tree model: (a) Fruit tree in the field; (b) Model simplified of fruit tree; (c) Model simplified of branches; (d) Equivalent model of branches.
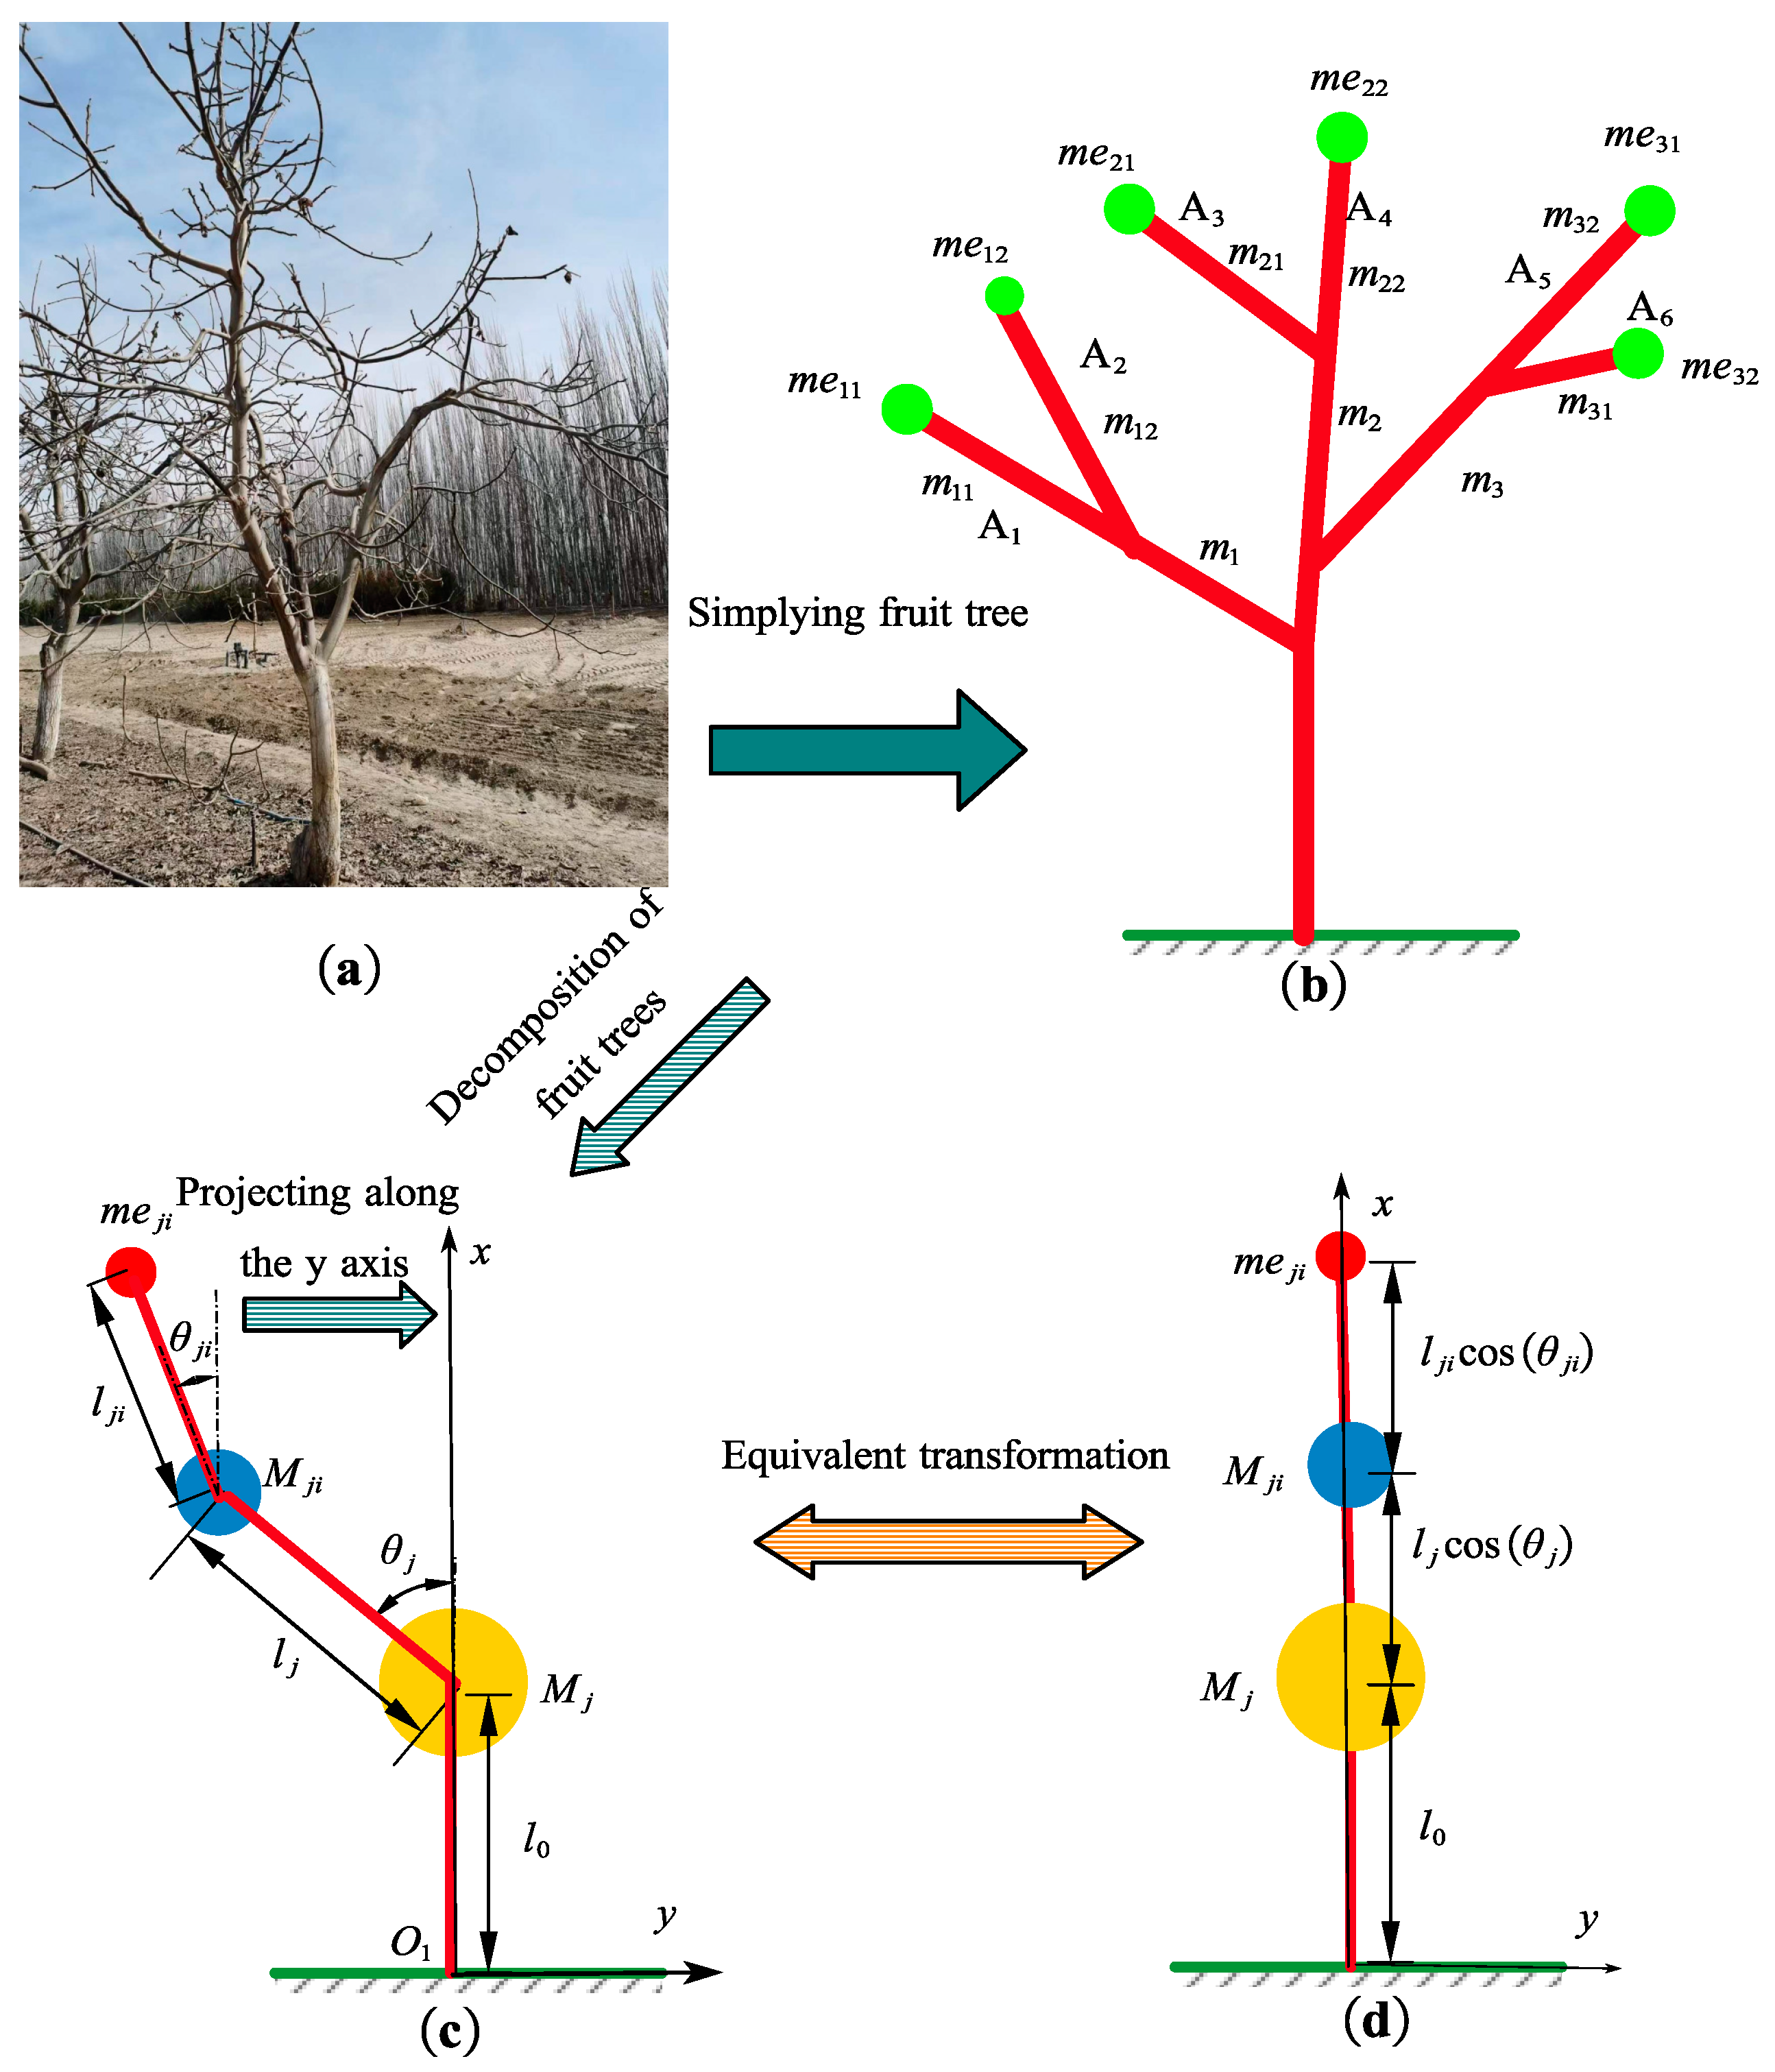
Figure 2.
Analysis of the Variability of Fruit Tree Branches: (a) Fruit tree branch model; (b) Constraint conditions and addition of sweep excitation force for the fruit tree; (c) Branch grouping; (d) Reduction of mass for the first group of branches; (e) Reduction of concentrated mass for both groups of branches.
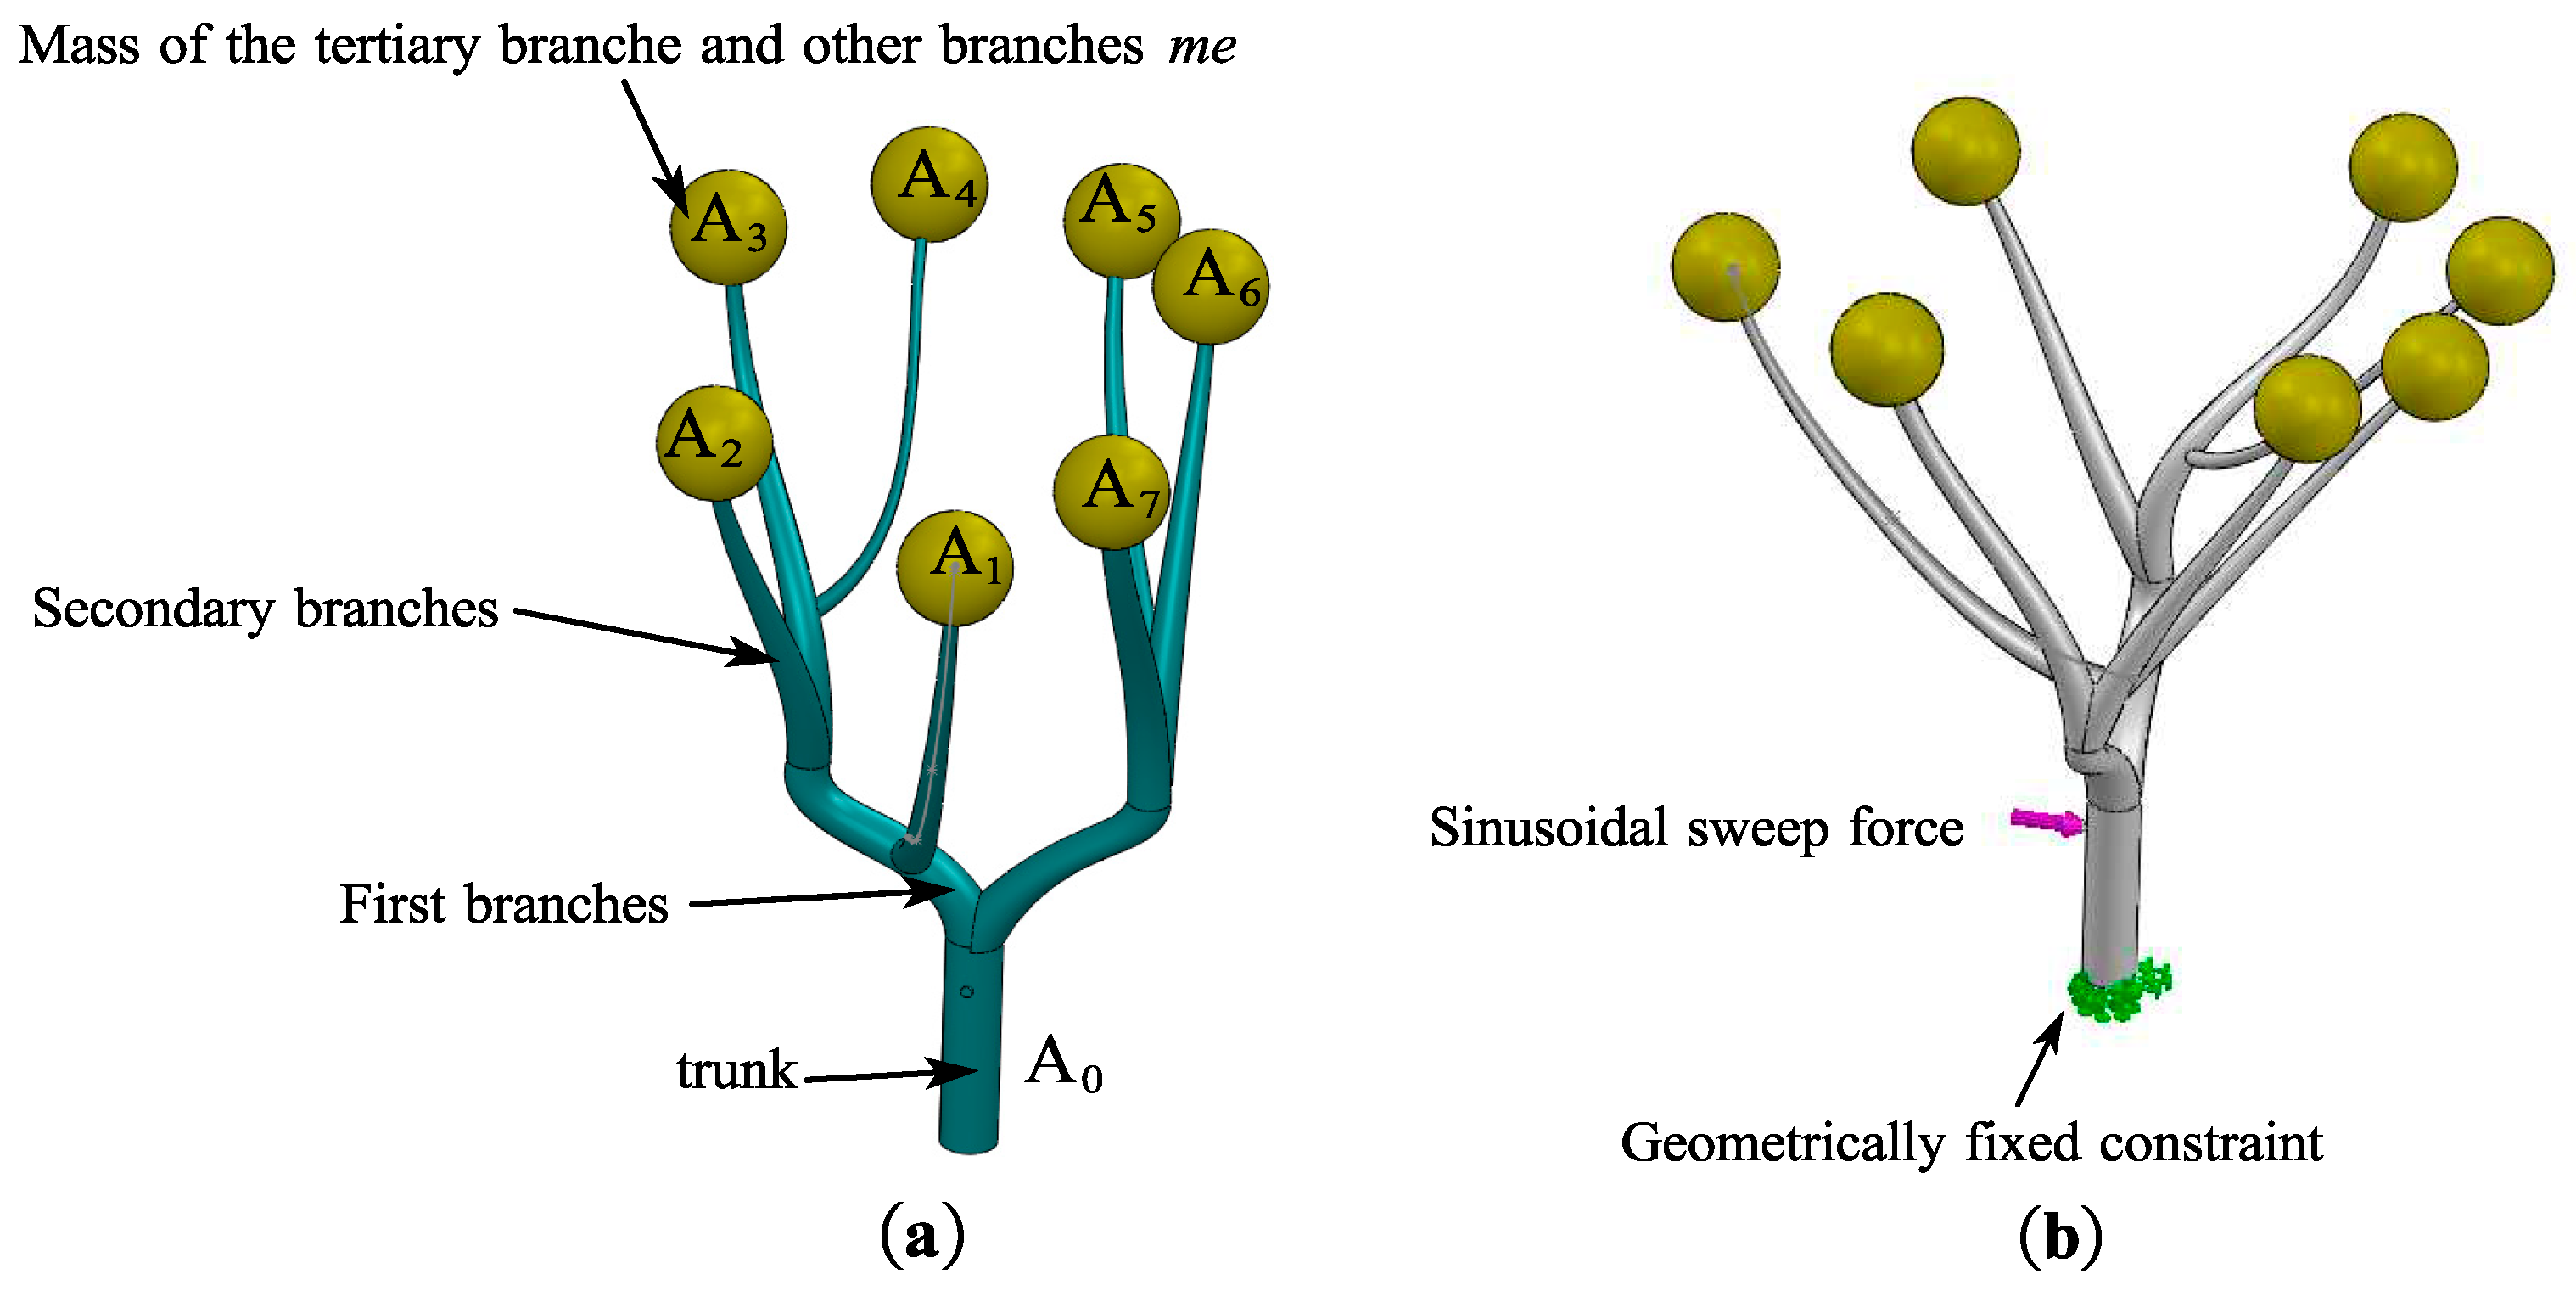
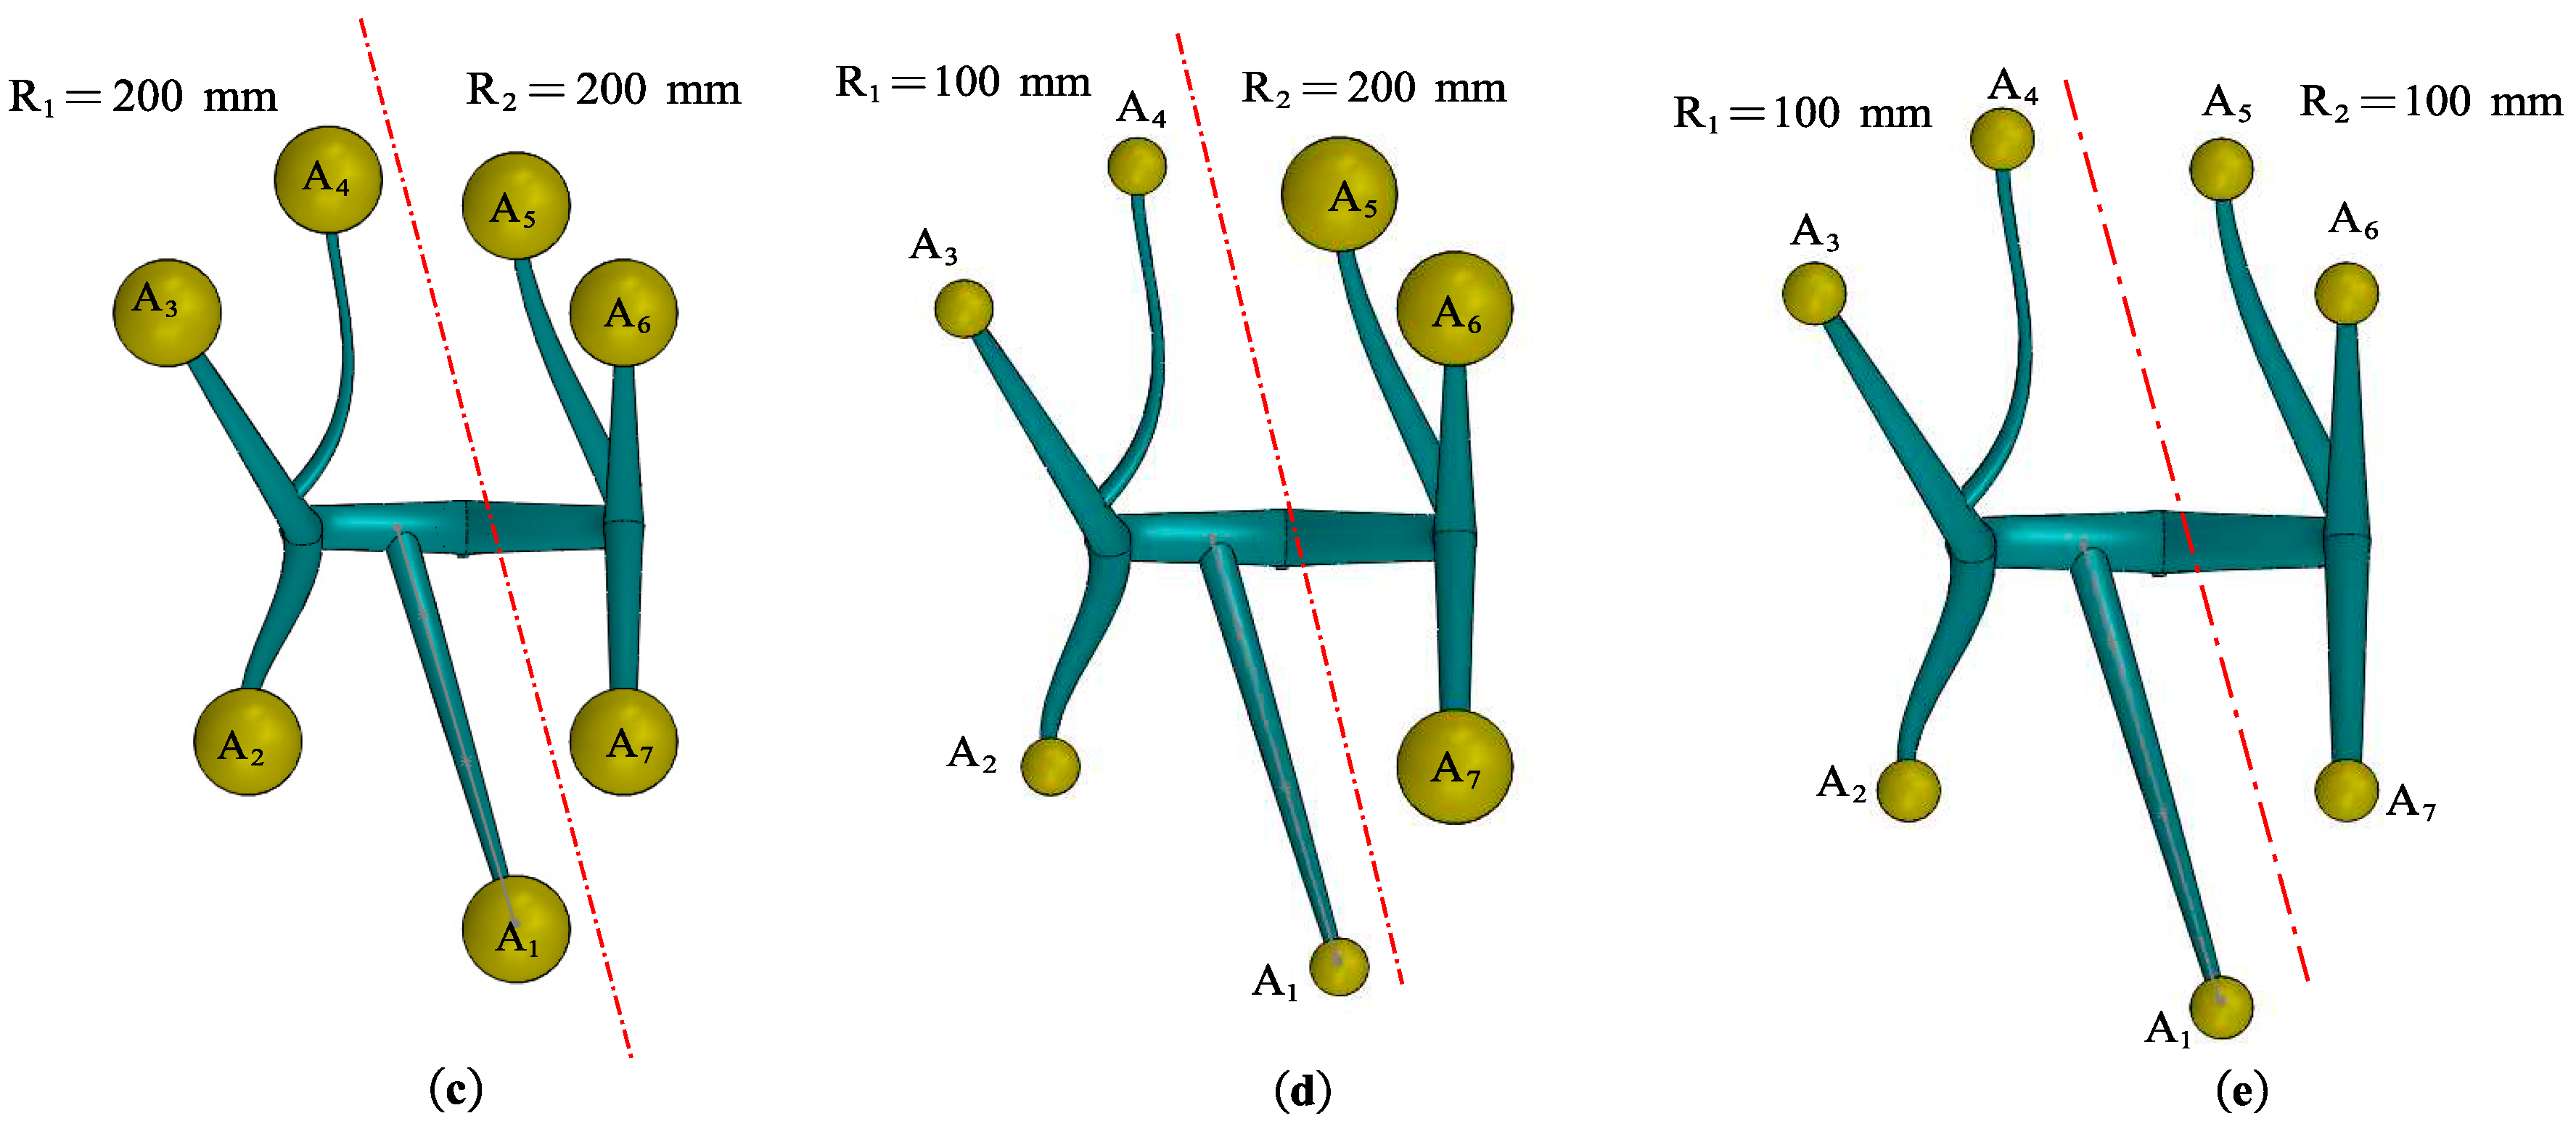
Figure 3.
Vibration Spectrum of Fruit Tree Branches when R1=R2=200 mm: (a) Vibration energy distribution of the fruit tree. (b) Vibration spectrum of branch A0. (c) Vibration spectrum of branch A1. (d) Vibration spectrum of branch A2. (e) Vibration spectrum of branch A3. (f) Vibration spectrum of branch A4. (g) Vibration spectrum of branch A5. (h) Vibration spectrum of branch A6. (i) Vibration spectrum of branch A7.
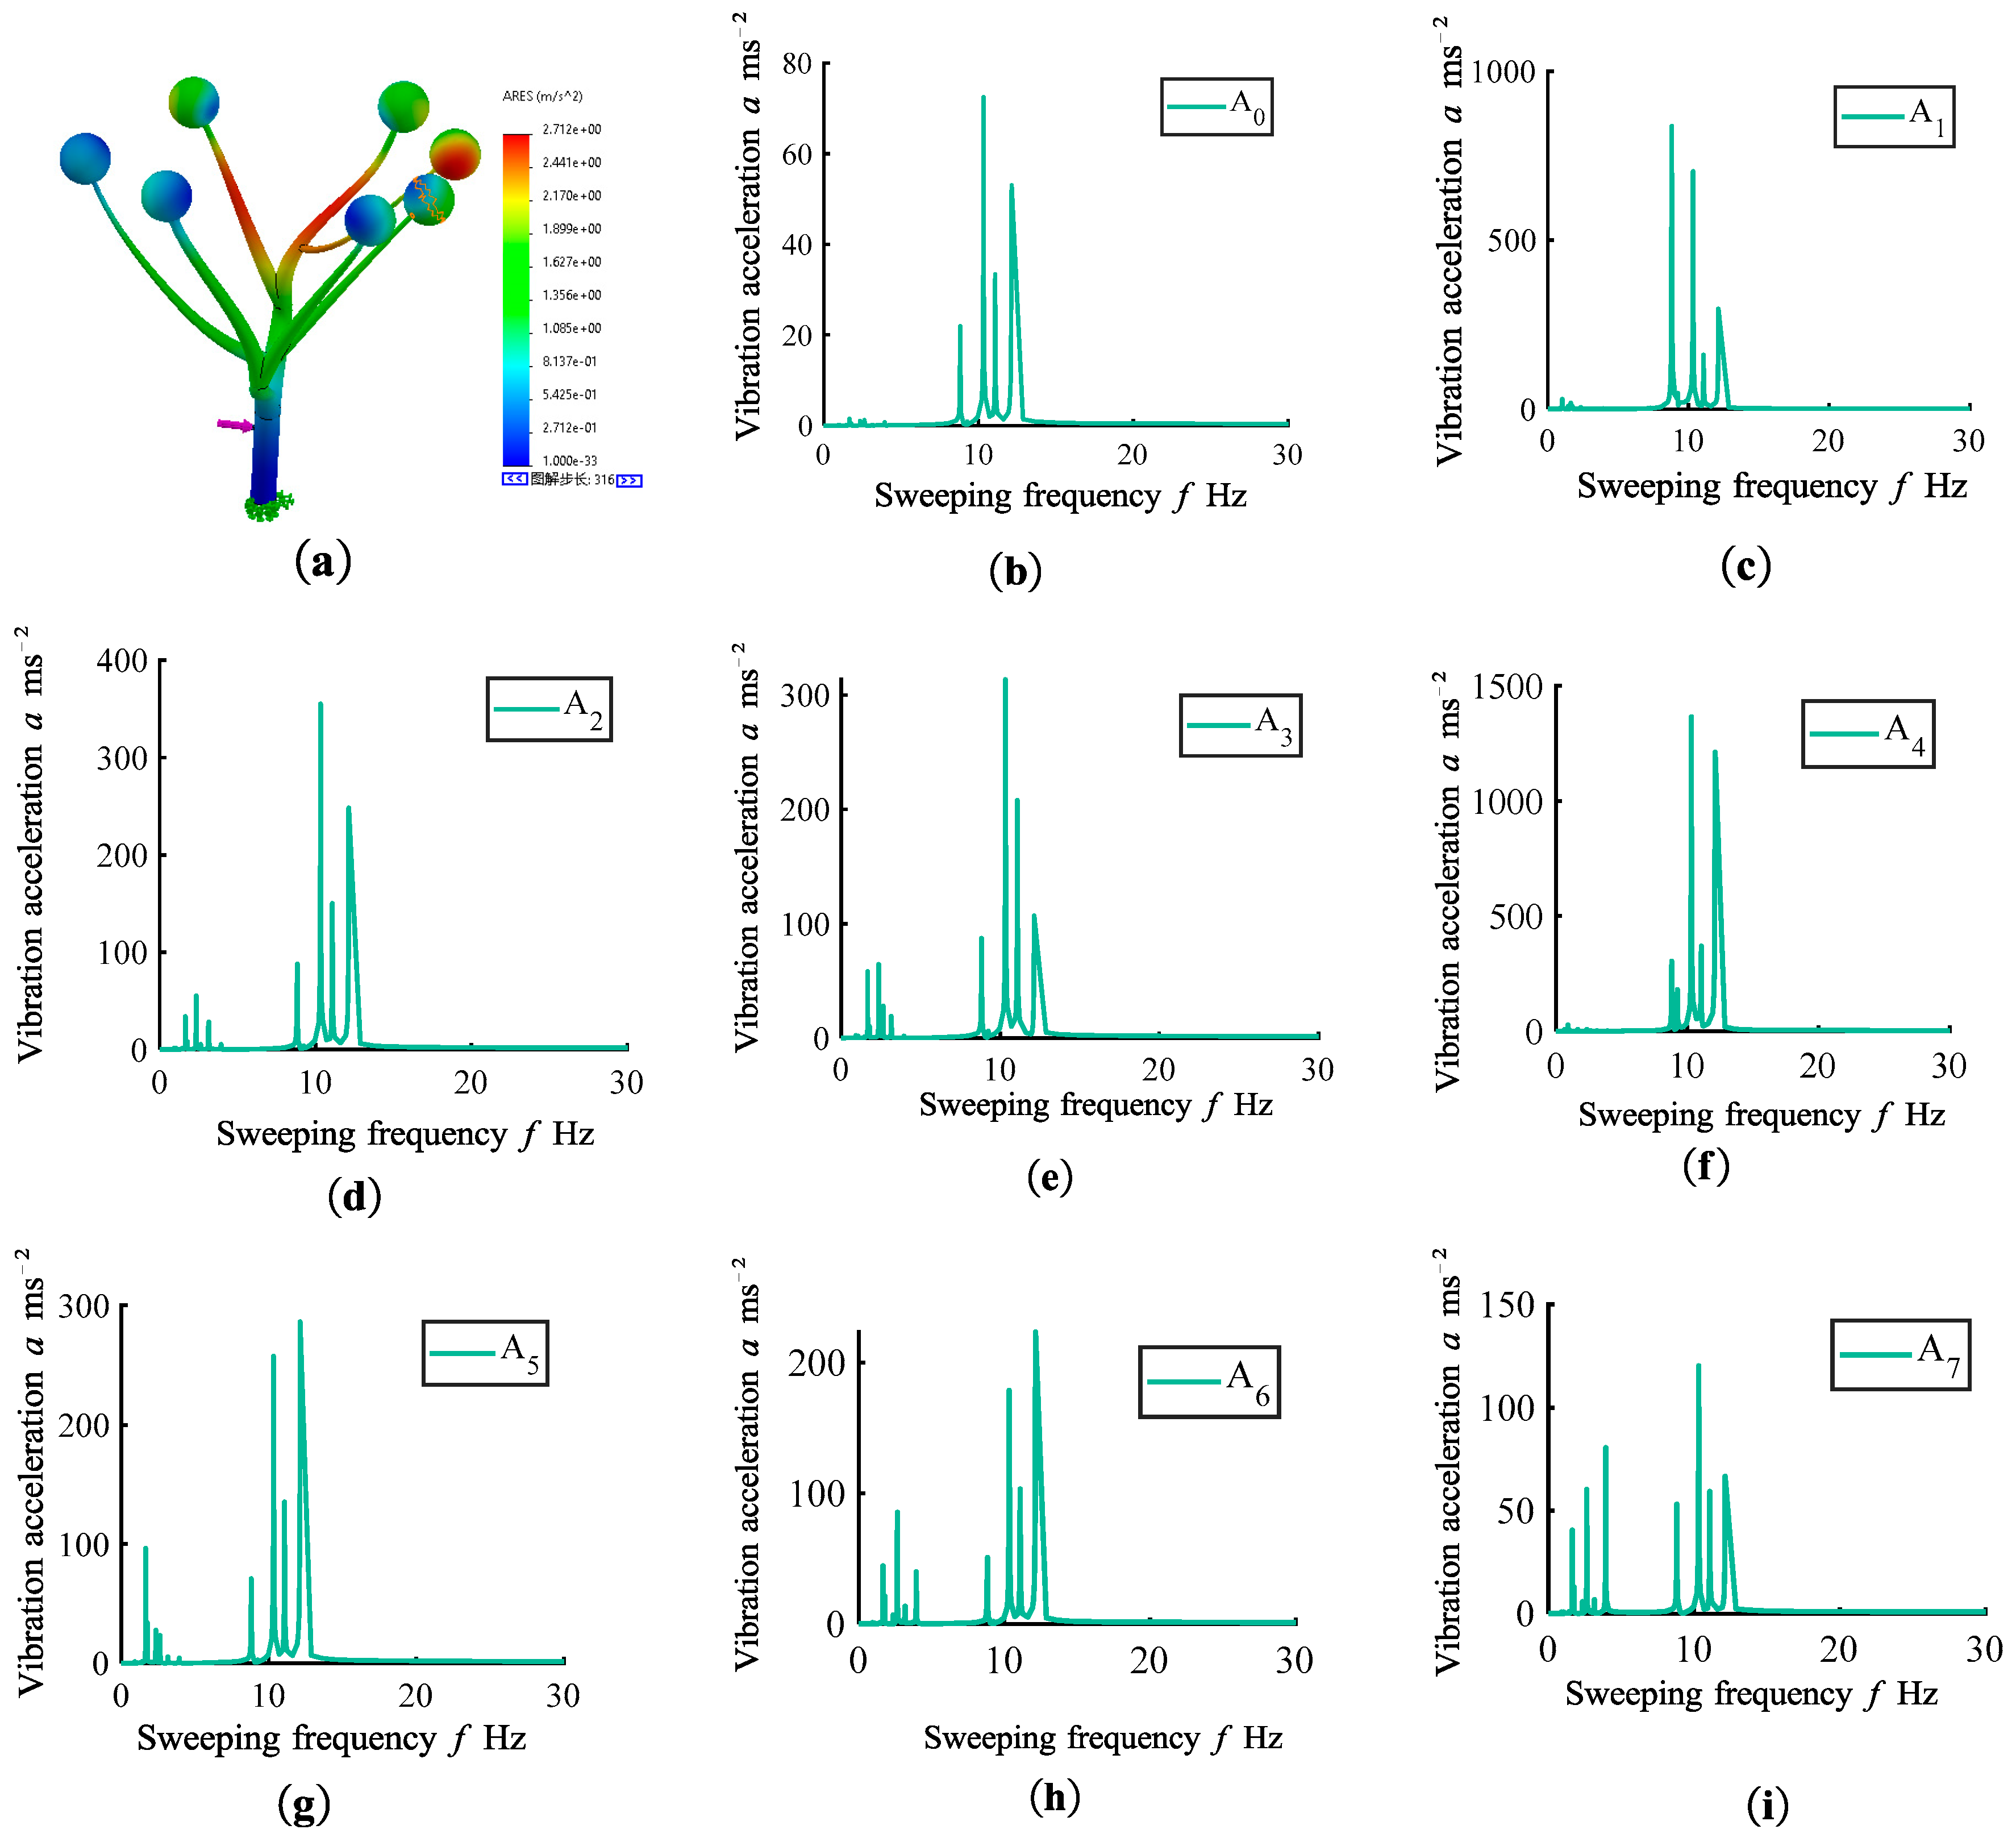
Figure 4.
Vibration Spectrum of Fruit Tree Branches when R1=100 mm and R2=200 mm: (a) Vibration energy distribution of the fruit tree. (b) Vibration spectrum of branch A0. (c) Vibration spectrum of branch A1. (d) Vibration spectrum of branch A2. (e) Vibration spectrum of branch A3. (f) Vibration spectrum of branch A4. (g) Vibration spectrum of branch A5. (h) Vibration spectrum of branch A6. (i) Vibration spectrum of branch A7.

Figure 5.
-Vibration Spectrum of Fruit Tree Branches when R1=100 mm and R2=100 mm: (a) Vibration energy distribution of the fruit tree. (b) Vibration spectrum of branch A0. (c) Vibration spectrum of branch A1. (d) Vibration spectrum of branch A2. (e) Vibration spectrum of branch A3. (f) Vibration spectrum of branch A4. (g) Vibration spectrum of branch A5. (h) Vibration spectrum of branch A6. (i) Vibration spectrum of branch A7.
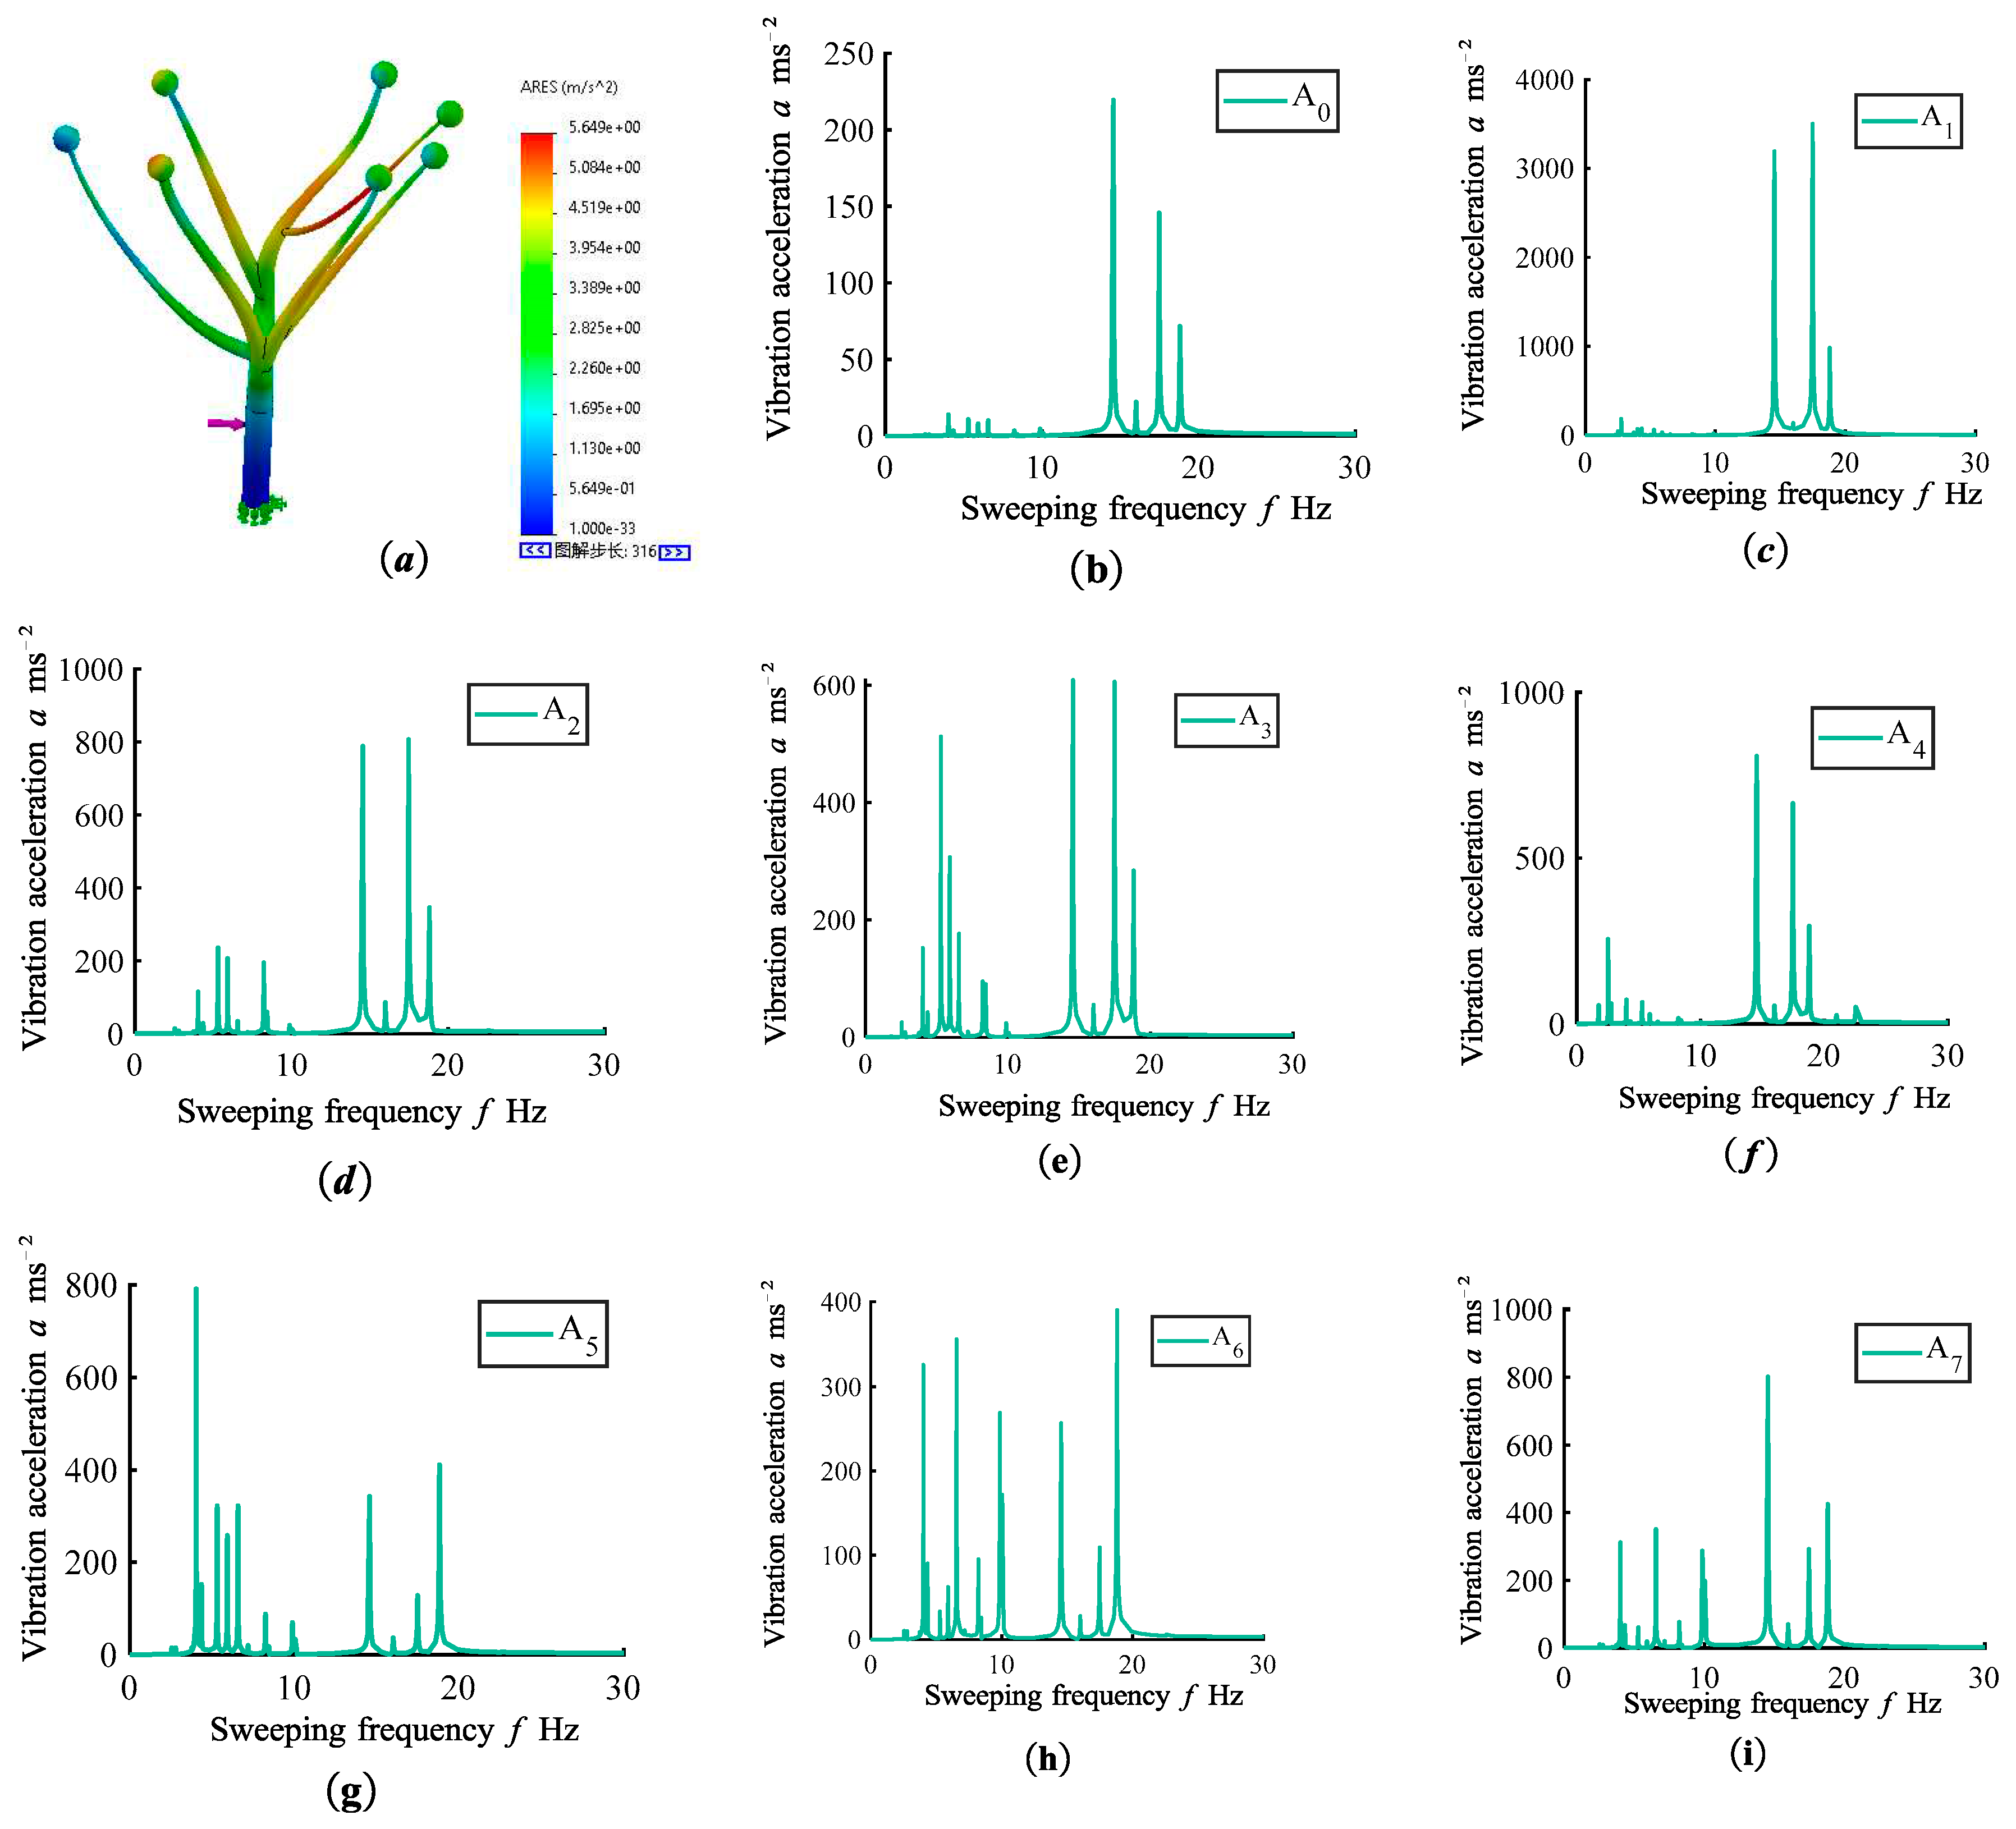
Figure 6.
R1=R2=200, the harvest frequency selection can be based on the following criteria: (a) The frequency of occurrence of natural frequencies across different branches corresponding to accelerations greater than 120 ms-2. (b) The mean accelerations corresponding to different natural frequencies. (c) The coefficient of variation of accelerations corresponding to different frequencies.
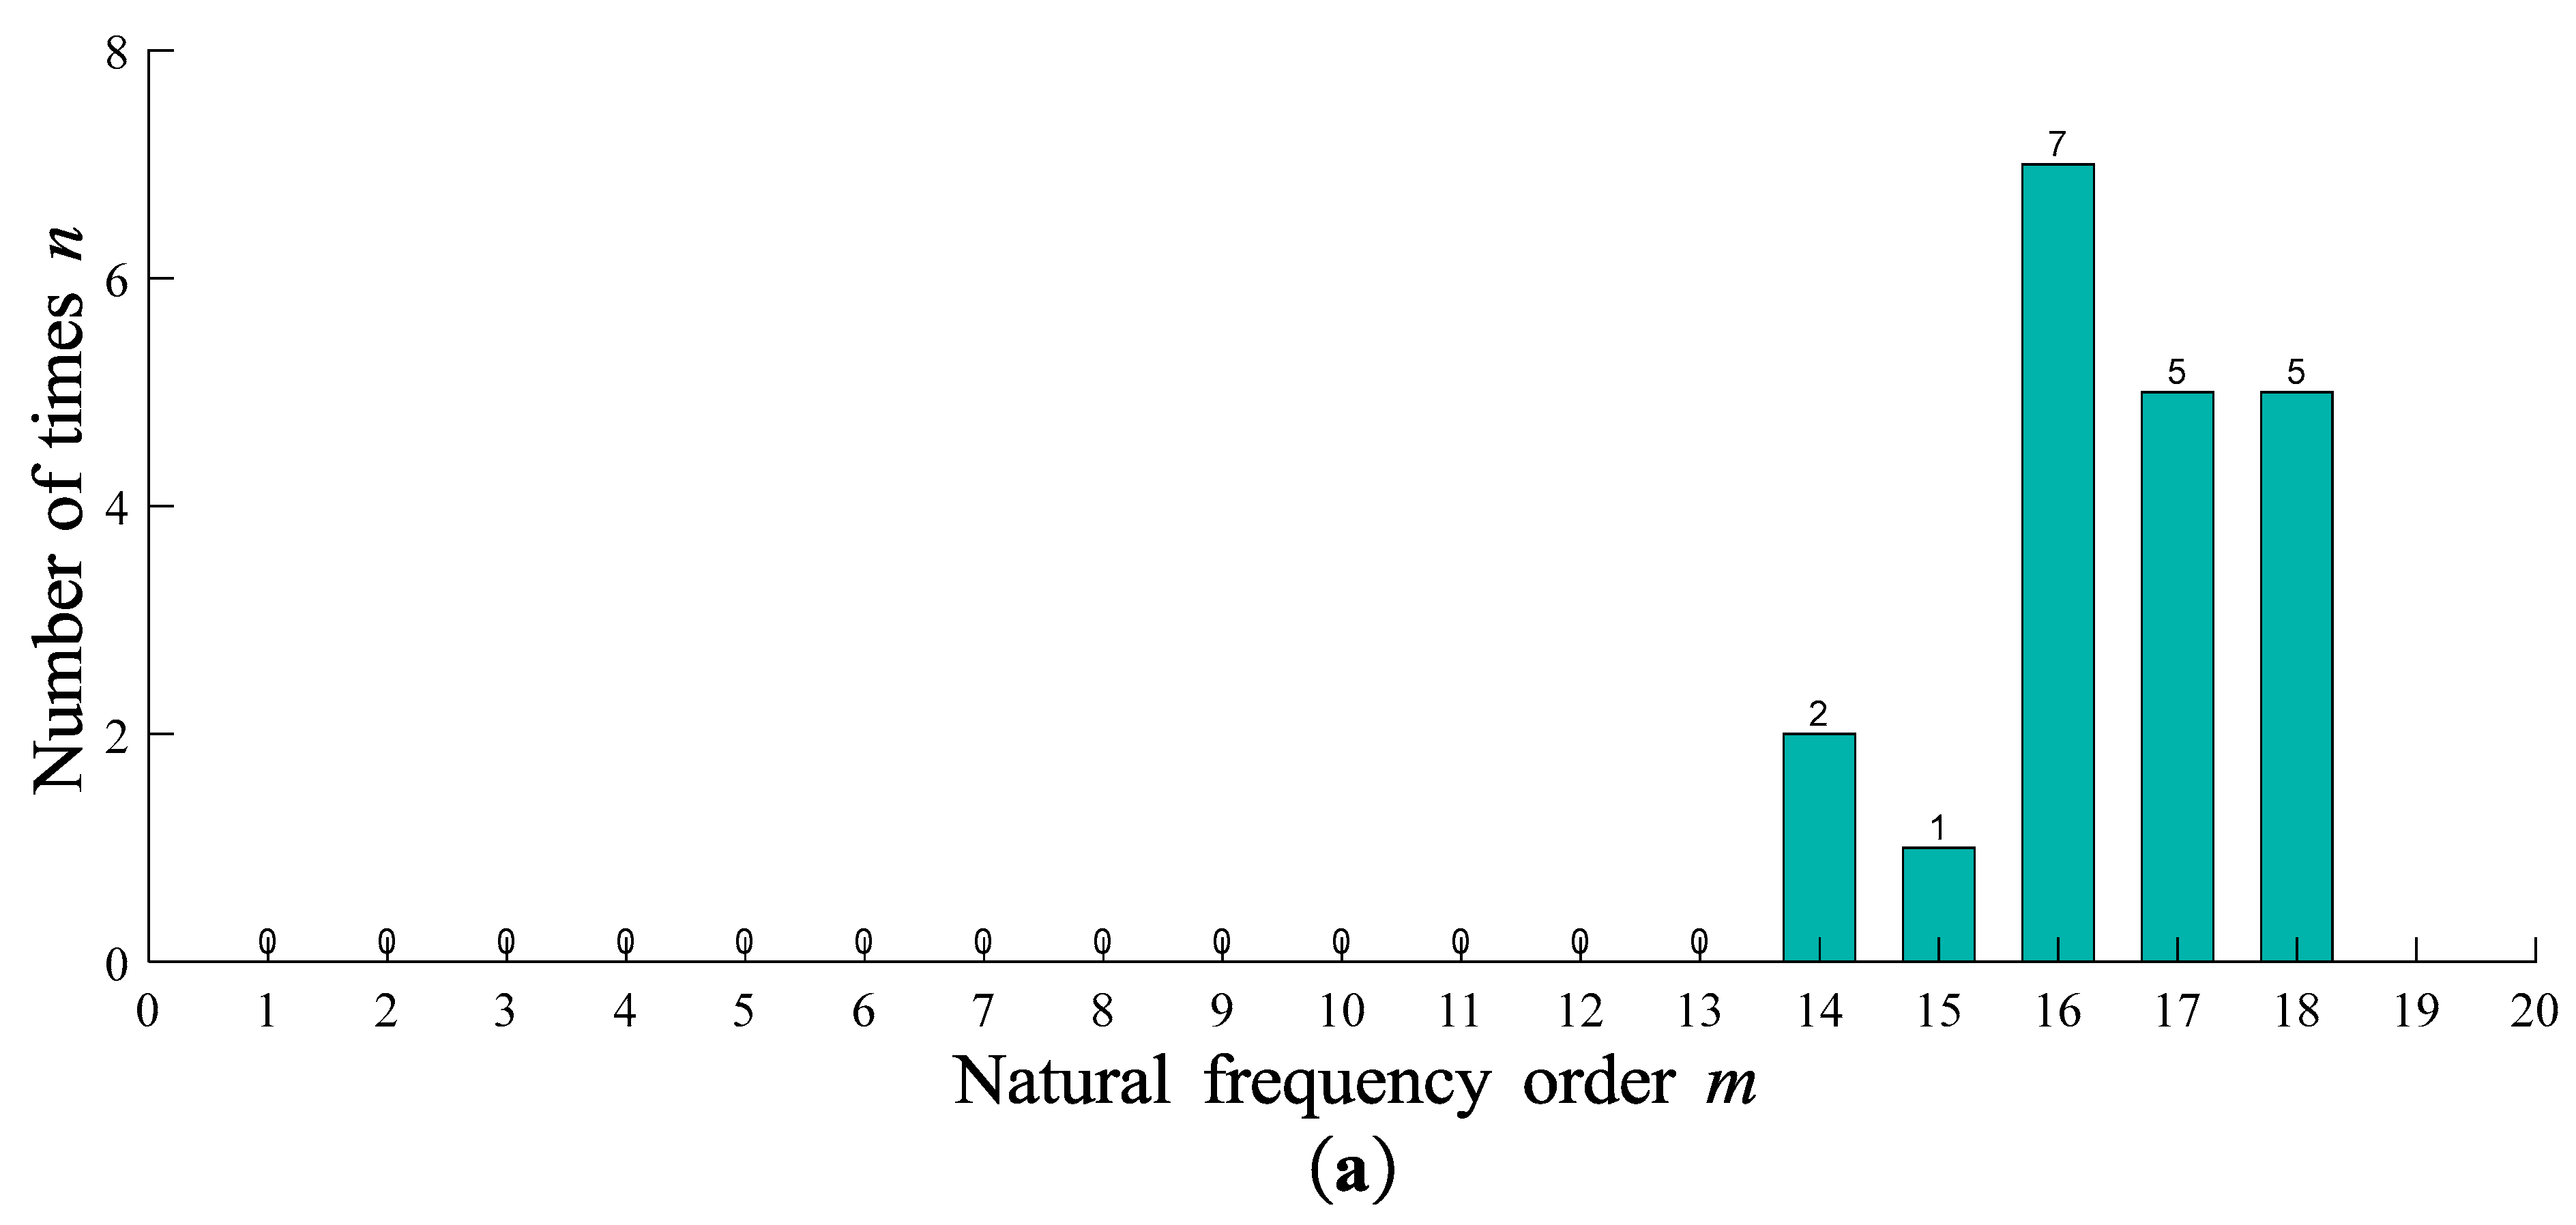
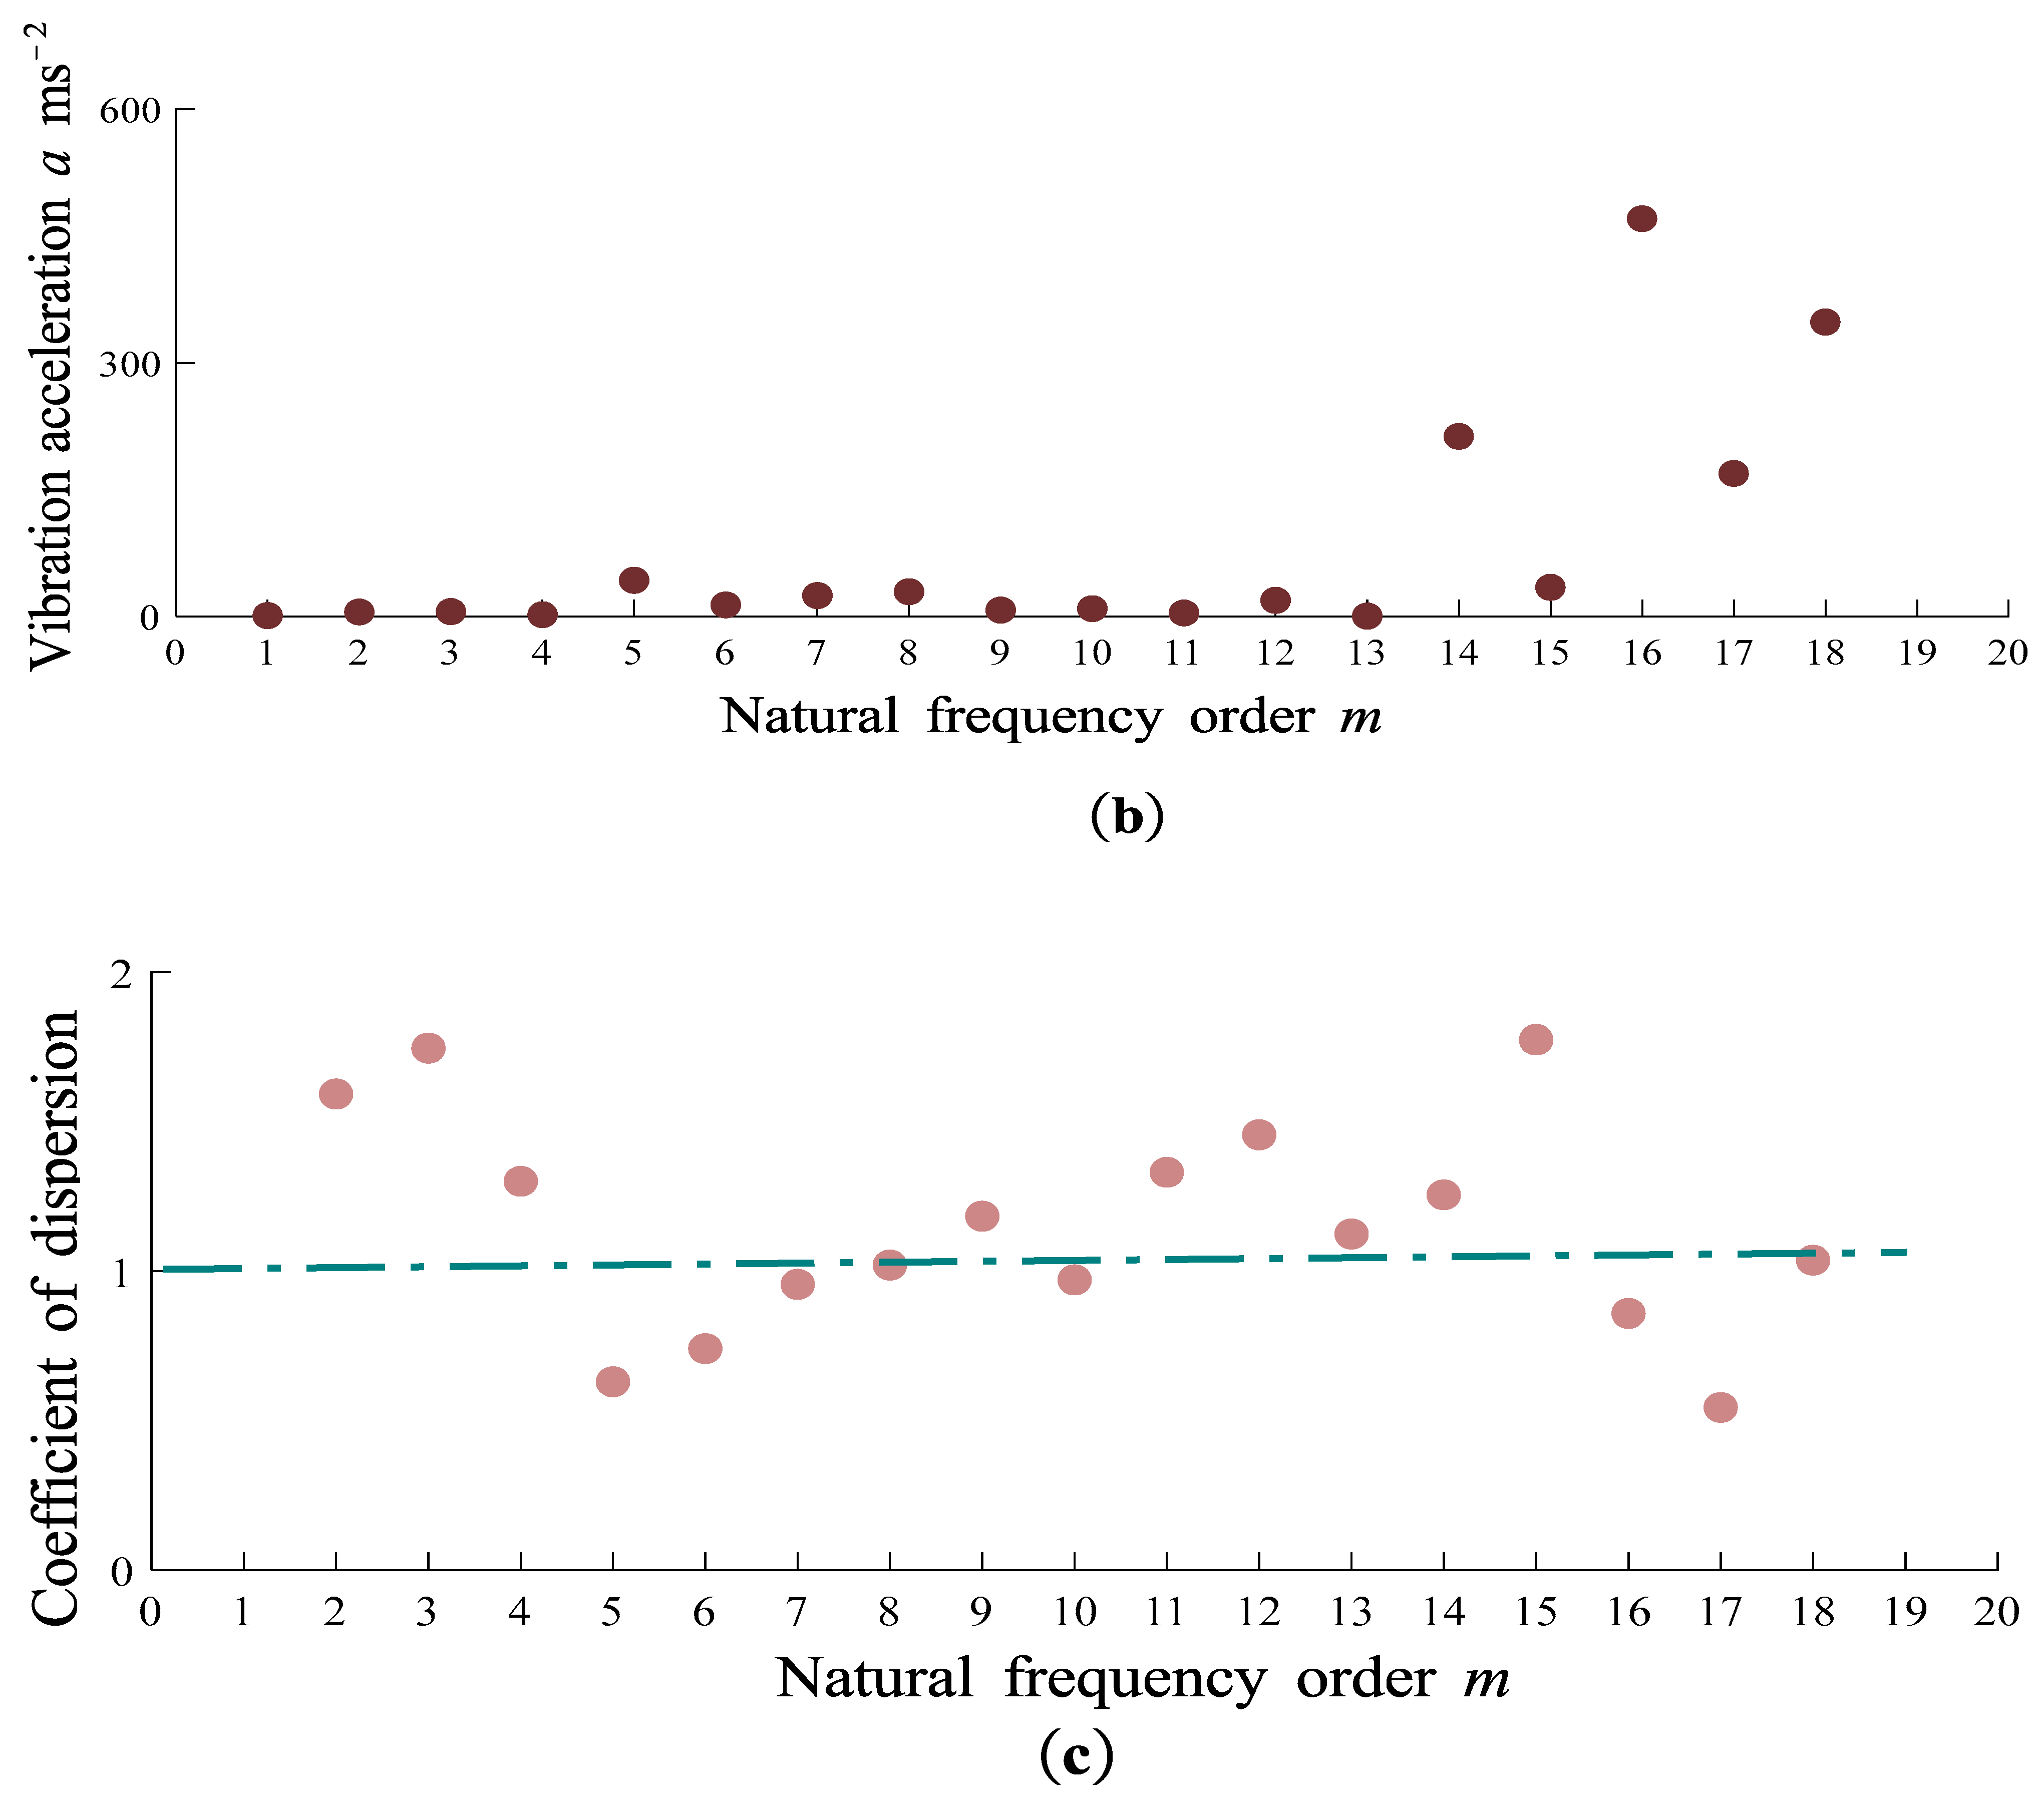
Figure 7.
When R1=100 and R2=200, the method for selecting the optimal harvesting frequency by Lin Guo can be based on the following criteria: (a) Count of occurrences of natural frequencies across different branches where the corresponding accelerations exceed 120 ms-2. (b) Mean accelerations corresponding to different natural frequencies. (c) Coefficient of variation of accelerations corresponding to different frequencies.
Figure 8.
When R1=R2=100, Lin Guo's method for selecting the harvesting frequency is as follows: (a) The frequency of occurrence of natural frequencies across different branches where the corresponding acceleration exceeds 120 ms-2. (b) The mean acceleration corresponding to different natural frequencies. (c) The coefficient of variation of acceleration corresponding to different frequencies.
Disclaimer/Publisher’s Note: The statements, opinions and data contained in all publications are solely those of the individual author(s) and contributor(s) and not of MDPI and/or the editor(s). MDPI and/or the editor(s) disclaim responsibility for any injury to people or property resulting from any ideas, methods, instructions or products referred to in the content. |
© 2023 by the authors. Licensee MDPI, Basel, Switzerland. This article is an open access article distributed under the terms and conditions of the Creative Commons Attribution (CC BY) license (http://creativecommons.org/licenses/by/4.0/).
Copyright: This open access article is published under a Creative Commons CC BY 4.0 license, which permit the free download, distribution, and reuse, provided that the author and preprint are cited in any reuse.


