Submitted:
30 November 2023
Posted:
01 December 2023
Read the latest preprint version here
Abstract
In Southeast Asia, the incidence of Leukemia, a malignant blood cancer originating from hema-topoietic progenitor cells, is on the rise, marked by a concerning 54% mortality rate. This study focuses on enhancing early-stage prediction to improve patient recovery prospects significantly. Leveraging Machine Learning and Data Science, we employ protein sequential data from frequently mutated genes such as BCL2, HSP90, PARP, and RB to predict Chronic Myeloid Leukemia (CML). Our approach relies on robust feature extraction techniques, namely Di-peptide Composition (DPC), Amino Acid Composition (AAC), and Pseudo amino acid composition (Pse-AAC), with prior attention to addressing outliers and validating feature selection through the Pearson Corre-lation Coefficient. Data augmentation ensures a well-rounded dataset for analysis. Employing a range of Machine Learning models, including Support Vector Machine (SVM), XGBoost, Random Forest (RF), K Nearest Neighbor (KNN), Decision Tree (DT), and Logistic Regression (LR), we achieve accuracy rates spanning from 66% to 94%. These classifiers undergo comprehensive as-sessment using performance metrics such as accuracy, sensitivity, specificity, F1-score, and the confusion matrix. Our proposed solution, encompassing a user-friendly web application dashboard, presents an invaluable tool for early CML diagnosis with profound implications for practitioners, offering a deploy-able asset within healthcare institutions and hospitals.
Keywords:
Protein Sequences
; Pseudo-AAC
; AAC
; Dipeptide-C
; Machine Learning Classifiers
; Chronic Myeloid Leukemia
; Blood Cancer
1. Introduction
The Leukemia is a complex medical condition influenced by genetic regulation in the production of blood cells. When hematopoietic precursor cells turn malignant [1], it gives rise to abnormal cell growth due to alterations in DNA and RNA sequences. This transformation results in the infiltration of healthy cells by malignant ones, thus causing Leukemia. The illness primarily entails the uncontrolled proliferation of spe-cific types of White Blood Cells (WBC) i.e., neutrophils, basophils, and eosinophils, while lymphocytes remain unaffected. Acute myeloid Leukemia (AML), chronic mye-loid Leukemia (CML), acute lymphoblastic Leukemia (ALL), and chronic lymphocytic Leukemia (CLL) are some of the several kinds of Leukemia [2] (for Reference Figure 1). The only subject of our research is Chronic Myeloid Leukemia (CML).
Leukemia cancer presents a substantial health challenge due to the abnormal proliferation of White Blood Cells (WBC) [1]. While research has concentrated on detecting cancer through blood cell images, exploration of Protein Sequential data is limited. Leukemia diagnosis heavily relies on hematologists, posing limitations in regions with a scarcity of specialists. Mortality rates are on the rise particularly in South East Asia [3] creating a demand for an early detection approach.
The motivation for driving the proposed research arises from the observation that a plethora of research has been conducted on cancer predictions—such as lung cancer, liver cancer, colon cancer, ovarian cancer, etc.— utilizing MRI, CT scans, image processing techniques and protein sequences [4,5,6]. However, the realm of gene data in bio-informatics, especially within the context of Chronic Myeloid Leukemia (CML), remains relatively uncharted. At present, no AI-based Dashboard system predicts Leukemia based on protein sequences, but the development of such a system could revolutionize diagnosis, leading to saved lives and eased healthcare burdens. Collaborative efforts between Machine Learning and Data Science can establish a robust model for accessible and timely Leukemia solutions.
The proposed research suggests the utilization of Machine Learning-based techniques to identify genes that cause Leukemia through Protein Sequences, aiming for early detection and a reduction in the mortality rate. This undertaking could emerge as a flagship initiative in health sciences, addressing the shortage of specialized hematologists. Implementation of the system would result in timely interventions and improved recovery prospects. Automation of certain diagnostic processes could ease the load on specialists and enhance healthcare services. The potential impact goes beyond Leukemia diagnosis, garnering recognition and interest from the medical community. Overall, this AI-driven research holds immense promise in reshaping healthcare and propelling the advancement of AI applications.
As a consequence of this research, innovative insights and progress in predicting and comprehending CML could come to fruition. This might lead to more effective diagnostic and treatment methodologies, ultimately benefiting patients and healthcare systems. Furthermore, the successful integration of bio-informatics and AI could pave the way for pioneering applications and further interdisciplinary research at the intersection of these two promising domains.
The main contribution of our proposed research is as follows:
- The current study focuses on protein sequential data rather than image data.
- The most frequently mutated genes were discovered through a literature review that was responsible for chronic myeloid Leukemia.
- Datasets were formulated from the most frequently muted gene data.
- Features were extracted through physicochemical properties of Amino Acid composition, Pseudo Amino Acid Composition, and di-peptide composition.
- The study focuses on enhancing early-stage prediction to improve patient recovery prospects significantly.
- Our proposed solution encompasses a user-friendly web application dashboard that presents an invaluable tool for early CML diagnosis, offering a deploy-able asset within healthcare institutions and hospitals.
This paper follows a structured format that aims to provide a comprehensive understanding of the research. Section 1, ’Introduction,’ outlines the problem statement. Section 2, ’Literature Review,’ discusses related research, positioning our study in the existing body of knowledge. Section 3, ’Materials and Methods,’ details the dataset creation process and experimental techniques. Section 4, ’Development of Individual Classifiers,’ presents our methodology and analysis. Section 5, ’Results and Discussion,’ succinctly interprets the findings. Lastly, in Section 6, we offer a conclusion that summarizes our contributions and outlines future directions for this research.
2. Literature Review
This section discusses the recently conducted Leukemia research comprehensive-ly, with a focus on Protein Sequences, RNA, and blood cell imagery. It elaborates on the process of acquiring and forming the dataset, a pivotal role in creating standardized Leukemia datasets by utilizing protein sequences. Importantly, previous researchers have not combined these three distinct feature extraction techniques while implementing a user-friendly dashboard, as done in this study.
In [7], the Random Forest model was employed to diagnose the cancerous growth of White Blood Cells and its specific variants, achieving an accuracy of 94.3%. In the research by [8], the classifier was evaluated using 60 photos, demonstrating that models like K-nearest neighbors and Naive Bayes Classifier could identify ALL with an accuracy of 92.8%. According to research [9], the ABC-BPNN scheme and Principal Component Analysis (PCA) were used to classify Leukemia cells with an average accuracy of 98.72% while also speeding up the calculation.
In reference [10], the primary objective of the investigation was the identification of the Leukemia sub-type, specifically ALL. The process involved BSA-based clustering in segregating Leukemia images, followed by the utilization of the Jaya approach in combination with various advanced classification algorithms, including decision tree (DT), (KNN) K-nearest neighbor, (NB) Naive Bayes, (SVM) support vector machine, linear discriminant analysis and ensemble random under-sampling boost. Notably, the Jaya approach, in tandem with decision tree and SVM exhibited superior accuracy. The SVM model was used in research [11] to identify ALL, with an accuracy rate of 89.81%. The dataset was used in [12] to classify ALL using the K-nearest neighbor method, with a 96.25% accuracy rate. In study [13], the exploration centered around the use of ML algorithms to analyze gene expression patterns derived from RNA sequencing (RNA-seq) for accurately predicting the likelihood of CR in pediatric AML patient’s post-induction therapy
Research [14] focused on analyzing RNA-seq data of extracellular vesicles (EV) from healthy individuals and colon cancer patients. The objective was to develop models for predicting and classifying different stages of colon cancer. Five canonical ML and Deep Learning (DL) classifiers were employed, resulting in accuracy of 94.6% for K-nearest neighbor, 97.33% for Random Forest, 93% for LMT, and 92% for Random Tree. In [15], the early diagnosis and distinction between types of lung cancers i.e, Non-Small Cell Lung Cancer) & (Small Cell Lung Cancer were highlighted as crucial for improving patient survival rates. The proposed diagnostic system utilized sequence-derived structural and physicochemical attributes of proteins associated with tumor types, employing feature extraction, selection, and prediction models.
In the study conducted by [16], i], introduced a stacking classifier algorithm addressing CTS selection criteria through feature-encoding techniques, generating feature vectors that encompass k-mer nucleotide composition, dinucleotide composition, pseudo-nucleotide composition, and sequence order coupling. This innovative stacking classifier algorithm outperformed previous state-of-the-art algorithms in predicting functional miRNA targets, achieving an accuracy of 79.77%.
In the study [17], Using Next Generation Sequencing (NGS) and targeted RNA sequencing along with a machine learning approach, Albitar et al. investigated the potential of discovering new biomarkers that can predict Acute graft-vs.-host disease (aGVHD). In the study [18], Using Chou’s Pseudo Amino Acid Composition (PseAAC) and statistical moments, Ahmad et al. predicted chronic myeloid Leukemia using protein sequences.
In the study [19], Using deep learning (DL), Jian et al. constructed a prediction model for transcription factor binding sites only from DNA original base sequences. Here, a DL method based on convolutions neural network (CNN) and long short-term memory (LSTM) was proposed to investigate four Leukemia categories from the perspective of transcription factor binding sites using four large non-redundant datasets for acute, chronic, myeloid, and lymphatic Leukemia, giving an average prediction accuracy of 75%.

Table 1.
A brid-eye view of Litrature.
| Reference | Data Set | Classifier | Classification | Accuracy |
|---|---|---|---|---|
| Mohamed et al. [7] | White Blood Cell Images | Random Forest | Detection of WBC Cancer | 94.3% |
| Kumar et al. [8] | Medical Images-ALL | K-mean clustering | Detection of Acute Lymphocytic Leukemia (ALL) | 92.8% |
| Sharma et al. [9] | Medical Images- Leukemia cells | ABC-BPNN and PCA | Classify Leukemia Cells | 98.72% |
| Moshavash et al. [11] | Blood Microscopic Images- Acute Leukemia | Support Vector Machine (SVM) | Classify Acute Lymphocytic Leukemia (ALL) | 89.81% |
| Gal et al. [13] | Gene expression patterns-RNA sequencing- AML | k-nearest neighbors algorithm (K-NN) | Predicting complete remission of AML | 84.2% |
| Bostanci et al. [14] | RNA sequences- Colon cancer | Random Forest | Prediction of colon cancer | 97.3% |
| Hosseinzadeh et al. [15] | Protein sequences-Lung tumor | Support Vector Machine (SVM) | Prediction of lung tumor types based on protein attributes | 82.0% |
| Dhakal et al. [16] | miRNA–mRNA interactions | Stacking-classifier algorithm | Predicting functional miRNA targets | 79.77% |
| Albitar et al. [17] | RNA sequences | Geometric Mean Naïve Bayesian | Bone Marrow based biomarker for predicting aGVHD | 93.0% |
| Ahmad et al. [18] | Protein Sequences | SVM,Random Forest, XGBoost | Prediction of Chronic Lymphocytic Leukemia using protein sequences | 97.09% |
| Jian et al. [19] | DNA sequences | Deep Learning (CNN & LSTM) | to investigate leukemia types from transcription factor binding sites | 75.0% |
3. Materials and Methods
The proposed research centers on the detection of leukemia, specifically targeting Chronic Myeloid Leukemia (CML), characterized by the neoplastic proliferation of White Blood Cells (WBCs) such as neutrophils, basophils, and eosinophils, while excluding lymphocytes. As previously mentioned, CML is linked to a heightened mortality rate due to its typical diagnosis at advanced stages, posing challenges for effective recovery. In response to this concern, our objective is to create a dashboard capable of identifying leukemia utilizing Protein Sequential data.
To achieve this goal, data related to leukemia cancer is collected and employed diverse machine learning algorithms including SVM [20,21], XG Boost, Random Forest [22,23], KNN [24,25], logistic regression, and decision tree, all of them are described comprehensively in a study review [26,27]. The accuracy of each algorithm will be evaluated and the one exhibiting the highest accuracy will be integrated into our system. Subsequently, this chosen algorithm will determine the presence or absence of cancer in an individual. In the final step, we serialized our model using tools such as pickle or joblib, enabling us to save the trained model alongside its associated data. These trained models are then incorporated into a Streamlit based dashboard, enhancing their user-friendly deployment in hospitals and other medical facilities (Figure 2).
3.1. Block Diagram
3.2. Dataset Collection
There are many genes involved in CML. Based on literature review, genes that are most often mutated i.e. BCL2, HSP90, PARP and RB were utilized for CML [20]. Moreover, by maintaining 0.6 as the cutoff level, the homologous samples were eliminated [22]. HSP90, functions as a chaperone protein, playing a crucial role in protein folding and degradation processes. Its up-regulation has been identified in various cancer types, including chronic myeloid leukemia (CML). Extensive research has demonstrated that inhibiting HSP90 can attenuate the growth of CML cells and enhance their susceptibility to chemotherapy and tyrosine kinase inhibitors (TKIs) [28,29]. PARP (Poly ADP-ribose polymerase) is an essential enzyme involved in DNA re-pair processes. Inhibiting PARP has demonstrated effectiveness in the treatment of cancers with BRCA mutations, and there is emerging evidence suggesting its potential applicability in managing chronic myeloid leukemia (CML) [30,31].
The BCL2 (B-cell lymphoma 2) protein family plays a crucial role in regulating programmed cell death, known as apoptosis. Elevated levels of BCL2 have been linked to resistance to chemo-therapy in chronic myeloid leukemia (CML) cells. Studies have demonstrated that inhibiting BCL2 can reinstate apoptosis in CML cells and boost the effectiveness of tyro-sine kinase inhibitors (TKIs) [32,33]. RB (Retinoblastoma) is a pivotal tumor suppressor gene involved in the regulation of cell cycle progression. The deactivation of RB is a prevalent characteristic in CML, and research has established that its reactivation can impede the proliferation of CML cells [34,35]. The FASTA file format was used to ex-tract the CML-related protein sequences from the Universal Resource of Proteins (UniProtKb) [21,36]. A successful dataset was created as a result. The same amount of negative samples as positive samples were gathered for CML using the opposite query phrase to create a negative dataset. Consequently, the dataset created for CML is balanced (Figure 3).
3.2.1. Fasta Format
In bioinformatics, the fasta format is a popular text-based format for representing proteins. It is derived from the FASTA software suite and follows a specific structure. A FASTA sequence starts with a single line that serves as a description, and it is fol-lowed by lines containing the sequencing data [36]. The description line is distinguished from the sequence data by the presence of a greater-than symbol (">") in the first column. The term following the ">" sign is used to identify the sequence, while the rest of the line can be used for providing additional description, though both are optional.
3.2.2. Sample of Protein Sequence (HSP90)
Initially protein sequences contained redundant data, to remove the redundancy in the data, a benchmark method is used (if we remove redundancy without benchmark algorithm our data will not be valid and reliable so we must need to remove redundancy with the help of benchmark method) i.e. CD-Hit (Figure 4). CD-hit is an online clustered database that is used to remove the redundancy of the data by setting the thresh-old to 0.6 [37].
3.2.3. Sample of Protein Sequence (HSP90)
Initially protein sequences contained redundant data, to remove the redundancy in the data, a benchmark method is used (if we remove redundancy without benchmark algorithm our data will not be valid and reliable so we must need to remove redundancy with the help of benchmark method) i.e. CD-Hit (Figure 4). CD-hit is an online clustered database that is used to remove the redundancy of the data by setting the thresh-old to 0.6 [37].
3.3. Feature Extraction
This section elaborates the feature extraction techniques using physio-chemical properties of the protein sequences. The feature extraction techniques that is used in the proposed research are of three categories.
3.3.1. Amino Acid Composition
The presence of specific amino acids often in a protein sequence is highlighted by AAC characteristics [38,39]. The percentage frequency of an amino acid, AAC i,j, in the jth protein, is calculated using the formula below:
In Equation (1), n denotes the amount of amino acids type (I) found in proteins j while na,aj refers to the total amount of amino acids contained in a protein. The jth protein sequence in the AAC features dataset is represented as a 20-dimensional (20-D) feature vector as follows:
Where, demonstrates how amino acids are composed.
The technique of amino acid composition involves extracting features from our data, resulting in a 20-dimensional feature set. However, the problem with this approach lies in the limited usefulness of the features extracted. Despite employing various data science feature engineering approaches and conducting hyper-parameter tuning, the accuracy remains constrained. Consequently, this approach proves less efficacious in attaining the desired outcomes.
3.3.2. Pseudo Amino Acid Composition
A 25-dimensional feature set is produced by using the Pseudo Amino Acid Com-position (PAAC) approach to extract features from our data [40]. The remarkable fact is that the features extracted through this method prove to be highly valuable. By further applying data science methods and feature engineering techniques, accuracy significantly improves, reaching an impressive range of 91% to 93%. This achievement represents a remarkable success in our endeavors.
In Figure 5a,b, we have depicted how the data is affected before and after removing outliers. Additionally, we performed data augmentation on the dataset extracted using this method to increase accuracy. The graph will illustrate these enhancements.
3.3.3. Di-peptide Composition
Protein sequences with dipeptide characteristics are denoted by the letters AA, AC, AD, YV, YW, and YY. There are 400 components in these sequences. The DC feature of each component is determined as follows:
Where DC(i) represents the structure of dipeptide for . In vector form, this feature space is represented as: . The di-peptide composition is a technique that extracts features from our data, resulting in 400 dimensions or four hundred features. However, it became evident that not all of these features were essential. Through the application of data science methods and feature engineering, it is concluded that only 229 features out of the initial 400 were necessary. Surprisingly, after this selection process, the accuracy of our results significantly improved, reaching an impressive 91% to 93%. This outcome marks a great success. In graphs below, it is depicted that how the data is affected before and after removing outliers.
3.3.4. Data Augmentation
Data augmentation process is initiated by segregating our dataset into positive and negative segments. This entails isolating patients who have tested positive from those with negative results. Subsequently, a series of operations are executed that are designed to generate numerical replicas of the existing data, thereby augmenting the sample size. This augmentation serves the purpose of enhancing the machine learning algorithm’s training procedure, attributed to the increased abundance of data availa-ble. However, it’s important to note that during the creation of these numerical dupli-cates, the data undergoes a transformation, transitioning from its initial format into a list structure. Consequently, the modified data is transited from this list format into a data frame. This procedural sequence ultimately leads to reintegrate the transformed data, thereby completing the data augmentation process (Figure 6).
4. Development of Individual Classifiers
4.1. Support Vector Machine
By creating a hyperplane with the greatest distance between any two points, SVM classifies data [41]. SVM’s decision surface is as follow.
The Lagrange multiplier is in this equation. support vectors are the data samples that are correlated to > 0. The following strategy is used to determine the objective function for categorizing non-separable data
where =
Parameter C plays a crucial role in balancing the mis-classification of input train-ing instances and the complexity of the decision surface [42,43,44]. A lower value of this parameter results in a smoother decision boundary, while a higher value customizes the decision boundary to closely fit the input training data by using more training in-stances as support vectors. However, this could potentially result in decreased model performance when faced with unseen data. We selected the parameter such as, Kernel =”rbf”, Degree =8, C =10000, gamma =100000, probability = True.
4.2. Random Forest
This method generates a substantial quantity of decision trees, that are subsequently combined to arrive at a final decision. We employed this approach in the con-text of Leukemia classification due to its strong performance and ability to generalize effectively when dealing with high-dimensional input datasets. The training dataset serves as the foundation for constructing these trees. In Pseudo AAC Composition we performed data augmentation, so the size was quite heavy for training we selected 129,361 and for testing 86,228 samples were selected and we came up with best number of estimators Equation (10) i.e., n=50. In case of Dipeptide Composition, we selected 2536 for training and 845 for testing and n=150 estimators were giving optimal results
4.3. K-Nearest Neighbor (KNN)
The KNN algorithm is learned by observing samples [45,46]. Instance-based classifiers assume that the classification of unknown instances can be accomplished by comparing the unidentified instance to a known instance using a distance/similarity function [41,47,48]. If two instances are positioned far apart in the instance space, they are less likely to belong to the same class than three examples that are located close together. The calculation of the Euclidean distance (Equation (11), denoted as d(Xi, Xj), between two m-dimensional vectors Xi and Xj is as follows:
4.4. Naïve Bayes
Bayes rules represent this learning procedure, that is based on the notion of independent attributes/features. The Gaussian function to train the model with equal prior probabilities in the following manner:
Where
4.5. XGBoost
Gradient boosting, a boosting approach that significantly lowers errors by adding several classifiers to pre-existing models. One by one, these models are added until no more advancements are possible. The term "gradient boosting" refers to the method’s use of a gradient descent strategy to minimize loss. The steps involved in gradient boosting are as follows:
The multiplicative factor m is used to define the boosted model for each terminal node:
4.6. Logistic Regression
In categorical binary classification, a statistical machine learning approach called logistic regression is employed [49]. Logistic regression finds extensive use in various biological and social scientific applications. It is used to describe the connection between a dependent binary and one or more dependent variables of different levels in plainer language. The parameters we selected were C=10, tol = 0.1, penalty = L2.
where:
- is the probability of the target variable y being equal to 1 given the input features X
- is the vector of model parameters
- X is the vector of input features
5. Results and Discussion
5.1. Results on Pseudo Amino Acid Composition (Pse-AAC) Data
The findings of the matrices employed in the project Accuracy score, F1-score, recall [50,51] and specificity receptively on the data of Pse-AAC are displayed in the Table 2 below.
The Table 3 below discusses the results of each ML model w.r.t to the data used i.e. PAAC and shows the results of the some other matrices used in project which are Specificity and Confusion Matrix, by using this matrix we will have values of True positive, True Negative, False Positive and False Negative (Figure 7).
Now, we need to plot the ROC curve for each algorithm (Figure 8) using the PAAC data as mentioned earlier.
5.2. Accuracy Result on Amino Acid Composition (AAC) Data
The accuracy score, F1-score, recall score, and specificity receptively on the AAC data are the matrices employed in the research, and the outcomes are shown in the table below (Table 4).
The table below (Table 5) discusses the results of each ML model w.r.t to the data used i.e. PAAC and shows the results of the some other matrices used in project which are Specificity and Confusion Matrix, by using this matrix we will have values of True positive, True Negative, False Positive and False Negative.
Now, the ROC curve is plotted for each algorithm (Figure 9) using the AAC data as mentioned earlier.
5.3. Accuracy Results on Di-Peptide Composition (DPC)
The accuracy score, F1-score, and recall score matrices utilized in the research are represented in the table below along with their outcomes when applied to DPC data (Table 6).
In the table above (Table 6), each machine learning model’s performance is discussed in relation to the DPC data that was used, and the Specificity and Confusion Matrix results are also shown (Table 7). Using this matrix, we can obtain values for True Positive, True Negative, False Positive, and False Negative.
Now, the ROC curve is plotted for each algorithm (Figure 10) for each algorithm using the PAAC data as mentioned earlier.
5.4. Machine Learning Based Dashboard
In the below screenshot (Figure 11), is overview of dashboard which has been developed in streamlit where you can choose your desired model. Our dashboard is deployed on Streamlit Cloud. Within this system, dashboard users are required to upload patient records through the web application and select a specific model. They can then review the results to determine whether the individual is affected by leukemia or not.
Click on the browse button and select patient record from computer (Figure 12).
After uploading data you can have a view of data and prediction as well (Figure 13).
6. Conclusions
This research focuses on Chronic Myeloid Leukemia, a condition where the production of WBC, RBC, and Platelets is controlled by genes. However, mutations in DNA can lead to the production of the Philadelphia chromosome, which causes unnecessary neoplastic proliferation. As a result, normal cells become malignant and extensively involve the bone marrow.Numerous studies and research have been conducted to detect cancer using MRI and CT scan, but the research on Protein Sequential data in this area is relatively limited compared to other domains. By utilizing information from mutant genes, the research’s major goal is to build a new paradigm for the early prediction of Chronic Myeloid Leukemia (CML).
For this study, we focused on the most frequently mutated genes, namely BCL2, HSP90, PARP, and RB, that are associated with CML. The presence of unusual mutations in these genes is linked to CML cancer development. We were able to reach an amazing accuracy rate of 92–94% by implementing multiple data pre-processing approaches and feature extraction using physiochemical parameters, indicating a substantial success in our study project. At the end we developed a Dashboard that can be used in hospitals and healthcare institutions to predict CML in patients. This way, doctors can easily upload patient data to the website, and our system will swiftly provide accurate predictions.
Through extensive research and collaboration, it is aimed to establish seamless in-tegration with hospital workflows, ensuring efficient data exchange and analysis.we hope to have a substantial impact in the field of cancer diagnosis that ultimately save lives.
Expanding beyond CML, the project aims to create a multi-cancer detection system covering various leukemia types. The ultimate vision involves integrating AI and Bioinformatics with healthcare systems, providing affordable cancer detection in collaboration with hospitals. This initiative seeks to improve early detection rates, advance cancer diagnosis, and save lives through cutting-edge technology and research.
References
- Siegel, R.L.; Miller, K.D.; Fuchs, H.E.; Jemal, A.; others. Cancer statistics, 2021. Ca Cancer J Clin 2021, 71, 7–33. [Google Scholar] [CrossRef] [PubMed]
- Bibi, N.; Sikandar, M.; Ud Din, I.; Almogren, A.; Ali, S. IoMT-based automated detection and classification of leukemia using deep learning. Journal of healthcare engineering 2020, 2020, 1–12. [Google Scholar] [CrossRef]
- IAfRoC, I. Leukaemia Source: Globocan 2020 2020 [Available from: https://gco. iarc. fr/today/data/factsheets/cancers/36-Leukaemia-fact-sheet. pdf, 2022.
- Munteanu, C.R.; Magalhães, A.L.; Uriarte, E.; González-Díaz, H. Multi-target QPDR classification model for human breast and colon cancer-related proteins using star graph topological indices. Journal of theoretical biology 2009, 257, 303–311. [Google Scholar] [CrossRef]
- Ramani, R.G.; Jacob, S.G. Improved classification of lung cancer tumors based on structural and physicochemical properties of proteins using data mining models. PloS one 2013, 8, e58772. [Google Scholar] [CrossRef] [PubMed]
- Yang, J.Y.; Yoshihara, K.; Tanaka, K.; Hatae, M.; Masuzaki, H.; Itamochi, H.; Takano, M.; Ushijima, K.; Tanyi, J.L.; Coukos, G.; others. Predicting time to ovarian carcinoma recurrence using protein markers. The Journal of clinical investigation 2013, 123, 3740–3750. [Google Scholar] [CrossRef] [PubMed]
- Mohamed, H.; Omar, R.; Saeed, N.; Essam, A.; Ayman, N.; Mohiy, T.; AbdelRaouf, A. Automated detection of white blood cells cancer diseases. 2018 First international workshop on deep and representation learning (IWDRL). IEEE, 2018, pp. 48–54. [CrossRef]
- Kumar, S.; Mishra, S.; Asthana, P. ; Pragya. Automated detection of acute leukemia using k-mean clustering algorithm. Advances in Computer and Computational Sciences: Proceedings of ICCCCS 2016, Volume 2. Springer, 2018, pp. 655–670. [CrossRef]
- Sharma, R.; Kumar, R. A novel approach for the classification of leukemia using artificial bee colony optimization technique and back-propagation neural networks. Proceedings of 2nd International Conference on Communication, Computing and Networking: ICCCN 2018, NITTTR Chandigarh, India. Springer, 2019, pp. 685–694. [CrossRef]
- Jothi, G.; Inbarani, H.H.; Azar, A.T.; Devi, K.R. Rough set theory with Jaya optimization for acute lymphoblastic leukemia classification. Neural Computing and Applications 2019, 31, 5175–5194. [Google Scholar] [CrossRef]
- Moshavash, Z.; Danyali, H.; Helfroush, M.S. An automatic and robust decision support system for accurate acute leukemia diagnosis from blood microscopic images. Journal of digital imaging 2018, 31, 702–717. [Google Scholar] [CrossRef] [PubMed]
- Umamaheswari, D.; Geetha, S. A framework for efficient recognition and classification of acute lymphoblastic leukemia with a novel customized-KNN classifier. Journal of computing and information technology 2018, 26, 131–140. [Google Scholar] [CrossRef]
- Gal, O.; Auslander, N.; Fan, Y.; Meerzaman, D. Predicting complete remission of acute myeloid leukemia: machine learning applied to gene expression. Cancer informatics 2019, 18, 1176935119835544. [Google Scholar] [CrossRef] [PubMed]
- Bostanci, E.; Kocak, E.; Unal, M.; Guzel, M.S.; Acici, K.; Asuroglu, T. Machine learning analysis of RNA-seq data for diagnostic and prognostic prediction of colon cancer. Sensors 2023, 23, 3080. [Google Scholar] [CrossRef] [PubMed]
- Hosseinzadeh, F.; KayvanJoo, A.H.; Ebrahimi, M.; Goliaei, B. Prediction of lung tumor types based on protein attributes by machine learning algorithms. SpringerPlus 2013, 2, 1–14. [Google Scholar] [CrossRef] [PubMed]
- Dhakal, P.; Tayara, H.; Chong, K.T. An ensemble of stacking classifiers for improved prediction of miRNA–mRNA interactions. Computers in Biology and Medicine 2023, 164, 107242. [Google Scholar] [CrossRef] [PubMed]
- Albitar, M.; Zhang, H.; Pecora, A.L.; Ip, A.; Goy, A.H.; Antzoulatos, S.; De Dios, I.; Ma, W.; Kaur, S.; Suh, H.C.; others. Bone Marrow-Based Biomarkers for Predicting aGVHD Using Targeted RNA Next Generation Sequencing and Machine Learning. Blood 2021, 138, 2892. [Google Scholar] [CrossRef]
- Ahmad, W.; Hameed, M.; Bilal, M.; Majid, A. ML-Pred-CLL: Machine Learning based prediction of Chronic Lymphocytic Leukemia using protein sequential data. 2022 International Conference on Recent Advances in Electrical Engineering & Computer Sciences (RAEE & CS). IEEE, 2022, pp. 1–7. [CrossRef]
- He, J.; Pu, X.; Li, M.; Li, C.; Guo, Y. Deep convolutional neural networks for predicting leukemia-related transcription factor binding sites from DNA sequence data. Chemometrics and Intelligent Laboratory Systems 2020, 199, 103976. [Google Scholar] [CrossRef]
- Rodríguez, D.; Bretones, G.; Quesada, V.; Villamor, N.; Arango, J.R.; López-Guillermo, A.; Ramsay, A.J.; Baumann, T.; Quirós, P.M.; Navarro, A.; Royo, C.; Martín-Subero, J.I.; Campo, E.; López-Otín, C. Mutations in CHD2 cause defective association with active chromatin in chronic lymphocytic leukemia. Blood 2015, 126, 195–202. [Google Scholar] [CrossRef]
- Apweiler, R.; Bairoch, A.; Wu, C.H.; Barker, W.C.; Boeckmann, B.; Ferro, S.; Gasteiger, E.; Huang, H.; Lopez, R.; Magrane, M.; others. UniProt: the universal protein knowledgebase. Nucleic acids research 2004, 32, D115–D119. [Google Scholar] [CrossRef] [PubMed]
- Fu, L.; Niu, B.; Zhu, Z.; Wu, S.; Li, W. CD-HIT: accelerated for clustering the next-generation sequencing data. Bioinformatics 2012, 28, 3150–3152. [Google Scholar] [CrossRef] [PubMed]
- Feng, P.M.; Lin, H.; Chen, W.; others. Identification of antioxidants from sequence information using naive Bayes. Computational and mathematical methods in medicine 2013, 2013. [Google Scholar] [CrossRef] [PubMed]
- Feng, P.M.; Ding, H.; Chen, W.; Lin, H.; others. Naive Bayes classifier with feature selection to identify phage virion proteins. Computational and mathematical methods in medicine 2013, 2013. [Google Scholar] [CrossRef] [PubMed]
- Jia, J.; Liu, Z.; Xiao, X.; Liu, B.; Chou, K.C. pSuc-Lys: predict lysine succinylation sites in proteins with PseAAC and ensemble random forest approach. Journal of theoretical biology 2016, 394, 223–230. [Google Scholar] [CrossRef] [PubMed]
- Lin, W.Z.; Fang, J.A.; Xiao, X.; Chou, K.C. iDNA-Prot: identification of DNA binding proteins using random forest with grey model. PloS one 2011, 6, e24756. [Google Scholar] [CrossRef] [PubMed]
- Qu, K.; Han, K.; Wu, S.; Wang, G.; Wei, L. Identification of DNA-binding proteins using mixed feature representation methods. Molecules 2017, 22, 1602. [Google Scholar] [CrossRef] [PubMed]
- Khajapeer, K.V.; Baskaran, R. Hsp90 inhibitors for the treatment of chronic myeloid leukemia. Leukemia research and treatment 2015, 2015. [Google Scholar] [CrossRef] [PubMed]
- Alves, R.; Santos, D.; Jorge, J.; Gonçalves, A.C.; Catarino, S.; Girão, H.; Melo, J.B.; Sarmento-Ribeiro, A.B. Alvespimycin Inhibits Heat Shock Protein 90 and Overcomes Imatinib Resistance in Chronic Myeloid Leukemia Cell Lines. Molecules 2023, 28, 1210. [Google Scholar] [CrossRef] [PubMed]
- Ellisen, L.W. PARP inhibitors in cancer therapy: promise, progress, and puzzles. Cancer cell 2011, 19, 165–167. [Google Scholar] [CrossRef] [PubMed]
- Liu, Y.; Song, H.; Song, H.; Feng, X.; Zhou, C.; Huo, Z. Targeting autophagy potentiates the anti-tumor effect of PARP inhibitor in pediatric chronic myeloid leukemia. AMB Express 2019, 9, 1–9. [Google Scholar] [CrossRef]
- Kaloni, D.; Diepstraten, S.T.; Strasser, A.; Kelly, G.L. BCL-2 protein family: Attractive targets for cancer therapy. Apoptosis 2023, 28, 20–38. [Google Scholar] [CrossRef] [PubMed]
- Ko, T.K.; Chuah, C.T.; Huang, J.W.; Ng, K.P.; Ong, S.T. The BCL2 inhibitor ABT-199 significantly enhances imatinib-induced cell death in chronic myeloid leukemia progenitors. Oncotarget 2014, 5, 9033. [Google Scholar] [CrossRef] [PubMed]
- Zhou, L.; Ng, D.S.C.; Yam, J.C.; Chen, L.J.; Tham, C.C.; Pang, C.P.; Chu, W.K. Post-translational modifications on the retinoblastoma protein. Journal of Biomedical Science 2022, 29, 1–16. [Google Scholar] [CrossRef]
- Yin, D.D.; Fan, F.Y.; Hu, X.B.; Hou, L.H.; Zhang, X.P.; Liu, L.; Liang, Y.M.; Han, H. Notch signaling inhibits the growth of the human chronic myeloid leukemia cell line K562. Leukemia research 2009, 33, 109–114. [Google Scholar] [CrossRef] [PubMed]
- Cai, Y.D.; Chou, K.C. Predicting subcellular localization of proteins in a hybridization space. Bioinformatics 2004, 20, 1151–1156. [Google Scholar] [CrossRef] [PubMed]
- Chou, K.C. Impacts of bioinformatics to medicinal chemistry. Medicinal chemistry 2015, 11, 218–234. [Google Scholar] [CrossRef] [PubMed]
- Chou, K.C. Prediction of protein cellular attributes using pseudo-amino acid composition. Proteins: Structure, Function, and Bioinformatics 2001, 43, 246–255. [Google Scholar] [CrossRef]
- Khan, Y.D.; Ahmad, F.; Anwar, M.W. A neuro-cognitive approach for iris recognition using back propagation. World Applied Sciences Journal 2012, 16, 678–685. [Google Scholar]
- of Clinical Oncology (ASCO), A.S. Genes and Cancer. Cancer.net 2023. [Google Scholar]
- Hart, P.E.; Stork, D.G.; Duda, R.O. Pattern classification; Wiley Hoboken, 2000.
- Khan, Y.D.; Ahmed, F.; Khan, S.A. Situation recognition using image moments and recurrent neural networks. Neural Computing and Applications 2014, 24, 1519–1529. [Google Scholar] [CrossRef]
- Butt, A.H.; Khan, S.A.; Jamil, H.; Rasool, N.; Khan, Y.D.; others. A prediction model for membrane proteins using moments based features. BioMed research international 2016, 2016. [Google Scholar] [CrossRef] [PubMed]
- Butt, A.H.; Rasool, N.; Khan, Y.D. A treatise to computational approaches towards prediction of membrane protein and its subtypes. The Journal of membrane biology 2017, 250, 55–76. [Google Scholar] [CrossRef] [PubMed]
- Khan, Y.D.; Khan, S.A.; Ahmad, F.; Islam, S.; others. Iris recognition using image moments and k-means algorithm. The Scientific World Journal 2014, 2014. [Google Scholar] [CrossRef]
- Sugiyama, M. Introduction to statistical machine learning; Morgan Kaufmann, 2015.
- Theodoridis, S. Machine learning: a Bayesian and optimization perspective; Academic press, 2015.
- Vapnik, V. The nature of statistical learning theory; Springer science & business media, 1999.
- Montesinos López, O.A.; Montesinos López, A.; Crossa, J. Multivariate statistical machine learning methods for genomic prediction; Springer Nature, 2022.
- Jiao, Y.; Du, P. Performance measures in evaluating machine learning based bioinformatics predictors for classifications. Quantitative Biology 2016, 4, 320–330. [Google Scholar] [CrossRef]
- Fawcett, T. ROC graphs: Notes and practical considerations for researchers. Machine learning 2004, 31, 1–38. [Google Scholar]
Figure 1.
Various stages of chronic Myeloid leukemia classification.
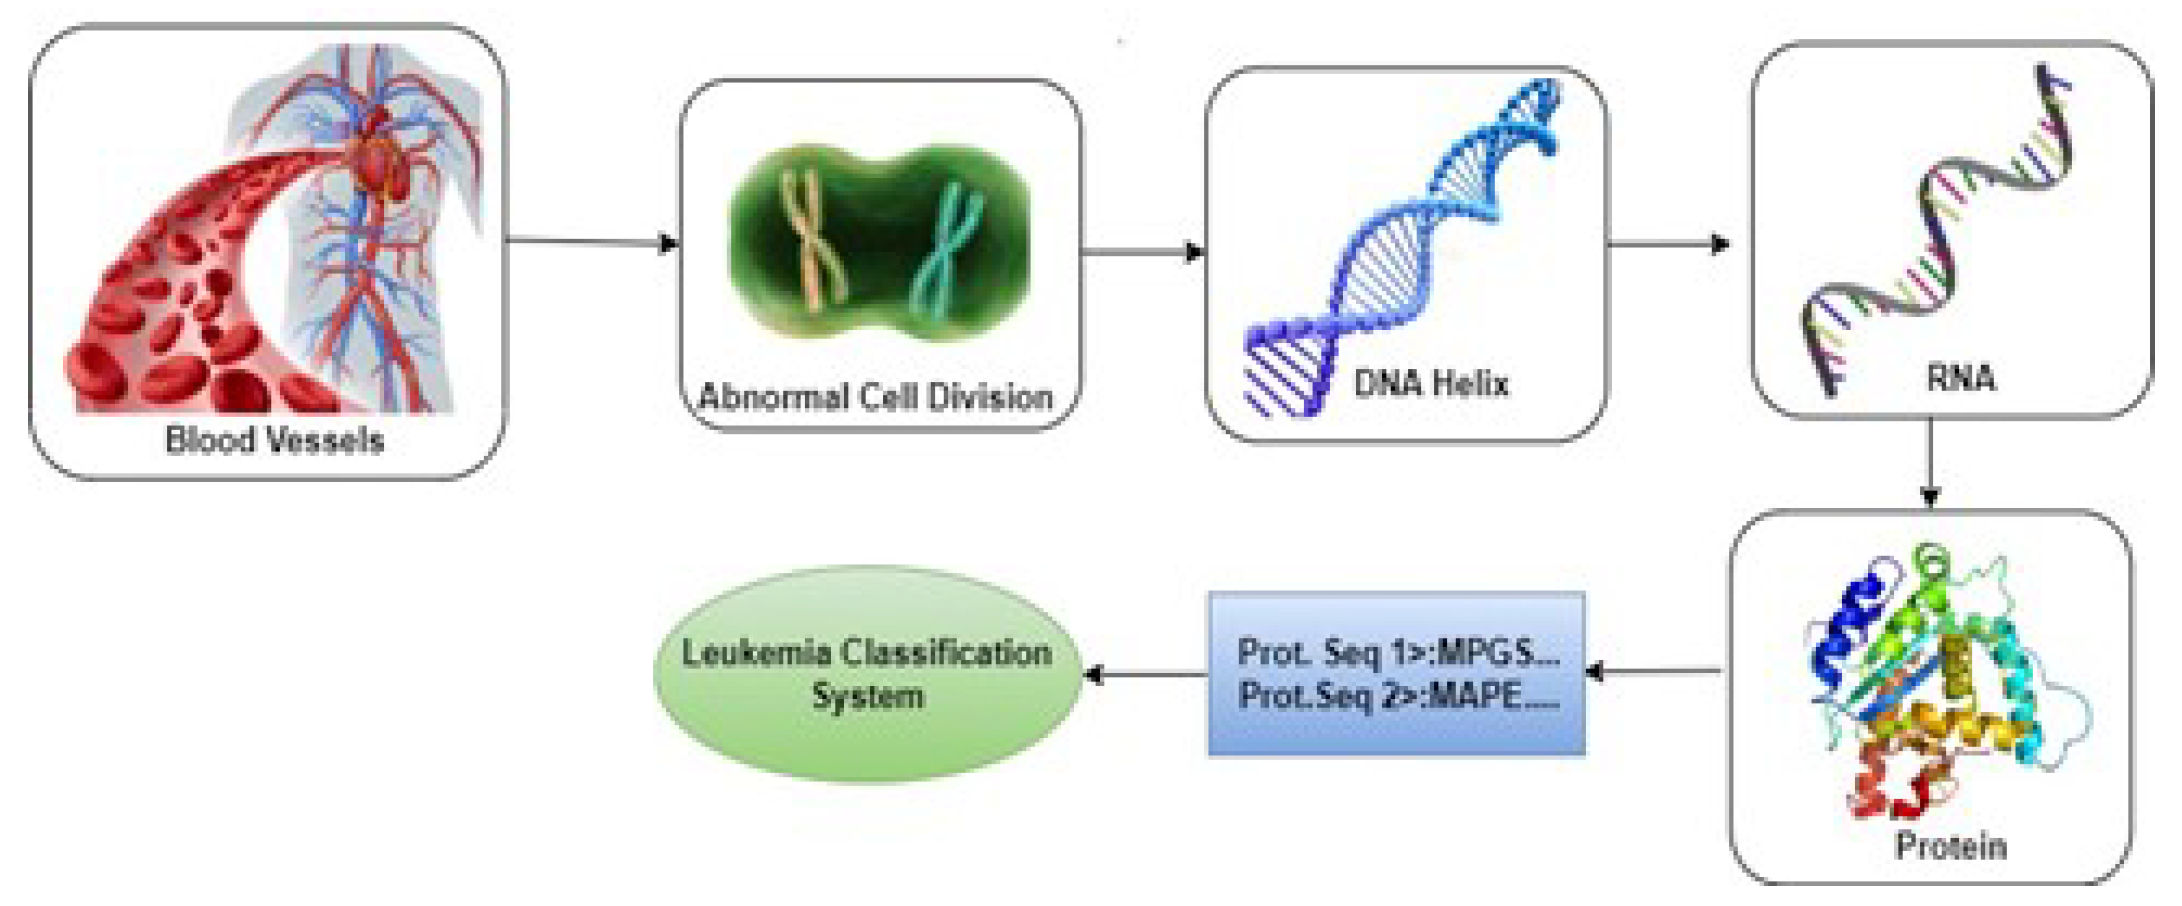
Figure 2.
Block Diagram of Designed System.
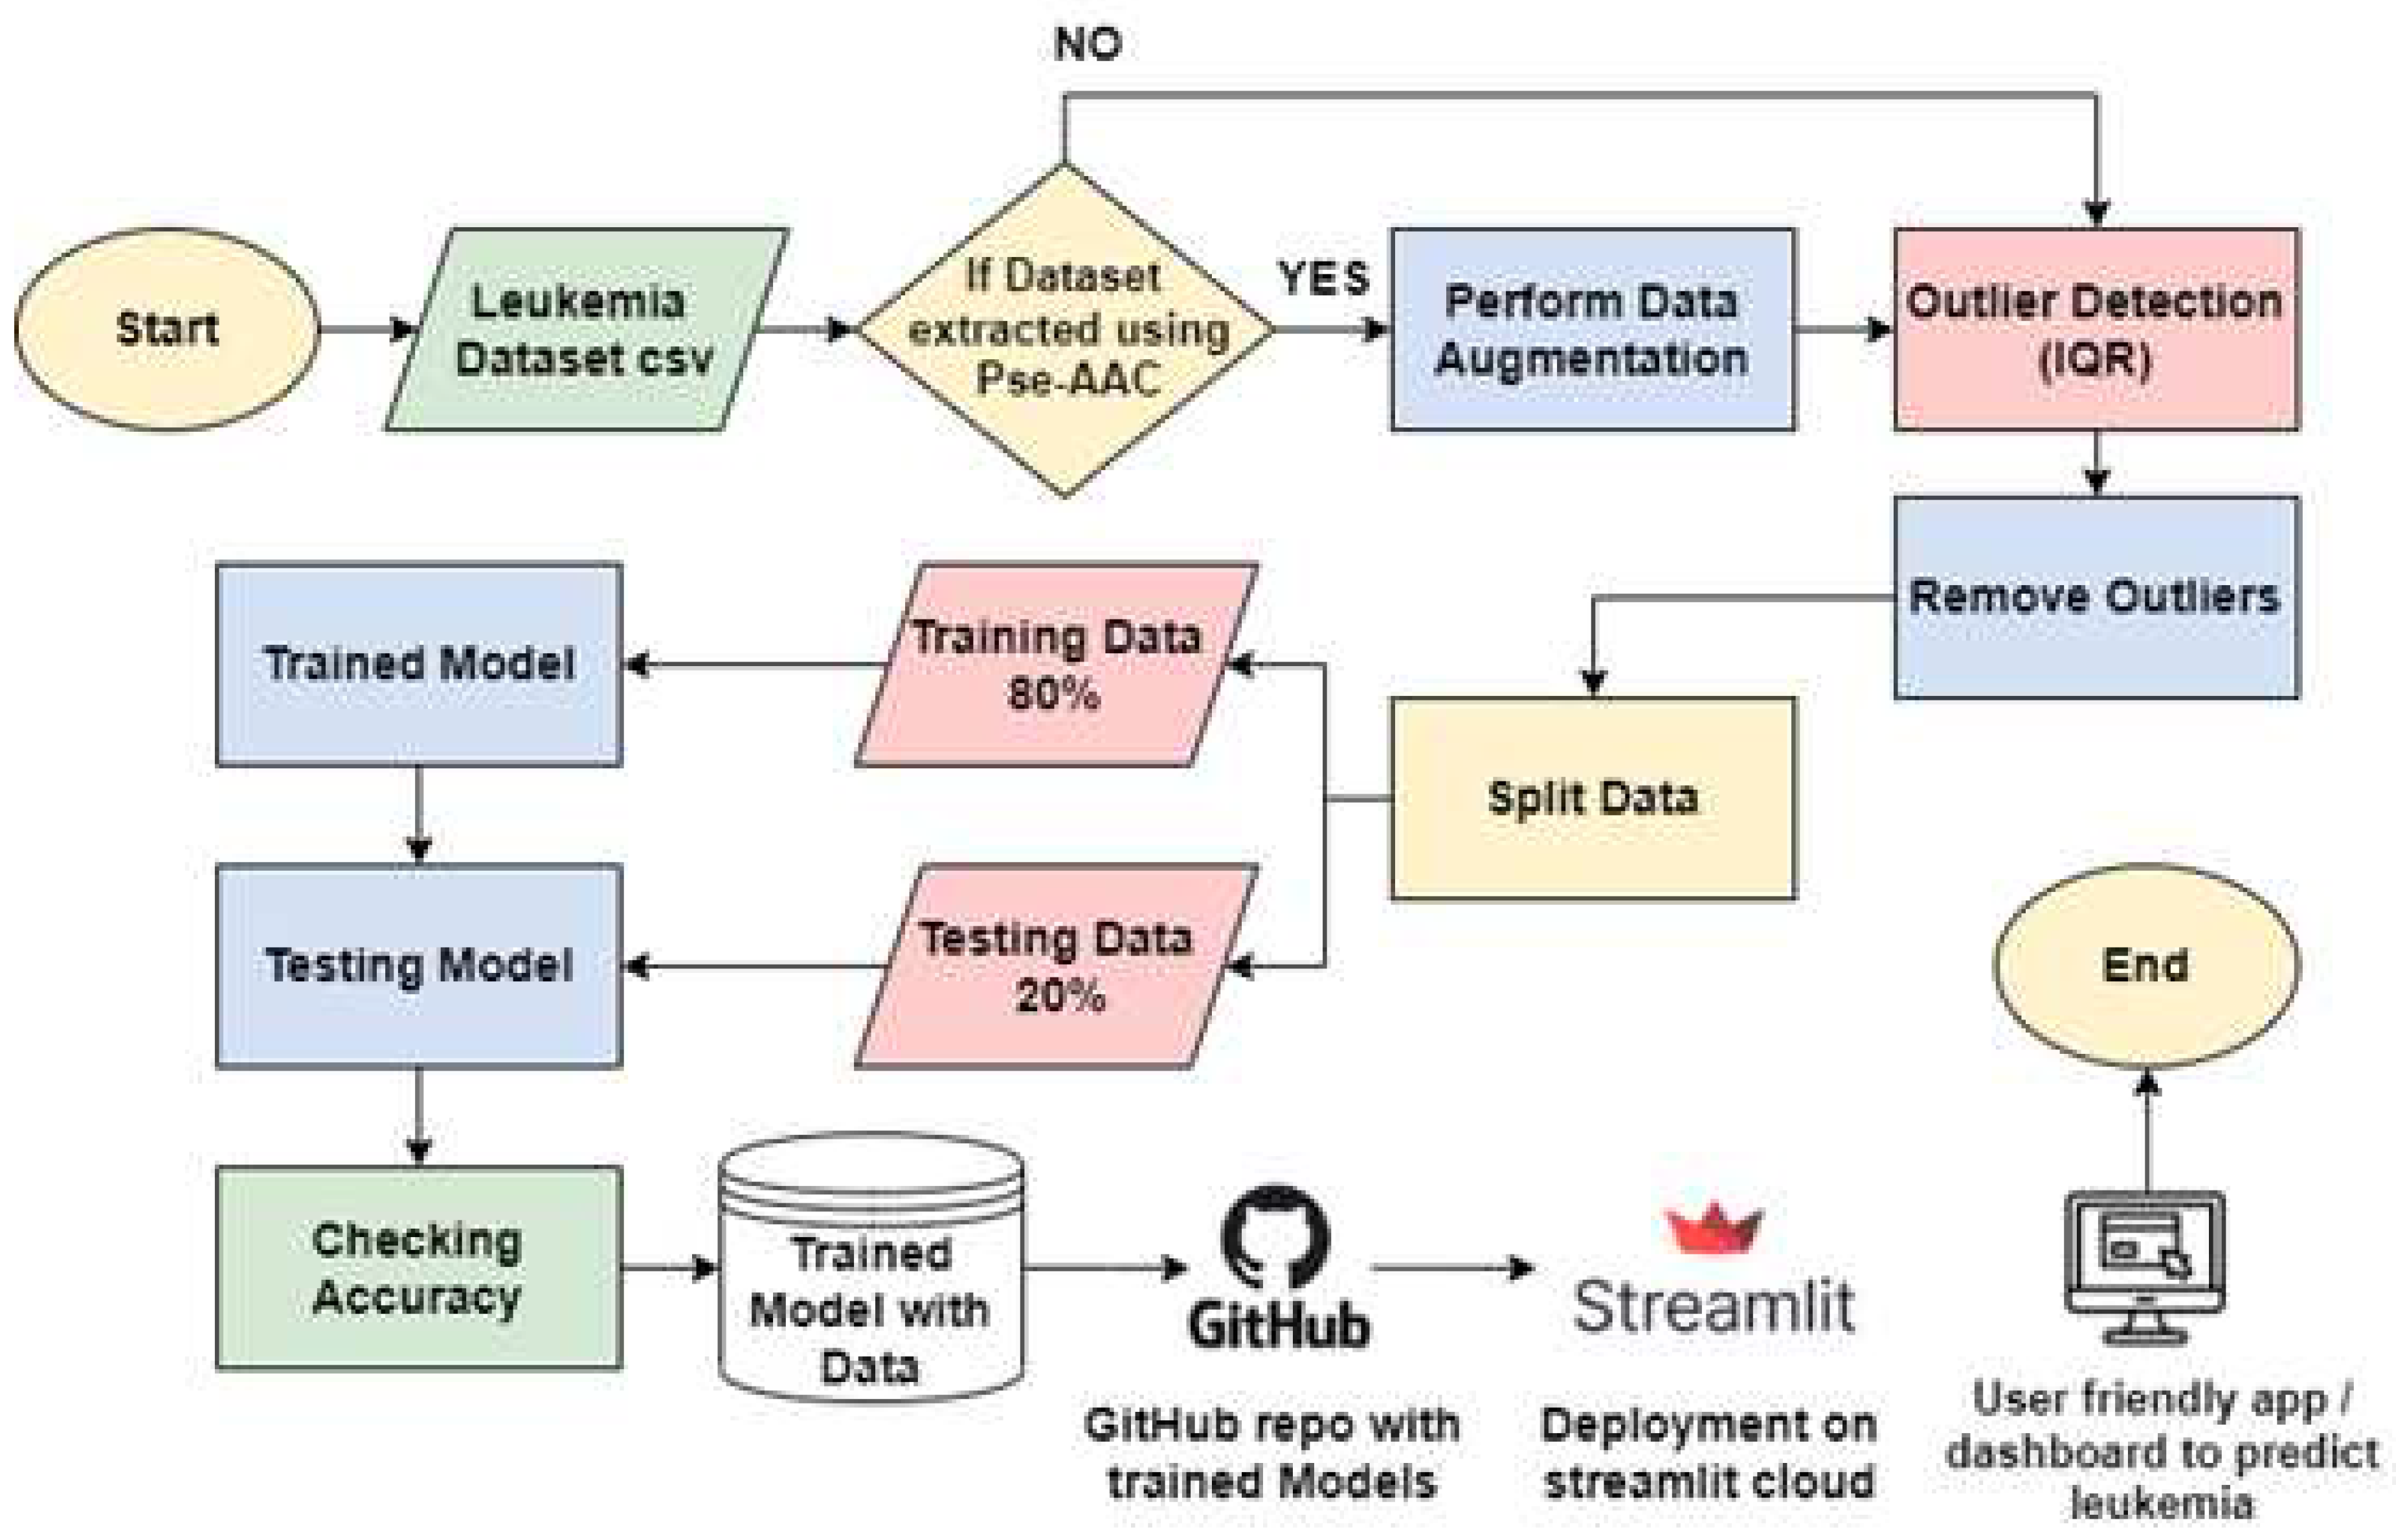
Figure 3.
Genes and Data Collection.
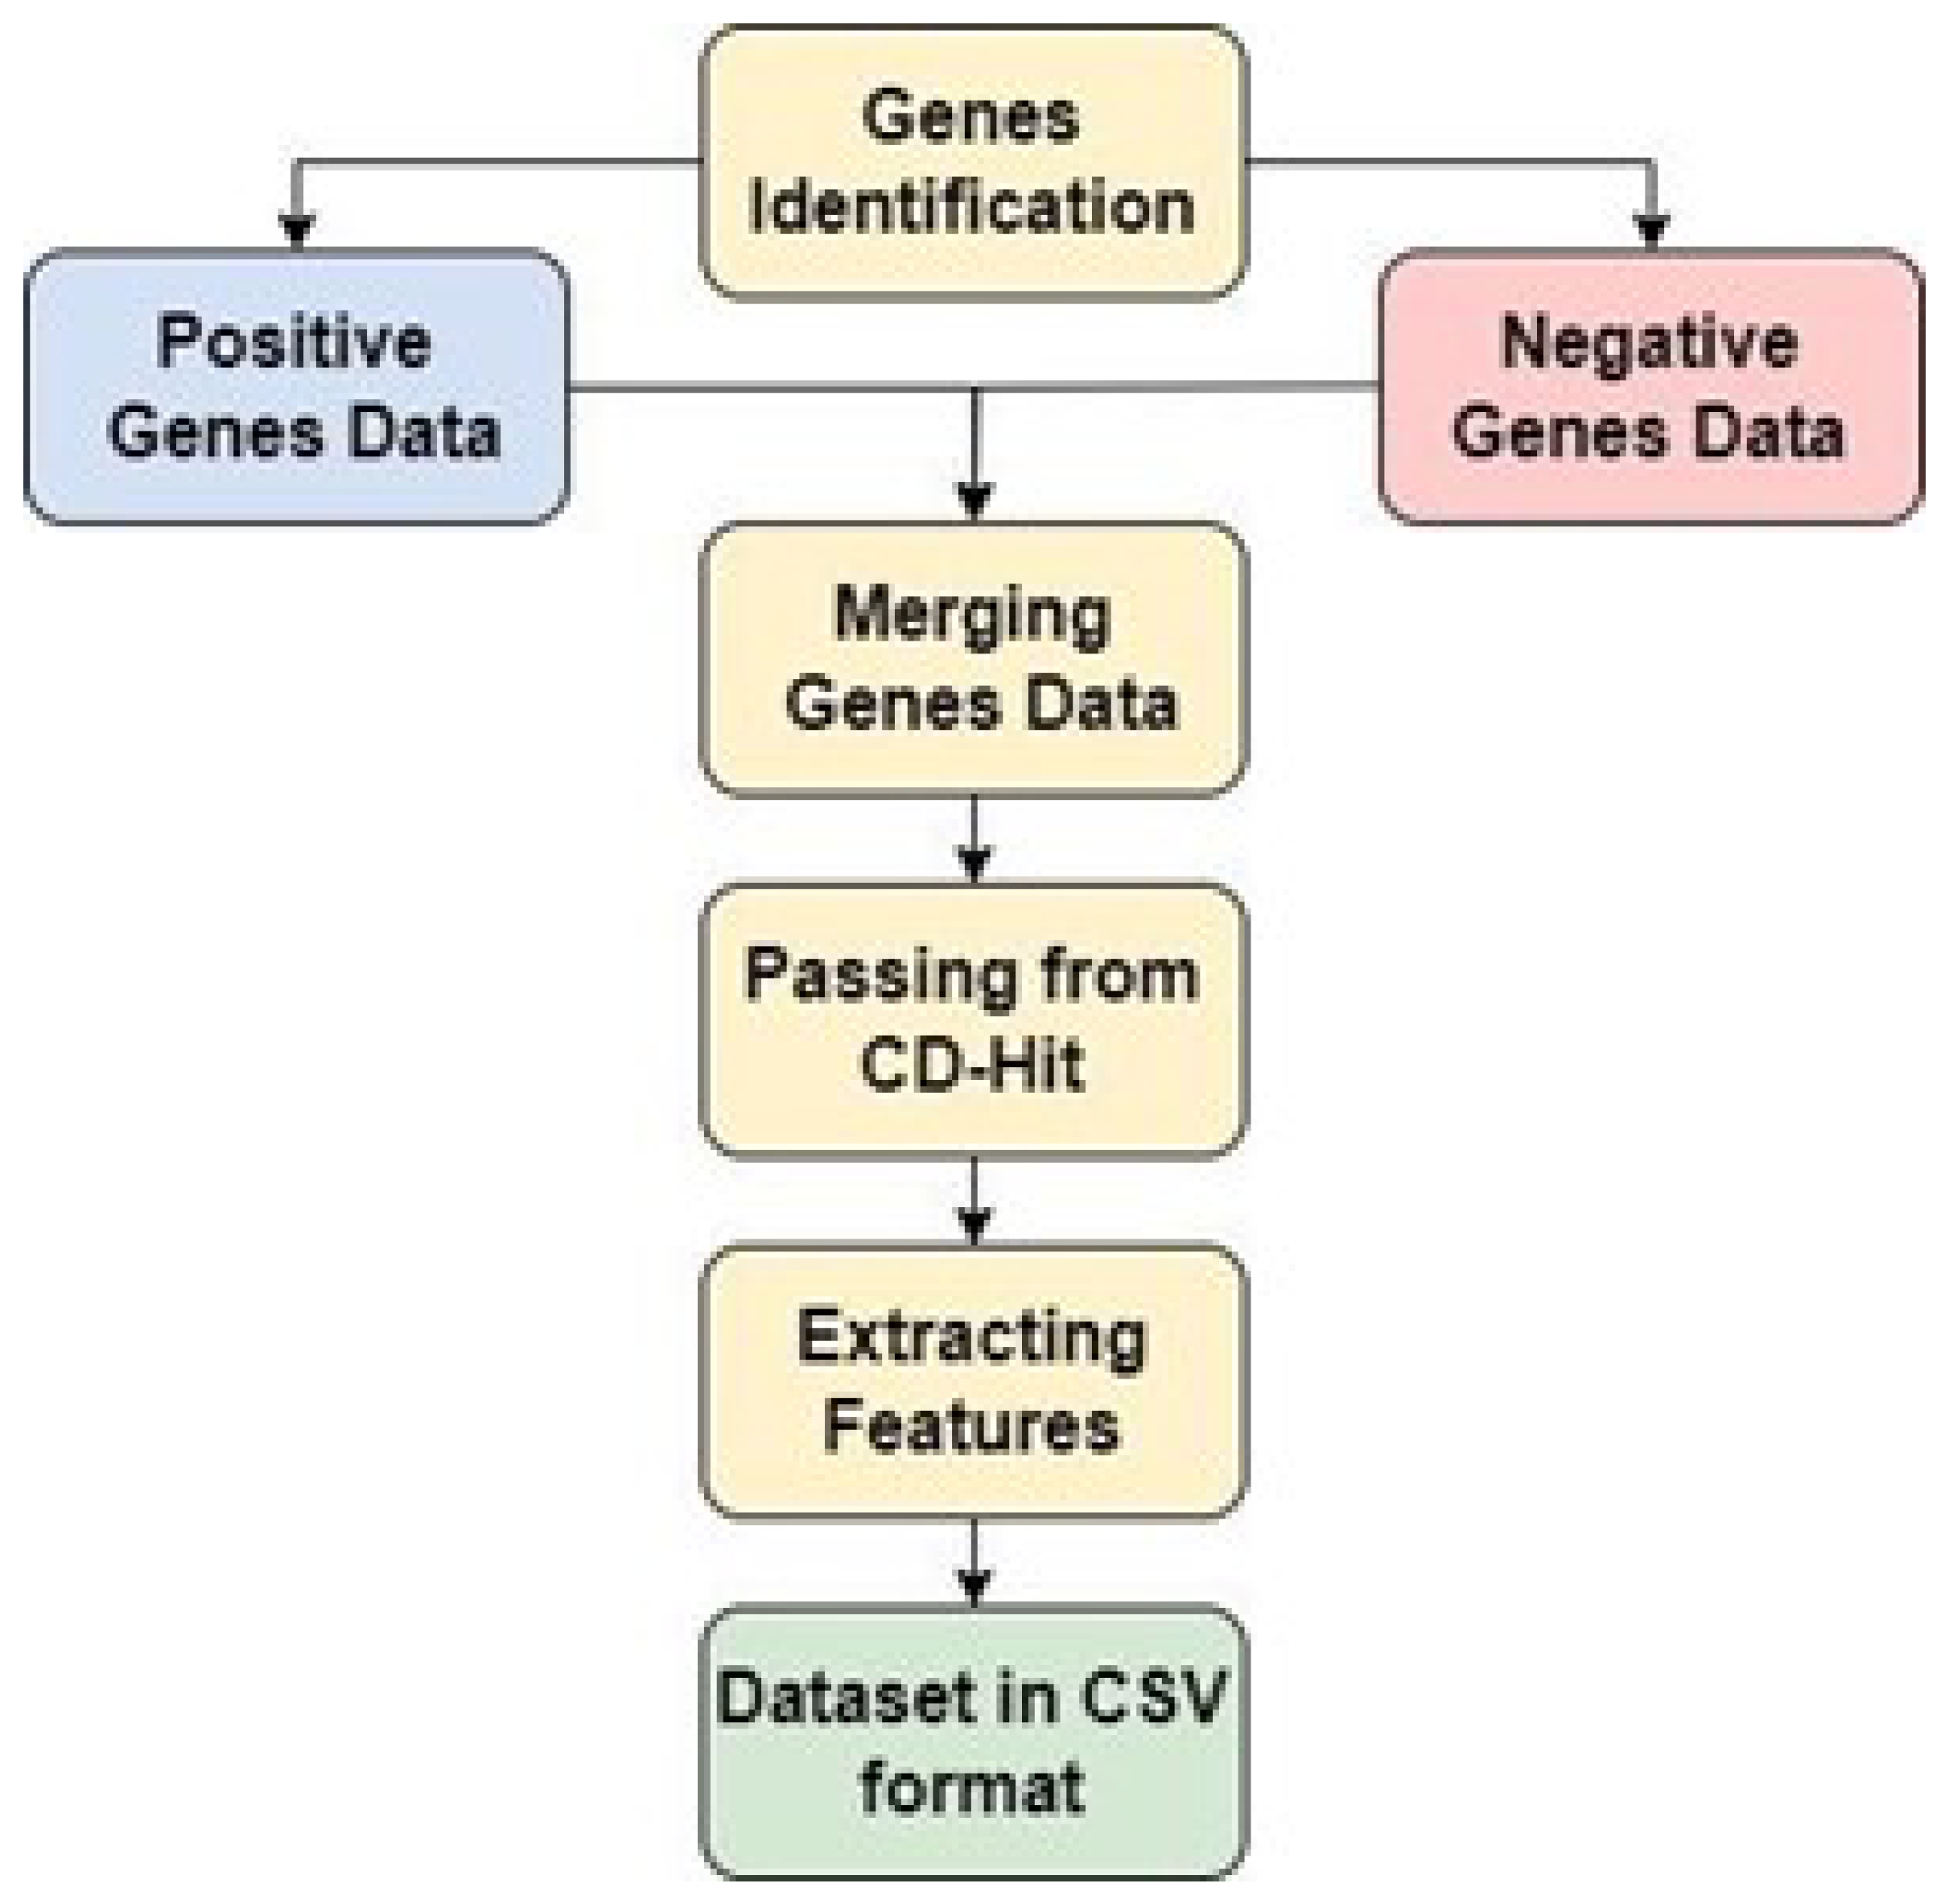
Figure 4.
gene sample.
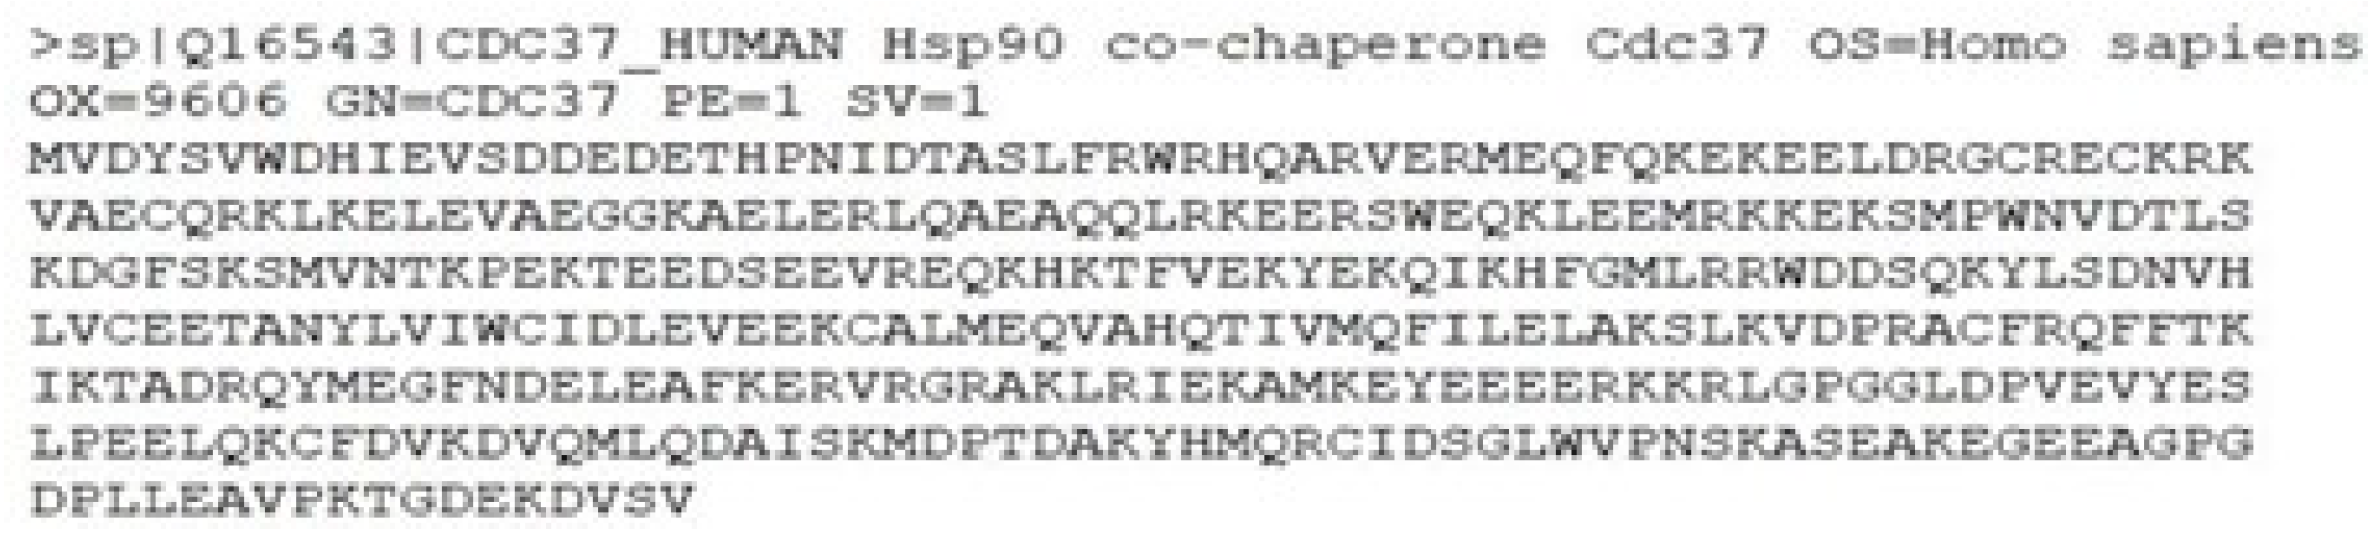
Figure 5.
Data before and after removing of Outliers
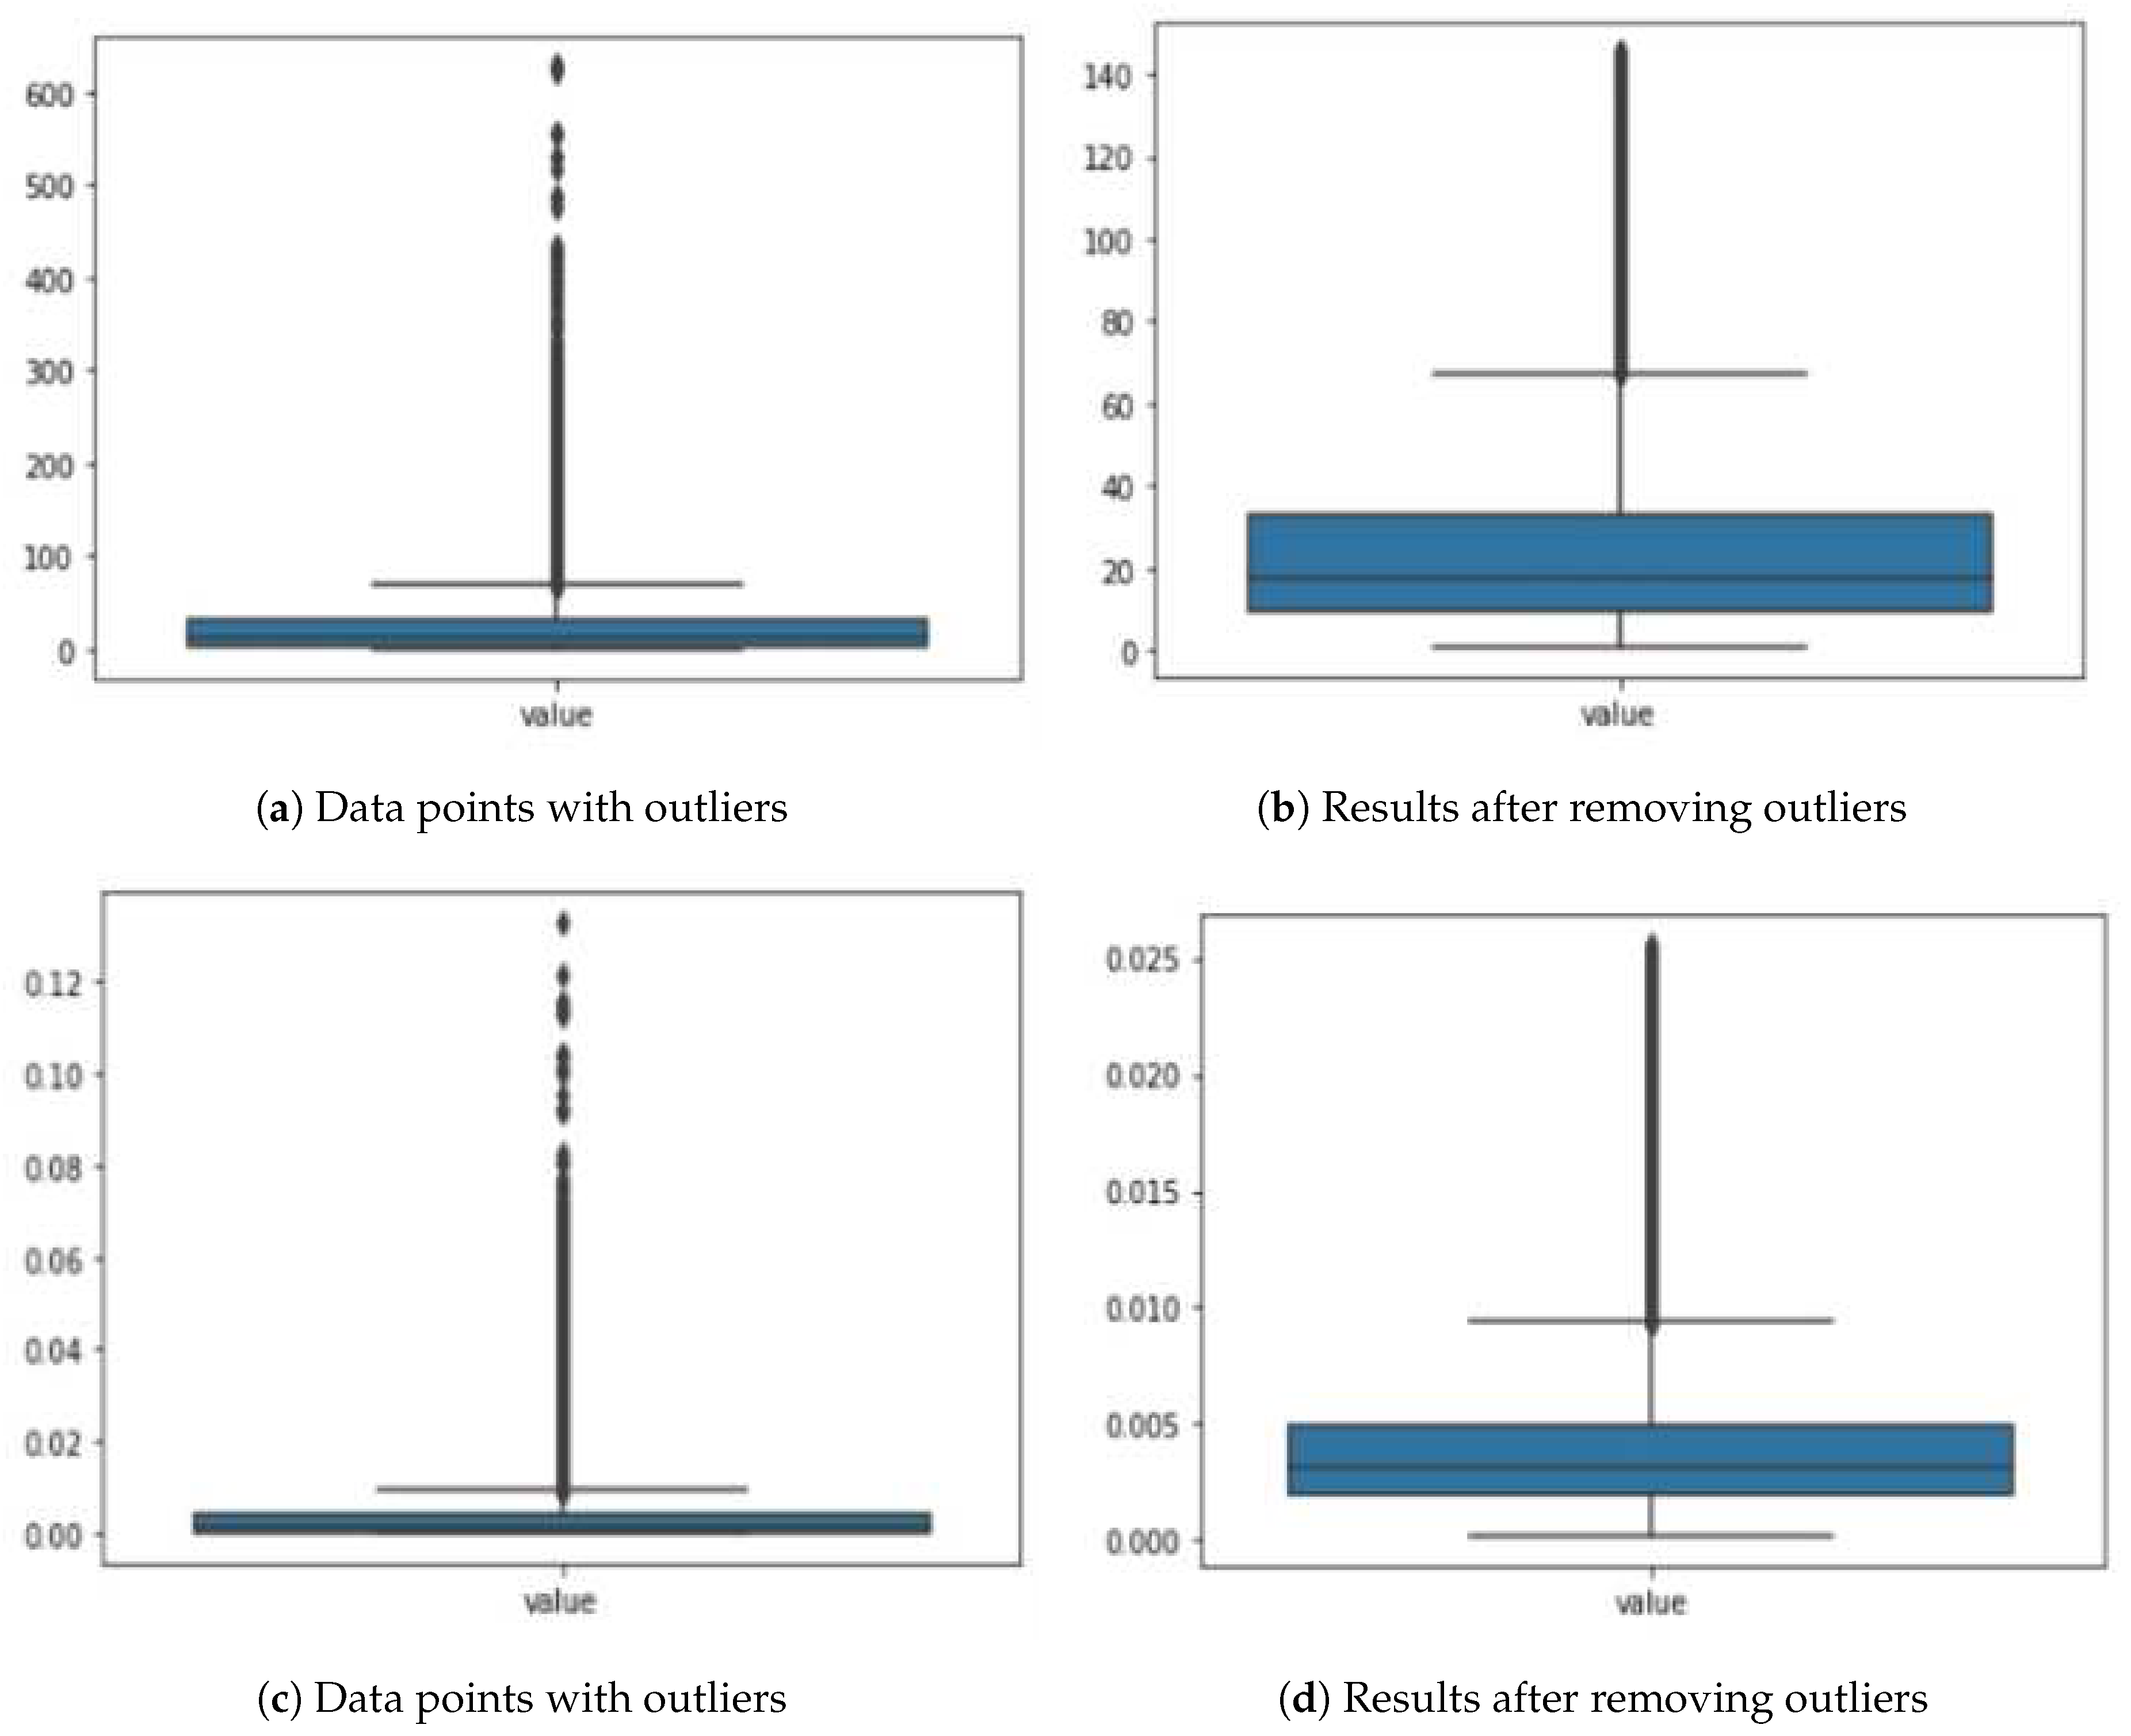
Figure 6.
Data Augmentation Procedure.
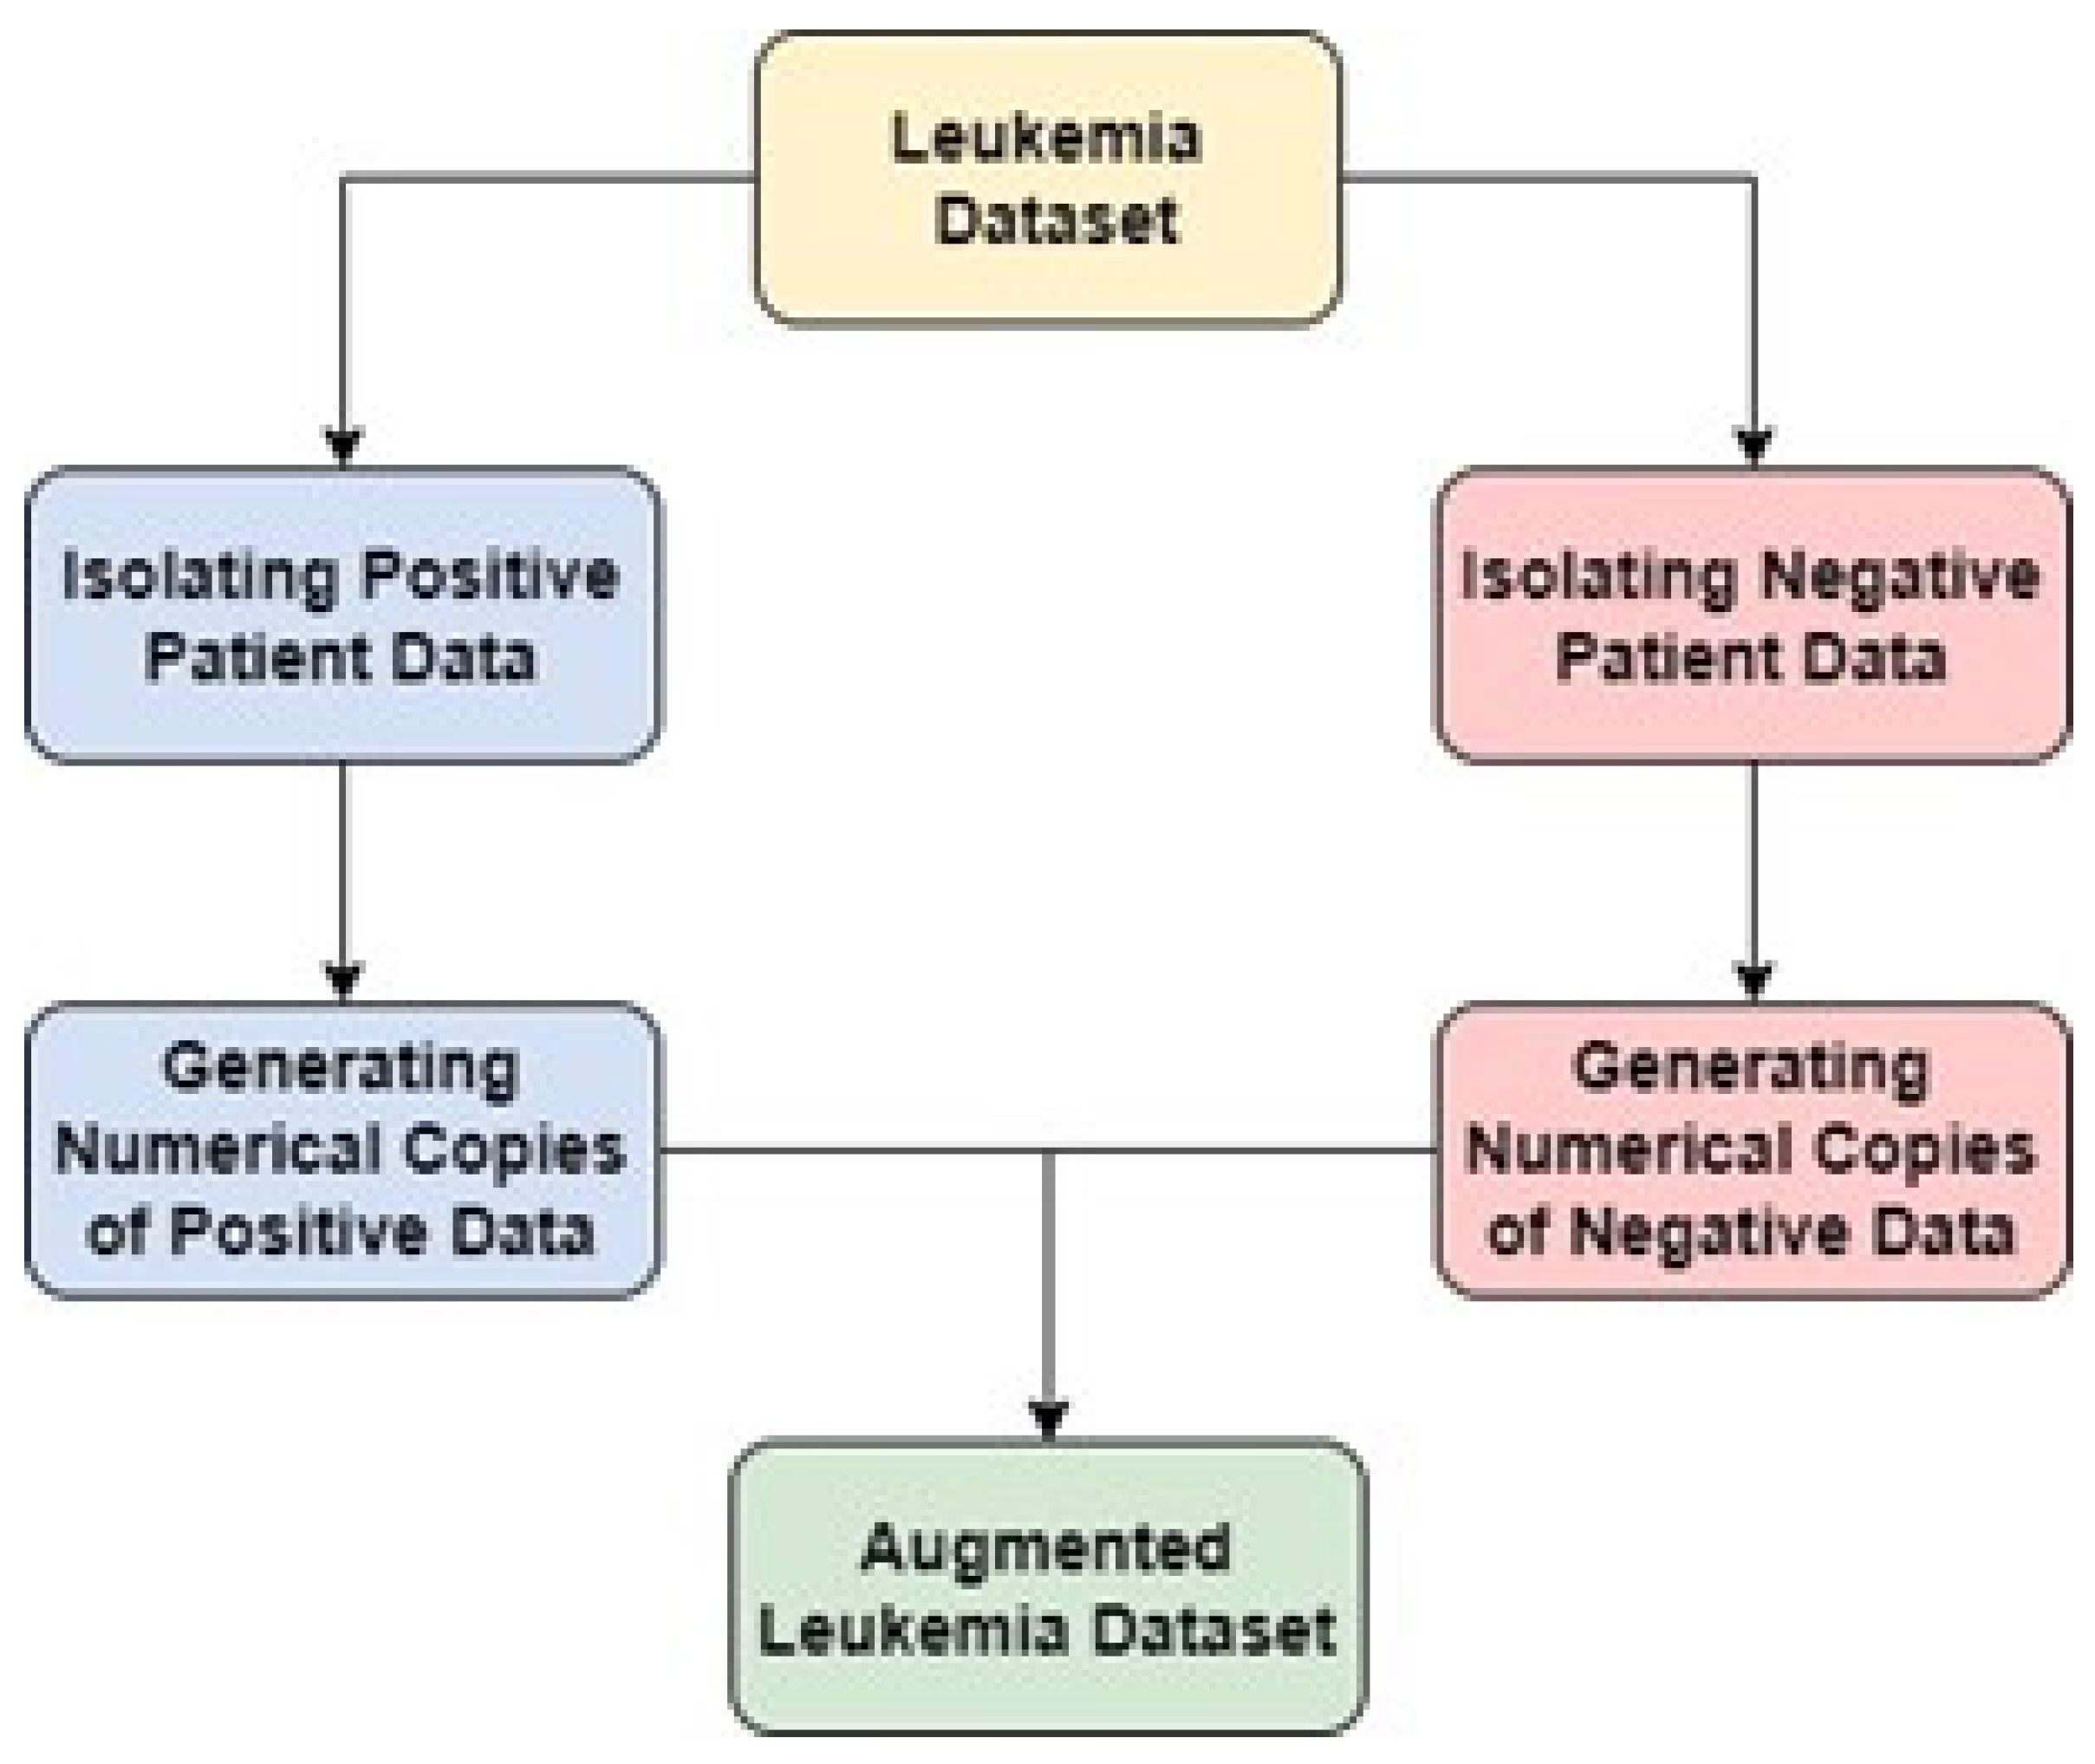
Figure 7.
Confusion Matrix of Table 3.
Figure 7.
Confusion Matrix of Table 3.
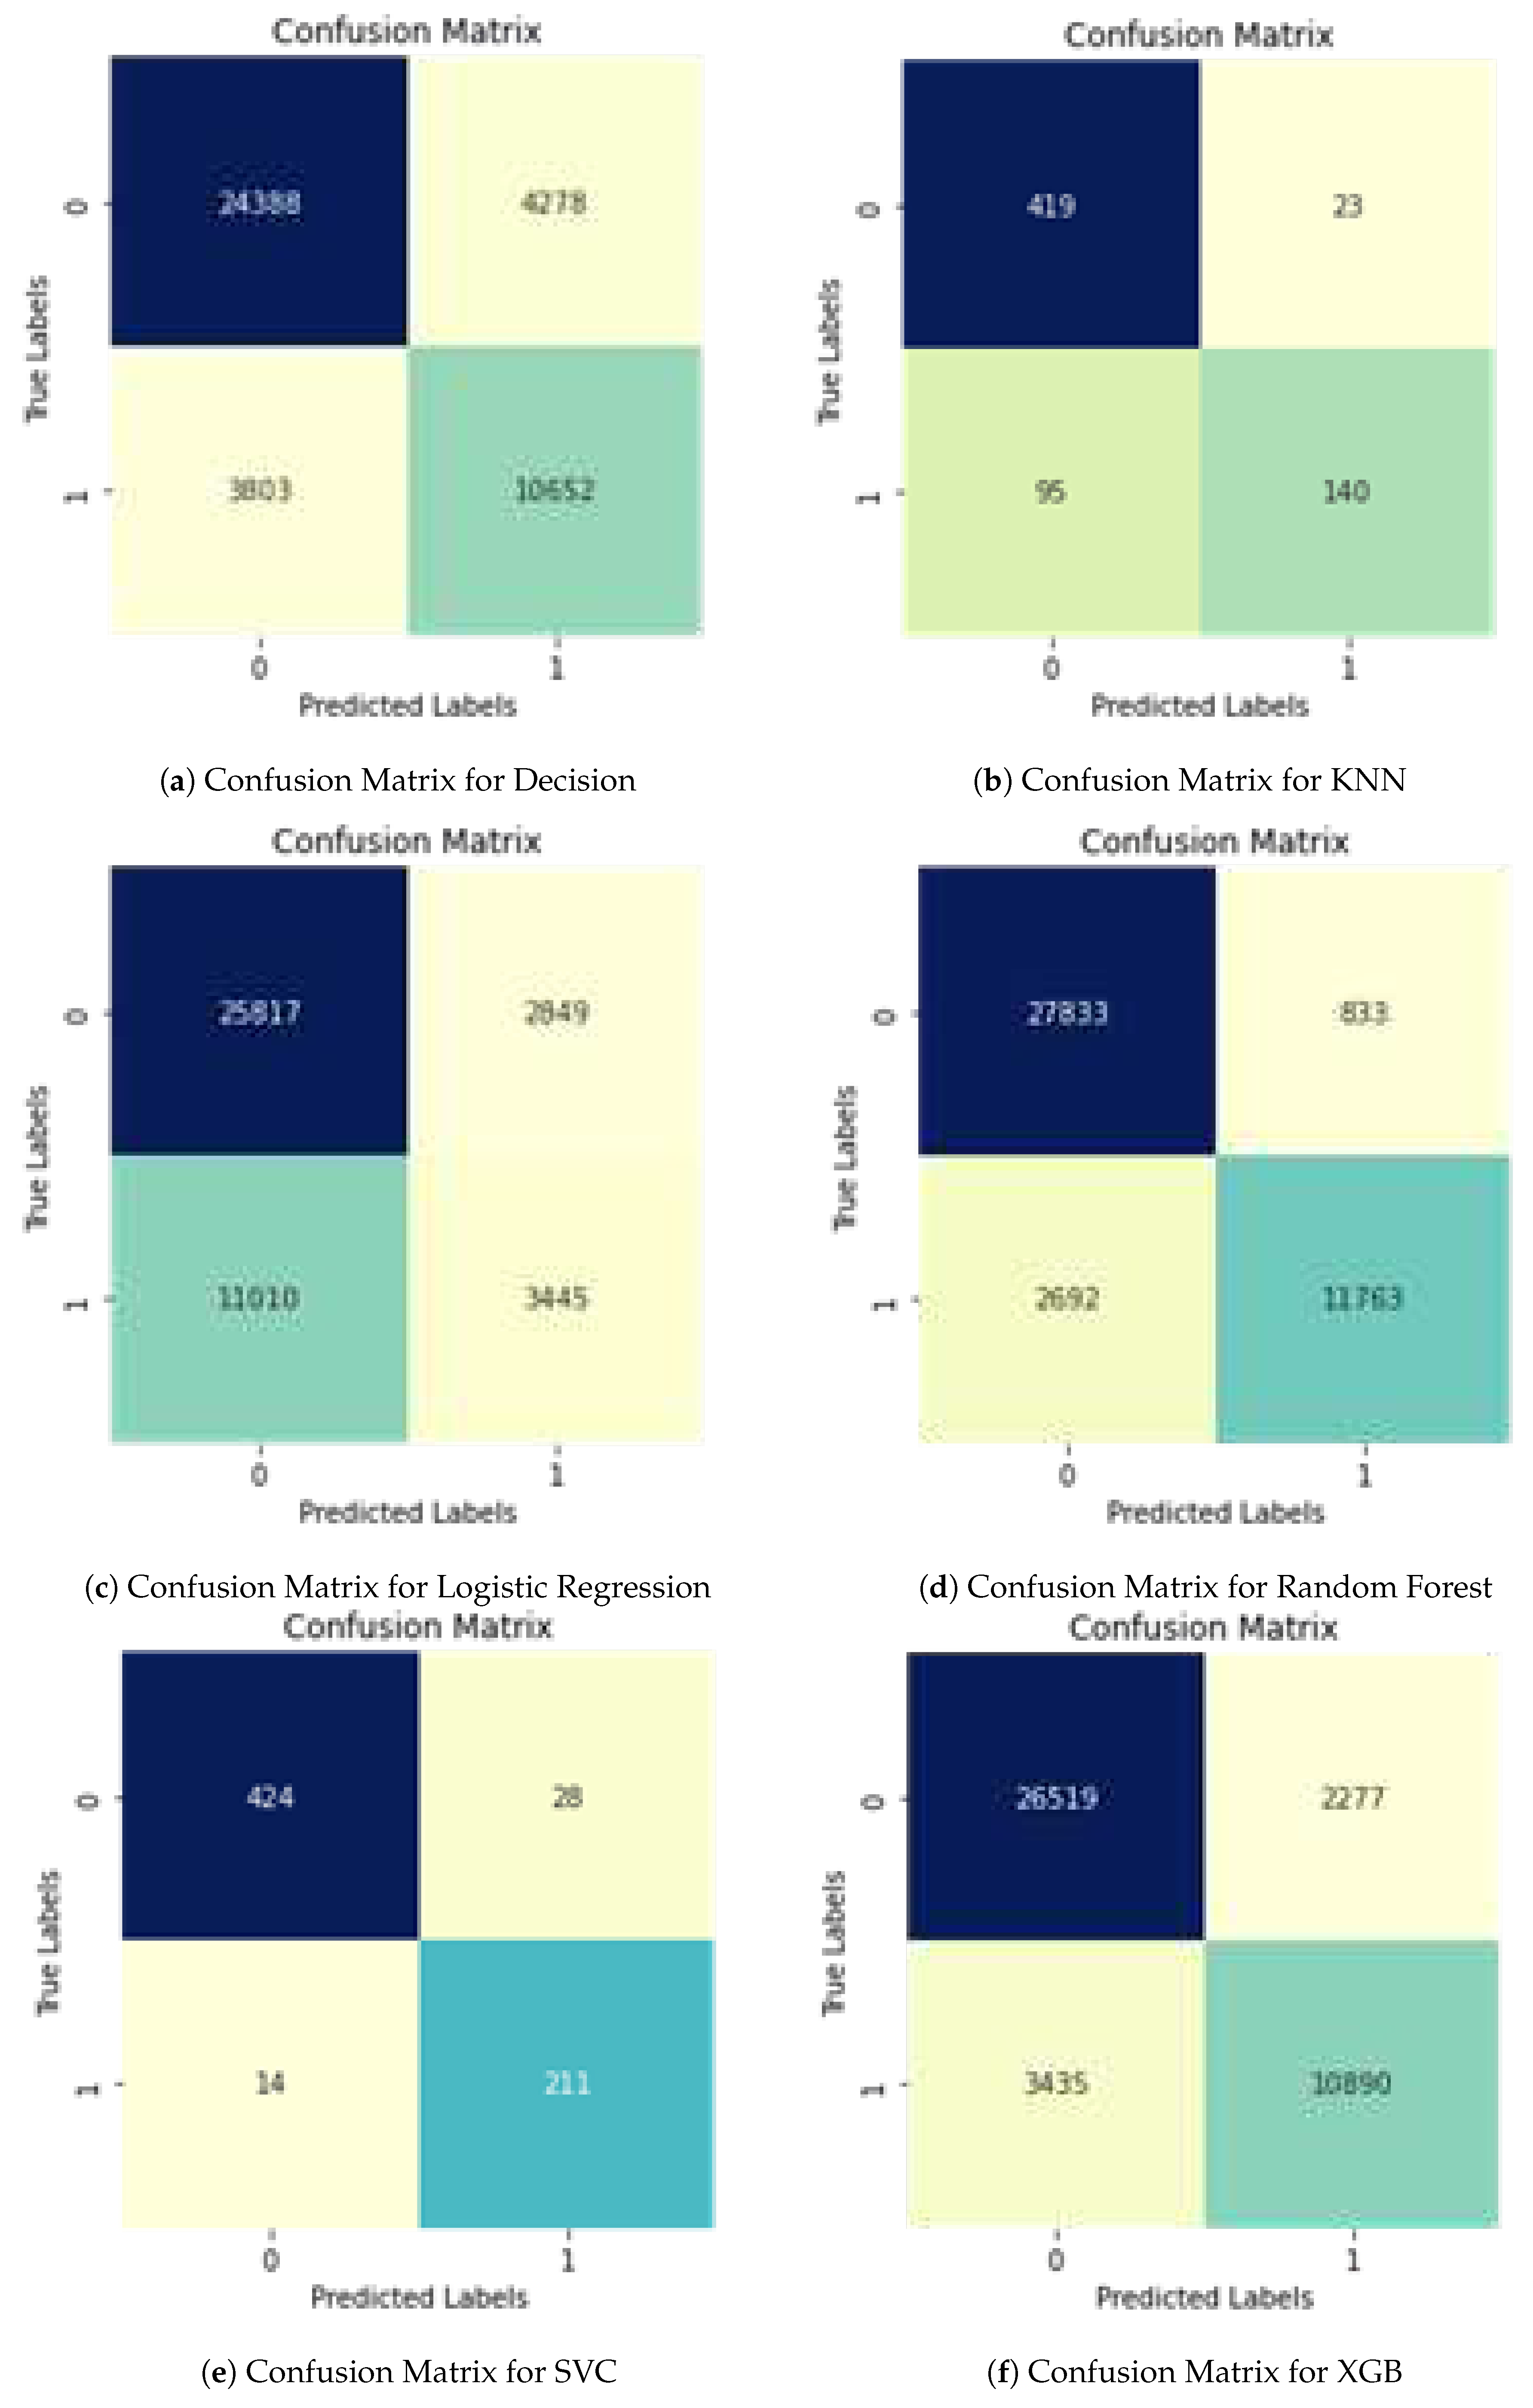
Figure 8.
ROC Curves for Applied models (Table 2).
Figure 8.
ROC Curves for Applied models (Table 2).
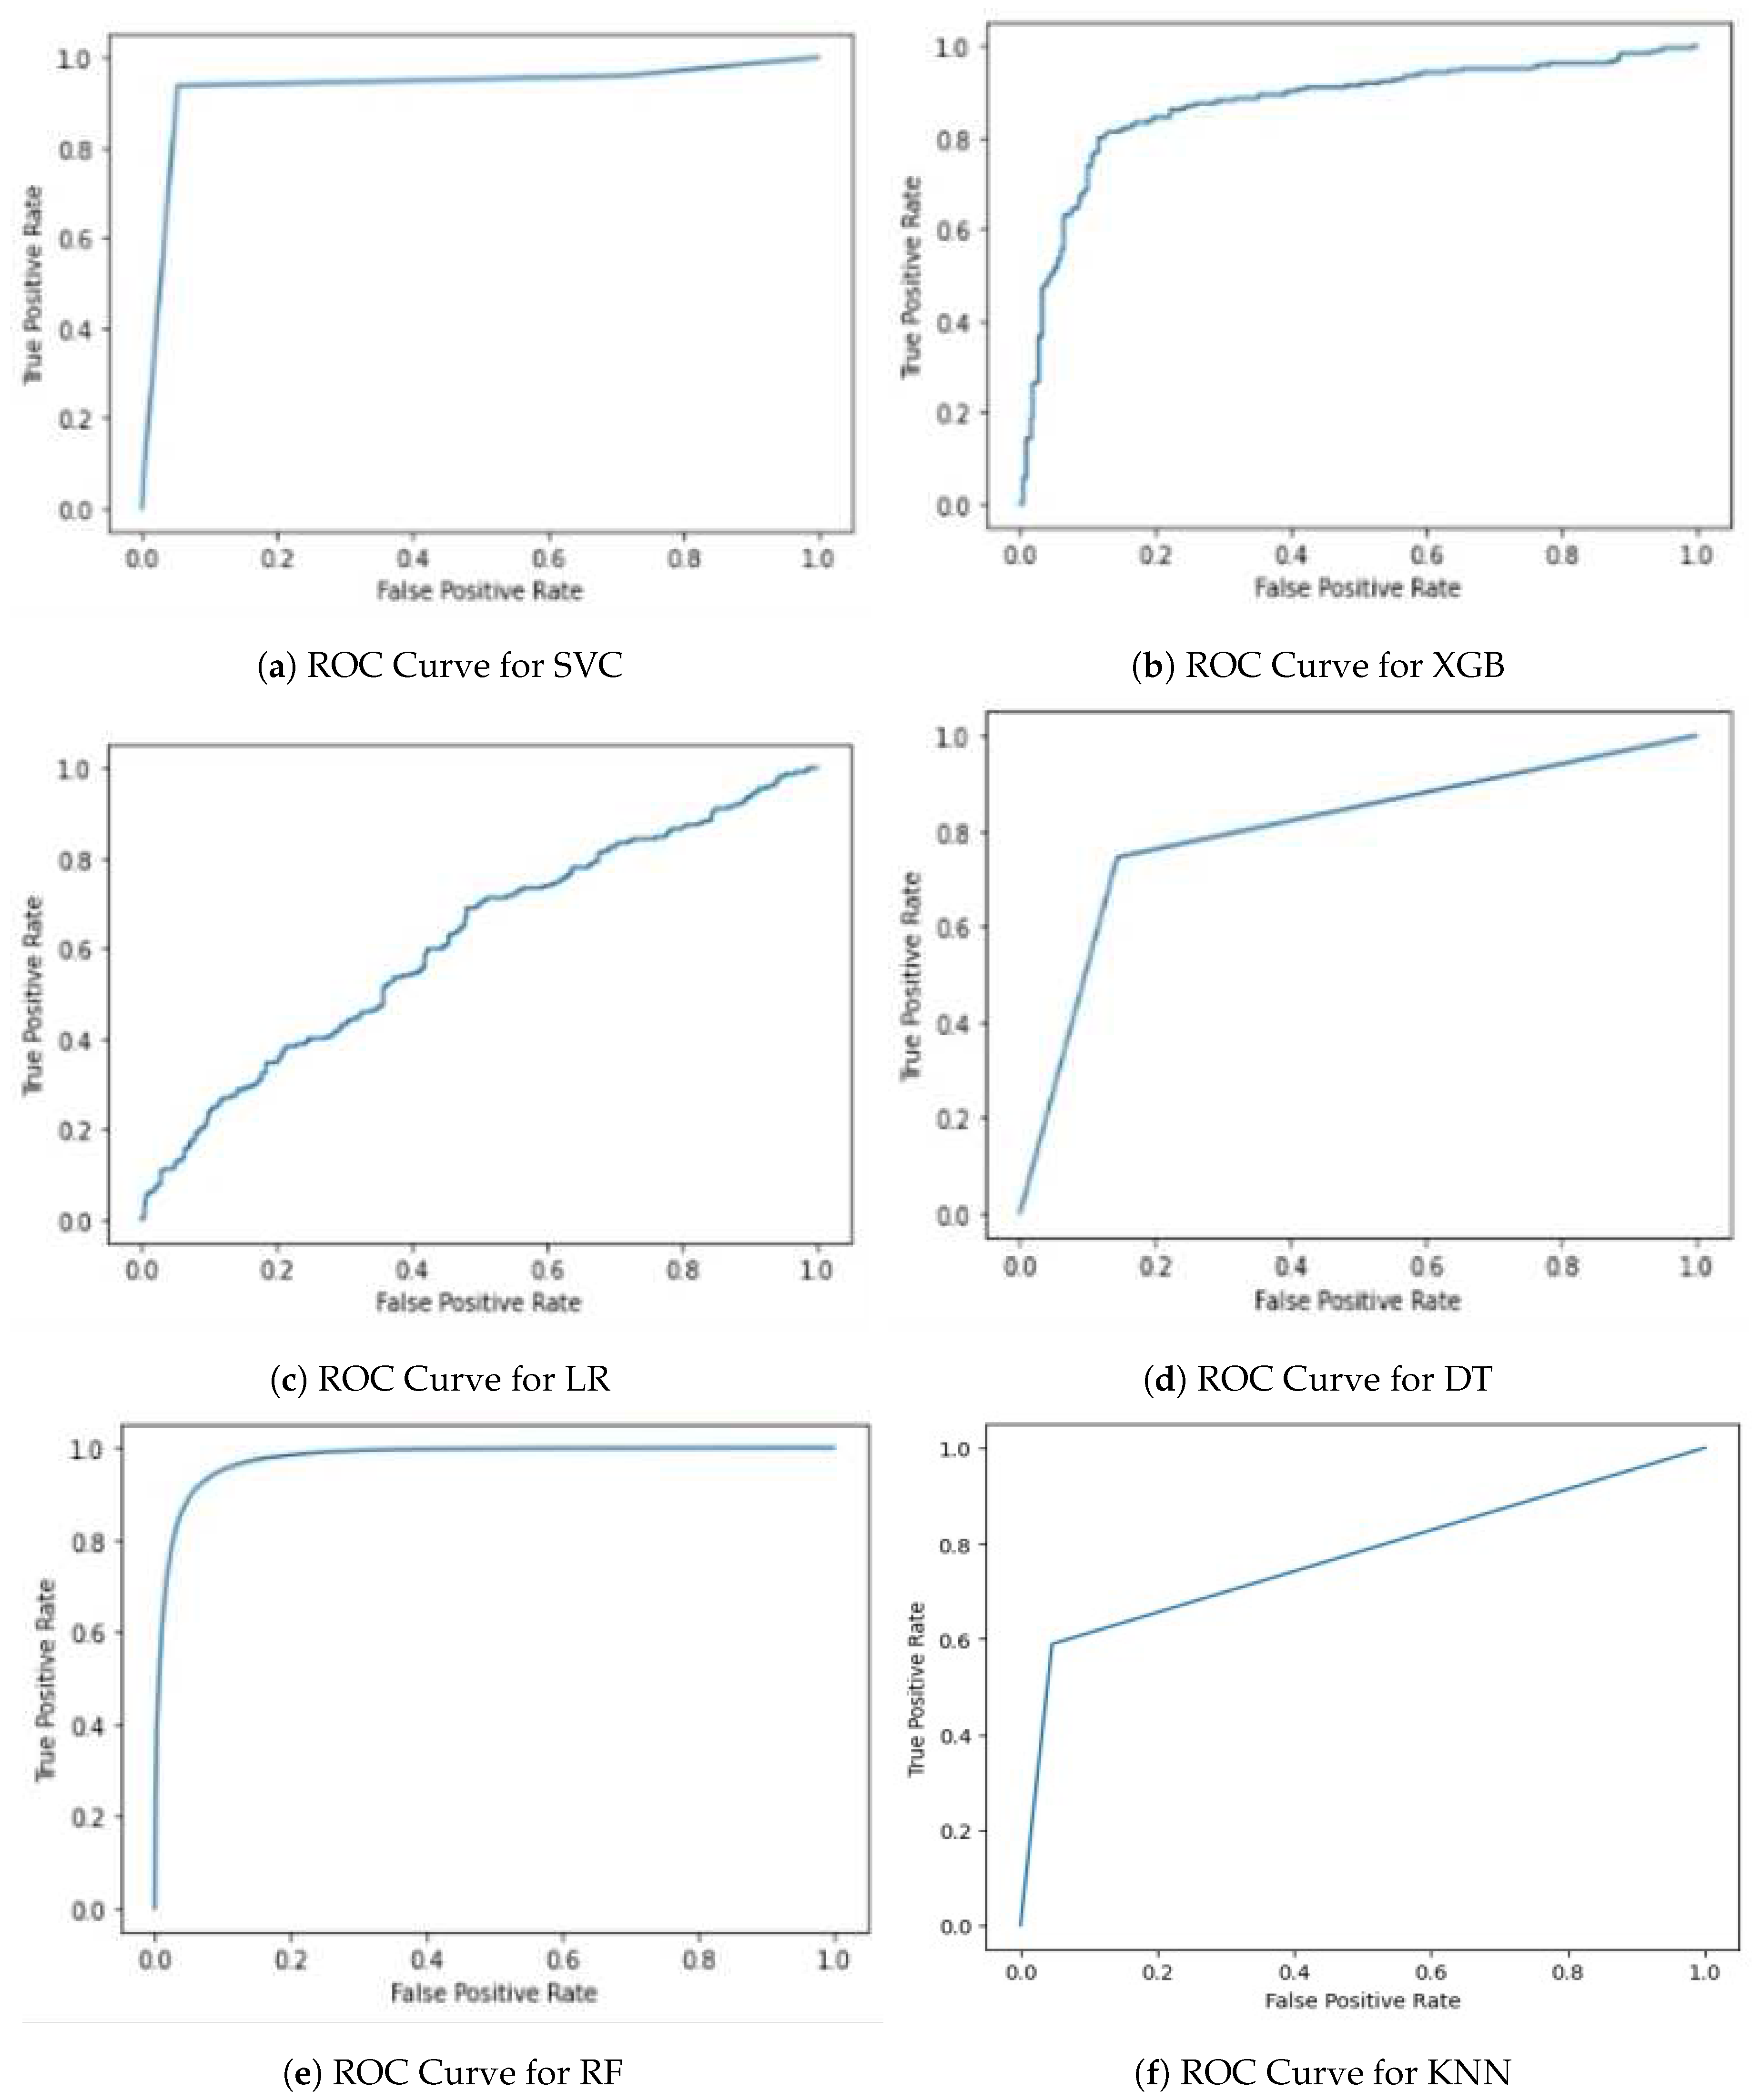
Figure 9.
ROC Curves for Applied models 4.
Figure 9.
ROC Curves for Applied models 4.

Figure 10.
ROC Curves for Applied models (Table 6)
Figure 10.
ROC Curves for Applied models (Table 6)
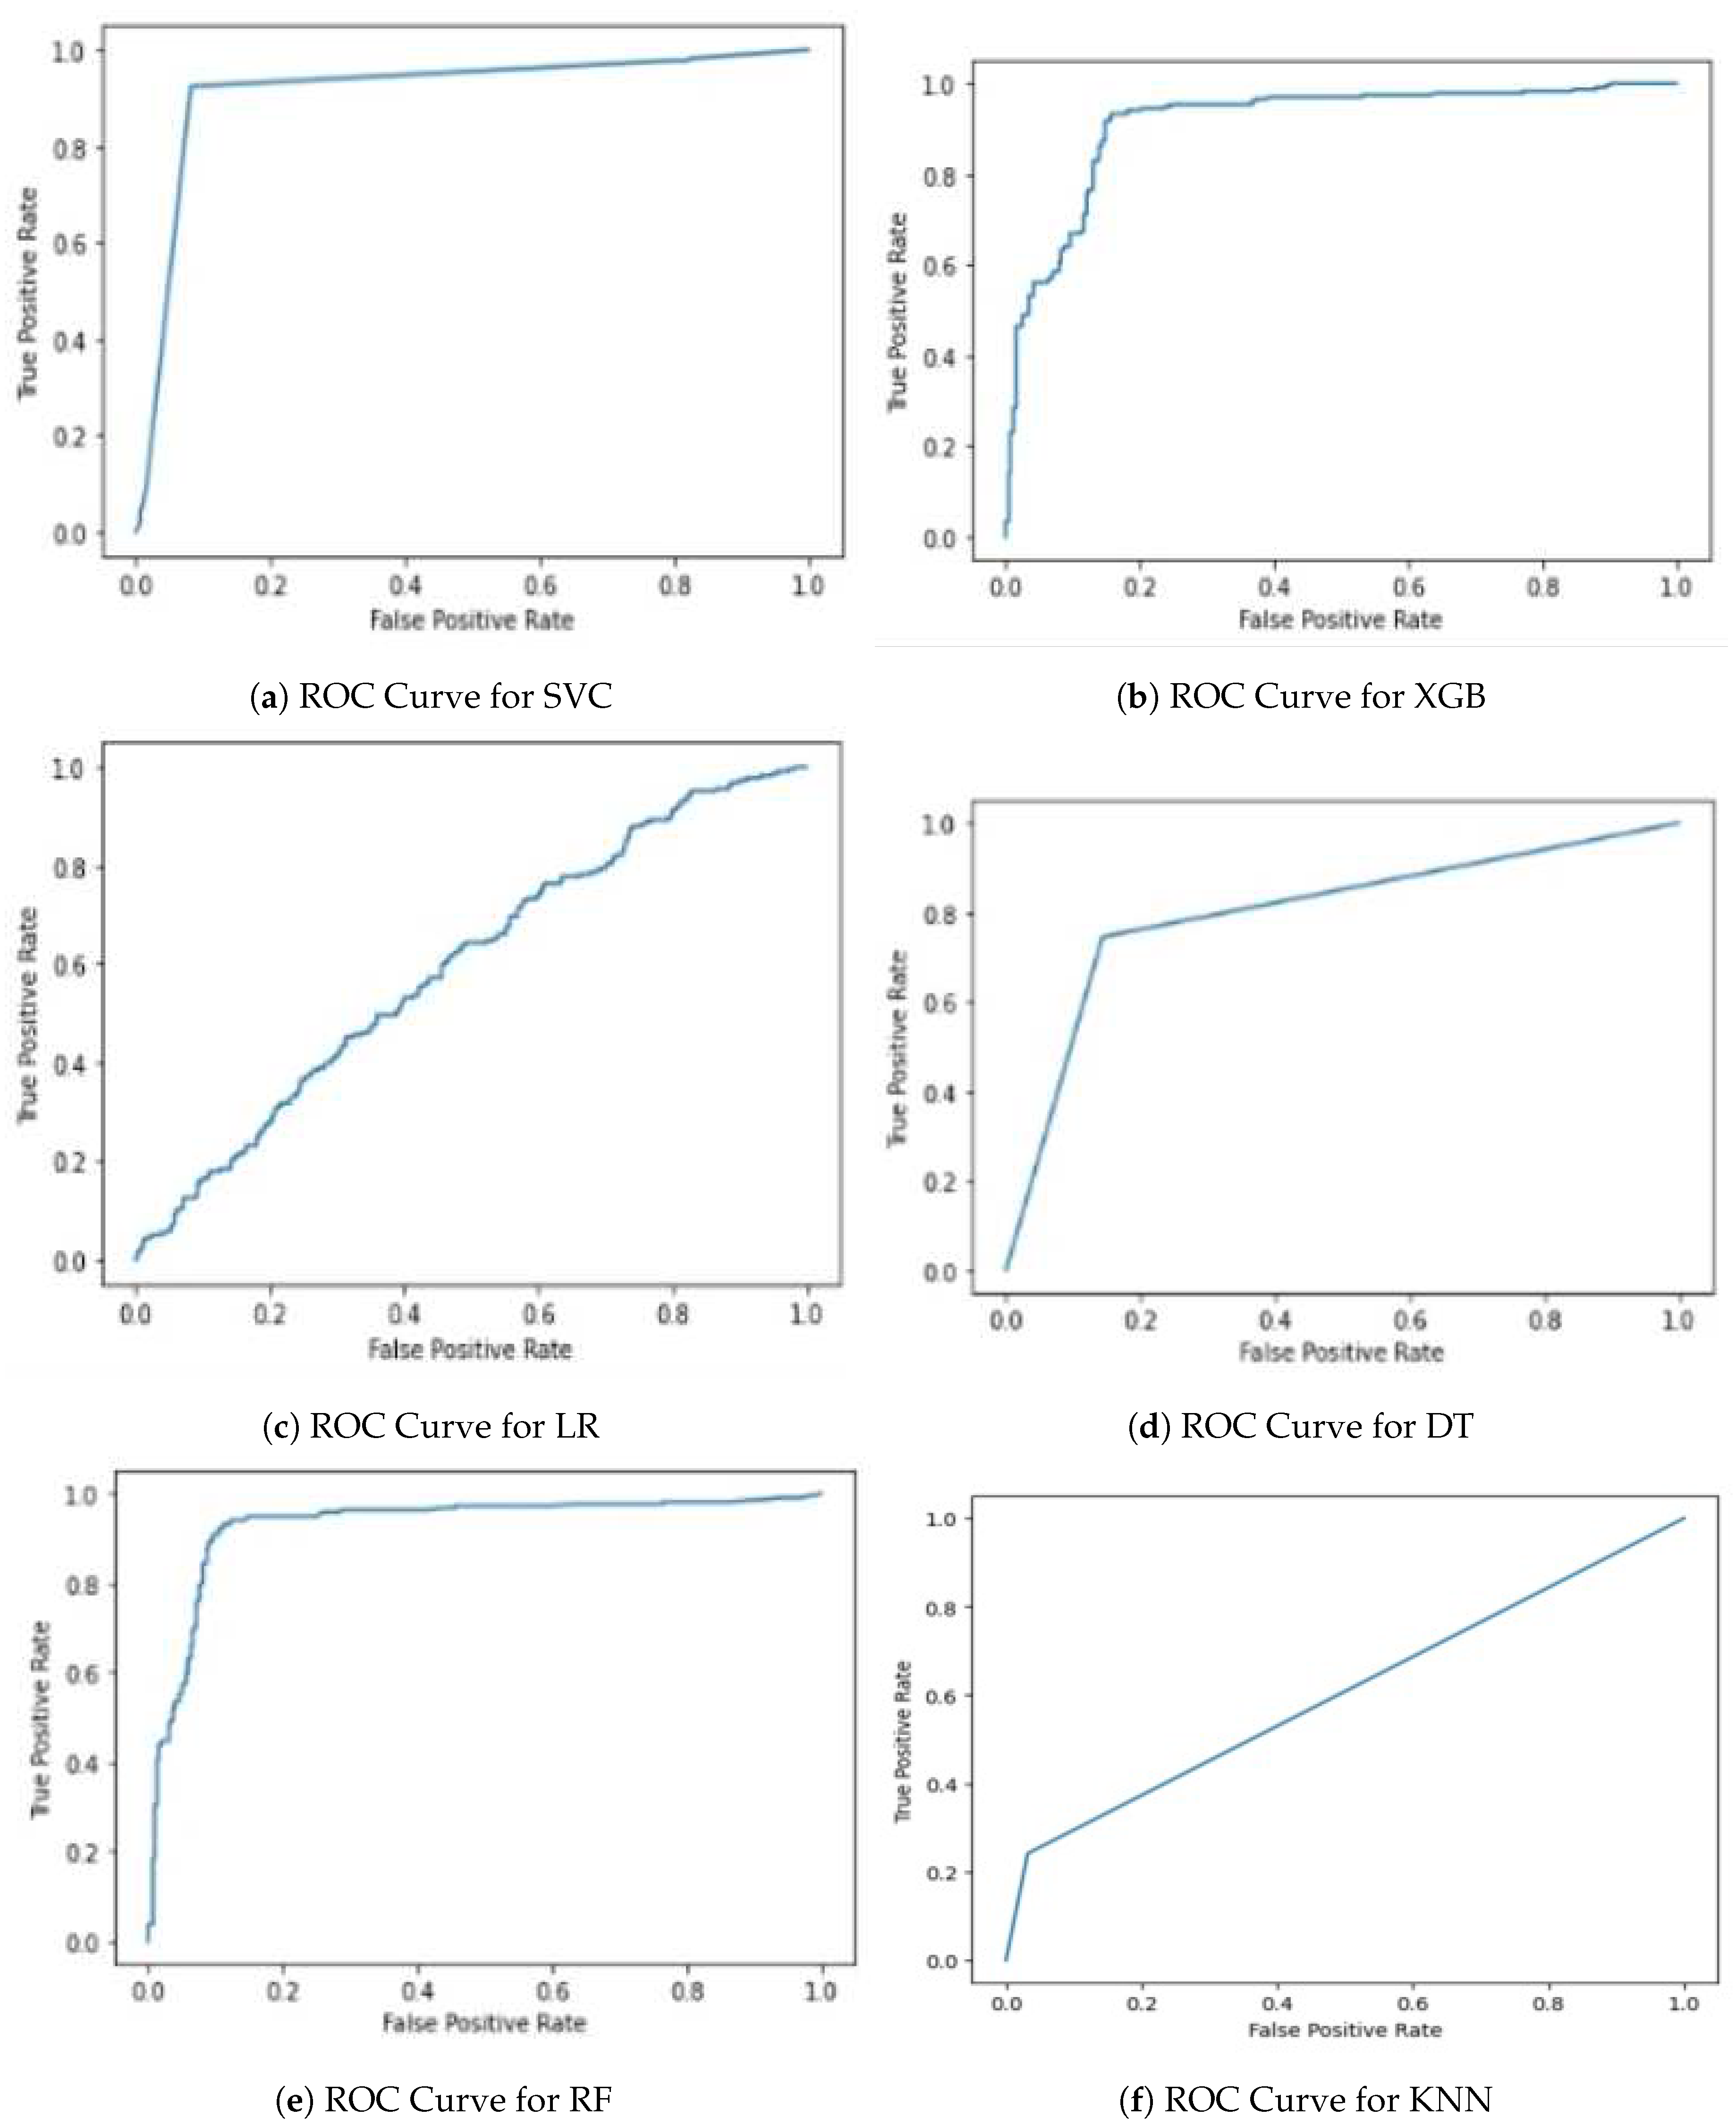
Figure 11.
Screenshot of dashboard.
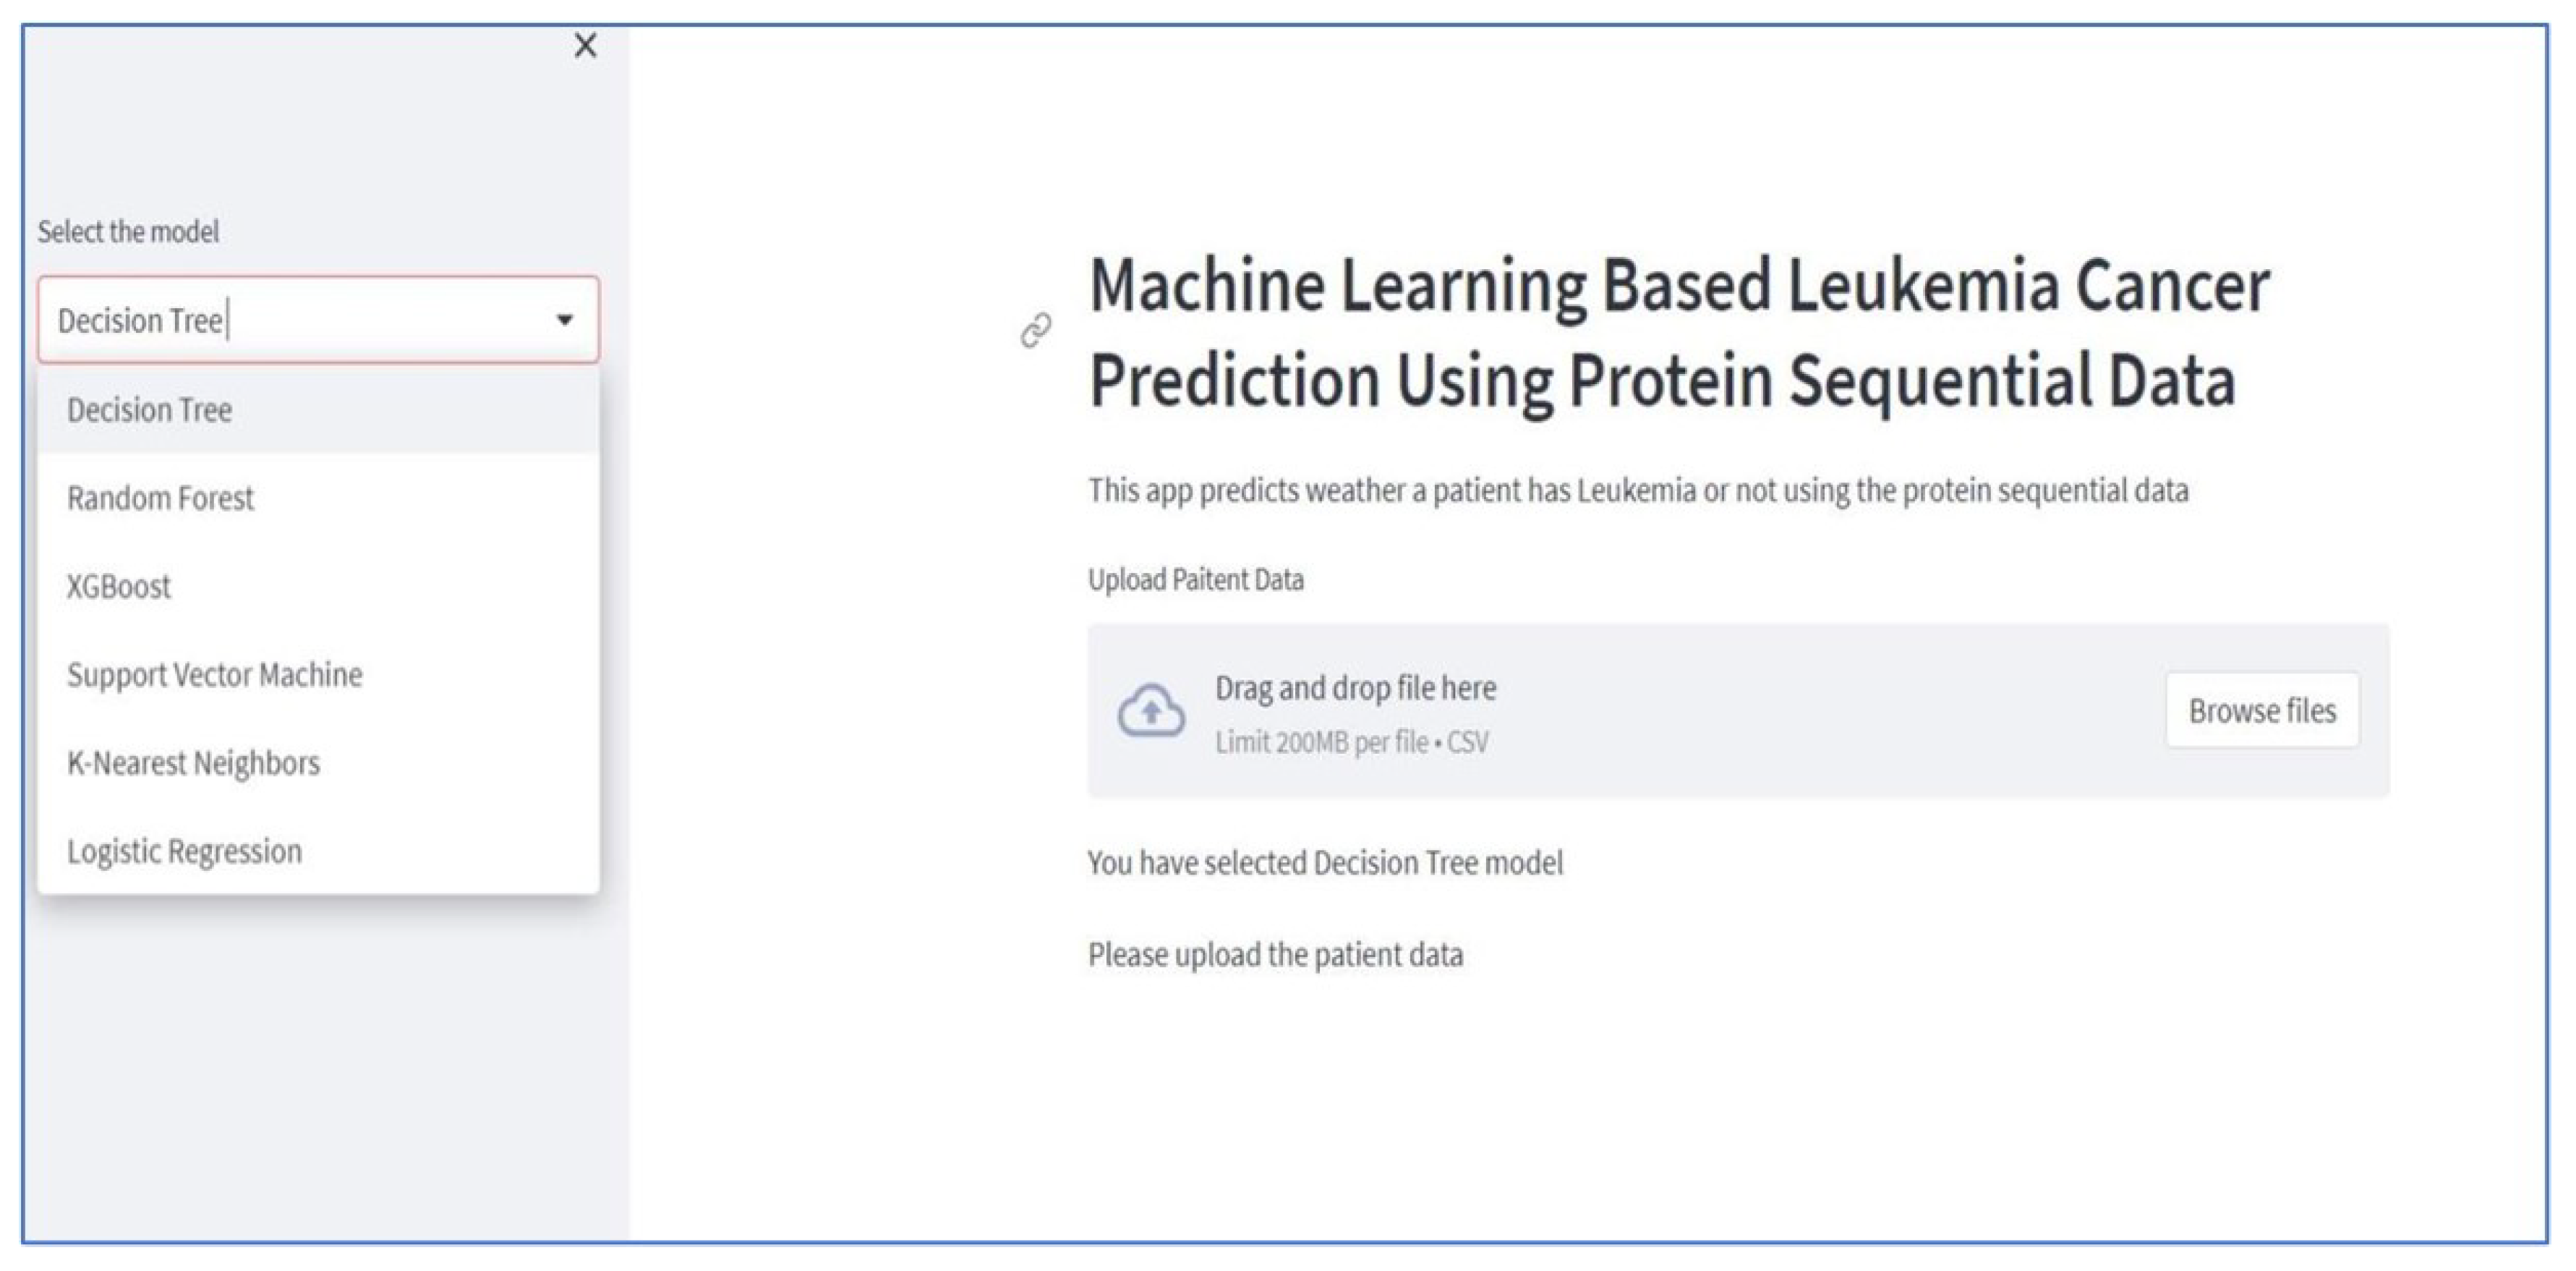
Figure 12.
Main screen for browsing data.
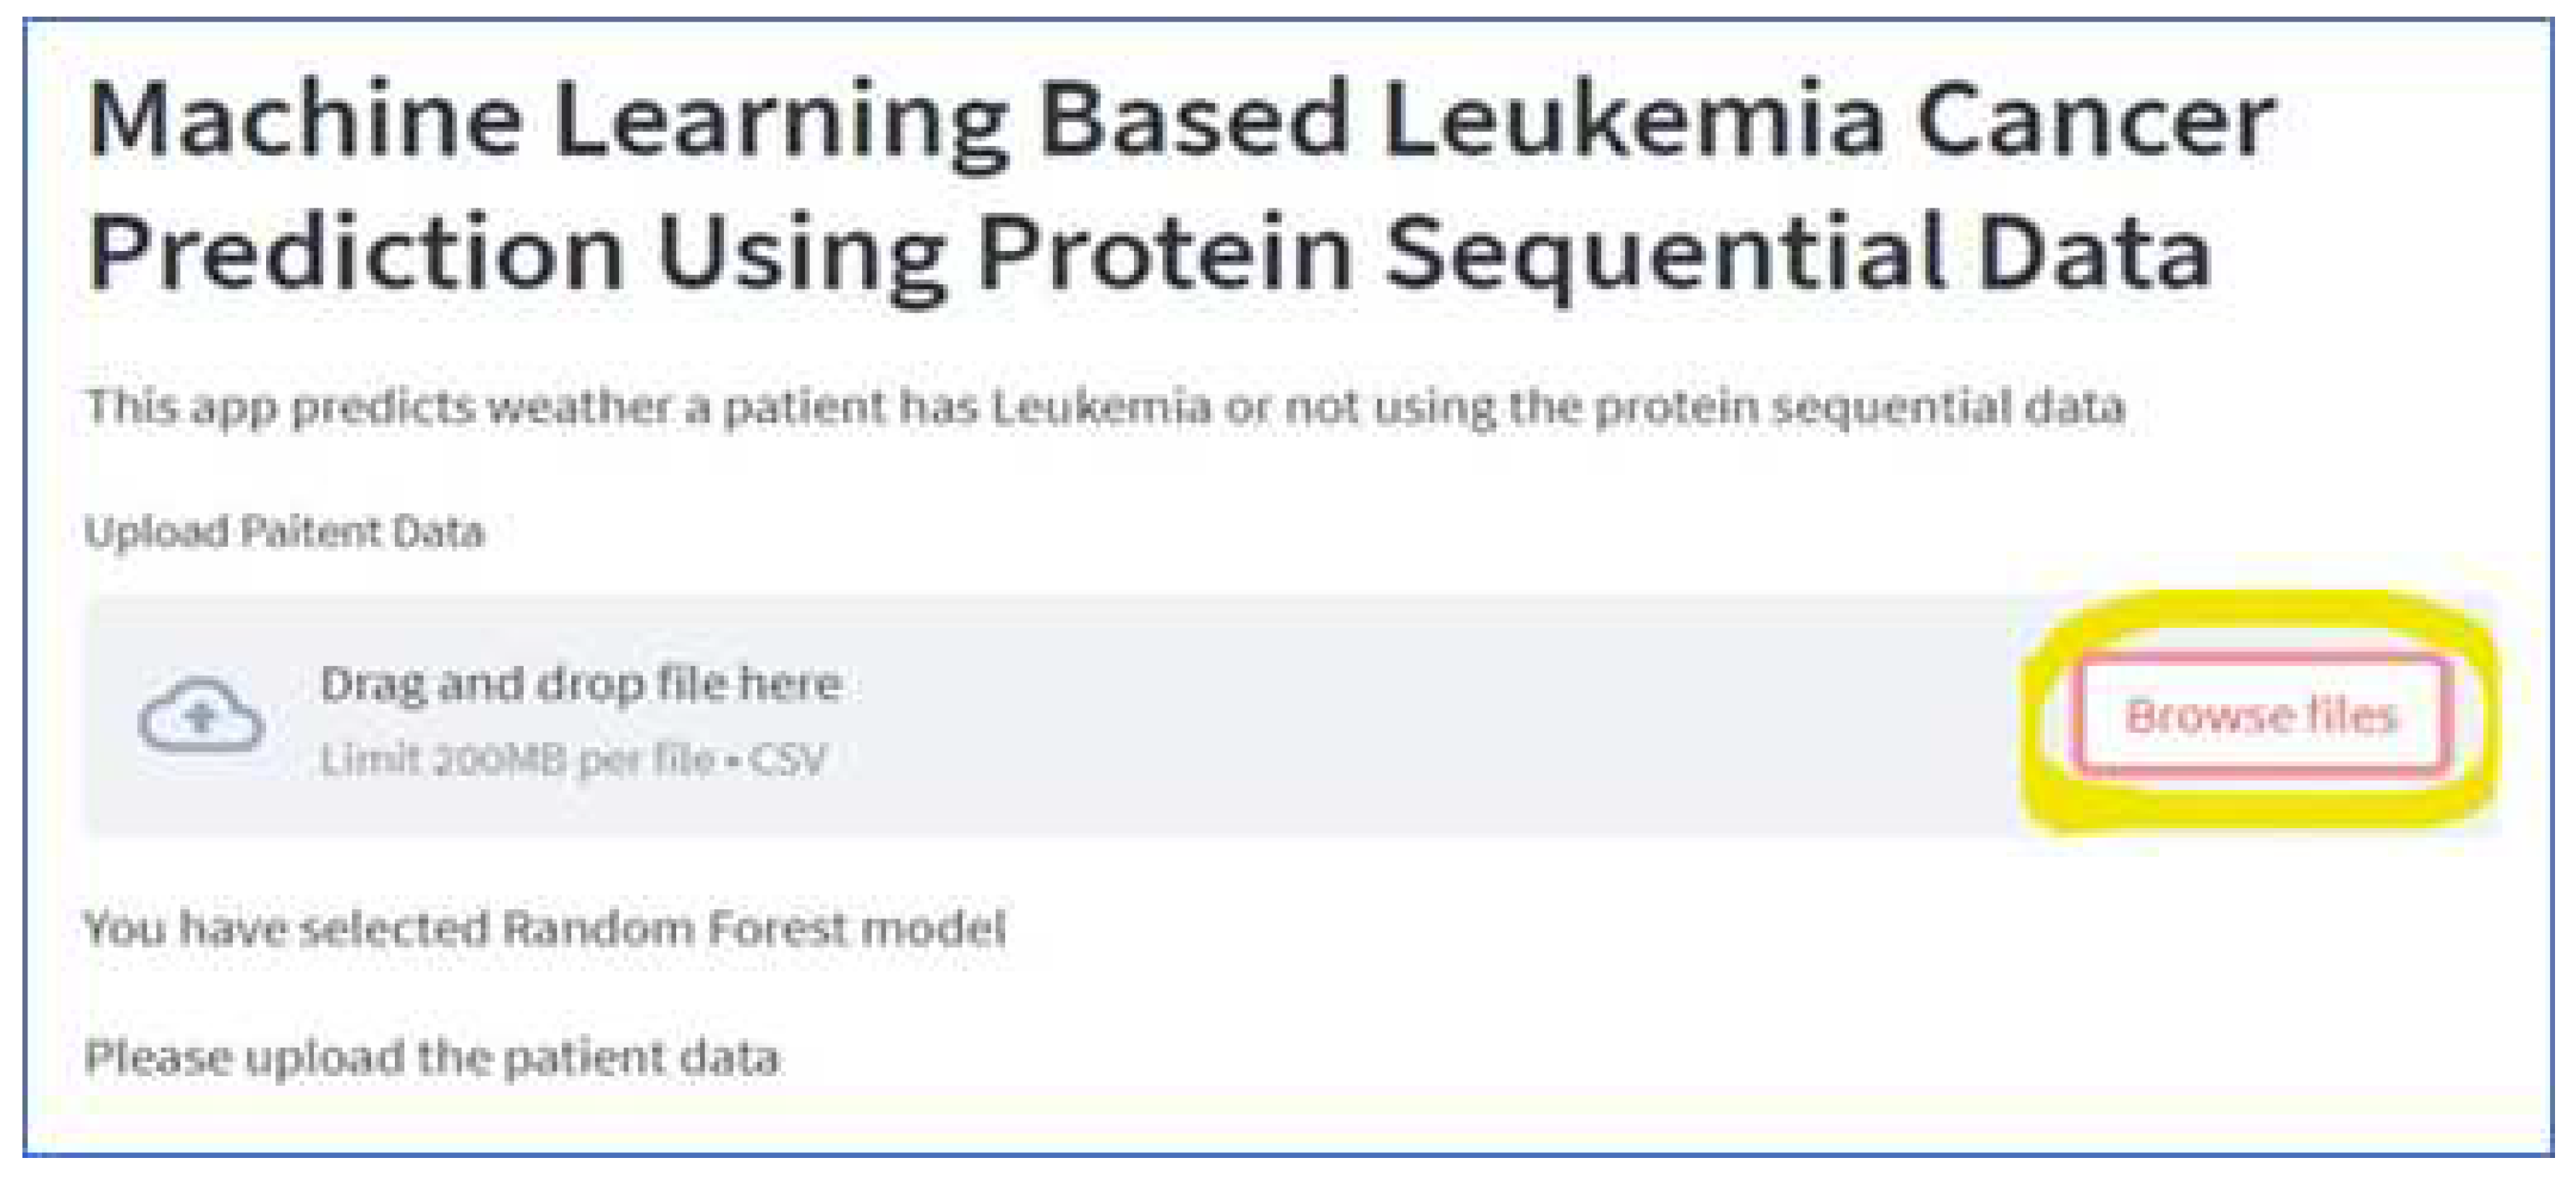
Figure 13.
Main screen for browsing data.
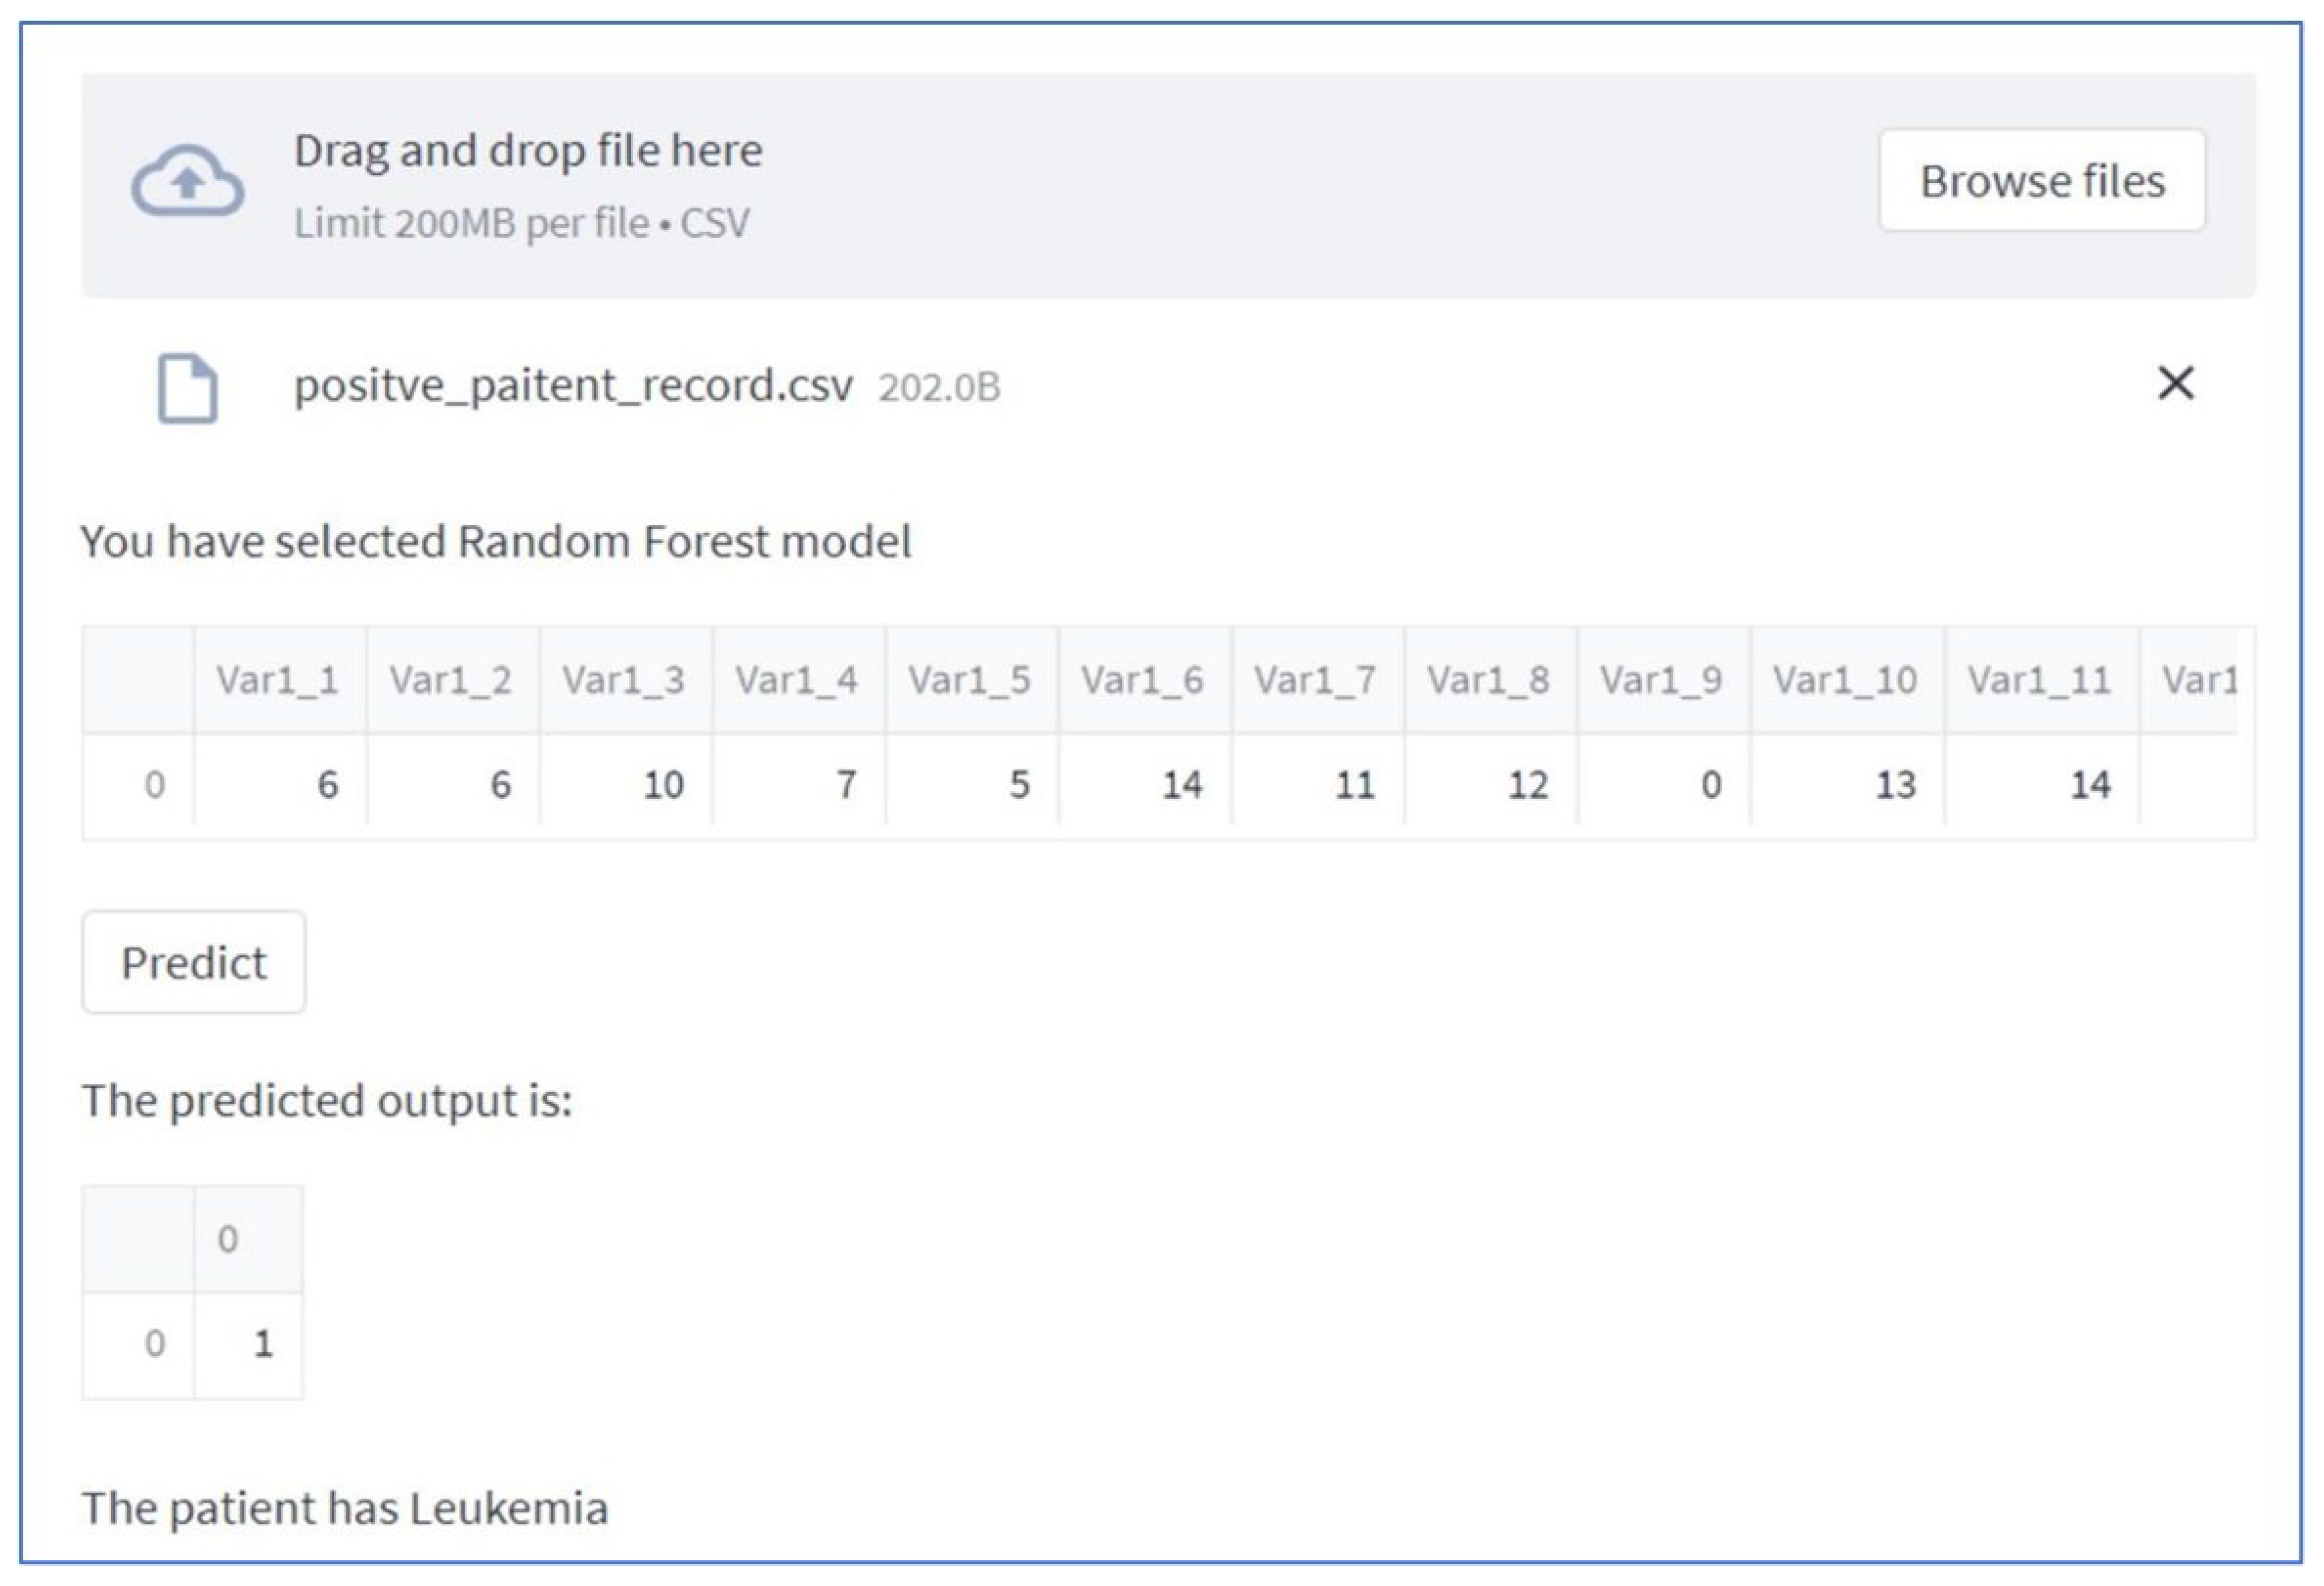
Table 2.
Results on Pseudo Amino Acid Composition (Pse-AAC) Data.
| Name of Algorithms | Accuracy | F1-Score | Recall | Specificity |
|---|---|---|---|---|
| Support Vector Classifier | 92~94% | 91~92% | 91~93% | 92~94% |
| Extreme Gradient Boost | 79~85% | 63~70% | 51~55% | 92~94% |
| Logistic Regression | 66~69% | 10~20% | 6~10% | 97~98% |
| Decision Tree | 81~84% | 73~76% | 74~76% | 84~86% |
| Random Forest | 87~91% | 85~87% | 80~83% | 96~97% |
| K Nearest Neighbor | 82~86% | 72~74% | 61~64% | 93~95% |
Table 3.
Confusion Matrix.
| Name of Algorithms | Confusion Matrix | |
|---|---|---|
| Support Vector Classifier | True Negative =424 | False Positive =28 |
| False Negative =14 | True Positive =211 | |
| Extreme Gradient Boost | True Negative =26159 | False Positive =2271 |
| False Negative =3435 | True Positive =10890 | |
| Logistic Regression | True Negative =25817 | False Positive =2849 |
| False Negative =11010 | True Positive =3445 | |
| Decision Tree | True Negative =24388 | False Positive =4278 |
| False Negative =3803 | True Positive =10652 | |
| Random Forest | True Negative =28014 | False Positive =808 |
| False Negative =2753 | True Positive =11546 | |
| K Nearest Neighbor | True Negative =419 | False Positive =23 |
| False Negative =95 | True Positive =140 |
Table 4.
Result on Amino Acid Composition (AAC) Data.
| Name of Algorithms | Accuracy | F1-Score | Recall | Specificity |
|---|---|---|---|---|
| Support Vector Classifier | 54.95% | 14.3% | 0.7% | 100% |
| Extreme Gradient Boost | 56.8% | 52.9% | 45.9% | 69% |
| Logistic Regression | 51.1% | 27.6% | 19.1% | 81.7% |
| Decision Tree | 54.4% | 52.25% | 52.9% | 55.8% |
| Random Forest | 50.6% | 41.1% | 35.4% | 64.9% |
| K Nearest Neighbor | 54.2% | 54.8% | 57% | 51% |
Table 5.
Confusion Matrix.
| Name of Algorithms | Confusion Matrix | |
|---|---|---|
| Support Vector Classifier | True Negative =271 | False Positive =0 |
| False Negative =121 | True Positive =62 | |
| Extreme Gradient Boost | True Negative =409 | False Positive =23 |
| False Negative =119 | True Positive =103 | |
| Logistic Regression | True Negative =9028 | False Positive =2022 |
| False Negative =8519 | True Positive =2015 | |
| Decision Tree | True Negative =124 | False Positive =98 |
| False Negative =95 | True Positive =107 | |
| Random Forest | True Negative =12612 | False Positive =6817 |
| False Negative =11832 | True Positive =6510 | |
| K Nearest Neighbor | True Negative =112 | False Positive =105 |
| False Negative =89 | True Positive =118 |
Table 6.
Results on Di-Peptide Composition (DPC).
| Name of Algorithms | Accuracy | F1-Score | Recall | Specificity |
|---|---|---|---|---|
| Support Vector Classifier | 92~94% | 87~88% | 91~93% | 90~93% |
| Extreme Gradient Boost | 79~84% | 66~68% | 55~57% | 92~94% |
| Logistic Regression | 66~69% | 0~0% | 6~10% | 100% |
| Decision Tree | 81~84% | 70~73% | 56~59% | 96~97% |
| Random Forest | 82~84% | 67~68% | 57~58% | 94~95% |
| K Nearest Neighbor | 72~73% | 31~32% | 20~21% | 95~97% |
Table 7.
Confusion Matrix.
| Name of Algorithms | Confusion Matrix | |
|---|---|---|
| Support Vector Classifier | True Negative =416 | False Positive =37 |
| False Negative =17 | True Positive =207 | |
| Extreme Gradient Boost | True Negative =413 | False Positive =25 |
| False Negative =105 | True Positive =134 | |
| Logistic Regression | True Negative =453 | False Positive =0 |
| False Negative =224 | True Positive =0 | |
| Decision Tree | True Negative =433 | False Positive =16 |
| False Negative =94 | True Positive =134 | |
| Random Forest | True Negative =437 | False Positive =23 |
| False Negative =93 | True Positive =124 | |
| K Nearest Neighbor | True Negative =438 | False Positive =15 |
| False Negative =179 | True Positive =45 |
Disclaimer/Publisher’s Note: The statements, opinions and data contained in all publications are solely those of the individual author(s) and contributor(s) and not of MDPI and/or the editor(s). MDPI and/or the editor(s) disclaim responsibility for any injury to people or property resulting from any ideas, methods, instructions or products referred to in the content. |
© 2023 by the authors. Licensee MDPI, Basel, Switzerland. This article is an open access article distributed under the terms and conditions of the Creative Commons Attribution (CC BY) license (http://creativecommons.org/licenses/by/4.0/).
Copyright: This open access article is published under a Creative Commons CC BY 4.0 license, which permit the free download, distribution, and reuse, provided that the author and preprint are cited in any reuse.


