Submitted:
27 November 2023
Posted:
28 November 2023
You are already at the latest version
Abstract
The issue of optimising the initial stand density (ISD) of tree plantations has high practical importance. The objective of this study was to nondestructively evaluate the influence of the initial stand density of Scots pine plantations located in the European part of the Russian Federation on wood basic density (BD), moisture content (MC), ultrasound velocity (UV), latewood content, and drilling resistance (DR). 45-year-old trees with stand densities of 500, 1000, 3000, 5000, and 10000 trees/ha were tested by a 5-cm-long core sample for gravimetric MCGM and BD, by PULSAR-2.2 for UV along the height (UVH) and through the tree trunk diameter (UVD), by the IML-RESI PD-400 tool for DR, and by GANN HT 85T for MC based on the electrical resistance method (MCERM). A significant influence of ISD was found on DBH, UVD, MCGM, and MCERM. ISD had no significant impact on BD, UVH, and DR. The wood BD ranged from 356 to 578 kg/m-3, with a mean value of 434±3.3 kg/m-3, and was restricted by the soil and environmental factors. DBH and 70% MCERM were good indicators of tree vitality. Linear correlations between DBH and MCERM (R2=0.67), DBH and MCGM (R2=0.74), DR and BD (R2=0.71), and the two-factor model MCGM=f(DBH, BD), (R2=0.76) were found.
Keywords:
core sample
; drilling resistance
; moisture content
; nondestructive testing
; initial plantation density
; ultrasound velocity
1. Introduction
The initial density of forest plantations is one of the key factors determining their productivity, marketability, viability, and environmental protection. It also affects the overall economic efficiency (profitability) of forest cultivation. Research literature contains extensive discussion on the issue of stand density optimisation, which is utterly important from a practical standpoint [1,2,3,4,5,6,7,8,9,10,11,12,13,14]. The multifaceted nature of the problem and a wide range of possible solutions account for why it has not lost its relevance [15,16,17,18,19,20,21,22,23,24,25,26,27].
A detailed analysis of the data from field experiments, which hardly ever lasted longer than 20-30 years, revealed that they were all established in various natural zones and using various approaches. Most of the time, the integrity of the experiments was compromised, necessitating an immediate termination because the plots were too small. Some researchers used plots of 1×1, 1×2, and 2×2 m2, on which they planted from 5 to 200 seedlings. They then incorrectly projected the results obtained from small plots to 1-hectare (ha) areas. With all the disparity in the results, it is nevertheless possible to make certain generalisations:
1) when growing in dense groups, during the first years, seedlings have a higher increase in height and trunk diameter, thereafter, the situation changes to the contrary;
2) the diameter of trees is far more influenced by the initial stand density than is their height, which is primarily determined by moisture content and fertility of soil;
3) during the first 15-30 years of plantation establishment, i.e., before crown and root closure, when intraspecific competition for resources comes into effect, the stocking volume is proportional to the initial stand density. After that, this dependence gradually changes into a dome-shaped and even inversely proportional relationship;
4) reducing the initial stand density allows for obtaining large-size wood in shorter periods of time;
5) when stand density is excessively high, wood productivity is reduced as a result of both intraspecific competition and fallout from snow and wind loads;
6) there is a greater chance of insect damage when plantations are initially planted at a low density;
7) trees planted too densely will eventually fall, and their width growth will slow down;
8) planting too densely is not viable from an economic standpoint as it leads to overpaying for labour and seedlings.
It has been established by researchers that there is no relative optimal stand density for the initial and current plantations [8,10,13,14,28]. The optimal stand density is determined by the set goal, which can be either increasing complex productivity while accounting for all biological components of forest ecosystems, obtaining wood of the required quality and quantity in the shortest possible time, or enhancing the stability and durability of plantations, their environmental and protective functions, as well as the appeal for human recreation. Accurate purpose determination of the established plantations well in advance is crucial since it is not feasible, either in theory or in practice, to ensure that the forest serves all the possible purposes at the same time. For a given tree species, the ideal stand density cannot be uniform; rather, it must be determined by natural and climatic zones, as well as by edaphic conditions within the latter. So, for example, it was established [29,30] that with the deterioration of the growing conditions, the density of tree planting should be increased. It has been demonstrated in experimental plantations of Scots pine (Pinus sylvestris L.) that their initial density in the dry steppe zone should be from 30000–40000 trees per ha (trees/ha) [31] to even 100000 trees/ha [32], in the coniferous–broad-leaved and broad-leaved forests, from 2500 to 7500 trees/ha [33,34]. The optimal initial density of plantations in fresh suborns was between 2000 and 8000 trees/ha [35]. Uniform seedling planting is ideal since it maximises the growth potential of tree species [36].
Some researchers aimed to investigate the dynamics of taxation indicators. Studies examining the impact of pine planting practices and their initial density on the mechanical and physical properties of wood, as well as its technical quality, are very few. The most important parameter of wood is volumetric density, which also determines the trees' resistance to icing, wind loads, snowdrifts, and trunk rot. The research findings on this subject are far from conclusive [37,38,39,40,41,42,43,44]. This is caused by the variety of forest biogeocenoses as well as the way in which environmental conditions affect them. Thus, for example, Poluboiarinov and Fedorov [41] claimed that in the north-west of the European part of Russia, increased density of Scots pine plantations led to a significant reduction in tree height increment (r = -0.62), the width of annual rings (r = -0.95), and wood density (r = -0.58). Nevertheless, it had a negligible impact on the length of the tracheids (r = 0.20) and the proportion of the latewood (r = 0.17). Zhu et al. [18] noted that with an increase in red pine (Pinus resinosa Ait.) stand density, the average width of the annual layer decreases (r = -0.90, -0.96), which, according to the authors, is the most accurate parameter to describe the influence of stand density on wood density and anatomical parameters of tracheids. Using the SilviScan, the authors found that with a decrease in the average width of the annual layer, the wood density as a whole increases (r = -0.30), while the density of latewood decreases (r = 0.45) and the density of early wood in the annual layer increases (r =-0.52).
Most researchers [39,40,45,46,47] came to the conclusion that in order to produce high-quality wood, Scots pine plantations should have initial stand density of at least 1000–1200 trees/ha. The physical and mechanical properties of wood deteriorate when fewer trees are planted per hectare: there was a 47% decrease in modulus of rupture at static bending, a 23% decrease in compressive strength along the fibres, an 18–26% decrease in the amount of latewood in the annual layer, and only a 7% decrease in wood density. The best result of wood properties in fresh ramen (forest site type С2) was observed in a variation with a plantation density of 10000 trees/ha, according to other authors [48] who carried out research in the Moscow region. The findings of our previous research revealed that 2500–3000 trees/ha is the optimum initial stand density in the dry coniferous forest of the Mari El Republic [15,26,44].
Also, according to [49], the wood density in pine plantations located in the northern and southern subzones of the taiga ranged from 520 to 540 kg⋅m-3. In pine plantations in the middle taiga subzone, the wood density did not depend on the forest site type. It changed depending on the method of plantation establishment: in plantations, from 444 to 483 kg⋅m-3, in seed crops, from 491 to 510 kg⋅m-3 [50,51]. The wood density varied from 428 to 484 kg⋅m-3 in 26-year-old pine stands with varying stand densities (10000–40000 trees/ha) established in the Tambov region for subor forests (forest site type В2). About 20000 trees per hectare was the number at which both wood density and stock volume reached their maximum levels [42]. On plantations with the lowest and highest number of trees per ha, the wood density was almost the same (428±2.4 and 427±3.5 kg⋅m-3). In the middle subzone of the taiga, the wood density on a 60-year-old pine plantation with the initial stand density ranging from 1800 to 3800 trees/ha was almost the same [52]. The method of plantation establishment (planting or seeding) had a negligible impact on the fluctuation of the wood density indicator. However, its influence on the latewood content was 30.8%.
Thinning and increased spacing between trees on plantations often resulted in a decrease in the wood density in coniferous forests [53,54,55,56]. Tyurin and Danilov [57] demonstrated that the wood basic density for 40-year-old spruce plantations established with an initial stand density of 1000 to 4000 trees/ha varied slightly (from 393 to 406 kg⋅m-3), reaching the highest values at an average density value of about 2000 trees per ha. The dependence of wood density on the number of trees in pine and spruce stands in Lithuania [58], as well as Cariniana legalis in Brazil [59], was low positive. However, in Australian eucalyptus plantations, the reverse was observed [60]. The density of Populus tometosa plantations in China, according to some researchers [61], did not significantly affect the wood density.
Results from research on geographical species reveal that the causes of the variance in wood density values are not only the number of trees per hectare but also the physical and geographical conditions as well as the hereditary characteristics of the trees [62,63,64,65,66,67]. Some researchers have shown that wood density increases further south in all types of forests with the exception of lichen-dominated pine forests [49]. The contrary was observed in the Amur area [68,69]. The influence of the type of forest is much weaker in this case [49]. With regard to the indicator's variation, the average annual air temperature has the most impact on it [41,70]. The pine breed is characterised by intensive growth of wood with low density [71].
A literature review revealed that there was no unanimous opinion on how the initial stand density affected the variability of the wood basic density or other wood properties of Scots pine. Presumably, the strength characteristics of wood are predetermined hereditarily, which can be used in cultivation in order to increase the environmental and resource potential of plantations during artificial forest regeneration.
Nondestructive testing and evaluation techniques, such as the time-of-flight acoustic method, based on measuring the acoustic wave velocity and drilling resistance (DR) measurements, is widely used to evaluate the quality and internal condition of wood in stands [72,73,74]. One of the main objectives when using the DR method is to evaluate the accuracy of the indirect prediction of the wood density in growing trees. The degree of correlation of these parameters (R2) varied from 0.28 to 0.93 [75,76,77,78]. The use of DR data with a limited penetration depth of a drill bit into a growing tree allows for higher accuracy of wood density prediction: R2=0.93 for a drilling depth of 50 mm [75] and R2>0.80 for a drilling depth of up to 15 mm [79]. Some studies concluded that in order to increase the accuracy of assessing the mechanical and physical properties of wood in a tree, combined acoustic and DR measurement methods can be applied [80,81]. Nondestructive acoustic methods for evaluating wood quality can be used to indirectly determine the density and stiffness of the wood [82,83,84].
Using contemporary nondestructive methods and approaches required to optimise methods and technologies of pine plantations in the Republic of Mari El and the Middle Volga region, the research aims to clarify previously obtained data on the effect of the initial stand density of Scots pine plantations on the wood density and other parameters of trees.
2. Materials and Methods
2.1. Study site
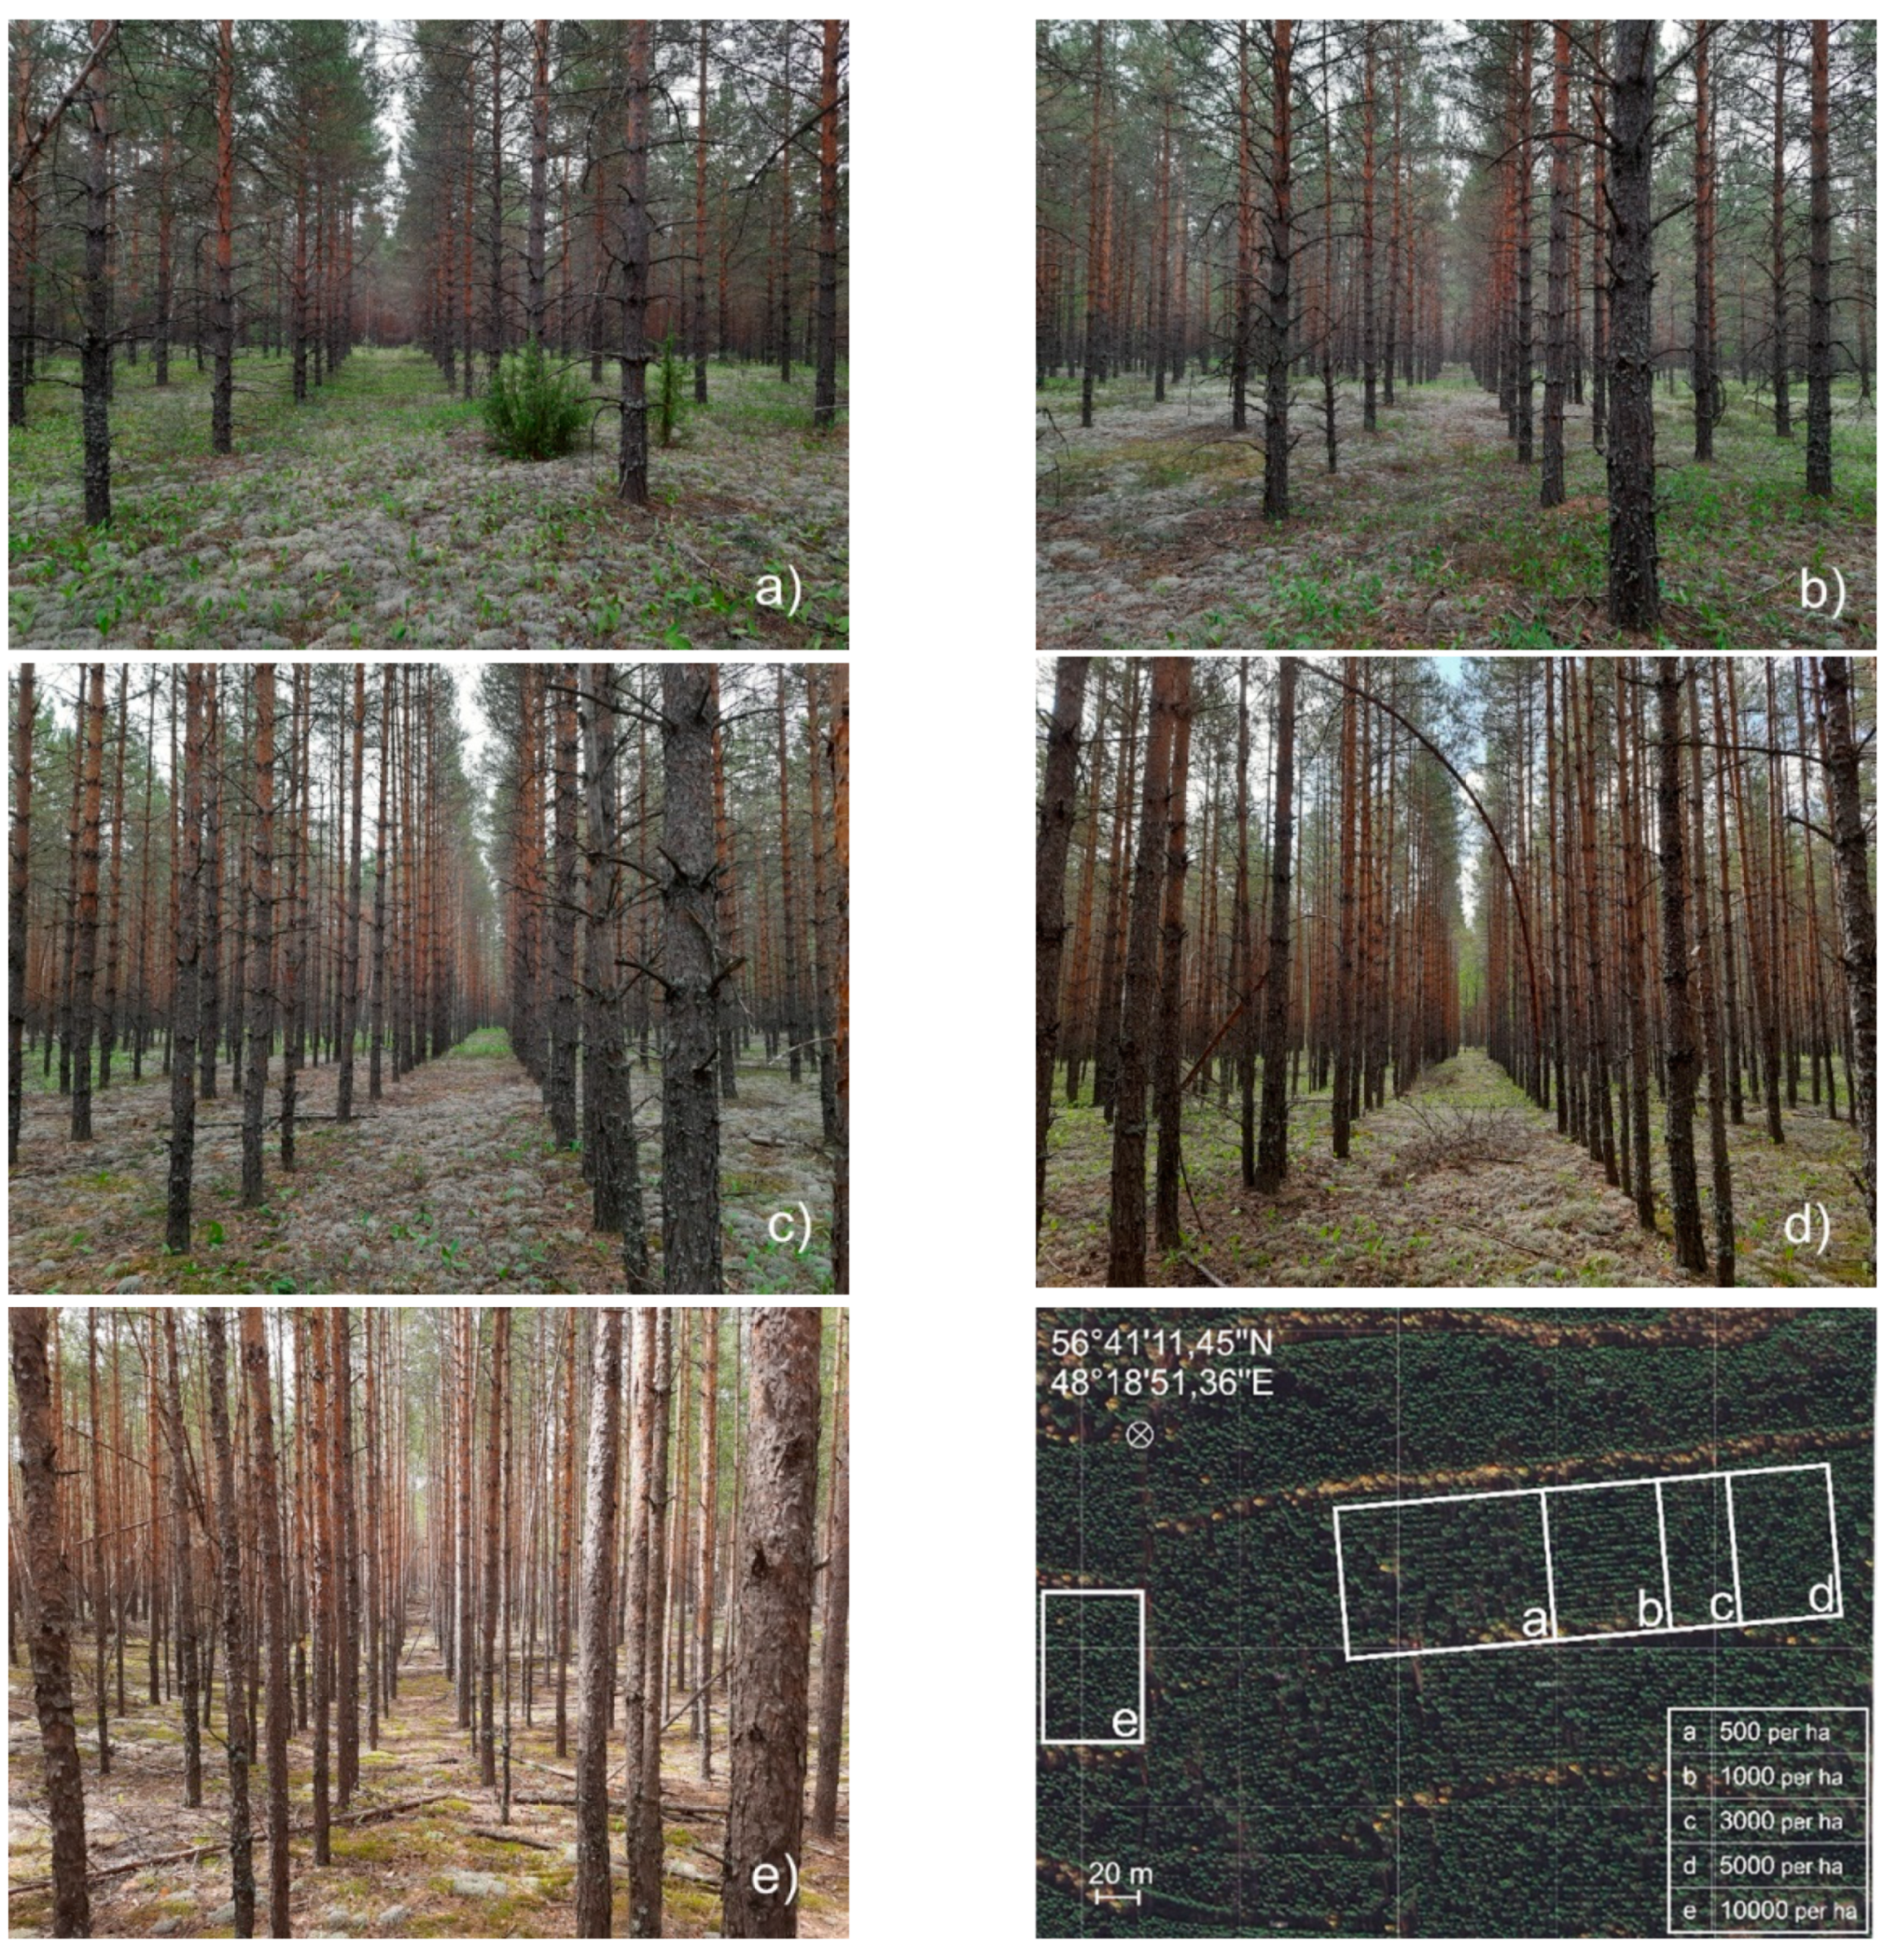
The Scots pine (Pinus sylvestris L.) plantations used in this research are located in the central part of the Mari El Republic, Russian Federation. Trees were selected from five experimental plots with densities of 500, 1000, 3000, 5000, and 10000 trees per ha (Figure 1). Tree planting was carried out in May 1977 on the site, which was originally covered with a 50-year-old natural pine forest destroyed by wildfire. The plantation was established with 2-year-old Scots pine seedlings and forest planting equipment. The research site has flat relief. The soil is dry, loose-sandy, subacid, low in nutrients, and soddy-low in podzolic acid [26]. The groundwater table is located at a depth of over six metres below the surface. The forest site type is lichen-dominated pine. The plots received no agrotechnical or silvicultural treatments.
Figure 1.
Photo-images and location of selected experimental plots with different initial stand density: (a) 500 trees per ha; (b) 1000 trees per ha; (c) 3000 trees per ha; (d) 5000 trees per ha; (e) 10000 trees per ha; (f) coordinates and scale of experimental plots.
Figure 1.
Photo-images and location of selected experimental plots with different initial stand density: (a) 500 trees per ha; (b) 1000 trees per ha; (c) 3000 trees per ha; (d) 5000 trees per ha; (e) 10000 trees per ha; (f) coordinates and scale of experimental plots.
2.2. Tree measurements
Lines of trees were randomly chosen from experimental plots. Twenty trees from each plot and a selected line (nearby lines) were measured for diameter, moisture content, drilling resistance, and ultrasound velocity at breast height (Figure 2). Moisture content was measured by GANN HT 85T and 40-mm-long needles (GANN Mess- und Regeltechnik GmbH., Stuttgart, Germany) from the north side using the electrical resistance method.
Ultrasound velocity was determined for each tree by the time-of-flight method. The transit time of the ultrasound wave was measured using the PULSAR-2.2 tool (Interpribor LLC, Chelyabinsk, Russian Federation) along the height of the trunk over 500 mm from the north side of the tree and radially through the trunk diameter in a north-south direction. Additional acoustic sensor indentations were made in the bark xylem prior to an acoustic measurement. After that, the transit time was adjusted while taking the average thickness of the tree bark into account. The mean transit time of five measurements was used to calculate the ultrasound velocity.
Figure 1.
Schematic diagram of drilling resistance (DR) and ultrasonic signal transit time (TT) measurements in radial direction (North-South); wood moisture content (MC), TT along the height of the trunk and extraction of wood core (North side of a tree).
Figure 1.
Schematic diagram of drilling resistance (DR) and ultrasonic signal transit time (TT) measurements in radial direction (North-South); wood moisture content (MC), TT along the height of the trunk and extraction of wood core (North side of a tree).
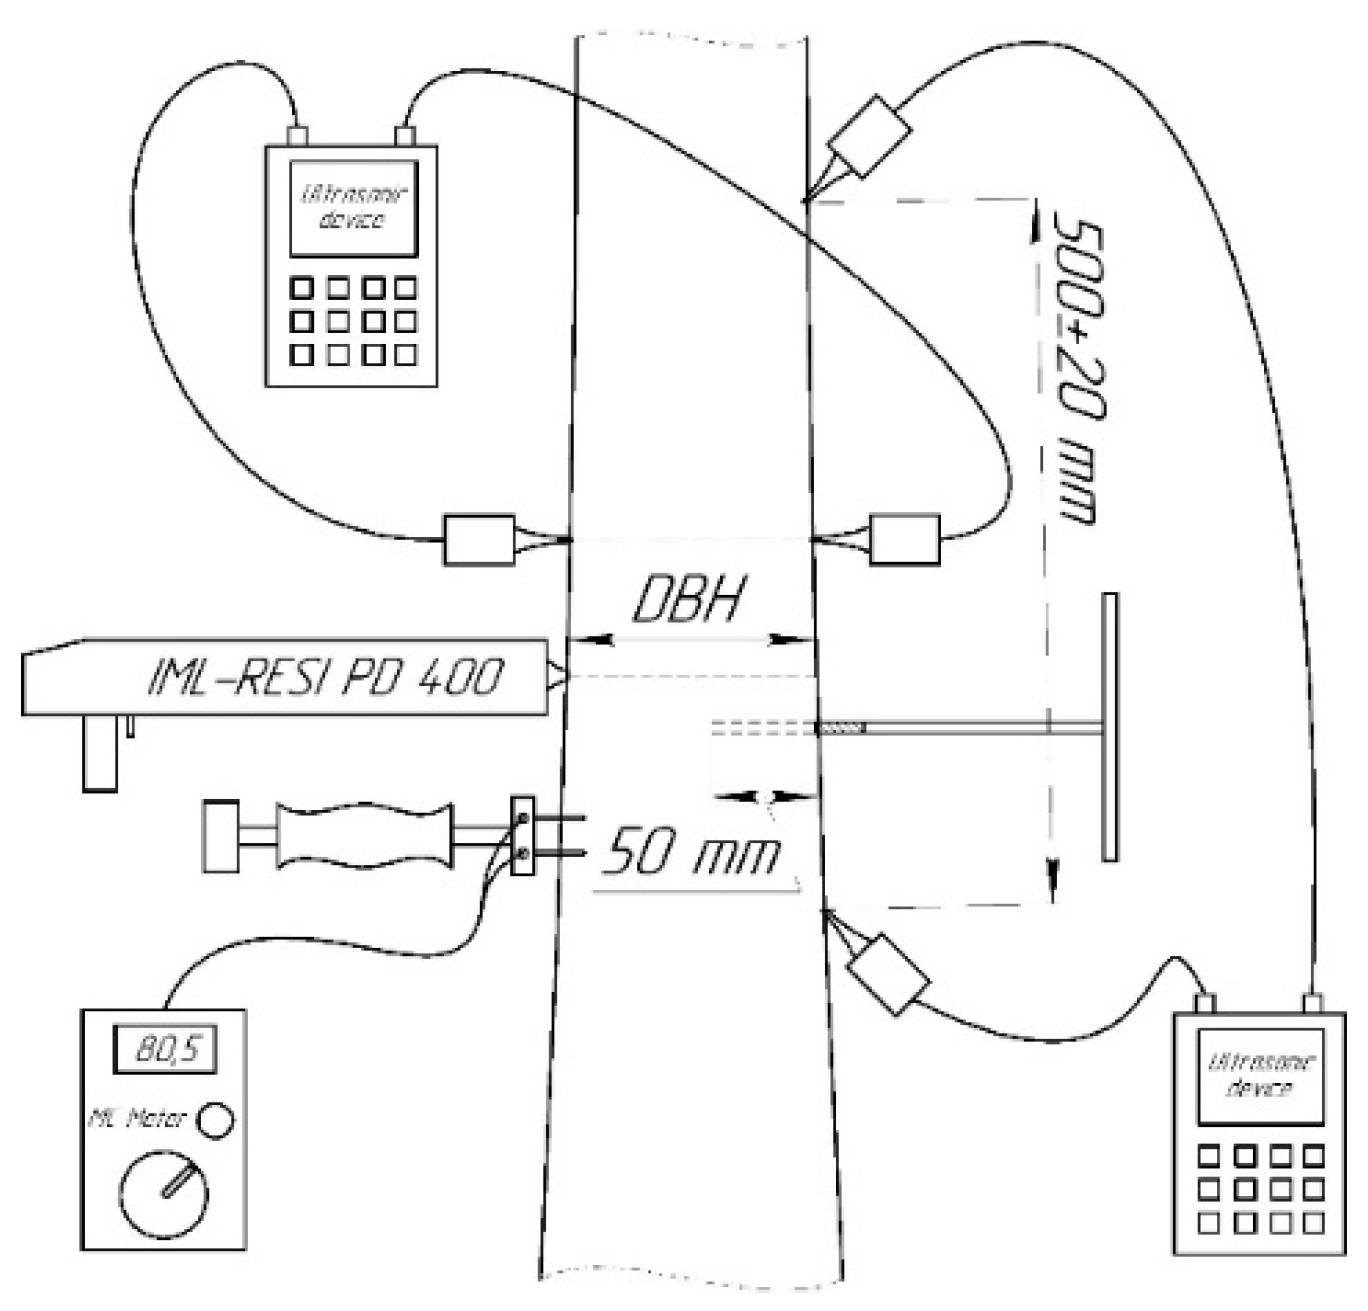
In order to conduct the DR measurements, an IML-RESI PD-400 tool and standard drill bit were used (IML System GmbH, Wiesloch, Germany). Measurements of drilling resistance were made from bark to bark at a constant feed rate of 1.5 m·min-1 and a rotating frequency of 2500 min-1 in the north-south direction. Drilling resistance and feeding resistance (FR) parameters were measured and digitally recorded every 0.1 mm of the drilling depth. The DR profiles obtained from each tree included a relative DR curve reflecting the torsion force on the drill bit and a FR curve reflecting the pressure exerted on the tool, both recorded in percentage of the amplitude. Drilling resistance and FR data were saved and processed using the PD-Tools PRO-V1.67. The DR profiles were adjusted by removing the shaft friction component [85,86,87,88] based on the hypothesis of its linear increase with increasing drilling depth.
A 5-cm-long (about 5-mm in diameter) core sample was extracted in close proximity (10-20 mm) to the location of DR holes from each tree for wood moisture content and basic density evaluation by the gravimetric method. The cores were placed in individual plastic tubes and measured later in the day. The volume of cores was evaluated in green condition by calliper (0.01 mm) with the core mean diameter evaluated in two directions: parallel and perpendicular to the grain direction. The mass of cores (0.001 g) was measured in green and oven-dried conditions. The basic density of wood cores was determined as [89]:
where ρb is the basic density (kg⋅m-3), m0 is the oven-dry mass (kg), and VMAX is the volume at green condition.
The moisture content of wood cores was evaluated according to standard [90] as the ratio between the mass of water in the core and the mass of the core in oven-dry conditions. Mean DR and FR corresponding to the 5-cm-long cores (without DR data for bark and phloem) were compared between groups of trees with varied plantation densities and correlated with wood basic density. The estimated parameters of trees and wood properties, their corresponding acronyms, and coding to make the data easier to read are presented in Table 1.
In order to evaluate the impact of variables on the observed physical properties of wood, the study also briefly summarises the findings of the author's earlier research on the growth rate of trees on experimental plots.
The statistical differences between the mean values were assessed using ANOVA and Tukey’s HSD (honestly significant difference). All statistical analysis has been performed in Microsoft Excel®, Statistica 10 (Dell Technologies Inc., Round Rock, TX, USA) and SigmaPlot 14 (Systat Software Inc., San Jose, CA, USA) at the 95% confidence level.
3. Results and Discussion
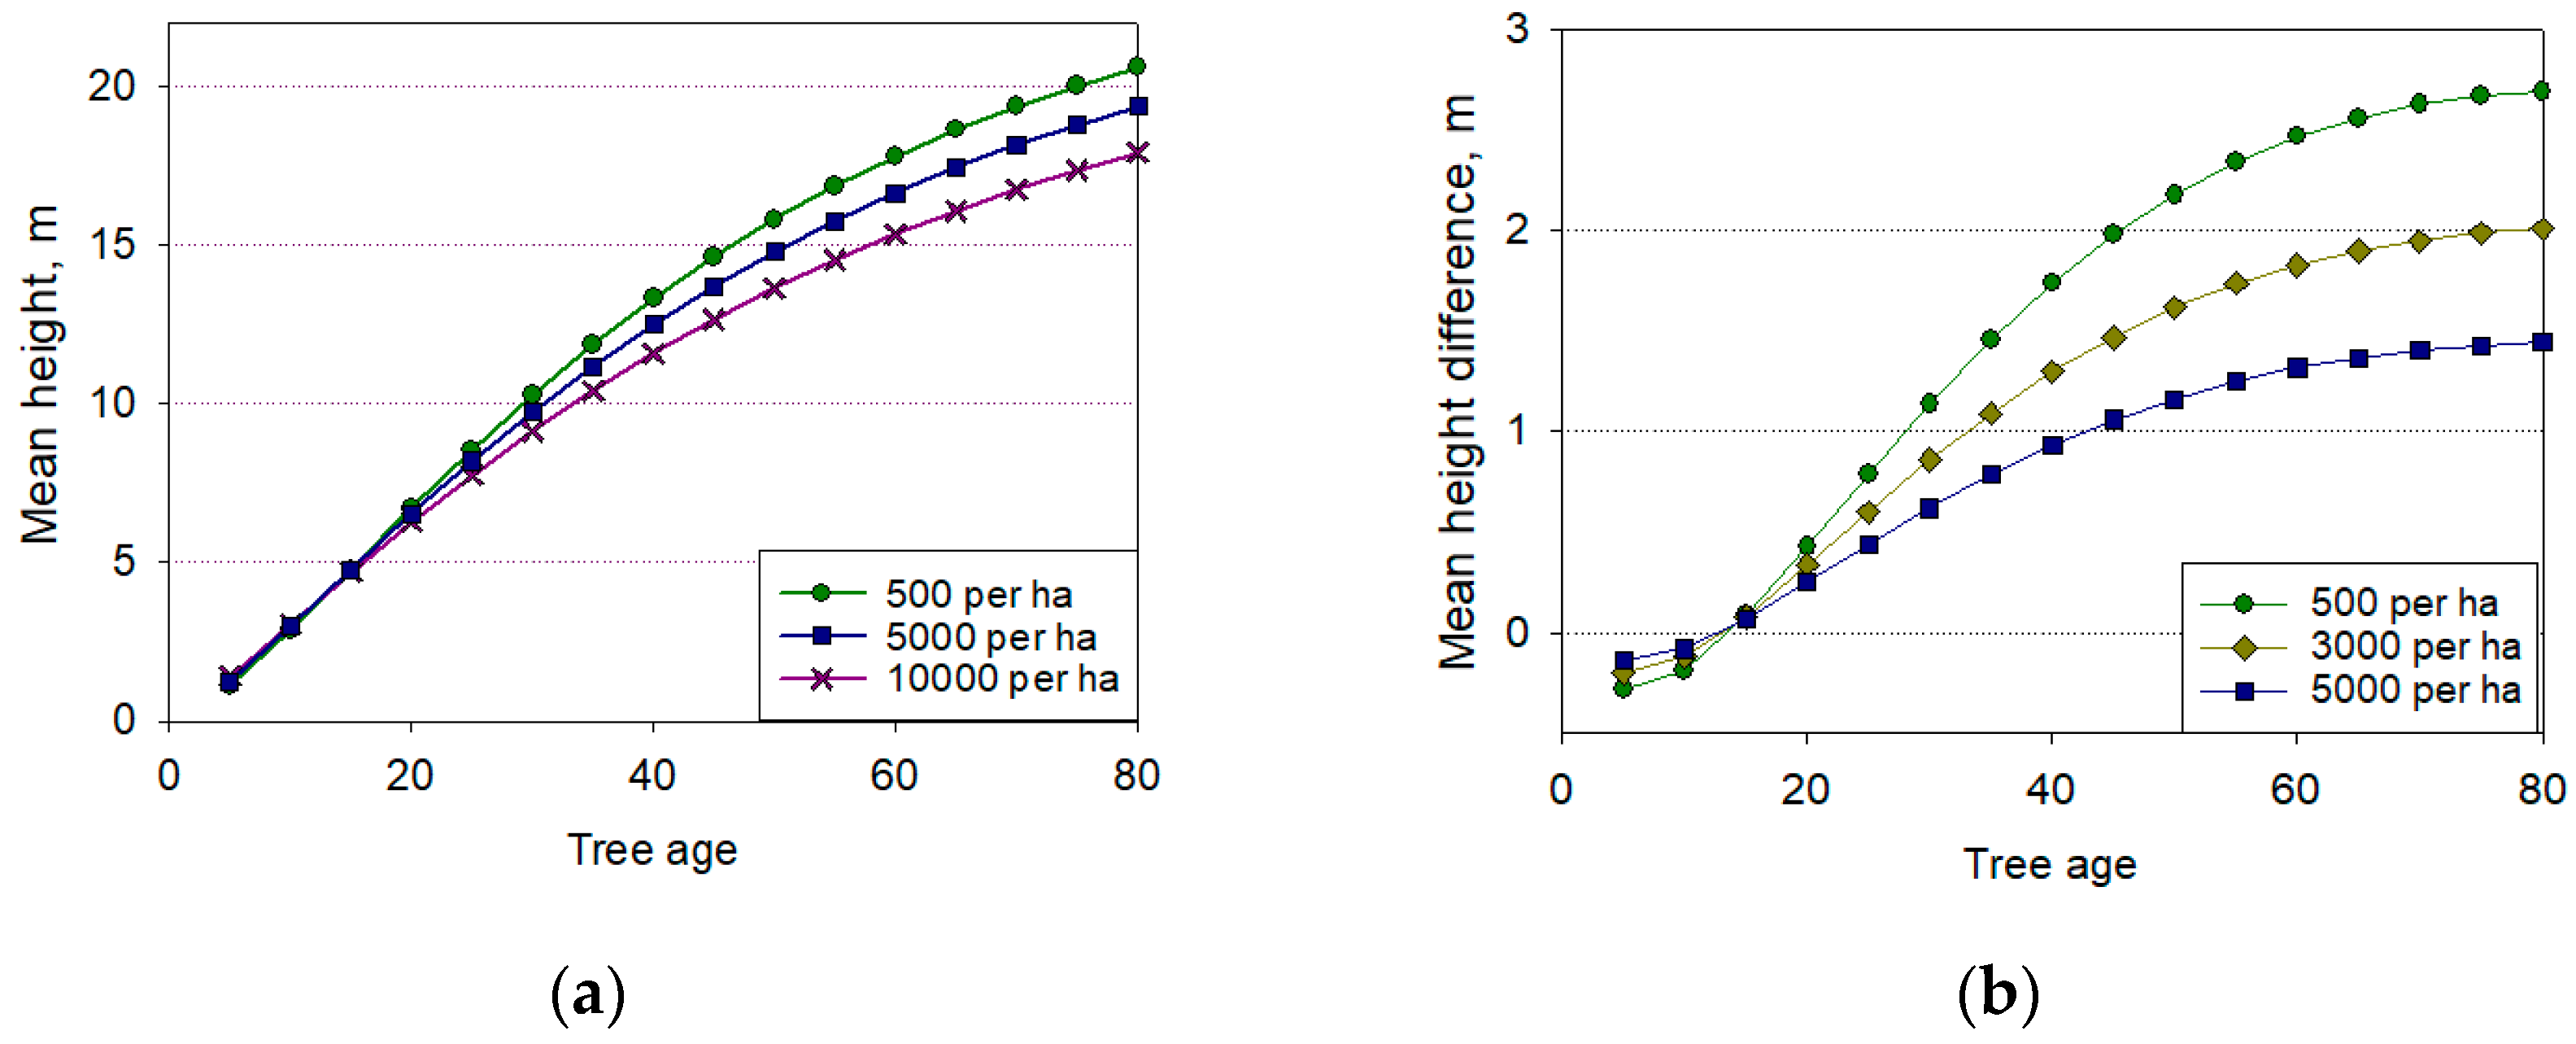
According to our earlier research findings [26], the impact of the initial stand density on the condition and inventory metrics of trees is more or less evident even after five years. As the forest stand grows, these differences become more pronounced. While there are notable variations throughout the experiment's versions, the stand density had the least impact on their height and annual increment. So, within six years after the plantation establishment, the plots with the highest stand density had the highest annual increase in height (Figure 3), which is associated with the so-called Allee effects [91,92]. Accordingly, the development progress and resistance to adverse environmental factors significantly increase in species growing in groups compared to single trees. Upon crown closure, this effect is gradually overlapped by the competitive relations between them in cenoses. After 25 years, the largest annual increase in height was observed in plantations with the lowest initial stand density, which at the age of 40 years exceeded the height of densely planted stands by 1.7 m. The differences get much more significant with time, as demonstrated by the prediction models in Figure 4.
Figure 3.
Dynamics of trees on experimental plots: (a) Annual increase in height; (b) Radial growth.
Figure 3.
Dynamics of trees on experimental plots: (a) Annual increase in height; (b) Radial growth.
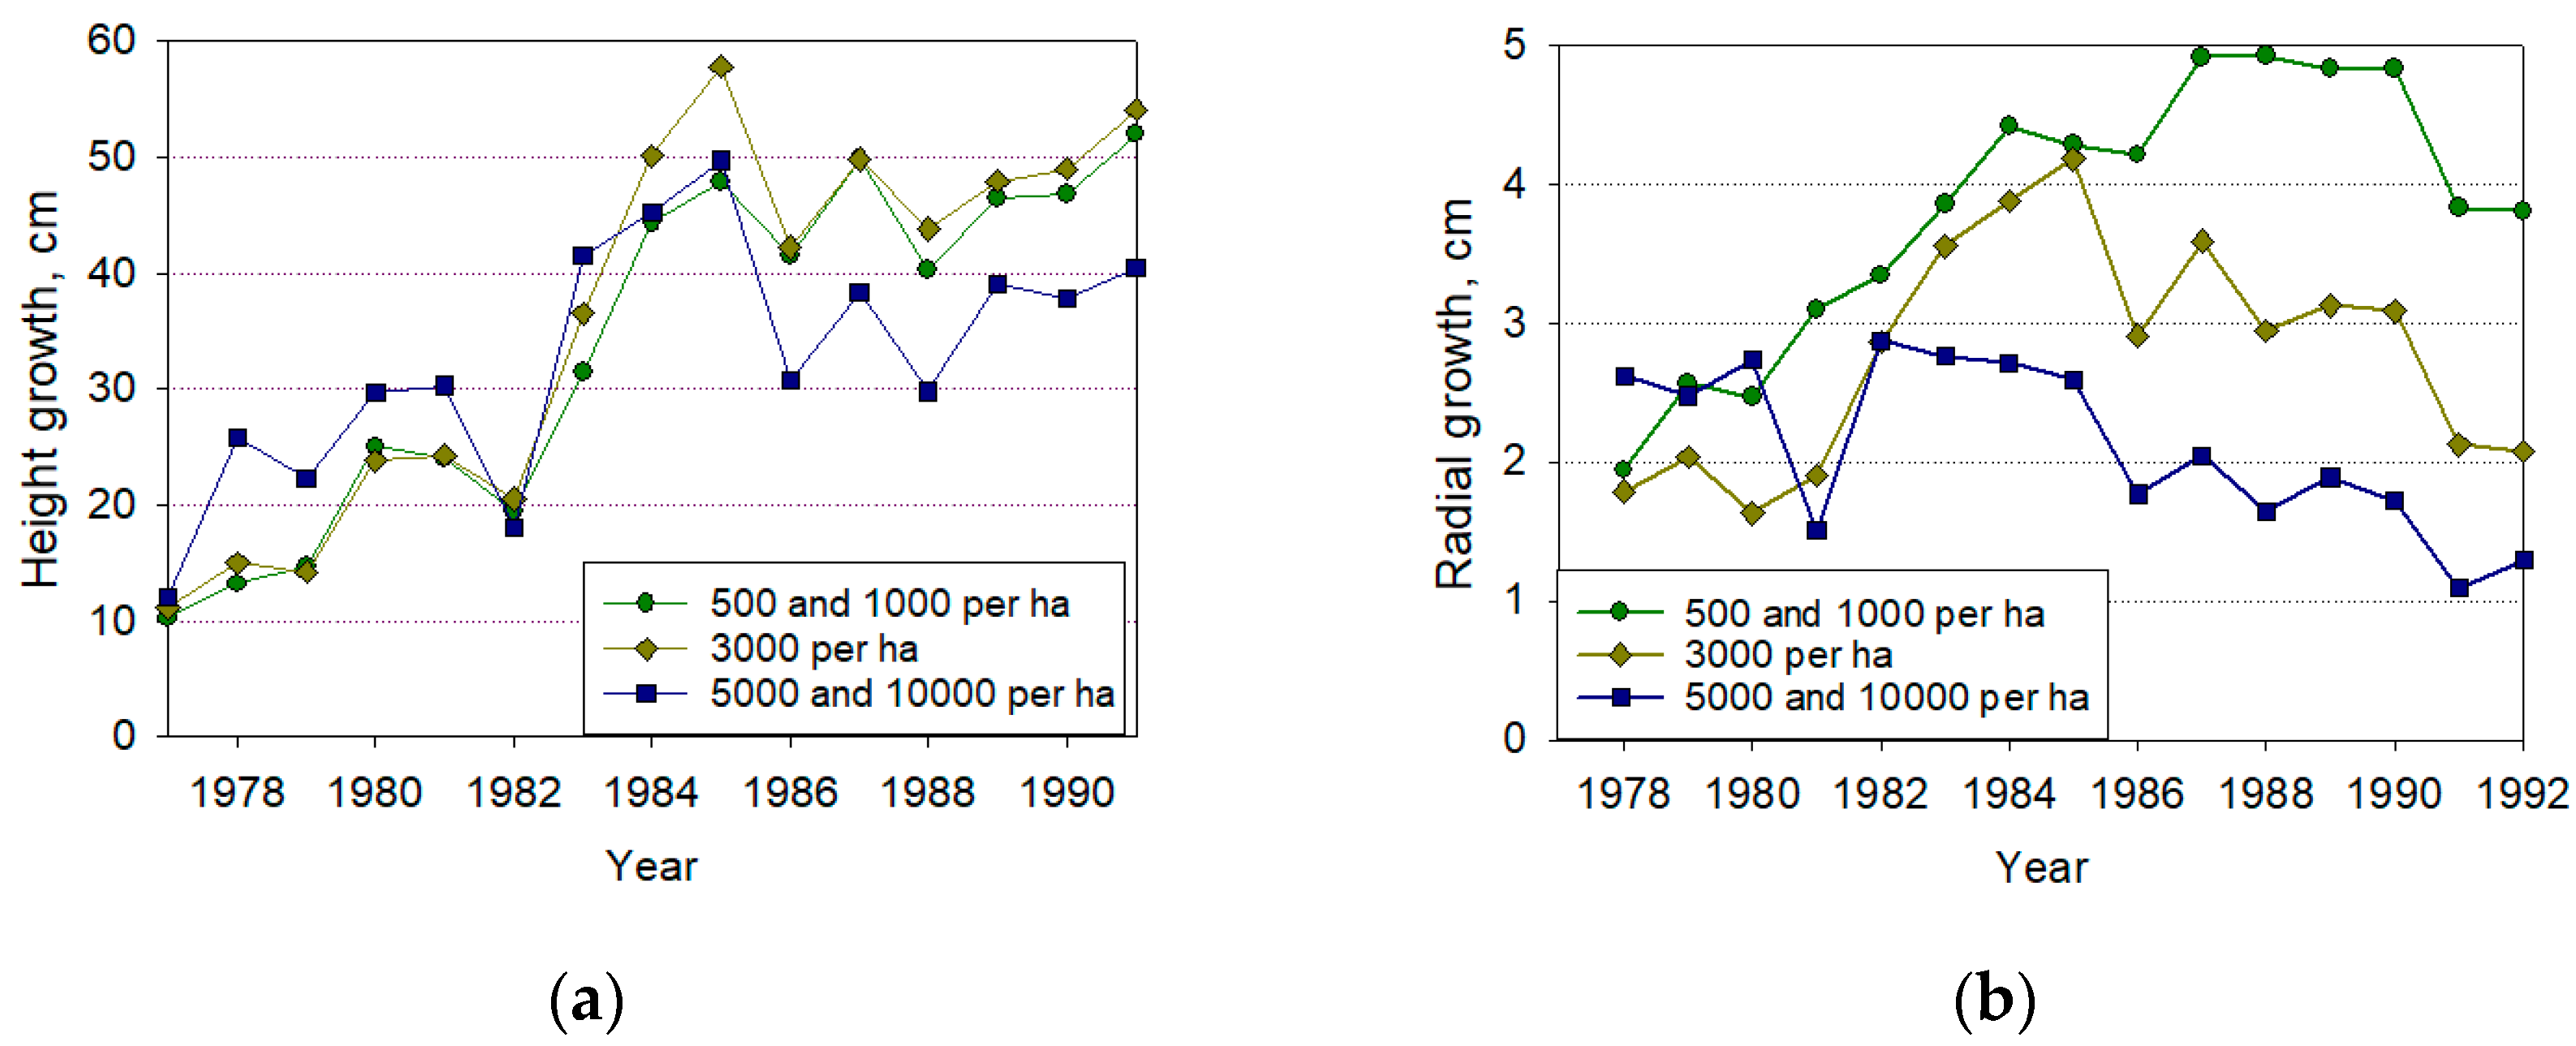
Figure 4.
Predicted models for trees on experimental plots: (a) Mean height of trees; (b) difference between mean height in relation to mean height of trees for stand density 10000 trees per ha.
Figure 4.
Predicted models for trees on experimental plots: (a) Mean height of trees; (b) difference between mean height in relation to mean height of trees for stand density 10000 trees per ha.
It has been found that there are considerable variations within the estimated parameters of the trees and wood characteristics on the experiment plots. Significant variations occur in the mean DBH (X1), the mean width of annual layers (X2), the proportion of the latewood (X3), and the gravimetric moisture content of wood (X5) (Table 2). The value of the ultrasound velocity in wood undergoes the least changes (X6, X7). The basic density of wood, as a target indicator of its quality, varied from 356 to 578 kg⋅m-3 with mean value 434 ± 3.3 kg⋅m-3. The variability of tree parameter values is a source of natural selection of individuals in coenopopulations, ensuring their sustainable development. The heterogeneity of cenopopulations also indicates the possibility of selection of the most promising individuals for a target trait.
The effect of the initial stand density on the variation of the estimated parameters was different. It most significantly influenced the MC, mean width of annual layers, and DBH variability (62.1–72.7%, Table 3). Less impact of the initial stand density was on ultrasound velocity along the tree trunk, and particularly, the basic density of wood, which is consistent with previous studies [26,44].
Most of the parameters exhibited significantly different values across all experiment variations, indicating the heterogeneity of the tree population (Table 4). Thus, the highest values were observed in the DBH, proportion of latewood, MC, and DR on the experiment plot with the lowest stand density. The ultrasound velocity in wood along the height of the trunk was minimal. On the experimental plot with a stand density of 10000 trees per ha, the wood basic density was the maximum, and the values of most of the other estimated parameters were minimal. The highest values of ultrasound velocity along the height of the trunk were observed on plots with a density of 5000 trees per ha, while the highest DBH was observed on plots with a stand density of 1000 trees per ha.
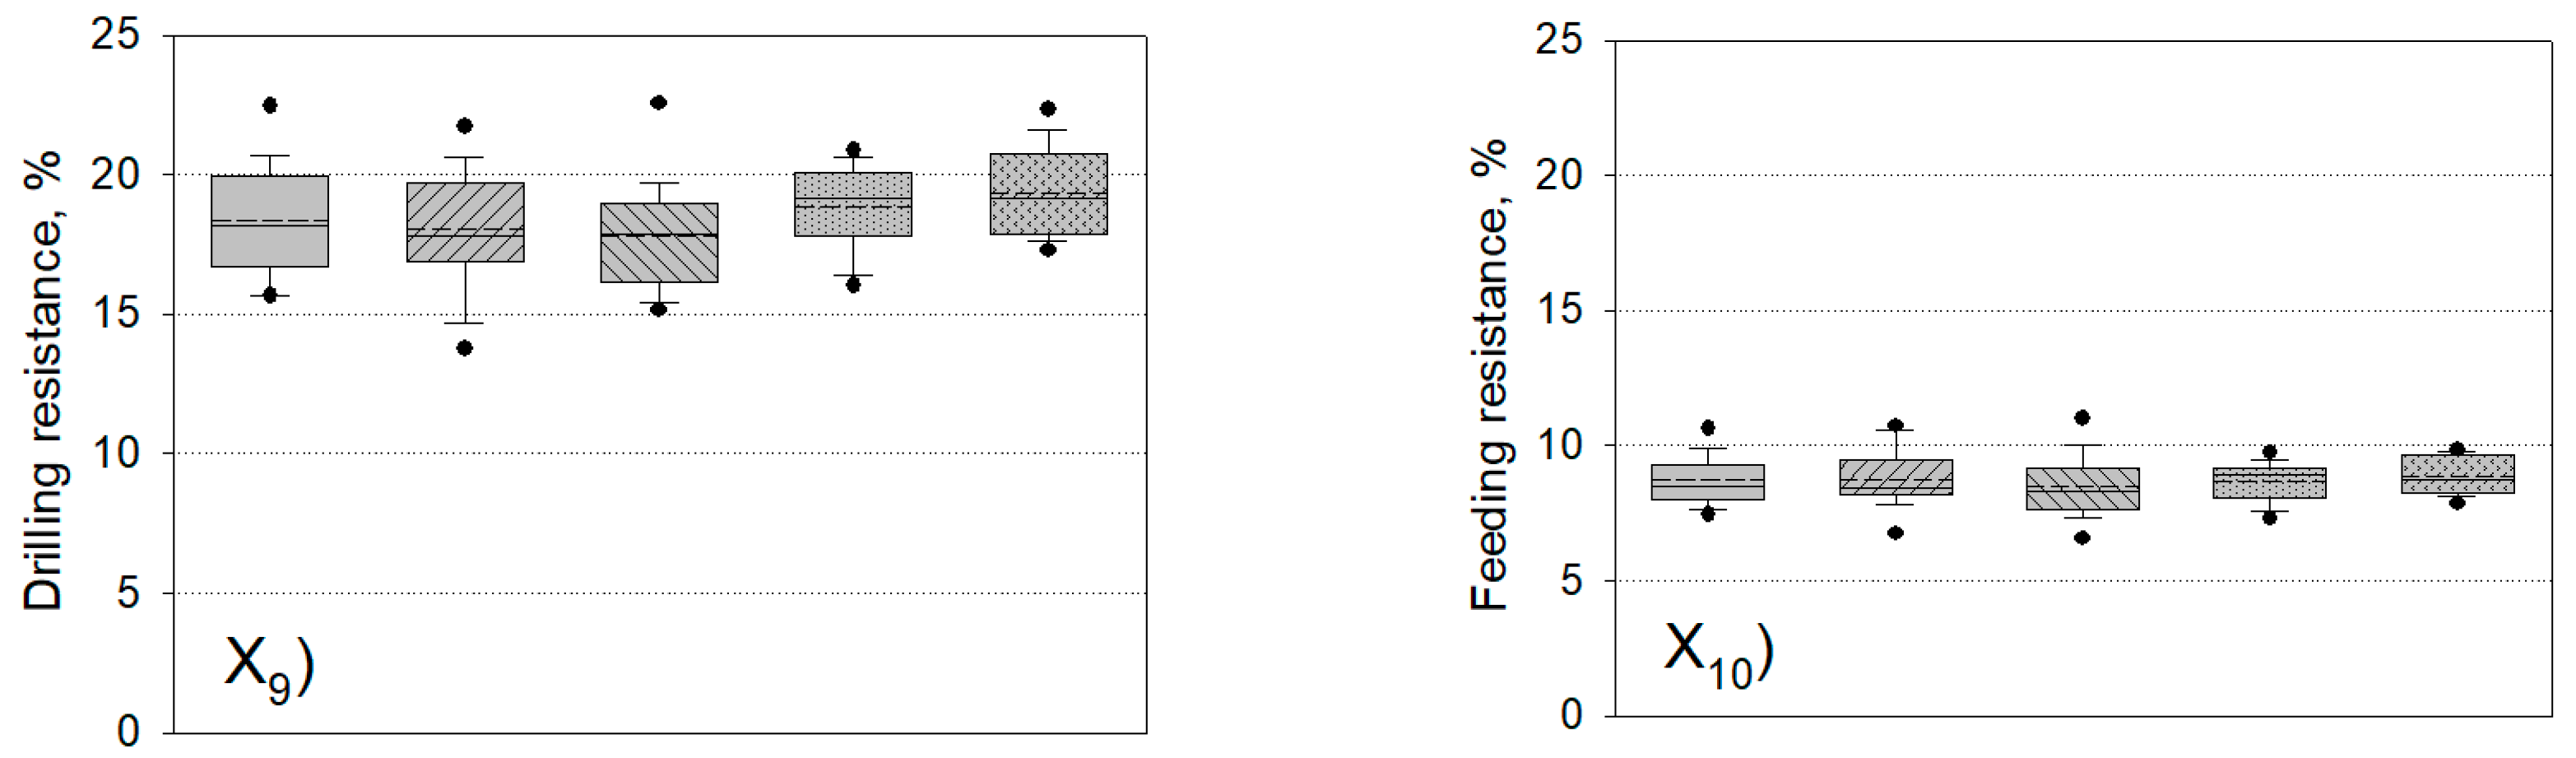
Figure 5 shows box-plot diagrams illustrating the range of the estimated parameters distributed by initial plantation density.
Figure 5.
Influence of the initial stand density on: X1 - diameter at breast height (DBH); X8 - basic density of wood; X4 - moisture content evaluated by the electrical resistance method (MCERM); X5 - moisture content evaluated by the gravimetric method (MCGM); X6 - ultrasound velocity along the height of the trunk (UVH); X7 - ultrasound velocity through the trunk (UVD); X9 - mean drilling resistance corresponding to tree diameter; X10 - mean feeding resistance corresponding to tree diameter. Box - 25th-75th percentiles; whiskers 10th-90th percentiles; dots 5th-95th percentiles; solid line in the box is the median, dash-line is the mean.
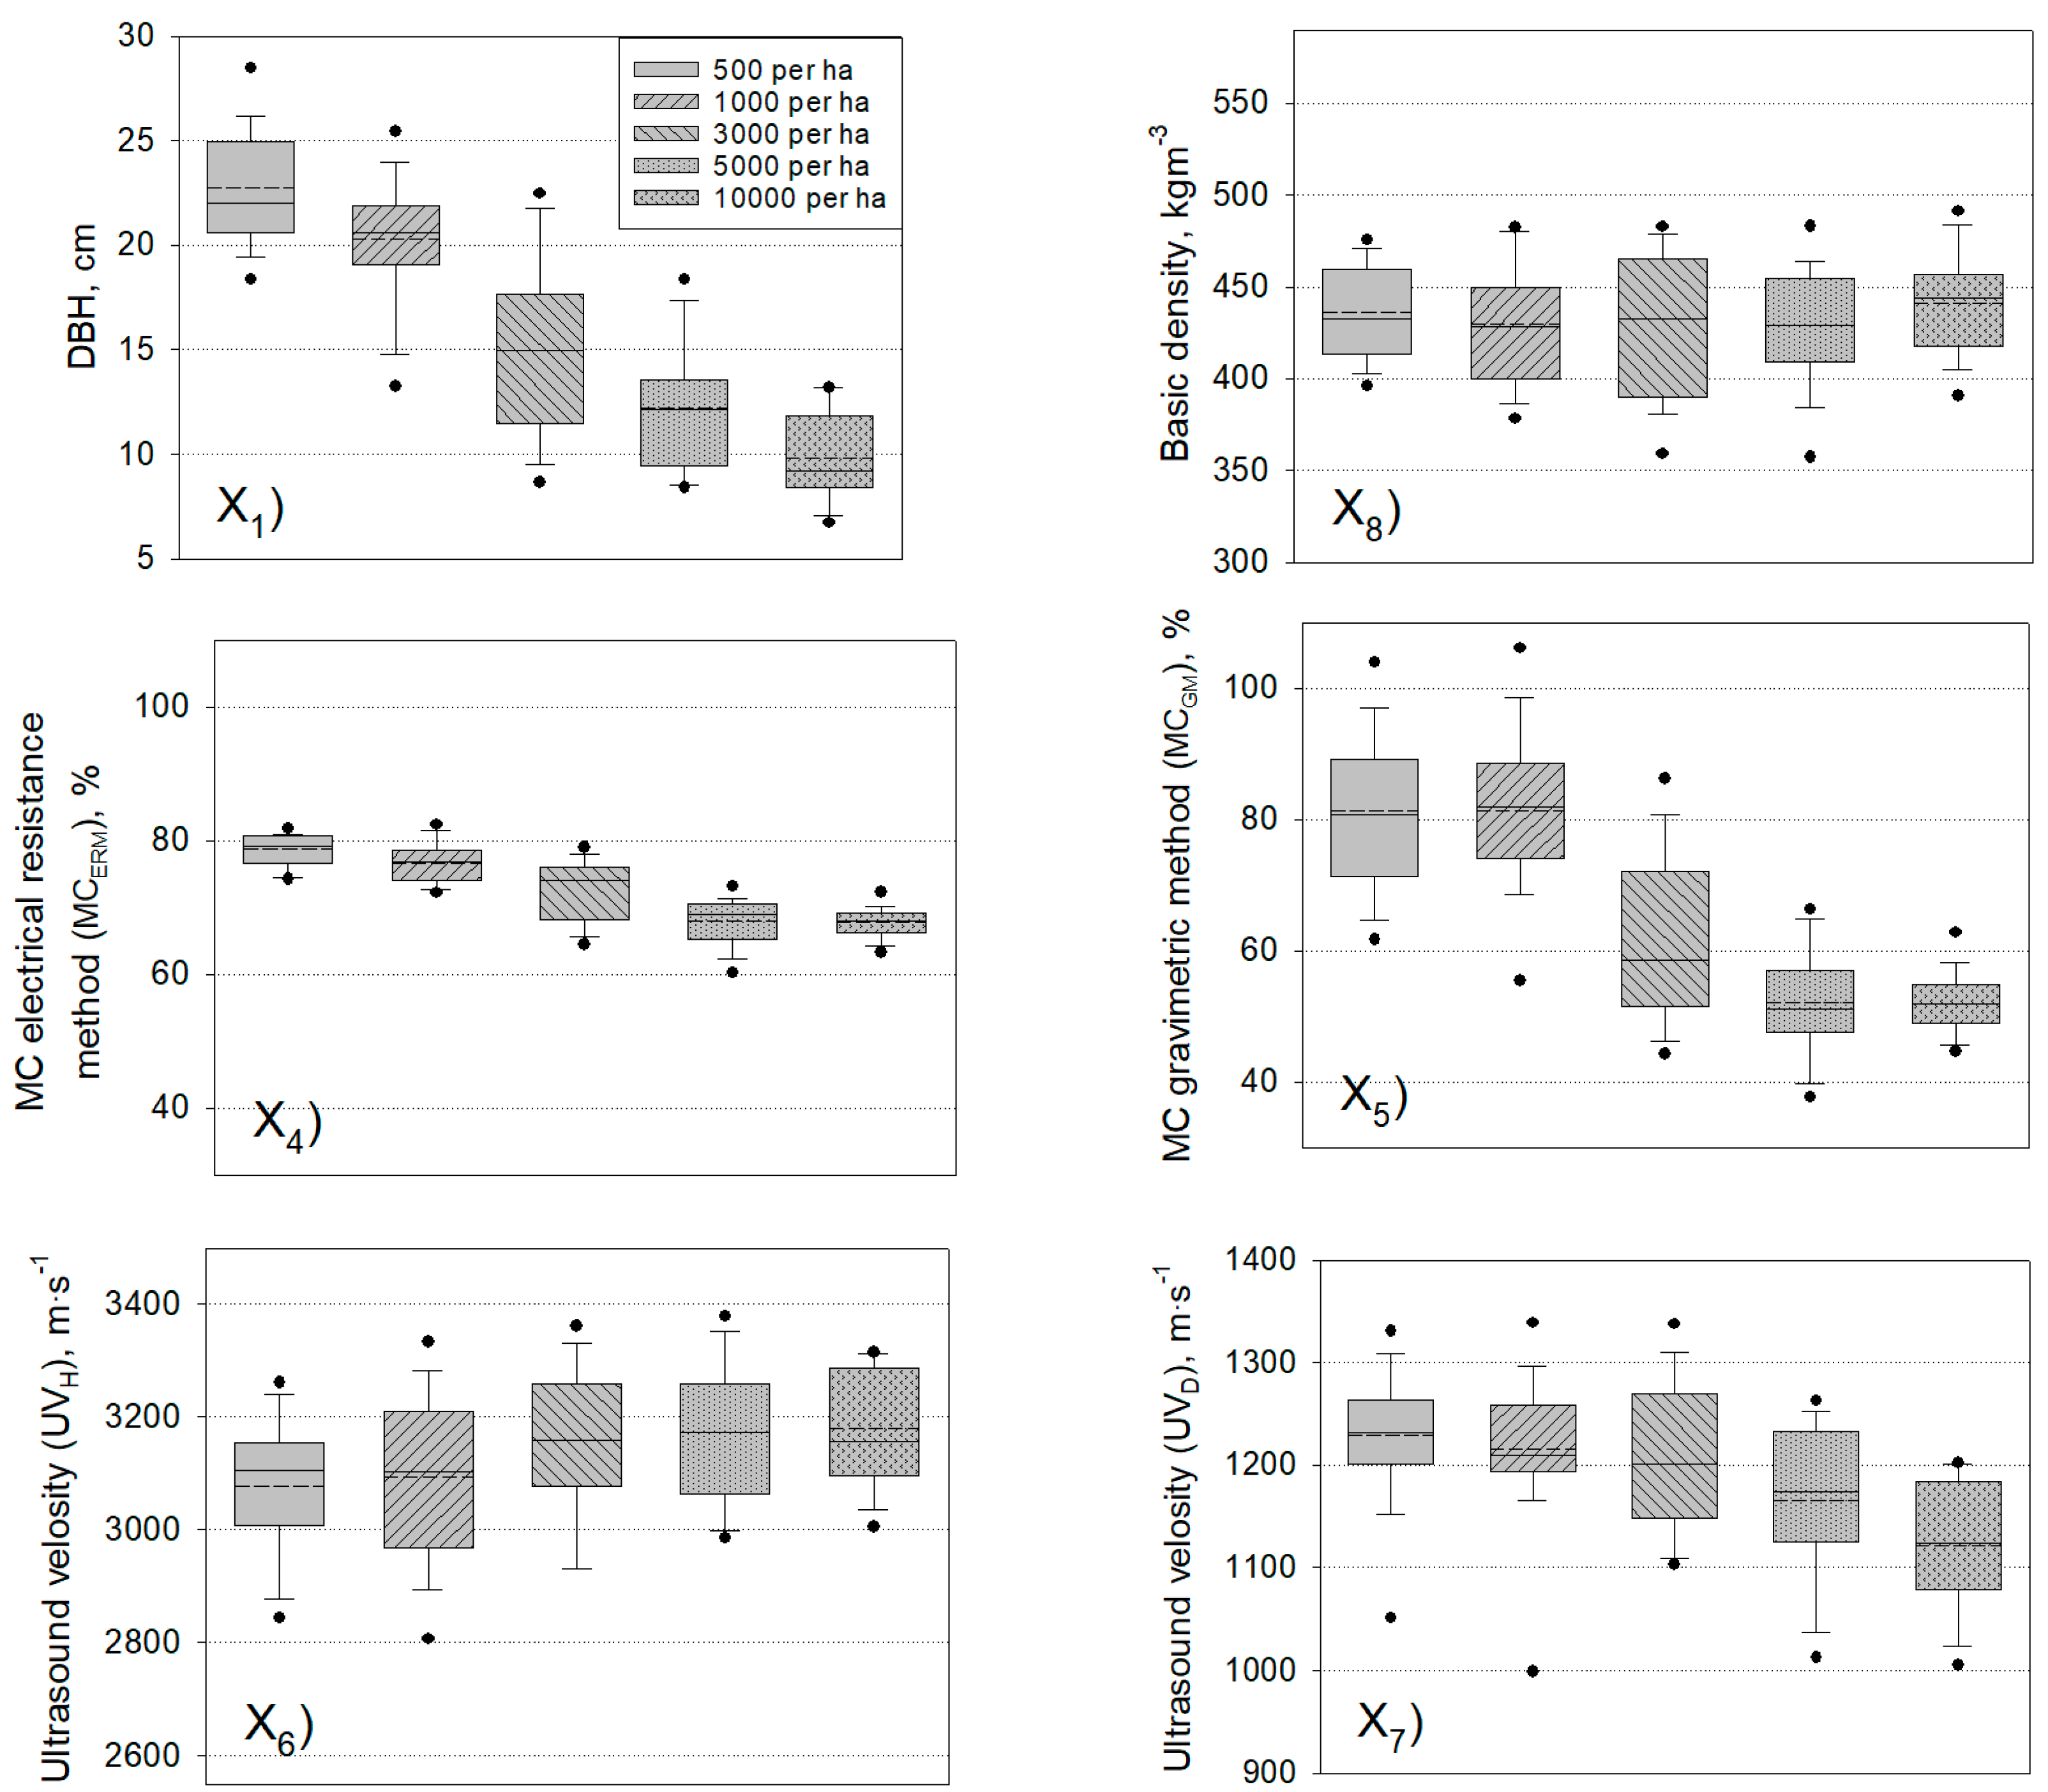
The absence of a statistically significant effect of the initial stand density on the UVH is consistent with the previously obtained results for red pine (Pinus resinosa) and jack pine (Pinus banksiana) with two groups of initial plantation density >1997 and <988 trees per ha [83].
According to the data presented, the main contribution to the dispersion of most of the estimated parameters is made by the individual characteristics of trees. These characteristics are likely fixed in the tree's genome and show up in the initial data series as odd noises that distort the influence of the factor of the initial stand density. The value of the standard deviation of the parameters changes according to the experiment variations without any discernible pattern, reflecting the varying representativeness of the genotype of trees in cenopopulations. Thus, for example, the experimental plot with an initial stand density of 3000 trees per ha had the highest variability in DBH, UVH, and sapwood MC measured by the electrical resistance method. (Table 5, Figure 5). Plots with stand densities ranging between 500 and 1000 trees per ha had the highest values of the standard deviation of the mean width of the annual layer. Plots with a stand density between 500 and 10000 trees per ha had the highest standard deviation of the proportion of latewood. The highest standard deviation was also observed for: sapwood moisture content estimated by the gravimetric method on plots with a stand density ranging between 1000 and 3000 trees per ha; ultrasound velocity through the plot with a density of 500 trees per ha and wood basic density on the plot with the initial 1000 trees per ha.
Some series of the estimated parameters from which a small number of outliers were removed had a strong correlation (Table 6, Figures 6–8).
The lower level of significant correlation coefficient was 0.25
Figure 6.
Correlation between diameter at breast height (DBH, X1) and moisture content (MC): (a) MC evaluated by the electrical resistance method (MCERM, X4); (b) MC evaluated by the gravimetric method (MCGM, X5). R2 coefficient of determination; SEE standard error of the estimate; CB confidence band.
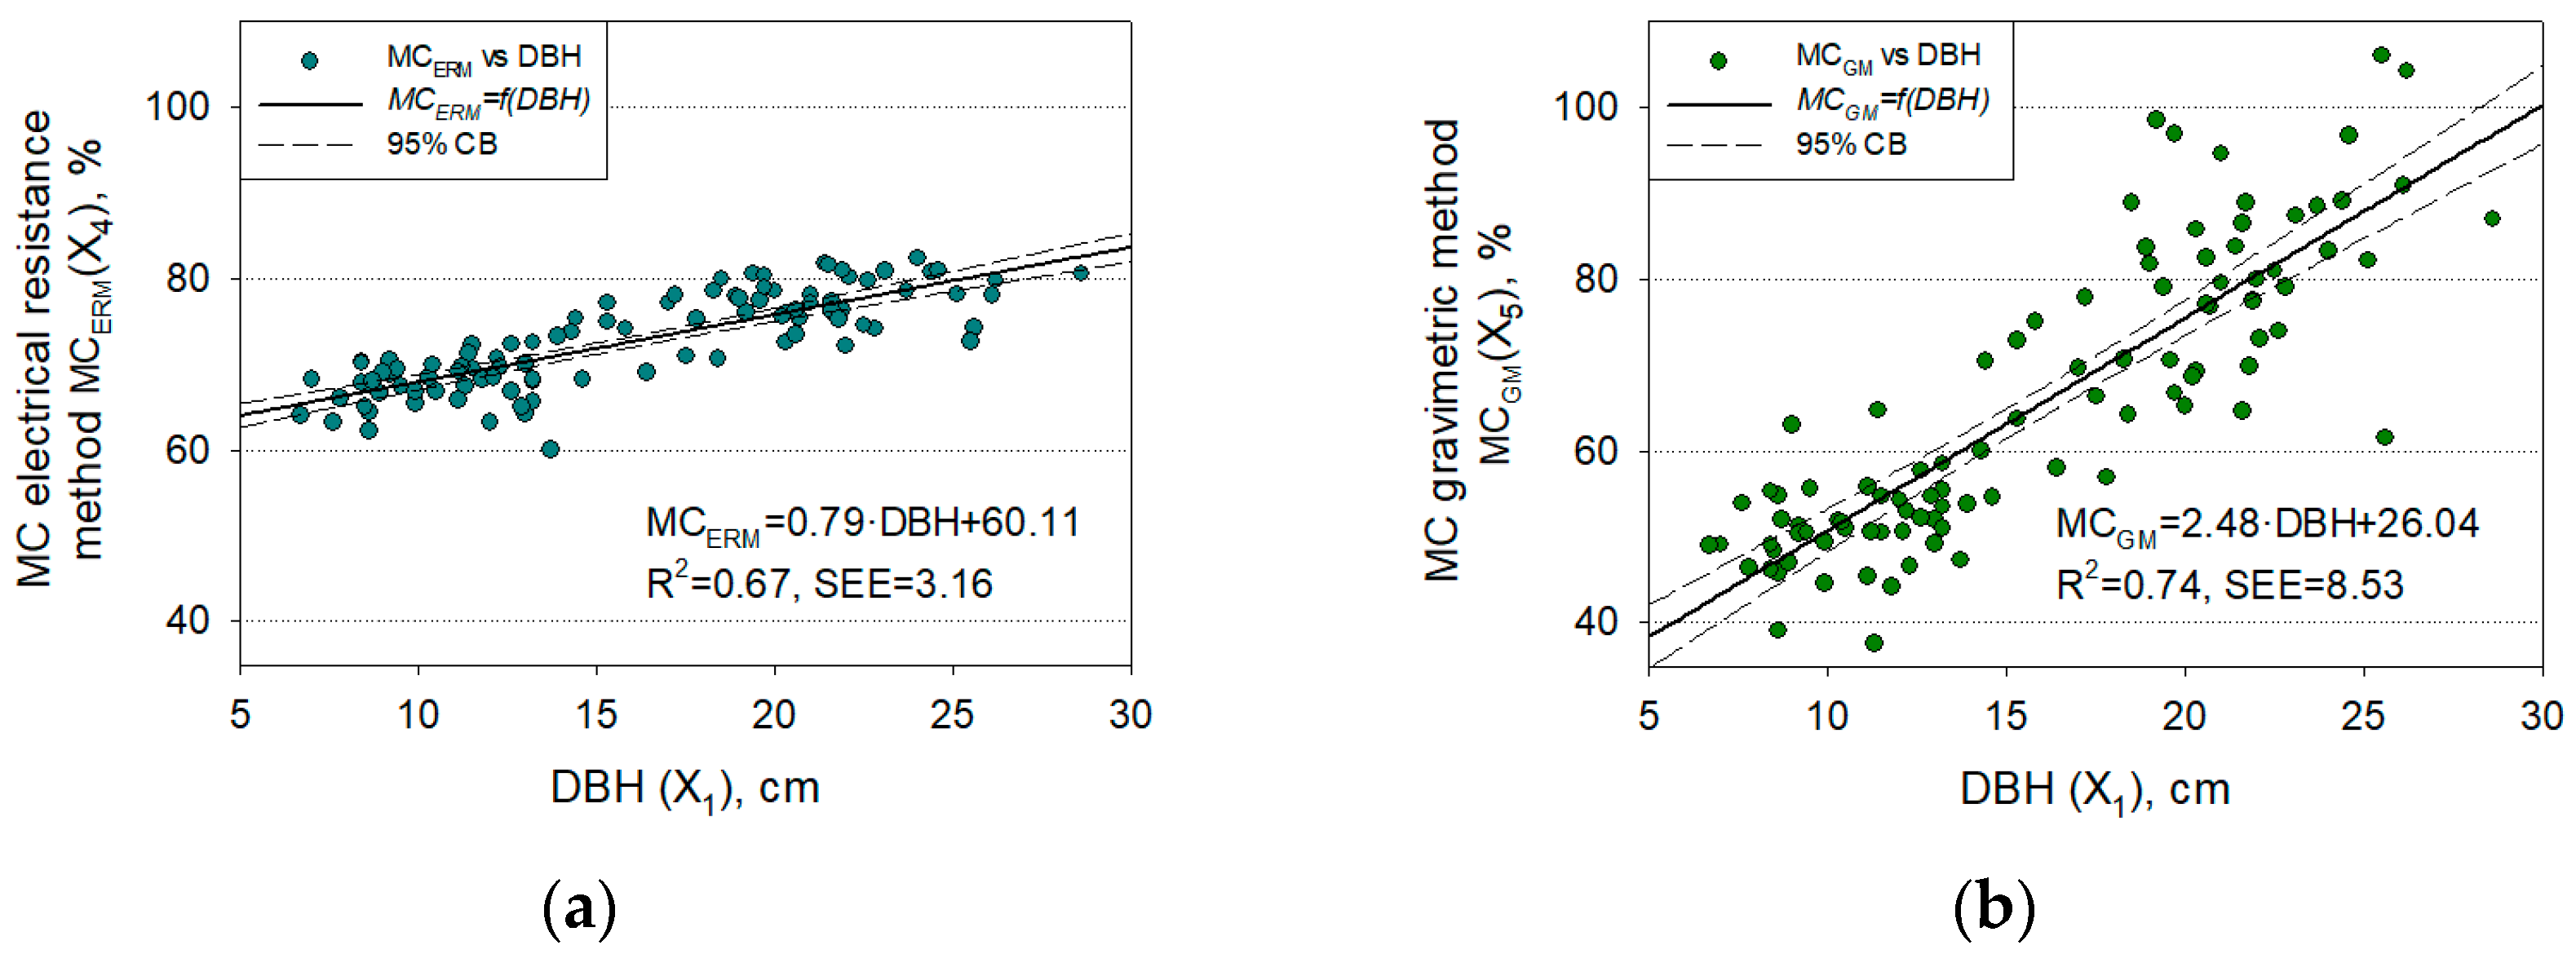
Figure 7.
Correlation between moisture contents evaluated by the gravimetric (MCGM, X5) and electrical resistance (MCERM, X4) methods. R2 coefficient of determination, SEE standard error of the estimate, CB confidence band.
Figure 7.
Correlation between moisture contents evaluated by the gravimetric (MCGM, X5) and electrical resistance (MCERM, X4) methods. R2 coefficient of determination, SEE standard error of the estimate, CB confidence band.
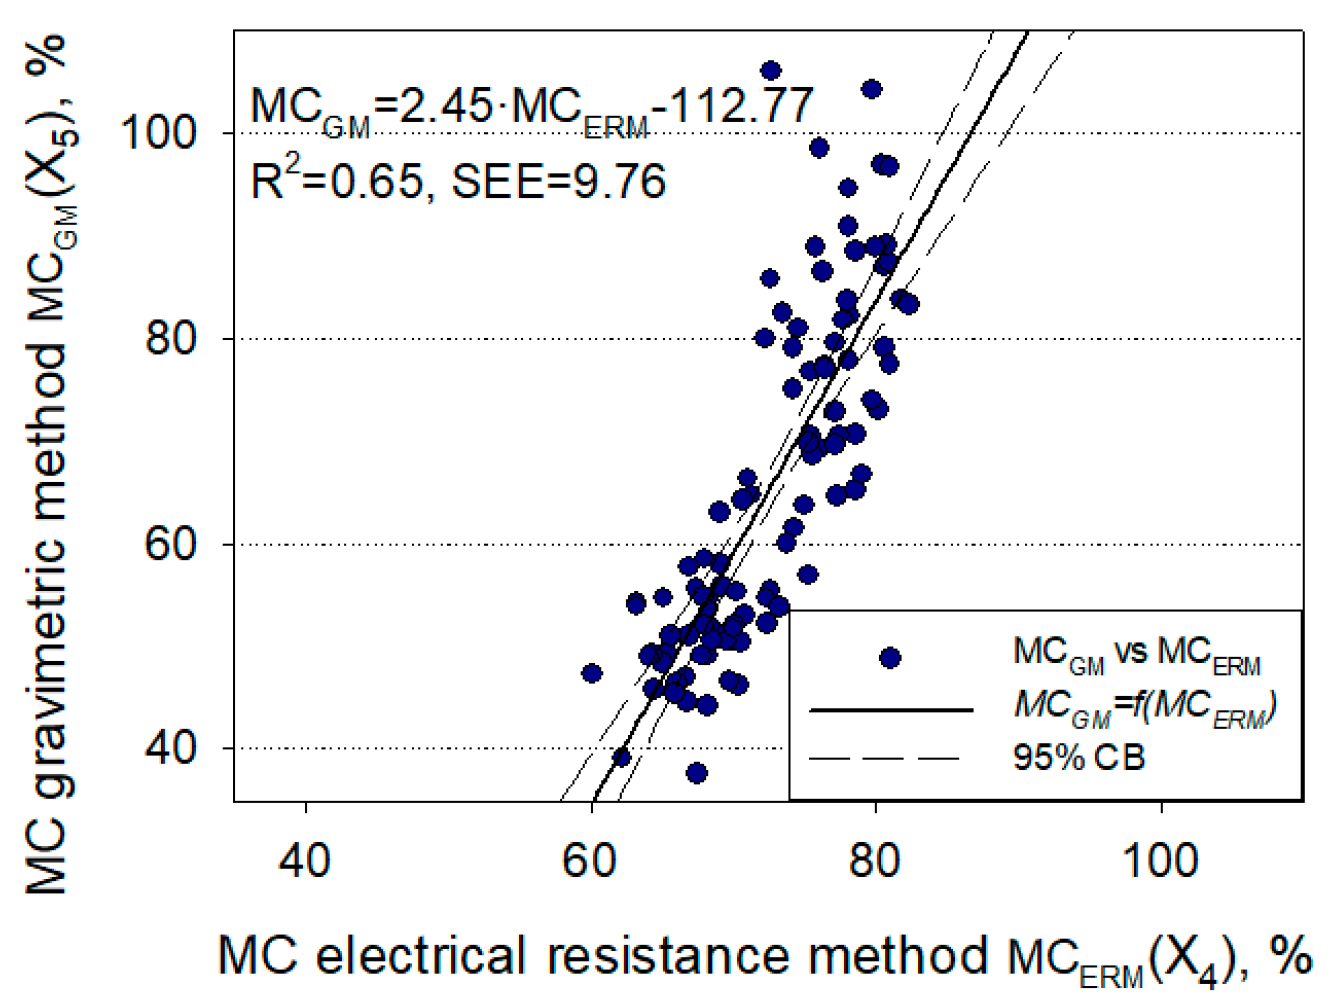
Figure 8.
Correlation between the diameter at breast height (DBH) and ultrasound velocity through the trunk diameter (UVD) at breast height (circled data are excluded from the linear model).
Figure 8.
Correlation between the diameter at breast height (DBH) and ultrasound velocity through the trunk diameter (UVD) at breast height (circled data are excluded from the linear model).
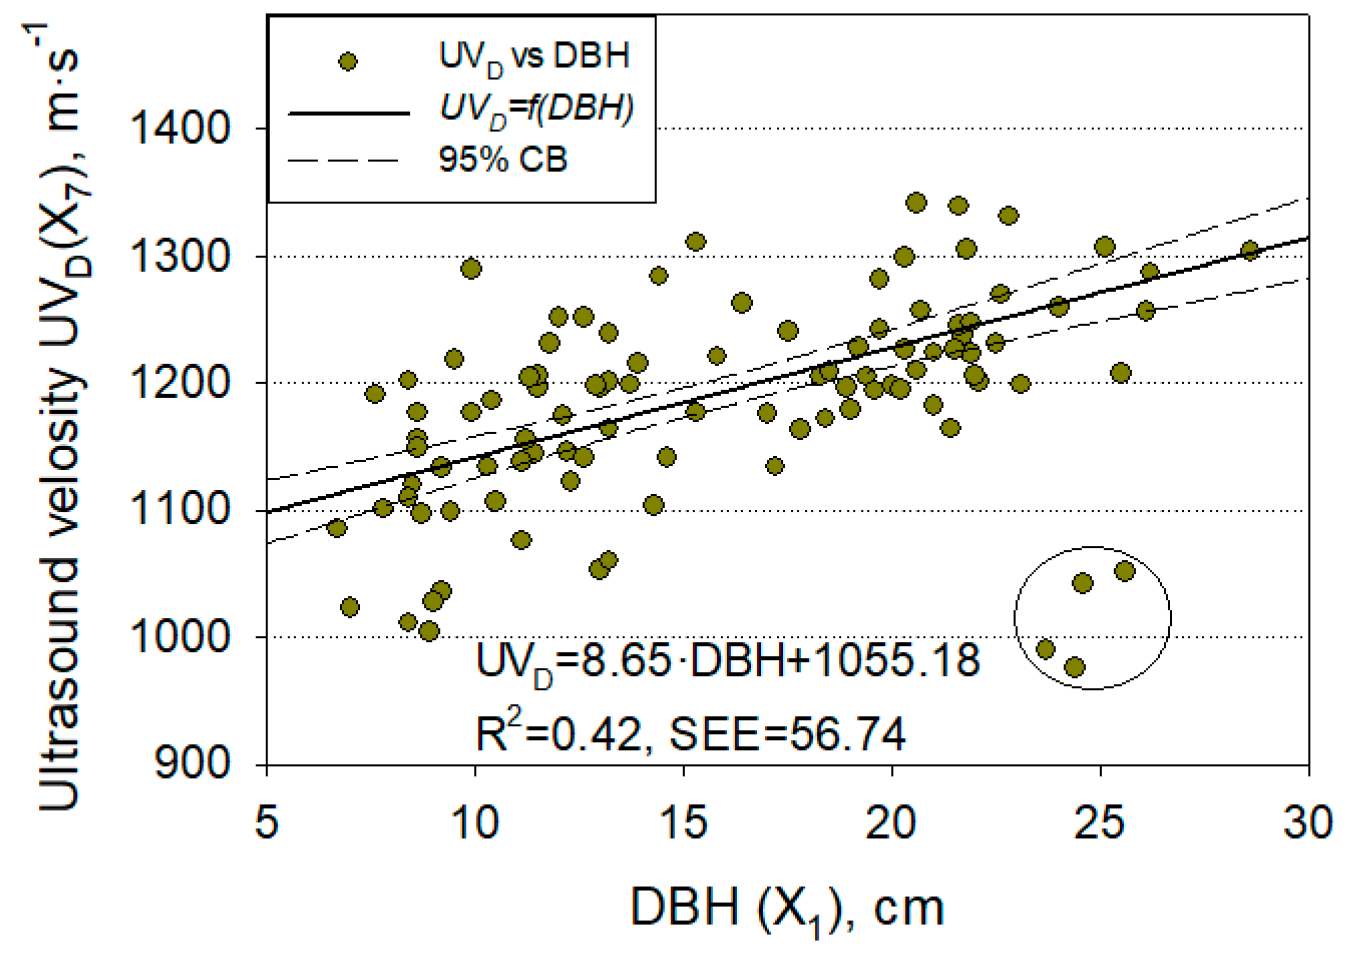
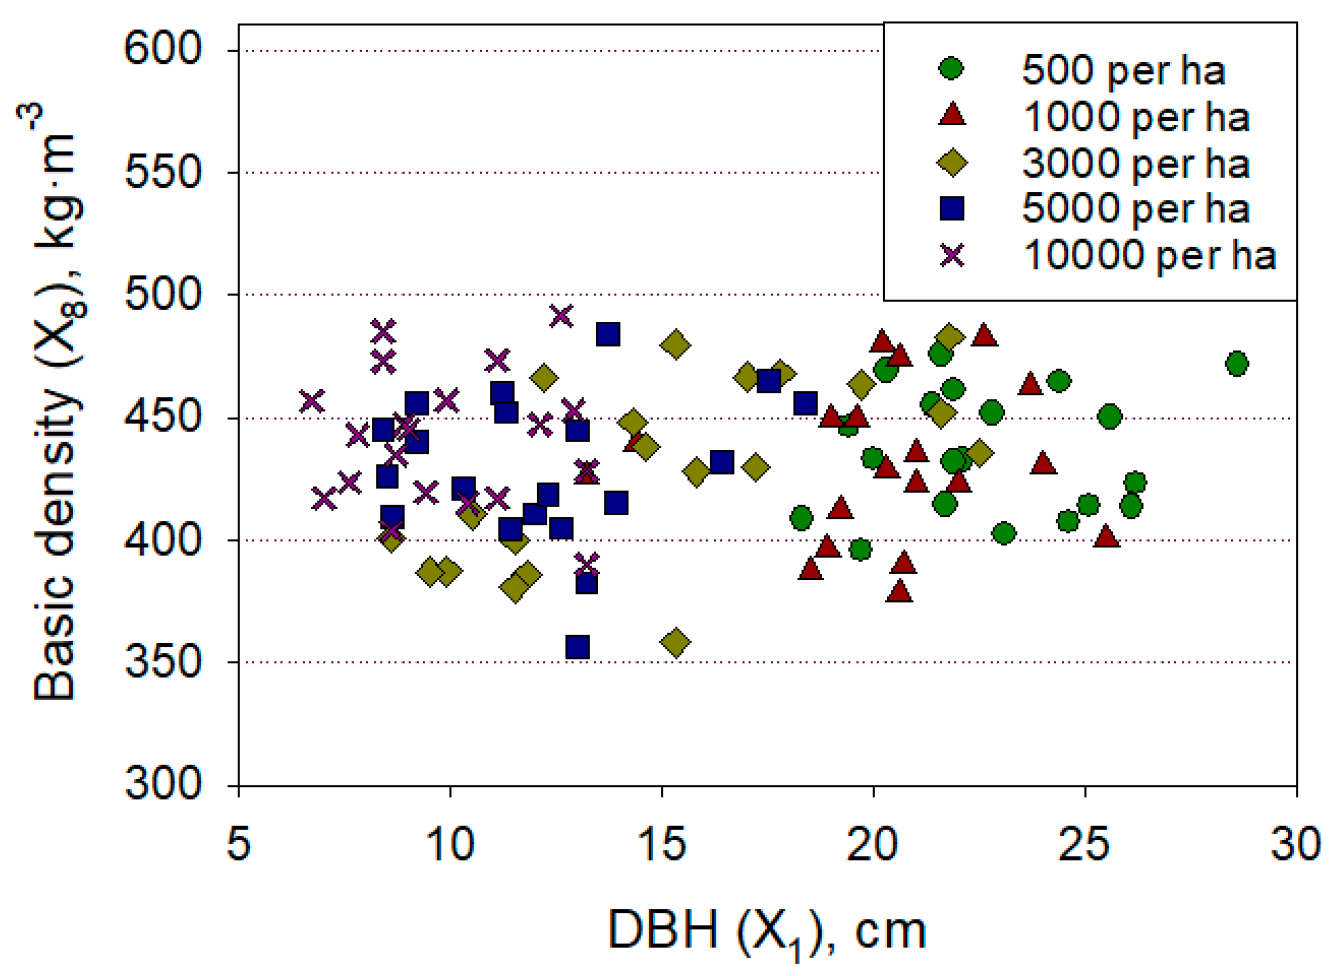
Figure 9.
Interaction between wood basic density (BD, X8) and diameter at breast height (DBH, X1) for trees with varied initial stand density.
Figure 9.
Interaction between wood basic density (BD, X8) and diameter at breast height (DBH, X1) for trees with varied initial stand density.
Application of ultrasonic techniques to predict the wood density in growing trees is limited since there was no correlation found between basic density and ultrasound velocity transmitted along the height of the tree trunk (Figure 10).
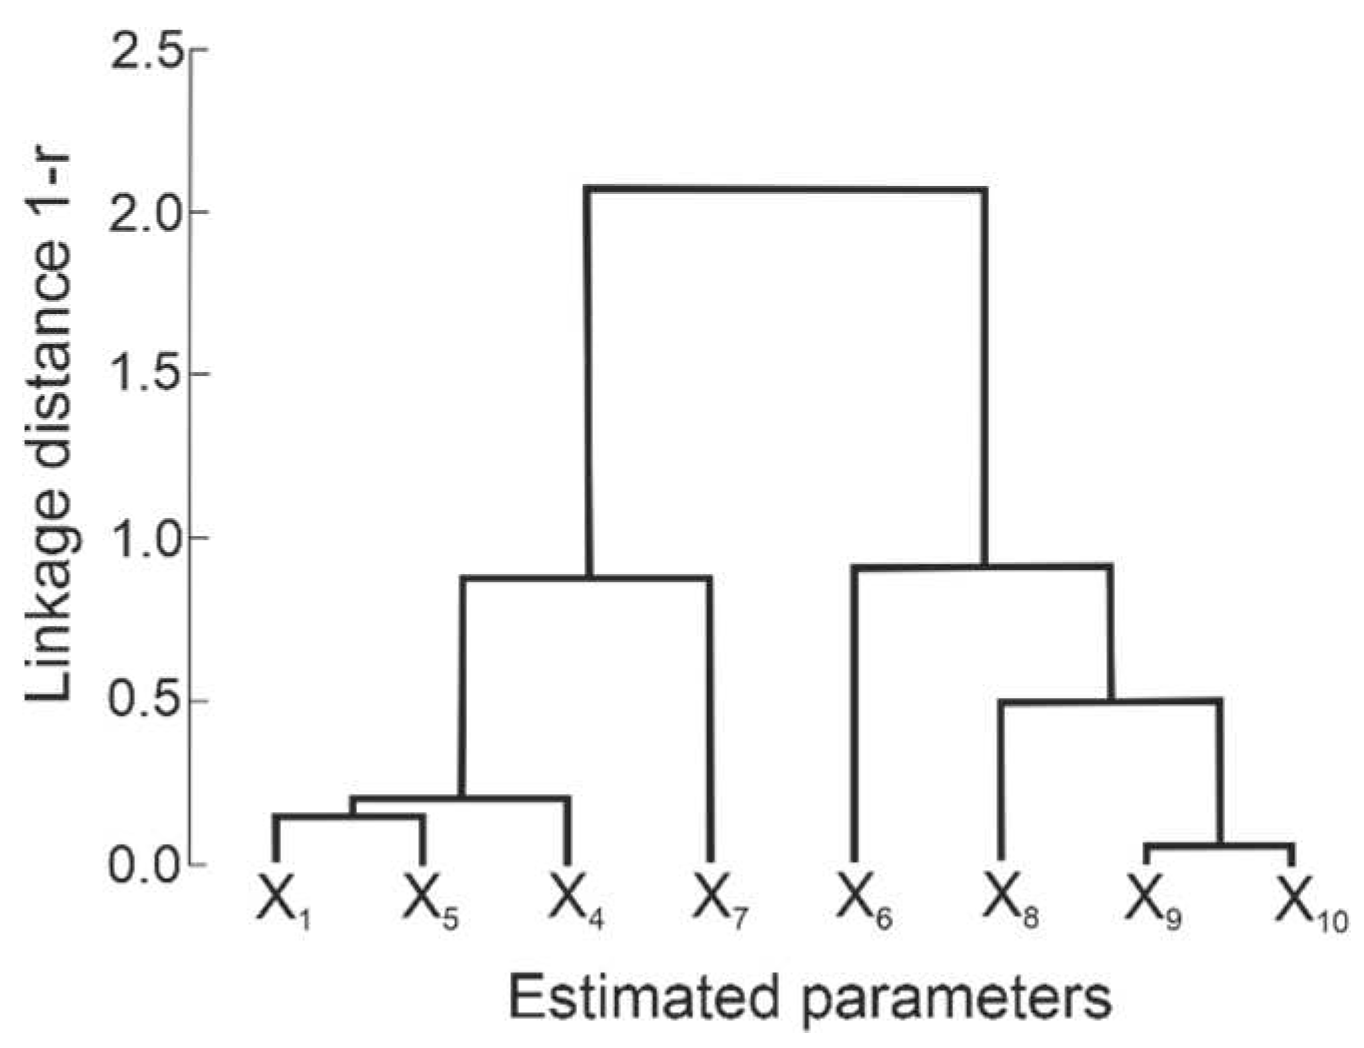
The estimated parameters can be integrated into two separate clusters based on the degree of their correlation and the informative value (Figure 11). The first cluster, reflecting the viability of tree cenopopulations and the degree of competition between them, includes DBH (X1) and MC (X4 and X5), as well as the measurement of ultrasound velocity wave through the tree trunk (X7). The second cluster characterising the physical, mechanical and technological properties of wood included indicators of their basic density (X8), DR and FR (X9 and X10), as well as the measurement of ultrasound velocity signal along the trunk height (X6).
Figure 10.
Interaction between wood basic density and ultrasound velocity through the tree trunk (UVD) and along the height of the trunk (UVH).
Figure 10.
Interaction between wood basic density and ultrasound velocity through the tree trunk (UVD) and along the height of the trunk (UVH).
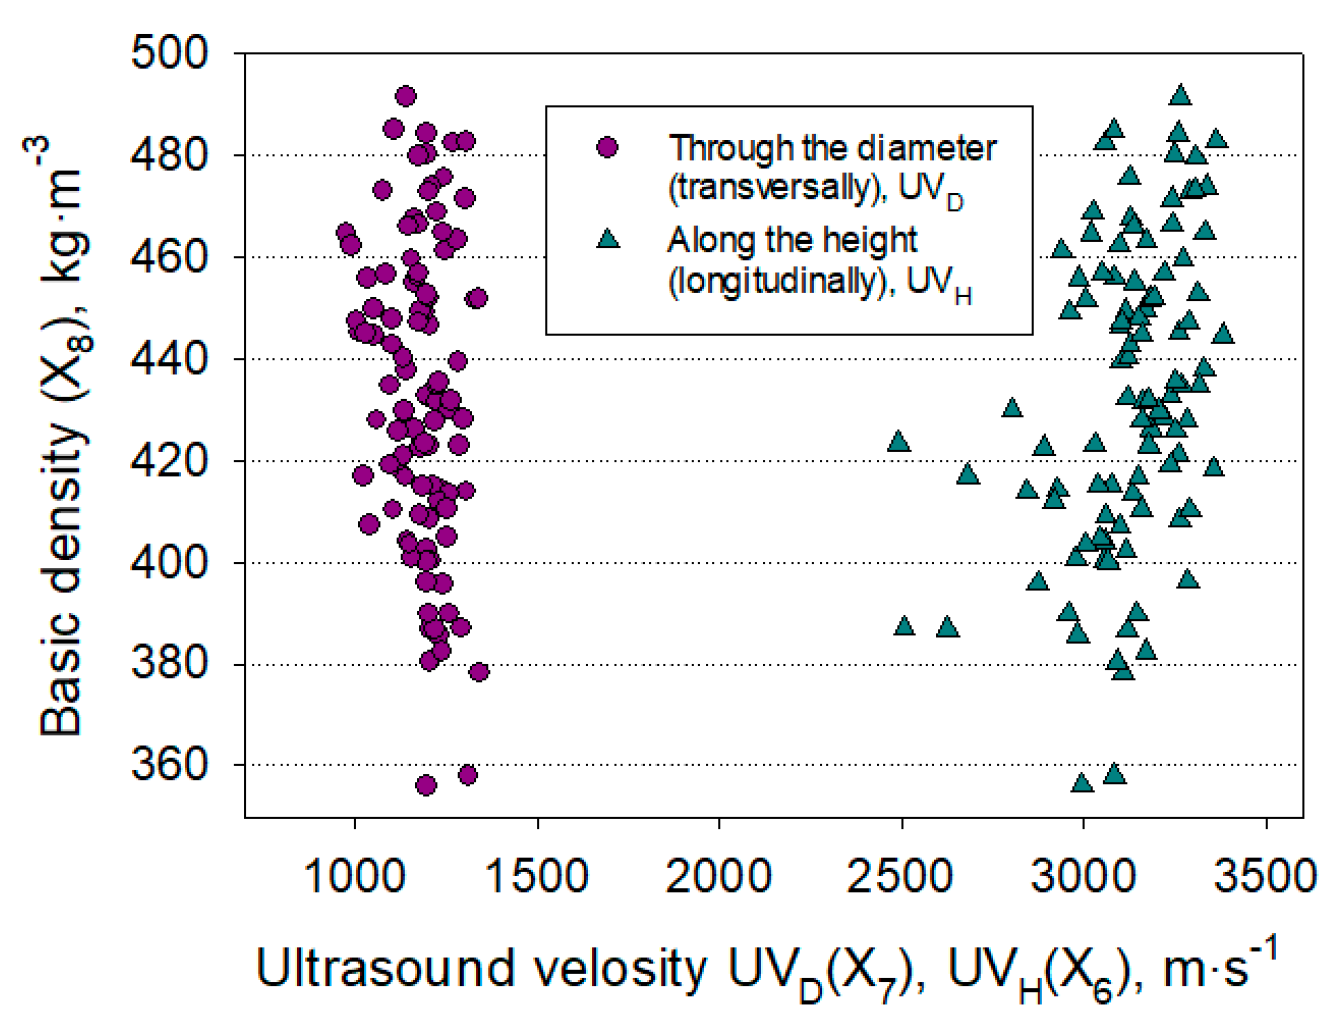
Figure 10.
Dendrogram of the cluster analysis using Ward's method and 1-r distance based on Pearson correlation coefficient as similarity index for the estimated parameters.
Figure 10.
Dendrogram of the cluster analysis using Ward's method and 1-r distance based on Pearson correlation coefficient as similarity index for the estimated parameters.
Wood basic density (X8) in growing trees can be predicted by the DR according to the linear regression model, with less predictive power in comparison with results obtained on defect-free cubic specimens [93]:
When assessing the vitality of forest coenopopulations, it is advisable to use only two parameters: the mean diameter of trees and the MC of water-carrying tissues by the electrical resistance method. In healthy stands with good development prospects, the average value of MC should not be below 70%. Wood basic density on the experimental plots does not depend on the plantation density, DBH, mean width of annual layers, or the proportion of latewood which contradicts the findings of other researchers [18,37,40,41,43,57]. We believe that the unique characteristics of the forest site types of the experimental plots account for the variations in the findings obtained. The initial stand density is not, in our case, a limitation factor for the sapwood basic density. Wood density is limited at the experimental plots by poor and dry soil, leading to a decrease in the sell wall thickness and an increase in the proportion of empty space between the cell walls filled by the water solutions.
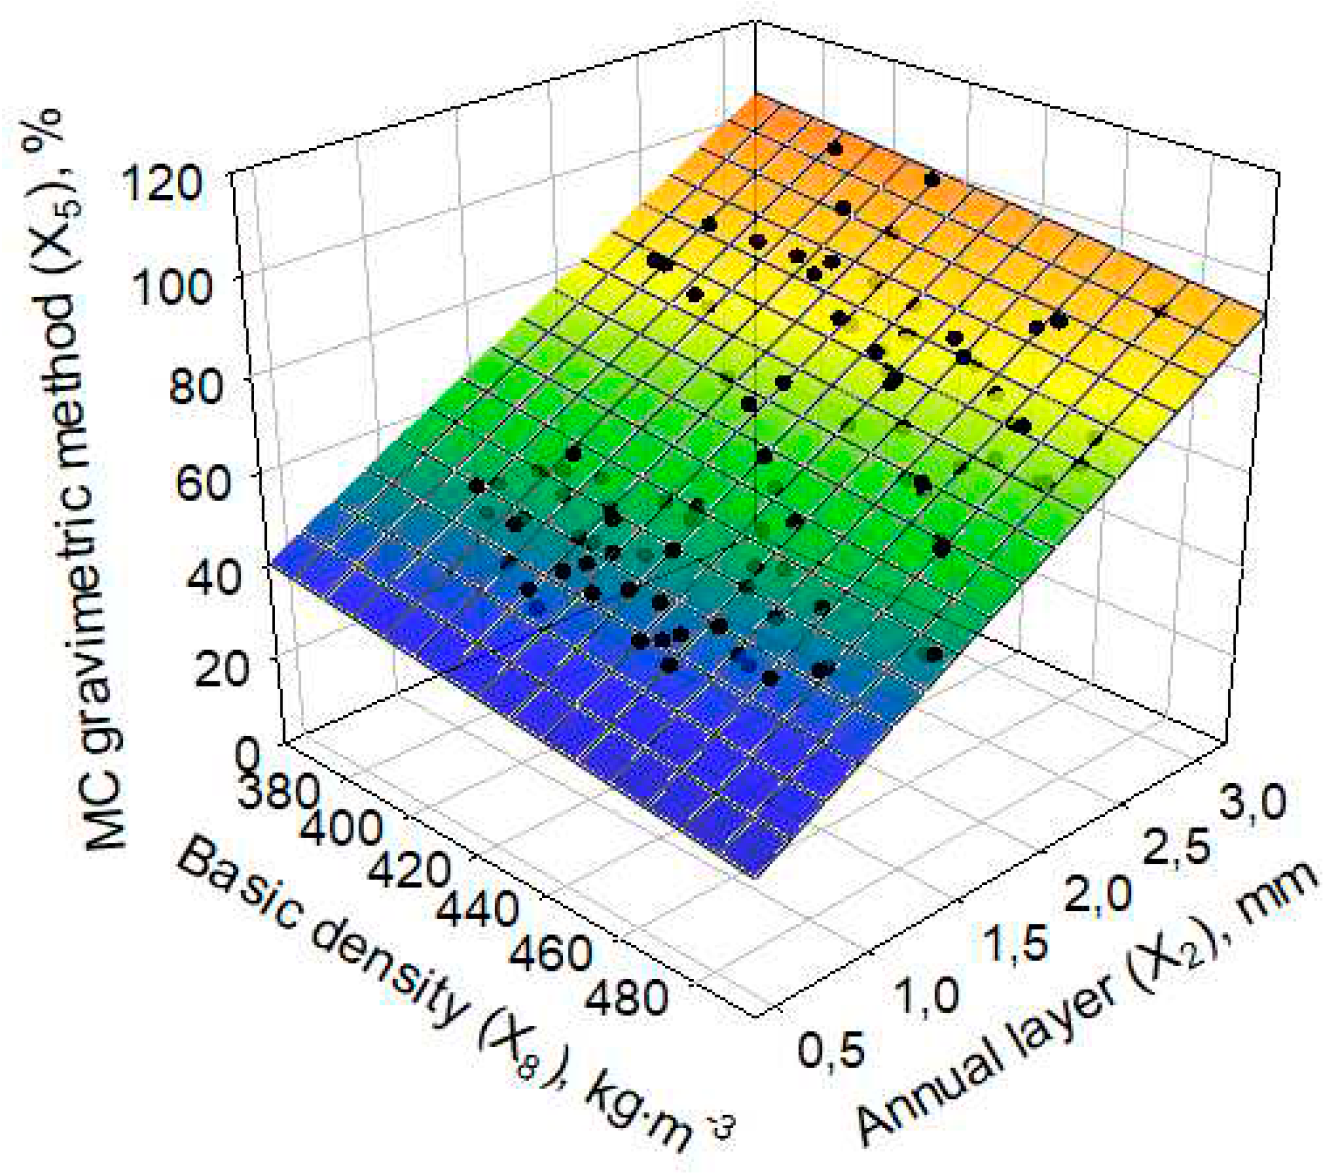
The strong interaction between wood MC, basic density, and mean width of the annual layers, as shown in Figure 12, which can be approximated by the multiple linear model, provides compelling evidence for this conclusion:
Figure 12.
Experimental data and smoothed surface of the interaction between basic density, mean width of annual layers, and moisture content of wood evaluated by the gravimetric method.
Figure 12.
Experimental data and smoothed surface of the interaction between basic density, mean width of annual layers, and moisture content of wood evaluated by the gravimetric method.
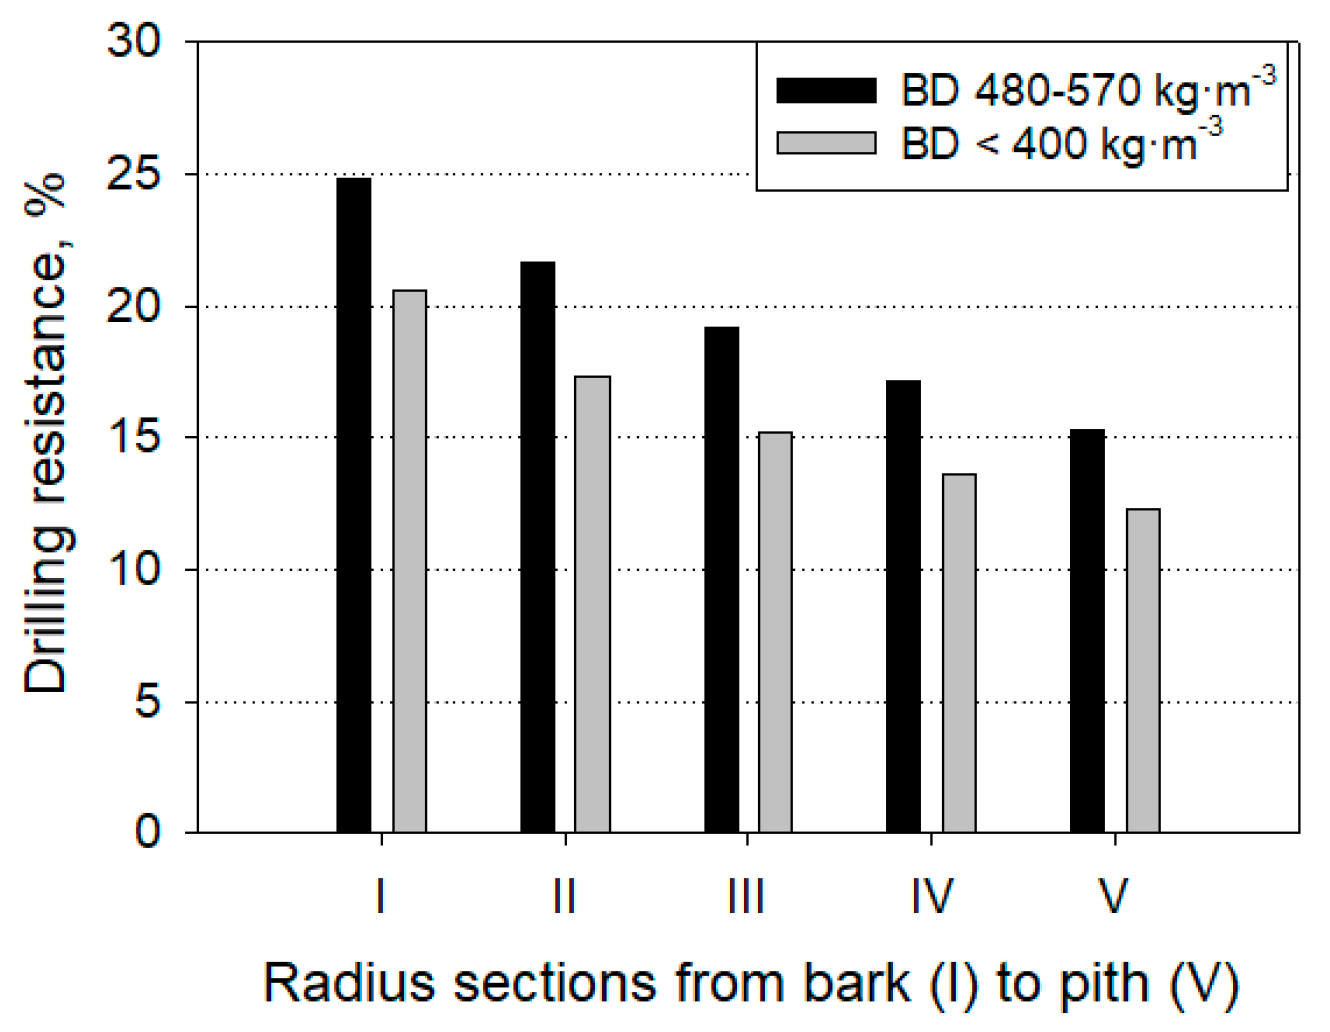
Studies have indicated that the drilling resistance is not a constant value but rather decreases from sapwood to the pith (Table 7m Figure 13), indicating a proportional decrease in the wood basic density. The nature of the change in DR, shown in Figure 13, occurs almost identically for conventional groups of trees with low (<400 kg⋅m-3) and high basic density (480-570 kg⋅m-3).
Figure 13.
Mean drilling resistance (DR) of a tree radius divided into five equal sections (I-V). Two groups of trees with sapwood basic density (BD) below 400 kg m-3 and 480-570 kg m-3.
Figure 13.
Mean drilling resistance (DR) of a tree radius divided into five equal sections (I-V). Two groups of trees with sapwood basic density (BD) below 400 kg m-3 and 480-570 kg m-3.
It was also found that earlywood width for trees with high wood density (480-570 kg⋅m-3) fluctuated intensively and increased with tree age in comparison with trees with low wood density (<400 kg⋅m-3). The same trees exhibit quite opposite dynamics in the width of latewood (Figure 14).
Figure 14.
Early- (a) and latewood (b) width for trees with sapwood basic hardness (BD) below 400 kg m-3 and between 480-570 kg m-3.
Figure 14.
Early- (a) and latewood (b) width for trees with sapwood basic hardness (BD) below 400 kg m-3 and between 480-570 kg m-3.

Future research will be focused on the relationship between DR and the basic density of wood for different types of pine forests and the prediction of the mechanical properties of wood using ultrasonic measurements.
5. Conclusions
1. The high initial density of Scots pine plantations led to a decrease in tree height, diameter growth, and MC of sapwood. Meanwhile, the wood basic density and ultrasound velocity along the tree trunk remained unchanged.
2. All measured and evaluated parameters had a high variation. In particular, there was a considerable variation in DBH, the mean width of annual layers, the proportion of latewood, and the gravimetric MC. The value of the ultrasound velocity underwent the least variation. Wood basic density, as a key parameter of its quality, ranged between 356 and 578 kg⋅m-3, with a mean value of 434 ± 3.3 kg⋅m-3.
3. Selecting the most promising trees for the intended purpose may be possible due to the variability of tree parameters, which is the foundation for the natural selection of trees in cenopopulations.
3. The individual characteristics of the trees, which are most likely fixed in their genome, account for the majority of the variation in the estimated parameters.
4. The two primary factors that most accurately indicated the survival of coenopopulations of a stand were the mean DBH and the MC of their water-carrying tissues evaluated by the electrical resistance method, which in healthy stands should not be below 70%. This evaluation suggests that the initial stand density of Scots pine plantations should not feature more than 3000 trees per ha, since higher stand densities will result in weakened trees and a reduction in their physiological functions.
6. The initial stand density is not a limitation factor for the basic density. Its value on the experimental plots was restricted by the soil and environmental factors that caused the formation of very thin tracheid walls in trees, thus increasing the proportion of free space between them, which was filled up by water solutions.
7. The basic density of wood in growing trees can be predicted by DR based on a linear regression model (R2=0.71). Ultrasound velocity along the tree truck and through the diameter had no correlation with the wood basic density.
8. There were differences in the dynamics of the early- and latewood width between trees with low and high wood density.
6. Patents
The authors filed a patent application for a new nondestructive testing and evaluation method based on time-of-flight ultrasonic measurements and drilling resistance for assessing the mechanical and physical characteristics of wood in growing trees. Application No. 2023127590 was submitted on 26.10.2023 to the Federal Service for Intellectual Property of the Russian Federation.
Author Contributions
Conceptualization and methodology Y.D. and E.S.; investigation and formal analysis Y.D., E.S. and A.K.; core sample preparation and assessment A.K. and E.S.; writing-original draft preparation Y.D. and E.S.; graphing results E.S.; writing-review and editing Y.D., E.S. and A.K.; funding acquisition E.S., Y.D. and A.K.; supervision E.S. All authors have read and agreed to the published version of the manuscript.
Funding
The research work was supported by the Russian Science Foundation (RSF, No 23-16-00220), https://rscf.ru/en/project/23-16-00220/ using equipment of the Core Facility Centre «Ecology, biotechnologies and processes for obtaining environmentally friendly energy carriers» of Volga State University of Technology, Yoshkar-Ola.
Acknowledgments
The authors gratefully acknowledge Dr. Nadezhda Ivanova, Dr. Tatyana Tatiana Krivorotova and student Anastasia Prigunova (Volga State University of Technology, Yoshkar-Ola) for drilling resistance profiles processing.
Conflicts of Interest
The authors declare no conflict of interest.
References
- Rubtsov, V.I. K voprosu o pervonachalnoi gustote lesnyh kultur [On the issue of the initial plantation density of forest stands]. Lesnoe Khozyajstvo-Forestry 1957, 1, 25–27. [Google Scholar]
- Smirnov, N. T. Sostoyanie kultur sosny v zavisimosti ot razmeshcheniya rastenii i gustoty posadki [The condition of pine plantation depending on species distribution and plantation density]. Lesnoy zhurnal-Forestry journal 1959, 4, 53–59. [Google Scholar]
- Evdokimenko, M. D. Osobennosti rosta modelnyh sosnovyh drevostoev raznoi gustoty [Characteristics of model pine stand development at varying stand densities]. Lesnoe Khozyajstvo-Forestry 1968, 12, 34–36. [Google Scholar]
- Pinchuk, A.M.; Lomov V.D. Vliyanie gustoty sosnovyh molodnyakov na anatomicheskie pokazateli drevesiny i nakoplenie organicheskoi massy [The impact of young pine stand density on wood's anatomical characteristics and the buildup of phytomass]. Nauchnye trudy MLTI [In Proceedings of Moscow Forestry Institute, Vol. 49]. Moscow, Russia, 1973; pp. 38–42.
- Martynov, A.N. Gustota kultur khvoinyh porod i ee znachenie [Coniferous plantation density and its importance]. Tsentralnoe biuro nauchno-tekhnicheskoi informatsii [Central office for scientific and technical information]: Moscow, USSR, 1974; pp. 1–58.
- Rubtsov, V.I.; Novoseltsev, A.I.; Popov, V.K.; Rubtsov, V.V. Biologicheskaya Produktivnost Sosny v Lesostepnoi Zone [Biological Productivity of Pine in the Forest-Steppe Zone]; Nauka: Moscow, USSR, 1976; pp. 1–223. [Google Scholar]
- Redko, G.I. Gustota lesnyh kultur [Density of forest plantations]; Leningradskaya lesotekhnicheskaya akademiya [Leningrad Forestry Academy]: Leningrad, USSR, 1978; pp. 1–52. [Google Scholar]
- Riabokon, A.P. Opredelenie biologicheskogo optimuma gustoty sosnovyh drevostoev v usloviyah svezhei subori [Determining biologically optimal stand density of pine in subor areas]. Russian Journal of Forest Science 1979, 3, 16–23. [Google Scholar]
- Vakurov, A.D. Tridcatiletnii opyt vyrashchivaniya sosnovyh kultur raznoi gustoty pod Moskvoi [Thirty years of experimenting with pine of various plantation densities in the Moscow region]. Russian Journal of Forest Science 1979, 6, 81–85. [Google Scholar]
- Kuzmichev, V.V.; Savich, Y.N. Vliyanie gustoty posadki na rost sosnovyh kultur [The impact of plantation density on the growth of pine forests]. Russian Journal of Forest Science 1979, 6, 50–63. [Google Scholar]
- Golovchanskii, I.N.; Riabokon, A.P.; Shinkarenko, I.B.; Govorova, T.T. Vliyanie gustoty na produktivnost i sortimentnuyu strukturu drevostoev sosny [The impact of plantation density on pine productivity and sorting structure]. Lesnoe Khozyajstvo-Forestry 1979, 12, 45–48. [Google Scholar]
- Gabeev, V.N. Produktivnost kultur sosny [Pine species productivity]; Nauka: Novosibirsk, USSR, 1982; pp. 1–188. [Google Scholar]
- Shinkarenko, I.B.; Dzedziulia, A.A. Optimizaciya rezhimov gustoty pri celevom vyrashchivanii sosnovyh kultur [Optimising plantation density in pine forests for special purpose]; Tsentralnoe biuro nauchno-tekhnicheskoi informatsii [Central office for scientific and technical information]: Moscow, USSR, 1983; pp. 1–59. [Google Scholar]
- Iuodvalkis, A.I.; Ozolinchius, R.V. Lesovodstvenno-biologicheskie aspekty optimizacii pervonachalnoi gustoty sosnovyh nasazhdenii [Optimisation of the initial density of pine plantations: forestry and biological factors]. Lesnoe Khozyajstvo-Forestry 1987, 9, 20–22. [Google Scholar]
- Demakov, Y.P.; Nureeva, T.V.; Puriaev, A.S.; Ryzhkov, A.A. Regularities of wood stand development composed of Scots pine with different initial density. Bulletin of Volga State University of Technology. Series Forest. Ecology. Nature management 2016, 4 (32), 19–33. [Google Scholar] [CrossRef]
- Buzykin, A.I.; Pshenichnikova, L.S. Vliyanie gustoty na morfostrukturu i produktivnost kultur sosny [The impact of plantation density on the productivity and morphology of pine]. Russian Journal of Forest Science 1999, 4, 38–43. [Google Scholar]
- Buzykin, A.I.; Pshenichnikova, L.S.; Suhovolskii, V.G. Gustota i produktivnost drevesnyh cenozov [Density and productivity of wood cenoses]; Nauka: Novosibirsk, Russia, 2002; pp. 1–152. [Google Scholar]
- Zhu, J.Y.; Scott, C.T.; Scallon, K.L.; Myers, G.C. Effects of plantation density on wood density and anatomical properties of Red pine (Pinus Resinosa Ait.). Wood. Fiber. Sci. 2007, 39(3), 502–512. [Google Scholar]
- Usoltsev, V.A.; Malenko, A.A. Kultury sosny raznoi gustoty posadki i problema ee optimizacii [Pine stands with varying plantation densities and the challenges of its optimisation]. Botanicheskie Issledovaniya v Sibiri, vyp. 16 [In Proceedings of the Botanical Research in Siberia, Vol. 16], Sukachev Institute of Forest, Krasnoyarsk, Russian Federation, 2008, pp. 136–164.
- Sobachkin, D.S.; Benkova, V.E.; Sobachkin, R.S.; Buzykin, A.I. The Influence of density on inventory parameters in young natural and experimental pine forests. Russian Journal of Forest Science 2009, 2, 3–9. [Google Scholar]
- Merzlenko, M.D.; Glazunov, Iu.B. Growth and state of pine cropper with different density in Serebryanoborskoe experienced forestry. Lesnoy zhurnal-Forestry journal 2014, 6, 32–40. [Google Scholar]
- Usoltsev, V.A.; Malenko, A.A. Forest plantations with different initial density. Part 1. Optimization aspects, group and density effects. Eco-potential 2014, 3, 23–33. [Google Scholar]
- Usoltsev, V.A.; Malenko, A.A. Forest plantations with different initial density. Part 2. Analysis of the experimental planting of Pinus Sylvestris L. Eco-potential 2014, 3, 34–37. [Google Scholar]
- Rogozin, M.V.; Razin, G.S. Razvitie drevostoev. modeli, zakony, gipotezy [Development of forest stands. models, laws, hypotheses]; Perm State University: Perm, Russia, 2015; pp. 1–277. [Google Scholar]
- Sang, Y.; Gao, P.; Kang, X.; Zhang, P. Effect of initial planting density on growth traits and wood properties of triploid Chinese white poplar (Populus tometosa) plantation. Forests 2021, 12, 1676. [Google Scholar] [CrossRef]
- Demakov, Y. P. Rezultaty mnogoletnih opytov po sozdaniyu i vyrashchivaniyu kultur sosny obyknovennoi v Respublike Marii El [The results of long-term experiments on the establishment and cultivation of Scots pine in the Republic of Mari El]; Volga State University of Technology: Yoshkar-Ola, Russia, 2022; pp. 1–242. [Google Scholar]
- Gabira, M.M.; Girona, M.M.; DesRochers, A.; Kratz, D.; da Silva, R.B.G.; Duarte, M.M.; de Aguiar, N.S.; Wendling, I. The impact of planting density on forest monospecific plantations: An overview. For. Ecol. Manag. 2023, 534, 1–16. [Google Scholar] [CrossRef]
- Pisarenko, A.I.; Redko, G.I.; Merzlenko, M.D. Iskusstvennye lesa [Forest plantations]; Vserossiiskii nauchno-issledovatelskii informatsionnyi tsentr «Lesresurs» [Russian research information center «Lesresurs»]: Moscow, Russia, 1992; pp. 1–308. [Google Scholar]
- Golovyanko, Z. S. Gustota i sostav kultur na borovoi pochve [Density and composition of trees growing on the coniferous soil]. Lesnoe Khozyajstvo-Forestry 1940, 6, 22–25. [Google Scholar]
- Mironov, V.V. Ekologiia khvoinykh porod pri iskusstvennom lesovozobnovlenii [Ecology of coniferous species in artificial reforestation]; Lesnaya promyshlennost [Forest Industry]: Moscow, USSR, 1977; pp. 1–232. [Google Scholar]
- Godnev, E. D. Gustota kultur sosny kak faktor ih ustoichivosti [Plantation density of pine as a factor of its stability]. Lesnoe Khozyajstvo-Forestry 1957, 4, 30–35. [Google Scholar]
- Nesterov, V.G. Itogi lesokulturnogo dela za stoletie i obosnovanie proekta tipov lesnykh kultur dlia Buzulukskogo bora [The outcomes of a century-long forestry industry and the rationale behind draft aimed at choosing forest species for Buzuluk pine stand; Goslesbumizdat: Moscow, USSR, 1949; pp. 221–254. [Google Scholar]
- Kondratev, P.S. Novye dannye nablyudenii za rostom sosnyakov raznoi gustoty [New data from observations of the growth of pine with different stand densities]. Izvestiya of Timiryazev Agricultural Academy 1959, 2, 141–154. [Google Scholar]
- Savich, Y.N.; Ovsiankin, V.N.; Poluboiarinov, O.I. O Roste, produktivnosti i ustoichivosti sosnovyh kultur, sozdannyh pri razlichnoi gustote posadki [About the growth, productivity and sustainability of pine stands established with different plantation density]. Nauchnye trudy UkrSKhA [In Proceedings of the Ukrainian agricultural academy, Vol. 213], Kiev, USSR, 1978, pp. 27–38.
- Merzlenko, M.D.; Glazunov, Y.B. Growth and state of pine cropper with different density in Serebryanoborskoe experienced forestry. Lesnoy zhurnal-Forestry journal 2014, 6, 32–40. [Google Scholar]
- Merzlenko, M.D. Relevant aspects of artificial reforestation. Lesnoy zhurnal-Forestry journal 2017, 3, 22–30. [Google Scholar] [CrossRef]
- Poluboiarinov, O.I. Vliianie Lesokhoziaistvennykh Meropriiatii na Kachestvo Drevesiny [The Impact of Forest Treatment on the Quality of Wood]; Leningradskaya lesotekhnicheskaya akademiya [Leningrad Forestry Academy]: Leningrad, USSR, 1974; pp. 1–97. [Google Scholar]
- Riabokon, A.P. O kachestve stvolov sosny v drevostoyah razlichnoi gustoty [Quality of pine trunks in various stand density]. Lesnoe Khozyajstvo-Forestry 1978, 5, 33–36. [Google Scholar]
- Riabokon, A.P. Kachestvo drevesiny pri raznoi intensivnosti rosta sosnovyh nasazhdenii [The quality of wood at different growth rates of pine plantations]. Lesnoe Khozyajstvo-Forestry 1980, 11, 26–28. [Google Scholar]
- Riabokon, A.P.; Litash, N.P. Fiziko-mekhanicheskie svoistva drevesiny sosny v kulturah raznoi gustoty [Physical and mechanical properties of wood in different pine stand density]. Russian Journal of Forest Science 1981, 1, 39–45. [Google Scholar]
- Poluboiarinov, O.I.; Fedorov, R.B. Vliyanie klimaticheskih faktorov na plotnost drevesiny sosny obyknovennoi v lesnoi zone evropeiskoi chasti SSSR [The impact of climatic factors on the density of Scots pine stand in the forest zone of the European part of the USSR]. Lesnoy zhurnal-Forestry journal 1985, 2, 5–9. [Google Scholar]
- Revin, A.I.; Smoljanov, A.N.; Starostyuk, N.B. Physical and mechanical wood properties of pine stands of different plantation density in theTambov region. Lesnoy zhurnal-Forestry journal 2010, 2, 38–43. [Google Scholar]
- Danilov, D.A.; Stepanenko, S.M. Structure and density of wood of spruce and pine in plantations of the Leningrad region. Izvestia of Sankt-Peterburg Forest Engineering Academy. 2014, 204, 35–46. [Google Scholar]
- Demakov, Y.P.; Demitrova, I.P.; Nureeva, T.V.; Simatova, T.Y. The effect of initial density and thinning intensity of a pine stand on growth and wood density. Vestnik of Volga State University of Technology. Series Forest. Ecology. Nature management 2019, 2(42), 26–40. [Google Scholar]
- Poluboiarinov, O.I.; Polonchuk, N.S. Vliyanie rubok uhoda na kompleksnye pokazateli kachestva drevesiny [the impact of thinning on the complex indicators of wood quality]. Mezhvuzovskii sbornik nauchnyh trudov «Lesovodstvo, lesnye kultury i pochvovedenie» [In 10th Proceedings of the Silviculture, forest plantations and soil science], Leningrad Forestry Academy, Leningrad, USSR, 1980, pp. 67–71.
- Melekhov, V.I.; Babich, N.A.; Korchagov, S.A. Kachestvo drevesiny sosny v kulturakh [The quality of wood in pine plantations]; Arhangelskii gosudarstvennyi tekhnicheskii universitet [Arkhangelsk State Technical University]: Arkhangelsk, Russia, 2003; pp. 1–110. [Google Scholar]
- Podoshvelev, D.A. Dinamika izmeneniya fiziko-mekhanicheskih svoistv drevesiny sosny v zavisimosti ot gustoty [Dynamics of changes in the physical and mechanical properties of pine wood depending on the stand density]. Trudy Belorusskogo gosudarstvennogo tekhnicheskogo universiteta. Seriya I, Lesnoe hozyaistvo. [In Proceedings of the Belarusian State Technical University. Series I, Forestry, Vol. XVI]; Minsk, Belorussia, 2008, pp. 143–146.
- Lomov, V.D. Struktura drevostoev sosny i anatomicheskoe stroenie godichnyh sloev [Structure of pine stands and anatomical structure of annual layers]. In Proceedings of the 6th RCCWS International Symposium; Krasnoyarsk, Russia, September 10–16, 2018, pp. 138–140.
- Konovalov, D.Y. Kachestvo drevesiny kultur sosny v severnoi i yuzhnoi podzonah taigi [The quality of pine wood in the northern and southern taiga subzones]. Ph.D. thesis, Arkhangelsk State Technical University, Arkhangelsk, Russia, 2007. [Google Scholar]
- Korchagov, S.A. Povyshenie kachestvennoi produktivnosti nasazhdenii na lesovodstvennoi osnove [Improving the quality productivity of plantations based on forestry treatment]. Doctoral thesis, Arkhangelsk State Technical University, Arkhangelsk, Russia, 2010.
- Korchagov, S.A.; Gribov, S.E.; Kliukvina, N.A. Sravnitelnaya harakteristika fiziko-mekhanicheskih svoistv drevesiny sosny v posadkah po tipam lesa [Comparative characteristics of physical and mechanical properties of pine wood in plantations of various forest types]. Lesnoy vestnik / Forestry Bulletin 2007, 5, 54–57. [Google Scholar]
- Ovodov, A.V. Kachestvo drevesiny sosny v nasazhdeniyah, sozdannyh posevom i posadkoi [The quality of pine wood in plantations established by mechanical and natural seeding]. Ph.D. thesis, Arkhangelsk State Technical University, Arkhangelsk, Russia, 2010.
- Bues, C.T. The influence of stand density and thinning on the wood density of South African radiata pine. Holz Roh. Werkst. 1985, 43, 69–73. [Google Scholar] [CrossRef]
- Hapla, F. Investigations on properties of Douglas-fir in differently thinned experimental areas by x-ray densitometric method. Holz Roh. Werkst. 1985, 43, 9–15. [Google Scholar] [CrossRef]
- Grammel, R. Connections between growing conditions and wood-technological properties of spruce. Eur. J. For. Res. 1990, 109, 119–129. [Google Scholar] [CrossRef]
- Glushkova, Y. P. Bazisnaya plotnost drevesiny eli v plantacionnyh kulturah [Basic density of wood in spruce plantations]. Vestnik of the Kazan State Agrarian University 2010, 1(15), 136–139. [Google Scholar]
- Turin, D.S.; Danilov D.A. Pokazateli plotnosti drevesiny v 40-letnih plantacionnyh kulturah eli razlichnoi gustoty [Wood density in 40-year-old spruce plantation with varied stand density]. Sbornik nauchnyh trudov «Aktualnye problemy lesnogo kompleksa» [In Proceedings of the Bryansk State Engineering Technological University «Actual problems of the forest complex», Vol. 38], Bryansk, Russia, 2014; pp. 52–54.
- Šilinskas, B.; Varnagiryte-Kabašinskiene, I.; Aleinikovas, M.; Beniušienė, L.; Aleinikovienė, J.; Škėma, M. Scots pine and Norway spruce wood properties at sites with different stand densities. Forests 2020, 11, 587. [Google Scholar] [CrossRef]
- Oliveira, I.R.; Chagas, M.P.; Bouillet, J.-P.; Longui, E.L.; de Lima, I.L. Effect of tree spacing on growth and wood density of 38-year-old Cariniana legalis trees in Brazil. South. Forests 2018, 80(4), 311–318. [Google Scholar] [CrossRef]
- Montagu, K.D.; Düttmer, K.; Barton, C.V.M.; Cowie, A.L. Developing general allometric relationships for regional estimates of carbon sequestration – an example using Eucalyptus pilularis from seven contrasting sites. For. Ecol. Manag. 2005, 204, 113–127. [Google Scholar] [CrossRef]
- Sang, Y.; Gao, P.; Kang, X.; Zhang, P. Effect of initial planting density on growth traits and wood properties of triploid Chinese White Poplar (Populus tometosa) Plantation. Forests 2021, 12, 1676. [Google Scholar] [CrossRef]
- Poluboiarinov, O.I.; Redko, G.I. Kachestvo drevesiny geograficheskih kultur sosny v ohtinskom leskhoze [Quality of wood of geographical pine stands in Okhta forestry]. Lesovodstvo, lesnye kultury i pochvovedenie, mezhvuzovskii sbornik nauchnyh trudov [In Proceedings of the Silviculture, forest plantations and soil science, Vol. 6], Leningrad Forestry Academy, Leningrad, USSR, 1977; pp. 107–111.
- Isaeva, L.N.; Cherepnin, V.L. Kachestvo drevesiny geograficheskih kultur sosny obyknovennoi v Srednei Sibiri [The quality of the wood of locally grown Scots pine in Central Siberia]. Russian Journal of Forest Science 1988, 2, 80–83. [Google Scholar]
- Latsevich, A.V. Svoistva drevesiny sosny obyknovennoi raznogo geograficheskogo proiskhozhdeniya [Properties of Scots pine wood grown in different geographical locations]. In Proceedings of the Bryansk State Technical University, Series Forestry, Vol. IX, Bryansk, Russia, 2001, pp. 143–146.
- Kuzmin, S.R.; Vaganov, E.A. The anatomic characteristics of Scots pine tree rings in provenances in the Angara river basin. Russian Journal of Forest Science 2007, 4, 3–12. [Google Scholar]
- Nakvasina, E.N.; Minin, N.S. Variability of the annual rings structure and wood density in the geographical spruce stands of the Arkhangelsk region. Vestnik of Pomor University. Series Natural and Exact Sciences 2007, 2, 78–85. [Google Scholar]
- Kuzmin, S.R.; Rogovtsev, R.V. Radial growth and percent of latewood in Scots pine provenance trials in Western and Central Siberia. Siberian Journal of Forest Science 2016, 6, 113–125. [Google Scholar] [CrossRef]
- Iaborov, V.T. Lesa i lesnoe hozyaistvo Priamurya [Forests and forestry of the Amur Region]; RIO: Blagoveshchensk, Russia, 2005; pp. 1–224. [Google Scholar]
- Shirnin, Y.A.; Romanova, N.A. Substantiation of regional coefficient of timber density variability in technical and economic assessment. Vestnik of Volga State University of Technology. Series Forest. Ecology. Nature Management 2018, 4(40), 56–63. [Google Scholar] [CrossRef]
- Lvov, P.N. Geograficheskaia vyrazhennost kolichestvennykh i kachestvennykh pokazatelei drevostoev na evropeiskom severe [Geographical expression of quantitative and qualitative indicators of stands in the European North]. Lesovodstvo, Lesnye Kultury i Pochvovedenie, Mezhvuzovskii Sbornik Nauchnyh Trudov [In Proceedings Silviculture, forest plantations and soil science, Vol. 9], Leningrad Forestry Academy, Leningrad, USSR, 1980, pp. 12–23.
- Zaitsev, D.A.; Danilov, D.A.; Beliaeva, N.V. Effects of thinning on the macrostructure and wood density of spruce and pine. Forestry Engineering Journal 2018, 3, 60–70. [Google Scholar] [CrossRef]
- Wang, X. Acoustic measurements on trees and logs: A review and analysis. Wood Sci. Technol. 2013, 47, 965–975. [Google Scholar] [CrossRef]
- Gao, S.; Wang, X.; Wiemann, M.C.; Brashaw, B.K.; Ross, R.J.; Wang, L. A critical analysis of methods for rapid and non-destructive determination of wood density in standing trees. Ann. For. Sci. 2017, 74, 27. [Google Scholar] [CrossRef]
- Schimleck, L.; Dahlen, J.; Apiolaza, L.A.; Downes, G.; Emms, G.; Evans, R.; Moore, J.; Pâques, L.; Van den Bulcke, J.; Wang, X. Non-destructive evaluation techniques and what they tell us about wood property variation. Forests 2019, 10, 728. [Google Scholar] [CrossRef]
- Bouffier, L.; Charlot, C.; Raffin, A.; Rozenberg, P.; Kremer, A. Can wood density be efficiently selected at early stage in maritime pine (Pinus pinaster Ait.). Ann. For. Sci. 2008, 65, 106. [Google Scholar] [CrossRef]
- Fundova, I.; Funda, T.; Wu, H.X. Non-destructive wood density assessment of Scots pine (Pinus Sylvestris L.) using Resistograph and Pilodyn. PLoS ONE 2018, 13, e0204518. [Google Scholar] [CrossRef] [PubMed]
- Downes, G.M.; Lausberg, M.; Potts, B.; Pilbeam, D.; Bird, M.; Bradshaw, B. Application of the IML resistograph to the infield assessment of basic Density in Plantation Eucalypts. Aust. For. 2018, 81, 177–185. [Google Scholar] [CrossRef]
- Vlad, R.; Pei, G.; Sidor, C.G.; Cuciurean, C.; Ispravnic, A.; Stefan, G. Assessing standing-tree wood density by microdrilling in tending forestry work carried out on Norway Spruce (Picea abies (L.) H. Karst) stands. Forests 2022, 13, 1450. [Google Scholar] [CrossRef]
- Oliveira, J.T.S.; Wang, X.; Vidaurre, G. Assessing specific gravity of young Eucalyptus plantation trees using a resistance drilling technique. Holzforschung 2017, 71, 137–145. [Google Scholar] [CrossRef]
- Eckard, J.T.; Isik, F.; Bullock, B.; Li, B.; Gumpertz, M. Selection efficiency for solid wood traits in Pinus Taeda using time-of-flight acoustic and micro-drill resistance methods. For. Sci. 2010, 56, 233–241. [Google Scholar] [CrossRef]
- Todoroki, C.L.; Lowell, E.C.; Filipescu, C.N. Wood density estimates of standing trees by micro-drilling and other non-destructive measures. N. Z. J. For. Sci. 2021, 51, 14. [Google Scholar] [CrossRef]
- Newton, P.F. Acoustic-Based Non-destructive estimation of wood quality attributes within standing Red Pine trees. Forests 2017, 8, 380. [Google Scholar] [CrossRef]
- Chhin, S.; Dahle, G. Using acoustic tomography to infer stem wood quality of pine forests affected by a fungal pathogen in different latitudinal regions and plantation densities. Ecologies 2023, 4, 512–520. [Google Scholar] [CrossRef]
- Llana, D.F.; Short, I.; Harte, A.M. Use of non-destructive test methods on Irish hardwood standing trees and small-diameter round timber for prediction of mechanical properties. Ann. For. Sci. 2020, 77, 62. [Google Scholar] [CrossRef]
- Nutto, L.; Biechele, T. Drilling Resistance Measurement and the Effect of Shaft Friction – Using Feed Force Information for Improving Decay Identification on Hard Tropical Wood. In Proceedings of the 19th International Nondestructive Testing and Evaluation of Wood Symposium; Rio de Janeiro, RJ, Brazil, 22–25 September 2015; pp. 154–161. [Google Scholar]
- Sharapov, E.; Wang, X.; Smirnova, E. Drill Bit Friction and Its Effect on Resistance Drilling Measurements in Logs. In Proceedings of the 20th International Nondestructive Testing and Evaluation of Wood Symposium; USDA, Forest Products Laboratory, Madison, 12–15 September 2017; pp. 405–415. [Google Scholar]
- Gendvilas, V.; Downes, G.M.; Neyland, M.; Hunt, M.; Jacobs, A.; O’Reilly-Wapstra, J. Friction correction when predicting wood basic density using drilling resistance. Holzforschung 2021, 75(6), 508–516. [Google Scholar] [CrossRef]
- Tiukavina, O.N.; Neverov, N.A.; Melekhov, V.I.; Korchagov, S.A.; Makarov, S.S.; Korepin, D.Y. Osobennosti interpretatsii rezultatov rezistogramm pri otsenke kachestva stvolovoy drevesiny sosny [Resistogram results interpretation in assessing pine trunk wood quality]. Lesnoy vestnik / Forestry Bulletin 2023, 27(2), 18–26. [Google Scholar] [CrossRef]
- Ugolev, B.N. Drevesinovedenie s osnovami lesnogo tovarovedeniya [Wood science with the basics of forestry merchandising]. Moscow State Forest University: Moscow, Russia, 2001; pp. 1–340. [Google Scholar]
- GOST 16483.7-71; Drevesina. Metody opredeleniya vlazhnosti [Wood. Methods for determination of moisture content]. Standards publisher: Moscow, Russia, 2006.
- Odum, Y. Osnovy ekologii [Basics of ecology]; MIR: Moscow, USSR, 1975; pp. 1–740. [Google Scholar]
- Titov, Y.V. Effekt gruppy u rastenii [Group effect in plants]; Nauka: Leningrad, USSR, 1978; pp. 1–151. [Google Scholar]
- Sharapov, E.; Brischke, C.; Militz, H.; Smirnova, E. Prediction of modulus of elasticity in static bending and density of wood at different moisture contents and feed rates by drilling resistance measurements. Eur. J. Wood Prod. 2019, 77, 833–842. [Google Scholar] [CrossRef]

Table 1.
Encoding of the estimated parameters of trees and wood properties/.
| Parameter | Code |
|---|---|
| Diameter at breast height (DBH), cm | Х1 |
| Mean width of the annual layer (DBH/(2·tree age)), mm | Х2 |
| Latewood content (LC), % | Х3 |
| Moisture content by electrical resistance method (MCERM), % | Х4 |
| Moisture content of the core by the gravimetric method (MCGM), % | Х5 |
| Ultrasound velocity along the tree trunk (UVH), m/c | Х6 |
| Ultrasound velocity through the tree trunk (UVD), m/c | Х7 |
| Basic density of sapwood (core) (BD), kg⋅m-3 | Х8 |
| Drilling resistance for 5-cm depth (core length) (DR), % | Х9 |
| Feeding resistance for 5-cm depth (core length) (FR), % | Х10 |
Table 2.
Variability of the estimated parameters.
| Parameter | М ± m | min | max | S | р | nCV | Аs | Е |
|---|---|---|---|---|---|---|---|---|
| Х1 | 16.0 ± 0.6 | 6.7 | 28.6 | 5.71 | 3.6 | 61.4 | 0.155 | -1.232 |
| Х2 | 0.80 ± 0.03 | 0.34 | 1.43 | 0.29 | 3.6 | 61.4 | 0.155 | -1.232 |
| Х3 | 30.3 ± 0.9 | 18.9 | 48.9 | 6.8 | 3.0 | 59.6 | 0.292 | 0.435 |
| Х4 | 72.7 ± 0.6 | 60.1 | 82.4 | 5.48 | 0.8 | 43.5 | -0.074 | -1.036 |
| Х5 | 65.4 ± 1.6 | 37.6 | 106.1 | 16.48 | 2.5 | 59.2 | 0.514 | -0.786 |
| Х6 | 3117 ± 17 | 2492 | 3380 | 167.0 | 0.5 | 26.7 | -1.388 | 3.082 |
| Х7 | 1184 ±8.0 | 976 | 1341 | 80.7 | 0.7 | 38.9 | -0.495 | 0.011 |
| Х8 | 434 ± 3.3 | 356 | 578 | 33.6 | 0.8 | 43.0 | 0.549 | 2.258 |
| Х9 | 19.5 ± 0.26 | 13.9 | 27.9 | 2.56 | 1.3 | 45.4 | 0.510 | 0.921 |
| Х10 | 9.15 ± 0.12 | 6.01 | 13.0 | 1.25 | 1.4 | 39.8 | 0.462 | 0.575 |
M±m – mean and standard error; min, max – minimum and maximum values; S – standard deviation; р – accuracy, %; nСV – normalized coefficient of variation, nСV = 100×S/(М-min); %; As – skewness; E – kurtosis.
Table 3.
Results of variance decomposition for estimated parameters.
| Variance | The influence of the factor (%) and the level of probability of erroneous conclusion | ||||||||
| Х1 | Х3 | Х4 | Х5 | Х6 | Х7 | Х8 | Х9 | Х10 | |
| Between the groups of stand density | 72.7 | 34.0 | 67.0 | 62.1 | 3.8 | 19.5 | 2.1 | 11.4 | 16.4 |
| Inside the group of stand density | 27.3 | 66.0 | 33.0 | 37.9 | 96.2 | 80.5 | 97.9 | 88.6 | 83.6 |
| Confidence level | <0.001 | <0.001 | <0.001 | <0.001 | 0.437 | <0.001 | 0.728 | 0.021 | 0.002 |
Table 4.
Effect of stand density on mean values and standard error of estimated parameters.
| Parameter | 500 per ha | 1000 per ha | 3000 per ha | 5000 per ha | 10000 per ha |
| Х1 | 22.7 ± 0.6 | 20.3 ± 0.6 | 14.9 ± 0.9 | 12.2 ± 0.6 | 9.9 ± 0.5 |
| Х3 | 32.3 ± 1.4 | 25.1 ± 1.4 | 29.7 ± 0.9 | 26.0 ± 0.6 | 28.5 ± 0.9 |
| Х4 | 78.7 ± 0.5 | 76.7 ± 0.7 | 72.5 ± 1.0 | 67.9 ± 0.8 | 67.7 ± 0.5 |
| Х5 | 81.3 ± 2.6 | 79.9 ± 2.9 | 62.0 ± 2.8 | 52.1 ± 1.7 | 51.9 ± 1.0 |
| Х6 | 3078 ± 26 | 3094 ± 32 | 3118 ± 49 | 3174 ± 27 | 3121 ± 47 |
| Х7 | 1207 ± 20 | 1216 ± 16 | 1207 ± 16 | 1166 ± 16 | 1122 ± 14 |
| Х8 | 436 ± 6 | 437 ± 10 | 428 ± 8 | 429 ± 7 | 441 ± 6 |
| Х9 | 21.0 ± 0.7 | 19.9 ± 0.5 | 18.6 ± 0.6 | 18.8 ± 0.5 | 19.5 ± 0.4 |
| Х10 | 10.0 ± 0.3 | 9.5 ± 0.2 | 8.8 ± 0.3 | 8.6 ± 0.2 | 8.9 ± 0.2 |
Table 5.
Effect of stand density on variability of estimated parameters.
| Parameter | Standard deviation of estimated parameters | ||||
| 500 per ha | 1000 per ha | 3000 per ha | 5000 per ha | 10000 per ha | |
| Х1 | 2.69 | 2.87 | 4.27 | 2.87 | 2.10 |
| Х3 | 0.68 | 0.64 | 0.48 | 0.40 | 0.39 |
| Х4 | 11.80 | 8.30 | 7.80 | 10.20 | 13.20 |
| Х5 | 2.36 | 3.00 | 4.50 | 3.47 | 2.18 |
| Х6 | 11.70 | 13.00 | 12.40 | 7.56 | 4.57 |
| Х7 | 118.50 | 143.00 | 218.20 | 119.10 | 208.60 |
| Х8 | 90.60 | 69.50 | 69.90 | 73.30 | 63.30 |
| Х9 | 25.40 | 45.20 | 37.50 | 30.50 | 27.30 |
| Х10 | 3.18 | 2.260 | 2.650 | 2.24 | 1.75 |
Table 6.
Pearson correlation coefficient between estimated parameters.
| Parameter | Х1 | Х4 | Х5 | Х6 | Х7 | Х8 | Х9 | Х10 |
| Х1 | 1.00 | |||||||
| Х4 | 0.82 | 1.00 | ||||||
| Х5 | 0.86 | 0.81 | 1.00 | |||||
| Х6 | 0.05 | 0.02 | -0.11 | 1.00 | ||||
| Х7 | 0.65 | 0.31 | 0.41 | -0.15 | 1.00 | |||
| Х8 | 0.11 | 0.09 | -0.09 | 0.43 | -0.17 | 1.00 | ||
| Х9 | 0.31 | 0.27 | 0.23 | 0.42 | -0.08 | 0.81 | 1.00 | |
| Х10 | 0.49 | 0.46 | 0.40 | 0.39 | 0.02 | 0.71 | 0.92 | 1.00 |
Table 7.
Mean and standard error of drilling resistance (DR) for a tree radius divided into five equal sections (I-V).
Table 7.
Mean and standard error of drilling resistance (DR) for a tree radius divided into five equal sections (I-V).
| Trees/ha | I | II | III | IV | V |
|---|---|---|---|---|---|
| 500 | 23.4 ± 0.6 | 20.4 ± 0.9 | 19.0 ± 0.8 | 16.1 ± 0.5 | 14.0 ± 0.6 |
| 1000 | 23.0 ± 0.5 | 19.1 ± 0.5 | 17.2 ± 0.7 | 15.8 ± 0.6 | 13.7 ± 0.5 |
| 3000 | 23.3 ± 0.6 | 19.3 ± 0.5 | 16.3 ± 0.4 | 14.9 ± 0.5 | 12.9 ± 0.5 |
| 5000 | 24.1 ± 0.7 | 21.8 ± 0.6 | 17.8 ± 0.5 | 16.0 ± 0.4 | 13.9 ± 0.3 |
| 10000 | 25.0 ± 0.6 | 22.0 ± 0.6 | 20.0 ± 0.5 | 16.9 ± 0.4 | 14.3 ± 0.3 |
Disclaimer/Publisher’s Note: The statements, opinions and data contained in all publications are solely those of the individual author(s) and contributor(s) and not of MDPI and/or the editor(s). MDPI and/or the editor(s) disclaim responsibility for any injury to people or property resulting from any ideas, methods, instructions or products referred to in the content. |
© 2023 by the authors. Licensee MDPI, Basel, Switzerland. This article is an open access article distributed under the terms and conditions of the Creative Commons Attribution (CC BY) license (http://creativecommons.org/licenses/by/4.0/).
Copyright: This open access article is published under a Creative Commons CC BY 4.0 license, which permit the free download, distribution, and reuse, provided that the author and preprint are cited in any reuse.


