
Submitted:
27 November 2023
Posted:
28 November 2023
You are already at the latest version
Abstract
This study assessed the impacts of genotypes, environments, and their interaction on the performance of elite cowpea lines for key adaptive, grain yield, and associated traits across different locations. A total of 42 elite genotypes were evaluated in five Nigerian environments, representing various savanna ecologies during the 2021 growing season. The experimental design employed was an alpha lattice arrangement, replicating each genotype three times. The results revealed significant differences among genotypes, environments, and genotype-by-environment interaction for most traits, including days to maturity, 100 seed weight, and grain yield. GGE biplot showed G21 (IT14K-2111-2) and G25 (IT15K-2386-1) as the most stable genotypes across the five environments, G41(IT1K-61-82) was best adapted to Ibadan and Shika, G5 (245-1) was best adapted to Bagauda and Gumel while G30 (IT16K-2365-1) was best adapted to Bauchi. G21 and G25 could be recommended across the five test environments while G41, G30 and G5 are specific to the adapted environments.
Keywords:
Cowpea (Vigna unguiculata)
; G x E interactions
; stability
; GGE biplot
Introduction
Cowpea, Vigna unguiculata (L. Walp), is an important grain legume grown in the tropics, where it constitutes a valuable source of protein, in the diets of millions of people [1].
The crop has become an essential nutritional component in the human diet due to its high protein content, carbohydrate composition that complements cereal grains, and relatively low-fat content [2]. Improved cowpea varieties contain between 20 and 25% protein on a dry weight basis [3,4]. Smallholder farmers are the major cowpea producers in sub-Saharan Africa (SSA), where the crop is grown for various purposes, including tender leaves, green pods, grains, and fodder, which serve as both human food and livestock feed. Additionally, cowpea residues are utilized to replenish the soil, contributing to enhanced soil fertility in the region [5].
In addition to the grain, cowpea plays an important role in human nutrition, food security, and income generation for farmers and food vendors in SSA. Fresh leaves are also used as pot herbs, especially in East Africa.
In an earlier study, [6] found that cowpea fodder could contain up to 18.6g of protein per 100g dry weight and plays a crucial role as a valuable and nourishing feed resource within crop-livestock systems. Additionally, it serves as a significant income source for various stakeholders in the value chain. Reports indicate that the price of cowpea haulms can range from 50% to 80% of the grain price [7]), and in Nigeria, farmers who harvest and store cowpea fodder for sale at the peak of the dry season increased their annual income by 25% [8]. Depending on the region, seed coat colour and texture could be very important to consumers. For example, in northern parts of Nigeria, where cowpea is generally produced because of favourable climatic conditions mostly in the dry northern Guinea Savannah, Sudan Savannah, and Sahel, agro-ecologies characterized by low annual rainfall, white-coloured grains are preferred by consumers, whereas in the southern parts of the country, the preference is for brown-seeded types [1].
In Africa, particularly in the West and Central Africa, Nigeria produces the highest quantity of cowpea grains annually at approximately 3.6 million metric tonnes; other major producers are Niger Republic and Burkina Faso with an average of 2.6 and 0.660 million metric tonnes, respectively[9] The crop is known to be relatively drought tolerant compared to other legumes and adapted to marginal soil, due to the nitrogen-fixing ability that makes it a useful staple crop for farmers in harsh environments under moisture stress and high temperatures[10,11]. It is widely cultivated and consumed globally, especially in the arid and semi-arid tropics and sub-Saharan Africa [12]. In recent times, the amount of rainfall received in the major producing areas has been declining, and the distribution of the rains is irregular, especially during the early or late stages of the cropping seasons [1,13].
While cowpea is a versatile grain legume, its productivity is hindered by various factors, both biotic and abiotic. Biotic factors such as weeds, insects, and diseases, as well as abiotic factors like soil type, altitude, and rainfall patterns, contribute to the low and unstable yields of cowpea across different environments and years [14,15,16]. In addition, the low yield by smallholder farmers has been partly attributed to the use of local varieties and poor agronomic practices such as low plant density per hectare [17]). Additionally, the scarcity of widely adaptable and early maturing varieties further exacerbates the problem. The productivity of the crop is highly influenced by the variability in environmental conditions, including location effects, seasonal fluctuations, and the interaction between these factors. These environmental variables play a crucial role in determining the actual yield potential of cowpea [18,19]. Studies in cowpea have shown that G x E has a significant effect on traits performance [20,21,22,23]. It has been found that some cowpea genotypes are more stable in agronomic trait performance across environments than others [24,20]. The variability of genotypes performance is partially unpredictable just as response of genotypes to change in environment are not the same [24]. This agreed with [26,27] on cowpea.
The interaction between genotypes and environments (GEI) poses a significant challenge for plant breeders, as it complicates the process of recommending the best-performing varieties. The inconsistency of genotypes that yield the highest results across different cropping environments and seasons add to this challenge. Hence, the analysis of GEI is a fundamental requirement prior to recommending varieties for widespread cultivation since it serves as a crucial step in knowing the superiority and consistency of genotypes performance across diverse geographic locations. This is essential because a genotype's performance can be significantly influenced by its genetic worth, environmental conditions, and or the interaction of both [20,21,23]. Often, the environment could mask the genetic potential of a genotype, leading to poor genetic gain from artificial selection, especially for quantitative traits such as grain yield [21]. Thus, GEI analysis is valuable during the final stages of selecting elite breeding materials as it assists breeders in recommending candidate varieties as either suitable for location-specific adoption or wider geographic use [23,21] Several techniques have been widely adapted to analyse and interpret G × E data for cowpeas, including the genotype main effect plus genotype-by-environment interaction biplot (GGE biplot) analysis and the additive main effect and multiplicative interaction (AMMI) [21,22,28]. To mitigate the impact of GEI, researchers commonly repeat experiments in multiple sites within a single year or over multiple crop seasons in a single site, or sometimes both approaches are combined [29,30].
Therefore, evaluating the performances of improved cowpea in contrasting environments is imperative for the recommendation of the right genotype for a specific environment or wider use across different regions. In view of this, the objectives of the present study were to estimate the effects of genotype, environment, and genotype × environment interaction on key agronomic, grain yield and yield-related traits of some elite cowpeas and assess the stability of improved cowpea lines for yield across different environments.
Materials and Methods
Genetic materials
The genetic materials for this study were forty test entries and two standard checks, which are presented in Table 1. The lines were recently developed by the Cowpea breeding program at the International Institute of Tropical Agriculture (IITA) Nigeria and their response to various environments have not been documented in a published literature.
Description of the study environments
The experiment was conducted in five Nigeria locations in 2021 (Table 2). The locations were Bagauda in Kano state, situated on 499m elevation, semi-arid/sudan savanna with annual rainfall ranging from 552-1093mm from June to November. The temperature ranges from 19 - 33◦c and the soil type are regosols. The second location was Ibadan in Oyo state, situated on 235m elevation in derived savanna, with an annual rainfall ranging from 939-1681mm from March to November. The temperature in this location ranges from 21- 31◦c and the soil type are lixisols. Details of the environmental condition for the other locations, namely, Abubakar Tafawa Balewa University (ATBU), Gubi in Bauchi state; Gumel in Jigawa state, and Shika in Kaduna state, all in Nigeria are presented in Table 2.
The testing sites cut across three different agro-ecologies in Nigeria, which are also the key cowpea growing zones (Figure 1). These agro-ecological zones include Derived Savanna, Nothern Guinea Savanna and Semi- arid/Sudan Savanna.
Experimental layout and data collection
The experiment was laid in 7 x 6 alpha lattice design with three replications. Cowpea lines were established in four rows each four metres long. The intra and inter planting space was 20cm and 75cm, respectively. To control weeds, pre- and post-emergence herbicides (Life line at the rate of 3 liters/ hectare and Raptor at the rate of 1.5 liter per hectare respectively) were applied. Fertilizer was applied at the rate of 30:110:30kg N, P2O5: K2O, which translates as 100kg NPK 15:15:15 (two bags) and 200kg single super phosphate (SSP 18% P2O5) were applied per hectare. All agronomic practices were carried out in accordance with recommendations for cowpea production [8].
The measured parameters included plant hills, plant stands at harvest, days to first flowering, days to 50% flowering, days to first pod maturity, days to 95% pod maturity, bacteria blight score, grain yield (kg/ha), dried fodder yield (kg/ha), and 100 seed weight (g). To minimise border effects, data were recorded from the net plot consisting of the two middle rows as the net plot.
Data analysis
The analysis of variance was conducted using the R software [33]. Means were separated using the least significance difference (LSD) at probability level of 5% where significant differences were found. The following statistical measures were calculated in the analysis: phenotypic coefficient of variation (PCV), genotypic coefficient of variation (GCV), predicted genetic advance (GA) and genetic advance as per cent of mean (GAM) as per formular listed below. Principal component analysis (PCA) was computed for yield and was done using ViTSel,[34] to further understand genotypes’ stability across test locations. Additionally, stability parameters such as Wricke ecovalence [35], cultivar superiority of Lin and Bins [36], Shukla stability [37], GGE biplot (displays the GGE of a genotype by environment two-way data. The GGE biplot methodology originates from graphical analysis of multi-environment variety trials) and Pearson correlation were computed among the traits measured using R [38].
Where; PCV, GCV, GA and GAM were computed as follows;
Phenotypic coefficient of variation (PCV),
Genotypic coefficient of variation (GCV) =
= the mean,
Broad sense heritability (H2) was estimated as the ratio of genotypic variance to
Where, VP is phenotypic variance, VG is genetic variance and VE is environmental sources
Genetic advance to be expected by selecting 5% of the superior progeny was calculated using the following formula given by [43]
Genetic Advances (GA),
i = standard selection differential for 5% selection intensity (= 2.06) according to [44].
and h2 is the heritability in a broad sense.
Genetic Advance as Per cent of Mean (GAM)
where GA is the genetic advance,
and is the general mean
GAM was categorised as low (0–10%), moderate (10–20%), and high (> 20%) following [45] recommendation.
Stability measures
1. Wricke’s ecovalence (Wi) [35]
Where; Wi = ecovalence of the i-th cultivar
Yij = the observed phenotypic value of the i-th cultivar in the j-th environment
Yi. = mean of i-th cultivar across the entire environment
Y.j = mean of j-th environment
Y.. = grand mean.
2. Cultivar Superiority (Pi) of Lin and Binns [36]
Where, Pi = superiority index of the i-th cultivar,
Xij = yield of the i-th cultivar in the j-th environment,
Mj = maximum response obtained among all the cultivars in the j-th environment,
and n = number of environments.
3. Shukla's stability (1972) [37] measure was calculated as the difference between the genotype's observed performance and its expected performance across all environments, divided by the overall mean performance across all genotypes and environments. The formula for Shukla's stability measure is as follows:
Where: S is the stability measure for genotype i
Yi. is the average performance of genotype i across all environments
is the overall mean performance across all genotypes and environments
Yijis the performance of genotype i in environment j
Genotype Main Effect Plus Genotype by Environment Interaction (GGE) Biplot Analysis
A GGE biplot generated from multivariate analysis, was used to depict the associations between the genotypes and the specific testing environments [28].
Results
The results of the analysis of variance revealed significant differences for all the traits measured (Table 3). Significant differences were observed among the environments, genotypes, and genotype by environment interaction. The phenotypic coefficient of variation (PCV) consistently exhibited higher values compared to the genotypic coefficient of variation (GCV) for all the assessed traits. The heritability estimates ranged from 0.49 for seed yield to a maximum of 0.97 for 100 seed weight. Specifically, the GCV, which represents genotypic variability ranged from 0.02 for bacteria blight to 265.11 for dried fodder weight. Conversely, the PCV, representing phenotypic variability spanned from 27.22 for days to 50% flowering to 756.26 for dried fodder. Moreover, the expected genetic advance (GA) varied across traits with the lowest value of 2.99 for days to first flowering and the highest value of 252.80 in dried fodder weight. Additionally, the expected genetic advance as a percentage of the mean (GAM) was also found to differ across traits assessed with values ranging from a minimum of 5.50 for days to 95% maturity to 66.85 in bacteria blight infection. These results provide valuable evidence of the diversity and heritability of the examined traits which further indicate variation within the genotypes and environmental conditions.
Estimates of Stability Measures for Elite Cowpea Genotypes Evaluated for Key Agronomic Traits Across Various Agro-ecologies
Three stability measures were used to identify the most stable genotypes (Table 4). Genotypes G8, G16, G5, G26, G25, G20, G19, G12, G38, and G36 were the most stable based on Wricke’s ecovalence method. On the other hand, based on cultivar superiority, the top superior genotypes were G25, G17, G42, G40, G32, G20, G12, G14, G19, and G16, while genotypes G27, G28, G23, G37, G21, G5, G19, G6, G41, and G18 were detected by Shukla stability variance as being the most stable. Genotype G19, was ranked in the top ten position by all three stability measures, G12 and G16 were ranked among the best 10 genotypes in both Wrickes and cultivar superiority stability estimates.
Principal Components
Principal Component 1 (PC1) and Principal Component 2 (PC2) together accounted for 81% of the total variation among the genotypes studied across the five environments (Figure 2).
The PC1*PC2 indicated that Ibadan and Shika environments were closely related with. Genotypes G41, G10 and G28 were the most suitable in these environments. Gumel and Bagauda were also closely related, with Genotypes G37,G5 and G6 being the most adapted to these sites.
Genotype Main Effect Plus Genotype-by-Environment Interaction (GGE) Biplot Analysis
Specific adaptation of genotypes was assessed using the “Which Won Where” model of the GGE biplot (Figure 3). In this analysis, principal components 1 and 2 explained 81.05% of the total variations. Nine mega environments (sectors) were identified by the “Which Won Where’’ biplot, with Ibadan, Shika, Gumel and Bagauda all falling within the same mega environment. Genotype G41 appeared to be the best for Ibadan and Shika, as it was located closer to these two environments on the biplot. On the other hand, genotype G5 was the best for Gumel and Bagauda. Bauchi fell within another mega environment and G30 was the best genotype for the environment. These inferences are based on the proximity of each genotype to the respective environments in the biplot.
Figure 4 displayed results for GGE biplot-mean versus stability. In this analysis, principal components 1 and 2 explained 79.9% of the total variations. It presented the mean yield and stability across the five test locations. G5 had the highest mean yield, while G21 and G25 were the most stable having the shortest perpendicular mark on the axis. G12 and G41 also have high mean yield value but are less stable because they have longer perpendicular mark on the axis.
Correlations among Traits
There was a positive and significant correlation between the weight of dried fodder and several traits, including the number of plant hills, plant stands at harvest, days to 95% maturity, and seed yield in kg/ha (Figure 5). Of particular interest, significant positive correlations were detected among all maturity-related traits, days to first flower, days to 50% flowering and days to 95% pod maturity. In addition, days to 95% maturity was significantly correlated (r = 0.73) with 100 seed weight. On the other hand, grain yield had positive but weak correlations with maturity-related traits. These traits are expected to play a significant role in the selection process for dried fodder weight, days to first flowering, days to 50% flowering, and 100 seed weight. Likewise, the 100-seed weight showed a weak negative relationship with bacterial blight, the number of plant hills, and plant stands at harvest. However, it displayed a slight positive connection with seed yield per hectare in kilograms. Grain yield (kg/ha) also had a positively significant correlation with dried fodder weight, number of plants per hill and plant stands at harvest.
Discussion
Phenotypic coefficient of variation (PCV) was generally higher than Genotypic coefficient of variation (GCV) in all the traits, suggesting that the environment plays a major role in the performance of the genotypes across different locations. This means that the expression of the trait is more influenced by environmental conditions, such as temperature, humidity, nutrient availability, or other external factors, rather than solely by genetic differences, which agrees with the findings of [24]. High values of PCV and GCV observed in the present study suggest reliability of effective selection for these traits. Furthermore, it also indicated the existence of substantial phenotypic variability among the tested cowpea genotypes. Similar reports of high PCV and GCV for agronomic traits such as yield, and hundred seed weight were reported by [46,47,48,49,50]
Higher broad sense heritability reveals that a large portion of variation may be heritable, especially if the additive component of the broad sense heritability is very high. In this study, the highest broad sense heritability was recorded in hundred seed weight.
The present study dissected the stability of advanced cowpea lines based on three stability measures. Wricke's ecovalence stability measure calculates the average deviation of a genotype's performance from the average performance of all genotypes in each environment, and then compares this deviation to a measure of the overall variation in performance across environments. A genotype is considered stable if its deviation is relatively small compared to the overall variation. In the present study, genotypes G8, G16, G5, G26 and G25 were the top five lines with very small mean yield deviation across the five environments and are considered stable across these environments. In agreement to this,[51] in cowpea and [52] in common bean reported the highest yielding genotypes as having relatively low ecovalence values. In the present study, according to the ecovalence method, the most unstable genotypes were G30, G38, G27, G28, and G17, showing relatively higher ecovalence values for grain yield, respectively. According to [53], genotypes with high ecovalence mean and large estimated values are suitable for high-input environments. Similarly, [54] in faba bean also reported Wricke’s stability measures as effective parameter in identifying stable and high yielding genotype which agrees with our findings.
Cultivar superiority (Pi) of Lin and Binns measures the most stable genotype as the one with the least deviation from the maximum yield of each environment; i.e.; with the lowest (Pi) value. From the present investigation; the most stable genotype ranked first for Pi and for mean grain yield was G25 followed by G17; G42; G40; and G32; respectively. These stable genotypes had the least contribution to the total variation due to the genotype by environment interaction. In contrast; G29; G5; G11; G31 and G37 were the most unstable genotypes; and they contributed a large portion of the total variation due to GEI; these results agree with the work of [52], who reported that the most stable cowpea genotypes having the lowest Pi value and high mean grain yield in their study
Our study revealed significant G × E among cowpea genotypes on several agronomic traits such as hundred seed weight, grain yield, days to flowering and days to maturity which were also reported by [46,55,56,57].
Overall, the GGE biplot provides a powerful visual representation of complex genotype-by-environment interactions and can help researchers to identify the genotypes that are most suited for specific environments, as well as the environments that are most similar to each other in terms of performance [58,59]). [60] reported high heritability for stay green trait and substantially low genotype by environment (g x e) interactions for this trait in cowpea would enable successful incorporation of this trait in improved varieties. Findings of [52], indicated that the yield performance of speckled bean genotypes was highly influenced by GE interaction effects; the magnitude of environment effect was about 2.88 times that of genotype effect. In agreement with our findings [25], in cowpea also reported that analysis of variance for each location and combined over five locations showed significant differences among genotypes, environments, and genotypes × environments interaction (GEI) for grain yield and most of the yield-related traits. The significant genotypes × environments interaction effects indicated the inconsistent performance of genotypes across the tested environments and the differential discriminating ability of the tested environments. The significant effects of GEI on traits suggested the need to assess the stability of genotypes overall environments [51,61,62,63,64].
Grain (kg/ha) shows positive significant correlation to days to 50% flowering, indicating that the longer it takes to attain 50% flowering, the higher the yield; this agreed with the findings of [65] in soybean that there is positive significant correlation with grain yield and days to 50% flowering and days to maturity, however, our findings shows negative non-significant correlation to 100 seed weight which disagreed with the findings of [65]. The 100 seed weight show positive significant correlation with days to 50% flowering and days to 95% physiological maturity. This was expected as the longer period of grain filling result in larger seed size which corroborated the findings of [66,67]
Conclusions
Our study revealed that the influences of genotypes, environments, and their interaction were highly significant for the grain yield of cowpea genotypes evaluated across five locations during the 2021 growing season in Nigeria. We employed various stability models to assess genotype stability, including Wricke’s ecovalence, cultivar superiority, Shukla stability variance, and the GGE biplot and it shows that Wricke's ecovalence and cultivar superiority methods are more dependable measures of stability than the Shukla method. This conclusion is drawn from the fact that the same five genotypes were consistently ranked as the most stable among the top ten genotypes in both Wricke’s ecovalence and cultivar superiority stability measures. Specifically, genotypes G16, G25, G20, G12, and G19 consistently ranked among the top ten stable genotypes according to both Wricke’s ecovalence and cultivar superiority measures. Furthermore, G19 was the only genotype that appeared among the top ten stable genotypes in all three stability measures used in this study. The GGE biplot analysis revealed nine possible mega-environments, with four locations (Ibadan, Shika, Bagauda, and Gumel) falling within the same mega-environment (Sector VIII), while Bauchi constituted a distinct mega-environment. Based on the GGE biplot analysis, G21 (IT14K-2111-2) and G25 (IT15K-2386-1) emerged as the most stable genotypes across all five test locations, as indicated by the shortest perpendicular marks on the axis. As a result, we recommend these two genotypes for cultivation across the test locations.
Author Contributions
Conceptualization, B.P. and O.B.; methodology, B.P., P.O.O., O.B. and C.F.; software, B.P.; validation, B.P., P.O.O., A.T., S.B.M. ,O.B. and C.F.; formal analysis, B.P., and P.O.O.; investigation, B.P., P.O.O.; resources, O.B. and C.F.; data capture and curation, B.P., P.O.O., A.T., D.J.I., and G.B., writing—original draft preparation, B.P., writing—review and editing, B.P., P.O.O., A.T., S.B.M.,O.B. and C.F.; visualization, B.P., P.O.O.; supervision, O.B. and C.F.; project administration, O.B.;funding acquisition, O.B. All authors have read and agreed to the published version of the manuscript.
Funding
This research was funded by the Bill & Melinda Gates Foundation through the Accelerated Varietal Improvement and Seed Delivery of Legumes and Cereals in Africa (AVISA) project, Grant #OPP1198373. d.
Data Availability Statement
All data reported in this study have been provided as Supplementary Materials.
Acknowledgments
The authors appreciate funding support from the Bill & Melinda Gates Foundation (BMGF) through the Accelerated Varietal Improvement and Seed Delivery of Legumes and Cereals in Africa (AVISA) project, and CRP funds from the International Institute of Tropical Agriculture (IITA).
Conflicts of Interest
The authors declare no conflict of interest.
References
- Boukar O, Belko N, Chamarthi S; Batieno, J., Owusu; Fatokun, C. Cowpea (Vigna unguiculata): Genetics, genomics and breeding. Plant Breed. 2019, 138, 415–42. [Google Scholar] [CrossRef]
- Jayathilake C, Visvanathan R, Deen A, Bangamuwage R. , Jayawardana B.C., Nammi S, Liyanage R. (2018). Cowpea: an overview on its nutritional facts and health benefits. J Sci Food Agric. 2018, 98, 4793–4806. [Google Scholar] [CrossRef] [PubMed]
- Omoigui, L.O.; Kamara, A.Y., Kamai; Aliyu, K.T. Guide to cowpea production in Northern Nigeria; IITA: Ibadan, Nigeria, 2020; p. 48. [Google Scholar]
- Samireddypalle, A.; Boukar, O., Grings; Blummel, M. Cowpea and Groundnut Haulms Fodder Tradding and Its Lessons for Multidimensional Cowpea Improvement for Mixed crop Livestock Systems in West Africa. 2017. [Google Scholar]
- Singh, B. (2014) Cowpea: The Food Legume of the 21st Century. Madison, WI, USA: Crop Science Society of America.
- Duke, J. A. (1990). Introduction to food legumes. In S. R. Singh (Ed.), Insect Pests of Tropical Legumes (pp. 1–42). Chichester, UK: John Wiley and Sons Ltd.
- Singh, B.B.; Ajeigbe, H. A., Tarawali; Abubakar, M. Improving the production and utilization of cowpea as food and fodder. Field Crops Research 2003, 84, 169–177. [Google Scholar] [CrossRef]
- Dugje, I.Y.; Omoigui, L. O., Ekeleme; Ajeigbe, H. Farmers’ guide to cowpea production in West Africa. IITA, Ibadan, Nigeria, 20. http://www.iita.org/c/document library/get file?uuid=dd0fe400-eb90-470c-9dc1-f679c5d66a81&groupId=25357. 2009. [Google Scholar]
- FAOStat (2021). FAOSTAT, Statistical data base. Rome: Food and Agricultural Organizations of the United Nations. 2023.
- Hill, S. (2015). “Cowpea adaptability to southeastern organic farming systems: forage productivity and charcoal rot susceptibility,” MSc. 'Thesis, University of Tennessee, Knoxville, Tennessee, 2015.
- Noubissietchiagm, J. B. , Bell, J. M., Guissaibirwe, S., Gonne, S. and Youmbi, E. (2010) “Varietal response of cowpea (vigna unguiculata L. Walp.) to striga gesnerioides (wild.) vatke race SG5 infestation,” Horti Agrobotanici, Cluj-Napoca. 2010; 38, 33–41. [Google Scholar]
- Baidoo, P. K. and Mochiah, M. B. “Varietal susceptibility of improved cowpea vigna unguiculata (L.) (walp.) cultivars to field and storage pests,” Sustainable Agriculture Research 2014, 3, 69. [Google Scholar]
- Chamarthi, S. K. , Belko, N., Togola, A., Fatokun, C. A., & Boukar, O. (2019). Genomics-Assisted Breeding for Drought Tolerance in Cowpea. In V. R. R. et al. (eds.) (Ed.), Genomics Assisted Breeding of Crops for Abiotic Stress Tolerance, Vol. II, Sustainable Development and Biodiversity (pp. 187–209). Springer. [CrossRef]
- Horn, L. , Shimelis, H. and Laing, M. (2015). “Participatory appraisal of production constraints, preferred traits and farming system of cowpea in the northern Namibia: implications for breeding,” Legume Research, vol. 38, no. 5, pp. 691–700, 2015.
- Maureen, F.A.K. (2015) Genetic analysis of traits related to biological nitrogen fixation in cowpea [vigna unguiculata L. WALP] under low soil phosphorus, PhD 'thesis, University of Ghana, Legonm, Ghana, 2015.
- Mohammed, S. B. , Dzidzienyo, D. K., Umar, M. L., Ishiyaku, M. F., Tongoona, P. B., & Gracen, V. (2021). Appraisal of cowpea cropping systems and farmers’ perceptions of production constraints and preferences in the dry savannah areas of Nigeria. CABI Agric Biosci, 2, 25. [CrossRef]
- Olufajo, O.O.; Singh, B.B. Advances in cowpea cropping systems research. In: Fatokun, C.A., Tarawali, S.A., Singh, B.B., Kormawa, P.M., Tamo, M. (Eds.) Challenges and Opportunities for Enhancing Sustainable Cowpea Production, vol. 4. Institute of Tropic Agriculture, (IITA), Conference III held at Ibadan, Nigeria. 2002; 267–277. [Google Scholar]
- Hall, A. E. , Cisse, N., Thiaw,S., Hassan O.A.,E., Ehlers, J.D., Ismail, A.M., Fery, R.L., Roberts, P.A., Kitch, L.W.., Murdock,L.L., Boukar, O., Phillips, R.D., McWatters, K.H. (2003). Field Crops Research, 2003; 82. [Google Scholar]
- Adewale, B.D. , Adeigbe, O. and Aremu, C. (2011) “Genetic distance and diversity among some cowpea (Vigna unguiculata L. Walp) genotypes,” International Journal of Research in Pharmacy and Science, vol. 1, no. 2, pp. 9–14, 2011.
- Ali, Y.; Aslam, Z., Hussain; Shakur, A. Genotype and environmental interaction in cowpea (Vigna Unguiculata-L) for yield and disease resistance. International Journal of Environmental Science & Technology 2013, 1, 119–123. [Google Scholar] [CrossRef]
- Goa, Y.; Mohammed, H., Worku; Urage, E. Genotype by environment interaction and yield stability of cowpea (Vigna unguiculata (L.) Walp.) genotypes in moisture limited areas of Southern Ethiopia. Heliyon 2022, 8(3), e09013. [Google Scholar] [CrossRef] [PubMed]
- Gumede, M. T. , Gerrano, A. S., Modi, A. T., & Thungo, Z. (2022). Influence of genotype and environment on grain yield among cowpea (Vigna unguiculata (L.) Walp) genotypes under dry land farming system. Https://Doi.Org/10.1080/09064710.2022.2069593, 72(1), 709–719. [CrossRef]
- Horn, L.; Shimelis, H., Sarsu; Laing, M.D. Genotype-by-environment interaction for grain yield among novel cowpea (Vigna unguiculata L.) selections derived by gamma irradiation. Crop Journal 2018, 6, 306–313. [Google Scholar] [CrossRef]
- Adewale, B.D.; Okonji, C., Oyekanmi; Aremu C., O. Genotypic variability and stability of some grain yield components of Cowpea. African Journal of Agricultural Research 2010, 5, 874–880. [Google Scholar]
- Kindie, Y. , Tesso, B., and Amsalu, B. (2021). “Genotype X Environment Interaction and Yield Stability in Early-Maturing Cowpea (Vigna unguiculata (L.) Walp.) Landraces in Ethiopia’’, Advances in Agriculture, vol. 2021 Article ID 3786945, 10 pages, 2021. [CrossRef]
- Sarvamangala, C. , Uma, M. S., Birada, S. and Salimath, P.M. (2010). “Stability analysis for yield and yield components over seasons in cowpea (Vigna unguiculata L. Walp),” Electronic Journal of Plant Breeding, vol. 1, no. 6, pp. 1392–1395, 2010.
- Nunes, H. F. , Filho, F.R.F., Ribeiro, V.Q., and Gomes, R.L.F. “Grain yield adaptability and stability of black-eyed cowpea genotypes under rainfed agriculture in Brazil,” African Journal of Agricultural Research, vol. 9, no. 2, pp. 255–261, 2014.
- Yan, W.; Kang, M. S., Ma; Cornelius, P. L. GGE Biplot vs. AMMIAnalysis of Genotype-by-Environment Data. Crop Science 2007, 47, 643–653. [Google Scholar] [CrossRef]
- Gauch, H. and Zobel, W. (1996) “AMMI analysis of yield trials,” in Genotypes by Environment Interaction, S. Kang and H. Gauch, Eds., CRC, New York, NY, USA, 1996.
- Genetic variation and genetic advance in cowpea based on yield and yield-related traits.
- Bandeira, M. , Jackson, K., Moura, M. de, Angelo, J. and Raphaelle, L. (2018). “Genotype by environment interaction in cowpea lines using GGE biplot method,” Universidade FederalRural do Semi- ´ Arido, vol. 31, no. 1, pp. 64–71, 2018 FAO Digital Soil Map of the World. 1991. [Google Scholar]
- International Institute of Tropical Agriculture (IITA), Geographic Information System (GIS). 2023.
- R Core Team (2023). A Langage and Environment for Statistical Computing. R. Foundation for Statistical Computing Vienna, Austria. URL http://www. R. Project.org Rural do Semi-Arido, vol.31, no. 1, pp.64-71, 2018.
- ViTSel. Version 1.0 (2020). Africa Rice Centre (AfricaRice), Centro Internacional de Mejoramiento de Maiz y Trigo (CIMMYT), and International Institute of Tropical Agriculture (IITA).
- Wricke, G. Übereine Methodezur Erfassung der ökologischen Streubreite in Feldversuchen. Z. Pflanzenzuecht. 1962, 47, 92–96. [Google Scholar]
- Lin, C.S.; Binns, M. R (1988). “A superiority measure of cultivar performance for cultivar x location data,” Canadian Journal of Plant Science, vol. 68, pp. 193–198, 1988.
- Shukla, G.K. Some statistical aspects of partitioning genotype environmental components of variability. Heredity 1972, 29, 237–245. [Google Scholar] [CrossRef] [PubMed]
- Dia, M.; Wehner, T.C.; Arellano, C. RGxE: An R Program for Genotype x Environment Interaction Analysis. American Journal of Plant Sciences 2017, 8, 1672–1698. [Google Scholar] [CrossRef]
- Singh, R. K. , Chaudhary, S.D. (1985). Biometrical Methods in Quantitative Genetic Analysis, Kalyan Publishers, New Delhi, pp. 205 -214.
- Hanson, C. H. , Robinson, H. F. and Comstock, R. E. (1956). “Biometrical studies of yield in segregating populations of Korean lespedeza 1,” Agronomy Journal, vol. 48, no. 6, pp. 268–272, 1956.
- Falconer, D. S. , & Mackay, T. C. F. ( 1996). Introduction to Quantitative Genetics (London, Longman.
- Lynch, M.; Walsh, B. Genetics and Analysis of Quantitative Traits (Sunderland, MA, Sinauer Associates, 1998).
- Robinson, H.F. , Comstock, R.E., and Harvey, P.H. “Estimates of heritability and the degree of dominance in corn 1,” Agronomy Journal, vol. 41, no. 8, pp. 353–359, 1949.
- Allard, R.W. (1960). Principles of Plant Breeding, John Wiley and Sons, Inc., New York.
- Johnson, H.W.; Robinson, H.F.; Comstock, R.E. Estimates of genetic and environmental variability in soybeans 1. Agronomy Journal 1955, 47, 314–318. [Google Scholar] [CrossRef]
- Mofokeng, M.A.; Mashilo, J., Rantso; Shimelis, H. Genetic variation and genetic advance in cowpea based on yield and yield-related traits. Acta Agric Scand Sect B Soil Plant Sci 2020, 70, 381–391. [Google Scholar] [CrossRef]
- Manggoel, W.; Uguru M.I., Ndam, O.N. Genetic Variability, Correlation and Path Coefficient Analysis of some Yield Components of Ten Cowpea [Vigna unguiculata (L.) Walp] accessions. J Plant Breed Crop Scie. 2002, 4, 80–86. [Google Scholar] [CrossRef]
- Kumawat, K.C.; Raje, R.S.; Kumhar, B.L. Genetic variation in yield and yield components in cowpea [Vigna unguiculata L. (Walp.)]. Ann Agri-Bio Res 2005, 10, 21–23. [Google Scholar]
- L. Merr.) on whole and water saturated fractions of hydrocarbon (hexane),” Annals of Biological Research, vol. 1, no. 4, pp. 34–40, 2010.
- Narayanankutty C, Mili R, Jaikumaran U. Variability and genetic divergence in vegetable cowpea. J Maharashtra Agricultural University 2003, 28, 26–29. [Google Scholar]
- Vidya C, Oommen S.K, Vijayaraghava. Genetic variability and heritability of yield and related characters in yard-longbean. J Tropical Agric 2002, 40, 11–13. [Google Scholar]
- Mohammed, I.; Victoria, M. Y., Singh; Zaria, A.A. Phenotypic stability for selected traits of some cowpea lines in Nigerian agro-ecologies. Plant Biology and Biotechnology 2017, 5, 67–77. [Google Scholar]
- Tadesse,T., Sefera,G., B. Asmare,B. and Teklaign,A. (2018). “Application of AMMI for grain yield stability analysis in large speckled bean genotypes grown in midlands of bale zone,”Chemical and Biomolecular Engineering, vol. 3, no. 3, pp. 17–21, 2018.
- Asfaw, A. , Assefa,T., Amsalu,B., Negash, k., Alemayehu, F., Gurum, F., Rezene, Y., Finenissa, C., Atnafi,M., and Daba, C., (2008). “Adaptation and yield stability of small red beans elite lines in Ethiopia,” International Journal of Plant Breeding and Genetics, vol. 2, no. 2, pp. 51–63, 2008.
- Abou-Khater, L.; Maalouf, F., Jighly. Adaptability and Stability of Faba Bean (Vicia faba L.) Accessions under Diverse Environments and Herbicide Treatments. Plants 2022, 11(3), 251. [Google Scholar] [CrossRef]
- Gerrano,A.S., van Rensburg, W.S.J., Kutu, F,R.,(.2019). Agronomic evaluation and identification of potential cowpea (Vigna unguiculata L. Walp) genotypes in South Africa. Acta Agric Scand Sect B Soil Plant Sci. 69:295–303.
- Martos-Fuentes, M.; Fernández, J.A., Ochoa. Genotype by environment interactions in cowpea (Vigna unguiculata L. Walp.) grown in the Iberian Peninsula. Crop Past Sci 2017, 68, 924–931. [Google Scholar] [CrossRef]
- Ddamulira, G. , Santos, C.A.F., Alanyo, M., Ramathani, I., Maphosa M. (2017). Maturity,protein content and yield stability of cowpea in Uganda. SA J Plant Soil. 34:255–261.
- Yan, W.; Kang, M.S. GGE biplot analysis: a graphical tool for breeders. In Geneticists, and Agronomists; KANG, M.S., Ed.; CRC Press: Boca Raton, FL, USA, 2003; pp. 63–88. [Google Scholar]
- Yan, W.; Tinker, N.A. Biplot analysis of multi-environment trial data: principles and applications. Can. J. Plant Sci 2006, 86, 623e645. [Google Scholar] [CrossRef]
- Hall, A. E. , Thiaw, S., Ismael, A. M., and Ehlers, J.D. (1997) Water-use efficiency and drought adaptation in cowpea. In: Singh BB, Mohan Raj DR, Dashiell KE and Jackai LEN (eds) Advances in Cowpea Research. (Co-publication of International Institute of Tropical Agriculture (IITA) and Japan International Research Center for Agricultural Sciences (JIRCAS)). Ibadan: IITA, pp. 87–98.
- Santos, A. , Ceccn,G., Rodrigues, E.V., Teodoro, P.E., Makimo, P.A., Alves, V.B., Silva, J.F., Correa, A.M., Alvares, R.C.F., and Torres, F.E. (2015). “Adaptability and stability of cowpea genotypes to Brazilian midwest,” African Journal of Agricultural Research, vol. 10, no. )41, pp. 3901–3908, 2015.
- Moges, A. (2017). “Genotype by environment interaction on yield and micronutrient concentration of biofortified common bean (Phaseolus vulgaris L.) in Ethiopia,” Haramaya University, Haramaya, Ethiopia, 2017, MSc Thesis.
- El-Shaieny, A.A.H.; Abdel-Ati, Y.A.A., El-Damarany; Rashwan, M.R. Stability analysis of components characters in cowpea (Vigna unguiculata (L.) Walp). Journal of Horticulture and Forestry 2002, 7, 24–35. [Google Scholar] [CrossRef]
- Firew, M. 2002. “Simultaneous selection for high yield and stability in common bean (Phaseolus vulgaris) genotypes,” The Journal of Agricultural Science, vol. 138, no. 3, pp. 249–253, 2002.
- Mesfin, H.M. , (2017). Genotype x Environment Interaction and Stability Analysis in Soybean [Glycine max (L.) Merrill]] for Grain Yield in Ethiopia. MSc. Thesis, submitted to the Department of Horticulture and Plant Science Jimma University College of Agriculture and Veterinary Medicine Jimma University, Jimma Microbiol. App. Sci. 6 (9); pp. 967–975.
- Sharma, P. , Baranda, B., Haritwal, S., Sharma, M., (2017). Character association for seed yield and its components in cowpea [Vigna unguiculata (L.) Walp]. Int. J. Curr.
- Owusu, E.Y.; Karikari, B., Kusi. Genetic variability, heritability and correlation analysis among maturity and yield traits in Cowpea (Vigna unguiculata (L) Walp) in Northern Ghana. Heliyon 2021, 7, e07890. [Google Scholar] [CrossRef]
Figure 1.
Agroecological zones and site location on the Map of Nigeria *Source[32].
Figure 1.
Agroecological zones and site location on the Map of Nigeria *Source[32].
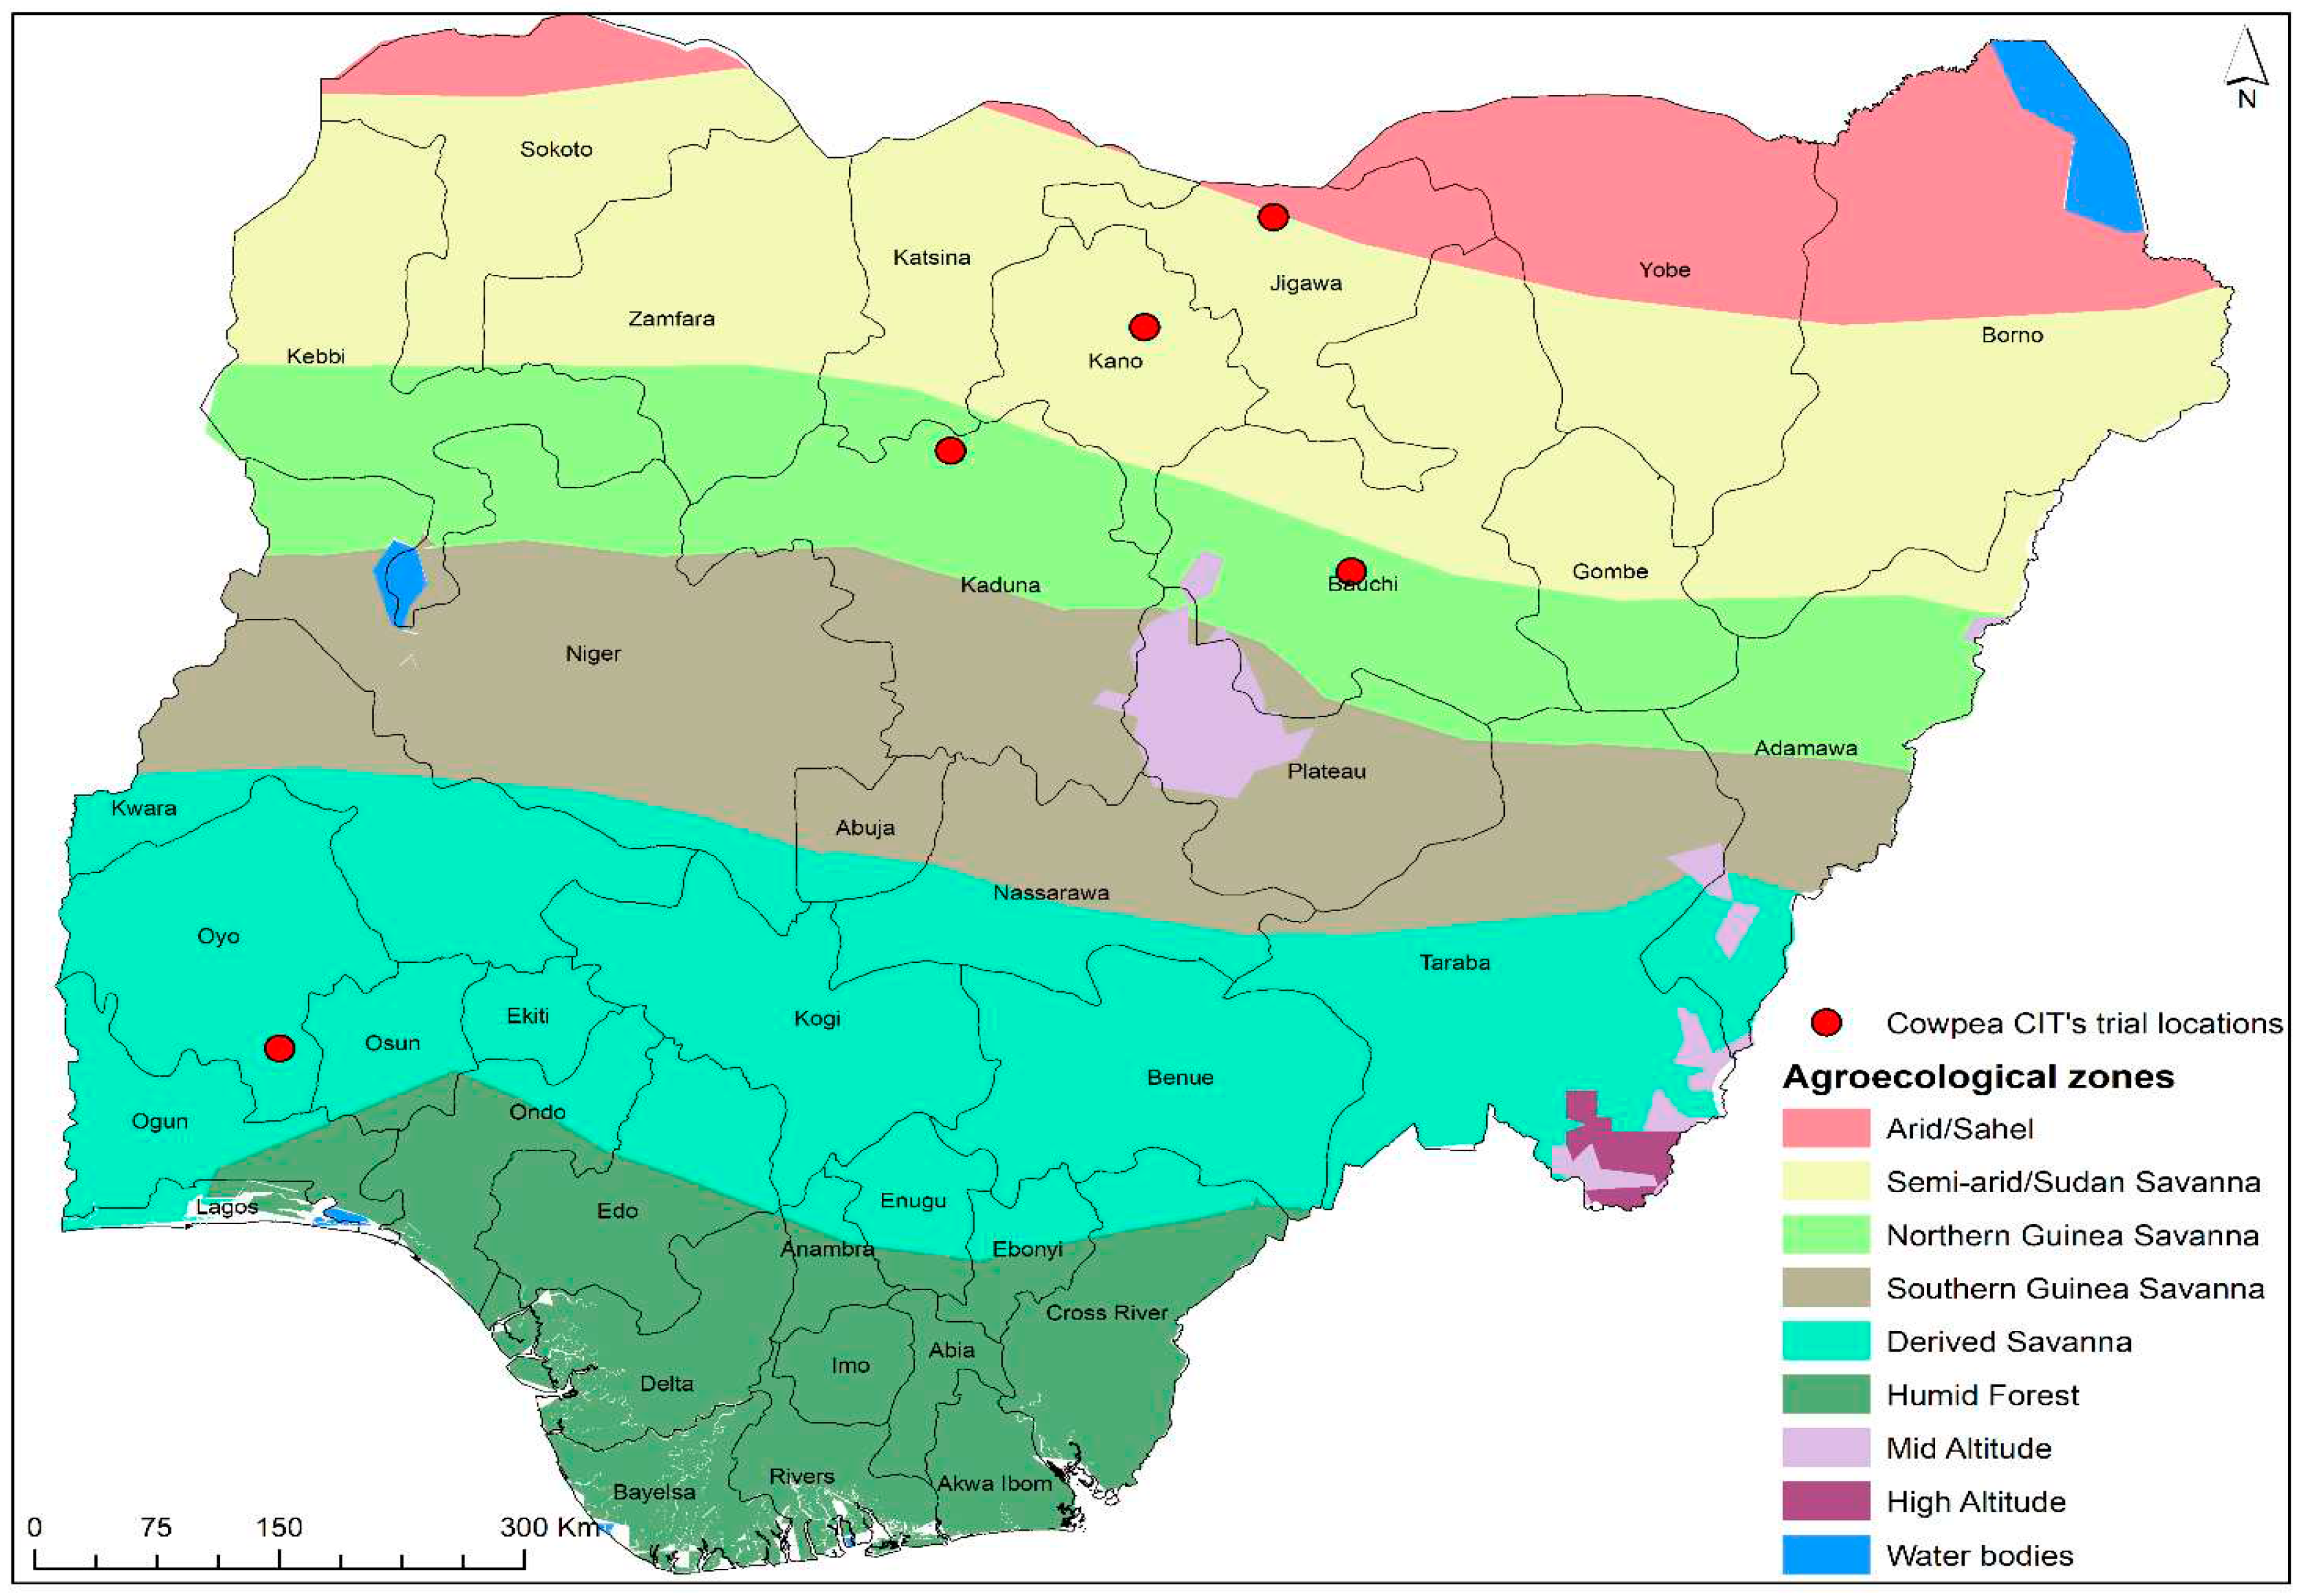
Figure 2.
PCA analysis showing clustering of genotypes and test locations for yield using ViTSel. (ViTSel 2020)
Figure 2.
PCA analysis showing clustering of genotypes and test locations for yield using ViTSel. (ViTSel 2020)
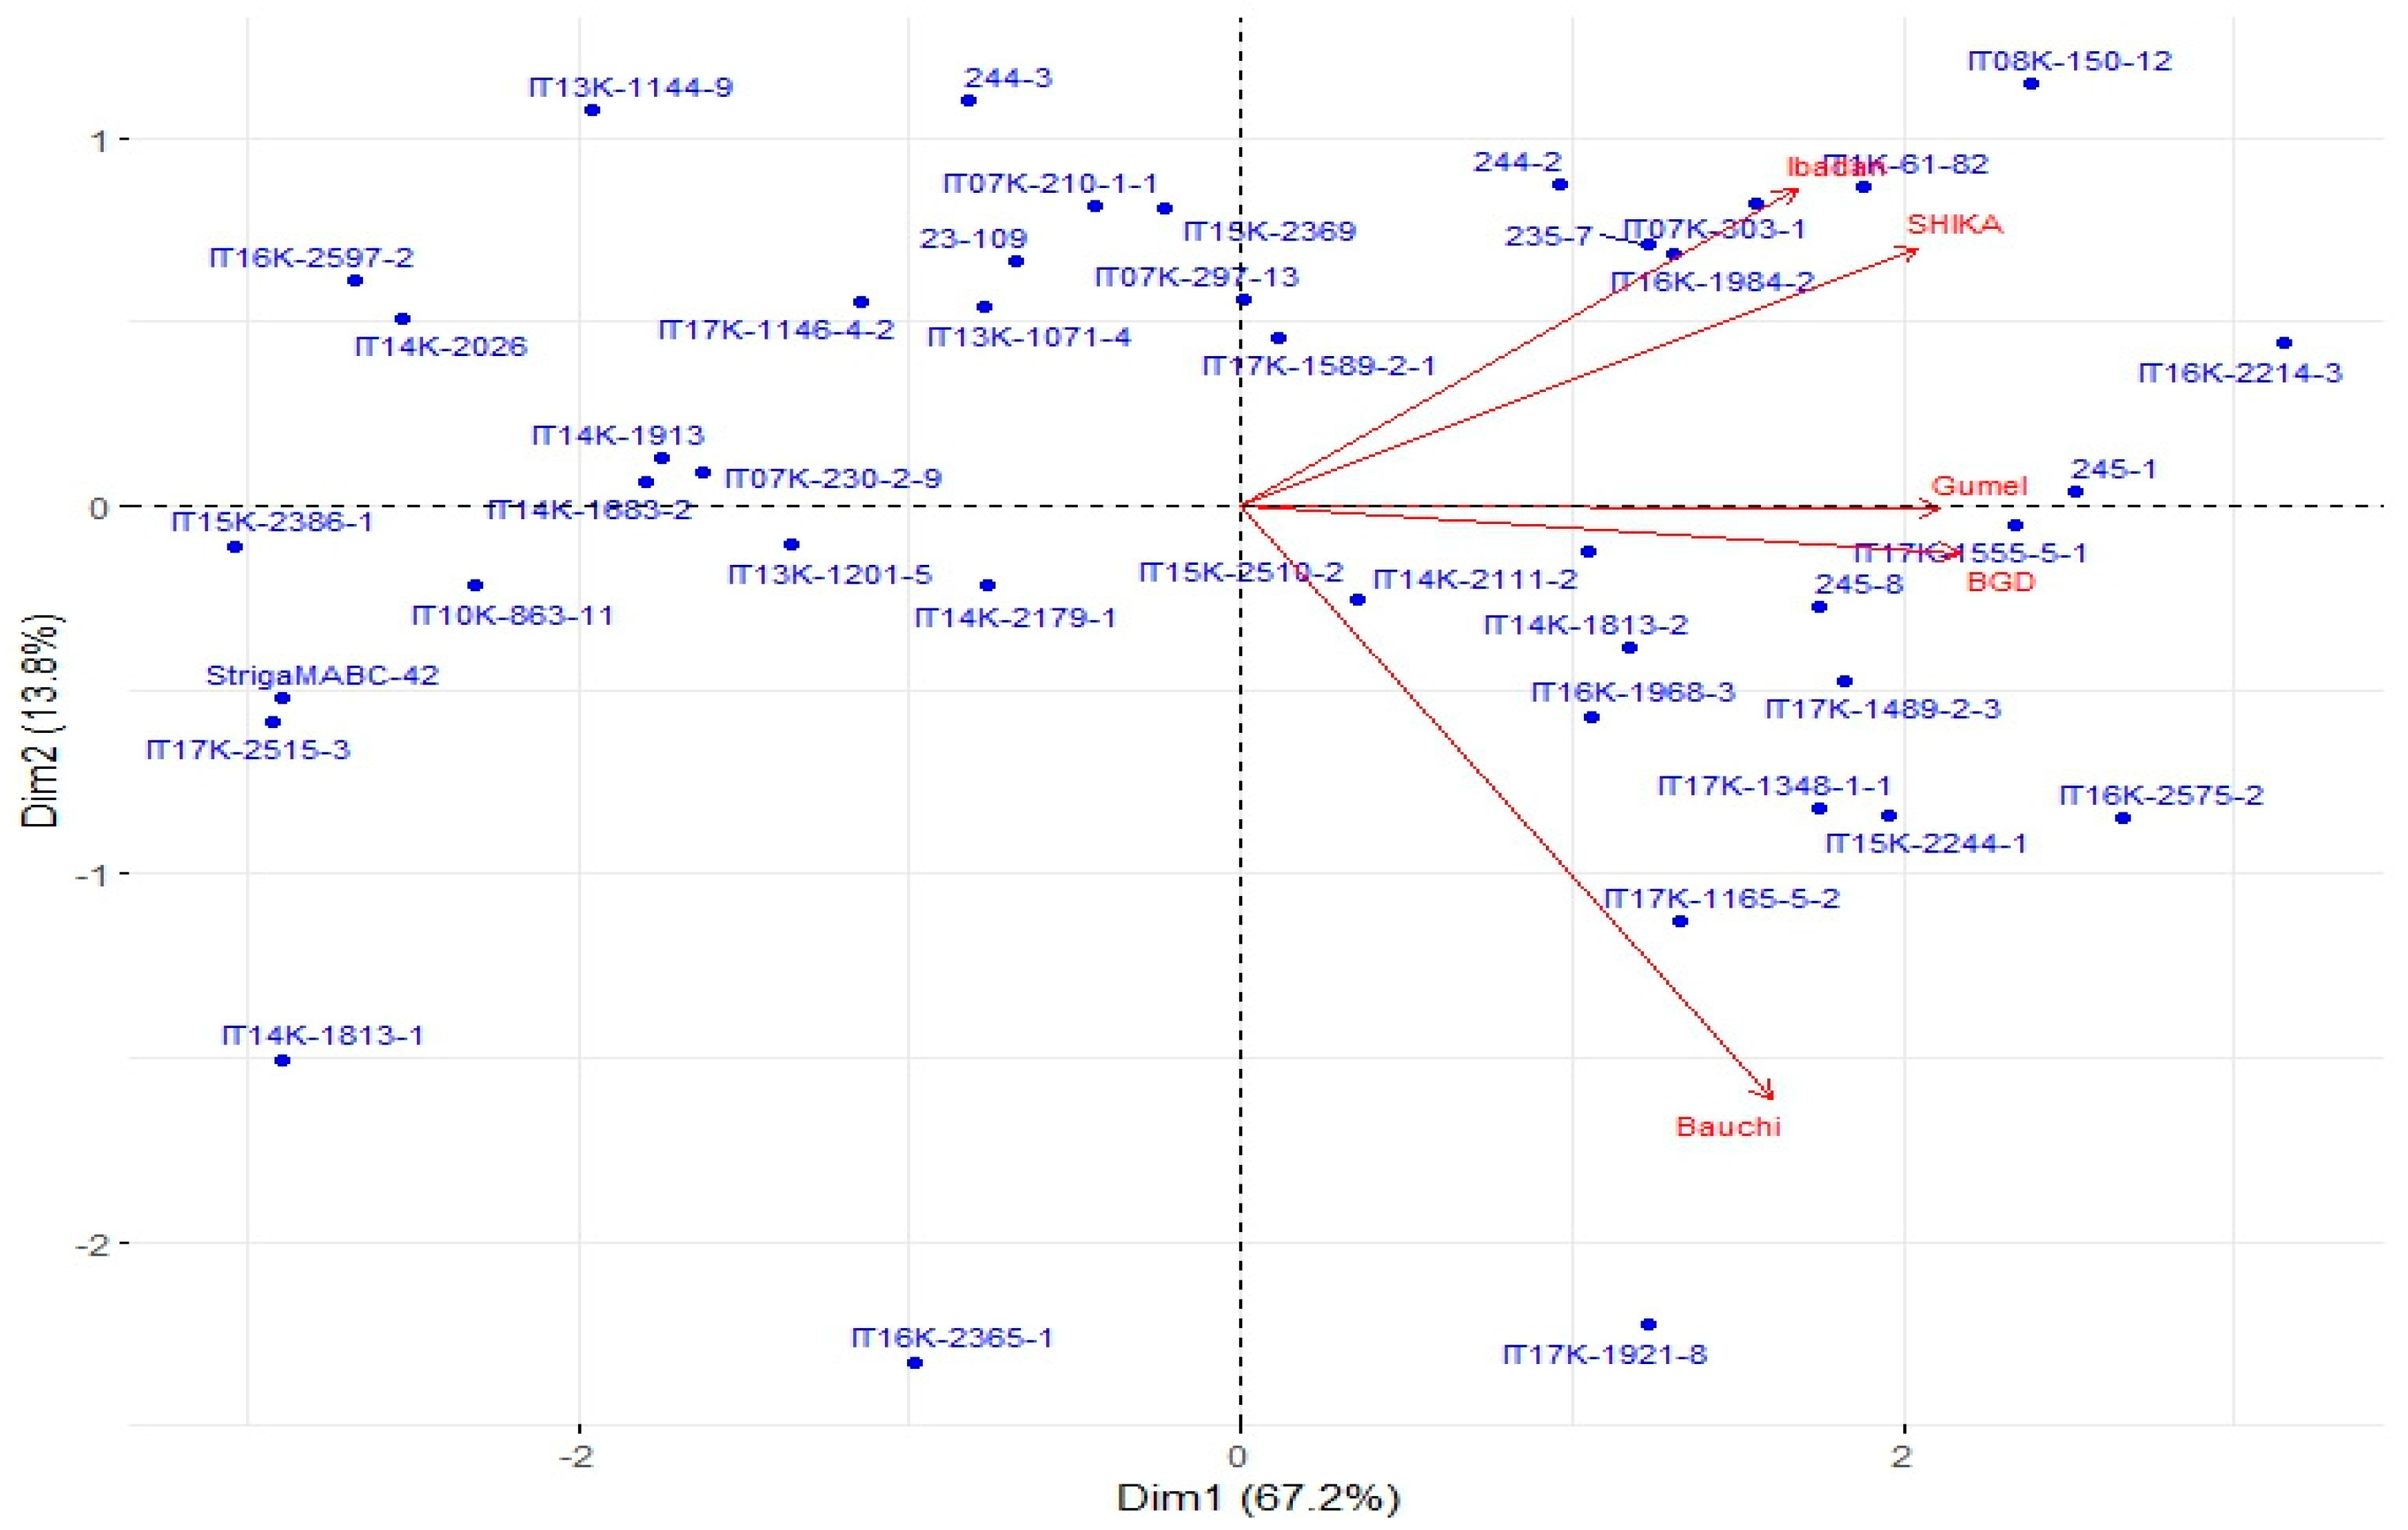
Figure 3.
GGE biplot -Which Won Where-presenting the best genotypes in each environment.
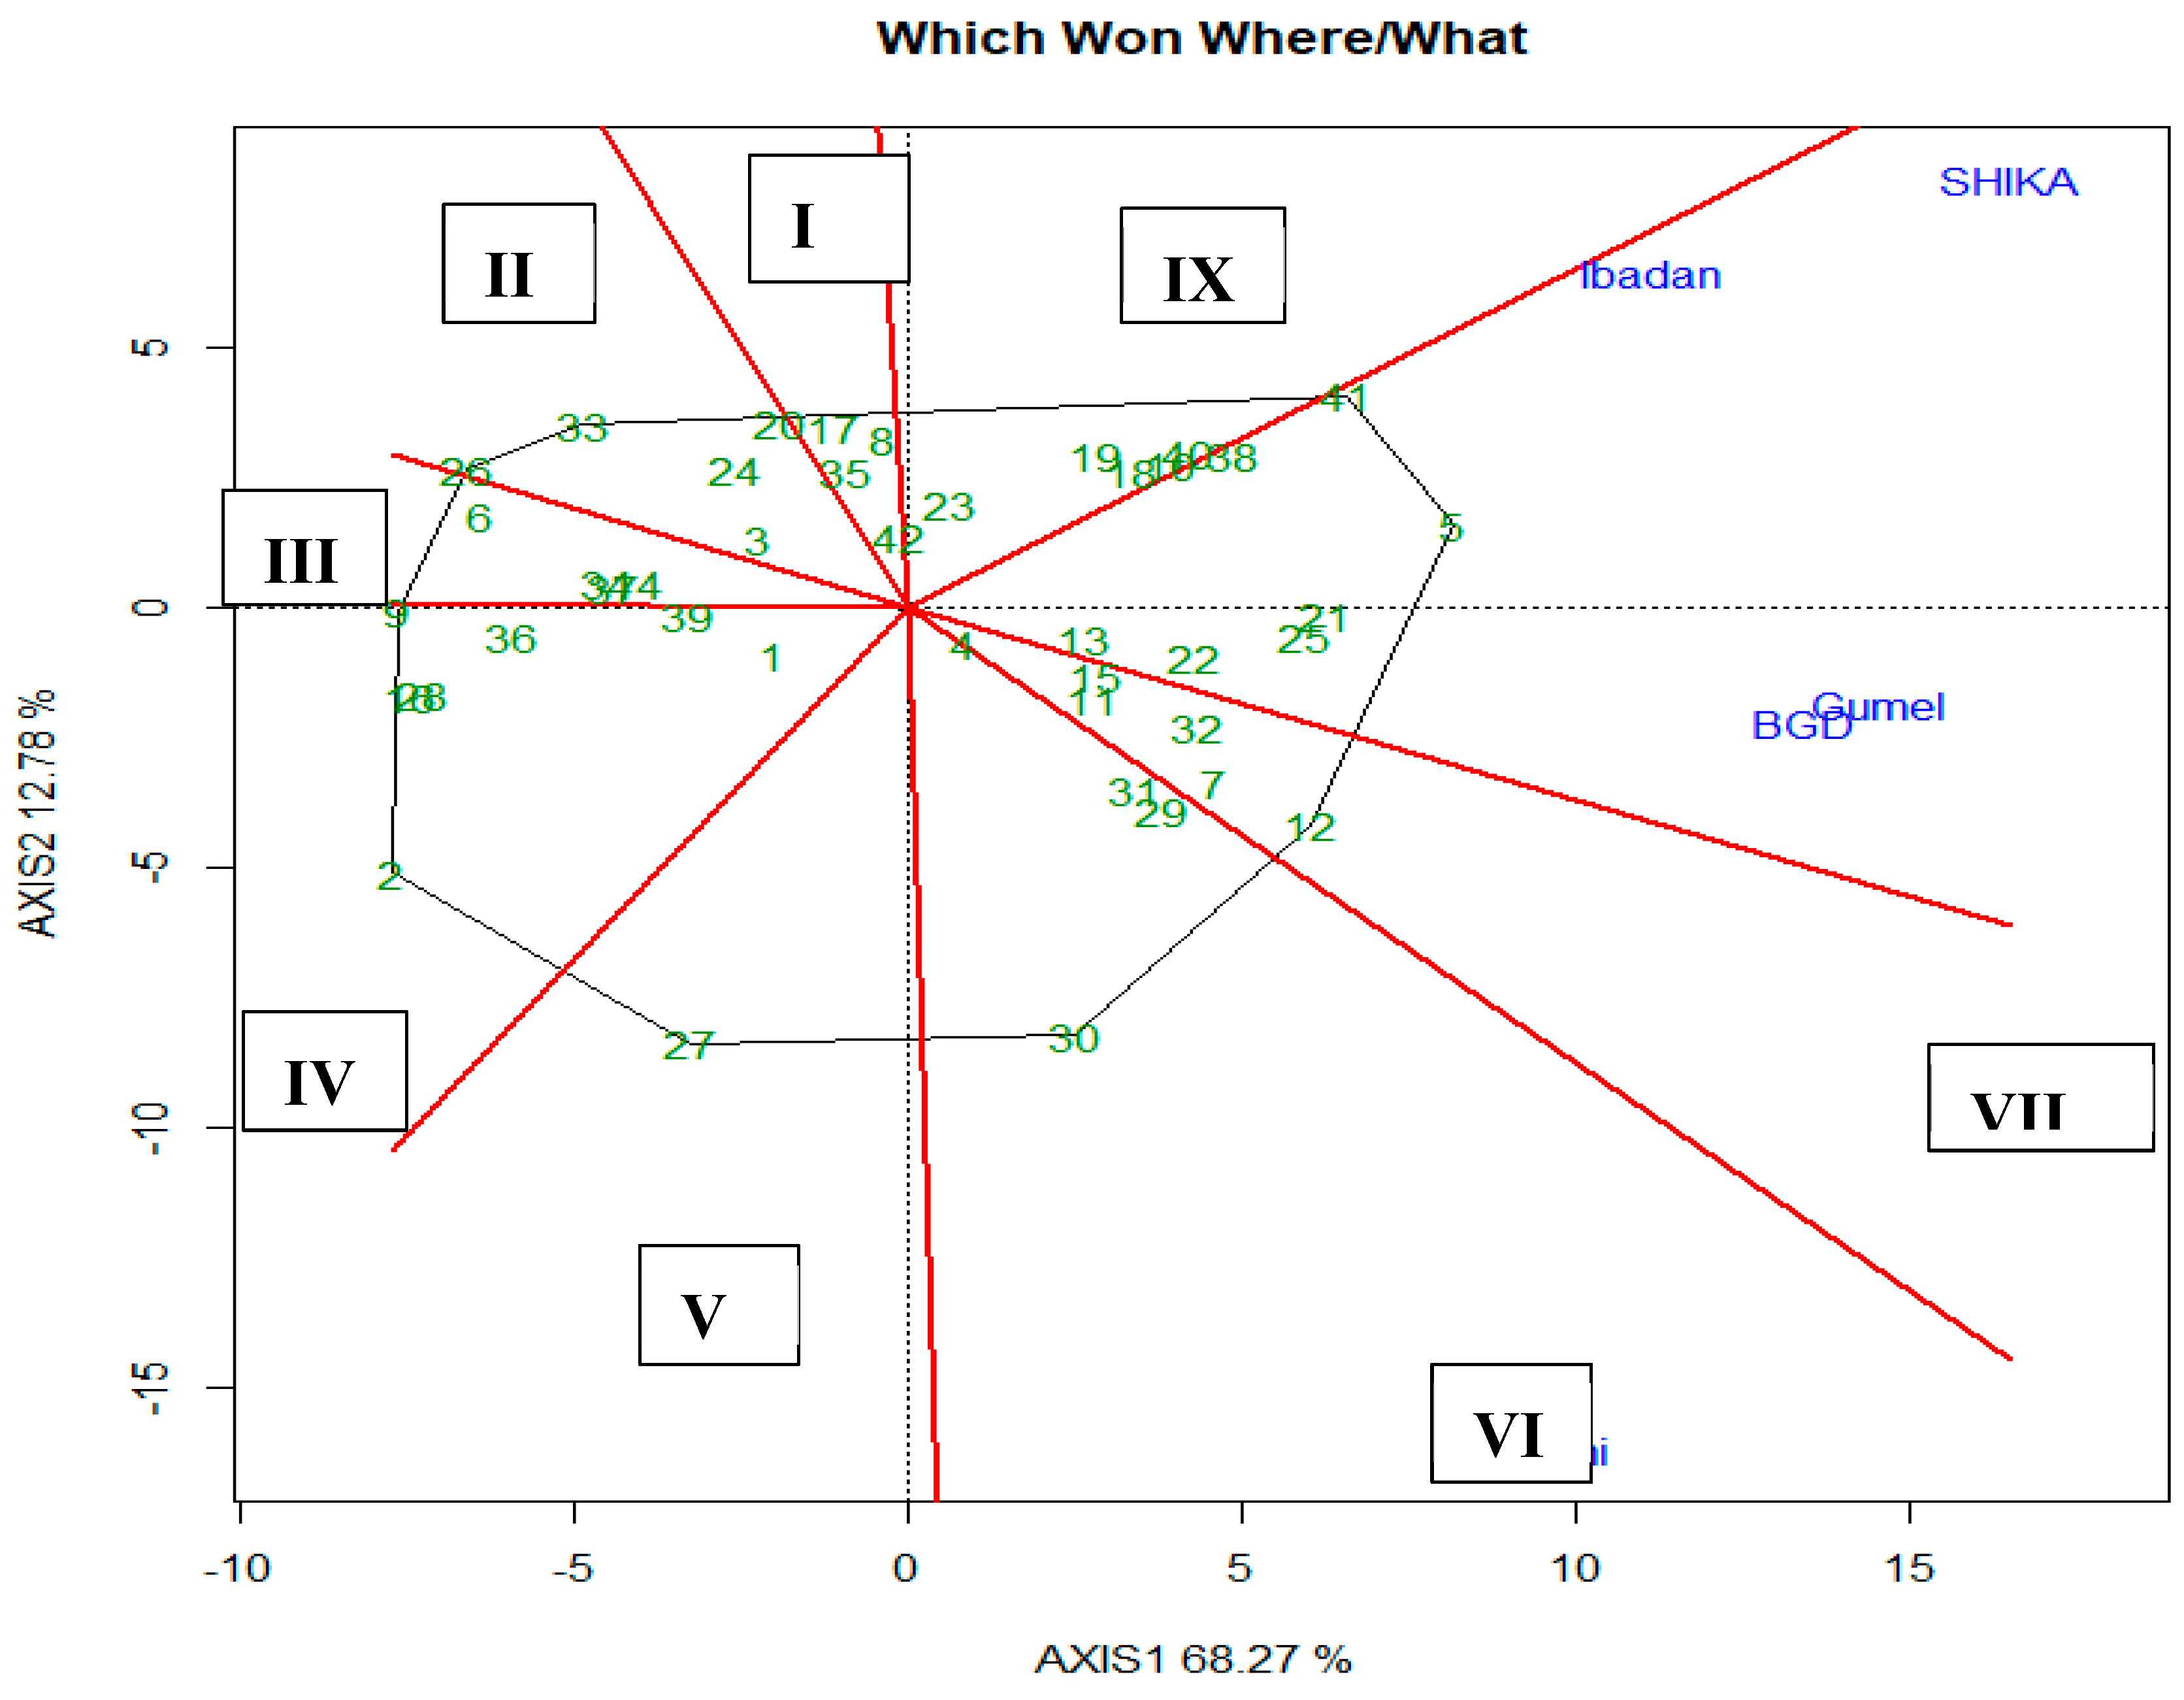
Figure 4.
GGE biplot-presenting mean versus stability for grain yield data across five locations.
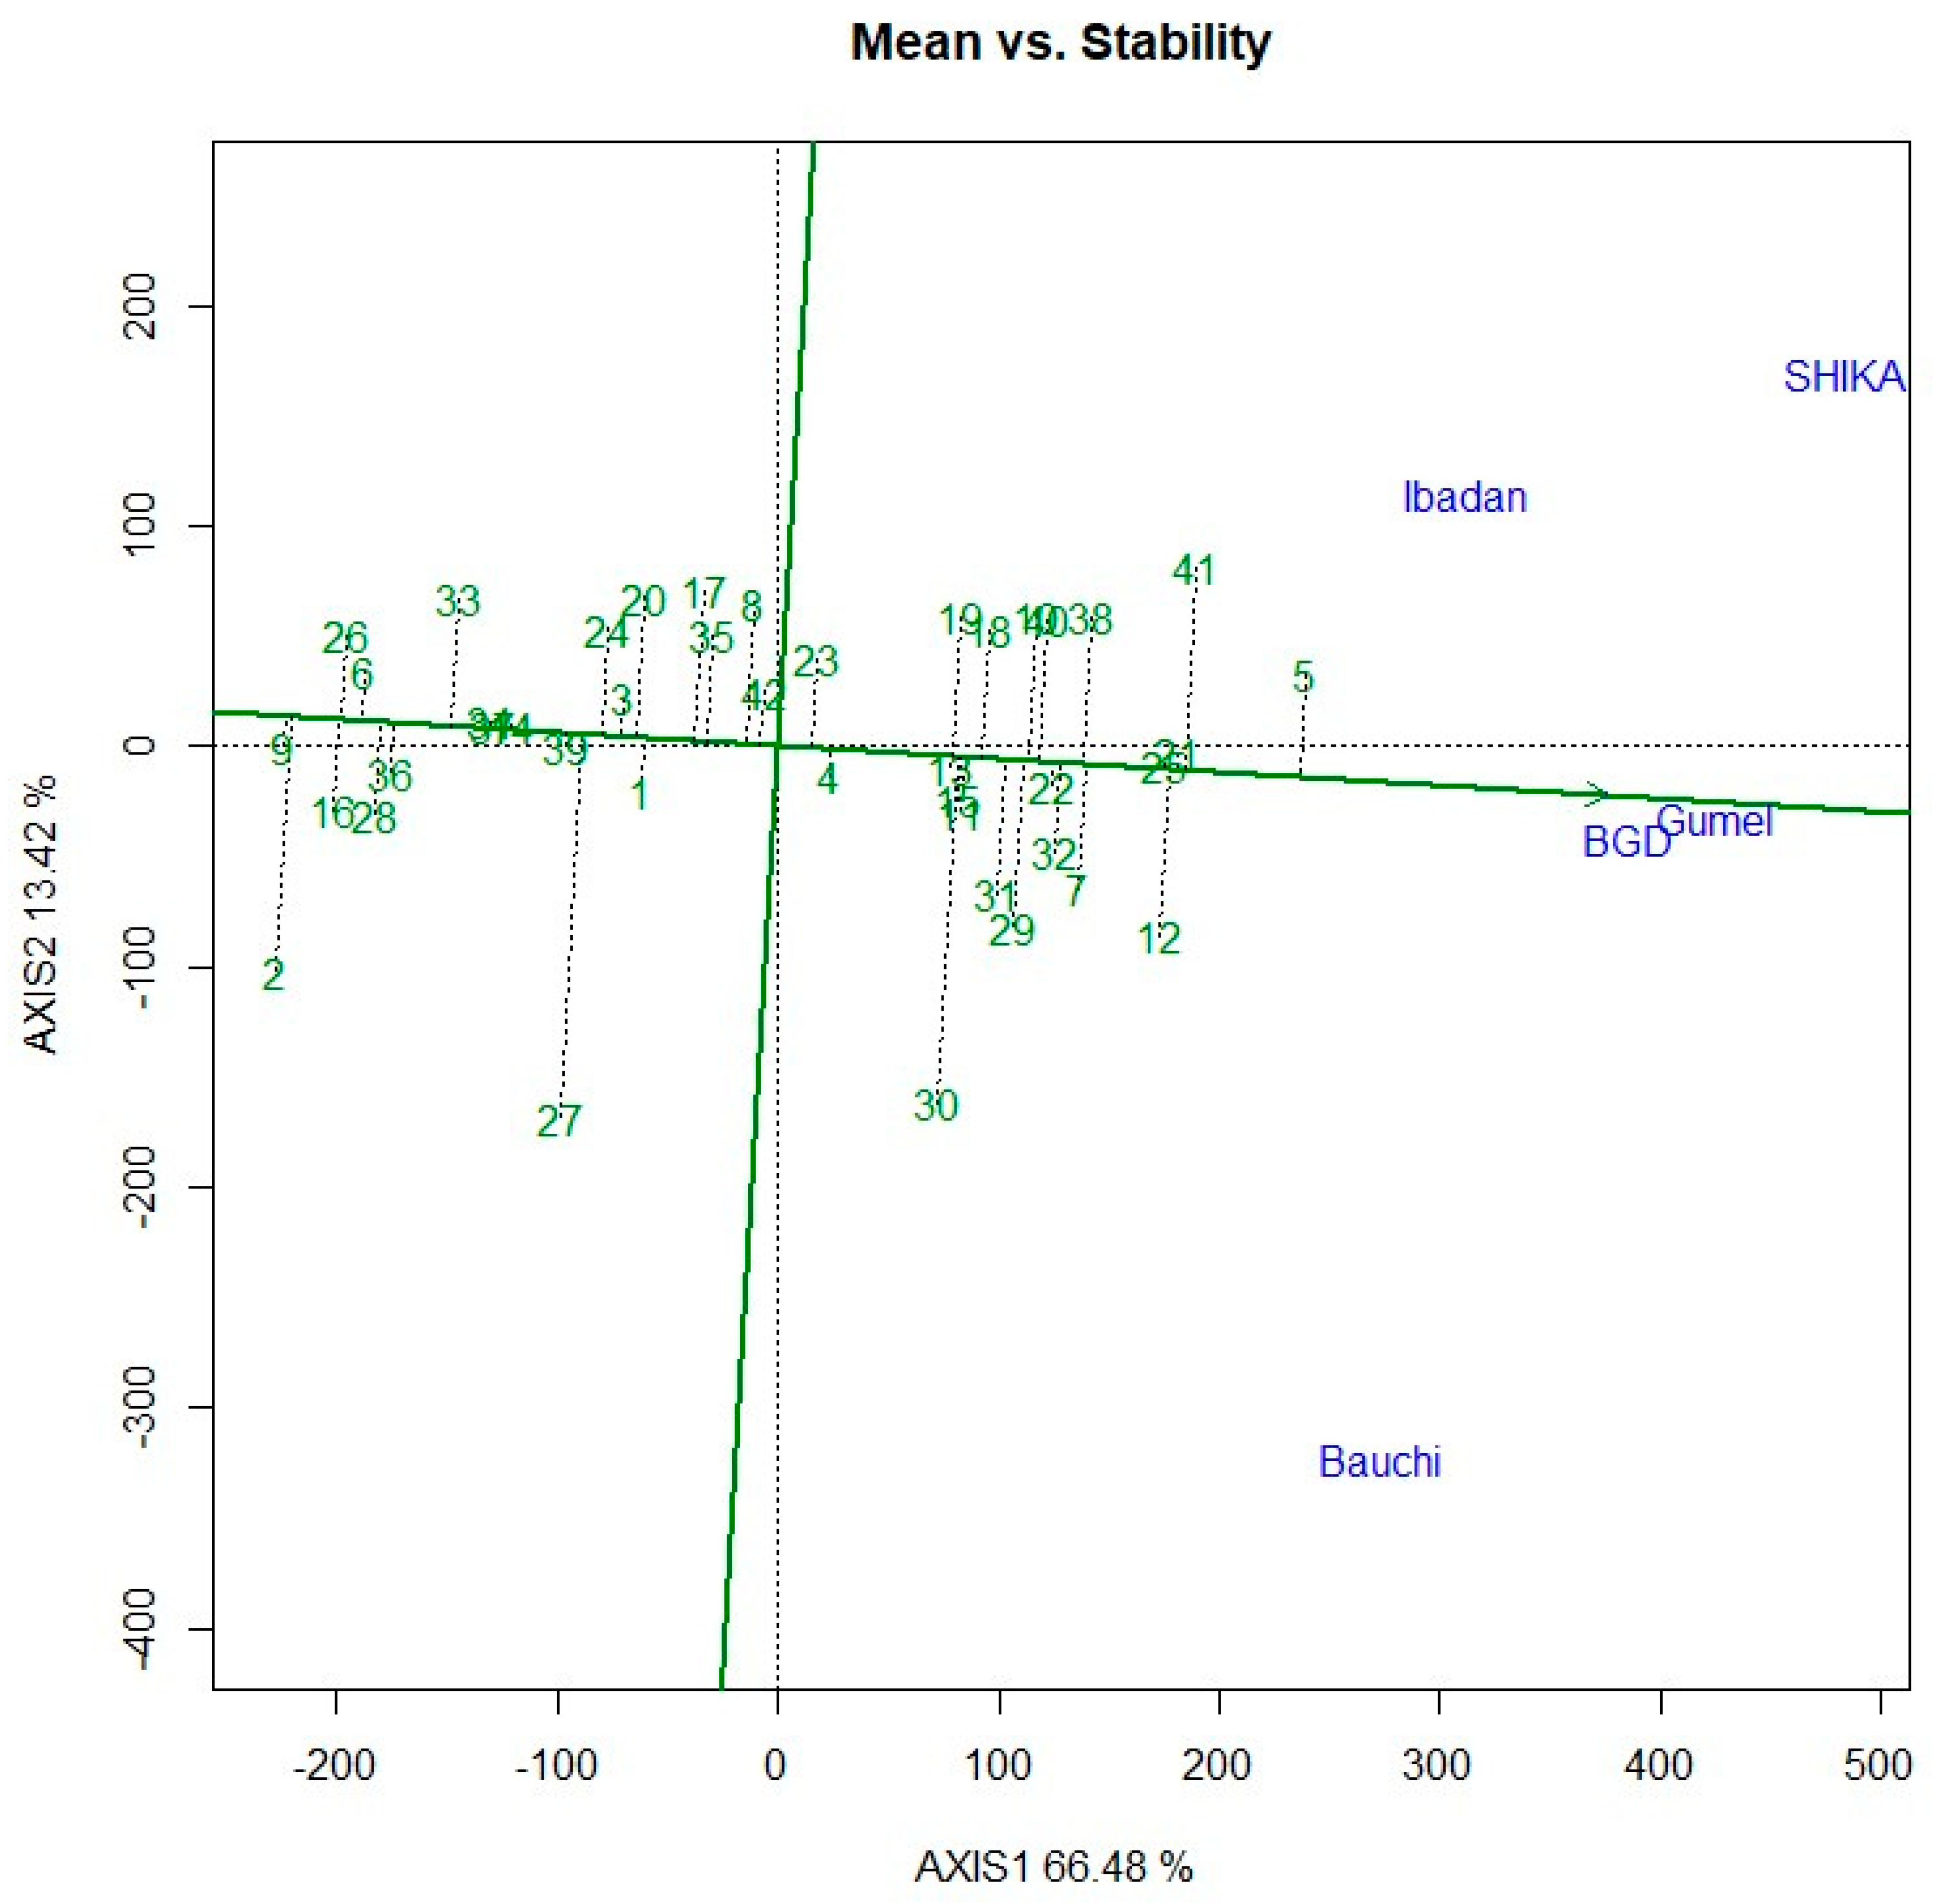
Figure 5.
Relationship between phenology, yield components and bacteria blight incidence for elite cowpea lines evaluated across five locations in Nigeria.
Figure 5.
Relationship between phenology, yield components and bacteria blight incidence for elite cowpea lines evaluated across five locations in Nigeria.
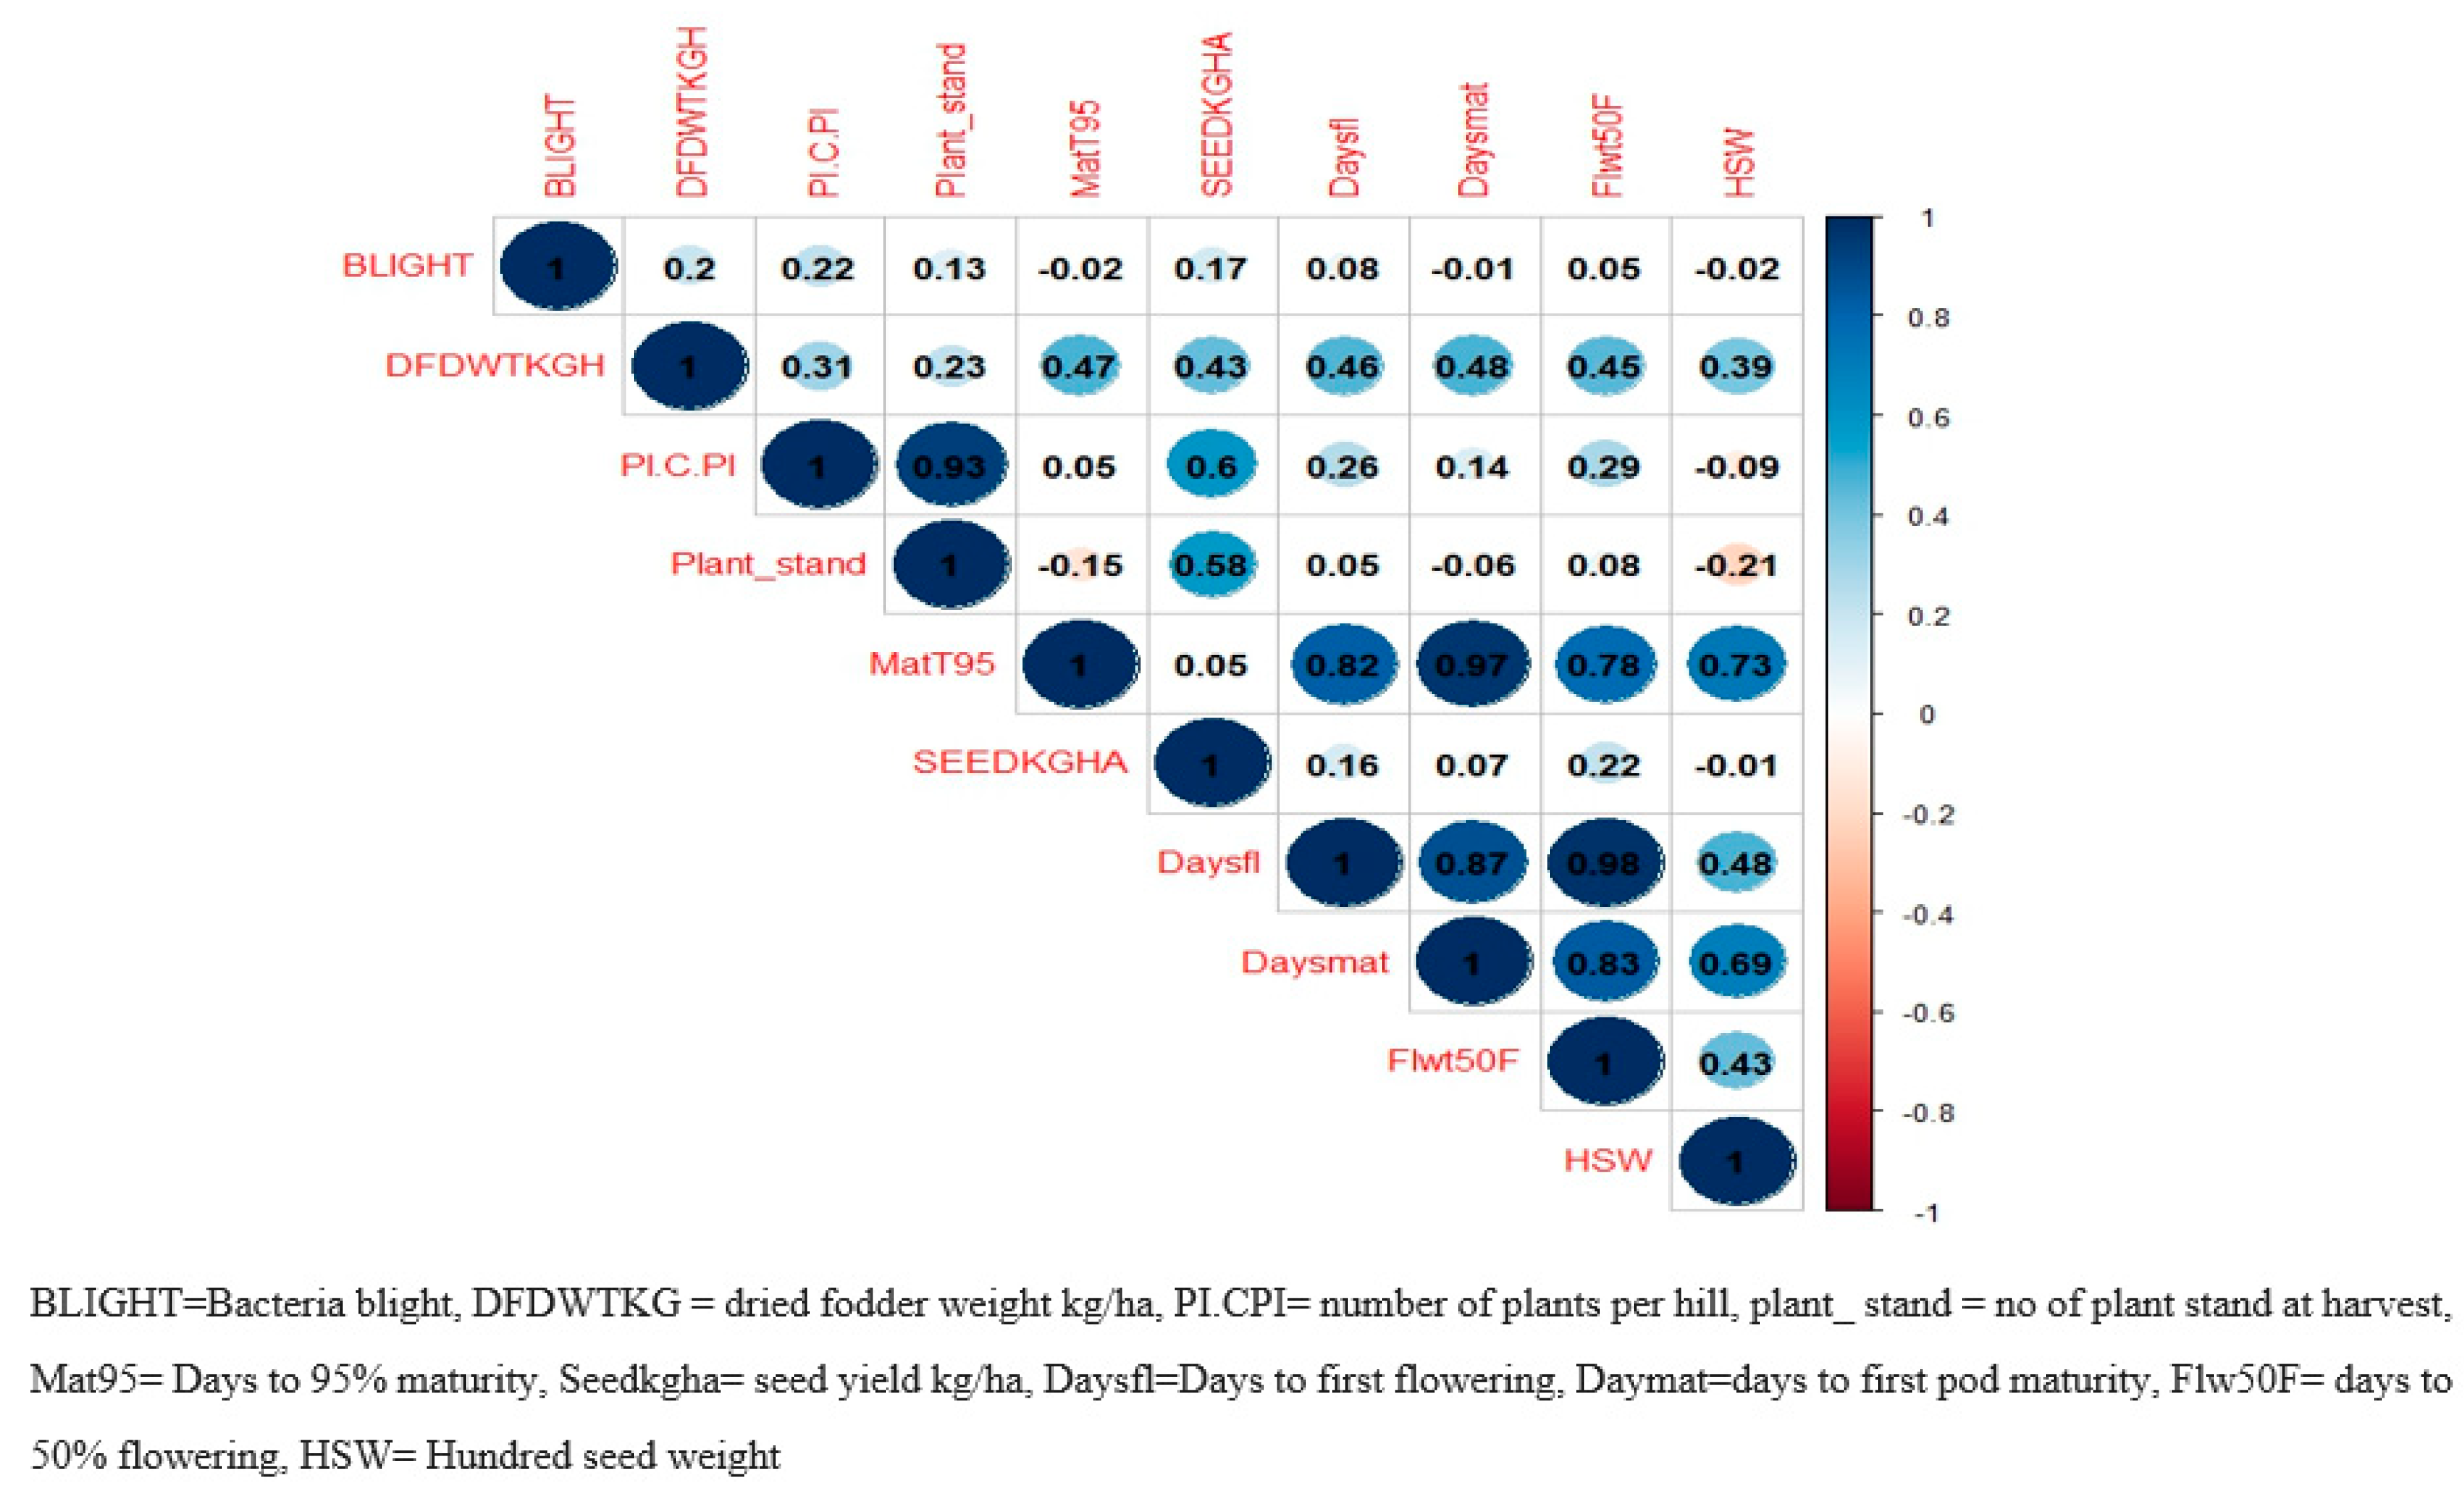

Table 1.
List and description of the genotypes.
| Genotype codes | Genotype | Entry type | Source |
|---|---|---|---|
| G1 | 23-109 | T | IITA |
| G2 | 235-7 | T | IITA |
| G3 | 244-2 | T | IITA |
| G4 | 244-3 | T | IITA |
| G5 | 245-1 | T | IITA |
| G6 | 245-8 | T | IITA |
| G7 | IT07K-210-1-1 | T | IITA |
| G8 | IT07K-230-2-9 | T | IITA |
| G9 | IT07K-297-13 | C | IITA |
| G10 | IT07K-303-1 | T | IITA |
| G11 | IT08K-150-12 | C | IITA |
| G12 | IT10K-863-11 | T | IITA |
| G13 | IT13K-1071-4 | T | IITA |
| G14 | IT13K-1144-9 | T | IITA |
| G15 | IT13K-1201-5 | T | IITA |
| G16 | IT14K-1683-2 | T | IITA |
| G17 | IT14K-1813-1 | T | IITA |
| G18 | IT14K-1813-2 | T | IITA |
| G19 | IT14K-1913 | T | IITA |
| G20 | IT14K-2026 | T | IITA |
| G21 | IT14K-2111-2 | T | IITA |
| G22 | IT14K-2179-1 | T | IITA |
| G23 | IT15K-2244-1 | T | IITA |
| G24 | IT15K-2369 | T | IITA |
| G25 | IT15K-2386-1 | T | IITA |
| G26 | IT15K-2510-2 | T | IITA |
| G27 | IT16K-1968-3 | T | IITA |
| G28 | IT16K-1984-2 | T | IITA |
| G29 | IT16K-2214-3 | T | IITA |
| G30 | IT16K-2365-1 | T | IITA |
| G31 | IT16K-2575-2 | T | IITA |
| G32 | IT16K-2597-2 | T | IITA |
| G33 | IT17K-1146-4-2 | T | IITA |
| G34 | IT17K-1165-5-2 | T | IITA |
| G35 | IT17K-1348-1-1 | T | IITA |
| G36 | IT17K-1489-2-3 | T | IITA |
| G37 | IT17K-1555-5-1 | T | IITA |
| G38 | IT17K-1589-2-1 | T | IITA |
| G39 | IT17K-1921-8 | T | IITA |
| G40 | IT17K-2515-3 | T | IITA |
| G41 | IT1K-61-82 | T | IITA |
| G42 | StrigaMABC-42 | T | IITA |
T-test entries, C- check [32].
Table 2.
Description of the study environments.
| Location | State | Latitude | Longitude | Elevation | Agroecology | *Annual rainfall (Min-Max) mm | Rainfall duration (months) | Temperature ◦C Min- Max | Soil Type† |
|---|---|---|---|---|---|---|---|---|---|
| Bagauda | Kano | 11.945 | 8.6736 | 499m | Semi-arid/Sudan Savanna | 552mm - 1093mm | June - November | 19 ◦C - 33 ◦C | Regosols |
| (ATBU)Gubi | Bauchi | 10.439722 | 9.8131 | 602m | Northern Guinea Savanna | 779mm - 1192mm | June - November | 19 ◦C - 32 ◦C | Lixisols |
| Gumel | Jigawa | 12.622611 | 9.384 | 371m | Semi-arid/Sudan Savanna | 293mm - 662mm | June - November | 20 ◦C - 35 ◦C | Cambisols |
| Shika | Kaduna | 11.1825 | 7.6044 | 692m | Northern Guinea Savanna | 818mm - 1242mm | May - November | 18 ◦C - 32 ◦C | Lixisols |
| IITA-Ibadan | Oyo | 7.501424 | 3.90992 | 235m | Derived Savanna | 939mm - 1681mm | March - November | 21 ◦C - 31 ◦C | Lixisols |
Table 3.
Summary Statistics, Heritability Estimates and Variation Metrics for Elite Cowpea Lines Evaluated for Key Agronomic Traits Across Various Agroecologies.
Table 3.
Summary Statistics, Heritability Estimates and Variation Metrics for Elite Cowpea Lines Evaluated for Key Agronomic Traits Across Various Agroecologies.
| Traits | Mean± SE | LSD | CV | Enva | Genob | Geno *Envc |
H2 | GCV | PCV | GA | GAM |
|---|---|---|---|---|---|---|---|---|---|---|---|
| DFDWTKGH | 585.72±41.50 | 31.25 | 210.31 | <0.001 | <0.001 | <0.001 | 0.70 | 265.11 | 756.26 | 252.80 | 43.16 |
| Daysfl | 42.07±0.35 | 4.13 | 1.04 | <0.001 | <0.001 | <0.001 | 0.85 | 23.68 | 26.82 | 2.99 | 7.09 |
| Flwt50F | 45.24±0.49 | 4.04 | 1.67 | <0.001 | <0.001 | <0.001 | 0.83 | 22.99 | 27.22 | 3.05 | 6.75 |
| Daysmat | 60.52±0.48 | 3.51 | 1.48 | <0.001 | <0.001 | <0.001 | 0.82 | 21.95 | 27.32 | 3.47 | 5.74 |
| MatT95 | 70.33±0.53 | 4.05 | 1.62 | <0.001 | <0.001 | <0.001 | 0.83 | 23.56 | 27.82 | 3.87 | 5.50 |
| SEEDKGHA | 809.85±45.1 | 15.44 | 176.65 | <0.001 | <0.001 | <0.001 | 0.49 | 218.33 | 439.55 | 117.48 | 14.51 |
| HSW | 15.85±0.31 | 15.83 | 0.93 | <0.001 | <0.001 | <0.001 | 0.97 | 59.89 | 63.02 | 4.97 | 31.35 |
ap = value for environment factor; bp = value for genotype factor, cp = value for genotype-by environment interaction factor; LSD =least significant difference, CV= coefficient of variation, H2= broad sense heritability, GCV = Genotypic coefficient of variation, PCV=phenotypic coefficient of variation, GA= genetic advancement, GAM= genetic advance as percentage of the mean, DFDWTKG= dried fodder weight (kg/ha), Daysfl=Days to first flowering, Flw50F= days to 50% flowering, Daymat=days to first pod maturity, Mat95=Days to 95% maturity, Seedkgha= seed yield kg/ha, HSW=100 seed weight.
Disclaimer/Publisher’s Note: The statements, opinions and data contained in all publications are solely those of the individual author(s) and contributor(s) and not of MDPI and/or the editor(s). MDPI and/or the editor(s) disclaim responsibility for any injury to people or property resulting from any ideas, methods, instructions or products referred to in the content. |
© 2023 by the authors. Licensee MDPI, Basel, Switzerland. This article is an open access article distributed under the terms and conditions of the Creative Commons Attribution (CC BY) license (http://creativecommons.org/licenses/by/4.0/).
Copyright: This open access article is published under a Creative Commons CC BY 4.0 license, which permit the free download, distribution, and reuse, provided that the author and preprint are cited in any reuse.


