
Submitted:
26 November 2023
Posted:
28 November 2023
You are already at the latest version
Abstract
Studies of mast cell biology is dependent on relevant and validated in vitro models. We here present detailed information concerning the phenotype of both freshly isolated human skin mast cells (MCs), and of in vitro cultures of these cells that was obtained by analyzing their total transcriptome. Transcript levels of MC-related granule proteins and transcription factors were found to be remarkably stable over a 3-week culture period. Relatively modest changes were also seen for important cell surface receptors including the high affinity receptor for IgE, FCER1A, the low affinity receptor for IgG, FCGR2A, and the receptor for stem cell factor, KIT. FCGR2A was the only Fc receptor for IgG expressed by these cells. Comparisons of the present transcriptome against previously reported transcriptomes of mouse peritoneal MCs and mouse bone marrow derived MCs (BMMCs) revealed both similarities and major differences. Strikingly, cathepsin G was the most highly expressed granule protease in human skin MCs, in contrast to the almost total absent of this protease in both mouse MCs. Transcript levels for the majority of cell surface receptors were also very low compared to the granule proteases in both mouse and human MCs, with a difference of almost two orders of magnitude. An almost total absence of T cell granzymes was observed in human skin MCs, indicating that granzymes have no or only a minor role in human MC biology. Ex vivo skin MCs expressed high levels of selective immediate early genes and transcripts of heat-shock proteins. In validation experiments, we determined that this expression was an inherent property of the cells and not the result of the isolation process. Three to four weeks in culture results in an induction of cell growth related genes accompanying their expansion by 6-10-fold, which increases the number of cells for in vitro experiments. Collectively, we show that cultured human skin MCs resemble their ex vivo equivalents in many respects and are a more relevant in vitro model compared to mouse BMMCs for studies of MC biology, in particular human MC biology.
Keywords:
mast cells
; granule proteases
; cathepsin G
; tryptase
; chymase
; Fc receptors
; IgE
; prostaglandins
; leukotrienes
; heparin
1. Introduction
Mast cells (MCs) are hematopoietic cells that are positioned at the interphase between tissue and environment such as the skin, the tongue, the intestinal mucosa and the lung [1]. They are highly specialized cells filled with electron dense granules that can act on external threats to initiate an inflammatory response. A number of physiologically highly potent substances such as histamine, heparin and a number of abundant granule proteases are stored in these granules. The granule-stored proteases can constitute up to 35% of the total cellular protein and the transcript levels for these proteases are among the highest in the entire cell [1,2]. The levels can reach several % of the total transcriptome [1,3]. Heparin and the related chondroitin sulfate are highly sulfated and negatively charged proteoglycans expressed by MCs. They play important roles as anticoagulants, as stabilizing agents for MC proteases and as charge-compensating molecules in the granule storage of positively charged mediators, including histamine. The enzymes involved in the synthesis of these proteoglycans and of histamine are therefore important markers for MCs.
MCs can rapidly release their granule material upon stimulation of the cell by crosslinking of receptors for immunoglobulin E (IgE), or by stimulation by complement components like the anaphylatoxins C3a, C4a and C5a. MCs can also be activated by positively charged low molecular weight compounds, like substance P and compound 48/80. This response is mediated by the MRGPRX2 receptor, which is almost exclusively expressed by connective tissue type MCs (CTMCs) [4,5,6]. Upon activation MCs also produce a number of lipid mediators, including leukotriene C4 (LTC4) and prostaglandin D2 (PGD2). The enzymes involved in their synthesis, such as phospholipase A2 (PLA2), the hematopoietic prostaglandin D synthase (HPGDS) and leukotriene C4 synthase (LTC4S) are also important markers for MCs.
MC development and migration are regulated by cytokines and chemokines that deliver their information by binding to specific cell surface receptors. Growth and differentiation of MCs are primarily regulated by stem cell factor (SCF), interleukin-3 (IL-3) (especially in the mouse), IL-4 and IL-33, and the receptors for these cytokines are important characteristics of MCs [7,8,9,10,11,12,13,14,15,16,17,18,19,20,21,22]
Transcription factors play a key role in cell growth and differentiation and several of them are important characteristics of MCs, including GATA1, GATA2 and MITF [1,5,23,24,25]. Analyzing the transcript levels for these transcription factors can therefore reveal important features of MCs and how their phenotype changes upon in vitro culture conditions. These transcription factors are also important for the physiological role of MCs and can thereby give information on differences in MC biology between species. The MC-related transcription factors were therefore used in the present study, together with a panel of other proteins, as markers for the comparison between MCs in mouse and man and for characterization of how MCs change upon culture. A selection of results from published studies on mouse peritoneal MCs and in vitro expanded mouse bone marrow derived MCs (BMMCs) using the Ampliseq technology have been summarized in Table 1 [1,26] for comparison with the human MC data presented in this article.
The majority of tissue MCs seem to originate from an early wave of cells coming from the yolk sac [27,28]. However, during inflammatory conditions MC precursors can also be recruited from the bone marrow to increase in number in the inflamed tissue [29]. The fate of these cells upon returning to steady state conditions of the tissue is not fully known but involves most likely apoptosis of the majority of the cells. This relatively recent information concerning the origin of the majority of tissue MCs and macrophages has changed the view of the role of the bone marrow for both MCs and other hematopoietic cells like macrophages. Such information is of major importance for our view of the characteristics of in vitro developed cells originating from the bone marrow compared to tissue-resident MCs and macrophages [30,31,32,33,34,35,36]. The most commonly used in vitro model for mouse MCs is namely bone marrow derived MCs (BMMCs). These cells most likely represent cells of a different origin compared to the majority of tissue MCs, which appear to be yolk sac derived. We have also recently shown that these BMMCs represent relatively immature cells that differ markedly in phenotype from tissue resident MCs and should therefore be used with care as in vitro models of MC physiology [26] (see also Table 1). An interesting in vitro model for studies of MCs physiology is therefore human skin MCs that can be expanded in vitro by medium containing serum and recombinant SCF and IL-4, as described in this article. We can here show that they resemble tissue resident MCs much better than mouse BMMCs and are therefore superior as in vitro model in particular for research of human MC biology.
2. Materials and Methods
2.1. Purification of human skin MCs
MC purification was performed as previously described [37,38] with several modifications specified in more recent work [21]. Skin was cut into strips and treated with dispase (24.5 ml per preparation, activity: 50 U/ml; Corning, Kaiserslautern, Germany) at 4°C overnight. After removal of the epidermis, the dermis was chopped into small pieces and digested with 2.29 mg/ml collagenase (Worthington, Lakewood, NJ), 0.75 mg/ml hyaluronidase (Sigma, Deisenhofen, Germany), DNase I at 10 µg/ml (both from Roche, Basel, Switzerland), and 5 mM MgSO4 for 1 h at 37°C.
The cell suspensions were separated from remaining tissue by three steps of filtration. In case of breast skin, the undigested tissue still remaining after the first digestion was subjected to a second digestion step of 1 h at 37° C after the first filtration. MC purification from the dispersates was achieved by positive selection with anti-human c-Kit microbeads and an Auto-MACS separation device (both from Miltenyi Biotec, Bergisch Gladbach, Germany). MC purity always exceeded 98%, as assessed by acidic toluidine-blue staining (0.1% in 0.5 N HCl).
2.2. In vitro culture of human skin MCs
The isolated skin MCs were expanded in vitro for 2-3 weeks in cell culture medium (basal Iscove’s medium; BioSell, Feucht, Germany) containing 10% fetal calf serum (Biochrom. Berlin, Germany), 1% P/S (Fisher Scientific, Berlin, Germany), 1% non-essential amino acid solution (Roth, Karlsruhe, Germany), 100 ng/ml recombinant human stem cell factor (SCF) (Thermo Fisher Scientific) and 20 ng/ml of recombinant human IL-4 (Thermo Fisher Scientific). The medium was changed every three days to ensure sufficient quantity of the recombinant cytokines.
2.3. RNA isolation and heparinase treatment
Total RNA was prepared from freshly isolated MCs and in vitro cultured MCs, respectively, following an established protocol for each preparation. Briefly, MCs were lysed in 700 µl QIAzol®lysis reagent (Qiagen, Hilden, Germany), mixed with 140 µl chloroform (Sigma) and 60 µl DEPC-treated water and transferred to a 2 ml gel tube (Quanta bio/VWR, Dresden, Germany). After centrifugation, the supernatant was transferred to a NucleoSpin® filter and RNA was isolated using the NucleoSpin RNA kit from Machery-Nagel (Düren, Germany) following the manufacturer’s instructions. For heparinase (BioLab, Braunschweig, Germany) treatment the resulting RNA solution was mixed with RNAse inhibitor (Thermo Fisher Scientific), and heparinase buffer (BioLab, Braunschweig, Germany) and incubated for 3 hours at 25°C. Another RNA isolation procedure was followed, using the NucleoSpin RNA kit from Machery-Nagel (Düren, Germany) according to the manufacturer’s protocol. To further concentrate preparations, RNA was precipitated overnight at -80°C using 100% ethanol and sodium acetate (Merck, Darmstadt, Germany). RNA of each preparation was eventually solved in 20 µl DEPC-treated water. After each treatment step, RNA concentration was determined by using a Nanodrop ND-1000 (Nano Drop Technologies, Wilmington, Delaware, USA).
2.4. Ampliseq analysis of the total transcriptome
The transcriptome of freshly isolated mast cells and the different cultures were analyzed for their total transcriptome by the Thermo-Fisher chip based Ampliseq transcriptomic platform at the SciLife lab in Uppsala, Sweden (Ion-Torrent next-generation sequencing system- Thermofisher.com). The sequence results were delivered in the form of Excel files with normalized expression levels for an easy comparison between samples. In the Ampliseq analysis all transcripts are read only once; this is why no normalization is needed.
2.5. Validations and RT-qPCR
For the first approach, cultured skin MCs were stimulated with an anti-FcεRI-Ab, AER-37 (0.5 µg/ml)(Abcam, Cambridge, UK), for 30 min, 90 min, and 24 h and compared to cultured unstimulated skin MCs. In the second approach, skin MCs were harvested 1 and 2 d after isolation, as well as after 3 weeks of cultivation. For the final part, cultured skin MCs were exposed to enzymes identically to what is used for skin MC isolation (2.29 mg/ml collagenase, 0.75 mg/ml hyaluronidase, DNase I at 10 µg/ml, and 5 mM MgSO4) and kept at 37° C with or without shaking prior to harvest. RNA was extracted with the NucleoSpin RNA kit (MACHEREY-NAGEL, Düren, Germany) and reverse transcribed with TaqMan Reverse Transcription reagent (applied biosystems, California, USA) according to the manufacturer’s recommendations. Quantitative PCR was performed with the LightCycler® FastStart DNA Master SYBR Green I reaction mix (Roche Diagnostics, Mannheim, Germany) in QIAquant 96 5plex real-time PCR cycler (Qiagen, Hilden, Germany). The primers for target genes were designed with NCBI primer blast software, and synthesized by TIB Molbiol, Berlin, Germany. The 2−ΔΔCT method was used to quantify the relative expression levels of target genes to several reference genes (appearing at the end of the table, i.e., β-actin, GAPDH, HPRT, and Cyclophilin B = Peptidylprolyl Isomerase B, gene name PPIB), as described [39,40]. Statistical analysis and visualization were performed with GraphPad Prism software (La Jolla, CA, USA, version 10.0.3.)

Table 2.
Primer sequences for primers used in the quantitative PCR analysis described above.
| Gene | Forward Primer (5′->3′) | Reverse Primer (5′->3′) |
| FOS | AGTGACCGTGGGAATGAAGT | GCTTCAACAGACTACGAG |
| FOSB | CTACGGAGCCTGCACTTTCA | AGCGAGTCCTCAAAGTACGC |
| HSPA1A | AGCTGGAGCAGGTGTGTAAC | CAGCAATCTTGGAAAGGCCC |
| HSPA1B | TGTAACCCCATCATCAGCGG | TCCCAACAGTCCACCTCAAAG |
| ACTB | CTGGAACGGTGAAGGTGACA | AAGGGACTTCCTGTAACAATGCA |
| GAPDH | ACATCGCTCAGACACCATG | TGTAGTTGAGGTCAATGAAGGG |
| HPRT | GCCTCCCATCTCCTTCATCA | CCTGGCGTCGTGATTAGTGA |
| PPIB | AAGATGTCCCTGTGCCCTAC | ATGGCAAGCATGTGGTGTTT |
3. Results
3.1. Samples used for analysis
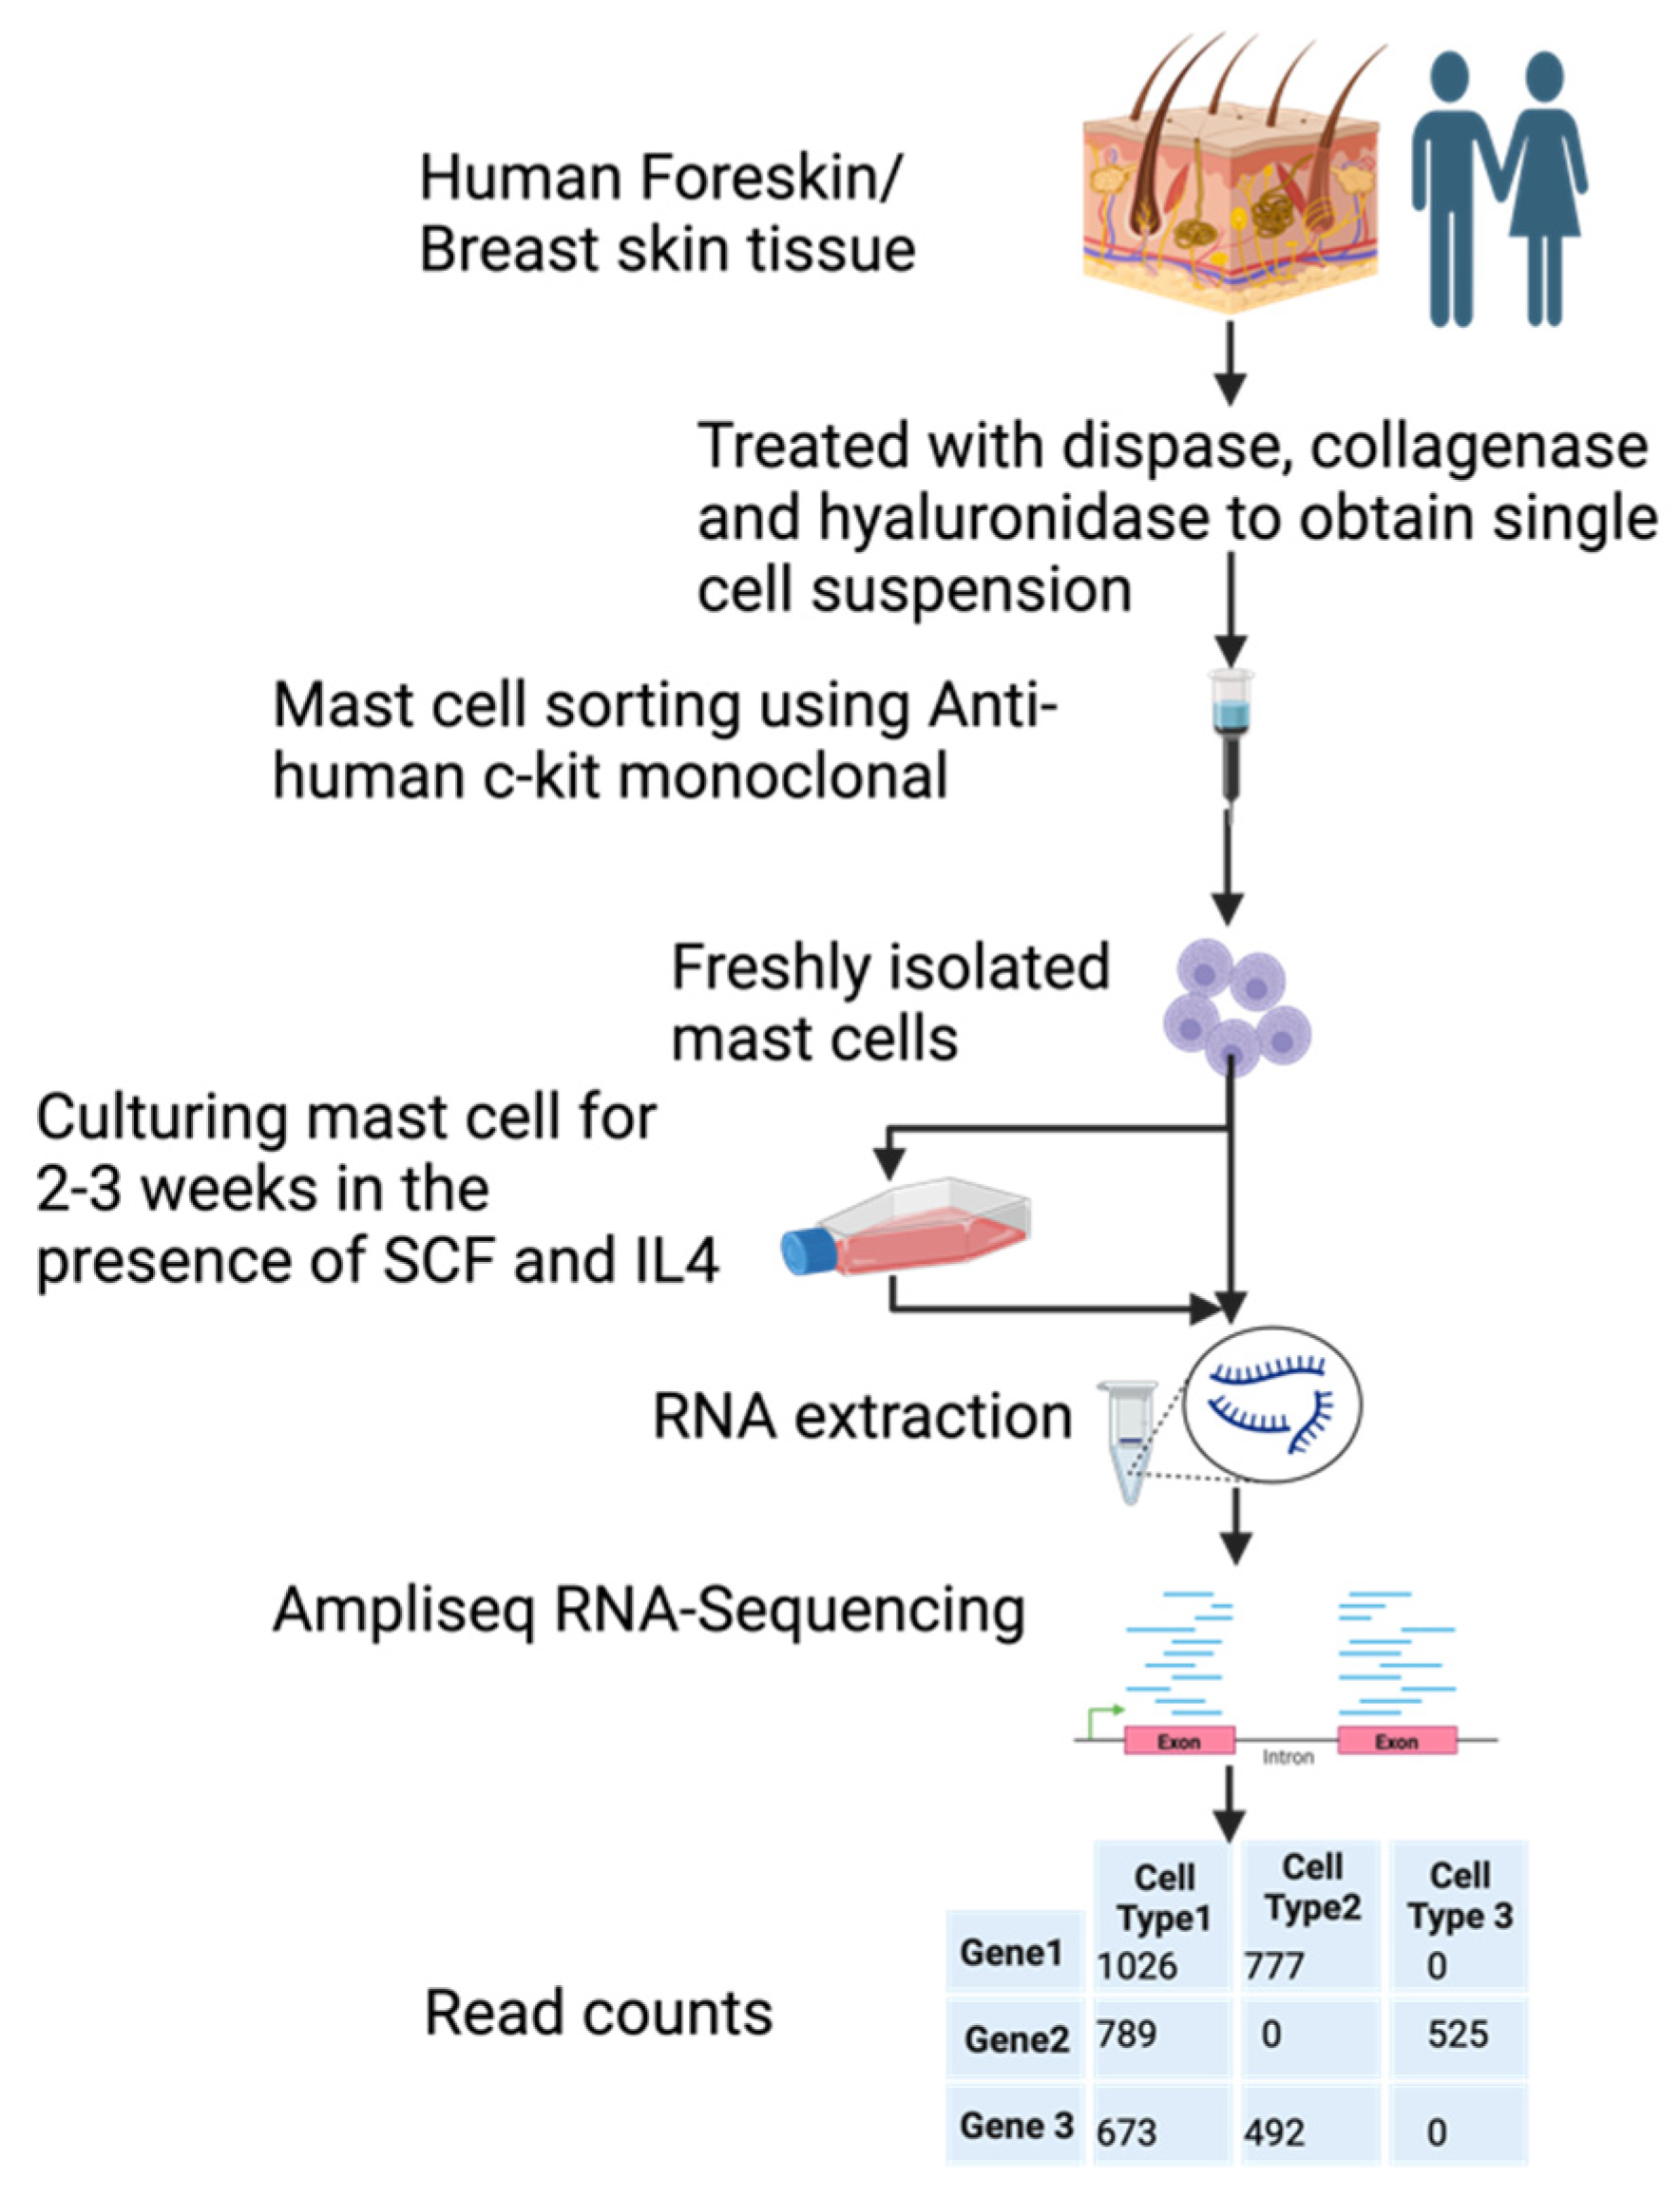
Samples of human foreskin and breast skin were, after surgery, collected and digested with dispase and collagenase to obtain a single cell suspension. These cells were then subjected to purification by magnetic cell sorting using a non-activating anti-kit antibody. Approximately 98% pure MCs were obtained by this procedure for analysis of their entire transcriptome, before and after in vitro culturing for 2-3 weeks. The in vitro culture was performed in a serum containing medium, to which recombinant human stem cell factor (SCF) and interleukin-4 (IL-4) had been added. The aim of cultures was to obtain more cells for in vitro studies of MC biology. The number of MCs increased about 6-10-fold, by a three-week culture [38].
For the freshly isolated MCs we analyzed three independent samples, all isolated from foreskin (three separate donor pools, 12, 7, 6 for the three fresh and for the cultured 5-15). For the in vitro expanded cells, we had four cultures in total, two originating from foreskin (cultured for 20 and 17 days), and two from breast skin, cultured for 18 and 19 days, respectively. These seven samples were analyzed by the Ampliseq technology to obtain a quantitative map of the expression levels of all approximately 21,000 human genes.
By analyzing the expression of one non-coding RNA involved in X chromosome inactivation, XIST, we confirmed the origin of the seven samples in this analysis. Two of the three freshly isolated samples and the two originating from cultured foreskin MCs were clearly negative for this transcript showing that they were of male origin. The two samples from breast skin showed high levels of expression of this gene confirming their female origin (Table 3). Interestingly, one of the freshly isolated samples had a low level of this transcript indicating a mixed phenotype (Table 3). However, there are also reports of XIST expression in male cells [41]. We here also included a male specific gene, the RPS4Y1, which is expressed from the Y chromosome and therefore cannot be expressed by female cells. This gene was expressed at relatively low levels in all three freshly isolated samples and in the two foreskin samples, but not in the two breast samples, confirming the male origin of the five foreskin samples (Table 3).
Figure 1.
A schematic presentation of the experiment.
3.2. Transcript levels for the major granule-stored proteases and other proteases
We first analyzed the granule proteases, as they are in general highly and uniquely expressed by MCs. This is why they are good markers of MC identity and phenotype. Three serine proteases and a carboxypeptidase constitute the major granule proteins of human MCs. Their transcript levels were very high and largely stable during a period of three weeks of in vitro culture, with the exeption of chymase, CMA1, which was reduced by approximately 50% (Table 4).
The most highly expressed protease was cathepsin G (CATG), a neutrophil and mast cell expressed protease with approximately 10000 reads, followed by beta-tryptase (TPSB2) with 7000 reads, carboxypeptidase A3 (CPA3) with 4000 reads and chymase (CMA1) with 2000 reads (Table 4). The expression of most other hematopoietic serine proteases was very low or absent in these cells, except for the delta- and gamma-tryptases (TPSD1 and TPSG1) and the carboxypeptidase M (CPM), all with an average of 220 reads or lower (Table 4). A minor increase in cathepsin C (CTSC), from approximately 30 to approximately 75 reads was observed after culture (Table 4). This enzyme is involved in N-terminal cleavage and activation of the majority of granule proteases [42]. An approximately 10-fold upregulation, from an average of 20 to 200 reads, was also observed for another endoplasmic reticulum or Golgi located protease, cathepsin W (CTSW), which is expressed by NK cells and cytotoxic T cells (Table 4) [43]. We did not detect expression of any of the T cell granzymes, except for a low level of granzyme B (GZMB) in two of the in vitro cultures, with 2 and 11 reads, respectively (Table 4). No transcripts were detected for any of the neutrophil proteases (except cathepsin G as described above), including N-elastase, proteinase-3, or neutrophil proteases 4 (NSP-4), and no expression of myeloperoxidase and lactoferrin, which, except for NSP-4, are all found in relatively high amounts in mature neutrophils. Likewise, we did not find expression of any of the classical eosinophil markers, ECP, EDN and EPO.
Only very minor differences in expression between freshly isolated and cultured MCs were observed for the lysosomal proteases cathepsin B, D and L1 (CTSB, CTSD and CTSL1) (Table 4). In contrast, a marked upregulation was observed for two tissue metalloproteases, ADAMTS7 and ADAM14, from very low levels with a few reads in fresh cells, to 100-150 reads in cultured cells (Table 4).
3.3. Transcript levels for protease inhibitors.
Protease inhibitors are important to control the effects of the massive amounts of proteases stored in MCs and other immune cells. We could observe some changes in the pattern of protease inhibitors after in vitro culture of skin MCs. While no major change was seen for TIMP1, TIMP3 and cystatin 3 (CST3), a steep upregulation of cystatin 7 (CST7) and serpin B1 (SERPINB1) and a major downregulation of serpins E1 (SERPINE1) and H1 (SERPINH1) was observed (Table 5).
3.4. Transcript levels for Fc receptors and other cell surface receptors.
All three chains making up the high-affinity IgE receptor FcεRI (i.e., FCERIA, MS4A2 and FCERIG) were upregulated two- to five-fold in culture. In contrast, a relatively strong, 10-fold, downregulation of FCGR2A was observed (Table 6). Interestingly, FCGR2A was the only Fc receptor, in addition to the high affinity IgE receptor, expressed by these skin MCs. All other Fc receptors were essentially negative including FCER2, FCGR1A, FCGR2B, FCGR2C, FCGR3A and FCGR3B (Table 6). This is of major importance in view of the numerous reports in the literature of Fc receptor expression on MCs. We can here show that these human MCs essentially only express two Fc receptors, the high affinity IgE receptor and one of the low affinity receptors for IgG, the FCGR2A.
There was a marked upregulation of the inhibitory receptor CD200R1 and a minor upregulation of the inhibitory receptors CD300A and MILR1, also called Allergin 1; however, in all three cases from relatively low starting levels to levels between 100 and 200 reads (Table 6).
3.5. Transcript levels for MRGPRX2, purinergic, cannabinoid and anti-Mullerian hormone receptors.
For the majority of these receptors, including MRGPRX2, the ATP receptor P2RX1, the endothelin receptor B (EDNRB), and several other receptors we could not detect any changes in transcript levels upon in vitro culture. They showed very stable expression with only small variations as shown in Table 7. We observed a minor increase in the cannabinoid receptor CNR2 and in the ATP/ADP receptor P2RX6. However, for the ATP/ADP receptor P2RY1 we could see a marked upregulation, although from very low starting values (Table 7).
3.6. Transcript levels for growth factor receptors.
No major changes in transcript levels were observed for the majority of receptors for cytokines and other growth and differentiation factors, including the stem cell factor receptor (KIT), the erythropoietin receptor (EPOR), the colony stimulating factor receptors CSF2RA and CSF2RB, the IL-33 receptor (IL1RL1), and others. However, for a few receptors including the IL-9 receptor (IL9R), we observed an upregulation from an average of 5 reads to 100-150 reads (Table 8). A marked downregulation of the lymphotoxin B receptor (LTBR), and several members of the TNF receptor family, including TNFRSF9 and TNFRSF21, was also observed (Table 8). Interestingly relatively low levels of expression were seen for the majority of these receptors rarely over 100-200 reads, except for KIT that was in the range of 1300-1400 reads in cultured MCs (Table 8).
3.7. Transcript levels for MHC class I and class II genes
No major change in expression was seen for the MHC class I genes, HLA-A, HLA-B and HLA-C (Table 9). However, for the MHC class II genes we detected a marked downregulation upon in vitro culture. The levels of MHC class II in freshly isolated cells were, however, very low compared to monocytes, as discussed previously [5]. Monocytes have been analyzed previously and their MHC class II expression levels were in the range of several thousand reads [45]. In the present study, the most highly expressed class II gene was HLA-DRB1, which in one MC preparation reached 146 reads (Table 9). Upon in vitro culture, the expression of the different class II genes was reduced to almost undetectable levels (Table 9). The transcription factor regulating class II expression, the CIITA, was also very lowly expressed and was after in vitro culture reduced down to almost zero transcripts (Table 9).
3.8. Transcript levels for enzymes involved in proteoglycan, histamine, prostaglandin and leukotriene synthesis
No major change in the expression in the enzymes involved in proteoglycan synthesis was observed (Supplementary Table S1). In contrast several enzymes involved in histamine prostaglandin and leukotriene synthesis were upregulated upon culture including a minor (two-fold) upregulation of the histidine decarboxylase (HDC) from approximately 800 to 2000 reads, and a 3-4-fold upregulation of the prostaglandin synthesis enzyme HPGDS from 600 to 2500 reads, and an almost 10-fold upregulation of the leukotriene synthesis enzyme leukotriene C4 synthase, LTC4S from approximately 100 to 1000 reads (Table 10). No change in the expression of histamine receptor 4 (HRH4) expression was seen upon culture (Table 10). Interestingly, the only enzyme that showed a major downregulation was the phospholipase A2 -G2A (PLA2G2A) that is involved in the release of arachidonic acid from membrane phospholipids, generating the precursor of both prostaglandins and leukotrienes. However, PLA2G2A is a secreted form of phospholipase A2 and probably of minor importance for the intracellular levels of arachidonic acid, and its role in MCs biology is less well known. High levels of annexin 1 (ANXA1) mRNA were detected in these cells, with approximately 5000 reads in freshly isolated cells and a minor reduction to around 2000 reads in cultured cells (Table 10). Annexin 1 is a phospholipid binding protein also named lipocortin I, which acts as a negative regulator of phospholipase 2 and can thereby inhibit eicosanoid production and suppress inflammation [46]. A minor upregulation from approximately 700 reads to 1800 reads was seen for long-chain-fatty-acid-CoA ligase 4 (ACSL4), an enzyme with a role in lipid metabolism with preference for arachidonic acid [47]. A minor upregulation was also seen for the prostaglandin E receptor 3 (PTGER3). It is a receptor with preference for prostaglandin E2, which typically increases FcεRI-dependent allergic responses in contrast to PTGER2 and PTGER4 [48]. We found no or very minor changes upon culture in the expression of PTGER2 and PTGER4 (Table 10).
3.9. Transcript levels for cell adhesion molecules
Several minor and a few major changes in the expression of cell adhesion molecules were observed, while the majority was relatively stable. The most pronounced upregulation was seen for integrin alpha 2B (ITGA2B) which went from a few reads to around 500 reads. A marked upregulation was also observed for CECAM 1 from around 10 reads to close to 300 reads (Table 11). A decrease in expression was instead seen for integrins alpha 5 and 9 (ITGA5 and ITGA9) which went from approximately 150-250 to around 25 reads (Table 11). An almost 10-fold decrease was also observed for L1CAM going from around 250 reads to between 20 and 50 reads after three weeks in culture (Table 11). L1CAM has important functions in the development of the nervous system, where it engages in cell-matrix and cell-cell-interactions, e.g., by binding to integrins such as alpha Vβ3; its potential significance in MCs has been recently discussed [49].
3.10. Transcript levels for transcription factors
The MC-related transcription factors GATA1, GATA2, MITF and HEY1 showed no or very modest changes in expression upon culture, in agreement with most other transcription factors analyzed (Table 12). No changes in transcript levels were also seen for two more general transcription factors that have been shown to be of major importance for skin MC maintenance and for regulating GATA2 the evolutionary ancient CREB1 [39] and STAT5 [50,51], respectively (Table 12). However, we found examples of quite dramatic changes, and that was primarily in a few zinc finger and leucine zipper genes including KLF2, KLF4, TSC22D3 and ZFP36. These genes were highly expressed in the freshly isolated cells and strongly down regulated in culture (Table 12). KLF2 has a major role in erythroid and lung development [52]. However, its expression is most pronounced in lymphocytes [53]. KLF4 is highly expressed in non-dividing cells and downregulated upon induction of cell division, thereby matching our data. Over-expression of KLF4 induces growth arrest [54]. ZFP36 is involved in mRNA stability and binds to AU rich elements in 3´ends of mRNAs to increase their degradation, primarily of cytokine transcripts [55]. Its expression is very high in non-dividing myelocytes like granulocytes, monocytes as well as MCs [53]. TSC22D3 may have a role in regulating anti-inflammatory and immunosuppressive effects of IL-10 and corticosteroids [56]. Like KLF2, its expression is strongly enriched in lymphocytes [53]. Except for KLF4, the reason for the dramatic downregulation of these zinc finger and leucine zipper genes during transition from resting to actively dividing cells is not known, but this finding is consistent with what was previously reported for breast skin MCs [5].
3.11. Transcript levels for growth-related genes
Most of the growth-related genes were highly upregulated in culture, as indicated in the previous section where the growth arrest inducing zinc finger gene KLF4 was highly expressed in freshly isolated cells but almost totally absent from cells after in vitro culture (Table 12 and Table 13). Cell growth is apparently induced in culture and genes associated with the cell cycle are consequently increased in expression from low levels of a few reads to several hundred reads (Table 13). We observed potent upregulation of the histones H3 needed for new DNA assembly, the cell cycle regulated ribonucleotide reductase (RRM2), the topoisomerase 2A (TOP2A), the cyclin dependent kinase (CDK1), a key player in cell cycle regulation, and of the MKI67, a well-known marker for cell proliferation and ribosomal RNA synthesis (Ki-67) (Table 13) [57].
3.12. Transcript levels for cytokine and growth factor genes
Most of the cytokines, chemokines and other growth factor related genes showed minor changes in expression. However, major changes were detected in a few entities. VEGFA, PDGFA, and IL-13 all showed a marked downregulation in expression upon in vitro culture, and this also applied to some degree to CSF1 (M-CSF) (Table 14). Both VEGFA and PDGFA dropped in expression by almost 100-fold, VEGFA from approximately 2000 reads to 20 reads and PDGFA from around 350 to 7 reads (Table 14). There were also examples of the opposite, such as GM-CSF (CSF2), which showed a 10-100-fold increase, to levels in the range of 300-800 reads, and IL-7 which increased 10-times, but from very low initial levels (Table 14).
3.13. Transcript levels for several cluster of differentiation (CD) cell surface expressed proteins
Most of the CD molecules, including CD4, CD9 and CD14 showed relatively minor changes in expression upon in vitro expansion (Table 15). However we found a few CD molecules showing more pronounced changes. These included CD63, which was increased by approximately 4-fold from around 300 reads to 1200 reads, CD274, also named PD-L1, which was decreased by approximately 10-fold from around 130 reads to 15 reads, and CD52, a 12 amino acid GPI-anchored peptide that may have an antiadhesive effect due to its high negative charge, which was increased by almost 40 times from around 20 reads to 800 reads (Table 15).
3.14. Transcript levels for circadian clock related genes
Most of the circadian clock genes show minor changes in expression, however, with some interesting exceptions. PER1 dropped in expression quite dramatically from almost 2000 to around 20 reads and TIMELESS increased by almost 50 times from very low levels around 2 reads to almost 100 reads (Table 16).
3.15. Transcript levels for other proteins of potential interest
The expression levels of an extended list of genes of potential interest for the function of MCs can be found in Supplementary Tables S1-S11. In these tables we list enzymes involved in proteoglycan synthesis, solute carriers, lipid transporters, calcium, sodium, and potassium channels, other cell surface proteins, Siglecs, olfactory receptors, other receptors, cell signaling components, other enzymes, proteins related to vesicle transport, cytoskeletal and nuclear proteins, extracellular matrix proteins, oncogenes, and proteins of unknown function (Supplementary Tables S1-S11).
3.16. Transcript levels for heat shock proteins (HSPs) and immediate early genes (IEGs)
A number of heat shock proteins and a few immediate early response genes including FOS, FOSB and JUNB were highly expressed in the freshly isolated cells, some being the most highly expressed genes in these cells. These genes included the heat shock proteins HSPA1A, HSPA1B, HISPA6 and HSP90AB1, where HSPA1A reached over 75000 reads, and FOSB, which had over 14000 reads in one sample but was low in cultured cells (Table 17).
To understand whether the high expression of HSPs and IEGs in ex vivo MCs was an inherent property of the cells (that was lost in the conditions of the culture) or whether it was a stress response of the cells due to the isolation process, we performed two types of experiments.
Firstly, we made use of the fact that stimulation of cultured skin MCs, e.g., by SCF or FcεRI-aggregation, can induce a potent but transient IEG expression [10,39,40]. Here, we explored the kinetics of IEG and HSP expression following FcεRI-aggregation. Indeed, expression of the two IEGs, FOS and FOSB, was induced and peaked after 30 min, but diminished already after 90 min and was down to baseline after 24 h (Figure 2A). While IEGs are well-known to be regulated by various stimuli, requiring CREB activity as an intermediary in skin MCs [39], it was unknown whether this also applies to HSPs. As displayed in Figure 2A, there was only marginal upregulation of HSPA1A and HSPA1B at 90 min (by ≈3-fold). Therefore, HSPs showed a distinct pattern of regulation vis-à-vis IEGs.
We then examined whether freshly extracted skin MCs rapidly downregulated IEGs and HSPs, which could suggest that the expression was primarily resulting from (unspecific) activation during isolation. The assumption was that if expression was the result of the isolation procedure (rather than a feature of the physiologic MCs), expression would be at the level of cultured MCs after 1 day at the latest. However, this was not the case. As displayed in Figure 2B, the expression of HSP and IEG was still between ≈25 and ≈80-fold higher after 1 day versus in 3-week-cultured MCs. Significantly higher IEG expression was also detected after 2 days. The time-course, showing a drop in gene expression after 2 days versus 1 day, suggested that a subpopulation was gradually lost in culture. In fact, 25-30% of skin MCs were lost during the first day, suggesting that their survival requires the skin microenvironment. Alternatively, MCs may actively downregulate expression of these genes in the new micromilieu.
In another series of experiment, cultured MCs were exposed to the conditions applied during isolation (i.e., digestive enzymes with or without shaking in a water bath). Compellingly, there was likewise no efficient induction of either IEGs or HSPs by incubation with collagenase/hyaluronidase/DNAse with or without shaking, establishing that the conditions MCs endure during isolation do not bring about the high expression found in ex vivo MCs. FOSB was a slight exception, but even after treatment with enzymes, its transcript abundance was at only 0.1-0.2% of the freshly extracted MCs, not explaining the high abundance in the latter.
4. Discussion
A detailed analysis of the total transcriptome of freshly isolated and cultured human MCs was performed to validate the quality of the in vitro expanded MCs concerning their potential use as models of human MC biology. The cultured cells were found to be remarkably stable in their transcriptome compared to what has been observed for mouse BMMCs (Table 1) [26]. Mouse BMMCs represent a very immature version of mouse MCs where the expression levels of several important MC markers are very low compared to freshly isolated mouse peritoneal MCs, including the granule stored chymase, Mcpt4 (mMCP-4), the tryptase Mcpt6 (mMCP-6) and the drug/neuropeptide receptor Mrgprb2 (Table 1) [26]. One additional important difference between these two model systems for studies of MC biology is that they represent cells of very different developmental origin. The mouse BMMCs originate from adult bone marrow whereas the majority of human skin MCs have their origin primarily in an early wave of cells from the yolk sac [28,27]. A recent study of MCs from different mouse organs has shown that, also in the mouse, the organ of origin is a decisive factor for the resulting MC phenotype even though cells from different sources were exposed to identical microenvironments during their recent history [58].
The MCs used herein are human, which makes them better models of human biology than mouse MCs of any origin. The presented data harmonizes with a previous analysis of skin MCs using another technology for transcriptome analysis namely deep-CAGE sequencing [5]. We have here expanded this analysis including additional samples and another sequencing technology to verify the findings, and, most importantly to extend to foreskin MCs, which had not been analyzed previously. Concerning granzymes, we did not detect expression of any of the granzymes under steady state conditions. However, some of them may be induced by LPS or IgE receptor crosslinking, as has been observed for GZMB, which was found to be highly inducible following FcεRI-aggregation in human skin MCs in the Motakis study [5]. A 5-fold increase in GZMB levels was also seen in mouse BMMCs upon LPS stimulation [1]. Mouse GZMC was actually also upregulated from 0.1 reads to 100 reads, which corresponds to a 1000-fold increase but from very low starting levels [1]. However, during normal steady state conditions, granzymes seem to be almost totally absent from both mouse and human MCs.
In this study, the multiagonist receptor MRGPRX2 remained largely stable, although a slightly lower expression was detected in cultured MCs. This was in contrast to previous studies, demonstrating a prominent downregulation of this receptor at transcript, protein, and functional level in cultured MCs [5,59]. Even so, skin MCs still retain decent levels of MRGPRX2 in culture and can be used for MRGPRX2-related research, as substantiated by the findings herein. This is in marked contrast to mouse BMMCs that almost totally lack expression of the corresponding mouse receptor Mrgprb2 (Table 1). Expression of the dopamine receptor DRD2was also observed in this dataset at similar expression levels as in previous studies [49].
Skin is a heterogeneous organ with different micromilieus prevailing in distinct locations. Here we analyzed the transcriptome in MCs derived from both foreskin and breast skin. We previously compared these two skin MC subsets by low-throughput techniques and found that differences were rather small [60]. For example, breast skin MCs displayed slightly higher tryptase activity, but lower histamine and chymase activity, however, with huge variations within groups [60]. The very minor differences observed here, in global gene expression, between female and male samples further confirmed this concept. These findings suggest that despite their different sources (female, adult versus male, juvenile), major characteristics of skin MCs are surprisingly stable and are not strongly influenced by age, sex or the precise location.
Concerning the cultured human skin MCs, one additional factor is the total number of cells. Upon in vitro culture, the cells start to proliferate and we found that the expression of genes related to cell growth were increased (Table 13). After three weeks of culturing the number of cells had increased by 6-10 times resulting in more cells available for experiments. However, it is advantageous to use ex vivo skin MCs at least in a few experiments, to verify findings obtained with the precultured counterparts. The notion that expanded cells will resemble their respective prototype cell in the original tissue, even after culture, was recently reported also for mouse fetal skin or fetal liver derived MCs [58]. However, our findings demonstrate a number of slightly unusual features that should be taken into consideration when using the in vitro expanded human skin MCs in studies of MC biology (Figure 4 and Figure 5). Notably, the expression of the three genes for the high affinity IgE receptor was increased by 2-5 times and there was an almost 10-fold reduction in the transcript level for the low affinity IgG receptor FCGR2A. Moreover, there was an almost 10-fold upregulation of the leukotriene synthesis enzyme, leukotriene C4 synthase (LTC4S) (Figure 5). The demonstrated upregulation of high affinity IgE receptor subunits and the leukotriene synthesis enzymes is harmonizing with previous studies, and is most likely explained by an induced response to the added SCF and IL-4 in the culture medium [18,38,59,61]. There were also changes in cell adhesion molecules with a shift from integrin alpha 5 and 9 to beta 2A (Table 11). We found no or very minor changes in the enzymes involved in proteoglycan synthesis but a clear upregulation of some enzymes involved in leukotriene and prostaglandin synthesis (Table 10). In spite of these changes, the in vitro expanded human skin MCs seem to be a very interesting model for studies of human MC biology. We can also say from this study that there are no or very minor differences between cells isolated from men or females. The only major sex-related differences we found were in the non-coding transcript XIST for X chromosome inactivation, which was found essentially only in the two female samples, and in the male specific gene RPS4Y1, which is expressed from the Y chromosome (Table 3). XIST acts to cover one copy of the X chromosome, rendering it inactive [62].
For future studies, including design and evaluation of novel treatment strategies based on targeting MCs there are some findings that need to be taken into serious consideration. One example is the very limited complexity in Fc receptor expression in human skin MCs. Attempts are made to use antibodies against the inhibitory IgG receptor FCGR2B for downregulating MC activation through the high affinity IgE receptor. The possibility of inhibiting MC activation by FCGR2B crosslinking is probably very limited in view of the almost total absence of the transcripts for this receptor both in freshly isolated and cultured skin MCs (Table 6). However, this does not exclude that FCGR2B can be induced in skin MCs under disease conditions or that FCGR2B is expressed by human MCs in other tissues. Moreover, we did not detect expression of any of the granzymes, which is in contrast to published work. Here we found that the levels of all five granzymes in the freshly isolated MCs were very low, close to zero, indicating that granzymes have no or only a very limited role in human MC biology unless cells are stimulated.
High expression of selective IEGs and HSPs was a hallmark of ex vivo MCs, while this quality was lost in culture, as reported previously [53]. Since high expression of IEGs was likewise detected in monocytes, basophils, neutrophils, and other cells [53], we hypothesized that this was an inherent property of fully mature leukocytes, also encompassing ex vivo MCs, to be gradually lost outside of the body. Alternatively, it could have resulted from the isolation process as such.
Using several strategies, we found that the first hypothesis was most likely correct accounting for most of the effect. Firstly, we showed that mimicking the steps of isolation did not lead to a general upregulation of HSPs and IEGs in cultured MCs (only to a 20-fold increase in one gene), while expression in cultured versus ex vivo cells was > 10,000-fold lower (by RT-qPCR; up to ≈1,000-fold by sequencing). This is in accordance with findings in the mouse where exposure of peritoneal MCs to digestive enzymes led to a maximally 5-fold difference in a limited number of genes [63]. Interestingly, several IEGs were found among the regulated genes in this mouse study and FOSB was third in their list, in line with what we found here for FOSB (but not for FOS). However, this moderate increase can by no means explain the differences between ex vivo and cultured MCs, but it does indicate that a slight modulation during purification can occur in a gene-dependent manner. This upregulation is most likely transient, though. In fact, FOSB was down more strongly after 1 and 2 d compared to FOS (the latter not enhanced by digestive enzymes/shaking).
Additional evidence for an inherently high expression of HSPs and IEGs in skin MCs came from the fact that expression following MC purification did not diminish as rapidly as expression induced by MC stimulation. Indeed, the levels in ex vivo MCs were still increased at 1 or even 2 d vis-à-vis cultured MCs. In contrast, when IEGs were induced by FcεRI-aggregation, levels were back to their initial values after 1 d or less.
Our data are in line with the comprehensive FANTOM5 atlas. For example, granulocytes and monocytes expressed very high levels of certain IEGs, including FOS and JUNB. Both of the HSPs uncovered as high in skin MCs were expressed also in brain regions and reproductive organs (which were not exposed to digestive enzymes). Moreover, only some HSPs were highly expressed in skin MCs, while others were not; and the same applied to IEGs. Therefore, these genes are not expressed across the board in ex vivo cells/tissues, but in clearly defined, cell- and tissue-specific patterns. For example, monocytes expressed substantial FOS but only little FOSB, while FOSB reached similar levels as in skin MCs also in basophils, eosinophils, Langerhans cells, and CD8+ cells [53]. Expression of HSPA1A/B was pronounced in newborn brain, adult reproductive tissues (breast, vagina), heart, aorta, and adipocytes (in addition to influenza-infected macrophages). It is not entirely clear why primary cells accumulate such high levels of these transcripts. However, abundant expression seems to extend to the protein level in MCs and monocytes, whereby FOS (transcript and protein) abundance in primary monocytes was particularly striking [25]. In that paper, we compared expression in primary myelocytes with corresponding cell lines (THP-1, HMC-1) detecting much higher levels in primary cells, while reduction was a hallmark of actively cycling cells [25]. This was confirmed herein and extended to HSPs in MCs (yet not monocytes), emphasizing that each ex vivo cell expresses a unique combination of IEGs/HSPs. Regarding FOS specifically, it is described as indispensable in monocyte differentiation, increasing during maturation [64]. We assume FOS and other factors play similar roles in MCs in vivo where they maintain the fully differentiated state and long-term survival within the cutaneous environment. In this regard, certain IEGs, HSPs, and several TFs like KLF2 and KLF4 (all much higher in freshly extracted MCs) may all be part of the same program.
In summary, this study provide a detailed transcriptomic characterization of in vivo matured human skin MCs in comparison with their in vitro-expanded counterparts. The findings confirm and extend our understanding of the phenotype of skin MCs in their normal tissue environment. Such information is also essential for design and evaluation of novel potential treatment strategies aimed at targeting MCs in vivo. Based on previous and current findings, in vitro expanded human skin MCs seem to be one of the best alternatives presently available for in vitro studies of the general in vivo function of human skin MCs. However, it should be noted that the large amounts of human skin needed to obtain sufficient number of freshly isolated MCs is still an obstacle for a wider use of this model.
Supplementary Materials
The following supporting information can be downloaded at the website of this paper posted on Preprints.org.
Acknowledgments
The study was supported by grants from Konsul Berghs Stiftelse (Srinivas Akula), Knut and Alice Wallenberg Foundation (KAW 2017-0022) (Lars Hellman and Sara Wernersson) and the Deutsche Forschungsgemeinschaft DFG (BA-3769/3, BA-3769/4) (Magda Babina).
Abbreviations
MCs, mast cells; BMMCs, bone marrow derived mast cells; CPA3 carboxypeptidase A3
References
- Akula, S., et al., Quantitative In-Depth Analysis of the Mouse Mast Cell Transcriptome Reveals Organ-Specific Mast Cell Heterogeneity. Cells, 2020. 9(1). [CrossRef]
- Schwartz, L.B., et al., Quantitation of histamine, tryptase, and chymase in dispersed human T and TC mast cells. J Immunol, 1987. 138(8): p. 2611-5. [CrossRef]
- Lutzelschwab, C., et al., Secretory granule proteases in rat mast cells. Cloning of 10 different serine proteases and a carboxypeptidase A from various rat mast cell populations. J Exp Med, 1997. 185(1): p. 13-29. [CrossRef]
- Tatemoto, K., et al., Immunoglobulin E-independent activation of mast cell is mediated by Mrg receptors. Biochem Biophys Res Commun, 2006. 349(4): p. 1322-8. [CrossRef]
- Motakis, E., et al., Redefinition of the human mast cell transcriptome by deep-CAGE sequencing. Blood, 2014. 123(17): p. e58-67. [CrossRef]
- McNeil, B.D., et al., Identification of a mast-cell-specific receptor crucial for pseudo-allergic drug reactions. Nature, 2015. 519(7542): p. 237-41. [CrossRef]
- Valent, P., et al., Induction of differentiation of human mast cells from bone marrow and peripheral blood mononuclear cells by recombinant human stem cell factor/kit-ligand in long-term culture. Blood, 1992. 80(9): p. 2237-45. [CrossRef]
- Irani, A.M., et al., Recombinant human stem cell factor stimulates differentiation of mast cells from dispersed human fetal liver cells. Blood, 1992. 80(12): p. 3009-21. [CrossRef]
- Mitsui, H., et al., Development of human mast cells from umbilical cord blood cells by recombinant human and murine c-kit ligand. Proc Natl Acad Sci U S A, 1993. 90(2): p. 735-9. [CrossRef]
- Franke, K., et al., The SCF/KIT axis in human mast cells: Capicua acts as potent KIT repressor and ERK predominates PI3K. Allergy, 2022. 77(11): p. 3337-3349. [CrossRef]
- Okayama, Y. and T. Kawakami, Development, migration, and survival of mast cells. Immunol Res, 2006. 34(2): p. 97-115. [CrossRef]
- Cruse, G., D.D. Metcalfe, and A. Olivera, Functional deregulation of KIT: link to mast cell proliferative diseases and other neoplasms. Immunol Allergy Clin North Am, 2014. 34(2): p. 219-37. [CrossRef]
- Toru, H., et al., Interleukin-4 promotes the development of tryptase and chymase double-positive human mast cells accompanied by cell maturation. Blood, 1998. 91(1): p. 187-95. [CrossRef]
- Bischoff, S.C., et al., IL-4 enhances proliferation and mediator release in mature human mast cells. Proc Natl Acad Sci U S A, 1999. 96(14): p. 8080-5. [CrossRef]
- Thienemann, F., B.M. Henz, and M. Babina, Regulation of mast cell characteristics by cytokines: divergent effects of interleukin-4 on immature mast cell lines versus mature human skin mast cells. Arch Dermatol Res, 2004. 296(3): p. 134-8. [CrossRef]
- Kulka, M. and D.D. Metcalfe, High-resolution tracking of cell division demonstrates differential effects of TH1 and TH2 cytokines on SCF-dependent human mast cell production in vitro: correlation with apoptosis and Kit expression. Blood, 2005. 105(2): p. 592-9. [CrossRef]
- Guhl, S., et al., Long-term cultured human skin mast cells are suitable for pharmacological studies of anti-allergic drugs due to high responsiveness to FcepsilonRI cross-linking. Biosci Biotechnol Biochem, 2011. 75(2): p. 382-4. [CrossRef]
- Babina, M., et al., IL-4 and human skin mast cells revisited: reinforcement of a pro-allergic phenotype upon prolonged exposure. Arch Dermatol Res, 2016. 308(9): p. 665-670. [CrossRef]
- Allakhverdi, Z., et al., Cutting edge: The ST2 ligand IL-33 potently activates and drives maturation of human mast cells. J Immunol, 2007. 179(4): p. 2051-4. [CrossRef]
- Iikura, M., et al., IL-33 can promote survival, adhesion and cytokine production in human mast cells. Lab Invest, 2007. 87(10): p. 971-8. [CrossRef]
- Babina, M., et al., Yin-Yang of IL-33 in Human Skin Mast Cells: Reduced Degranulation, but Augmented Histamine Synthesis through p38 Activation. J Invest Dermatol, 2019. 139(7): p. 1516-1525 e3. [CrossRef]
- Wang, Z., et al., IL-33 and MRGPRX2-Triggered Activation of Human Skin Mast Cells-Elimination of Receptor Expression on Chronic Exposure, but Reinforced Degranulation on Acute Priming. Cells, 2019. 8(4). [CrossRef]
- Kitamura, Y., et al., Effect of MITF on mast cell differentiation. Mol Immunol, 2002. 38(16-18): p. 1173-6. [CrossRef]
- Ohneda, K., S. Ohmori, and M. Yamamoto, Mouse Tryptase Gene Expression is Coordinately Regulated by GATA1 and GATA2 in Bone Marrow-Derived Mast Cells. Int J Mol Sci, 2019. 20(18). [CrossRef]
- Babina, M., et al., The transcription factor profile of human mast cells in comparison with monocytes and granulocytes. Cell Mol Life Sci, 2005. 62(2): p. 214-26. [CrossRef]
- Akula, S., et al., How Relevant Are Bone Marrow-Derived Mast Cells (BMMCs) as Models for Tissue Mast Cells? A Comparative Transcriptome Analysis of BMMCs and Peritoneal Mast Cells. Cells, 2020. 9(9). [CrossRef]
- Li, Z., et al., Adult Connective Tissue-Resident Mast Cells Originate from Late Erythro-Myeloid Progenitors. Immunity, 2018. 49(4): p. 640-653 e5. [CrossRef]
- Gentek, R., et al., Hemogenic Endothelial Fate Mapping Reveals Dual Developmental Origin of Mast Cells. Immunity, 2018. 48(6): p. 1160-1171 e5. [CrossRef]
- Hallgren, J. and M.F. Gurish, Mast cell progenitor trafficking and maturation. Adv Exp Med Biol, 2011. 716: p. 14-28. [CrossRef]
- Sieweke, M.H. and J.E. Allen, Beyond stem cells: self-renewal of differentiated macrophages. Science, 2013. 342(6161): p. 1242974. [CrossRef]
- Amit, I., D.R. Winter, and S. Jung, The role of the local environment and epigenetics in shaping macrophage identity and their effect on tissue homeostasis. Nat Immunol, 2016. 17(1): p. 18-25. [CrossRef]
- Perdiguero, E.G., et al., The Origin of Tissue-Resident Macrophages: When an Erythro-myeloid Progenitor Is an Erythro-myeloid Progenitor. Immunity, 2015. 43(6): p. 1023-4. [CrossRef]
- Hoeffel, G., et al., C-Myb(+) erythro-myeloid progenitor-derived fetal monocytes give rise to adult tissue-resident macrophages. Immunity, 2015. 42(4): p. 665-78. [CrossRef]
- Ginhoux, F., et al., Fate mapping analysis reveals that adult microglia derive from primitive macrophages. Science, 2010. 330(6005): p. 841-5. [CrossRef]
- Kierdorf, K., et al., Microglia emerge from erythromyeloid precursors via Pu.1- and Irf8-dependent pathways. Nat Neurosci, 2013. 16(3): p. 273-80. [CrossRef]
- Bain, C.C., et al., Constant replenishment from circulating monocytes maintains the macrophage pool in the intestine of adult mice. Nat Immunol, 2014. 15(10): p. 929-937. [CrossRef]
- Babina, M., et al., Comparative cytokine profile of human skin mast cells from two compartments--strong resemblance with monocytes at baseline but induction of IL-5 by IL-4 priming. J Leukoc Biol, 2004. 75(2): p. 244-52. [CrossRef]
- Guhl, S., et al., Skin mast cells develop non-synchronized changes in typical lineage characteristics upon culture. Exp Dermatol, 2014. 23(12): p. 933-5. [CrossRef]
- Franke, K., et al., CREB Is Activated by the SCF/KIT Axis in a Partially ERK-Dependent Manner and Orchestrates Survival and the Induction of Immediate Early Genes in Human Skin Mast Cells. Int J Mol Sci, 2023. 24(4). [CrossRef]
- Franke, K., et al., Clorfl86/RHEX Is a Negative Regulator of SCF/KIT Signaling in Human Skin Mast Cells. Cells, 2023. 12(9). [CrossRef]
- Inoue, K., et al., Impeding Xist expression from the active X chromosome improves mouse somatic cell nuclear transfer. Science, 2010. 330(6003): p. 496-9. [CrossRef]
- Korkmaz, B., et al., Neutrophil proteinase 3 and dipeptidyl peptidase I (cathepsin C) as pharmacological targets in granulomatosis with polyangiitis (Wegener granulomatosis). Semin Immunopathol, 2013. 35(4): p. 411-21. [CrossRef]
- Brown, J., et al., Lymphopain, a cytotoxic T and natural killer cell-associated cysteine proteinase. Leukemia, 1998. 12(11): p. 1771-81. [CrossRef]
- Hazzan, T., et al., Thymic Stromal Lymphopoietin Interferes with the Apoptosis of Human Skin Mast Cells by a Dual Strategy Involving STAT5/Mcl-1 and JNK/Bcl-xL. Cells, 2019. 8(8). [CrossRef]
- Paivandy, A., et al., Quantitative In-Depth Transcriptome Analysis Implicates Peritoneal Macrophages as Important Players in the Complement and Coagulation Systems. Int J Mol Sci, 2022. 23(3). [CrossRef]
- Wallner, B.P., et al., Cloning and expression of human lipocortin, a phospholipase A2 inhibitor with potential anti-inflammatory activity. Nature, 1986. 320(6057): p. 77-81. [CrossRef]
- Kuch, E.M., et al., Differentially localized acyl-CoA synthetase 4 isoenzymes mediate the metabolic channeling of fatty acids towards phosphatidylinositol. Biochim Biophys Acta, 2014. 1841(2): p. 227-39. [CrossRef]
- Morimoto, K., et al., Prostaglandin E2-EP3 signaling induces inflammatory swelling by mast cell activation. J Immunol, 2014. 192(3): p. 1130-7. [CrossRef]
- Babina, M., K. Franke, and G. Bal, How "Neuronal" Are Human Skin Mast Cells? Int J Mol Sci, 2022. 23(18). [CrossRef]
- Shelburne, C.P., et al., Stat5 expression is critical for mast cell development and survival. Blood, 2003. 102(4): p. 1290-7. [CrossRef]
- Li, Y., et al., The STAT5-GATA2 pathway is critical in basophil and mast cell differentiation and maintenance. J Immunol, 2015. 194(9): p. 4328-38. [CrossRef]
- Pearson, R., et al., Kruppel-like transcription factors: a functional family. Int J Biochem Cell Biol, 2008. 40(10): p. 1996-2001. [CrossRef]
- Noguchi, S., et al., FANTOM5 CAGE profiles of human and mouse samples. Sci Data, 2017. 4: p. 170112. [CrossRef]
- Chen, X., et al., Kruppel-like factor 4 (gut-enriched Kruppel-like factor) inhibits cell proliferation by blocking G1/S progression of the cell cycle. J Biol Chem, 2001. 276(32): p. 30423-8. [CrossRef]
- Carballo, E., W.S. Lai, and P.J. Blackshear, Feedback inhibition of macrophage tumor necrosis factor-alpha production by tristetraprolin. Science, 1998. 281(5379): p. 1001-5. [CrossRef]
- Ayyar, V.S., et al., Quantitative tissue-specific dynamics of in vivo GILZ mRNA expression and regulation by endogenous and exogenous glucocorticoids. Physiol Rep, 2015. 3(6). [CrossRef]
- Bullwinkel, J., et al., Ki-67 protein is associated with ribosomal RNA transcription in quiescent and proliferating cells. J Cell Physiol, 2006. 206(3): p. 624-35. [CrossRef]
- Iuliano, C., et al., Fetal Tissue-Derived Mast Cells (MC) as Experimental Surrogate for In Vivo Connective Tissue MC. Cells, 2022. 11(6). [CrossRef]
- Babina, M., et al., MRGPRX2 is negatively targeted by SCF and IL-4 to diminish pseudo-allergic stimulation of skin mast cells in culture. Exp Dermatol, 2018. 27(11): p. 1298-1303. [CrossRef]
- Babina, M., et al., Skin mast cell phenotypes between two highly divergent cohorts - more pronounced variability within than between groups. Exp Dermatol, 2017. 26(5): p. 446-449. [CrossRef]
- Hsieh, F.H., et al., T helper cell type 2 cytokines coordinately regulate immunoglobulin E-dependent cysteinyl leukotriene production by human cord blood-derived mast cells: profound induction of leukotriene C(4) synthase expression by interleukin 4. J Exp Med, 2001. 193(1): p. 123-33. [CrossRef]
- Ng, K., et al., Xist and the order of silencing. EMBO Rep, 2007. 8(1): p. 34-9. [CrossRef]
- Dwyer, D.F., et al., Expression profiling of constitutive mast cells reveals a unique identity within the immune system. Nat Immunol, 2016. 17(7): p. 878-87. [CrossRef]
- Friedman, A.D., Transcriptional regulation of granulocyte and monocyte development. Oncogene, 2002. 21(21): p. 3377-90. [CrossRef]
Figure 2.
Expression of IEGs/HSPs quickly returns to baseline after FcεRI-stimulation but not after purification of skin MCs. A) Cultured skin-derived MCs were stimulated by FcεRI-aggregation for the indicated times and expression of the respective genes was quantified by RT-qPCR and normalized to unstimulated control. N ≥ 7. B) Skin MCs were kept in standard medium, 10%FCS and no growth factors at 37oC for 1 and 2 d following isolation, as described in methods. Cultured MCs were used after around 3 weeks in culture. Gene expression was studied as in A. n ≥ 4. Normalized against 4 HKGs. The p-values are given directly in the figure.
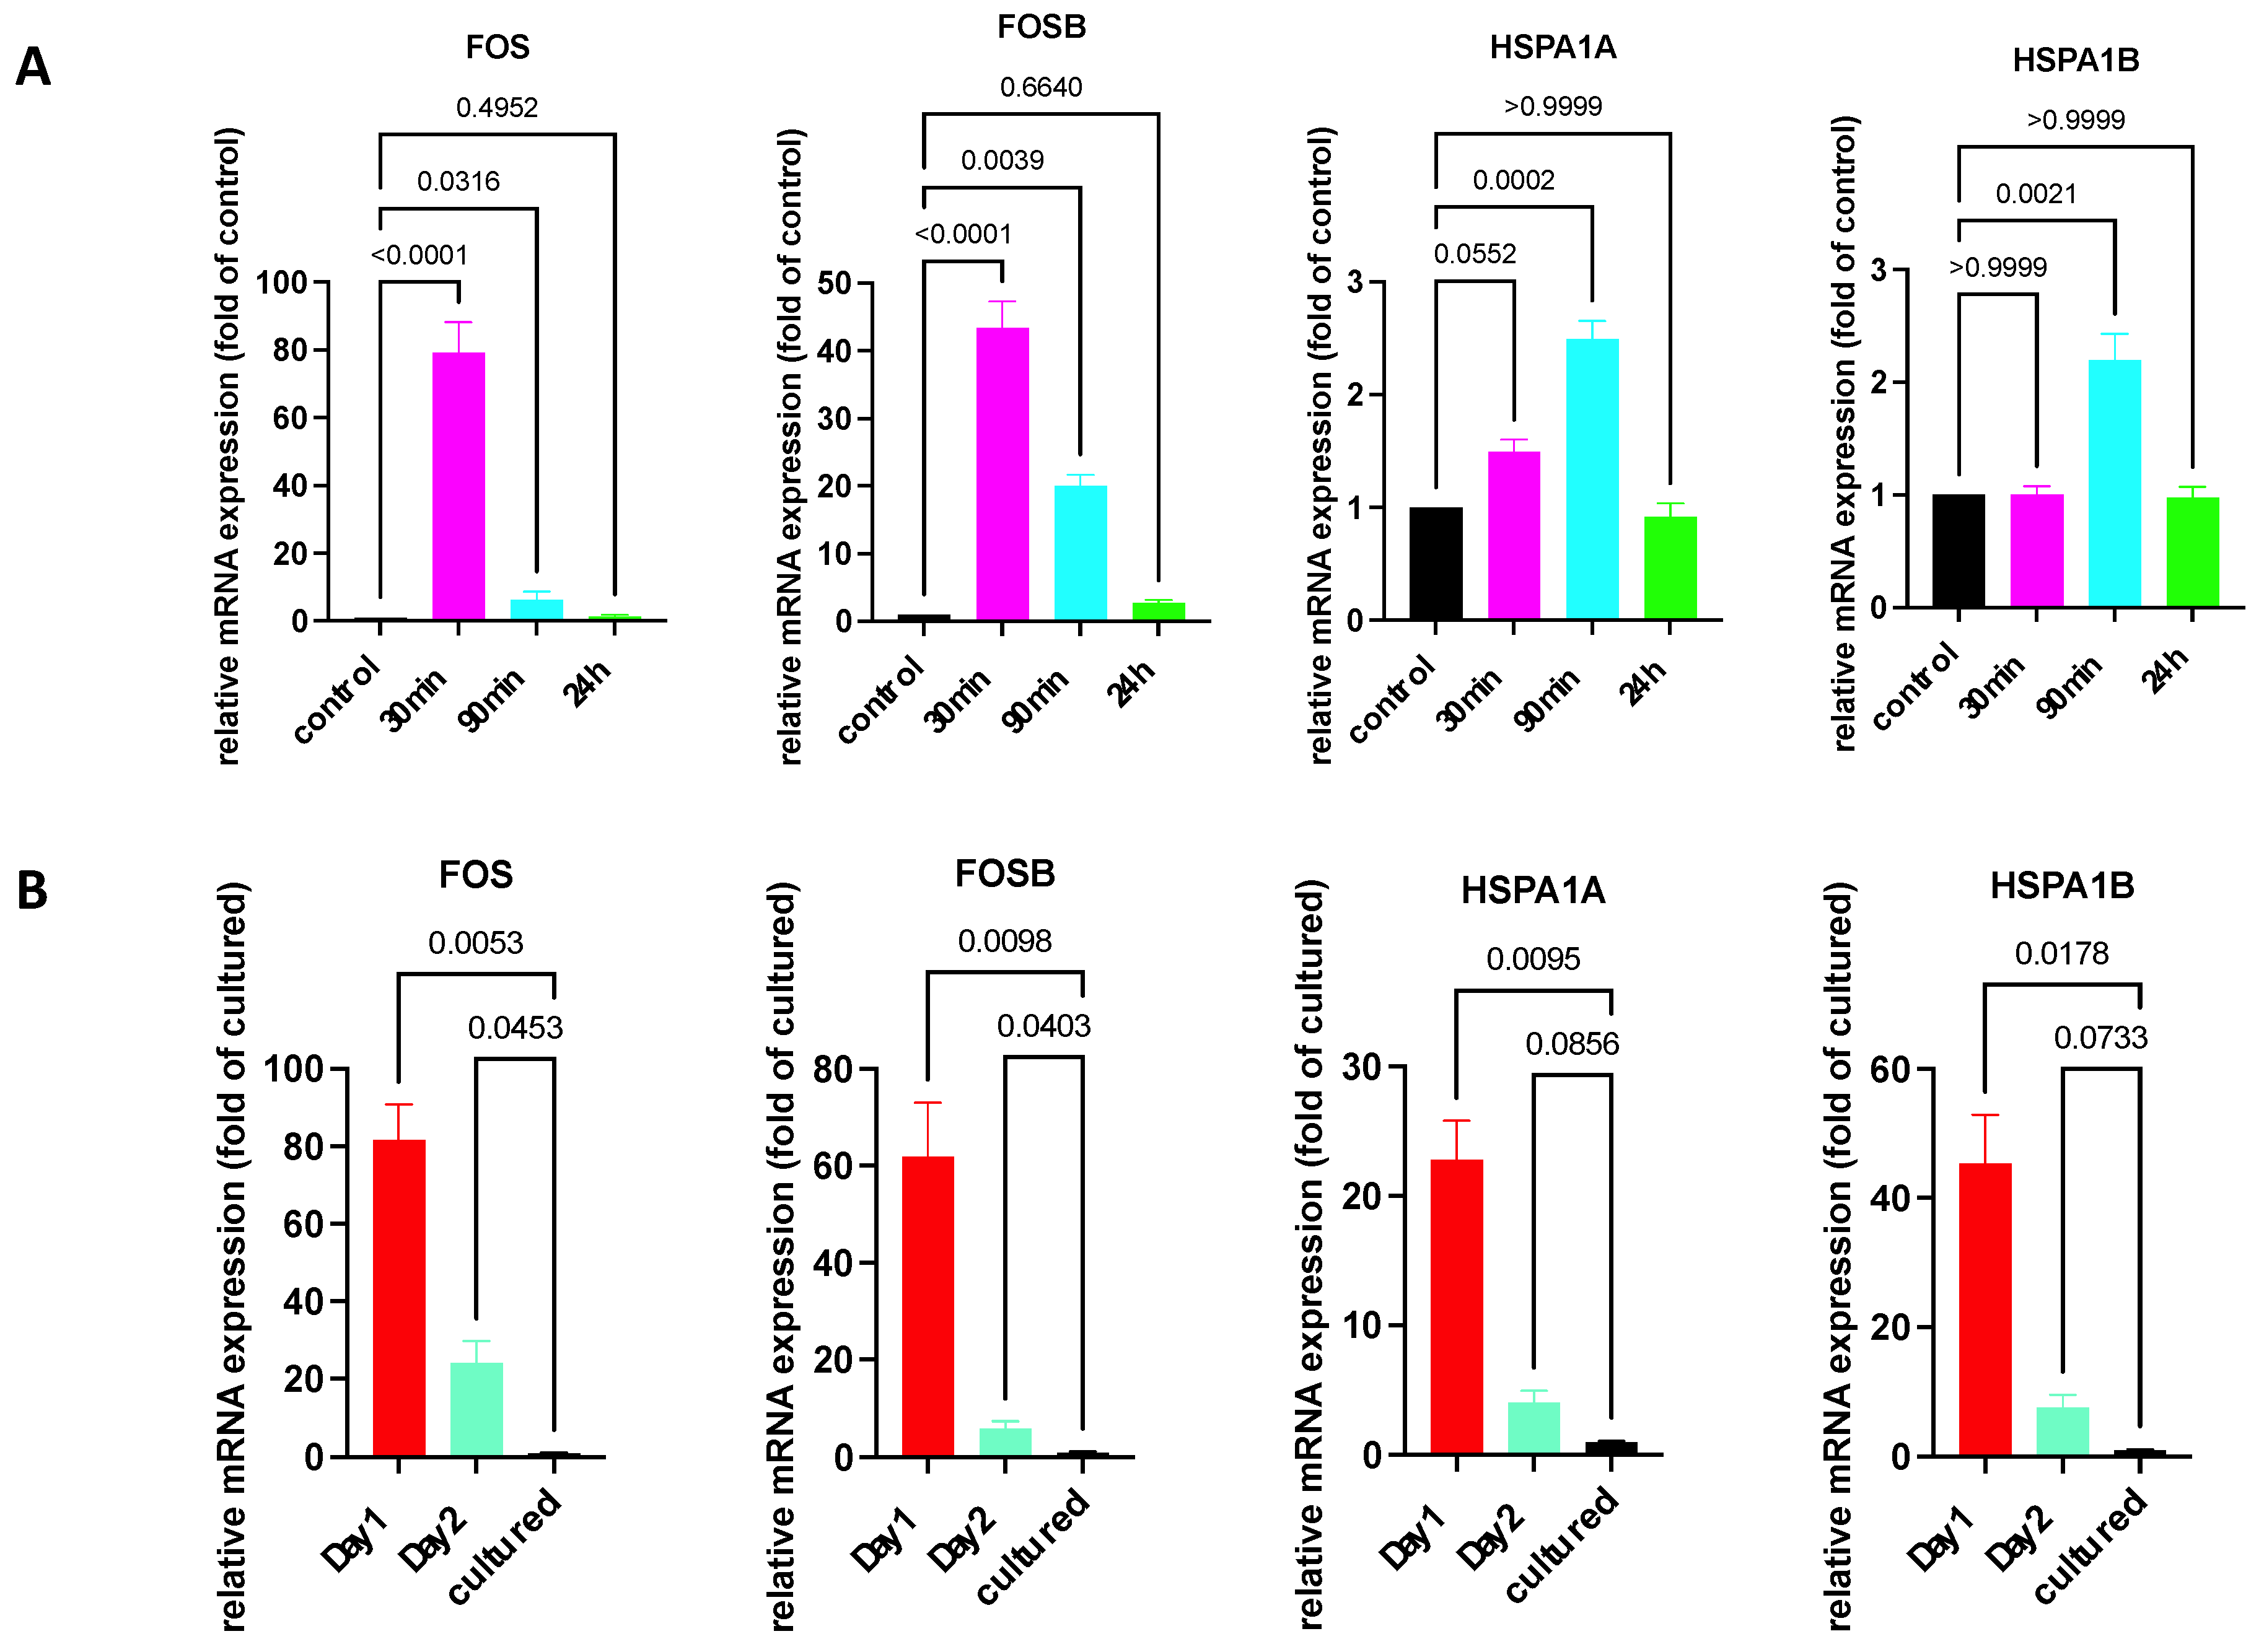
Figure 3.
Conditions applied during isolation do not (efficiently) induce expression of IEGs/HSPs. Cultured skin MCs were exposed to digestive enzymes with/without additional shaking or kept in normal culture conditions (“cultured”). Expression of the respective genes in cultured skin MCs (exposed/non-exposed) and in freshly isolated skin MCs (ex vivo) was quantified by RT-qPCR and normalized to the control (black column). N = 2.
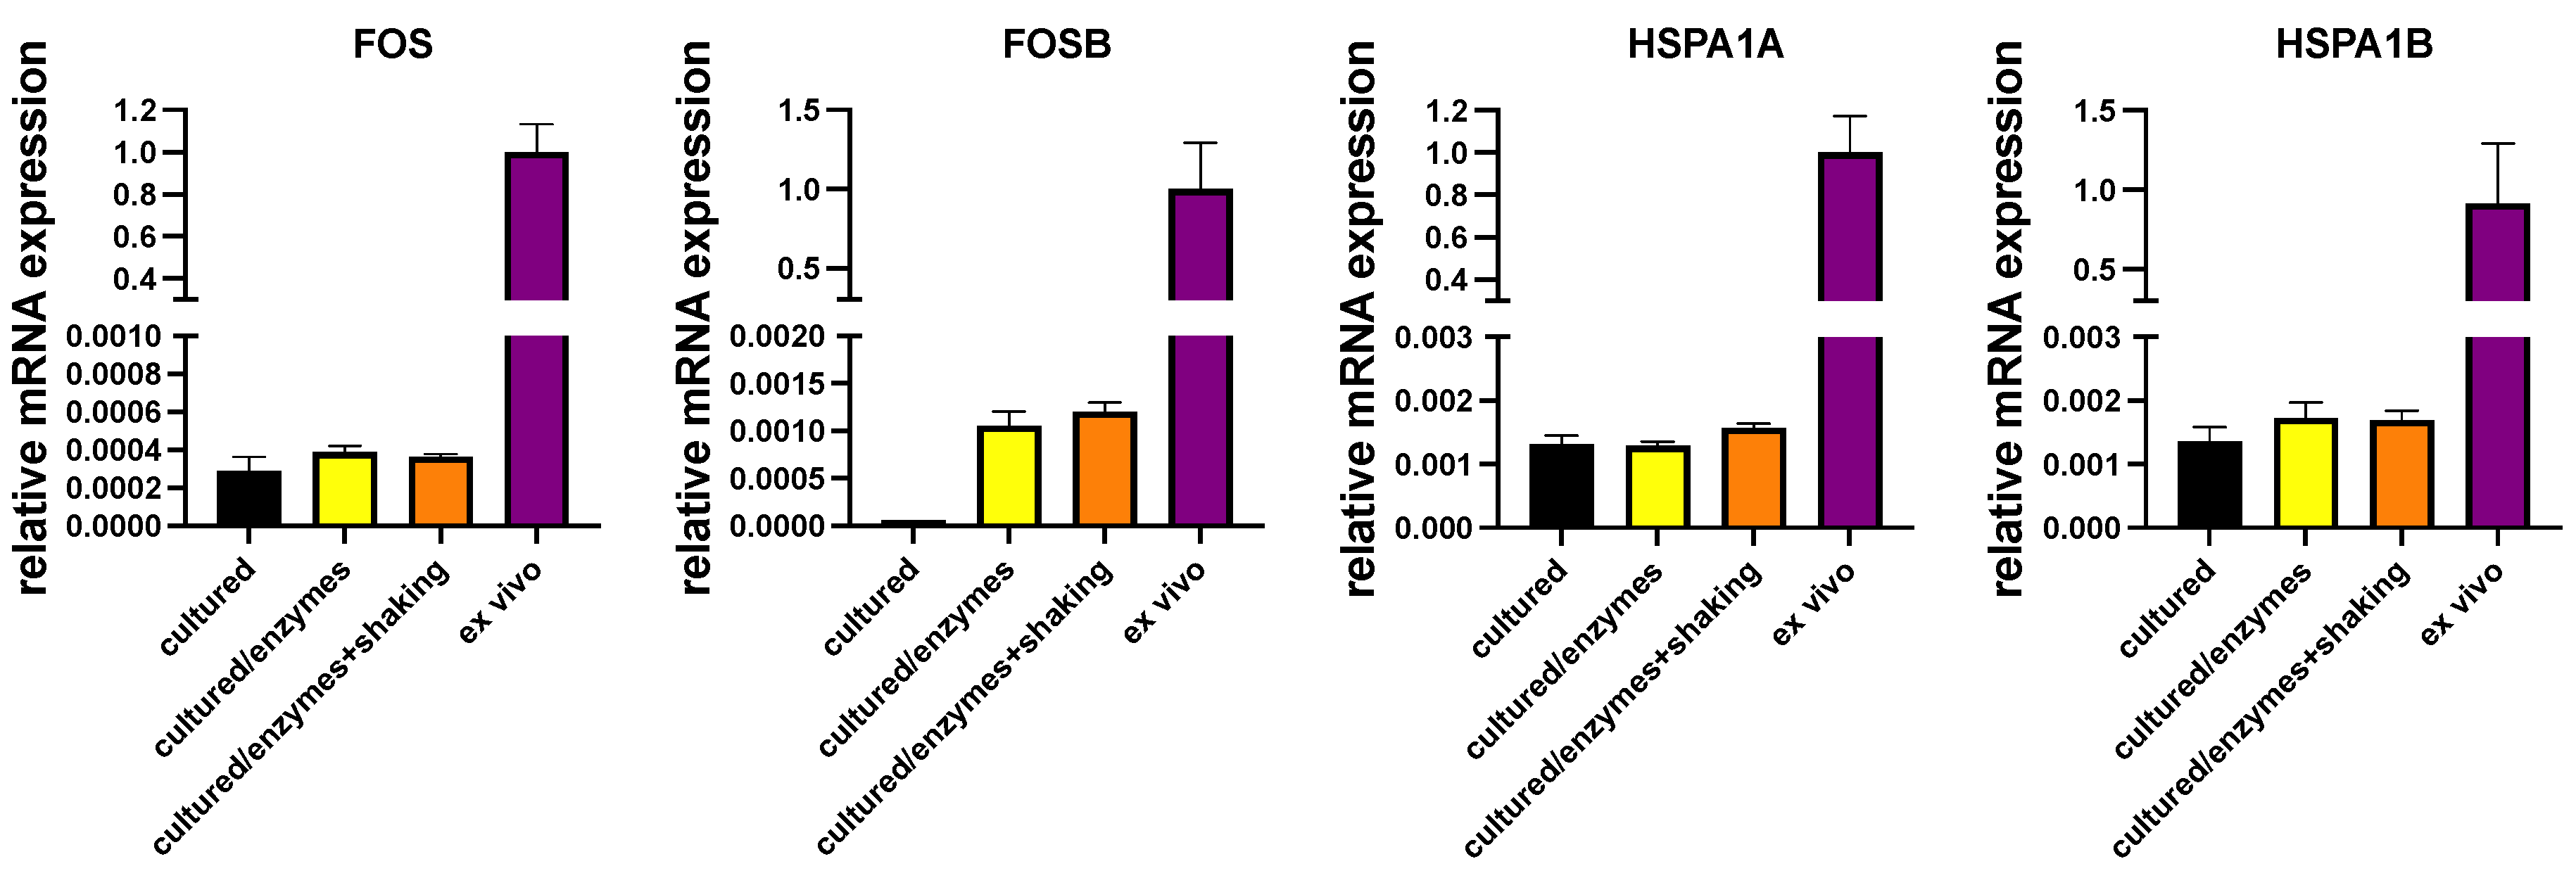
Figure 4.
A summary of the key genes of this transcriptional analysis of human skin MCs. EV stands for ex vivo or freshly isolated cells, CF for cultured female cells and CM for cultured male cells.
Figure 4.
A summary of the key genes of this transcriptional analysis of human skin MCs. EV stands for ex vivo or freshly isolated cells, CF for cultured female cells and CM for cultured male cells.
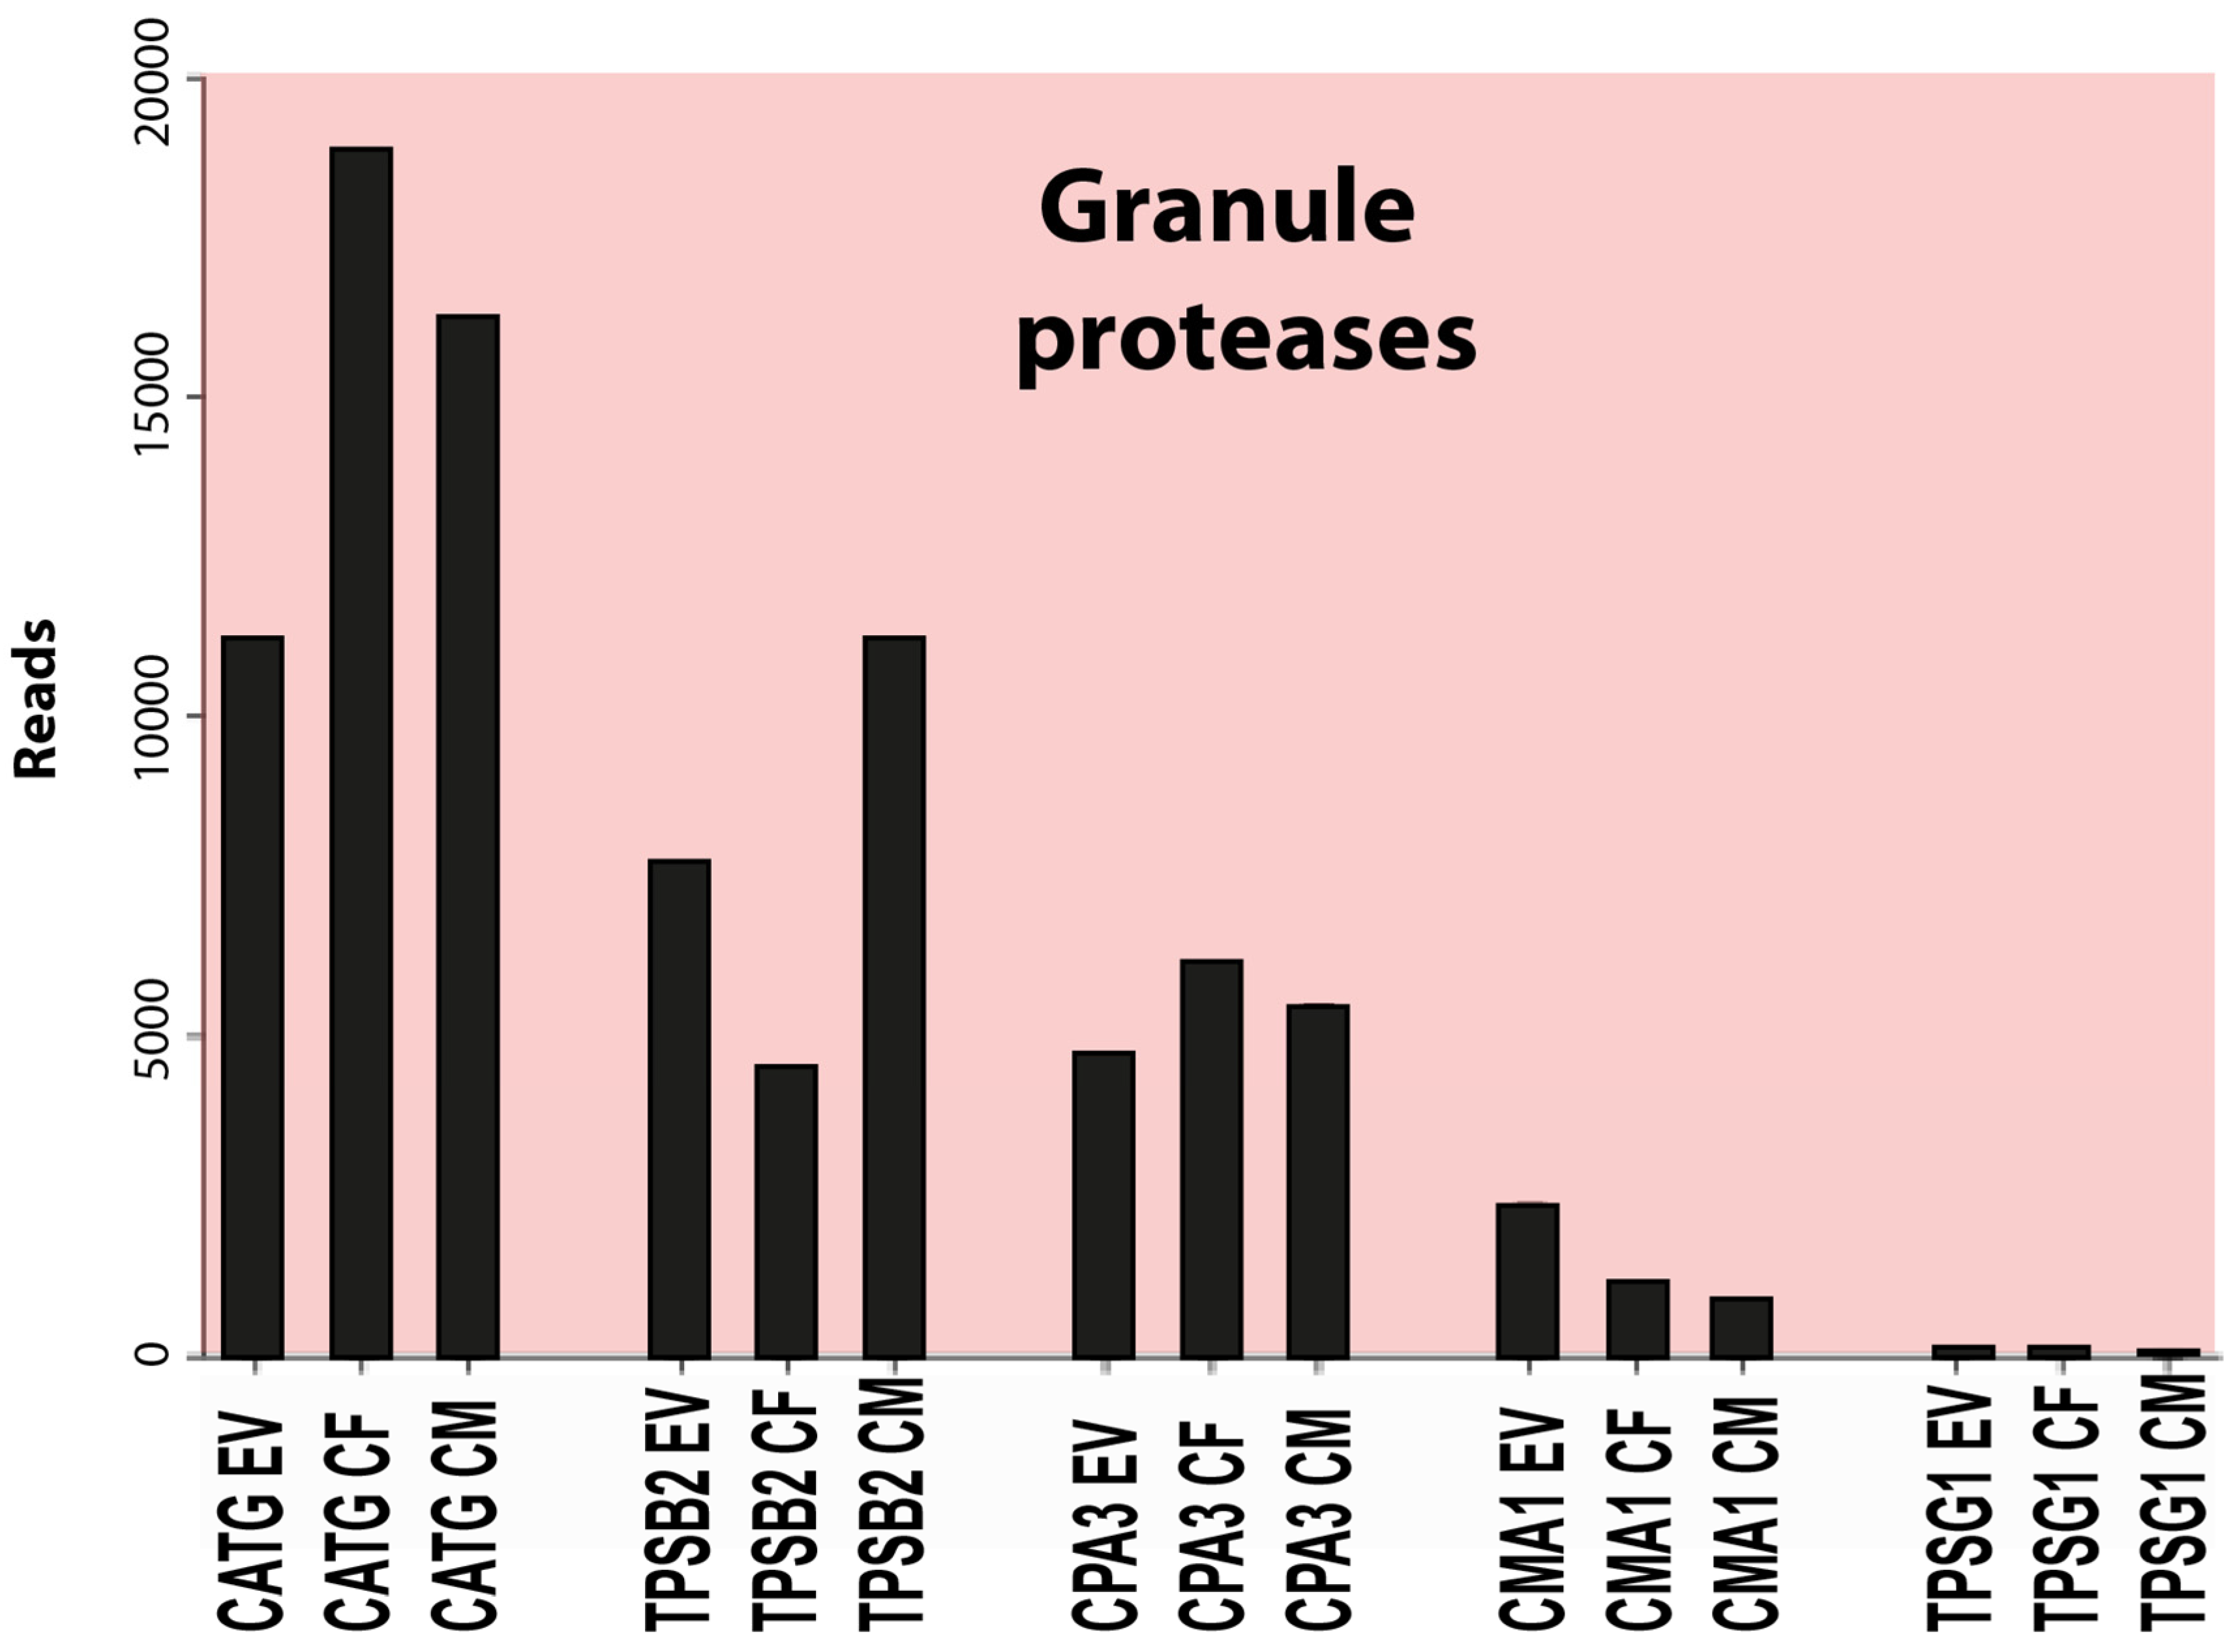
Figure 5.
A summary of the key genes of this transcriptional analysis of human skin MCs. EV stands for ex vivo or freshly isolated cells, CF for cultured female cells and CM for cultured male cells.
Figure 5.
A summary of the key genes of this transcriptional analysis of human skin MCs. EV stands for ex vivo or freshly isolated cells, CF for cultured female cells and CM for cultured male cells.
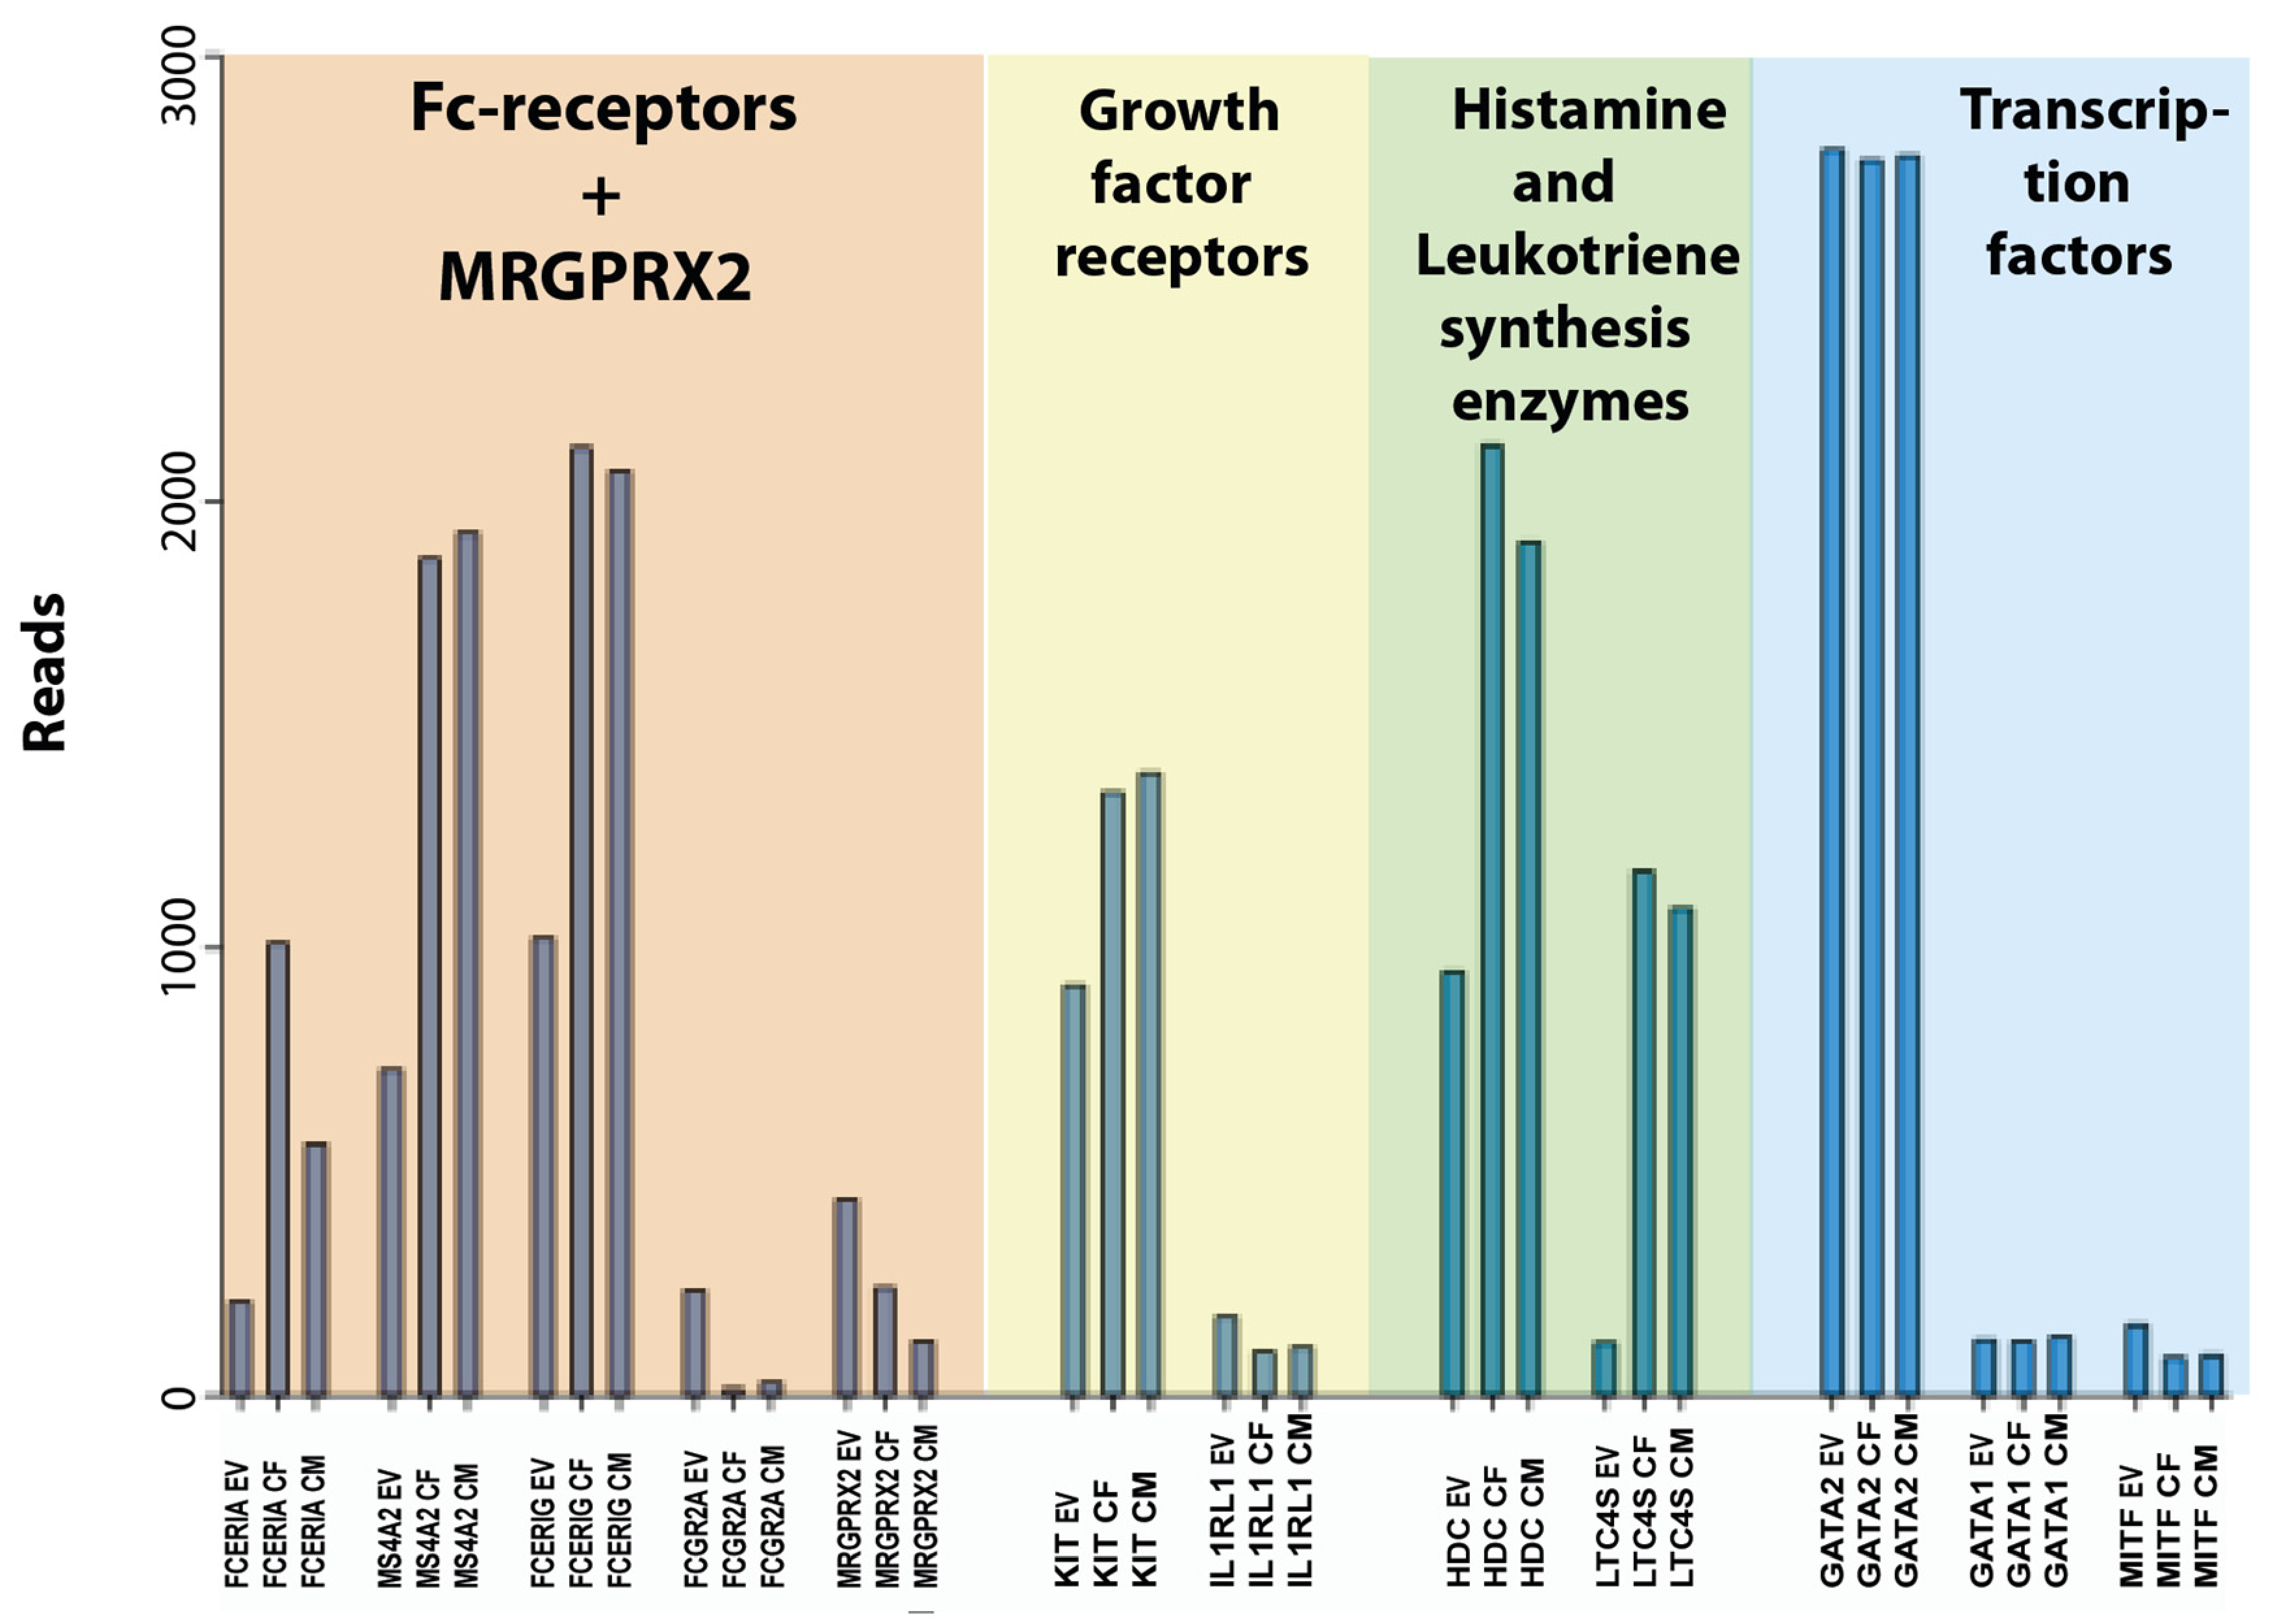
Table 1.
Transcript levels in reads from an Ampliseq analysis of purified mouse peritoneal MCs and of a 3-week culture of mouse BMMCs.
Table 1.
Transcript levels in reads from an Ampliseq analysis of purified mouse peritoneal MCs and of a 3-week culture of mouse BMMCs.
| Gene | Mouse Peritoneal MCs | Mouse BMMCs |
| Proteases | ||
| Cma1 (Mcpt5) | 45221 | 15683 |
| Mcpt4 (mMCP-4) | 31290 | 7 |
| Tpsb2 (Mcpt6) | 67773 | 3119 |
| Cpa3 (CPA-3) | 45604 | 22478 |
| Tpsab1 (Mcpt7) | 96 | 54 |
| Mcpt9 (mMCP-9) | 0 | 0 |
| CtsG (CTS-G) | 512 | 18 |
| Mcpt8 (mMCP-8) | 12 | 46 |
| Gzm B | 236 | 386 |
| Gzm C | 0.8 | 0.1 |
| Gzm D | 0.4 | 0 |
| Gzm E | 0 | 0.1 |
| Receptors | ||
| FcεRI alpha | 252 | 1631 |
| Ms4a2 (IgE rec. beta) | 1297 | 4288 |
| c-kit | 720 | 833 |
| Mrgprb2 | 899 | 8 |
| Transcription factors | ||
| Gata1 | 74 | 296 |
| Gata2 | 2272 | 5205 |
| Gata3 | 27 | 14 |
| Mitf | 370 | 144 |
Table 3.
Transcript levels in reads from an Ampliseq analysis of freshly isolated MCs from foreskin and from purified MCs from breast skin and foreskin MCs cultured for 2-3 weeks.
Table 3.
Transcript levels in reads from an Ampliseq analysis of freshly isolated MCs from foreskin and from purified MCs from breast skin and foreskin MCs cultured for 2-3 weeks.
| Freshly isolated cells | Cells cultured for 2-3 weeks | ||||||
| Foreskin (Male) |
Breast skin (Female) |
Foreskin (Male) |
|||||
| XIST | 1 | 54 | 0 | 389 | 311 | 0 | 0 |
| RPS4Y1 | 81 | 73 | 53 | 0.1 | 0.2 | 193 | 172 |
Table 4.
Transcript levels in reads from an Ampliseq analysis of freshly isolated MCs from foreskin and from purified MCs from breast skin and foreskin MCs cultured for 2-3 weeks.
Table 4.
Transcript levels in reads from an Ampliseq analysis of freshly isolated MCs from foreskin and from purified MCs from breast skin and foreskin MCs cultured for 2-3 weeks.
| Freshly isolated cells | Cells cultured for 2-3 weeks | ||||||
| Foreskin (Male) |
Breast skin (Female) |
Foreskin (Male) |
|||||
| Proteases | |||||||
| CATG | 9445 | 6194 | 12156 | 16285 | 21210 | 18847 | 13470 |
| TPSB2 | 7096 | 6177 | 7970 | 3771 | 5143 | 6791 | 15604 |
| CPA3 | 4403 | 3086 | 4976 | 5717 | 6465 | 6134 | 4812 |
| CMA1 | 1713 | 1359 | 2958 | 1177 | 1160 | 954 | 655 |
| TPSD1 | 418 | 67 | 145 | 196 | 156 | 78 | 62 |
| TPSG1 | 86 | 49 | 107 | 73 | 88 | 39 | 53 |
| CPM | 140 | 81 | 19 | 87 | 91 | 48 | 52 |
| GZMA | 0 | 0 | 0.1 | 0.1 | 2 | 0.3 | 0.5 |
| GZMK | 0 | 0 | 0 | 0 | 0 | 0 | 0 |
| GZMB | 0.4 | 0.2 | 0 | 0.6 | 0.2 | 11 | 2 |
| GZMH | 0 | 0 | 0 | 0 | 0.2 | 0 | 0 |
| GZMM | 0 | 0 | 0 | 0 | 0 | 0 | 0 |
| CTSC | 23 | 28 | 36 | 83 | 72 | 74 | 83 |
| CTSW | 32 | 12 | 12 | 294 | 177 | 175 | 184 |
| CTSD | 2356 | 1723 | 2806 | 3354 | 5192 | 3513 | 4318 |
| CTSB | 241 | 315 | 334 | 495 | 517 | 499 | 608 |
| CTSL1 | 48 | 158 | 55 | 22 | 28 | 29 | 27 |
| PLAT (tPA) | 136 | 288 | 137 | 164 | 218 | 317 | 158 |
| PLAU (uPA) | 102 | 38 | 100 | 16 | 20 | 18 | 12 |
| ADAMTS7 | 80 | 58 | 56 | 68 | 53 | 41 | 45 |
| ADAMTS14 | 2 | 1 | 3 | 108 | 141 | 98 | 159 |
| ADAM12 | 9 | 6 | 4 | 158 | 146 | 144 | 144 |
| PRSS12 | 38 | 59 | 98 | 3 | 4 | 10 | 3 |
| CASP3 | 88 | 74 | 119 | 294 | 223 | 168 | 217 |
| BACE2 | 103 | 49 | 39 | 473 | 434 | 399 | 425 |
Table 5.
Transcript levels in reads from an Ampliseq analysis of freshly isolated MCs from foreskin and from purified MCs from breast skin and foreskin MCs cultured for 2-3 weeks.
Table 5.
Transcript levels in reads from an Ampliseq analysis of freshly isolated MCs from foreskin and from purified MCs from breast skin and foreskin MCs cultured for 2-3 weeks.
| Freshly isolated cells | Cells cultured for 2-3 weeks | ||||||
| Foreskin (Male) |
Breast skin (Female) |
Foreskin (Male) |
|||||
| Protease inhibitors | |||||||
| TIMP1 | 407 | 357 | 502 | 569 | 982 | 692 | 630 |
| TIMP3 | 1270 | 995 | 939 | 434 | 521 | 414 | 529 |
| CST3 | 564 | 586 | 395 | 219 | 337 | 258 | 219 |
| CST7 | 111 | 91 | 44 | 760 | 1210 | 418 | 482 |
| LXN | 27 | 132 | 49 | 16 | 13 | 16 | 17 |
| SERPINB1 | 333 | 156 | 222 | 1669 | 1663 | 1652 | 1569 |
| SERPINE1 | 200 | 339 | 115 | 6 | 2 | 9 | 0.7 |
| SERPINH1 | 270 | 352 | 470 | 11 | 13 | 17 | 10 |
Table 6.
Transcript levels in reads from an Ampliseq analysis of freshly isolated MCs from foreskin and from purified MCs from breast skin and foreskin MCs cultured for 2-3 weeks.
Table 6.
Transcript levels in reads from an Ampliseq analysis of freshly isolated MCs from foreskin and from purified MCs from breast skin and foreskin MCs cultured for 2-3 weeks.
| Freshly isolated cells | Cells cultured for 2-3 weeks | ||||||
| Foreskin (Male) |
Breast skin (Female) |
Foreskin (Male) |
|||||
| Fc receptors | |||||||
| FCER1A (α) | 214 | 127 | 207 | 987 | 1041 | 494 | 633 |
| MS4A2 (β) | 817 | 441 | 642 | 1966 | 1782 | 2129 | 1732 |
| FCER1G (γ) | 908 | 848 | 1140 | 1852 | 2391 | 2064 | 2074 |
| FCER2 | 0 | 0 | 0 | 0 | 0 | 0 | 0 |
| FCGR1A | 0 | 0 | 0 | 0 | 0 | 0.3 | 0 |
| FCGR2A | 142 | 199 | 325 | 23 | 6 | 36 | 20 |
| FCGR2B | 2 | 0.4 | 0.2 | 0.1 | 0 | 0 | 0 |
| FCGR2C | 2 | 1 | 1 | 0.4 | 0 | 0 | 0 |
| FCGR3A | 0.3 | 0 | 0 | 0 | 0 | 0 | 0 |
| FCGR3B | 0 | 0 | 0 | 0 | 0 | 0 | 0 |
| MILR1 | 57 | 29 | 68 | 135 | 204 | 162 | 145 |
| CD200R1 | 24 | 6 | 5 | 109 | 88 | 84 | 85 |
| CD300A | 56 | 35 | 74 | 152 | 167 | 119 | 151 |
Table 7.
Transcript levels in reads from an Ampliseq analysis of freshly isolated MCs from foreskin and from purified MCs from breast skin and foreskin MCs cultured for 2-3 weeks.
Table 7.
Transcript levels in reads from an Ampliseq analysis of freshly isolated MCs from foreskin and from purified MCs from breast skin and foreskin MCs cultured for 2-3 weeks.
| Freshly isolated cells | Cells cultured for 2-3 weeks | ||||||
| Foreskin (Male) |
Breast skin (Female) |
Foreskin (Male) |
|||||
| Multiligand pseudo-allergy receptor, Purinergic and Cannabinoid receptors, anti-Mullerian hormone receptors | |||||||
| MRGPRX2 | 365 | 253 | 511 | 143 | 338 | 134 | 109 |
| MAS1L | 119 | 26 | 344 | 76 | 34 | 30 | 105 |
| P2RX1 | 334 | 226 | 337 | 328 | 335 | 259 | 356 |
| P2RX6 | 4 | 3 | 4 | 12 | 12 | 8 | 11 |
| P2RY1 | 11 | 3 | 2 | 68 | 61 | 75 | 77 |
| CNRIP1 | 113 | 74 | 81 | 382 | 124 | 241 | 224 |
| DRD2 | 35 | 19 | 56 | 94 | 47 | 71 | 57 |
| PAQR5 | 142 | 71 | 126 | 171 | 187 | 171 | 192 |
| EDNRB | 101 | 63 | 65 | 21 | 69 | 54 | 68 |
| ADORA2B | 8 | 6 | 5 | 21 | 23 | 17 | 30 |
| ADORA3 | 16 | 3 | 5 | 10 | 12 | 14 | 20 |
| CNR1 | 1 | 4 | 0.3 | 0.1 | 0 | 0 | 0 |
| CNR2 | 0 | 0 | 0 | 13 | 8 | 10 | 11 |
| AMHR2 | 59 | 26 | 57 | 85 | 101 | 86 | 104 |
Table 8.
Transcript levels in reads from an Ampliseq analysis of freshly isolated MCs from foreskin and from purified MCs from breast skin and foreskin MCs cultured for 2-3 weeks.
Table 8.
Transcript levels in reads from an Ampliseq analysis of freshly isolated MCs from foreskin and from purified MCs from breast skin and foreskin MCs cultured for 2-3 weeks.
| Freshly isolated cells | Cells cultured for 2-3 weeks | ||||||||||
| Foreskin (Male) |
Breast skin (Female) |
Foreskin (Male) |
|||||||||
| Growth Factor Receptors, Hormone receptors and Retinoid receptors | |||||||||||
| KIT | 1023 | 458 | 811 | 1347 | 1352 | 1381 | 1403 | ||||
| EPOR | 105 | 38 | 112 | 69 | 73 | 58 | 63 | ||||
| CSF2RA (GM-CSFR) | 14 | 6 | 6 | 1 | 1 | 3 | 0.8 | ||||
| CSF2RB (beta) | 512 | 347 | 789 | 448 | 326 | 177 | 312 | ||||
| CRLF2 (TSLP-R) | 194 | 427 | 257 | 85 | 77 | 87 | 76 | ||||
| IL1RL1 (IL33R) | 125 | 289 | 226 | 96 | 99 | 115 | 99 | ||||
| BMPR1A | 59 | 42 | 47 | 78 | 92 | 74 | 74 | ||||
| PTAFR | 53 | 25 | 46 | 90 | 128 | 64 | 144 | ||||
| IL2RA | 17 | 32 | 14 | 102 | 11 | 28 | 90 | ||||
| IL3RA | 10 | 11 | 0.6 | 4 | 0.7 | 4 | 3 | ||||
| IL5RA | 17 | 11 | 14 | 9 | 9 | 16 | 12 | ||||
| IL6R | 69 | 98 | 27 | 16 | 15 | 7 | 13 | ||||
| IL6ST | 124 | 252 | 115 | 65 | 110 | 61 | 62 | ||||
| IL9R | 4 | 11 | 2 | 110 | 87 | 155 | 122 | ||||
| IL18R1 | 280 | 216 | 510 | 62 | 47 | 88 | 56 | ||||
| GPR34 | 39 | 9 | 14 | 332 | 304 | 206 | 224 | ||||
| MC1R | 9 | 6 | 19 | 67 | 130 | 44 | 136 | ||||
| TNFRSF9 | 159 | 351 | 282 | 10 | 1 | 11 | 15 | ||||
| TNFRSF21 | 292 | 226 | 503 | 11 | 17 | 6 | 9 | ||||
| LTBR | 74 | 65 | 43 | 3 | 4 | 8 | 10 | ||||
| ACVR1B | 28 | 62 | 27 | 12 | 13 | 17 | 12 | ||||
| ADIPOR2 | 48 | 101 | 58 | 62 | 64 | 64 | 71 | ||||
| GABARAPL1 | 43 | 71 | 25 | 11 | 12 | 9 | 6 | ||||
| AGTRAP | 115 | 50 | 109 | 215 | 293 | 201 | 253 | ||||
| ADRB2 | 561 | 590 | 832 | 244 | 278 | 262 | 252 | ||||
| RXRA | 181 | 109 | 142 | 117 | 129 | 68 | 94 | ||||
| NRP1 | 58 | 71 | 26 | 171 | 213 | 150 | 149 | ||||
| NRP2 | 87 | 132 | 47 | 47 | 39 | 69 | 55 | ||||
Table 9.
Transcript levels in reads from an Ampliseq analysis of freshly isolated MCs from foreskin and from purified MCs from breast skin and foreskin MCs cultured for 2-3 weeks.
Table 9.
Transcript levels in reads from an Ampliseq analysis of freshly isolated MCs from foreskin and from purified MCs from breast skin and foreskin MCs cultured for 2-3 weeks.
| Freshly isolated cells | Cells cultured for 2-3 weeks | ||||||
| Foreskin (Male) |
Breast skin (Female) |
Foreskin (Male) |
|||||
| MHC and related genes | |||||||
| HLA-A | 344 | 326 | 253 | 231 | 329 | 167 | 201 |
| HLA-B | 297 | 188 | 70 | 338 | 48 | 93 | 106 |
| HLA-C | 552 | 241 | 200 | 449 | 475 | 251 | 196 |
| HLA-DPA1 | 93 | 60 | 21 | 13 | 5 | 10 | 23 |
| HLA-DPB1 | 39 | 28 | 9 | 0.2 | 0.4 | 1 | 0.3 |
| HLA-DRA | 75 | 65 | 19 | 0.4 | 0.2 | 0.3 | 0 |
| HLA-DRB1 | 146 | 121 | 118 | 52 | 0 | 0.7 | 0.8 |
| HLA-DQA1 | 17 | 8 | 4 | 0.2 | 0 | 0.4 | 0 |
| HLA-DOA | 2 | 0.6 | 0.4 | 0 | 0.1 | 0 | 0 |
| HLA-DOB | 0.1 | 0.1 | 0 | 0 | 0 | 0 | 0 |
| CIITA | 7 | 3 | 0.5 | 0.1 | 0 | 0.4 | 0 |
Table 10.
Transcript levels in reads from an Ampliseq analysis of freshly isolated MCs from foreskin and from purified MCs from breast skin and foreskin MCs cultured for 2-3 weeks.
Table 10.
Transcript levels in reads from an Ampliseq analysis of freshly isolated MCs from foreskin and from purified MCs from breast skin and foreskin MCs cultured for 2-3 weeks.
| Freshly isolated cells | Cells cultured for 2-3 weeks | |||||||
| Foreskin (Male) |
Breast skin (Female) |
Foreskin (Male) |
||||||
| Histamine, prostaglandin and leukotriene synthesis and receptors | ||||||||
| HDC | 853 | 796 | 1044 | 1844 | 2409 | 1941 | 1880 | |
| HRH4 | 27 | 7 | 31 | 23 | 6 | 15 | 9 | |
| HPGD | 1296 | 1021 | 1491 | 8857 | 9230 | 7877 | 8074 | |
| HPGDS | 705 | 484 | 588 | 2728 | 2015 | 2133 | 2715 | |
| PTGS2 (Cox2) | 523 | 392 | 353 | 293 | 248 | 881 | 364 | |
| PTGS1 (Cox1) | 378 | 357 | 401 | 335 | 390 | 340 | 389 | |
| ALOX5 | 307 | 143 | 109 | 282 | 380 | 369 | 351 | |
| PLA2G2A | 272 | 579 | 606 | 0 | 0 | 7 | 0 | |
| PLA2G3 | 0 | 0 | 0 | 0 | 0 | 0 | 0 | |
| PLA2G4A | 18 | 12 | 9 | 20 | 28 | 33 | 43 | |
| LTC4S | 129 | 60 | 105 | 1111 | 1236 | 923 | 1258 | |
| TBXAS1 | 26 | 18 | 26 | 128 | 108 | 104 | 129 | |
| ANXA1 | 3919 | 5423 | 6675 | 1907 | 1793 | 1938 | 1558 | |
| ACSL4 | 529 | 841 | 576 | 2027 | 1607 | 1961 | 1830 | |
| PTGER2 | 23 | 10 | 15 | 53 | 28 | 33 | 36 | |
| PTGER3 | 43 | 18 | 34 | 122 | 117 | 115 | 102 | |
| PTGER4 | 217 | 203 | 210 | 234 | 272 | 268 | 230 | |
| Complement and coagulation components | ||||||||
| C2 | 13 | 13 | 13 | 3 | 10 | 43 | 32 | |
| C3AR1 | 31 | 6 | 8 | 157 | 146 | 111 | 138 | |
| PROCR | 36 | 19 | 14 | 12 | 18 | 20 | 22 | |
Table 11.
Transcript levels in reads from an Ampliseq analysis of freshly isolated MCs from foreskin and from purified MCs from breast skin and foreskin MCs cultured for 2-3 weeks.
Table 11.
Transcript levels in reads from an Ampliseq analysis of freshly isolated MCs from foreskin and from purified MCs from breast skin and foreskin MCs cultured for 2-3 weeks.
| Freshly isolated cells | Cells cultured for 2-3 weeks | ||||||
| Foreskin (Male) |
Breast skin (Female) |
Foreskin (Male) |
|||||
| Cell adhesion molecules | |||||||
| ITGA2B | 4 | 3 | 6 | 649 | 654 | 547 | 479 |
| ITGA3 | 98 | 75 | 92 | 18 | 34 | 34 | 23 |
| ITGA5 | 162 | 358 | 176 | 25 | 22 | 25 | 21 |
| ITGA9 | 148 | 127 | 156 | 28 | 22 | 23 | 17 |
| ITGAV | 29 | 148 | 24 | 20 | 18 | 25 | 13 |
| ITGAX | 86 | 231 | 76 | 81 | 115 | 83 | 99 |
| PXN | 180 | 127 | 147 | 34 | 37 | 31 | 29 |
| SELPLG | 60 | 21 | 34 | 262 | 209 | 135 | 228 |
| ICAM1 | 146 | 53 | 15 | 52 | 37 | 38 | 42 |
| L1CAM | 304 | 232 | 233 | 24 | 20 | 52 | 58 |
| FAT1 | 34 | 36 | 24 | 60 | 54 | 85 | 71 |
| CEACAM1 | 11 | 6 | 14 | 301 | 254 | 261 | 309 |
| NINJ1 | 181 | 266 | 123 | 37 | 16 | 19 | 24 |
| PMP22 | 504 | 523 | 279 | 270 | 321 | 365 | 351 |
| NTM | 119 | 97 | 158 | 52 | 99 | 57 | 43 |
| JPH4 | 93 | 62 | 127 | 72 | 94 | 80 | 109 |
Table 12.
Transcript levels in reads from an Ampliseq analysis of freshly isolated MCs from foreskin and from purified MCs from breast skin and foreskin MCs cultured for 2-3 weeks.
Table 12.
Transcript levels in reads from an Ampliseq analysis of freshly isolated MCs from foreskin and from purified MCs from breast skin and foreskin MCs cultured for 2-3 weeks.
| Freshly isolated cells | Cells cultured for 2-3 weeks | ||||||
| Foreskin (Male) |
Breast skin (Female) |
Foreskin (Male) |
|||||
| Transcription factors | |||||||
| GATA2 | 2859 | 1421 | 2719 | 2575 | 2955 | 2735 | 2815 |
| GATA1 | 105 | 108 | 141 | 119 | 123 | 116 | 147 |
| GATA3 | 1 | 2 | 1 | 10 | 15 | 29 | 12 |
| MITF | 195 | 64 | 118 | 80 | 87 | 94 | 83 |
| HEY1 | 86 | 206 | 145 | 46 | 40 | 67 | 23 |
| HES1 | 138 | 117 | 88 | 13 | 13 | 15 | 16 |
| CREB1 | 75 | 83 | 54 | 73 | 71 | 67 | 64 |
| STAT5A | 80 | 56 | 70 | 86 | 65 | 78 | 86 |
| STAT5B | 111 | 100 | 156 | 150 | 133 | 127 | 128 |
| BHLHE40 | 1449 | 969 | 715 | 1612 | 1267 | 976 | 1046 |
| NFE2L3 | 18 | 19 | 27 | 22 | 18 | 20 | 21 |
| PBX1 | 53 | 44 | 50 | 131 | 134 | 112 | 136 |
| PHTF2 | 37 | 26 | 32 | 100 | 99 | 87 | 89 |
| HOXB2 | 22 | 14 | 12 | 58 | 67 | 64 | 60 |
| HOXB4 | 31 | 12 | 24 | 56 | 52 | 46 | 55 |
| RUNX2 | 61 | 23 | 40 | 17 | 14 | 14 | 5 |
| NR4A1 | 997 | 147 | 476 | 148 | 80 | 136 | 61 |
| IKZF1 | 158 | 133 | 124 | 353 | 312 | 262 | 353 |
| KLF2 | 2008 | 820 | 2018 | 3 | 10 | 8 | 8 |
| KLF4 | 1751 | 1041 | 1184 | 0.6 | 0.1 | 0.7 | 0 |
| TSC22D3 | 2856 | 2648 | 2859 | 7 | 6 | 5 | 8 |
| ZFP36 | 15395 | 10607 | 11923 | 289 | 138 | 122 | 53 |
| ZNF618 | 54 | 26 | 74 | 67 | 73 | 61 | 69 |
| ZNF521 | 43 | 19 | 35 | 69 | 77 | 70 | 56 |
| ZCCHC24 | 53 | 65 | 46 | 70 | 77 | 60 | 77 |
| ZMIZ1 | 190 | 300 | 224 | 153 | 159 | 135 | 158 |
| GFI1 | 116 | 41 | 54 | 148 | 257 | 195 | 229 |
| EGR3 | 494 | 194 | 902 | 379 | 248 | 422 | 220 |
| MEIS2 | 275 | 193 | 320 | 272 | 285 | 287 | 260 |
| STAT3 | 222 | 199 | 87 | 243 | 261 | 248 | 223 |
| AFF2 | 95 | 48 | 90 | 89 | 104 | 91 | 90 |
| TAL1 | 87 | 41 | 72 | 114 | 112 | 92 | 86 |
| E2F8 | 2 | 1 | 1 | 31 | 20 | 39 | 32 |
| FOXM1 | 0.3 | 0.3 | 0.2 | 75 | 55 | 111 | 81 |
| GLI3 | 57 | 47 | 32 | 11 | 25 | 22 | 21 |
| EPAS1 | 436 | 835 | 592 | 206 | 129 | 321 | 286 |
| MAF | 23 | 59 | 54 | 28 | 36 | 19 | 25 |
| PTRF | 465 | 707 | 280 | 198 | 140 | 175 | 125 |
Table 13.
Transcript levels in reads from an Ampliseq analysis of freshly isolated MCs from foreskin and from purified MCs from breast skin and foreskin MCs cultured for 2-3 weeks.
Table 13.
Transcript levels in reads from an Ampliseq analysis of freshly isolated MCs from foreskin and from purified MCs from breast skin and foreskin MCs cultured for 2-3 weeks.
| Freshly isolated cells | Cells cultured for 2-3 weeks | ||||||
| Foreskin (Male) |
Breast skin (Female) |
Foreskin (Male) |
|||||
| Cell growth related transcripts | |||||||
| HIST1H3G | 8 | 9 | 10 | 1145 | 645 | 1695 | 982 |
| HIST1H3J | 5 | 4 | 4 | 363 | 174 | 481 | 319 |
| HIST1H3F | 4 | 2 | 1 | 277 | 185 | 229 | 238 |
| RRM2 | 1 | 0.3 | 1 | 259 | 133 | 323 | 254 |
| TOP2A | 1 | 1 | 2 | 207 | 151 | 326 | 189 |
| CDK1 | 1 | 1 | 1 | 108 | 74 | 140 | 120 |
| MKI67 | 0.3 | 0.4 | 0.7 | 111 | 65 | 143 | 107 |
Table 14.
Transcript levels in reads from an Ampliseq analysis of freshly isolated MCs from foreskin and from purified MCs from breast skin and foreskin MCs cultured for 2-3 weeks.
Table 14.
Transcript levels in reads from an Ampliseq analysis of freshly isolated MCs from foreskin and from purified MCs from breast skin and foreskin MCs cultured for 2-3 weeks.
| Freshly isolated cells | Cells cultured for 2-3 weeks | ||||||
| Foreskin (Male) |
Breast skin (Female) |
Foreskin (Male) |
|||||
| Growth factors | |||||||
| VEGFA | 1948 | 1323 | 2848 | 17 | 15 | 23 | 23 |
| VEGFB | 138 | 87 | 108 | 155 | 213 | 185 | 240 |
| VEGFC | 7 | 9 | 0.4 | 0 | 0.4 | 1 | 0.2 |
| PDGFA | 270 | 366 | 442 | 7 | 5 | 8 | 7 |
| PDGFB | 4 | 14 | 0.8 | 0 | 0 | 0 | 0 |
| PDGFC | 17 | 20 | 14 | 0.7 | 0.7 | 0.9 | 0.2 |
| CSF1 (M-CSF) | 1579 | 933 | 1736 | 561 | 274 | 466 | 232 |
| CSF2 (GM-CSF) | 9 | 61 | 6 | 627 | 799 | 276 | 360 |
| CCL2 | 1518 | 1644 | 807 | 1379 | 925 | 1789 | 925 |
| CCL4 | 34 | 117 | 47 | 1 | 98 | 29 | 34 |
| CXCL16 | 263 | 160 | 310 | 185 | 252 | 117 | 156 |
| LIF | 659 | 307 | 1402 | 1582 | 1085 | 1798 | 1210 |
| TGFA | 31 | 21 | 41 | 65 | 87 | 58 | 59 |
| TGFB1I1 | 137 | 149 | 75 | 8 | 11 | 27 | 13 |
| TNF | 138 | 124 | 213 | 5 | 8 | 19 | 43 |
| TNFSF10 | 89 | 93 | 96 | 149 | 201 | 264 | 163 |
| IL13 | 29 | 47 | 28 | 0.5 | 0.4 | 1 | 0.3 |
| IL7 | 1 | 2 | 0.1 | 25 | 11 | 10 | 12 |
| IL5 | 0.1 | 0 | 0 | 3 | 1 | 5 | 8 |
| POSTN | 19 | 24 | 1 | 32 | 25 | 40 | 4 |
| GDF15 | 136 | 27 | 78 | 77 | 97 | 52 | 54 |
| EMR2 | 154 | 207 | 168 | 148 | 118 | 127 | 109 |
| OPTN | 37 | 27 | 10 | 63 | 56 | 80 | 58 |
| Growth factor induced proteins | |||||||
| TNFAIP3 | 5148 | 1318 | 588 | 24 | 11 | 23 | 18 |
Table 15.
Transcript levels in reads from an Ampliseq analysis of freshly isolated MCs from foreskin and from purified MCs from breast skin and foreskin MCs cultured for 2-3 weeks.
Table 15.
Transcript levels in reads from an Ampliseq analysis of freshly isolated MCs from foreskin and from purified MCs from breast skin and foreskin MCs cultured for 2-3 weeks.
| Freshly isolated cells | Cells cultured for 2-3 weeks | ||||||
| Foreskin (Male) |
Breast skin (Female) |
Foreskin (Male) |
|||||
| Surface Markers | |||||||
| CD4 | 238 | 157 | 188 | 365 | 382 | 201 | 342 |
| CD9 | 931 | 1078 | 997 | 896 | 770 | 914 | 833 |
| CD14 | 22 | 26 | 16 | 9 | 36 | 21 | 27 |
| CD22 | 146 | 110 | 118 | 730 | 738 | 411 | 585 |
| CD33 | 42 | 28 | 70 | 199 | 179 | 140 | 100 |
| CD34 | 4 | 2 | 3 | 0 | 0 | 0.1 | 0 |
| CD52 | 29 | 20 | 9 | 833 | 697 | 954 | 776 |
| CD63 | 265 | 306 | 270 | 1274 | 1264 | 1255 | 1092 |
| CD68 | 355 | 305 | 275 | 686 | 999 | 1124 | 1240 |
| CD274 (PD-L1) | 106 | 158 | 130 | 15 | 10 | 17 | 17 |
| CD276 | 17 | 32 | 28 | 34 | 41 | 32 | 44 |
| CD109 | 16 | 13 | 7 | 30 | 31 | 31 | 32 |
| PROS1 | 67 | 55 | 45 | 297 | 301 | 220 | 243 |
Table 16.
Transcript levels in reads from an Ampliseq analysis of freshly isolated MCs from foreskin and from purified MCs from breast skin and foreskin MCs cultured for 2-3 weeks.
Table 16.
Transcript levels in reads from an Ampliseq analysis of freshly isolated MCs from foreskin and from purified MCs from breast skin and foreskin MCs cultured for 2-3 weeks.
| Freshly isolated cells | Cells cultured for 2-3 weeks | ||||||
| Foreskin (Male) |
Breast skin (Female) |
Foreskin (Male) |
|||||
| Circadian proteins | |||||||
| PER1 | 2028 | 1197 | 2104 | 26 | 23 | 26 | 18 |
| CLOCK | 20 | 17 | 13 | 41 | 43 | 46 | 39 |
| PER2 | 45 | 54 | 29 | 11 | 17 | 10 | 12 |
| TIMELESS | 4 | 2 | 1 | 98 | 62 | 97 | 71 |
| PER3 | 39 | 21 | 15 | 25 | 39 | 40 | 36 |
| ARNTL | 5 | 3 | 1 | 15 | 14 | 13 | 15 |
| NR1D1 | 45 | 36 | 25 | 10 | 11 | 13 | 13 |
| NR1D2 | 37 | 33 | 12 | 34 | 32 | 31 | 31 |
Table 17.
Transcript levels in reads from an Ampliseq analysis of freshly isolated MCs from foreskin and from purified MCs from breast skin and foreskin MCs cultured for 2-3 weeks.
Table 17.
Transcript levels in reads from an Ampliseq analysis of freshly isolated MCs from foreskin and from purified MCs from breast skin and foreskin MCs cultured for 2-3 weeks.
| Freshly isolated cells | Cells cultured for 2-3 weeks | ||||||
| Foreskin (Male) |
Breast skin (Female) |
Foreskin (Male) |
|||||
| Stress and Growth response | |||||||
| FOSB | 13651 | 8861 | 14157 | 39 | 6 | 49 | 5 |
| FOS | 6395 | 3043 | 2026 | 158 | 60 | 140 | 51 |
| JUN | 30 | 17 | 16 | 0.2 | 0.1 | 0.3 | 0.2 |
| JUNB | 5676 | 3118 | 3982 | 331 | 315 | 231 | 250 |
| HSPA1A | 33988 | 35501 | 75250 | 259 | 293 | 211 | 293 |
| HSPA1B | 11715 | 5094 | 23085 | 57 | 45 | 65 | 85 |
| HSPA6 | 417 | 396 | 950 | 0.4 | 0 | 0 | 0 |
| HSPH1 | 885 | 423 | 702 | 94 | 108 | 115 | 111 |
| HSP90AB1 | 2350 | 2500 | 4641 | 432 | 479 | 391 | 430 |
| PLAUR | 888 | 415 | 1012 | 70 | 47 | 65 | 41 |
| CLU | 958 | 799 | 797 | 2460 | 2376 | 1523 | 1963 |
| CREB3L2 | 338 | 307 | 323 | 401 | 350 | 375 | 471 |
| IER3 | 1186 | 1693 | 836 | 1175 | 1143 | 1059 | 749 |
| EGR3 | 494 | 194 | 902 | 379 | 248 | 422 | 220 |
Disclaimer/Publisher’s Note: The statements, opinions and data contained in all publications are solely those of the individual author(s) and contributor(s) and not of MDPI and/or the editor(s). MDPI and/or the editor(s) disclaim responsibility for any injury to people or property resulting from any ideas, methods, instructions or products referred to in the content. |
© 2023 by the authors. Licensee MDPI, Basel, Switzerland. This article is an open access article distributed under the terms and conditions of the Creative Commons Attribution (CC BY) license (http://creativecommons.org/licenses/by/4.0/).
Copyright: This open access article is published under a Creative Commons CC BY 4.0 license, which permit the free download, distribution, and reuse, provided that the author and preprint are cited in any reuse.


