Submitted:
24 November 2023
Posted:
28 November 2023
You are already at the latest version
Abstract
Guava (Psidium guajava L.) is a species is widely distributed in Córdoba, despite this, there are few studies that have been carried out to understand its genetic diversity. For this reason, the objective of this research was to evaluate the genetic diversity and variability of guava (Psidium guajava L) using microsatellite markers in Montería, Córdoba-Colombia. Forty-five accessions were evaluated. For DNA extraction, the CTAB 2x extraction protocol was used with modifications. The extracted DNA was amplified by the PCR technique using seven microsatellite markers. A total of 46 alleles were found with an average of 6.5 alleles per locus. A total of 28 private alleles were identified in the populations, possibly fixed by different evolutionary forces. The evaluated population presented an average expected heterozygosity of 0.572 and the observed heterozygosity was lower (0.058). The fixation index presented a total average of 0.906, indicating that in Montería there is an excess of homozygotes. The PIC values allowed us to determine that the markers mPgCIR9, mPgCIR11, mPgCIR13, mPgCIR16, mPgCIR19 and mPgCIR22 are highly informative, while mPgCIR23 is moderately informative. The guava population in Montería presented a low genetic diversity within the subpopulations, which could be related to inbreeding events such as self-pollination..
Keywords:
genetic diversity
; genetic variability
; microsatellites
; allele frequencies
; population structure
1. Introduction
Guava (Psidium guajava L.) is a fruit tree belonging to the Myrtaceae family. It is native to the American continent, ranging from Mexico to Peru, where it can be found in the wild. However, it is currently cultivated in tropical and subtropical countries around the world [1].
Optimal conditions for the growth of these trees include soils with varying textures and drainage capabilities, pH ranges between 4.5 to 9.4, areas with high precipitation, and the ability to withstand drought conditions [2].
P. guajava possesses excellent nutritional and medicinal properties that are essential for health. It has been used as an antimicrobial, antigenotoxic, anti-inflammatory, antiallergic, antimalarial, hepatoprotective, and for the treatment of diarrhea and diabetes [3]. Likewise, its consumption has been associated with the reduction of cholesterol, triglycerides, and blood pressure [1].
In addition to its nutritional and medicinal properties, the cultivation of this species generates a socio-economic impact that benefits many families. They market this fruit in various forms, from fresh consumption to the production of jams, juices, snacks, among others, taking advantage of its well-established market in many countries. This is due to its hardiness, proliferation, high vitamin content, and significant economic [4].
P. guajava has been cultivated and utilized as a significant fruit in many parts of the world, particularly in tropical areas such as India, Indonesia, Pakistan, Bangladesh, and South America [5]. Currently, there is a wide range of cultivated varieties, and in Colombia specifically, three of these are present: common, pear, and apple [6], making it one of the most important fruit crops in the country.
In 2021, the departments of Santander, Meta, and Valle del Cauca were the main producers of this crop in Colombia. As for the department of Córdoba, the cultivation of this species for the same year covered an area of 297 hectares, with a production of 6,816 tons and a yield of 22.95 tons/ha [6].
To ensure high guava crop production in the department of Córdoba, it is necessary to determine the variability in the gene composition expressed in individuals of this species. Molecular tools are used for this purpose, with microsatellite markers being prominent among them. These markers are repetitive DNA sequences of 1 to 6 base pairs and are widely used to understand how living organisms change over time [7].
In Cordoba, and in Colombia in general, there is a lack of information regarding the genetic diversity and population structure of guava cultivars and populations. Therefore, the purpose of this study was to analyze the genetic diversity of 45 guava samples from Monteria, Cordoba, using 7 microsatellite markers.
2. Materials and Methods
2.1. Area of study:
The plant material was collected in the municipality of Montería-, Córdoba (08°45´0.5¨ North Latitude, 75°52´59.2¨ West Longitude) which has an area of 3043.00 km², is characterized by having a warm-tropical climate, with a dry season and a rainy season throughout the year and has an average temperature of 28°C. Sampling was conducted in the following districts: Maracayo, Patio Bonito y Santa Lucia (Table 1).
2.2. Sample collection
Forty-five accessions of P. guajava were collected from the three sampling zones, with 15 accessions from each population. These samples were placed in resealable bags with silica gel, properly labeled, and kept at room temperature during transportation to the Genetics Laboratory at the University of Córdoba, Colombia.
2.3. DNA Extraction
For the DNA extraction from the field-collected samples, the CTAB 2x extraction protocol with modifications proposed by Pardo et al., (2021) was employed. Briefly, leaf fragments of P. guajava were macerated in liquid nitrogen. Subsequently, 45-50 mg of the macerated material was placed in a reaction tube and 900 μL of extraction buffer was added. To each sample, 100 μL of 10% PVP and 20 μL of beta-mercaptoethanol were added. The mixture was then incubated in a water bath at 65°C for 60 minutes with intermittent vertexing every 10 minutes. After the incubation period, it was removed from the water bath and allowed to rest for 5 minutes. Next, 900 μL of chloroform-isoamyl alcohol solution (24:1) was added, and the mixture was gently inverted for 10 minutes and then centrifuged at 7000g for 5 minutes. The supernatant was transferred to a 1.5 ml reaction tube, and 120 μL of 3M sodium acetate and 500 μL of absolute ethanol were added. The solution was vortexed, cooled at -20°C for 1 hour, and then centrifuged at 13,000 RPM for 10 minutes, with the supernatant being discarded. Following this, 600 μL of 70% ethanol was added to clean the pellet. The tubes were centrifuged again at 13,000 RPM for 3 minutes, the supernatant was discarded, and the tubes were left to air-dry for 30 minutes inverted on a paper towel. The purity and concentration of the DNA were determined using both 2.5% (w/v) agarose gels and the NanoDrop® ND-1000 spectrophotometer. Finally, a rehydrating solution was added, and the extracted DNA was stored at 4°C until further use.
2.4. Polymerase Chain Reaction
The microsatellite markers (Table 2) were amplified using the PCR technique.
The reaction mixture had a final volume of 25 µl (Table 3), following the proposed specifications [8].
The PCR reaction (Table 4) was carried out in a Bio-Rad T100™ thermocycler (BIO-RAD, Hercules, USA) using the technique of PCR Touchdown. The PCR results were analyzed, and genetic variations were identified using the CEQ™ 8800 XL Capillary Genetic Analysis System from Beckman Coulter, Fullerton, CA. The analyses were repeated a minimum of two times in order to ensure that the results were consistent and reproducible.
2.5. Data analysis
Genetic-population parameters such as allelic frequencies, Private Alleles, Number of alleles (Na), Effective Number of alleles (Ne), Observed Heterozygosity (Ho), Expected Heterozygosity (He), Fixation Index (F), Hardy-Weinberg Equilibrium (HWE), Wright's F-statistics, and genetic distances were calculated using GenAlEx 6.5 software. Polymorphic Information Content (PIC) was determined with Cervus 3.0.7 software. The construction of the dendrogram based on the results was performed using Mega X software. For the analysis of population genetic structure, Structure 2.3.4 software was used.
3. Results
The allelic frequencies of the 7 microsatellite markers used to assess the genetic diversity of P. guajava in Montería can be observed in Table 5. A total of 46 alleles were found in the populations, with an average of 6.5 alleles for each of the analyzed loci. According to these data, it was possible to determine that the markers mPgCIR9 and mPgCIR13 had the highest number of alleles, each with 9, while the marker mPgCIR23 had the lowest number with 3 alleles.
The highest allelic frequencies were observed in allele 237 of marker mPgCIR19 and allele 203 of marker mPgCIR23, with a frequency of 1.000 in the Santa Lucia and Patio Bonito subpopulations, respectively. It is worth noting that these alleles were the only ones fixed in the population.
A total of 28 private alleles were identified in the Montería population, with Santa Lucia having the highest number at 11 alleles, followed by Patio Bonito with 9 and Maracayo with 8 alleles (Table 6).
Based on the results of the population genetic parameters (Table 7), an overall average of 3,286 alleles (Na), 2,482 effective alleles (Ne), 0.058 observed heterozygosity (Ho), 0.572 expected heterozygosity (uHe), and 0.906 fixation index (F) were determined by marker in each of the subpopulations.
The subpopulation that exhibited the highest values in terms of observed heterozygosity and expected heterozygosity was Patio Bonito, with an average of 0.107 and 0.621, respectively. On the other hand, Santa Lucia was the subpopulation with the lowest values, with an average of 0.016 and 0.501 for the two parameters.
Regarding the fixation index, the highest value was obtained in the Santa Lucia subpopulation, with an average of 0.974, while the Patio Bonito subpopulation had the lowest average value at 0.815.
In relation to Hardy-Weinberg equilibrium (HWE), the Patio Bonito subpopulation was the only one that exhibited markers in equilibrium, with a total of 4 markers.
Considering the results of the Polymorphic Information Content (PIC), it was determined that the marker mPgCIR22 had the highest value at 0.795, indicating that it is the most informative marker. Conversely, the marker mPgCIR23 had the lowest value at 0.443 (Table 8).
According to the results of Wright's F statistics (Table 9), it was determined that the lowest values of FIS and FIT were observed in the marker mPgCIR13, with values of 0.753 and 0.781, respectively. In contrast, the highest values were found in markers mPgCIR11, mPgCIR22, and mPgCIR23, each with a value of 1.000.
Regarding FST, it was determined that the marker contributing the most differentiation between the evaluated subpopulations is mPgCIR19 with a value of 0.522, while the marker mPgCIR13 contributes the least differentiation, with a value of 0.110.
As for the number of migrants (Nm), the lowest value was observed in the marker mPgCIR19 with a value of 0.229, and the highest value was found in the marker mPgCIR9 with a value of 1.591.
In Table 10, the Nei genetic distance matrix among the studied subpopulations can be observed. Based on this matrix, it was determined that Patio Bonito and Santa Lucia are the subpopulations with the greatest differences (2.000).
In the dendrogram (Figure 1), you can observe the genetic relationships that exist between the studied subpopulations, showing that Patio Bonito and Maracayo are genetically closer, while Santa Lucia is more distant from the other populations.
In Figure 2, you can find the Delta K values, which helped determine the different genetic groups, indicating that a value of K=2 is the number of genetic groups that best fit the data.
Similarly, you can observe two genetic groups represented by the colors red and green. In the first genetic group (green), the subpopulations of Patio Bonito and Maracayo are included, as they are like each other. Santa Lucia is placed in the second genetic group (red), distinct from the other subpopulations.
4. Discussion
In the studied populations, the allelic frequencies had an average of 6.5 alleles per locus (Table 5). The allele frequency values found in this research are higher than those already reported by other researchers [9,10,11,12]. However, the allelic frequencies obtained in this study are lower than those previously reported by other researchers [13,14,15,16],. The difference in results may be due to the limited number of individuals used in the present study. A total of 46 alleles were identified, a figure that aligns with results already obtained [9]. This similarity could be attributed to the characteristic phenomenon of self-pollination in the species, that has perfect flowers favoring self-fertilization [17], as well as to the diversity of the populations investigated in both studies [13].
Private alleles are alleles exclusive to each subpopulation that have become fixed due to different evolutionary forces. This condition allows these subpopulations to respond favorably to environmental conditions as generations progress [18]. Additionally, the presence of these alleles indicates high genetic diversity. The number of private alleles detected in the current study (Table 6) It differs from those already reported, which found a total of three private alleles on Isla Isabela [19]. Although this study analyzed a larger number of individuals, it found a lower richness of private alleles compared to what was reported in the municipality of Montería.
The evaluated guava population had an average expected heterozygosity (uHe) of 0.572, and the observed heterozygosity (Ho) was lower, with a value of 0.058 (Table 7). These values were lower than others already reported [13,17,19]. The results of the guava accessions in Montería indicate low genetic diversity in the evaluated accessions, which can be explained by the effects of inbreeding resulting from the self-pollination of the species.
The average effective number of alleles (Ne) was 2,482, this value being lower than that already reported in Pakistan [16], higher than what was reported in India [9], and similar to that obtained in the United States [20].
The fixation index (F) had an overall average of 0.906 (Table 7), indicating that there is an excess of homozygotes in Montería. This could be attributed to the high rate of self-pollination in the species, which can reach up to 75% [21]. Inbreeding in populations increases the risk of losing alleles in subsequent generations, which, in turn, leads to a reduction in the genetic diversity of species over time [22].
According to the Hardy-Weinberg equilibrium (HWE), it was determined that the microsatellite markers of the Maracayo and Santa Lucia subpopulations exhibit significant differences (P-Value < 0.05 and P-Value < 0.01) between observed and expected genotypes. Similarly, in Patio Bonito, the markers mPgCIR13 and mPgCIR22 showed significant differences (Table 7). This reaffirms the deficit of heterozygotes in the studied population. This condition may be related to the species' mode of reproduction, as P. guajava tends to undergo self-pollination, leading to a significant reduction in the number of heterozygotes and, in turn, causing a loss in the genetic variability of a population [23].
PIC values greater than 0.50 indicate highly informative markers, values between 0.50 and 0.25 indicate moderately informative markers, and values less than 0.25 indicate slightly informative markers [24]. According to this classification, the markers mPgCIR9, mPgCIR11, mPgCIR13, mPgCIR16, mPgCIR19, and mPgCIR22 are highly informative (Table 8), while the marker mPgCIR23 is moderately informative. Estos resultados son similares a los ya reportados en Pakistán con valores superiores a 0,50 para los mismos marcadores [16].
Regarding Wright's F statistics, the fixation index of individuals with respect to subpopulations within a population (FIS) and the fixation index of individuals with respect to the total population (FIT) showed values of 0.895 and 0.926, respectively (Table 9). With these positive values, it can be indicated that there is a deficiency of heterozygotes in the studied population, this could be related to significant levels of consanguinity, indicating limited genetic variation in the population [25]. These results are similar to those reported in Córdoba, where values for FIS and FIT were detected, revealing a deficit of heterozygotes and high levels of homozygosity [26].
For the genetic differentiation index among populations (FST), an average value of 0.320 was obtained (Table 9). Values from 0.25 to 1 indicate very high genetic differentiation [27], suggesting that there is very high genetic differentiation in Montería. These results are similar to those reported in Córdoba, where it was determined that the studied municipalities exhibited a high degree of genetic differentiation [26]. Concerning the number of migrants (Nm), the average value was 0.885 (Table 9), indicating that there is a limited number of individuals moving between populations. In other words, there is little genetic flow or reproduction between the studied subpopulations of P. guajava. These results are similar to those described in Tierralta, Córdoba, where an average of 1,010 migrants is reported, revealing a limited flow of individuals [28].
With respect to the genetic structure, it was found that the best grouping of individuals occurs when there are two genetic groups (K=2). According to this result, Patio Bonito and Maracayo share the same genetic group in relation to Santa Lucia, as this subpopulation belongs to a different genetic group (Figure 1). These results are consistent with the genetic distance matrix and the dendrogram (Table 10; Figure 2), where it is evident that Patio Bonito and Maracayo are the subpopulations with shorter distances (1.066) and are genetically closer. These findings align with what has been reported in the Galapagos Islands, where genetic differentiation is observed when there are two genetic groups [29].
5. Conclusions
The assessment of genetic diversity and variability in P. guajava in the municipality of Montería, Córdoba, using seven microsatellite markers, revealed that the guava population exhibited low genetic diversity within the studied subpopulations. This was evident through a high number of homozygotes and low levels of heterozygosity, likely resulting from inbreeding due to self-pollination. Additionally, it was determined that the markers mPgCIR9, mPgCIR11, mPgCIR13, mPgCIR16, mPgCIR19, and mPgCIR22 were highly informative, making them recommended for future research. Furthermore, it was observed that P. guajava populations did not follow the Hardy-Weinberg equilibrium in the subpopulations of Maracayo and Santa Lucia. Likewise, it was established that the Patio Bonito and Maracayo subpopulations are genetically closer to each other compared to Santa Lucia. These results can be attributed to their geographic locations, as the first two subpopulations are closer to each other in terms of territory.
Author Contributions
Conceptualization, E.P.; methodology, E.P. and L.C.; investigation, E.P., E.R. and L.C.; statistical analysis, E.R.; writing—original draft preparation, E.P.; writing—review and editing, E.P., E.R. and L.C. All authors have read and agreed to the published version of the manuscript.
Funding
This work was carried out with the funding provided by the University of Córdoba (Project No. FCB-11-19).
Data Availability Statement
The data presented in this study are available within the article.
Conflicts of Interest
The authors declare no conflict of interest.
References
- Singh, G. Recent development in production of guava. Acta Hortic. 2007, 735, 161–176 https://. [Google Scholar] [CrossRef]
- Keith, L.; Velásquez, M.; Zee, F. Identification and characterization of pestalotiopsis spp. causing scab disease of guava, Psidium guajava, in Hawaii. Plant Dis. 2006, 90(1), 16–23. [CrossRef]
- Gutiérrez, R. M.; Mitchell, S.; Solis, R. Psidium guajava: a review of its traditional uses, phytochemistry and pharmacology. J. Ethnopharmacol., 2008, 117(1); 1–27. [CrossRef]
- Negi, S. S.; Rajan, S. Improvement of guava through breeding. Acta Hortic. 2007, 735, 31–37 https://. [Google Scholar] [CrossRef]
- Kumar, M.; Tomar, M.; Amarowicz, R., Saurabh, V.; Nair, M. S.; Maheshwari, C.; Sasi. M.; Prajapati, U.; Hasan, M.; Singh, S.; Changan, S.; Kumar, R.; Berwal, M.; Satankar, V. Guava (Psidium guajava L.) Leaves: Nutritional composition, phytochemical profile, and health-promoting bioactivities. Foods. 2021, 10(4), 752. [CrossRef]
- Minagricultura (Ministerio de Agricultura y Desarrollo Rural- Colombia). Cadena de la guayaba. 2021. https://sioc.minagricultura.gov.co/Guayaba/Documentos/2021-03-31%20Cifras%20Sectoriales.pdf. Bogotá, Colombia (accessed on August 17, 2023.
- Arce-Valdés, L. R.; Sánchez-Guillén, R. A.; Nolasco-Soto, J.; Favila, M. E. Next-generation sequencing, isolation and characterization of 14 microsatellite loci of Canthon cyanellus (Coleoptera: Scarabaeidae). Mol. Biol. Rep. 2021, 48(11), 7433–7441. [Google Scholar] [CrossRef]
- Risterucci, A.M.; Duval, M.F.; Rohde, W.; Billotte, N. Isolation and characterization of microsatellite loci from Psidium guajava L. Mol. Ecol. Notes. 2005, 5, 745–748. [Google Scholar] [CrossRef]
- Kumar, S.; Singh, A.; Yadav, A.; Bajpai, A.; Singh, N.K.; Rajan, S.; Mala, T.; Muthukumar, M. Identification and validation of novel genomic SSR markers for molecular characterization of guava (Psidium guajava L. ). S. Afr. J. Bot. 2023, 155, 79–89. [Google Scholar] [CrossRef]
- Kumar, C.; Kumar, R.; Singh, S.K.; Goswami, A.K.; Nagaraja, A.; Paliwal, R.; Singh, R. Development of novel g-SSR markers in guava (Psidium guajava L.) cv. Allahabad Safeda and their application in genetic diversity, population structure and cross species transferability studies. PLoS One. 2020, 15(8), e0237538. [CrossRef]
- Kherwar, D.; Usha, K.; Amitha, S.V.; Singh, B. Microsatellite (SSR) marker assisted assessment of population structure and genetic diversity for morpho-physiological traits in guava (Psidium guajava L.). J. Plant Biochem. Biotechnol. 2018, 27, 284–292. [Google Scholar] [CrossRef]
- Kareem, A.; Jaskani, M.; Mehmood, A.; Khan, I.; Awan, F.; Sajid, M. Morpho-genetic profiling and phylogenetic relationship of guava (Psidium guajava l.) as genetic resources in Pakistan. Rev. Bras. Frutic. 2018, 40, e–069. [Google Scholar] [CrossRef]
- De Oliveira Bernardes, C.; Tuler, A. C.; Canal, D.; Carvalho, M. S.; Ferreira, A.; Da Silva Ferreira, M. F. Genetic Diversity and Population Structure of Psidium Species from Restinga: A Coastal and Disturbed Ecosystem of the Brazilian Atlantic Forest. Biochem. Genet. 2022, 60(6), 2503–2514. [Google Scholar] [CrossRef] [PubMed]
- Reinoso Medina, A. Determinación de la diversidad genética de la guayaba Psidium guajava en Ecuador continental. Undergraduate Thesis. Universidad San Francisco de Quito. Quito. 2019. Available online: http://repositorio.usfq.edu.ec/handle/23000/11004. (accessed on October 20, 2023).
- Chiveu, J. Assessment of genetic and nutritional diversity, and salinity tolerance of Kenyan guava (Psidium guajava L.): an underutilized naturalized fruit species. Doctoral Thesis. University of Göttingen, Germany. 2018. Available online: https://d-nb.info/116423112X/34. (accessed on October 2, 2023).
- Mehmood, A.; Luo, S.; Ahmad, N.M.; Dong, C.; Mahmood, T.; Sajjad, Y.; Jaskani, M.J.; Sharp, P. Molecular variability and phylogenetic relationships of guava (Psidium guajava L.) cultivars using inter-primer binding site (iPBS) and microsatellite (SSR) markers. Genet. Resour. Crop Evol. 2016, 63, 1345–1361. [Google Scholar] [CrossRef]
- Kumari, S.; Arumugam, N.; Singh, R.; Srivastav, M.; Banoth, S.; Mithra, A.C.; Arun, M.; Kumar, G.; Khan, Y. Diversity analysis of guava (Psidium guajava) germplasm collection. Indian J. Agric. Sci. 2018, 88, 489–497. [Google Scholar] [CrossRef]
- Konzen, E.; Martins, M. Contrasting levels of genetic diversity among populations of the endangered tropical palm Euterpe edulis Martius. Cerne. 2017, 23(1), 31–42. [CrossRef]
- Espín, A. Diversidad genética de la guayaba (Psidium guajava) en la Isla Isabela. Undergraduate Thesis Universidad San Francisco de Quito. Quito. 2018. Available online: http://repositorio.usfq.edu.ec/handle/23000/743.
- Sitther, V.; Zhang, D.; Harris, D. L.; Yadav, A. K.; Zee, F. T.; Meinhardt, L. W.; Dhekney, S. A. (). Genetic characterization of guava (Psidium guajava L.) germplasm in the United States using microsatellite markers. Genet. Resour. Crop Evol. 2014, 61(4), 829–839. [CrossRef]
- Díaz-Cruz, J. A. Diversidade e estrutura genética de populações de Psidium guajava L. (Myrtaceae) oriundas do Brasil e do México. Master's Thesis. Universidad Estadual de Ponta Grossa. Paraná, 2016. Available online: https://www.researchgate.net/profile/Jesus-Diaz-Cruz/publication/365127722_DIVERSIDADE_E_ESTRUTURA_GENETICA_DE_POPULACOES_DE_Psidium_guajava_L_MYRTACEAE_ORIUNDAS_DO_BRASIL_E_DO_MEXICO/links/6365a08f2f4bca7fd0321835/DIVERSIDADE-E-ESTRUTURA-GENETICA-DE-POPULACOES-DE-Psidium-guajava-L-MYRTACEAE-ORIUNDAS-DO-BRASIL-E-DO-MEXICO.pdf.
- Pardo-Pérez, E.; Cavadía Martínez, T.; Cruz Cantero, A. Diversidad genética en humanos mediante polimorfismos de inserción de Alu en la población de San Pelayo, Córdoba (Colombia). Rev. Logos Cienc. Tecnol. 2019, 11(2), 86-92. [CrossRef]
- Sitther, V.; Zhang, D.; Harris, D. L.; Yadav, A. K.; Zee, F. T.; Meinhardt, L. W.; Dhekney, S. A. Genetic characterization of guava (Psidium guajava L.) germplasm in the United States using microsatellite markers. Genet. Resour. Crop Evol. 2014, 61(4), 829–839. [CrossRef]
- Botstein, D.; White, R. L.; Skolnick, M.; Davis, R. W. Construction of a genetic linkage map in man using restriction fragment length polymorphisms. Am. J. Hum. Genet. 1980, 32(3), 314–331. [Google Scholar] [PubMed]
- Hedrick, P.W. Genetics of Populations, 4th ed. Jones and Bartlett Publishers, Sudbury, Massachusetts. 2011. 675 pages.
- Begambre-Hernández, M. Diversidad y estructura genética de la guayaba dulce (Psidium guajava L.) evaluada mediante marcadores microsatélites en tres municipios de Córdoba-Colombia. Master's Thesis. Universidad de Córdoba. Montería. 2022. Available online: https://repositorio.unicordoba.edu.co/handle/ucordoba/6162.
- Hartl, D. (2000). A primer of Population Genetics and Genomics. 4th edition. Oxford University Press. Oxford. 287 pp.
- Gutiérrez Hernández, M. Diversidad genética y estructura poblacional de guayaba (Psidium guajava L.) en Tierralta, Córdoba-Colombia utilizando marcadores microsatélites. Undergraduate Thesis. Universidad de Córdoba. Montería. 2020. Available online: https://repositorio.unicordoba.edu.co/handle/ucordoba/2856.
- Urquía, D.; Gutierrez, B.; Pozo, G.; Pozo, M. J.; Espín, A.; Torres, M. de L. Psidium guajava in the Galapagos Islands: Population genetics and history of an invasive species. PLOS ONE, 2019, 14(3), e0203737. [CrossRef]
Figure 1.
Dendrogram of the genetic relationships among the P. guajava populations in Montería-Córdoba.
Figure 1.
Dendrogram of the genetic relationships among the P. guajava populations in Montería-Córdoba.
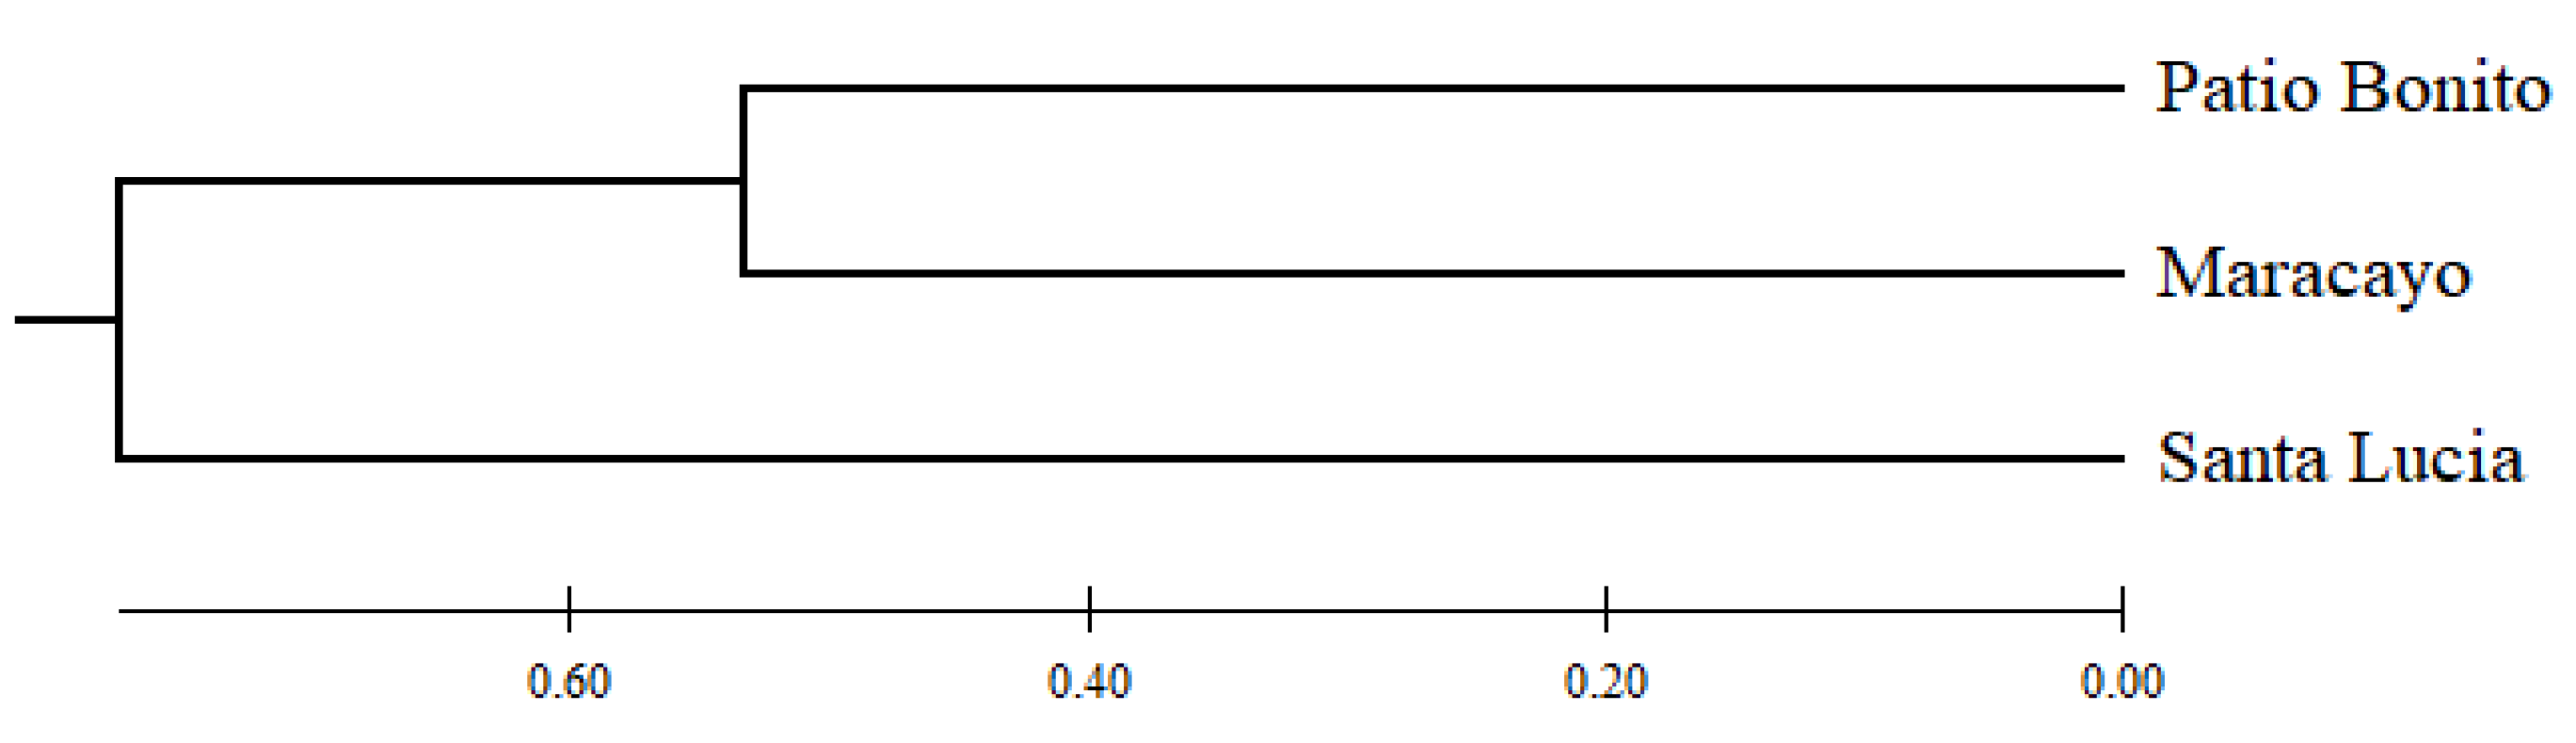
Figure 2.
Bayesian analysis of the genetic structure of P. guajava populations using Harvester Structure. A. Chart with Delta K values for two populations. B. Population genetic structure for k = 2.
Figure 2.
Bayesian analysis of the genetic structure of P. guajava populations using Harvester Structure. A. Chart with Delta K values for two populations. B. Population genetic structure for k = 2.
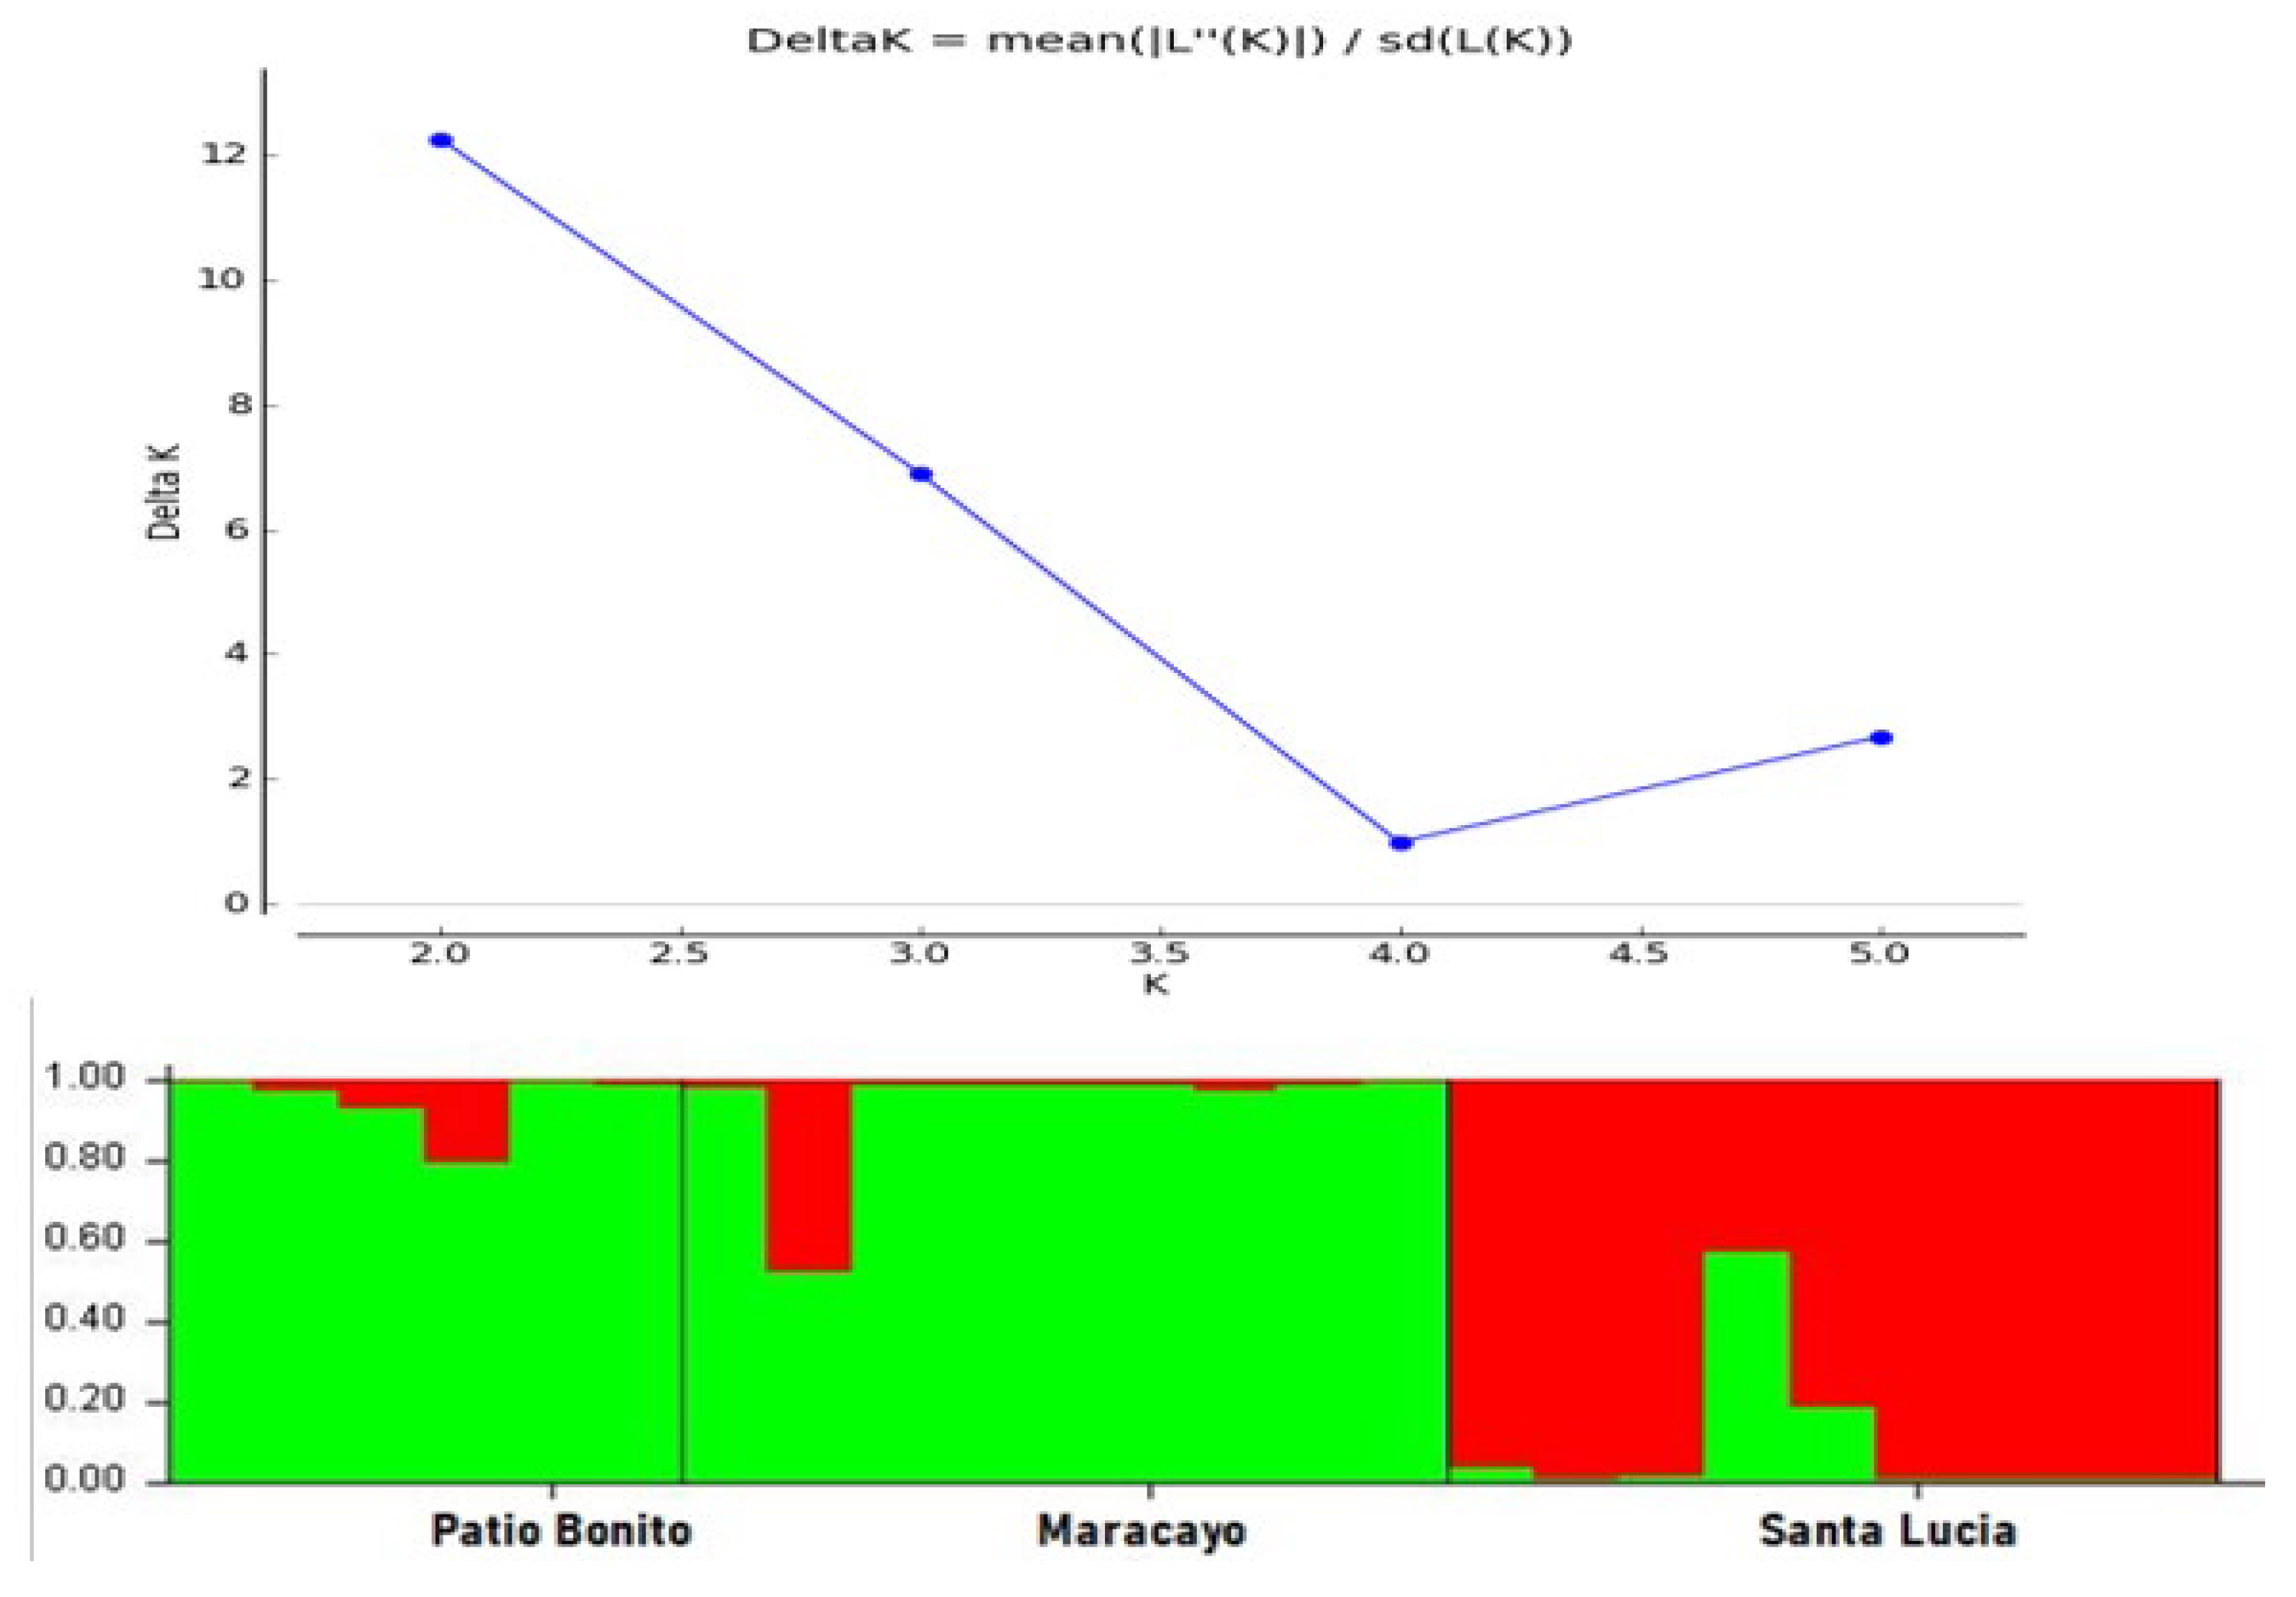

Table 1.
Coordinates of the study areas and number of individuals sampled in the municipality of Montería, Córdoba.
Table 1.
Coordinates of the study areas and number of individuals sampled in the municipality of Montería, Córdoba.
| Study zone | Sampled individuals | Latitude | Longitude | Altitude |
|---|---|---|---|---|
| Maracayo | 15 | 8° 24' 34" N | 75° 53' 27" W | 35 mamsl |
| Patio Bonito | 15 | 8° 47' 37" N | 75° 56' 4" W | 16 mamsl |
| Santa Lucia | 15 | 8° 37' 25" N | 75° 52' 15" W | 17 mamsl |
Table 2.
Primers of Psidium guajava L [8].
Table 2.
Primers of Psidium guajava L [8].
| Marker | Primer forward 5’ – 3’ | Primer reverse 5’ – 3’ |
|---|---|---|
| mPgCIR9 | GCGTGTCGTATTGTTTC | ATTTTCTTCTGCCTTGTC |
| mPgCIR11 | TGAAAGACAACAAACGAG | TTACACCCACCTAAATAAGA |
| mPgCIR13 | CCTTTTTCCCGACCATTACA | TCGCACTGAGATTTTGTGCT |
| mPgCIR16 | AATACCAGCAACACCAA | CATCCGTCTCTAAACCTC |
| mPgCIR19 | AAAATCCTGAAGACGAAC | TATCAGAGGCTTGCATTA |
| mPgCIR22 | CATAAGGACATTTGAGGAA | AATAAGAAAGCGAGCAGA |
| mPgCIR23 | GTCTATACCTAATGCTCTGG | CCCAGGAAAATCTATCAC |
Table 3.
PCR conditions for a volume per individual of 25 μl.
| Reagents | Stock concentration* | Individual concentration | Volume x one tube (μl) |
|---|---|---|---|
| DNA | 25 ng/ μL | 5 ng/ Μl | 5 |
| Enzyme | 5U/ μL | 0.05 U/ Μl | 0.25 |
| Primer Forward | 10 μM | 0.5 Μm | 1.25 |
| Primer Reverse | 10 μM | 0.5 Μm | 1.25 |
| dNTPs | 10 mM** | 0.2 Μm | 0.5 |
| Buffer | 10 X | 1 X | 2.5 |
| Water | ----------- | ---------- | 14.25 |
| Total | ----------- | ---------- | 25 |
Table 4.
PCR cycles performed for the amplification of the 7 molecular markers used.
| Temperature (°C) | Time | Number of cycles |
|---|---|---|
| 95° | 3 min | 1 |
| 61°-55° | 30 seg | 10 |
| 56° | 30 seg | 23 |
| 72° | 1 min | |
| 72° | 5 min | 1 |
Table 5.
Allelic frequencies of microsatellite markers used to assess genetic diversity in P. guajava in Montería-Córdoba.
Table 5.
Allelic frequencies of microsatellite markers used to assess genetic diversity in P. guajava in Montería-Córdoba.
| Locus | N° Allele | Allele | Patio Bonito | Maracayo | Santa Lucia |
|---|---|---|---|---|---|
| 161 | 0.000 | 0.143 | 0.000 | ||
| 163 | 0.000 | 0.143 | 0.000 | ||
| 166 | 0.167 | 0.143 | 0.000 | ||
| mPgCIR9 | 9 | 168 | 0.417 | 0.143 | 0.125 |
| 170 | 0.083 | 0.429 | 0.625 | ||
| 173 | 0.000 | 0.000 | 0.250 | ||
| 181 | 0.083 | 0.000 | 0.000 | ||
| 186 | 0.083 | 0.000 | 0.000 | ||
| 189 | 0.167 | 0.000 | 0.000 | ||
| 275 | 0.000 | 0.000 | 0.500 | ||
| 277 | 0.000 | 0.429 | 0.250 | ||
| mPgCIR11 | 6 | 280 | 0.250 | 0.143 | 0.000 |
| 283 | 0.250 | 0.429 | 0.250 | ||
| 286 | 0.250 | 0.000 | 0.000 | ||
| 295 | 0.250 | 0.000 | 0.000 | ||
| 224 | 0.000 | 0.250 | 0.000 | ||
| 227 | 0.083 | 0.063 | 0.000 | ||
| 229 | 0.167 | 0.188 | 0.000 | ||
| 232 | 0.500 | 0.375 | 0.167 | ||
| mPgCIR13 | 9 | 235 | 0.000 | 0.000 | 0.111 |
| 236 | 0.167 | 0.000 | 0.444 | ||
| 239 | 0.083 | 0.063 | 0.000 | ||
| 241 | 0.000 | 0.063 | 0.222 | ||
| 244 | 0.000 | 0.000 | 0.056 | ||
| 240 | 0.375 | 0.000 | 0.000 | ||
| 246 | 0.000 | 0.857 | 0.000 | ||
| 254 | 0.000 | 0.000 | 0.800 | ||
| mPgCIR16 | 7 | 256 | 0.125 | 0.000 | 0.000 |
| 270 | 0.500 | 0.000 | 0.000 | ||
| 274 | 0.000 | 0.000 | 0.200 | ||
| 281 | 0.000 | 0.143 | 0.000 | ||
| 237 | 0.000 | 0.000 | 1.000 | ||
| 250 | 0.000 | 0.500 | 0.000 | ||
| mPgCIR19 | 5 | 254 | 0.333 | 0.333 | 0.000 |
| 257 | 0.667 | 0.111 | 0.000 | ||
| 269 | 0.000 | 0.056 | 0.000 | ||
| 229 | 0.000 | 0.000 | 0.500 | ||
| 233 | 0.000 | 0.000 | 0.375 | ||
| 238 | 0.250 | 0.125 | 0.000 | ||
| mPgCIR22 | 7 | 241 | 0.000 | 0.625 | 0.000 |
| 252 | 0.000 | 0.000 | 0.125 | ||
| 254 | 0.250 | 0.000 | 0.000 | ||
| 259 | 0.500 | 0.250 | 0.000 | ||
| 203 | 1.000 | 0.250 | 0.143 | ||
| mPgCIR23 | 3 | 206 | 0.000 | 0.750 | 0.714 |
| 210 | 0.000 | 0.000 | 0.143 | ||
Table 6.
Private Alleles Identified in the P. guajava populations in Montería-Córdoba.
| Pop | Locus | Allele | Frecuencia |
|---|---|---|---|
| Patio Bonito | mPgCIR9 | 181 | 0.083 |
| Patio Bonito | mPgCIR9 | 186 | 0.083 |
| Patio Bonito | mPgCIR9 | 189 | 0.167 |
| Patio Bonito | mPgCIR11 | 286 | 0.250 |
| Patio Bonito | mPgCIR11 | 295 | 0.250 |
| Patio Bonito | mPgCIR16 | 240 | 0.375 |
| Patio Bonito | mPgCIR16 | 256 | 0.125 |
| Patio Bonito | mPgCIR16 | 270 | 0.500 |
| Patio Bonito | mPgCIR22 | 254 | 0.250 |
| Maracayo | mPgCIR9 | 161 | 0.143 |
| Maracayo | mPgCIR9 | 163 | 0.143 |
| Maracayo | mPgCIR13 | 224 | 0.250 |
| Maracayo | mPgCIR16 | 246 | 0.857 |
| Maracayo | mPgCIR16 | 281 | 0.143 |
| Maracayo | mPgCIR19 | 250 | 0.500 |
| Maracayo | mPgCIR19 | 269 | 0.056 |
| Maracayo | mPgCIR22 | 241 | 0.625 |
| Santa Lucia | mPgCIR9 | 173 | 0.250 |
| Santa Lucia | mPgCIR11 | 275 | 0.500 |
| Santa Lucia | mPgCIR13 | 235 | 0.111 |
| Santa Lucia | mPgCIR13 | 244 | 0.056 |
| Santa Lucia | mPgCIR16 | 254 | 0.800 |
| Santa Lucia | mPgCIR16 | 274 | 0.200 |
| Santa Lucia | mPgCIR19 | 237 | 1.000 |
| Santa Lucia | mPgCIR22 | 229 | 0.500 |
| Santa Lucia | mPgCIR22 | 233 | 0.375 |
| Santa Lucia | mPgCIR22 | 252 | 0.125 |
| Santa Lucia | mPgCIR23 | 210 | 0.143 |
Table 7.
Population genetic parameters assessed in the populations of Montería-Córdoba.
| Population | Locus | Na | Ne | Ho | uHe | F |
|---|---|---|---|---|---|---|
| mPgCIR9 | 6.000 | 4.000 | 0.333 | 0.818 | 0.556ns | |
| mPgCIR11 | 4.000 | 4.000 | 0.000 | 0.857 | 1.000ns | |
| Patio | mPgCIR13 | 5.000 | 3.130 | 0.167 | 0.742 | 0.755** |
| Bonito | mPgCIR16 | 3.000 | 2.462 | 0.250 | 0.679 | 0.579ns |
| mPgCIR19 | 2.000 | 1.800 | 0.000 | 0.533 | 1.000ns | |
| mPgCIR22 | 3.000 | 2.667 | 0.000 | 0.714 | 1.000* | |
| mPgCIR23 | 1.000 | 1.000 | 0.000 | 0.000 | ----- | |
| Average | 3.429 | 2.723 | 0.107 | 0.621 | 0.815 | |
| mPgCIR9 | 5.000 | 3.769 | 0.000 | 0.791 | 1.000** | |
| mPgCIR11 | 3.000 | 2.579 | 0.000 | 0.659 | 1.000** | |
| mPgCIR13 | 6.000 | 4.000 | 0.250 | 0.800 | 0.667** | |
| Maracayo | mPgCIR16 | 2.000 | 1.324 | 0.000 | 0.264 | 1.000** |
| mPgCIR19 | 4.000 | 2.656 | 0.111 | 0.660 | 0.822** | |
| mPgCIR22 | 3.000 | 2.133 | 0.000 | 0.567 | 1.000** | |
| mPgCIR23 | 2.000 | 1.600 | 0.000 | 0.429 | 1.000* | |
| Average | 3.571 | 2.580 | 0.052 | 0.596 | 0.927 | |
| mPgCIR9 | 3.000 | 2.133 | 0.000 | 0.567 | 1.000** | |
| mPgCIR11 | 3.000 | 2.667 | 0.000 | 0.714 | 1.000* | |
| Santa | mPgCIR13 | 5.000 | 3.447 | 0.111 | 0.752 | 0.843** |
| Lucia | mPgCIR16 | 2.000 | 1.471 | 0.000 | 0.356 | 1.000* |
| mPgCIR19 | 1.000 | 1.000 | 0.000 | 0.000 | ----- | |
| mPgCIR22 | 3.000 | 2.462 | 0.000 | 0.633 | 1.000** | |
| mPgCIR23 | 3.000 | 1.815 | 0.000 | 0.484 | 1.000** | |
| Average | 2.857 | 2.142 | 0.016 | 0.501 | 0.974 | |
| Total | 3.286 | 2.482 | 0.058 | 0.572 | 0.906 | |
| Na: Number of alleles; Ne: Effective number of alleles; Ho: Observed heterozygosity; uHe: Unbiased expected heterozygosity; F: Fixation index; HWE: Hardy-Weinberg Equilibrium (ns: not significant *: P-Value < 0.05 **: P-Value < 0.01). | ||||||
Table 8.
Polymorphic Information Content (PIC) estimated for each marker in the Montería-Córdoba population.
Table 8.
Polymorphic Information Content (PIC) estimated for each marker in the Montería-Córdoba population.
| Locus | PIC |
|---|---|
| mPgCIR9 | 0.738 |
| mPgCIR11 | 0.740 |
| mPgCIR13 | 0.787 |
| mPgCIR16 | 0.732 |
| mPgCIR19 | 0.713 |
| mPgCIR22 | 0.795 |
| mPgCIR23 | 0.443 |
Table 9.
Wright's F statistics used to assess P. guajava populations in Montería-Córdoba.
| Locus | FIS | FIT | FST | Nm |
|---|---|---|---|---|
| mPgCIR9 | 0.835 | 0.857 | 0.136 | 1.591 |
| mPgCIR11 | 1.000 | 1.000 | 0.166 | 1.256 |
| mPgCIR13 | 0.753 | 0.781 | 0.110 | 2.024 |
| mPgCIR16 | 0.784 | 0.895 | 0.514 | 0.236 |
| mPgCIR19 | 0.896 | 0.950 | 0.522 | 0.229 |
| mPgCIR22 | 1.000 | 1.000 | 0.294 | 0.600 |
| mPgCIR23 | 1.000 | 1.000 | 0.495 | 0.255 |
| Media | 0.895 | 0.926 | 0.320 | 0.885 |
| FIS: individual fixation index with respect to subpopulations within a population; FIT: individual fixation index with respect to the total population.; FST: genetic differentiation coefficient among subpopulation; Nm: number of migrants per generation. | ||||
Table 10.
Nei genetic distance matrix evaluated among the studied populations.
| A | B | C | |
|---|---|---|---|
| A | 0.000 | ||
| B | 1.066 | 0.000 | |
| C | 2.000 | 1.096 | 0.000 |
| A: Patio Bonito; B: Maracayo; C: Santa Lucia | |||
Disclaimer/Publisher’s Note: The statements, opinions and data contained in all publications are solely those of the individual author(s) and contributor(s) and not of MDPI and/or the editor(s). MDPI and/or the editor(s) disclaim responsibility for any injury to people or property resulting from any ideas, methods, instructions or products referred to in the content. |
© 2023 by the authors. Licensee MDPI, Basel, Switzerland. This article is an open access article distributed under the terms and conditions of the Creative Commons Attribution (CC BY) license (http://creativecommons.org/licenses/by/4.0/).
Copyright: This open access article is published under a Creative Commons CC BY 4.0 license, which permit the free download, distribution, and reuse, provided that the author and preprint are cited in any reuse.


