
Submitted:
24 November 2023
Posted:
27 November 2023
You are already at the latest version
Abstract
Urban Green Space (UGS) has important impacts on human health, but an integrated participatory approach to UGS design for improved residents’ health was lacking to date. The aim of our study was to develop and evaluate such a novel approach to address this gap. The approach was developed following guiding principles from the literature, and tested with groups of children and elderly as participants in two neighborhoods of Maastricht (The Netherlands) with a low score on economic and health indicators. Novel aspects of the approach are the inclusion of both positive and negative health effects, the combination of participant self-assessment and model-based assessment of the health effects of UGS designs, and the use of maps to visualize UGS designs and health effects. The participant-generated UGS designs resulted in a considerable self-assessed increase in use of the UGS for meeting, stress reduction or leisure-based physical activity, as compared to the current situation. The model-assessed positive and negative health effects of the participant-generated UGS designs were limited. The major strength of the developed approach is that it combines active participation of residents in UGS (re)design with assessment of the health effects of these UGS designs. Whereas in other participatory approaches to UGS design it often remains unclear whether the resulting designs represent an improvement in terms of health, our combination of computer model-based assessment and a participatory process produced clear outcomes regarding the health benefits and use of UGS designs.
Keywords:
Spatial model
; Urban Green Space
; Human health
; Ecosystem services
; Ecosystem disservices
; Participatory design
; GIS
; Quantitative assessment
1. Introduction
In the last decade, various national and international organizations working on the theme of the ‘healthy city’ have stressed the importance of the role that Urban Green Space (UGS) plays through the provision of ecosystem services for human health. The WHO regional office for Europe, for example, presented the various benefits and burdens of urban green (WHO Regional Office for Europe, 2016) and the effects of UGS-based interventions (WHO Regional Office for Europe, 2017). In the same decade, review studies have shown that strong positive relationships exist between the amount of UGS and people's health (Bowler et al., 2010; Gascon et al., 2016; Hartig et al., 2014; James et al., 2015; Kondo et al., 2018; Lee & Maheswaran, 2011; Lovell et al., 2018; Rigolon et al., 2018; Van den Berg et al., 2015; Van den Bosch & Sang, 2017; Völker & Kistemann, 2011). Practical UGS design principles for city planners to implement the result of such studies and reap the health benefits, are also available (Abhijith et al., 2017; Bodnaruk et al., 2017; Gehrels et al., 2016; Hiemstra, 2018). At the same time, it has become more common to involve citizens in designing of UGS. This last development has the potential to ‘seal the deal’ by combining general UGS design principles with location-specific knowledge and preferences of residents, and, in this way, to come to an effective and broadly accepted UGS design for neighborhoods or cities. Another recent development is to combine a participatory approach with mapping, with which in this context we mean acquiring spatially-explicit data, storing spatial designs or presenting assessment results on a map. Mapping is not only useful for identifying place-specific use and valuation of public spaces, but also for spatially-explicit problem identification, prioritization, and communication (Brown et al., 2018; Maes et al., 2013).
Reviews and overviews of studies on participatory approaches to planning of UGS, show that these studies often focus on specific aspects, for example on the types of street design features, the types of UGS benefits assessed, or the different ways in which actors are involved (Brown & Fagerholm, 2015; Brown et al., 2018; Hassen & Kaufman, 2016; van der Jagt et al., 2017). An analysis of studies published in the last decade indicates that integrated approaches are not yet available (Appendix A). Inclusion of multiple health benefits and the use of mapping are fairly common, but other elements of an integrated approach are often lacking. Firstly and mostly, this concerns the omission of health-related burdens. Secondly, impact assessment and redesign of UGS are often not included, let alone their combination: assessment of the health-related impacts of new UGS designs produced in a participatory process.
Concerning assessment of health-related impacts in a participatory approach to UGS design, it can be argued that a combination of participant self-assessment and expert- or model-based assessment would be preferable. On the one hand, UGS-health assessments based on expert judgment, measurements and/or computer models can quantify effects that are not directly observable by residents. On the other hand, a participatory process can include subjective factors and a more accurate representation of resident exposure to UGS effects. After all, residents are the local experts of how they themselves use the UGSs of their residential surroundings, as well as on a number of health-related effects of that UGS. Examples of such effects are effects on mental health, the amount of physical activity, social encounters with other residents, but sometimes also more biophysical effects such as heat stress. Finally, a participatory approach may lead to more involvement and perhaps even empowerment of residents and other stakeholders (Literat, 2013; Saadallah, 2020; Zhou et al., 2016).
Regarding quantification of health effects of UGS that are not directly observable by residents, several computer models exist to aid in city-scale spatial decision-making. Such computer models would also benefit from being embedded in a participatory approach, as this may yield more reliable or more detailed input data. Regarding the output of the model, it could lead to better understanding of and more agreement on model results by residents and other stakeholders, which may lead to more acceptance of spatial redesign decisions. There is a vast body of literature available that describes participatory modeling approaches (Jordan et al., 2018; Mendoza & Prabhu, 2005; Sterling et al., 2019). However, such approaches do not exist for the UGS-health theme, and in general, very few publications have focused on geospatial participatory modeling (Vukomanovic et al., 2019).
In sum, an integrated participatory approach to UGS design to improve residents’ health is currently lacking. Key elements to be integrated are attention for health-related burdens in addition to benefits, and a focus on assessment of the health-related impacts of UGS designs using a combination of self-assessment and spatial modelling in addition to the use of mapping. To address this gap, the aim of our study was to develop and evaluate such an integrated, novel approach to support participatory design of UGS to improve residents’ health.
In the next section, we describe the development of the approach and testing in two neighborhoods in the city of Maastricht (The Netherlands), and the role of a computer model (Oosterbroek et al., 2023) in this approach. We also explain our evaluation framework and its application to the developed approach. In the subsequent section, we report on the results of both the implemented approach and its evaluation. In the final section, we discuss the major strengths and weaknesses of the approach, provide recommendations for possible improvements and needs for further research, and end with a conclusion on its key contribution.
2. Methods
In this section, we describe the development of a novel approach to participatory design of UGS for beneficial health effects, followed by a description of how this approach was implemented and tested.
2.1. Developing a Novel Approach for Participatory Design of Urban Green Space
This section describes the development of the novel approach in two phases: formulation of ‘guiding principles’ and translation of these principles into process steps for participatory design. The guiding principles related to the need to assess a wide spectrum of effects (principle 1), as well as the need to assess both positive and negative health effects of Urban Green Space (principle 2) mainly stem from the stressed importance of being able to identify synergies and tradeoffs (Gonzalez-Ollauri & Mickovski, 2017; Roman et al., 2021). Guiding principles related to stimulating participants to feel personally connected to the effects (principle 3) and making impacts tangible (principle 5) were chosen because they make identification of challenges by participants less abstract, and they may advance information transfer, social learning and idea exchange (Ravera et al., 2011; Vukomanovic et al., 2019). Guiding principles related to dividing roles in estimating health effects (principle 4) and making full use of the capabilities of the participants (principle 7) were chosen as participants may possess reliable information on expected effects and useful insights on design that is actually implementable (Al-Kodmany, 2001; Reed, 2008; Usón et al., 2016). Principle ‘allow participants to adapt their design’ (principle 6) was included because participants can in this way contribute to checking for unwanted side effects of a plan, but also because taking their possible concerns about initial results into account at an early stage may increase the likelihood that local needs and priorities are successfully met (Dougill et al., 2006; Vukomanovic et al., 2019). Finally, the principle to involve decision makers throughout the process (principle 8) was chosen because in this case participants can more fully understand the broader problem that decision-makers would like to address (Reed, 2008; Vukomanovic et al., 2019).
2.1.1. Guiding Principles to Develop the Approach
1. Assess a wide spectrum of health effects of Urban Green Space
It often is the broad range of health effects of UGS that make their overall effect on health significant. Regarding mental health, systematic reviews have found strong evidence for positive relationships between the amount of UGS and perceived (self-assessed) mental health effects (Van den Berg et al., 2015). Stress reduction is often mentioned as a health-related benefit of UGS. A green living environment also invites people to meet, which is important for increasing social cohesion and thus for reducing loneliness (de Vries et al., 2013). The precise mechanisms are still unclear and whether, for example, meeting can be increased with more green space. Concerning the effect of urban green on physical activity, reviews also report positive associations, both for actual and self-reported physical activity (James et al. 2015; Kondo et al., 2018). Other health benefits of UGS are stress reduction through a view of urban green (Honold et al., 2015). Certain types and compositions of UGS also encourage people to travel by bicycle or on foot more often or for longer distances, to destinations such as to work and shops, or for recreation (‘active transport’) (Bancroft et al., 2015). This leads to, among other things, less obesity and less cardiovascular disease (Warburton et al., 2006). Examples of UGS benefits to which city residents are more passively exposed are heat stress decrease and air pollution decrease (Abhijith et al., 2017; Aram et al., 2019; Yu et al., 2020). Cooling by vegetation in cities with heat island effects leads to less heat stress and fewer deaths, especially among the elderly and during heat waves (Wong et al., 2013). Finally, air pollution decrease through vegetation leads to fewer cardiovascular and respiratory diseases, among other effects (Anderson et al., 2012; Pelucchi et al., 2009).
In addition to representing the actual overall health effects more truthfully, there may be other advantages of a more comprehensive assessment. Local decision makers will often focus on a limited number of specific health effects that are most relevant to them, for example based on city-specific problems or national legislation. If all or most of these effects are included in the assessment, they will consider the approach more relevant. A similar reasoning could hold for participants of the approach such as residents.
2. Assess both positive and negative health effects of Urban Green Space
UGSs can also have negative effects on human health. Vegetation in the vicinity of emissions can trap the polluted air, which can lead to more cardiovascular diseases (Abhijith et al., 2017). Trees and shrubs can in some places block the view of crossing cyclists and pedestrians and thus cause traffic accidents (Wolf, 2006). Certain compositions of UGS can be a suitable habitat for ticks, which are a major disease vector (Gassner et al., 2016a), leading to more cases of Lyme disease (Sprong et al., 2018). Finally, fear of crime in parks with less visibility, surveillance or other features that are considered unsafe (Pánek et al., 2017), can lead to other negative psychological effects. Such health-related burdens should be taken into account as well, in order to make a more balanced assessment of the (net) health effects of UGS.
3. Stimulate participants to feel personally connected to the effects of Urban Green Space
If the participants of the approach feel personally connected to the problems and their possible solutions, they may try to understand the issues better, possibly leading to more accurate input. Moreover, their engagement in the process may increase, as well as the likelihood that they will be present at all sessions (Vukomanovic et al., 2019). To achieve this, it is important to delimit the problem and the solutions to a scale that is still comprehensible for the participants.
4. Health effects best estimated by expert methods must be estimated by experts, and health effects best estimated by self-assessment must be estimated by participants
Some health benefits of UGS can be achieved without conscious contact with or being within UGS. Examples are the benefits of attractive views and active transport (mediated respectively through a more stress-reducing view, and attenuation or drowning out of traffic noise). Examples of UGS benefits to which city residents are even more passively exposed are heat stress decrease and air pollution decrease. A large park can cool the air up to hundreds of meters away in the city through evaporation of water (Monteiro et al., 2016; Theeuwes et al., 2017). Air at some distance of UGS can be sheltered from air pollution, for example along footpaths adjacent to busy roads (Abhijith et al., 2017). These types of health benefits are difficult for residents to assess, and could be better assessed with expert methods, such as measurements, standardized analyses, computer models or expert consultation.
Conversely, the extent to which health improves through stress-reducing, meeting and physical activity in green space largely depends on whether residents are actually ‘engaged’ in that green space (Hartig et al., 2014). Appreciation of UGSs by residents and the resulting intensity of use then plays a major role in the magnitude of the health effect. These effects are harder to estimate through expert methods due to variation in personal preferences and lack of readily available data, at least concerning appreciation and use of new UGS designs. In contrast, current or future use of an UGS design to achieve these health effects will be something that residents themselves can estimate relatively accurately.
5. Make impacts of user designs tangible for the participants
When UGS designed by participant-users are assessed with expert methods, impacts may by default be expressed in a less intuitive metric (for example μg/m3 of an air pollutant), or on a spatial scale that is less relevant to the resident (for example city-wide scale). It is therefore important to ensure that these impacts are presented to the participants such that they get a feeling for the magnitude of the impact.
6. Allow participants to adapt their design
After the participants are informed about the impact of their design, they should be given the possibility to adapt it. Adaptation may aim at, for example, reducing an undesirable health-related burden, or increasing an additional health-related benefit that wasn’t taken into account when creating the initial UGS design. This possibility may not only lead to co-design of better UGS solutions, but may also increase the acceptance of the final UGS designs, for example because the participants now have a better idea of why a certain compromise was necessary.
7. Make full use of the capabilities of the participants
Participants such as residents cannot only contribute by sufficiently reliably assessing certain health effects for both the current situation and the proposed redesigned situation (principle 4): they are also able to design desired UGS compositions that form such alternative scenarios. These two different contributions should be efficiently combined whilst guiding the participants through the steps of the participatory process.
8. Involve decision makers throughout the process
Direct involvement of decision makers (representatives of the local government responsible for urban planning) will likely be the most effective way to communicate the results of the process. In addition, decision makers may learn about the applied approach and the degree to which this approach improved the relation of the participant (e.g. resident, local entrepreneur) with the local government. Also, learning firsthand about resident-estimated use and health effects of public spaces, may be a relevant result for the decision maker. Such insights may make the decision maker more involved in the process and its follow-up as well.
2.1.2. Suggested Process Steps of the Approach
When placed in a logical order, the guiding principles take shape as the steps of a participatory process as shown in Table 1. Guiding principles 1 and 2 about a comprehensive set of health effects were addressed in preparatory Step 1 of the approach. Stimulating personal connectedness of participants (principle 3) was addressed in Step 2 by a neighborhood walk, and in Step 3 by specifying the design session. In Step 3, more specifically, areas of interest were marked, making it easier for participants to connect places that they had visited with places on the map. The neighborhood walk also served to make participants more acquainted and more similarly acquainted to the area to be assessed, and possibly trigger initial ideas of redesign. The participants were informed of these goals of the walk beforehand. Guiding principle 4 to 8 are (amongst other principles) addressed in Step 4 to 8 respectively.
During the expert assessment of Step 5, the assessment method would be more suitable if the effect of spatial factors other than UGS (such as location and composition of buildings and infrastructure) can be estimated as well. This is because residents may add elements in their design which are not UGS, but which they do consider important for their well-being or for their motivation to participate. Similarly, experts may consider non-UGS adaptations to be necessary to realize participant UGS designs. If in Step 5 there are no threshold values available to distinguish what is and what is not a health-relevant benefit or burden, then ‘health impact hotspots’ within the areas of interest can be selected: areas with the lowest benefit and highest burden values for each of the health-related benefits and burdens assessed by the expert method.
Note that between Step 7 (participant self-assessed health score) and Step 8 (report results to local decision makers), there is the option to iterate Steps 4 to 7 and thus re-asses the neighborhood designs after correction. This iteration would place a stronger emphasis on guiding principle 6 (possibility for participants to adapt their design).
2.2. Testing the Developed Approach in Two Neighborhoods of Maastricht
This section describes the neighborhood selection process, the implementation of the developed approach in the selected neighborhoods and the development of a framework to evaluate the approach.
2.2.1. Selecting Neighborhoods, Focus Areas and Participants
Certain groups appear to benefit more from nearby green spaces than others. This applies to children, young people and the elderly (Kabisch et al., 2017). Reasons include that these population groups are more vulnerable, and that they spend on average more time in their immediate living environment. Also people with a low socio-economic status appear to benefit more from nearby green. They are more likely to have an unhealthy lifestyle, which means that more health gains can be achieved in this group (WHO Regional Office for Europe, 2016). We selected two from among the most vulnerable neighborhoods in Maastricht. The selection was made on the basis of socio-economic status, health of the residents and amount of green space in the neighborhood (Box 1). For 27 neighborhoods within the built-up area of Maastricht, the values of the various indicators were summed (Appendix B). Two neighborhoods (Figure 1) were chosen that both score low on socio-economic status and health, but that vary considerably in the amount of green space: Pottenberg, with relatively much green space, and Wittevrouwenveld, with relatively little green space. Moreover, one neighborhood is located in Maastricht-East (Pottenberg) and one in Maastricht-West (Wittevrouwenveld).
After selecting the neighborhoods, we focused on the target group children and the elderly within those neighborhoods. We investigated which primary schools, children's activities, clubs and organized activities for the elderly exist in these neighborhoods. In each neighborhood, at least one children's group and a group of adults were selected and found willing to participate in the study (Table 2). Seven focus areas were then determined for each selected neighborhood. These are somewhat larger public areas that could be 'greened' or where adaptation of the existing green space was possible.
Box 1. Indicators used to select neighborhoods in Maastricht. High values for the socio-economic status and health indicators increase the chance of neighborhood selection. Data sources: 1 = CBS 2018, 2 = GGD Zuid Limburg 2018 (Health Monitor Adults and Elderly 2016, data 19+), 3 = Images of the Netherlands 2018-CIR aerial photo (Beeldmateriaal Nederland, 2018).
-
Socio-economic status
- -
- % Households below the social minimum1
- -
- % Households with a social assistance benefit (allowance)1
- -
- % Households that has difficulty getting by (making ends meet, self-assessed)2
- -
- Average income per resident (value inverted for scoring)1
-
Health
- -
- % At risk of anxiety disorder2
- -
- % Good perceived health (self-assessed, value inverted for scoring)2
- -
- % Socially excluded2
- -
- % Lonely2
- -
- % Overweight2
- -
- % Meets movement norm (value inverted for scoring)2
-
Urban Green Space
- -
- Green index3
- -
- Quantity average reachable green3
- -
- % Green under management of municipality3
2.1.2. Implementation of the Developed Approach in Two Neighborhoods of Maastricht
Step 1: choose a set of health effects to assess and decide how to assess each health effect
For testing the approach, we report on a selection of seven health-related benefits and four health-related burdens and their related ecosystem service (Table 3). We assumed that the following of these health determinants are best estimated by computer modeling: the benefits of 'air pollution decrease' and 'active transport', as well as the burdens of 'air pollution increase' and 'tick-bite increase'. Furthermore, we assumed that specifically for new UGS designs also the benefits of 'decreased heat stress' and 'decreased unattractive views', as well as the burdens of ‘increased perceived (social) unsafety’ and 'traffic accidents increase' are difficult to assess by residents and are best estimated by computer modeling. With the computer model (Oosterbroek et al., 2023) we planned to make a quantitative estimate of the current state benefits and burdens as well as the change therein based on the initial UGS designs (Step 5). Conversely, we assumed that residents best estimate the following health effects of both current and new UGS design: the benefits of 'meeting opportunities', 'leisure-based physical activity', and 'stress reduction opportunities'.
Step 2: orienting neighborhood walks
In February and March 2019, we held a meeting of approximately two hours within each group individually. During this meeting, the purpose of the research was first explained, followed by a walk of approximately 45 minutes through the neighborhood. Upon return to the meeting location, the participants were asked to contribute to new greenspace designs.
Step 3: first design session
Neighborhood maps were constructed that included a buffer zone of 500 m around the neighborhood borders. This was done because this is the distance at which green space and other factors can still have an effect on the health benefits and burdens within a neighborhood and because the elderly and children who live on the outskirts of the neighborhood also use these places. The areas managed by the municipality where there were no buildings, water or trees were left blank (white) on the maps, as places for possible extra UGS. These are often lawns or roads, but can also be, for example, a parking lot, football field or playground. The UGS managed by the municipality was indicated with a green (transparent) marking, because this can possibly be ‘removed’ in the participants’ design. Participants could (re)design UGS by indicating on the map of the neighborhood with various materials (markers and post-its) how green spaces could be changed, so that they would be used more and better for meeting, sports or play, and stress reduction. Participant design focused on the seven preselected areas in each neighborhood, sometimes supplemented with areas that the participants themselves indicated as benefitting from a UGS redesign.
Step 4: pre-processing participant Urban Green Space designs for expert assessment
The drawings and notes on the map, made by the participants during the design sessions were digitally incorporated in a GIS map, using the software ArcGIS (Esri). Drawn or indicated trees, shrubs, herbs, flowers and grass and paths were created as polygon features and categorized as such. In addition, drawn or indicated non-green features were also digitized: hills, bridges and groups of natural objects (tree trunks, stepping stones). These initial designs were then spatially extrapolated within the neighborhood area and its buffer zone. This means that where areas similar to the focus areas occurred, the same design elements were added or removed.
Step 5: expert assessment for both current Urban Green Space and Urban Green Space design situation
The 'extrapolated initial neighborhood designs' (from here on called 'initial neighborhood designs') were used as input for the spatial computer model EcoMATCH. The approach followed to model health benefits and burdens of UGS with this computer model is documented in Oosterbroek et al. (2023). For the model application in this study, two model modules were developed in addition to the modules already described in that study: modules ‘Active transport’ and ‘Traffic unsafety’. In line with Oosterbroek et al. (2023), Appendix C presents both these modules in detail, including all parameter values and sources used. By applying this approach, the influence of the neighborhood designs on the health-related exposures as listed in Table 3 was quantitatively assessed. First, the model was run for the eight health-related benefits and burdens that were deemed best estimated by the method of computer modeling for the current UGS situation in both neighborhoods. Based on these model results, health impact hotspots were defined as areas with the 10% lowest beneficial and highest burden values for each of the eight health-related benefits and burdens. This concerns 10% of the two selected neighborhoods together. It is therefore possible that health impact hotspots related to certain benefits or burdens are only located in one of the two neighborhoods. Subsequently, the model was run for the initial neighborhood design situation. Per health impact hotspot, changes in benefits and burdens as compared to the current UGS situation were calculated. Based on these outcomes, we created a map that displayed these hotspots, their health-related benefits and burdens and the change in these benefits and burdens based on the initial neighborhood designs. These maps were displayed in 3D and printed to use during the feedback meeting with participants.
Step 6: feedback meeting with participants to communicate health-related benefits and burdens and adjust the design
A second meeting was held for each group of participants in June-July 2019. During this meeting, we first presented the digitized initial neighborhood designs. Subsequently, we explained the computer-modeled health determinant values at neighborhood level. During this meeting, the participants were given the opportunity to make adjustments to their designs after having seen the design and hearing about the modeled health benefits and burdens. In the feedback meetings, only the health impact hotspots with the largest change in health benefit or burden caused by the green design were discussed. With the elderly, for example, we discussed the hottest areas in degrees Celsius and the areas with the most cooling by UGS in degrees Celsius. For the children, given their age (not older than 12), we translated the changes into (qualitative) infographics. These pictures showed beneficial (green) or detrimental (red) effects of their initial neighborhood designs. Participants were subsequently given the opportunity to adjust their design by drawing and commenting in the group. The resulting ‘final neighborhood designs’ were once more fed into the model to quantify health determinant values.
Step 7: determine participant change in Urban Green Space use after redesign
During the feedback meeting (Step 6) a survey was conducted to determine the extent to which the focus areas were used by the participants. The participants were asked to estimate how often they would visit a certain area for meeting, relaxation and physical activity. This was asked for the current situation as well as for the (adjusted) new design situation. The elderly were asked about the frequency of going to the area to meet people or together with others, to relax or enjoy being outside, or to get some physical activity (sport, play, go for a stroll) respectively. For children, these types of use were not distinguished and they were asked only about their frequency of ‘playing and meeting other children’. The participants could choose between 0 = no use, 1 = little use (a few times a year), 2 = medium use (a few times a month) and 3 = frequent use (a few times a day or week). Where opinions differed, the group's mean score was calculated. Participants were included in the score if they lived (or used to live) in the vicinity of the focus area or regularly visited the area.
Step 8: discuss method and results with local decision makers: the spatial planners of the municipality
After Step 1 and 2, the selected health determinant values, neighborhoods and participant groups were discussed with an employee of the spatial planning department of Maastricht municipality. After Step 3, the initial designs of children and elderly were also discussed with this spatial planner. Finally, after Step 7, the final neighborhood designs by the participants, the model–based assessment of the current and designed situation and the resident self-assessment were presented to two employees of the spatial planning department of Maastricht municipality. This was done in the form of a dialogue, so that questions could be answered and lessons could be learnt.
2.1.3. Development and Application of an Evaluation Framework
Considering that our novel approach to participatory UGS design resembles most closely what is known as ‘participatory mapping’ in the literature, this body of literature was searched to identify relevant criteria for our framework to evaluate the implemented approach. The keywords used the literature search reflected different participatory mapping approaches, participatory mapping criteria and participatory mapping lessons learned (Appendix D). The identified criteria (Table 4) were then applied to evaluate the performance of our novel approach.
3. Results
In this section, we present the results of implementing and evaluating the developed approach.
3.1. Implementation of the Developed Approach in Two Neighborhoods of Maastricht
The results for seven process steps (2-8) of the approach are described in the following sections. Step 1 concerns the choice for a set of health determinants and is described in section 2.2.
Step 2 and 3: orienting neighborhood walk and first design session
The neighborhood walks and the design sessions showed that elderly people are generally quite satisfied with the amount and type of green space in their neighborhood. They expressed a need for more flowers, for example on roundabouts at the entrance to the neighborhood. The elderly explained that their neighborhood is seen as a ‘disadvantaged neighborhood’ and that beautiful flowers in characteristic places give the neighborhood a better appearance. The elderly also liked to see more benches in the existing green spaces (especially in larger green areas, further from homes), so that they could take a rest during walks, enjoy the view and possibly have a chat.
The children especially indicated the need for more play facilities in the green spaces, such as climbing trees, stepping stones, a zip line, hills and football fields. The children also indicated to need a sheltered place, out of sight of adults, to get together and chat or play. More benches (for a picnic), flowers, water and walking paths were also often mentioned by the children. For more information about what the children and the elderly had included in their initial designs, see Appendix E.
Step 4 and 5: expert assessment of current and redesigned Urban Green Space situation
The digitized initial green designs per group and per focus area can be found in Appendix F. During the final feedback meeting of step 6, participants made a few changes and / or additions to their UGS designs (see Appendix G), which we processed into a single, final UGS design. The health-related impacts that we report on in this section concern the effects of the (adjusted) final UGS design. We extrapolated the UGS design input of the participants for all focus areas together to similar areas within the neighborhood (for Wittevrouwenveld, see Figure 2; for Pottenberg, see Appendix H).
All health impact hotspots with regard to heat stress and air pollution and most hotspots with regard to unattractive views were located in the Wittevrouwenveld neighborhood (i.e., the neighborhood with the least amount of green space). However, this neighborhood is not expected to have sites with suitable habitat for ticks. Pottenberg, on the other hand, does have such an area. The hotspot areas are shown in Figure 3, and Table 6 and Table 7 compare the estimated effects of the current UGS situation with the effects of the final UGS design situation.
In Wittevrouwenveld, the current UGS in the hottest places may provide some heat stress reduction (1.7 ºC warmer than the rural area instead of 2 ºC), which is made even larger by the final UGS design (1.6 ºC warmer than the rural area). Increase or decrease of air pollution due to the current UGS situation is not changed by the final UGS design. Also the benefit of decreasing unattractive views hardly changes due to the final UGS design, because the additional UGS is not in the field of view at the hotspots of the associated health problem. With regard to active transport, there is already some ‘functional UGS’ on routes, especially those routes from residential areas to shops and recreation. The ‘play parks’ and ‘flower meadows’ of the final UGS design make those routes more attractive, which provides slightly more predicted active transport for residents in hotspot ‘Inactive transport’. However, additional walking meters due to UGS are low, especially due to the large, less walkable distance to shops. In the current UGS situation, the overall perceived unsafety level is almost exclusively due to factors that have nothing to do with UGS, as these locations are out of sight of built-up areas and of busy roads, for example. The final UGS design does not change this much. The increased risk of traffic accidents is substantial due to current UGS (hedges and tall shrubs), but this burden does not increase with the final UGS design.
For Pottenberg as a whole, it is estimated that the inhabitants already walk a bit more than in Wittevrouwenveld, which can be explained by the greener neighborhood. Specifically for the ‘Inactive transport’ hotspot, however, the number of extra walking meters due to UGS is low, mainly because the west side of Pottenberg is almost a kilometer away from the nearest larger shopping center, so the model assumes that the car will often be taken from there. In contrast to Wittevrouwenveld, the current UGS in Pottenberg (due to a somewhat larger wooded park) is considered to be to a substantial extent responsible for perceived (socially) unsafe places. The final UGS design is expected to exacerbate this effect locally. Tick-bite risk is not expected to increase in the final UGS design. Finally, there is only one location in Pottenberg where it is predicted that an object (a bush near a roundabout) will substantiously reduce traffic safety, and the final UGS design does not create more of such places.
Step 6 and 7: feedback meeting with participants and determining change in use of the Urban Green Space by the participants
Step 6 concerned the feedback meeting with participants to communicate the health-related benefits and burdens that resulted from the model assessment. After that, participants were given the opportunity to adjust the UGS design. Regarding UGS design additions, participants added some flower areas, hedgerows and trees. Regarding UGS removal from their original UGS design, some trees were removed after participants had seen assessment results. For example: trees close to each other, to reduce the perceived unsafety burden.
For the elderly, but certainly for the children, making a distinction between use of a public area for meeting, relaxing, or sport and play was particularly difficult. We therefore did not make this distinction with the children. This observation was also reflected in the scores of these different self-assessed uses by the elderly, which showed an equal increase on the ordinal scale (see Appendix I). For an overview of the survey results of focus area use and intended use per neighborhood, see Table 5 (and see Appendix G for more detail). In Pottenberg, the elderly mainly use the parks to go for a stroll and relax and hardly to meet. For the final UGS design, the participants expected that their use would increase. For the children current use is less than for the elderly, but for the final UGS design, a significant increase in use was expected. In Wittevrouwenveld, the elderly also mainly use the UGS to go for a stroll and relax and hardly to meet. Here too the expected use increases for the final UGS design. Also the children expected to use the UGS more after redesign.
Table 6 and 7 provide an overview of the health-related benefits and burdens as assessed for the final UGS designs in both neighborhoods. The benefits of meeting opportunities, stress reduction opportunities and leisure-based physical activity are taken together here as well. Overall, the usage scores in Wittevrouwenveld are slightly higher than in Pottenberg, both for the current situation and the designs. As indicated earlier, a considerable increase in use for meeting, stress reduction or leisure-based physical activity was expected by residents for their final UGS designs, but the additional health benefits and especially the additional health burdens of these designs, insofar as included in this study, appear limited.
Step 8: discussing results with local decision makers
When the results (i.e., the health determinant values of the current situation and the final UGS designs) were presented to two spatial planners of Maastricht municipality, they indicated that the representation of these results was largely self-explanatory. It was clear to them what health determinants the different indicators represented and why they were marked at specific areas of the neighborhood maps. They asked about the assessment of the ‘active transport’ benefit and what explained the small difference per neighborhood. Furthermore, they made two remarks related to usefulness of the results for decision support. Firstly, they were especially (but not solely) interested in areas where municipal spatial interventions recently had taken place, were ongoing, or were planned. Secondly, they commented that some of the identified health impact hotspots overlapped with areas where there was no practical possibility for spatial redesign.
3.2. Evaluation: Strengths and Weaknesses of the Developed Approach
Table 8 presents the strengths and weaknesses (per category of evaluation criteria) identified when implementing the developed approach. The following sections elaborate on several of these strengths and weaknesses.
3.2.1. Strengths of the Developed Approach
Regarding the quality of the data made available to the participants, a strength was that the participants recognized the neighborhood maps (based on large-size aerial imagery) as representing their actual living environment. This was noticeable for example because children and elderly immediately reported on and pointed to reference locations where they had been or that they more frequently visited.
The quality of the data delivered by participants was positively affected by allowing the participants to use different methods to represent their input. Using notes for point locations and drawing for areas prevented problems with interpretation of the participants’ inputs. Both children and elderly combined the two methods. Multiple people working on the same design used different ways to mark areas (e.g. different styles of drawing). Computer-generated, bird-eye-view versions of the participants’ designs resulted in a uniform representation and clearer overview of the joint end-result for all participants. This enabled them to make a more accurate assessment of possible changes in UGS use if their design would be implemented.
Regarding user friendliness, the flexibility to use either drawing or making notes in participants’ UGS design appeared to stimulate broad participation. The elderly that participated mainly preferred to work with notes, whilst for the children the preference for drawing or making notes varied between individuals. The more uniform computer-generated maps not only made the proposed changes in UGS and their effects more clear, but also made it easier for the participants to adjust their designs in the subsequent session. Another strength regarding user friendliness was the flexibility in including landscape elements other than UGS, as it was sometimes harder for the participants to translate their ideas into what UGS would then look like. For example, children drew natural objects for certain tag-based games, or a maze made out of vegetation, but found it hard to translate these ideas into trees and shrubs (or hedgerows) themselves. Health determinant values of designs were estimated after the first design session and feedback was kept for a next session, which meant that participants did not need to wait for this during a session.
Regarding feasibility, the participants did not require much instruction and guidance during the design sessions. Due to the aerial imagery background on the neighborhood map (with some labels for distinct places), residents knew which place on the map was where, and the white areas on the map were also self-explanatory as areas where UGS (re)design was possible. During the second session, adjusting designs by participants was assisted by displaying the health burdens caused by the initial participatory design on the map (through infographics, color shades and numbers). It was therefore more easy for them to locate where UGS needed to be adjusted to prevent or reduce these burdens.
Regarding usefulness for decision makers, both the maps with participants’ final UGS design and the maps with health determinant values were found to be easy interpretable by spatial planners. In addition, they considered the map with hotspots of multiple (beneficial and detrimental) health-related effects useful as a product on its own.
Finally, regarding usefulness for participants (residents), the elderly indicated initially that they knew that neighborhood design affects the benefits such as meeting, stress reduction, and physical activity, but at the same time that they believed that their neighborhood did not need improvement in this regard. However, after the sessions they stated that they realized how addition or removal of landscape elements could improve their well-being through effects on meeting, stress reduction, and physical activity. Additionally, both elderly and children did not know much about other health determinant values of urban spatial design, nor how health issues such as heat stress and air pollution could be affected by green space. They indicated during the feedback session (Step 6) that using their own designs to explain about these effects gave them new insights in this matter.
We also identified some strengths that are probably more related to the implementation context (the specific neighborhoods and participant groups) than to the developed approach itself. Regarding feasibility, all contacted schools and clubs responded that we were welcome to organize the sessions, in case we would come to their location. Also regarding feasibility, it was possible for all participants to join the neighborhood walks and they were also willing to do that and seemed to appreciate the walk. Regarding the usefulness for decision makers, several of the participants’ design elements were low budget (flowers, small play objects, benches), increasing the feasibility of these ideas.
3.2.2. Weaknesses of the Developed Approach
Implementing the developed approach with children and elderly also revealed some weaknesses. Regarding the quality of the data delivered by participants, we observed group pressure on younger children to choose what their peers chose during the session with participant self-assessment (Step 7). Some children apparently did not want to be the only person indicating to (expect to) visit a place frequently or not at all.
Regarding user-friendliness, but also related to the quality of the data delivered by participants, it appeared that sessions were not always planned at moments of high motivation and concentration. For children, where sessions took place during school hours, it mostly seemed a welcome change from regular class activities. The design sessions also aligned well with some of the school’s educational objectives. During sessions organized outside school hours, the children also participated for longer periods without losing concentration when they were well-rested (e.g., scouting group in the morning). One session with children, however, took place after school and it was clear that these children found it difficult to maintain their concentration while drawing on the maps after a day at school. For most elderly groups, the design sessions appeared not to be their preferred activity. They for example often returned to chit-chatting whilst the (30 minute) design session was not yet finished.
The usefulness for decision makers was diminished because the participants’ designs were not restricted to feasible redesign options. The types of UGS considered feasible by the spatial planners (e.g. flowers on roundabouts) were only identified during the final step (Step 8). Another relevant preference of the spatial planners that was only identified during the final step concerned the model output. They would have appreciated an indication of the ‘degree to which UGS redesign is possible’ on the maps displaying the health impact hotspots. Taking this into account before Step 8 may increase the chance of implementation of designs.
Regarding usefulness for participants, a minor weakness was that the health determinant values of their designs could not be fed back immediately to them as these first needed to be assessed with the computer model. In the experience of the participants, this may have resulted in a less direct connection between their own designs and the health determinant values of these designs.
4. Discussion
This section discusses the major strengths and weaknesses of the developed approach, presents recommendations for improvement and further research, and ends with a conclusion on its key contribution.
4.1. Major Strengths and Weaknesses
The major result-related strength of the developed approach to support participatory design of UGS, is that it allows conclusions about whether the final designs actually represent an improvement compared to the current situation in terms of health. In both neighborhoods, the results show that the designs made by the elderly and children can be expected to lead to an increase in use of the green spaces for meeting, stress reduction, and physical activity. With regard to the model-assessed health benefits, a small increase in active transport (walking) with approximately 20-30 extra walking meters per day and a small heat stress decrease of around 0.1 ºC was estimated. According to the model, little change in the other health benefits can be expected. With regard to health burdens, a small increase in the feeling of social insecurity in the neighborhood of Pottenberg was predicted, due to the extra UGS introduced in the participants’ UGS design.
Through testing the developed approach for participatory design of UGS, we have learnt also about its strengths and weaknesses in relation to literature-based process evaluation criteria. Core strengths of its method are the use of visual material, specifically large-size aerial imagery background map and computer-generated (uniform) bird-eye-view versions of the participatory designs with visualized health determinant values. These products improve aspects regarding the quality of data to be used by participants, quality of data delivered by participants, user-friendliness and feasibility. Regarding the usefulness for decision support, the resulting maps with participatory designs and health determinant values were easy to interpret for spatial planners, and expressing results as impacts on ‘health hotspots’ was considered relevant by spatial planners. Finally, regarding the usefulness for the participants, strengths are an increase in knowledge and awareness of residents of how green spaces in their neighborhood could be improved to achieve positive health effects, and of the mechanisms behind generation of health benefits and burdens by green spaces.
A major weaknesses identified after applying the approach to the neighborhoods in Maastricht, was that participant sessions were not purposefully planned at moments when motivation and concentration could be expected to be high. Moreover, relevant preferences of decision makers regarding the results of the approach were now only identified during the final step. The fact that design sessions were not based on feasible Urban Green Space redesign options as provided by the local planner, could be considered a weakness as well, especially when implementation of designs is considered more important than participatory designs that are more purely based on the preferences of participants.
4.2. Recommendations for Improvement
As mentioned, major identified weaknesses of the proposed approach are lower levels of involvement of some participant groups and insufficient involvement of spatial planners in terms of their possibilities and preferences. The approach could be improved by addressing these weaknesses as follows. When organizing sessions, the daily schedule of the type of participant should be considered (e.g. sessions for children during school or on weekends, rather than after school). Sessions could also be more aligned with or integrated with the preferred activities of the participant group (e.g. accommodate for chit-chatting during design sessions with elderly visitors of a community centre). Involvement of decision makers (e.g. spatial planners) could be improved during the first steps of the approach, e.g. by asking the local decision makers which health issues related to UGS design have priority. In the following steps, these priority problems may then be focused upon. The local decision makers could also be asked about feasible redesign options, for example with regard to preferred UGS types, favored locations for UGS, or areas available for UGS redesign. Finally, the decision makers could be asked what type of results from the participatory approach they would consider most valuable. Taking the perspective of the local decision makers into account in the further steps of the approach will increase the chance that the outputs and insights are adopted in policy or practice. Communicating this perspective to the participants may make them more involved in the approach as well, as there is a larger chance that their designs will be implemented.
The neighborhoods where the proposed approach was tested, as well as the type and number of participants will have affected the outcomes of the approach in terms of UGS designs, health benefits and burdens, and the expected increase in use of UGS after redesign. Factors determining the effect of type of participant may amongst others be age, sex, income level and ethnic background. In this study, we only involved the elderly and children. It is recommended to include other age groups (youth and younger adults) in the design process as well. In this way, a UGS design is obtained that better represents the age distribution of a neighborhood, and can meet the needs of all the residents of the neighborhood. Another factor that may influence the outcomes and in particular UGS use, is the distance at which participants live from the area of interest. In the Wittevrouwenveld neighborhood, for example, it turned out, for example, that some of the older participants who are active in groups in those neighborhoods, do not live in the neighborhood concerned. Although they knew the neighborhood well, for example because they had lived there, an improved version of the approach should take the type of residents better into account.
The health benefits and burdens from urban green assessed in this study do not cover all mechanisms that link urban green space and health. Specifically when including residents in assessments, information can be gathered about more indirect (often behavior-dependent) benefits of UGS, such as when being in parks leads to exposure to sunlight and thus vitamin D production, or when trees protect against too much UV radiation (through their shadows). Similarly indirect burdens of UGS may become more tangible to assess when including participants, such as when playing in parks encourages soil ingestion (pica), or when UGS occurs in the form of natural exercise or play objects that cause injuries. Especially with regard to current urban spatial design, perceptions, observations and experiences of (resident) participants could play an important role in assessment of the impact of current UGS on these health benefits and burdens.
A final recommendation concerns the suggestion to adopt a dual approach, that combines estimations from experts and residents to assess the values of certain health determinants. This is mainly because models are better at predictions of effects of new street designs to which residents have not been exposed in real-life, whilst residents are the local experts that for example know which places they use the most or where they are exposed the most within the current street design. Although probably most health determinants would be best assessed with a dual approach, health determinants that we assessed in this study that seem especially suitable for this are Unattractive views, Heat stress and Active transport. Regarding the former two health determinants, this is because they can be directly observed and perceived by residents if they are physically present at the footpaths concerned. Regarding the latter health determinant, residents will likely have memories of why they chose certain routes and how long these routes were.
4.3. Recommendations for Further Research
Apart from effects of the participatory UGS designs on the participant-assessed benefits of meeting, stress reduction, and physical activity, the only substantial model-assessed effect of the UGS designs is on the benefit of ‘heat stress decrease’. The low impact of the designs on the benefits of 'air pollution decrease' and 'unattractive view decrease' was to be expected, because the design process was primarily aimed at increasing the three participant-assessed benefits and was limited to the focus areas. In addition, the influence of green at a greater distance is less for these benefits. For example, the 'unattractive views decrease' benefit is for pedestrians outside a park often limited, because buildings block the view of the park. However, it will be interesting for further research to find out if these minimal effects on other benefits and burdens is a general pattern when applying the approach to other neighborhoods as well. What can be varied in such a study are the health benefits that participants are requested to focus on in their (re)design, the location of the area to be redesigned in relation to health hotspot locations and the population density of the neighborhood.
The developed approach did not consider outcome-related criteria that can be linked to implementation of designs, and generation or reinforcement of participatory governance. It will be interesting for further research to evaluate to which extent results of this approach influenced spatial planning decisions. It will also be interesting for further research to evaluate to which extent the participatory process stimulated participants to form a network or community to improve UGS to improve health, or to strengthen such an existing network or community. Finally, it will be interesting for further research to evaluate to which extent the developed approach and similar approaches increased trust in institutions and reduced conflict beyond the participatory process (Tang & Liu, 2016). Evaluating such effects of the approach would require monitoring further developments after the participatory process has ended, and a long-term evaluation effort would be needed.
4.4. Conclusion
This study aimed to develop and evaluate a novel approach to support participatory design of UGS to improve residents’ health, as such an approach was lacking thus far. It aimed to include several guiding principles in its approach, in particular addressing a comprehensive selection of health benefits and burdens, combining inputs of residents and experts in a complementary way, making impacts tangible for residents, and involving the local decision makers. The proposed approach has proven to be effective in supporting a participatory urban green space design process, whilst meeting most of the guiding principles identified in the literature. However, in particular the implementation of the guiding principle of ‘involving the local decision makers’ could still be improved. The use of a computer model as part of the novel approach can be considered successful as well. The model aided in visualizing UGS designs as well as their health benefits and burdens in a for the participants recognizable way. The model and the participatory sessions complement each other and in this way a more complete assessment of health determinants is obtained. Whereas in other participatory approaches to UGS design it often remains unclear whether participation actually improves green spaces, our combination of a computer model with a participatory process produced clear outcomes as far as health benefits and use of UGS are concerned.
Author Contributions
Conceptualization, Bram Oosterbroek, Joop de Kraker, Sandra Akkermans and Paola Esser; Data curation, Bram Oosterbroek; Formal analysis, Bram Oosterbroek and Joop de Kraker; Funding acquisition, Sandra Akkermans and Paola Esser; Investigation, Bram Oosterbroek, Sandra Akkermans and Paola Esser; Methodology, Bram Oosterbroek, Joop de Kraker, Sandra Akkermans and Paola Esser; Project administration, Sandra Akkermans; Resources, Bram Oosterbroek, Sandra Akkermans, Paola Esser and Pim Martens; Software, Bram Oosterbroek; Supervision, Joop de Kraker and Pim Martens; Validation, Bram Oosterbroek and Joop de Kraker; Visualization, Bram Oosterbroek; Writing – original draft, Bram Oosterbroek, Sandra Akkermans and Paola Esser; Writing – review & editing, Joop de Kraker and Pim Martens.
Funding
This work was partially financially funded by the Academic Collaborative Centre for Healthy Living Environment (The Netherlands). This funding source had no other involvement in the study.
Acknowledgments
We would like to thank Tim van Wanroij and Anouk Schmid (Maastricht municipality) for their role as local decision maker in the participatory assessment process. Furthermore, we we would like to thank the teachers and children of elementary schools ‘El Habib’ and ‘The Letterdoes’ (both in Maastricht) for their role as respectively facilitators and participants in the participatory design process. Similar appreciation goes to the staff and children of Scouting Maastricht-West and the elderly of Buurtcentrum De Romein and Trefcentrum Wittevrouwenveld in Maastricht.
Conflicts of Interest
The authors declare that they have no known competing financial interests or personal relationships that could have appeared to influence the work reported in this paper.
References
- Abhijith, K., Kumar, P., Gallagher, J., McNabola, A., Baldauf, R., Pilla, F., . . . Pulvirenti, B. (2017). Air pollution abatement performances of green infrastructure in open road and built-up street canyon environments–A review. Atmospheric Environment, 162, 71-86.
- Al-Kodmany, K. (2001). Bridging the gap between technical and local knowledge: Tools for promoting community-based planning and design. Journal of Architectural and Planning research, 110-130.
- Anderson, J. O., Thundiyil, J. G., & Stolbach, A. (2012). Clearing the air: a review of the effects of particulate matter air pollution on human health. Journal of medical toxicology, 8(2), 166-175.
- Bancroft, C., Joshi, S., Rundle, A., Hutson, M., Chong, C., Weiss, C. C., . . . Lovasi, G. (2015). Association of proximity and density of parks and objectively measured physical activity in the United States: A systematic review. Social science & medicine, 138, 22-30.
- Beeldmateriaal Nederland. (2018). Data. Retrieved from https://www.beeldmateriaal.nl/data.
- Bodnaruk, E., Kroll, C., Yang, Y., Hirabayashi, S., Nowak, D., & Endreny, T. (2017). Where to plant urban trees? A spatially explicit methodology to explore ecosystem service tradeoffs. Landscape and Urban Planning, 157, 457-467.
- Bowler, D. E., Buyung-Ali, L. M., Knight, T. M., & Pullin, A. S. (2010). A systematic review of evidence for the added benefits to health of exposure to natural environments. BMC Public Health, 10(1), 1-10. [CrossRef]
- Brown, G., & Fagerholm, N. (2015). Empirical PPGIS/PGIS mapping of ecosystem services: A review and evaluation. Ecosystem Services, 13, 119-133. [CrossRef]
- Brown, G., Rhodes, J., & Dade, M. (2018). An evaluation of participatory mapping methods to assess urban park benefits. Landscape and Urban Planning, 178, 18-31.
- Canedoli, C., Bullock, C., Collier, M. J., Joyce, D., & Padoa-Schioppa, E. (2017). Public participatory mapping of cultural ecosystem services: Citizen perception and park management in the Parco Nord of Milan (Italy). Sustainability, 9(6), 891.
- CBS. (2018a). Bevolking; ontwikkeling in gemeenten met 100 000 of meer inwoners. Retrieved from https://statline.cbs.nl.
- de Vries, S., van Dillen, S. M., Groenewegen, P. P., & Spreeuwenberg, P. (2013). Streetscape greenery and health: stress, social cohesion and physical activity as mediators. Soc Sci Med, 94, 26-33. [CrossRef]
- Dougill, A. J., Fraser, E., Holden, J., Hubacek, K., Prell, C., Reed, M., . . . Stringer, L. (2006). Learning from doing participatory rural research: lessons from the Peak District National Park. Journal of Agricultural Economics, 57(2), 259-275.
- Gascon, M., Triguero-Mas, M., Martínez, D., Dadvand, P., Rojas-Rueda, D., Plasència, A., & Nieuwenhuijsen, M. J. (2016). Residential green spaces and mortality: A systematic review. Environment International, 86, 60-67. [CrossRef]
- Gehrels, H., Meulen, S. v. d., Schasfoort, F., Bosch, P., Brolsma, R., Dinther, D. v., . . . Massop, H. T. L. (2016). Designing green and blue infrastructure to support healthy urban living. Retrieved from http://edepot.wur.nl/384206.
- GGD Zuid Limburg (2018). Health Monitor Adults and Elderly 2016. Retrieved from https://www.gezondheidsatlaszl.nl.
- Gonzalez-Ollauri, A., & Mickovski, S. B. (2017). Providing ecosystem services in a challenging environment by dealing with bundles, trade-offs, and synergies. Ecosystem Services, 28, 261-263. [CrossRef]
- Hartig, T., Mitchell, R., De Vries, S., & Frumkin, H. (2014). Nature and Health. Annual Review of Public Health, 35, 207-228. [CrossRef]
- Hassen, N., & Kaufman, P. (2016). Examining the role of urban street design in enhancing community engagement: A literature review. Health & Place, 41, 119-132.
- Honold, J., Lakes, T., Beyer, R., & van der Meer, E. (2015). Restoration in Urban Spaces: Nature Views From Home, Greenways, and Public Parks. Environment and Behavior. [CrossRef]
- Huck, J. J., Whyatt, J. D., & Coulton, P. (2014). Spraycan: A PPGIS for capturing imprecise notions of place. Applied Geography, 55, 229-237. [CrossRef]
- James, P., Banay, R. F., Hart, J. E., & Laden, F. (2015). A Review of the Health Benefits of Greenness. Current Epidemiology Reports, 2(2), 131-142. [CrossRef]
- Jordan, R., Gray, S., Zellner, M., Glynn, P. D., Voinov, A., Hedelin, B., . . . Hubacek, K. (2018). Twelve questions for the participatory modeling community. Earth's Future, 6(8), 1046-1057.
- Kabisch, N., van den Bosch, M., & Lafortezza, R. (2017). The health benefits of nature-based solutions to urbanization challenges for children and the elderly – A systematic review. Environmental research, 159, 362-373. [CrossRef]
- Kondo, M. C., Fluehr, J. M., McKeon, T., & Branas, C. C. (2018). Urban green space and its impact on human health. International Journal of Environmental Research and Public Health, 15(3), 445.
- Lee, A. C. K., & Maheswaran, R. (2011). The health benefits of urban green spaces: a review of the evidence. Journal of Public Health, 33(2), 212-222. [CrossRef]
- Literat, I. (2013). Participatory mapping with urban youth: The visual elicitation of socio-spatial research data. Learning, Media and Technology, 38(2), 198-216.
- Lovell, R., Depledge, M., & Maxwell, S. (2018). Health and the natural environment: A review of evidence, policy, practice and opportunities for the future.
- Maes, J., Teller, A., & Erhard, M. (2013). Mapping and Assessment of Ecosystems and their Services. An Analytical Framework for Ecosystem Assessments Under Action 5 of the EU Biodiversity Strategy to 2020.
- Mendoza, G. A., & Prabhu, R. (2005). Combining participatory modeling and multi-criteria analysis for community-based forest management. Forest Ecology and Management, 207(1), 145-156. [CrossRef]
- Møller, M. S., Olafsson, A. S., Vierikko, K., Sehested, K., Elands, B., Buijs, A., & van den Bosch, C. K. (2019). Participation through place-based e-tools: A valuable resource for urban green infrastructure governance? Urban Forestry & Urban Greening, 40, 245-253. [CrossRef]
- Monteiro, M. V., Doick, K. J., Handley, P., & Peace, A. (2016). The impact of greenspace size on the extent of local nocturnal air temperature cooling in London. Urban Forestry & Urban Greening, 16, 160-169.
- Oosterbroek, B., de Kraker, J., Huynen, M. M. T. E., Martens, P., & Verhoeven, K. (2023). Assessment of green space benefits and burdens for urban health with spatial modeling. Urban Forestry & Urban Greening, 86, 128023. [CrossRef]
- Pánek, J., Pászto, V., & Šimáček, P. (2017). Spatial and temporal comparison of safety perception in urban spaces. Case study of Olomouc, Opava and Jihlava. Paper presented at the Proceedings of GIS Ostrava.
- Pelucchi, C., Negri, E., Gallus, S., Boffetta, P., Tramacere, I., & La Vecchia, C. (2009). Long-term particulate matter exposure and mortality: a review of European epidemiological studies. BMC Public Health, 9(1), 1-8.
- Ravera, F., Hubacek, K., Reed, M., & Tarrasón, D. (2011). Learning from experiences in adaptive action research: a critical comparison of two case studies applying participatory scenario development and modelling approaches. Environmental Policy and Governance, 21(6), 433-453.
- Reed, M. S. (2008). Stakeholder participation for environmental management: A literature review. Biological Conservation, 141(10), 2417-2431. [CrossRef]
- Rigolon, A., Browning, M. H., Lee, K., & Shin, S. (2018). Access to urban green space in cities of the Global South: A systematic literature review. Urban Science, 2(3), 67.
- Roman, L. A., Conway, T. M., Eisenman, T. S., Koeser, A. K., Barona, C. O., Locke, D. H., . . . Vogt, J. (2021). Beyond ‘trees are good’: Disservices, management costs, and tradeoffs in urban forestry. AMBIO, 50(3), 615-630.
- Saadallah, D. M. (2020). Utilizing participatory mapping and PPGIS to examine the activities of local communities. Alexandria Engineering Journal, 59(1), 263-274. [CrossRef]
- Sprong, H., Azagi, T., Hoornstra, D., Nijhof, A. M., Knorr, S., Baarsma, M. E., & Hovius, J. W. (2018). Control of Lyme borreliosis and other Ixodes ricinus-borne diseases. Parasites & Vectors, 11(1), 1-16.
- Sterling, E. J., Zellner, M., Jenni, K. E., Leong, K., Glynn, P. D., BenDor, T. K., . . . Jordan, R. (2019). Try, try again: Lessons learned from success and failure in participatory modeling. Elementa: Science of the Anthropocene, 7.
- Tang, Z., & Liu, T. (2016). Evaluating Internet-based public participation GIS (PPGIS) and volunteered geographic information (VGI) in environmental planning and management. Journal of Environmental Planning and Management, 59(6), 1073-1090.
- Theeuwes, N. E., Steeneveld, G. J., Ronda, R. J., & Holtslag, A. A. (2017). A diagnostic equation for the daily maximum urban heat island effect for cities in northwestern Europe. International Journal of Climatology, 37(1), 443-454.
- Usón, T. J., Klonner, C., & Höfle, B. (2016). Using participatory geographic approaches for urban flood risk in Santiago de Chile: Insights from a governance analysis. Environmental Science & Policy, 66, 62-72.
- Van den Berg, M., Wendel-Vos, W., Van Poppel, M., Kemper, H., Van Mechelen, W., & Maas, J. (2015). Health benefits of green spaces in the living environment: A systematic review of epidemiological studies. Urban Forestry & Urban Greening, 14(4), 806-816. [CrossRef]
- Van den Bosch, M., & Sang, Å. O. (2017). Urban natural environments as nature-based solutions for improved public health–A systematic review of reviews. Environmental research, 158, 373-384.
- van der Jagt, A. P., Elands, B. H., Ambrose-Oji, B., Gerőházi, É., Møller, M. S., & Buizer, M. (2017). Participatory governance of urban green spaces: trends and practices in the EU. NA, 28(3).
- Vukomanovic, J., Skrip, M. M., & Meentemeyer, R. K. (2019). Making it spatial makes it personal: engaging stakeholders with geospatial participatory modeling. Land, 8(2), 38.
- Warburton, D. E., Nicol, C. W., & Bredin, S. S. (2006). Health benefits of physical activity: the evidence. Cmaj, 174(6), 801-809.
- WHO Regional Office for Europe. (2016). Urban green spaces and health. Retrieved from Copenhagen: www.euro.who.int.
- WHO Regional Office for Europe. (2017). Urban Green Space Interventions and Health: a Review of impacts and effectiveness. Retrieved from Copenhagen: www.euro.who.int.
- Wolf, K. L. (2006). Urban trees and traffic safety: Considering the US roadside policy and crash data. Arboriculture and Urban Forestry. 32 (4): 170-179., 32(4), 170-179.
- Wong, K. V., Paddon, A., & Jimenez, A. (2013). Review of world urban heat islands: Many linked to increased mortality. Journal of Energy Resources Technology, 135(2).
- Zhou, X., Li, D., & Larsen, L. (2016). Using web-based participatory mapping to investigate children’s perceptions and the spatial distribution of outdoor play places. Environment and Behavior, 48(7), 859-884.
Figure 1.
overview maps of Wittevrouwenveld (left) and Pottenberg (right) neighborhoods, showing the neighborhood boundary, buffer zone (of 500 meters) around the neighborhood, locations where the participants meet and the focus areas. Aerial photo: Beeldmateriaal Nederland (2018).
Figure 1.
overview maps of Wittevrouwenveld (left) and Pottenberg (right) neighborhoods, showing the neighborhood boundary, buffer zone (of 500 meters) around the neighborhood, locations where the participants meet and the focus areas. Aerial photo: Beeldmateriaal Nederland (2018).
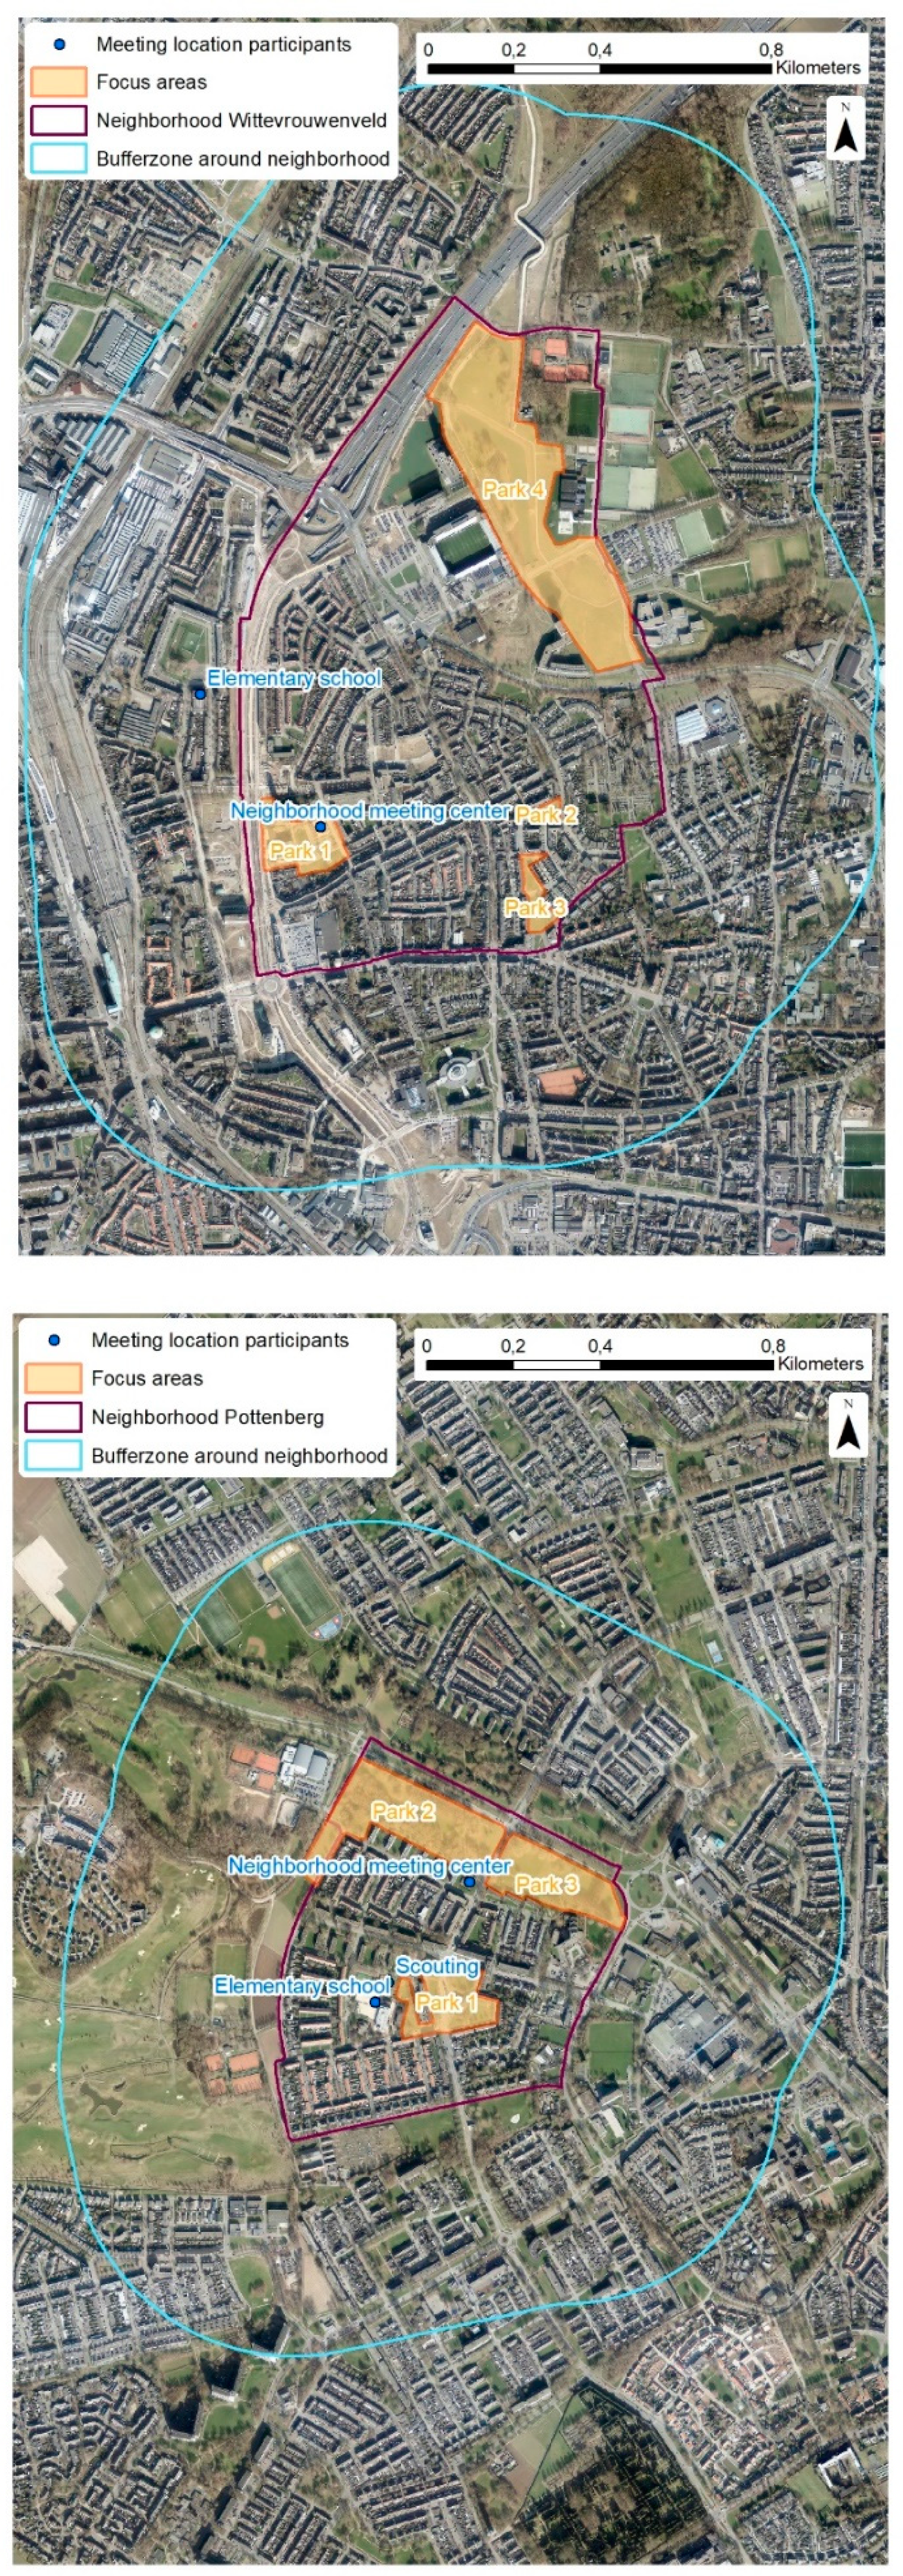
Figure 2.
Current situation (left) and changes proposed in the final UGS design (right) for neighborhood ‘Wittevrouwenveld’.
Figure 2.
Current situation (left) and changes proposed in the final UGS design (right) for neighborhood ‘Wittevrouwenveld’.
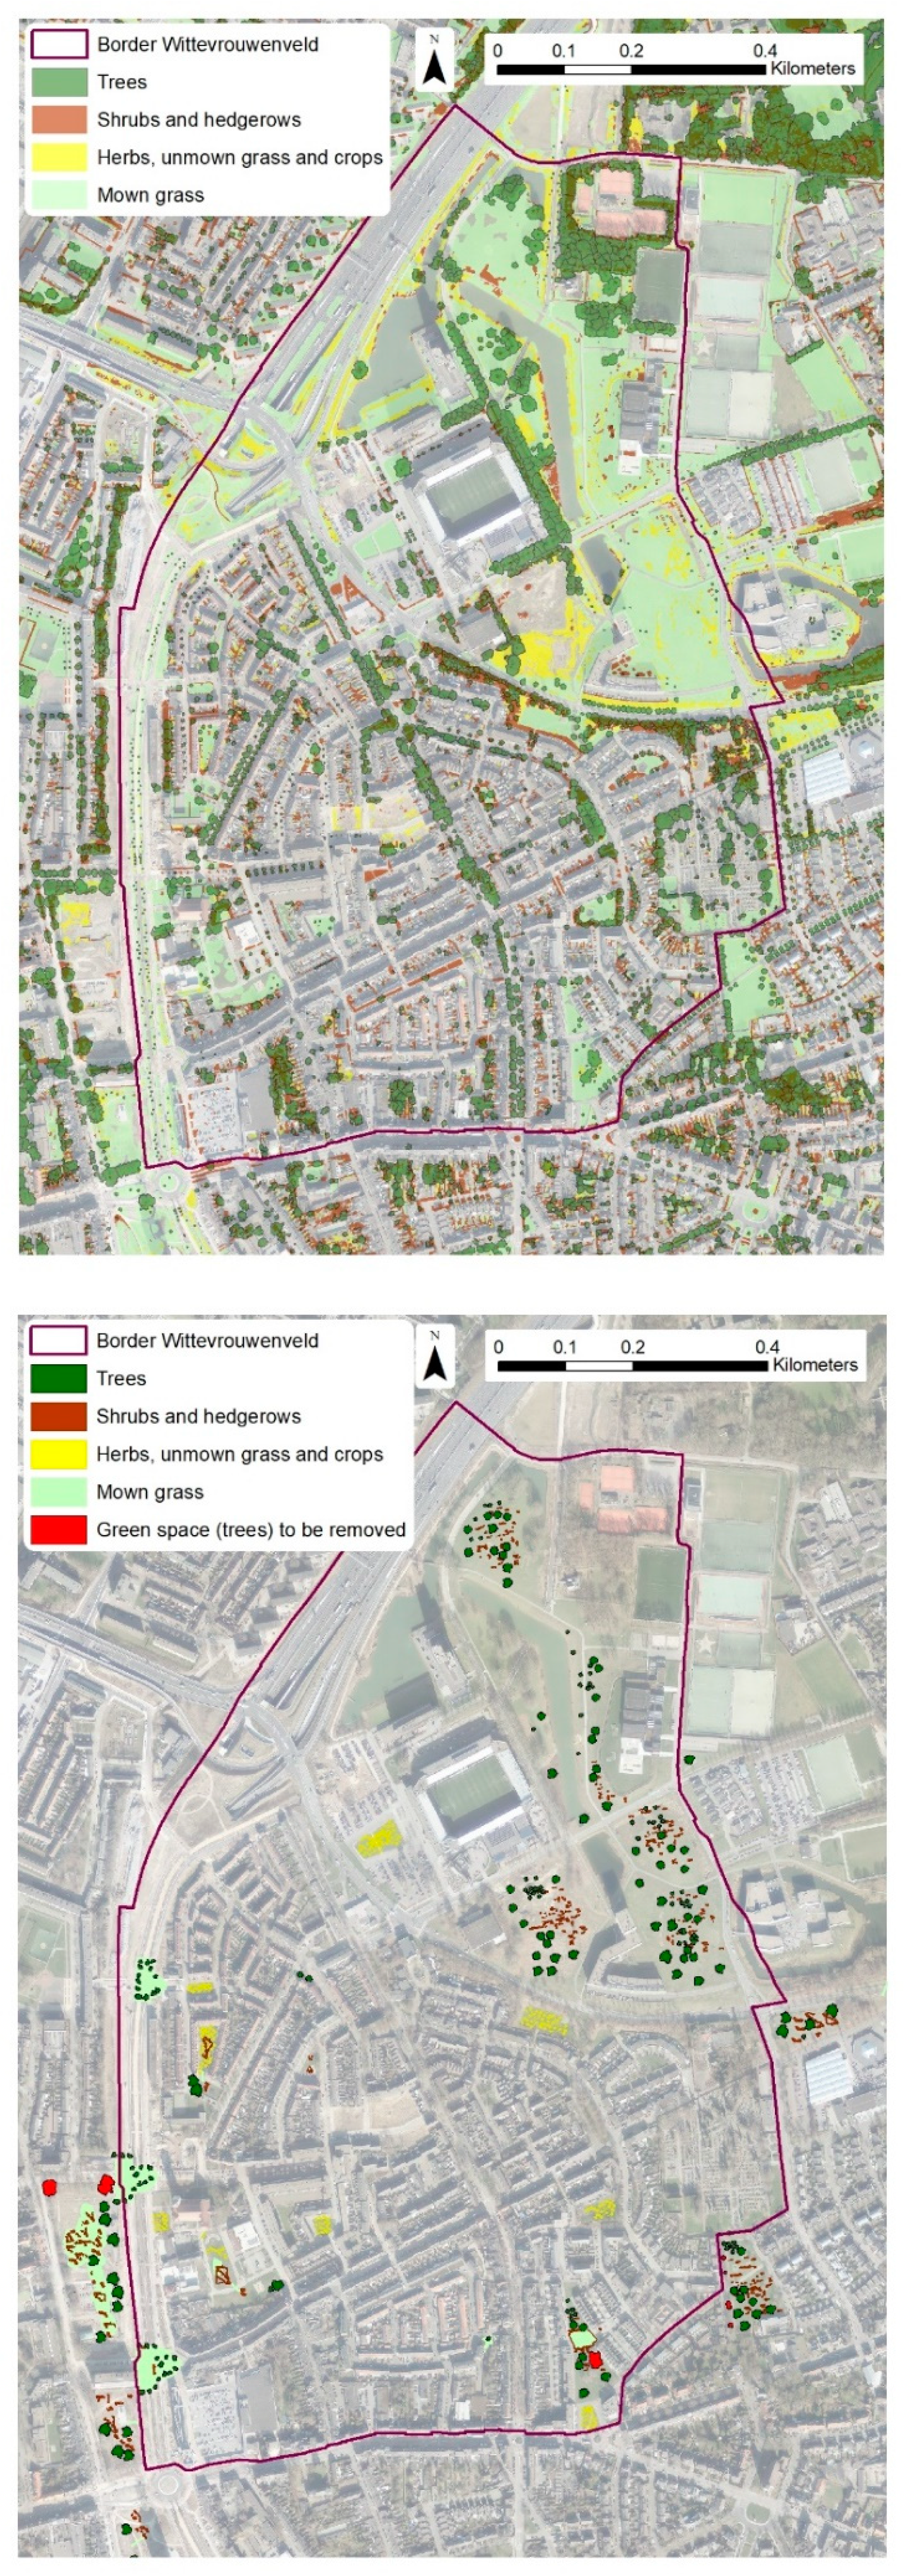
Figure 3.
Neighborhoods Wittevrouwenveld (left) and Pottenberg (right) with health impact hotspot locations.
Figure 3.
Neighborhoods Wittevrouwenveld (left) and Pottenberg (right) with health impact hotspot locations.
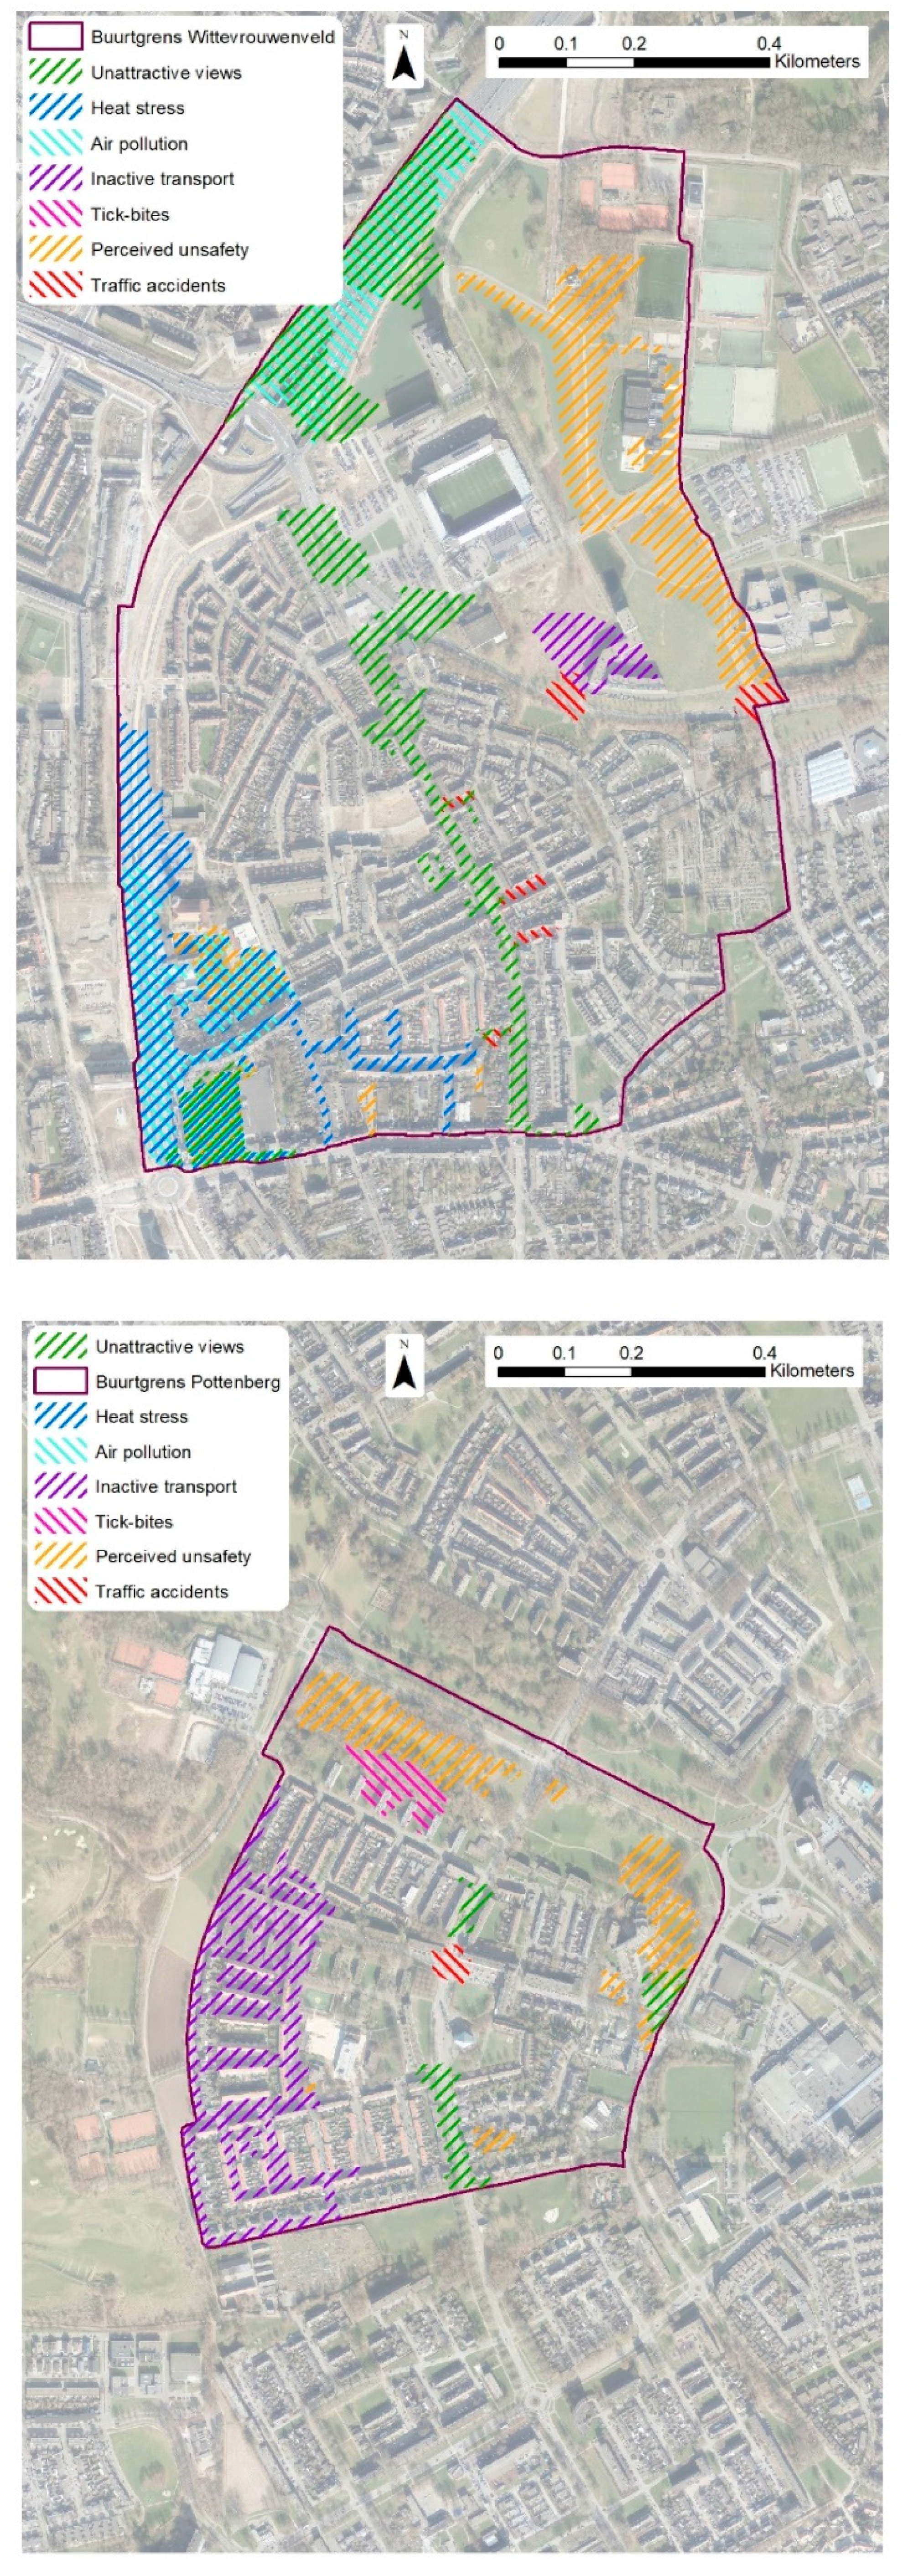

Table 1.
Process steps for participatory UGS design.
| Step | Name | Instruction for facilitator of the approach | Relates to guiding principle |
|---|---|---|---|
| 1 | Choose a set of health effects to assess and decide how to assess each health effect | Choose a wide enough spectrum of health effects. Determine which health effects are best assessed by the participants and which best by an available expert method. | 1, 2 (and 8) |
| 2 | Orienting neighborhood walk | Organize a walk through the area of interest and visit all UGS of significance. | 3, (8) |
| 3 | First design session | Construct maps by drawing lines around the border of the areas of interest. Indicate - within the areas of interest - where participants can or cannot change the current situation on the map. | 3, (8) |
| 4 | Pre-processing participant Urban Green Space designs for expert assessment | Process the maps such that they are ready for expert assessment of the health benefits selected during step 1. Consider generalizing or extrapolating designs to make effects more clear to participants at step 6. | 4, (8) |
| 5 | Expert assessment for both current UGS and UGS design situation | Perform expert assessment of the initial (participatory) UGS designs. Process the results of the expert assessment such that the difference between current UGS situation and initial design UGS situation is clearly visible for participants, for example only display hotspots. | 5, (8) |
| 6 | Feedback meeting with participants | Present the digitized initial UGS designs, and explain the health effects. Finally, give the participants the opportunity to make adjustments to their UGS design after being informed about the expert-based health benefits and burdens (‘adjusted UGS design’). | 5, 6, (8) |
| 7 | Determine participant self-assessed score on a selection of health effects | Conduct survey, interviews or other method to determine UGS usage scores for both the current UGS situation and the adjusted UGS design that includes possible adjustments made by the participants. | 7, 4, (8) |
| - | Possibility for iteration of steps 4 to 7 | Optional re-assessment of the adjusted UGS designs by expert and participants by repeating step 4 to 7. | 6, (8) |
| 8 | Report results to local decision makers | Assessment of the final UGS designs by experts. Process the results of the expert assessment such that the difference between the current situation and the adjusted design is understandable for local decision makers. Facilitate an interactive session with the local government. | 8 |
Table 2.
Participant information.
| Neighborhood of most participants* | Group | Number of participants | Average age (year) |
|---|---|---|---|
| Pottenberg | Elementary school | 9 | 11 |
| Pottenberg | Scouting | 10 | 7 |
| Pottenberg | Seniors social meeting group | 12 | 80 |
| Wittevrouwenveld | Elementary school | 6 | 11 |
| Wittevrouwenveld | Seniors social meeting group | 5 | 55 |
| * In some cases, participants lived around these neighborhoods | |||
Table 3.
Overview of health-related benefits and burdens of urban green space and how they were assessed.
Table 3.
Overview of health-related benefits and burdens of urban green space and how they were assessed.
| Urban Green Space benefit | Indicator | Type of assessment |
|---|---|---|
| Meeting opportunities increase | Area visiting frequency score 1 - 5 (never - daily) for use as meeting place | Resident self-assessment |
| Stress reduction opportunities increase | Area visiting frequency score 1 - 5 (never - daily) for use to relax | Resident self-assessment |
| Leisure-based physical activity increase | Area visiting frequency score 1 - 5 (never - daily) for use to sport, play or go for a stroll | Resident self-assessment |
| Unattractive views decrease | Unattractive views score (decrease) | Computer modeled |
| Heat stress decrease | Temperature (decrease) | Computer modeled |
| Air pollution decrease | Air pollutant concentration (decrease) | Computer modeled |
| Active transport increase | Walking distance (increase) | Computer modeled |
| Urban Green Space burden | ||
| Air pollution increase | Air pollutant concentration (increase) | Computer modeled |
| Perceived unsafety increase | Perceived social unsafety score (increase) | Computer modeled |
| Tick-bite increase | Tick-bite chance (increase) | Computer modeled |
| Traffic accidents increase | Pedestrian invisibility (increase) | Computer modeled |
Table 4.
Evaluation categories and criteria for participatory mapping approaches.
| Category | Criterion | Adopted or adapted from |
|---|---|---|
| Data quality for participants | Quality data (e.g. correct location and label) | (Tang & Liu, 2016) |
| Complete / sufficient spatial data | (Brown & Fagerholm, 2015; Huck et al., 2014) | |
| Unbiased selection of benefits for mapping | (Brown & Fagerholm, 2015) | |
| Data quality by participants | Data allow people to have their views included and well-represented | (Huck et al., 2014; McLain et al., 2013) |
| Participation equality: inclusion of or representativeness of social groups based on study design (e.g. due to provision of access) | (Møller et al., 2019) (Huck et al., 2014; Tang & Liu, 2016) | |
| User-provided data not artificially forced into discrete points and polygons | (Huck et al., 2014) | |
| Ability to detect, correct or remove inaccurate spatial records | (Fagerholm et al., 2021) | |
| User | Personalized connections to problems | (Vukomanovic et al., 2019) |
| friendliness | Clear communication of expectations and purpose to participants | (Brown & Fagerholm, 2015) (Brown & Kyttä, 2018) |
| Mapping benefits appropriate to participant knowledge and ability | (Brown & Fagerholm, 2015) | |
| Low mapping effort and high data usability | (Brown & Fagerholm, 2015) | |
| Combination with other communication techniques (e.g. social media) | (Tang & Liu, 2016) | |
| Clear operational definitions for the benefits being mapped and their attributes | (Brown & Fagerholm, 2015) | |
| Building or keeping trust is taken into account in the participatory process | (Brown & Kyttä, 2018) | |
| Co-creation and co-design between different participants is facilitated instead of being a barrier in the process | (Brown & Kyttä, 2018) | |
| Approach avoids conflict between participants | (Huck et al., 2014) | |
| Feasibility | Attraction of / motivation for a sufficient amount of participants | (Tang & Liu, 2016) |
| Ability to engage diverse, relevant, and sometimes reluctant stakeholders | (Brown & Fagerholm, 2015) | |
| Success of cooperation with other organizations to facilitate the process | (Tang & Liu, 2016) | |
| Continuity of support by the hosting organization during full and multiple sessions | (Tang & Liu, 2016) | |
| Continuity of user presence and engagement during full and multiple sessions | (Tang & Liu, 2016) | |
| Approach is not too costly | (Brown & Fagerholm, 2015) (Tang & Liu, 2016) | |
| Approach is not too time-consuming for participants | (Brown & Fagerholm, 2015) (Tang & Liu, 2016) | |
| Usefulness for decision makers | Integration of data into actual participatory land use planning decision processes | (Brown & Fagerholm, 2015) |
| Ability to combine spatial with non-spatial data to improve relevance | (Fagerholm et al., 2021) | |
| Standardization and commensurability of results with other measures of value | (Brown & Fagerholm, 2015) | |
| Ability to compare mapped results against current situation | (Brown & Fagerholm, 2015) | |
| Provides opportunity for trade-off analyses | (Brown & Fagerholm, 2015) | |
| Compatible with the social and institutional context of land use decision process | (Brown & Fagerholm, 2015) (Canedoli et al., 2017) | |
| Extent to which mapped attributes can be generalized to be applied to other place and in other contexts, or to produce a representation of a system | (Fagerholm et al., 2021) | |
| Usefulness for participants | Alignment with participant interests or goals | (Tang & Liu, 2016) |
| Stimulates empowerment of participating social groups (e.g. youth) | (Literat, 2013; Zhou et al., 2016) | |
| Increases public awareness of the issue or problem | (Brown & Fagerholm, 2015) (Tang & Liu, 2016) | |
| Increases trust in local policy making | ||
| Engages people in planning processes leading to decisions that will directly affect their lives. | (Brown & Fagerholm, 2015) |
Table 5.
Self-assessed use by participants of the focus areas for meeting and play. Both current use and after the design is implemented.
Table 5.
Self-assessed use by participants of the focus areas for meeting and play. Both current use and after the design is implemented.
| Group | Current use | Self-assessed expected use after design | Summary of designed elements |
|---|---|---|---|
| Elderly (n=17) |
A few times per month | A few times per week | Flowers, solitary trees, street trees, extra dog walking area, benches, bushes on roundabouts pruned for traffic safety. |
| Children (n=28) |
A few times per year | A few times per month to a few times per week | Climbing trees and play trees, paths, flowers, shielding shrubs, play bushes, hills, flowers, fallen trees, stepping stones. A few trees removed (because of soccer field, social safety, tick habitat) |
Table 6.
Health benefits and burdens of green space for the final UGS design of Wittevrouwenveld.
| Benefits of UGS (intended*) | Indicator-value of current green2 | Indicator-value after design2 |
|---|---|---|
| Meeting, stress reduction, and physical activity | Use a few times per month1 | Use a few times per week1 |
| Benefits of green (additional*) | ||
| Unattractive views decrease | 87% | 88% |
| Heat stress decrease | 14% (or 0.3 °C) 3 | 19% (or 0.4 °C) 3 |
| Air pollution decrease | 0% | 0% |
| Active transport increase | 2% (10 meter) 4 | 4% (30 meter) 4 |
| Burdens of green (additional*) | ||
| Air pollution increase | 0% | 0% |
| Perceived unsafety increase | 3% | 7% |
| Tick-bite increase | - | - |
| Traffic unsafety increase | 22% | 22% |
* Benefits as intended by the participants. Additional benefits and burdens may not have been intended. 1 The score is an average of the different groups and focus areas. 2 ‘-‘ = no value: the neighborhood did not contain any hotspot areas for the benefit or burden of green space. 3 % reduction as compared to total heat island effect. 4 extra walking meters per day.
Table 7.
Health benefits and burdens of green space for the final UGS design of Pottenberg.
| Benefits of UGS (intended*) | Indicator-value of current green2 | Indicator-value after design2 |
|---|---|---|
| Meeting, stress reduction, and physical activity | Use a few times per month1 | Use a few times per month to a few times per week1 |
| Benefits of green (additional*) | ||
| Unattractive views decrease | 94% | 96% |
| Heat stress decrease | - | - |
| Air pollution decrease | - | - |
| Active transport increase | 3% (20 meter) 4 | 7% (50 meter) 4 |
| Burdens of green (additional*) | ||
| Air pollution increase | - | - |
| Perceived unsafety increase | 30% | 38% |
| Tick-bite increase | 100% 5 | 100% (no extra areas) 5 |
| Traffic unsafety increase | 78% | 78% |
* Benefits as intended by the participants. Additional benefits and burdens may not have been intended. 1 The score is an average of the different groups and focus areas. 2 ‘-‘ = no value: the neighborhood did not contain any hotspot areas for the benefit or burden of green space. 3 % reduction as compared to total heat island effect. 4 extra walking meters per day. 5 tick-bite chance values can be fully attributed to UGS presence. The participatory design did not lead to additional areas with predicted presence.
Table 8.
Strengths and weaknesses of the developed approach per category of evaluation criteria.
| Criteria category | Strengths | Weaknesses |
|---|---|---|
| Data quality for participants |
|
- |
| Data quality by participants |
|
|
|
User friendliness |
|
|
| Feasibility |
|
|
| Usefulness for decision (maker) support |
|
|
| Usefulness for participants (residents) |
|
|
Disclaimer/Publisher’s Note: The statements, opinions and data contained in all publications are solely those of the individual author(s) and contributor(s) and not of MDPI and/or the editor(s). MDPI and/or the editor(s) disclaim responsibility for any injury to people or property resulting from any ideas, methods, instructions or products referred to in the content. |
© 2023 by the authors. Licensee MDPI, Basel, Switzerland. This article is an open access article distributed under the terms and conditions of the Creative Commons Attribution (CC BY) license (http://creativecommons.org/licenses/by/4.0/).
Copyright: This open access article is published under a Creative Commons CC BY 4.0 license, which permit the free download, distribution, and reuse, provided that the author and preprint are cited in any reuse.


