Submitted:
18 November 2023
Posted:
21 November 2023
You are already at the latest version
Abstract
This article presents a novel sustainable business management technique, emphasizing description and estimation over the outdated profit metric. Due to the intricacies and challenges of implementing the 2019 capital management method based on capital valuation (implemented in 2020–2022), a simpler approach became essential. While it is plausible for organizations to implement capital management based on their valuation, undertaking it with no outside help presents a challenge.
The new descriptive method is fundamentally distinct in that detailed monetary valuations of capitals are omitted in favor of description and estimation. This paper establishes the groundwork for applying the new approach in several stages and introduces three new management indicators—the overall accomplishment of management goals index (evaluating management efficacy), the capital level index, and the adjustment (compliance) index—replacing the profit metric. Noteworthy advantages include separating the assessment of management outcomes from the organization's condition, including human and social capital into efficiency evaluations, and removing the profit indicator for management purposes, which prevents resource waste and enhances company efficiency and effectiveness.
Keywords:
management method
; sustainable management
; sustainable enterprise
; management effectiveness
; management efficiency
; efficiency indicator
; effectiveness indicator
1. Introduction
As defined by the principles of the new approach, sustainable capital management necessitates that the enterprise's principal aim is to accomplish strategic and operational objectives in an efficient manner, wherein efficiency is understood as the endeavor to attain equilibrium. To put it simply, in the pursuit of their objectives, organizations should strive for maximum efficiency while remaining effective and striking a balance among their diverse capitals (including tangible, structural, financial, human, and market capital). Efficiency (in the balancing of capitals) and effectiveness (in the accomplishment of objectives) are the fundamental principles that each manager ought to uphold. When implemented together, these principles lead to success and satisfaction and confirm the enterprise's development.
In practical terms, this means that the actions of managers and the economic status of enterprises will be evaluated based on effectiveness (the extent to which objectives are met) and efficiency (the extent to which balance among the enterprise's capitals is achieved, understood as attaining a balance between the current levels of each of the six capitals and their optimum conditions, as defined by goals, or equilibrium between capitals).
The principle of effectiveness states that a company becomes more effective the more it manages to achieve its management goals during a given period. The principle of efficiency states that a company becomes more efficient the faster managers reach the equilibrium point between the current levels of each of the six capitals and their optimal states (as determined by goals), as well as the balance between the capitals.
Management goals determine the optimal values of the six capitals. Goals can be material, economic, or qualitative, such as introducing a new product to the market, building a new production plant, improving the availability of municipal services for residents, or reducing costs, etc.
Managing a company is an ongoing process that involves continuous efforts to achieve one or more goals while balancing the level of the company's capitals. The goal is to make sure that each capital's value approaches the goals' ideal level. It is essential for managers to recognize that effectiveness in goal achievement and efficiency (capital equilibrium) often conflict with each other. A company's effectiveness increases as it achieves its goals.
Determining the degree of accomplishment of managerial goals can be relatively straightforward, requiring no specific formulas or indicators. However, assessing the level of capital equilibrium is a more intricate task. A company’s progress toward reaching the equilibrium point can be calculated in various ways. For instance, it can be calculated as the quotient of the sum of differences between the current values of each capital and their ideal values, ensuring a balance. The subsequent step is to divide this outcome by the quantity of capitals used in the calculations. In management, key factors like the average percentage difference of capitals and weighted capital differences are crucial. These factors should be used as measures rather than relying on profits.
Consider a company with n capitals. Let , where i = 1, ..., n, represent the present values of these n capitals, and , where i = 1, ..., n, represent their target values. Additionally, let K denote the sum of the present capitals, i.e., K = , which we will interpret as the company's value.
1. Mean percentage difference technique
The mean percentage difference coefficient (alternatively, the coefficient of mean capital mismatch) is defined as the maximum of two values: 1 minus the average of absolute differences between present and target capitals, divided by present capitals, and zero. It will be denoted as MPD, using the initials of the English name, and expressed by the following formula:
The MPD coefficient reflects the mean mismatch of capitals. It is highly sensitive to significant deviations in any of the capitals, while remaining considerably less responsive to small discrepancies across multiple areas simultaneously. When the MPD value is close to 1, it indicates that all capitals are close to the expected optimal level. Conversely, when its value is close to 0, there are two possibilities: either all capitals deviate significantly from the expected values, or at least one of them differs drastically from the expected value.
2. Weighted capital difference method
The second efficiency metric of the company is defined as the maximum of two values: 1 minus the weighted average of absolute differences between present and target capitals. The weights are the ratios of the present capital values to the company's value, further divided by the sum of the squared ratios of the present values to the company's value and zero. It is named WCD, using the initials of the English name, and expressed by the following formula:
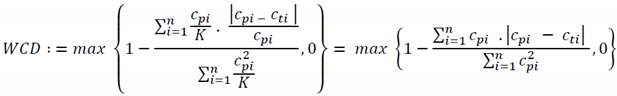
The WCD coefficient determines the efficiency of the entire company. By weighting the differences of each constituent capital based on its share in the total company value, it effectively describes the overall condition yet remains less sensitive to drastic deviations in capitals with the lowest present values. When the WCD value is close to 1, it indicates that the changes needed to achieve an ideal capital distribution should be minor. Conversely, when its value is close to 0, the most critical capitals for the company (i.e., those currently with the highest values) are at a very unfavorable level.
It is crucial to highlight that a comprehensive understanding of the company's status is achieved only when both coefficients are taken into account. While WCD provides a solid overview of the overall company condition, MPD captures significant deviations from target values on individual capitals, even those with the lowest present values. For optimal resource utilization, every manager's objective should be to keep both of these coefficients at their highest levels, ideally close to 1. This is because a balanced distribution of capital values corresponds to the highest efficiency for the company.
The notion of capital balancing, as delineated in this document, was first presented in Polish in 2019 [1] and subsequently translated into English in 2020 [2]. In light of evolving experiences, the assumptions underlying the concept were revised in the years that followed [3,4]. Between 2020 and 2022, a number of Polish industrial and service companies began using the novel capital balancing management technique in a preliminary capacity. The first capital valuation for sustainable capital management and the first implementation trial were carried out in the food industry at Pamapol in Ruś, Poland, a company listed on the Warsaw Stock Exchange. A detailed account of the valuation and capital balancing process can be found in the Economies journal [2]. During that same period, valuations were conducted at Delia Cosmetics in Konstantynów, a manufacturer of cosmetics; Izodom 2000 Sp. z o.o. in Zduńska Wola, a producer of houses and building supplies; and the Municipal Water and Sewage Company in Sieradz. In total, 14 companies undertook implementation efforts between 2020 and 2023.
The fundamental takeaway from the pilot implementations is that the capital balancing method proves viable for economic analysis and evaluating the company's situation and management decisions, serving as a compelling alternative to the conventional approach reliant on profit-based income statement formulas. Nevertheless, the implementation process revealed various barriers and constraints:
- Problems with capital valuation. What seemed to work best in research were cost-based methods (except for social capital valuation), modified for business purposes, mainly because they are relatively simple and based on actual financial and accounting information rather than estimates. The simplicity of the methods did not translate into their efficiency. For example, advertising expenditures do not always translate into higher market capitalization, higher sales, or even a better reputation for the business. The valuation of the entire business was not any less flawed.
- Challenges with trust in social capital valuation, especially internal social capital, conducted without the involvement of external experts and surveyors. Employee mistrust was not significantly reduced by using the anonymous CAWI method; on the contrary, it increased the percentage of surveys that were left unfinished or abandoned.
- Management goals have varying significance for a company. However, in the method used, no weights were assigned to individual goals. This led to more or less successful attempts to break down larger goals into a series of smaller ones.
- The lengthy valuation process, which resulted in several weeks of waiting for the results, showed that the method can be used for other purposes, such as yearly evaluations. For the needs of modern management, it is not yet practical, though. The entire process could be shortened considerably with the use of computer programs that make data collection and processing easier, but at the time, these programs were not available.
Taking into account the mentioned challenges, along with others not explicitly stated, employees assigned to implement the method often sought external expert support at nearly every stage, even after prior training. In response, a decision was made to streamline the method significantly. The aim was to mitigate challenges and ensure it was ready for independent implementation within a company, eliminating the need for external expert involvement.
2. Sources
The concept of sustainable enterprise capital management has strong scientific foundations and directly derives from several economic theories and methods. These include:
• The notion of organizational equilibrium pertains to the state of the relationships that occur between an organization and its surroundings, as well as within the organization itself, which is largely constant and varies only to a limited extent. However, it is viewed as a prerequisite for the efficiency of management procedures, which serve as the foundation for the organization's continued growth and operation. Throughout history, the importance of equilibrium has been acknowledged in various contexts, including the yin and yang concept in Chinese philosophy. At present, organizational equilibrium is a notion that can be identified in the works of H. Fayol, H. Mintzberg, G. Morgan, and H. Volberda [5,6,7,8].
• Systems Approach: a concept that emerged and evolved in the scientific realm during the 1950s and 1960s. The foundation of this methodology is regarding the entities under investigation (enterprises, in this case, businesses) as assemblages of interrelated components that constitute a novel entity that distinguishes itself within its surroundings [9,10,11,12,13,14].
• The Resource and Competence Theory asserts that a company's strength is primarily derived from the knowledge of its workforce and technological potential. According to proponents of this theory, the growth of a company results from two key mechanisms: the managerial ability to process information and the managers' perception of new ways to utilize excess resources. It is essential to note that a company, viewed as a collection of resources, operates in conditions of continuous disequilibrium [15,16,17,18].
• The Theory of Intellectual Capital highlights that a business encompasses more than just physical assets like buildings, machinery, and financial resources. This theory has been instrumental in elucidating the diverse capitals or resources that constitute a company. It offers a systematic framework to categorize the different types of capitals inherent in a business, including tangible, structural, financial, market, human, and social capitals. Moreover, it lays the foundation for principles guiding sustainable management practices [19,20,21,22,23].
• The incorporation of human and social capital theories has been instrumental in shaping the valuation technique outlined in this paper. The understanding of the valuation techniques for these capitals played a pivotal role in the development of this approach. It is worth noting that these theories played a crucial role in enabling the incorporation of both of these new capitals into the wider range of business capitals that define a company. Given that research on these capitals has spanned more than a century, the term "new" does not pertain to the current state of knowledge. Instead, it denotes their impartial treatment on the balance sheet of a company, akin to other forms of capital that have a substantial influence on the business's sustainability and development. Although human and social capital have been the subject of extensive empirical research and scholarly literature, their practical integration with other facets of business management has been comparatively unexplored [24,25,26,27,28,29,30,31].
The Sustainable Management Method primarily emphasizes the achievement of enterprise goals (effectiveness) and the balance of various capitals (efficiency). The determination of these goals is intentionally left to the independent decision-making of managers. However, contrary to initial impressions, this process is neither easy nor straightforward. The ultimate purpose of enterprise actions and managerial decisions continues to be a topic of contention in the literature. Economists, researchers in economics, and management scholars have been engaged in a debate on this matter for well over a century, spanning from the late 1800s to contemporary times [32,33,34,35]. There is ongoing debate about whether the long-established and widely criticized managerial theories, which are more or less associated with profit, still play a significant role in the practical determination of corporate goals. A particularly contested aspect is the theory that positions growth as the paramount objective for a company and the model proposing the maximization of the growth rate by E.T. Penrose and R. Marris [36,37,38,39,40,41]. It seems that the descriptive (simplified) concept of balancing capitals aligns closely with the idea of rationality in human decision-making. It represents a shift from the concept of individuals possessing unlimited computational abilities, considering all available choices, and maximizing utilities to the notion of decision-making processes based on achieving "satisfactory" outcomes through imperfect rules. Simon postulated that with regard to enterprises, they strive for satisfactory outcomes rather than optimal ones, with the intention of attaining satisfactory results rather than necessarily the best. Simon and other behaviorists, such as J.G. March and R.M. Cyert, substantially expanded upon this theory of rational choice [42,43,44,45].
3. Results: a concept of a simplified model for balancing company capitals
The refined version of sustainable capital management, incorporating a valuation of capital, underwent pilot implementations from 2020 to 2022. This updated descriptive method of balancing capitals, while preserving the core principles of pursuing capital equilibrium (efficiency) and concurrently attaining managerial objectives (effectiveness), introduces several modifications compared to its predecessor:
• It adopts a descriptive and evaluative approach to determine the levels of capitals without assigning monetary values. The pilot phase revealed that managers adeptly handle descriptions and assessments of capital levels. The technique has been significantly simplified, relying primarily on the arithmetic mean for calculations and omitting intricate formulas for enhanced comprehension and interpretation. Furthermore, the assessments of capital levels correspond to familiar evaluations commonly taught in educational settings. As such, it can be implemented within companies without the need for external advisors.
• It seamlessly integrates management goals (effectiveness) with capital equilibrium (efficiency), attributing weights (importance) to goals based on their varying impact on the company's operations. In practical terms, the attainment of management goals (target levels for individual capitals) reflects the efficacy of management, while the actual level of capitals signifies the company's present condition.
In order for companies to employ the simplified technique to manage capital equilibrium, auxiliary tables are utilized to improve assessment transparency and expedite calculations. Smaller businesses could use the tables listed in this paper for calculations, either directly in an Excel spreadsheet or via a specially designed computer application.
Before commencing with sustainable capital management, four essential steps need to be taken.
1) In the initial step, the company's leadership defines the types of capital, dimensions, and attributes that will undergo subsequent evaluation. Compiling the types of capitals, their dimensions, and their attributes receives approval, such as from the supervisory board. Notably, the technique does not presuppose a universal template for capitals' quantity and type, dimensions, or attributes. The company's management defines them, striving to encompass not only the most pivotal areas and issues but also those of lesser importance for the board's assessment but crucial to the company’s operation. Although the number of dimensions can vary, it is best to limit them to capitals that are highly relevant to the distinctive qualities of the company; ideally, there should be no more than 4-5 dimensions in any given capital. Making a comprehensive compilation is the goal. On the other hand, it ought to stay away from being overly specific in order to prevent a clouded view and make management and assessment easier. It should be remembered that this compilation will impact the process of capital balancing during the management process.
Table 1 and Table 2 provide examples of how capitals can be categorized into dimensions and attributes for two types of enterprises. Table 1 focuses on a company in a competitive market, while Table 2 represents a municipal enterprise owned by the local government, with its primary goal being public utility and undertaking activities to enhance residents' quality of life and support local businesses. This involves not only various approaches to defining capital dimensions and their attributes but also a particular focus on particular capital. In a competitive market, elaborate market capital becomes crucial for businesses. Market capital is significant, but not the most important factor, when it comes to a municipal enterprise that provides public utility services.
In the process of assigning specific dimensions to individual capitals, maintaining flexibility and considering the unique characteristics of the enterprise are crucial. Based on the authors' experiences in implementing the sustainable capital management method, it is noted that determining dimensions for human and social capital often poses challenges. Nonetheless, the dimensions and attributes share some similarities across different enterprises. Table 1 shows examples of six human capital dimensions and four social capital dimensions. It is obvious that additional dimensions may exist within each capital, and while some attributes can be recognized as capitals, it is recommended that they be limited in number in order to ensure a clear evaluation process.
Table 1 provides dimensions and attributes for two aspects of human capital and social capital as examples. It needs to be expanded to include the remaining four capitals, along with their dimensions and attributes. As mentioned earlier, these recommendations are intentionally not included in the table to avoid implying a rigid pattern and to allow for flexibility, considering the unique characteristics of each company. The following are suggestions and recommendations in this regard:
1. In the context of tangible assets, likely applicable to every business, the evaluation criteria would typically encompass dimensions such as production or service potential, with associated attributes (such as size and allocation of production factors in relation to the market and one’s possibilities, and the completeness and logic of asset utilization [or usefulness]), and additional factors like innovativeness (the capability and motivation for seeking and applying research results, and the level of implementation maturity). It makes sense to include technology as a dimension of tangible assets, since investments in R&D or buying new technologies are where the real value lies. However, technologies themselves exist in the form of physical documentation, which makes them an important part of structural capital. Beyond production potential, innovativeness, and technology, it may be worthwhile to consider the inclusion of factors such as modernity (automation, robotics, etc.) and reliability or dependability, depending on the specific nature of the enterprise. The latter dimension is particularly pertinent for businesses offering services to residents or other businesses (e.g., water, energy, municipal waste, transportation). When evaluating environmental protection levels, this can be factored into tangible assets or structural capital as a distinct ecological dimension. Alternatively, the environmental concern can be addressed by distributing attributes for assessment across individual (practically all) capitals, given its multifaceted nature, touching on product, technological, legal, financial, and social aspects.
2. In the realm of structural capital, several pivotal dimensions play a crucial role in ensuring the smooth operation of any enterprise. Acting as a binding element, it bridges tangible capital with other essential forms, particularly human and financial capital. Within any company, this type of capital must have a legal dimension (embracing concessions, licenses, permits, certificates, decisions, property rights [ownership], and limited property rights like rights of use, pledges, mortgages), an organizational dimension (covering organization, competencies, and responsibilities), a motivational dimension (notably, focusing on the motivation system, as individual employee motivation is addressed in social capital), and a dimension of computerization and digitization (highlighting the operational functionality and security of the system—where hardware falls under tangible capital, and all information within the system pertains to market, financial, and human capital). A crucial consideration arises regarding whether to include the dimension of occupational safety within this structural capital or in the realm of human capital. The omission of this dimension from Table 1 implies that this vital aspect, integral to most enterprises, might be more appropriately situated within the structural capital framework.
3. In financial capital, two traditional economic indicators are crucial for assessment and must not be overlooked: the dimension of financial liquidity (comprising the ability for short-term and long-term payments) and the dimension of indebtedness (including both short-term and long-term debt arrangements). Consideration should be given to incorporating dimensions such as financial capacity (especially in terms of one’s capacity for development funding), rationality in spending, financial effectiveness (also in the traditional sense of the ratio of effectiveness), methods of financing, and the taxation settlement system within the financial capital.
4. The dimensions chosen for assessing market capital can vary significantly, especially due to the diverse nature of businesses operating in different industries. This diversity is particularly noticeable in companies engaged in trade, where these dimensions are likely to be highly developed. Differences in market competitiveness, levels of product innovation, and other industry-specific factors contribute to this variability. Among the dimensions that are expected to be present in the majority of enterprises are markets, products (with a focus on the business readiness level and product brand), product quality (covering functionality, reliability, aesthetics, and ergonomics), company brand (including recognition, customer trust, and uniqueness), supply chains, and competitiveness (location, pricing, customer service, sales systems, and warranties).
2) In the second stage, the company's executive team engages in a comprehensive description and evaluative scoring of each capital's level across various dimensions, utilizing the previously-outlined description. It is imperative to emphasize that this evaluation does not align with the conventional approach to valuation, which is reflected in the straightforward capital balancing method. Conversely, it represents a managerial approximation predicated on the information presently accessible within the organization as well as its external environment. The level of internal social capital is an exception, requiring an anonymous survey among employees for determination. The evaluation is then presented to the supervisory board and/or the owner, allowing for feedback and potential objections.
In the simplified method, we adopted a straightforward point system based on widely known school-style assessments (see Table 2).

Table 2.
The capital level index and the adjustment of capital levels index.
| Point Index | Overall level of capital in a given dimension (l) | Aligment (consistency) of the level of capital in a given dimension to the other capitals (c) |
|---|---|---|
| 5.0 | exceptionally high level of capital, aligning seamlessly with both current and (partially or fully) anticipated future requirements of the enterprise | very good alignment of the level with all other capitals. |
| 4.5 | high level of capital, fully meeting the current needs of the enterprise | very good alignment of the level with all other capitals, with exceptions |
| 4.0 | moderately high level of capital, sufficient for the current needs of the enterprise. | good alignment of the level with all other capitals |
| 3.5 | moderate level of capital, sufficient for the current needs of the enterprise | good alignment of the level with all other capitals, with exceptions |
| 3.0 | low capital level, with limitations and deficiencies in meeting the current needs of the enterprise | sufficient alignment of the level with all other capitals |
| 2.0 | very low capital level, with significant limitations and deficiencies in meeting the current needs of the enterprise | significant deficiencies and limitations in terms of aligning the level with other capitals |
Below is an illustrative format of the table after the second stage (Table 3).
The overall level of capitals (L) will be calculated as the arithmetic mean of individual indices, while the level of alignment (consistency) of capitals (C) will be computed as the arithmetic mean of individual indices.
where p stands for the value of the point index (Table 4, column 4), whereas n stands for the number of dimensions.
where c stands for the value of the point index (Table 4, column 5), whereas n stands for the number of dimensions.
The assessment of the two indices, L and C, serves as an indicator of the enterprise's efficiency, calculated as the equilibrium level among capitals. The capital level index, L, is quantified in a range of values: a top value of 5.0 indicates an exceptionally high level of capital that fully or partially satisfies present and future enterprise needs (refer to Table 3); a bottom value of 2.0 indicates an exceptionally low level of capital characterized by significant constraints and inadequacies in meeting current enterprise requirements. Concurrently, the alignment (consistency) index of capitals, denoted as C, will exhibit a range of values between 5.0 and 2.0. A value of 5.0 signifies a high degree of congruence among the capital levels, while a value of 2.0 exposes notable deficiencies and constraints in the process of harmonizing the levels of one capital with the others.
Just as in the case of the value-based capital balancing method introduced earlier, it is advisable to compute both indices in this scenario. Only when both indices are considered together do they accurately reflect the equilibrium level. The data from Table 4 (columns 5 and 7) also enable the calculation of the efficiency of individual capitals, which can be beneficial when substantial variations exist in the levels between capitals, and/or when there are numerous dimensions within each capital, such as five or more.
3) In the third step of the process, following the description and assessment of the current levels of capitals across various dimensions, the focus shifts to the initial stage of future planning. This involves establishing both long-term and short-term managerial objectives, serving as target benchmarks for each capital at the conclusion of the designated period. These objectives should be derived from an analysis of the existing capital levels, an evaluation of the business environment, and consideration of owner expectations.
Annual goals are designed to align with and contribute to the accomplishment of long-term objectives. Each capital (tangible, structural, financial, market, human, and social) should have specific goals, typically more than one but not exceeding the number of dimensions within each capital. While it is common for a single goal to be assigned to one dimension, there may be dimensions without explicit managerial objectives, or alternatively, one dimension may have multiple goals.
Long-term goals often align with the overarching vision of the company, while annual goals may represent incremental progress toward these long-term aspirations. However, the process of defining goals is typically led by management and then subject to approval by the owner. Depending on the organizational structure, the board of directors may assume the owner's role in goal approval, providing valuable insights. The review and endorsement of goals by the owner or a designated body are pivotal because the achievement of both short-term and long-term objectives will gauge the management's effectiveness, and this linkage is integral to executive compensation.
Crucially, it is important to define the timeframes for achieving these short-term and long-term goals. Short-term objectives may often have a quarterly perspective, while long-term goals may span a period of 3 to 5 years. However, it is worth noting that short-term goals might be set on a quarterly basis, whereas long-term goals could have a horizon of 10 years or more.
The method's creators rule out pursuing any type of profit as a goal in financial capital, as it contradicts the method's underlying principles. Instead, viable objectives could include enhancing financial liquidity, reducing debt, boosting revenues, or cutting costs.
4) The final step in the process before initiating sustainable capital management is determining the weights assigned to each managerial objective. This aspect is of utmost importance, as the weight levels serve to emphasize the significance of specific objectives and impact the extent to which the capitals adjust to one another. The collective determination of the weight of an objective is based on its characteristics (c). Multiple attributes can be considered and decided upon by the management. It is crucial to include the last two attributes listed below: the impact on achieving long-term goals and the impact on balancing capitals, each assigned no less than 50% of the points (see below). Below are some examples of such attributes:
- attribute 1 (k1): positively influences the development of the company,
- attribute 2 (k2): positively impacts the efficient and secure operation of the company,
- attribute 3 (k3): positively contributes to the achievement of a specific long-term goal,
- attribute 4 (k4): positively influences the balancing of a given capital in relation to other capitals.
Each attribute should be assigned a point value based on the assessment of its impact, with the total sum equaling 100 points. For example, the point distribution could be equal (though not mandatory): attribute 1 = 25 points, attribute 2 = 25 points, attribute 3 = 25 points, and attribute 4 = 25 points.
The evaluations follow the same process as in the previous stages, conducted by the management, endorsed by the owner, or possibly reviewed by the board, which may provide input and ultimately require the owner's approval. In order to determine the ultimate importance of a particular attribute, a scale is utilized to denote different degrees of acceptance (p) for said attribute: 4 - "strongly agree," 3 - "partially agree," 2 - "disagree to some extent," 1 - "strongly disagree."
With this framework, the weight of a particular objective will range from 0.25 (when all attributes attain the minimum level of alignment, i.e., 1) to 1.0 (for highly crucial objectives, when all attributes achieve the maximum level of alignment, i.e., 4). Table 5 and the formula for a weighted average can be utilized to determine the weight of a specific managerial objective.
Table 4.
An example of a table that facilitates the calculation of the weight (w) for a specific managerial objective.
Table 4.
An example of a table that facilitates the calculation of the weight (w) for a specific managerial objective.
| Calculation of the weight for specific managerial objectives | Acceptance scale | |||
|---|---|---|---|---|
| strongly agree (p4) | partially agree (p3) | disagree to some extent (p2) | strongly disagree (p1) | |
| attribute 1 (k1) | ||||
| attribute 2 (k2) | ||||
| attribute 3 (k3) | ||||
| attribute 4 (k4) | ||||
Hence, the weight of a managerial objective (w) is derived from the weighted average:
The weight of the same managerial objective remains consistent (w) in both short- and long-term perspectives. This ends the preparation phase and initial assessments, initiating the management process based on goal accomplishment and concurrent capital equilibrium.
Upon the completion of the specified sustainable management period (quarter, calendar year), the management assesses the extent of successfully accomplishing managerial goals (both short- and long-term) (G) and evaluates the level of individual capitals (L) along with their alignment (C) with other capitals (Table 5 and Table 6). The owner or the designated body conducts a review and approval procedure for this evaluation.
The assessments unfold in two steps, with a slight adjustment in their sequence compared to the steps in the preparatory stage.
1) We evaluate the attainment of managerial objectives, reflecting the efficiency of management.
A general indicator of managerial goal accomplishment (G), a gauge of management efficiency within the company, is calculated as the average product of achieving short-term goals (Gs) and long-term goals ():
The level of accomplishment for short-term goals (Gs) and long-term goals (Gl) is determined by calculating the degree of goal fulfillment in specific dimensions of individual capitals.
In evaluating the extent of short-term goal accomplishment (Table 6) across various dimensions, a simple point scale is utilized:
- full accomplishment of the managerial goal: 1.0
- partial accomplishment of the managerial goal with minor gaps: 0.75
- partial accomplishment of the managerial goal with significant gaps: 0.5
- minimal accomplishment of the managerial goal: 0.25
- no accomplishment of the managerial goal: 0.0
Table 5.
Assessing the extent of accomplishment of short-term managerial goals.
| Types of capital | Capital dimension | Short-term managerial goals | A description of the level of goal accomplishment | Point assessment of goal accomplishment (s) | Weighted point value of the goal (w) | Adjusted assessment of accomplishment ( s * w ) |
|---|---|---|---|---|---|---|
| Tangible | ||||||
| Structural | ||||||
| Financial | ||||||
| Market | ||||||
| Human | ||||||
| Social | ||||||
The extent of successful accomplishment of short-term goals (Gs) is the sum of the products of the assessment of each goal in a specific dimension (s) and the weight of that goal (w), divided by the number of goals (n):
For evaluating the degree of accomplishment of long-term goals (Gl), a simple scale is employed, indicating a positive impact on the long-term objective: 1.0 very significant; 0.75 significant; 0.5 moderate; 0.25 small; 0.0 none.
Table 6.
Assessing the extent of accomplishment of long-term managerial goals.
| Types of capital | Capital dimension | Long-term managerial goals | A description of the level of goal accomplishment | Point assessment of goal accomplishment (s) | Weighted point value of the goal (w) | Adjusted assessment of accomplishment ( s * w ) |
|---|---|---|---|---|---|---|
| Tangible | ||||||
| Structural | ||||||
| Financial | ||||||
| Market | ||||||
| Human | ||||||
| Social | ||||||
Assessing the extent of accomplishment of long-term managerial goals () is the sum of the products of the assessment of each goal in a specific dimension and capital (l), multiplied by the weight of that goal (w), divided by the number of goals (n):
An evaluation of the extent of achievement of managerial goals should serve as the basis for assessing the management's effectiveness and the compensation they receive. Meanwhile, the assessment of the level of capitals should be the starting point for the pursuit of subsequent managerial objectives.
1) evaluating capital levelsand capital alignment (the effectiveness of the company)
Conducting an assessment of the accomplishment of managerial goals serves as the basis for evaluating the status of individual capitals (L) after a quarter or a year, along with their alignment (compliance) with other capitals (C), as outlined in Table 7. The evaluation of individual capital levels and their alignment is conducted using the indexes provided in Table 2.
The overall level of capitals (L) is calculated in the same manner as at the beginning of the assessment period—as the arithmetic mean of individual indexes. In the same way, at the beginning of the assessment period, the level of alignment of capitals (compliance) (C) is calculated as the arithmetic mean of individual indexes.
where p stands for the level point index value (Table 4, column 4), whereas n stands for the number of dimensions.
where c stands for the level point index value (Table 4, column 5), whereas n stands for the number of dimensions.
To summarize, the outcome of managerial efforts manifests as the company's current status, while the assessment results furnish insights into the management efficiency (G) and overall effectiveness (level L and compliance C) of the enterprise. It is crucial to keep in mind that efficiency indicators reflect the consequences of actions over a defined period (e.g., a quarter or a year), akin to a traditional income statement. Meanwhile, effectiveness gauges the company's standing at a specific point, reminiscent of a traditional balance sheet.
The final outcomes of the assessment are encapsulated in three indicators of sustainable management:
1. The overall index of managerial goal accomplishment (G), a gauge of management efficacy within the company, (G), is calculated as the average product of the achievement of short-term goals (Gs) and long-term goals (Gl).
2. The Capital Level Index (L), indicating the efficiency of the enterprise, is calculated as the average arithmetic mean of the individual point indices of the capital level after the achievement of management goals. The higher the index (5.0 or close to this value), meaning fully responsive to current and future needs of the enterprise (partially or fully), the higher the efficiency of the enterprise.
3. Alignment index The Capital Alignment Index (C) serves as an indicator of the alignment levels between various capitals, providing insights into the overall efficiency of the enterprise. This index is computed by averaging the individual point indices of the capitals following the accomplishment of managerial goals. A higher index, approaching 5.0, signifies excellent alignment with all other capitals and corresponds to heightened efficiency within the enterprise.
As previously noted, the G index serves as a dynamic assessment of goal accomplishment within a specific period (similar to the income statement in traditional accounting). Therefore, it is possible to compare G indices across different periods, bearing in mind that goals, their difficulty levels, and various contextual factors may differ between periods. On the other hand, the L and C indices are static, representing the level and alignment at a specific moment (similar to that of the balance sheet in traditional accounting). While Table 8 introduces the option to compare levels and alignments across periods in column 7, it is not recommended as it may lead to misleading conclusions. This could pose a problem, given the managers' inclination to habitually compare balance sheet positions.
4. Discussion
Is sustainable capital management capable of replacing the traditional and somewhat outdated use of profit and loss statements and balance sheets in modern businesses? Traditional measurement principles based on profit, assets, and liabilities will and should certainly remain. Their primary role should be confined to tax-related matters or valuing shares or stocks, operating in areas where they are necessary, and fulfilling their purpose. From a practical management standpoint, managers and shareholders should prioritize sustainable capital management, enabling increased efficiency and effectiveness. For this purpose, it is not important whether we utilize a sophisticated capital balancing model based on a tangible valuation of capitals using monetary values or opt for the simplified descriptive-estimation method outlined in this article.
The question of whether effectiveness and efficiency, as per the capital balancing method, align with contemporary notions of profitability is pivotal. In addressing this query, it is essential to bear in mind that the capital balancing method is rooted in various scientific theories, primarily the theory of resources. Therefore, it cannot be equated with the traditional concept of profit, defined as the difference between revenue and costs. However, conventional accounting practices also incorporate indicators, particularly within the framework of the balance sheet, that serve as reflections of the organization's financial status. These variables are correlatable with the method of capital balancing. Although there are certain conditions that must be met, it is possible to affirm that this method is compatible with these indicators: firstly, provided that these indicators show that resource utilization is being optimized, and secondly, if they do so comprehensively, taking into account the entire company's capitals. Regrettably, practical applications do not consistently correspond to this. Nevertheless, it is important to acknowledge that although the capital balancing approach abstains from using profit as a metric, it does employ conventional and efficacious indicators including debt, liquidity level, and efficiency to achieve financial capital balancing.
Introducing sustainable capital management in businesses can be supported by several key arguments:
• Indicators of sustainable management not only replace the outdated concept of profit as a metric or even the primary objective of business activities but also introduce alternative measures based on efficiency and effectiveness. When it comes to maximizing the utilization of a company's resources (capitals), profit does not provide a comprehensive measure. The emphasis by shareholders or managers on profit and the determination to achieve it at any cost often lead to the squandering of resources, both tangible and human, while overshadowing considerations for the future. In this context, the method of balancing capitals shifts the perspective on what is essential and what is optimal for companies, employees, and the overall economy.
• The sustainable management approach incorporates two capitals—human and social—in the calculation of a company's efficiency. While their significance has been acknowledged in both theory and practice, the calculation of efficiency for investments in human and social capital has been relatively uncommon. It is crucial to treat these capitals as integral values for the company in the accounting process, in the same manner as tangible, financial, or market capital. The significance of this matter stems from the current recognition that human and social capitals are substantial factors that contribute to the efficiency of businesses. The failure to account for these capitals in the income and balance sheets when calculating profits prevented managers from recognizing the direct effects of investments in them. Despite possessing knowledge of the significant impact these investments had on the company's outcomes, managers encountered difficulties in justifying spending money on them; as a consequence, they adopted a cautious approach in allocating funds to both human and, particularly, social capital.
• Ensuring a clear separation between the evaluation of managerial effectiveness and the assessment of the company's overall situation is crucial. The question of whether a company's profit is a direct result of the efforts of its management and workforce or influenced by various internal and external factors remains somewhat unanswered. It is plausible that even when management and employees perform exceptionally well, external conditions may prevent the company from turning a profit, and vice versa. Implementing a management approach based on balancing capitals it becomes clear that the extent to which managerial goals have been accomplished, reflected in how well the targeted level of capitals has been reached, serves as a measurable indicator of management efficacy. Concurrently, a description of these capital levels offers insights into the market and the company’s financial, social, regulatory, and technological position. This approach eliminates a potential issue where managers occupying lucrative positions receive higher compensation than those with higher competencies who might be dedicated to guiding businesses through times of crisis not caused by their actions but by external factors.
• The new method prohibits the utilization of what is generally referred to as "creative accounting" for managerial objectives. Although the process of determining profit for the income statement may appear straightforward, the proliferation of legal regulations necessitates the provision of specialized services. Furthermore, occurrences like favorable or negative fluctuations in exchange rates or the sale of unneeded assets at a loss may appear in this statement, casting doubt on the company's true financial status and occasionally impeding planning, which is essential for efficient management. Furthermore, profit can be easily instrumentally exploited. Consider an international holding company that, for example, maximizes the compensation of suppliers who work for a different company within the holding that is located abroad, making it simple to transfer profits to a tax haven nation. Using profit as a metric for assessing the company's condition can lead to errors and a decrease in the diligence of executives and owners. There may exist a scenario in which a company generates a profit but is saddled with excessive debt or lacks sufficient financial liquidity to repay its obligations. Finally, an important thing to keep in mind is that being exact and detailed in profit estimates may be required for tax purposes, but they can get in the way of good management. Furthermore, managers are provided with ex post facto profit-related information.
• Introducing the sustainable capital management approach to companies does not require any changes to existing legal regulations, even those that are of the lowest priority. Companies continue to conduct financial reporting according to existing legal regulations, and, in particular, tax calculation will remain unchanged. The difference lies in the fact that managers, in the management process, adhere to the principles of sustainable capital management.
What potential weaknesses in sustainable capital management exist?
• It is imperative to draw attention to what could be the biggest barrier impeding the implementation of sustainable capital management. This is related to long-standing habits and deeply held beliefs that profit is a universal and optimal metric, or the ultimate goal, when it comes to management. This conventional wisdom, instilled during economics courses, provides a level of comfort for managers who might not like learning and implementing novel techniques. Managers are also mindful that errors are unavoidable in the early stages, which acts as an obvious deterrent to breaking with the common ground of conventional profit-centric accounting in management. Moreover, a great number of powerful organizations, both financial and non-financial, are based on this profit-based philosophy. Revenues and costs are as ingrained in the managerial mindset as profit itself. For many managers, the primary focus remains to boost revenue or decrease expenses, which serves as an unwavering objective and priority that guides their managerial choices. Making the shift to a mentality that is focused on capitals and their balance is quite difficult.
• Precise assessment of the social capital level—especially its internal dimension—is critical to the sustainable management approach's success. The 2020–2023 experiences highlight a common problem that many organizations face: employees' mistrust of one another when it comes to freely expressing their opinions, even when they are promised research anonymity. In order to tackle this, a computer application that has the potential to improve the anonymity of employee feedback must be developed.
• The subjective nature of data, especially assessments, is bound to be perceived as a drawback, especially by individuals who are used to working with hard financial numbers. Because of this, it is crucial to employ the same sources, approaches to interpreting phenomena, and evaluation scales and criteria during the data collection and assessment processes. The challenge lies not so much in the subjectivity itself but in the variability that hampers meaningful comparisons. It is noteworthy that, in defense, managers have never solely based their decision-making on rigid data. In every instance, the experience and even intuition of managers play a significant role. Developing periodic descriptions of capital levels allows managers to gain clarity on priorities and establish goals, not only for themselves but also for their teams.
Author Contributions
Conceptualization, methodology, visualization, and writing—original draft—D.K. Formal analysis, methodology, and writing—original draft—E.J. All authors have read and agreed to the published version of the manuscript.
Funding
This research received no external funding.
Institutional Review Board Statement
Not applicable.
Informed Consent Statement
Not applicable.
Data Availability Statement
Data sharing not applicable.
Conflicts of Interest
The authors declare no conflict of interest.
References
- Klimek, D. Koncepcja zrównoważonego zarządzania kapitałami przedsiębiorstwa. Kwartalnik Naukowy Uczelni Vistula 2019, 4, 44–53. [Google Scholar]
- Klimek, D. Sustainable Enterprise Capital Management. Economies 2020, 8, 12. [Google Scholar] [CrossRef]
- Klimek, D.; Jędrych, E. A Model for the Sustainable Management of Enterprise Capital. Sustainability 2021, 13, 183. [Google Scholar] [CrossRef]
- Jędrych, D.; Klimek, A.; Rzepka, A. Principles of Sustainable Management of Energy Companies: The Case of Poland. Energies 2021, 14, 2042. [Google Scholar] [CrossRef]
- Romanelli, E.; Tushman, M. Organizational transformation as punctuated equilibrium: an empirical test. Academy of Managament Journal 1994, 5, 1141–1166. [Google Scholar] [CrossRef]
- Mano, O. The Difference between Bernard’s and Simon’s Concepts of Organization Equilibrium: Simon’s Misunderstanding about Bernard’s Intention. Economic Journal of Hokkaido University 1994, 23, 13–28. [Google Scholar]
- Koźmiński, A. K.; Obłój, K. Zarys teorii równowagi organizacyjnej. Państwowe Wydawnictwo Ekonomiczne 1989.
- Szałański, M. Diagnozowanie organizacji przy wykorzystaniu teorii równowagi organizacyjnej. Przegląd Organizacji 1998, 5, 14–18. [Google Scholar] [CrossRef]
- Boulding, K. E. General systems theory: The skeleton of science. Management Science 1956, 2, 197–208. [Google Scholar] [CrossRef]
- Kast, F. E. , Rosenzweig, J. E. General systems theory: Applications for organization andmanagement. Academy of Management Journal 1972, 15, 447–465. [Google Scholar] [CrossRef]
- Scott, W. G. Organization theory: A reassessment. Academy of Management Journal 1974, 17, 242–254. [Google Scholar] [CrossRef]
- Ashmos, D.P.; Huber, G.P. The systems paradigm in organization theory: Correct-ing the record and suggesting the future. Academy of Management Review 1987, 12, 607–621. [Google Scholar] [CrossRef]
- Yoon, S.W.; Kuchinke, K.P. Systems theory and technology: Lenses to analyze anorganization. Performance Improvement 2005, 44, 15–20. [Google Scholar] [CrossRef]
- Koźmiński, A.K.; Latusek-Jurczak, D. Rozwój teorii organizacji. Od systemu do sieci. Oficyna Wolters Kluwer business: Warszawa 2011.
- Barney, J. Firm resources and sustained competitive advantage. Journal of Management 1991, 1, 99–120. [Google Scholar] [CrossRef]
- Wernerfelt, B. A resource-based view of the firm’. Strategic Management Journal 1984, 2, 171–180. [Google Scholar] [CrossRef]
- Barney, J.B. Resource-based theories of competitive advantage: A ten-year retrospective onthe resource-based view. Journal of Management 2001, 27, 643–650. [Google Scholar] [CrossRef]
- Montresor, S. Resources, capabilities, competences and the theory of the firm. Journal of Economic Studies 2004, 31, 409–434. [Google Scholar] [CrossRef]
- Bourdieu, P.; Wacquant, L.J.D. An Invitation to Reflexive Sociology. Polity Press, Oxford 1992.
- Boudreau, J.; Ramstad, P. Measuring Intellectual Capital: Learning From Financial History. Human Resource Management 1997, 3, 1–22. [Google Scholar] [CrossRef]
- Edvinsson, L. Developing intellectual capital at Skandia. Long Range Planning 1997, 3, 366–373. [Google Scholar] [CrossRef]
- Bontis, N. Intellectual capital: an exploratory study that develops measures and models. Management Decision 1998, 2, 63–76. [Google Scholar] [CrossRef]
- Stewart, T.A. Intellectual Capital: The New Wealth of Organizations, Bantam Doubleday Dell Publishing Group, New York, NY, 1997.
- Bourdieu, P. The forms of capital. In: J.E. Richardson (ed.) Handbook of theory of research of the sociology of education 1986, pp.241–258. Greenword Press.
- Nahapiet, J. , Ghoshal, S. Social capital, intellectual capital and the organizational advantage. Academy of Management Review 1998, 2, 242–266. [Google Scholar] [CrossRef]
- Coleman, J.S. Social Theory, Social Research, and a Theory of Action. American Journal of Sociology 1986, 91, 1309–35. [Google Scholar] [CrossRef]
- Coleman, J.S. Social capital in the creation of human capital. American Journal of Sociology 1988, 94, 95–120. [Google Scholar] [CrossRef]
- Adler, P.S. , Seok-Woo, K. Social capital: Prospects for a new concept. The Academy of Management Review 2002, 27, 17–40. [Google Scholar]
- Bueno, E.; Salmador, M.P., Rodríguez. The role of social capital in today’s economy empirical evidence and proposal of a new model of intellectual capital. Journal of Intellectual Capital 2004, 4, 556–574. [Google Scholar] [CrossRef]
- Jędrych, E.; Klimek, D. (2018) Social Capital in the Company (Meat and Vegetable Processing Industry). Proceedings of the 2018 International Scientific Economic Sciences Agribusiness Rural Econonomy 2018, 2, 300–305. [Google Scholar]
- Jędrych, E.; Klimek, D.; Rzepka, A. . Social Capital in Energy Enterprises: Poland’s Case. Energies 2022, 15, 546. [Google Scholar] [CrossRef]
- Hawley, F.B. Enterprise and Profit. The Quarterly Journal of Economics 1900, 15, 75–105. [Google Scholar] [CrossRef]
- Hawley, F.B. The Controversy about the Capital Concept. The Quarterly Journal of Economics 1908, 22, 467–475. [Google Scholar] [CrossRef]
- Beckerath, H. MacGregor's Enterprise Purpose and Profit. The Quarterly Journal of Economics 1936, 50, 2–367. [Google Scholar] [CrossRef]
- Klimek, D. Management objectives of a municipal company – the solution to good management? Organizacja i Zarządzanie : kwartalnik naukowy 2019, 1, 27–36. [Google Scholar]
- Penrose, E.T. Limits to the growth and size of firms. American Economic Review 1955, 45, 531–543. [Google Scholar]
- Penrose, E.T. Foreign investment and the growth of the firm. Economic Journal 1956, 66, 220–235. [Google Scholar] [CrossRef]
- Penrose, E.T. The Theory of the Growth of the Firm. Basil Blackwell, Oxford 1959.
- Penrose, E.T. The growth of the firm: A case study: The Hercules Powder Company. Business History Review 1960, 34, 1–23. [Google Scholar] [CrossRef]
- Marris, R. A Model of the “Managerial” Enterprise. The Quartely Journal of Economics 1963, 77, 185–209. [Google Scholar] [CrossRef]
- Marris, R. The Economic Theory of Managerial Capitalism, MacMillan: London, UK, 1964.
- Simon, H. Models of man, social and rational: Mathematical essays on rational human behavior in a social setting; Wiley: New York, USA, 1957. [Google Scholar]
- Simon, H. Theories of Decision-Making in Economics and Behavioral Science. The American Economic Review 1959, 49, 253–283. [Google Scholar]
- Simon, H. Rational Decision Making in Business Organizations. American Economic Review 1979, 69, 493–513. [Google Scholar]
- Cyert, R.M.; March, J.G. A Behavioural Theory of the Firm; Englewood Cliffs. Prentice-Hall: New York, USA, 1963. [Google Scholar]
Table 1.
Examples of dimensions and attributes of human and social capital.
| Capital type | Dimension | Atributes |
|---|---|---|
| Human | Knowledge | knowledge gained through employment, formal and specialized education, and the generational structure of knowledge |
| Skills | task-execution abilities (licenses, certificates, and specialized training), aptitude for management and organization | |
| Capabilities and flexibility | the ability to carry out tasks (projects) and work-related subcontracting (multi-skilling) | |
| Experience | The total number of years spent in a specific position, the duration of employment in a particular company, and gap between generations | |
| Costs | acquisition costs, wages, turnover, training, and social costs | |
| Completeness | gaps in employment, recruitment potential, turnover, and health (i.e., absenteeism) | |
| Social | Cognitive | values and norms, proactivity, common language |
| Relational | trust, reciprocity, and motivation for collaboration | |
| Structural | company structure, internal relationship status, and employee status | |
| External relational | relationships with suppliers and customers, relationships with business institutions and local government in the environment |
Table 3.
Table after the second step.
| Types of capital | Dimension of capital | Description of the level of capital in a given dimension and its alignment with other capitals | Level point index (p) | Alignment point index (c) | ||
|---|---|---|---|---|---|---|
| of a given dimension | of a given capital | of a given dimension | of a given capital | |||
| 1 | 2 | 3 | 4 | 5 | 6 | 7 |
| Tangible | ||||||
| Structural | ||||||
| Financial | ||||||
| Market | ||||||
| Human | ||||||
| Social | ||||||
Table 7.
Final assessment of the level and alignment (consistency) of capitals.
| Types of capital | Capital dimension | A description of the level of individual capital in a given dimension after a given period | Level Point Index (p) | Description of alignment to other capitals after a given period | Alignment point index (c) | Point-baseddifference compared to the initial assessment |
|---|---|---|---|---|---|---|
| 1 | 2 | 3 | 4 | 5 | 6 | 7 |
| Tangible | ||||||
| Structural | ||||||
| Financial | ||||||
| Market | ||||||
| Human | ||||||
| Social | ||||||
Disclaimer/Publisher’s Note: The statements, opinions and data contained in all publications are solely those of the individual author(s) and contributor(s) and not of MDPI and/or the editor(s). MDPI and/or the editor(s) disclaim responsibility for any injury to people or property resulting from any ideas, methods, instructions or products referred to in the content. |
© 2023 by the authors. Licensee MDPI, Basel, Switzerland. This article is an open access article distributed under the terms and conditions of the Creative Commons Attribution (CC BY) license (http://creativecommons.org/licenses/by/4.0/).
Copyright: This open access article is published under a Creative Commons CC BY 4.0 license, which permit the free download, distribution, and reuse, provided that the author and preprint are cited in any reuse.


