
Submitted:
17 November 2023
Posted:
20 November 2023
You are already at the latest version
Abstract
The impact of climate change on water resources is a global issue with significant regional
implications. The Ghba subbasin has experienced a higher socioeconomic change. In this
paper, we assess the potential impact of climate change and human activity on water supply
and demand in the Ghba subbasin of Ethiopia. We then evaluate the effectiveness of regional
adaptation strategies for water supply management under these conditions. To do this, we use
the statistical downscaling model (SDSM) and the water assessment and planning tool (WEAP)
to simulate and analyse future water conditions. After running the model through a calibration
and validation process, minimum (Tmin) and maximum (Tmax) temperatures, water demand and
unmet water demand were projected for 2100 horizon, using different climate change
scenarios. The results showed that the model's performance, calibration, and validation were
all satisfactory. The analysis showed that, under A2 and B2 emission scenarios of the
Intergovernmental Panel on Climate Change (IPCC), the mean precipitation will increase by
31% and 26%, respectively. The projected mean Tmax and Tmin will be warmer than the
baseline period, with Tmax increasing by 1.5°C (A2) and 1.3°C (B2), and Tmin by 1.7°C (A2)
and 1.5°C (B2) by 2100. The results also illustrate that in all scenarios, water consumption
would rise and that this need will not be satisfied, and the pressure on water resources will
intensify, resulting in a water shortage. The findings show that future water demand under the
influence of climate change is projected to exceed 210 million cubic meters (MCM) by 2100.
The findings show that while the evaluations of the recommended adaption techniques are
effective, they are not enough to guarantee the Ghba subbasin's water sustainability.
Keywords:
Climate change
; SDSM
; WEAP
; IPCC
; water demand
1. Introduction
The Ghba sub-basin receives a mean annual precipitation of 641mm (Gebremicael et al., 2022; Hiben et al., 2022a). The subbasin is facing growing anthropogenic and socioeconomic activities leading to severe water shortages in recent years (Gebremicael, 2019; Weldegebriel and Yeshitela, 2021). Increasing complexity, uncertainties brought on by climate change and global warming, and shifting socioeconomic conditions characterize current practices while managing water resources. These factors present new challenges that cannot be resolved within the current management paradigm, which uses a command-and-control strategy (Schlüter et al., 2010). According to studies by Rochdane et al. (2012), sub-Saharan African nations will face serious dangers in the next decades from severe fluctuation in water supplies and large drops in streamflow. As the population in the Ghba subbasin increases, there is an increasingly urgent need for water (Hiben et al., 2016). World Bank projects of water infrastructure were designed at addressing this challenge. The assessment of this project’s intervention demonstrates that the subbasin’s water supply has grown considerably as a result of the initiative. However, the increased supply of water has not been able to keep up with the previously established and rising demand (Hiben et al., 2016; Oyedotun, 2017).
Climate change in the Ghba subbasin provides severe threats and difficulties to several sectors, including agriculture, water resources, and energy, all of which sustain the economy and people’s well-being (Roth et al., 2018). Droughts, changes in groundwater and surface water levels, the occurrence of illnesses, and extreme heat are only a few of the main effects of climate change. For example,Gebrehiwot et al. (2011) (Gebremeskel et al., 2018b)identified 8 seasonal droughts within the Nile basin headwaters in the period between 1978 and 1987. Our review has shown that there are drought years and seasons in the various drainage in Ghba subbasin (Gebremedhin, 2019; Gebremeskel et al., 2018b).
Droughts have a significant impact on the basin’s water resources, hydropower production, and agriculture (Miles et al., 2000). Rainfall patterns in the subbasin show cycles over the past forty years (Gebremicael et al., 2022). The studies by Gebremicael et al. (2013), Hiben et al. (2022a) and Gebremicael (2019) shows that there has been no significant change of rainfall in the subbasin, while a significant change has been seen in the amount of flow. However, the catchment experienced a significant increase in low flows following the implementation of intensive soil and water conservation programs (SWC), while the low flow in the control catchment decreased. As per the review studies by Francés et al. (2017), Cervigni and Valentini (2013), and Chesterman et al. (2021) climate-resilient water management planning usually involves setting a series of overarching objectives, including equity, environmental protection, and development priorities, balancing supply and demand, and considering changes in climate’s effects. The principles for the allocation of water resources are efficiency, equity, and sustainability, with the goal of achieving the greatest benefit for society, the environment, and the economy (Hirons et al., 2018).
The main objective of this article is to develop an improved adaptation options under different socioeconomic and climate change scenarios. Hence, the 1st section contains the general introduction and literature review, and the rest of the paper is organized as follows: Section 2 contains the data and methodology. Section 3 contains the results. Section 4 contains the conclusions and policy implications.
2. Data and Methods
2.1. Study Area
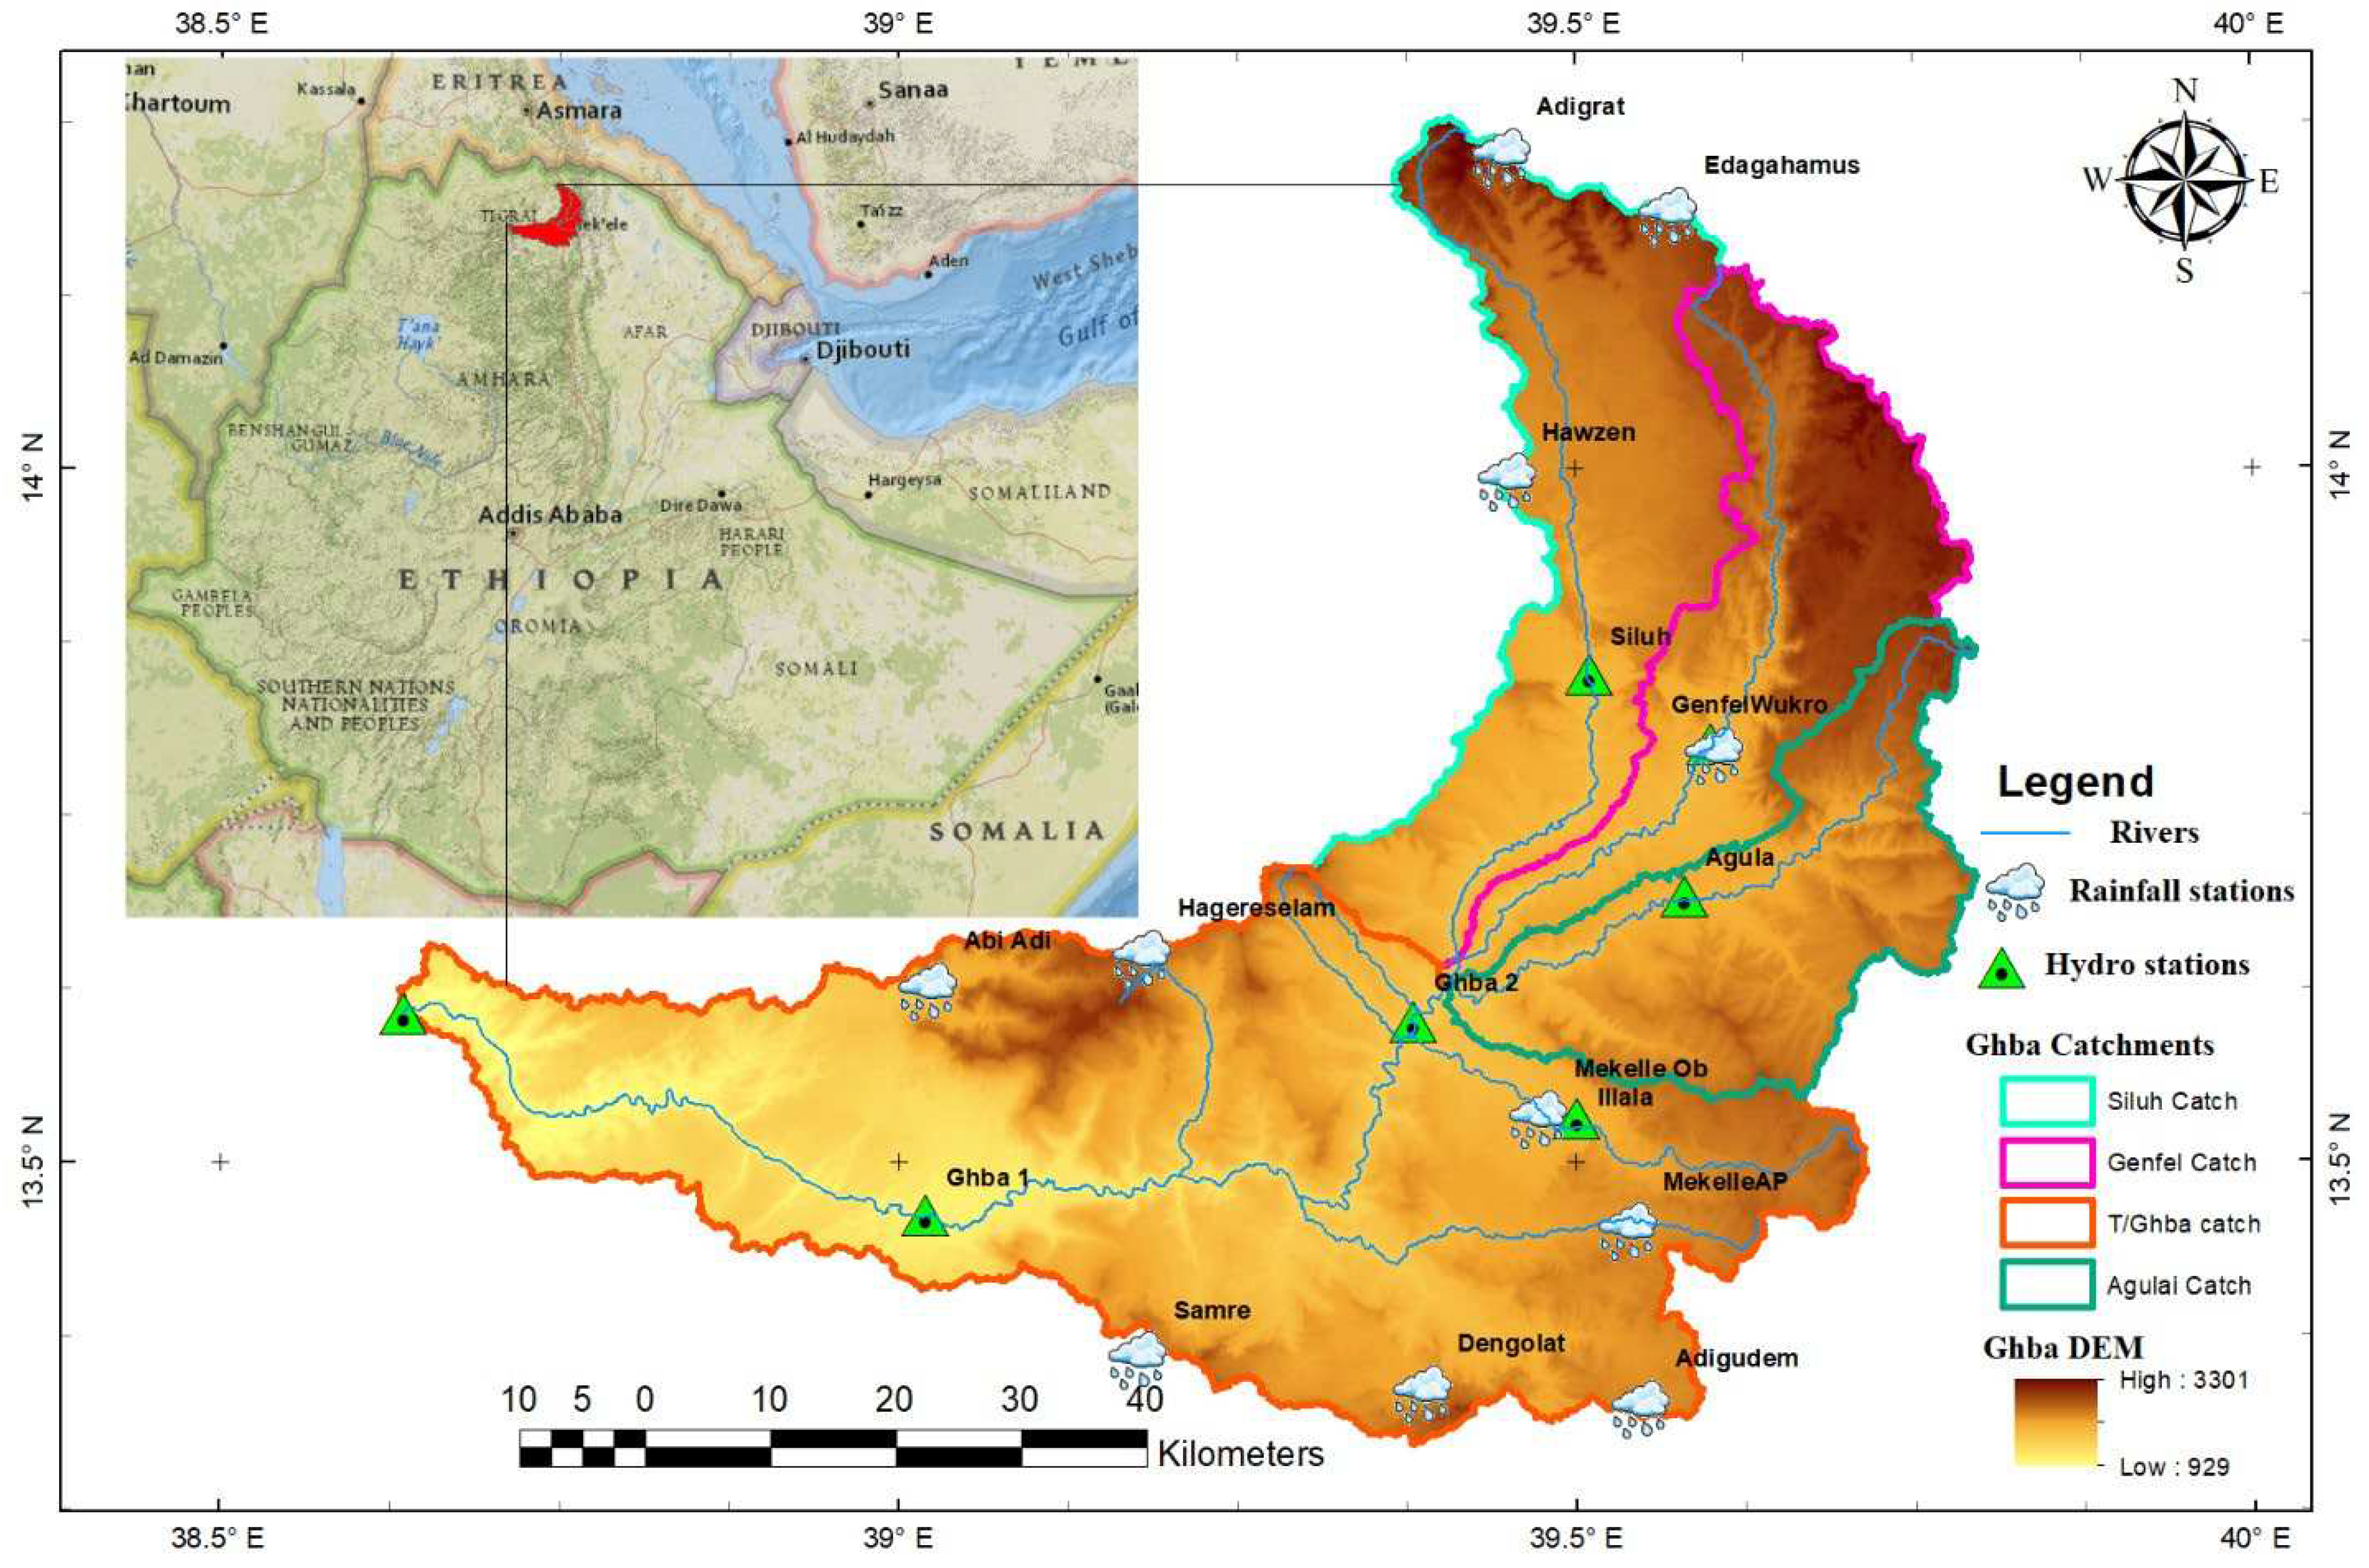
The Ghba sub-basin is located in northern Ethiopia and covers from 38o38’ to 39o48’Eastern longitudes and 13o14’ to 14o16’ northern latitudes as can be seen Figure 1. The Ghba subbasin, which includes Mekelle, the capital of the Tigray regional state, has a total area of around 5125 km2. It is the source of the Upper Tekeze River basin, a significant tributary of the Nile River (Gebremicael et al., 2019). North and north-eastern highlands and hills, as well as highlands in the catchment’s centre, define the topography (Nyssen et al., 2015). Numerous rivers that flow towards the southwest corner of the sub basin and join the main Tekeze River at Chemey divide the central highlands (Nyssen et al., 2019a). Figure 1 shows that the altitude ranges from 930 meters above sea level (m.a.s.l.) at the subbasin outlet to 3,300 meters above sea level (m.a.s.l.) at the Mugulat Mountains near Adigrat town. (Gebremicael et al., 2017). With a standard deviation of 361 meters and a mean elevation of 2144 meters, the catchment’s topography is very rough (Nyssen et al., 2019b).
The Ghba subbasin’s LULC is characterized by severe land degradation brought on by overgrazing, agriculture, and deforestation on the topography. Rain-fed agriculture predominated in the research area during the designated time periods, with the principal crops being wheat, teff, sorghum, barley, maize, and pulses, followed by shrubs, bare ground, wood, grassland, plantations, residential areas, forests, and water (Figure 2). Nevertheless, In the eastern, northern, and central portions of the subbasin, irrigation-based agriculture has developed dramatically over the previous 10 to 15 years due to the government’s millennium development plan (Behailu et al., 2004; Hagos, 2002; Weldegebriel and Yeshitela, 2021).
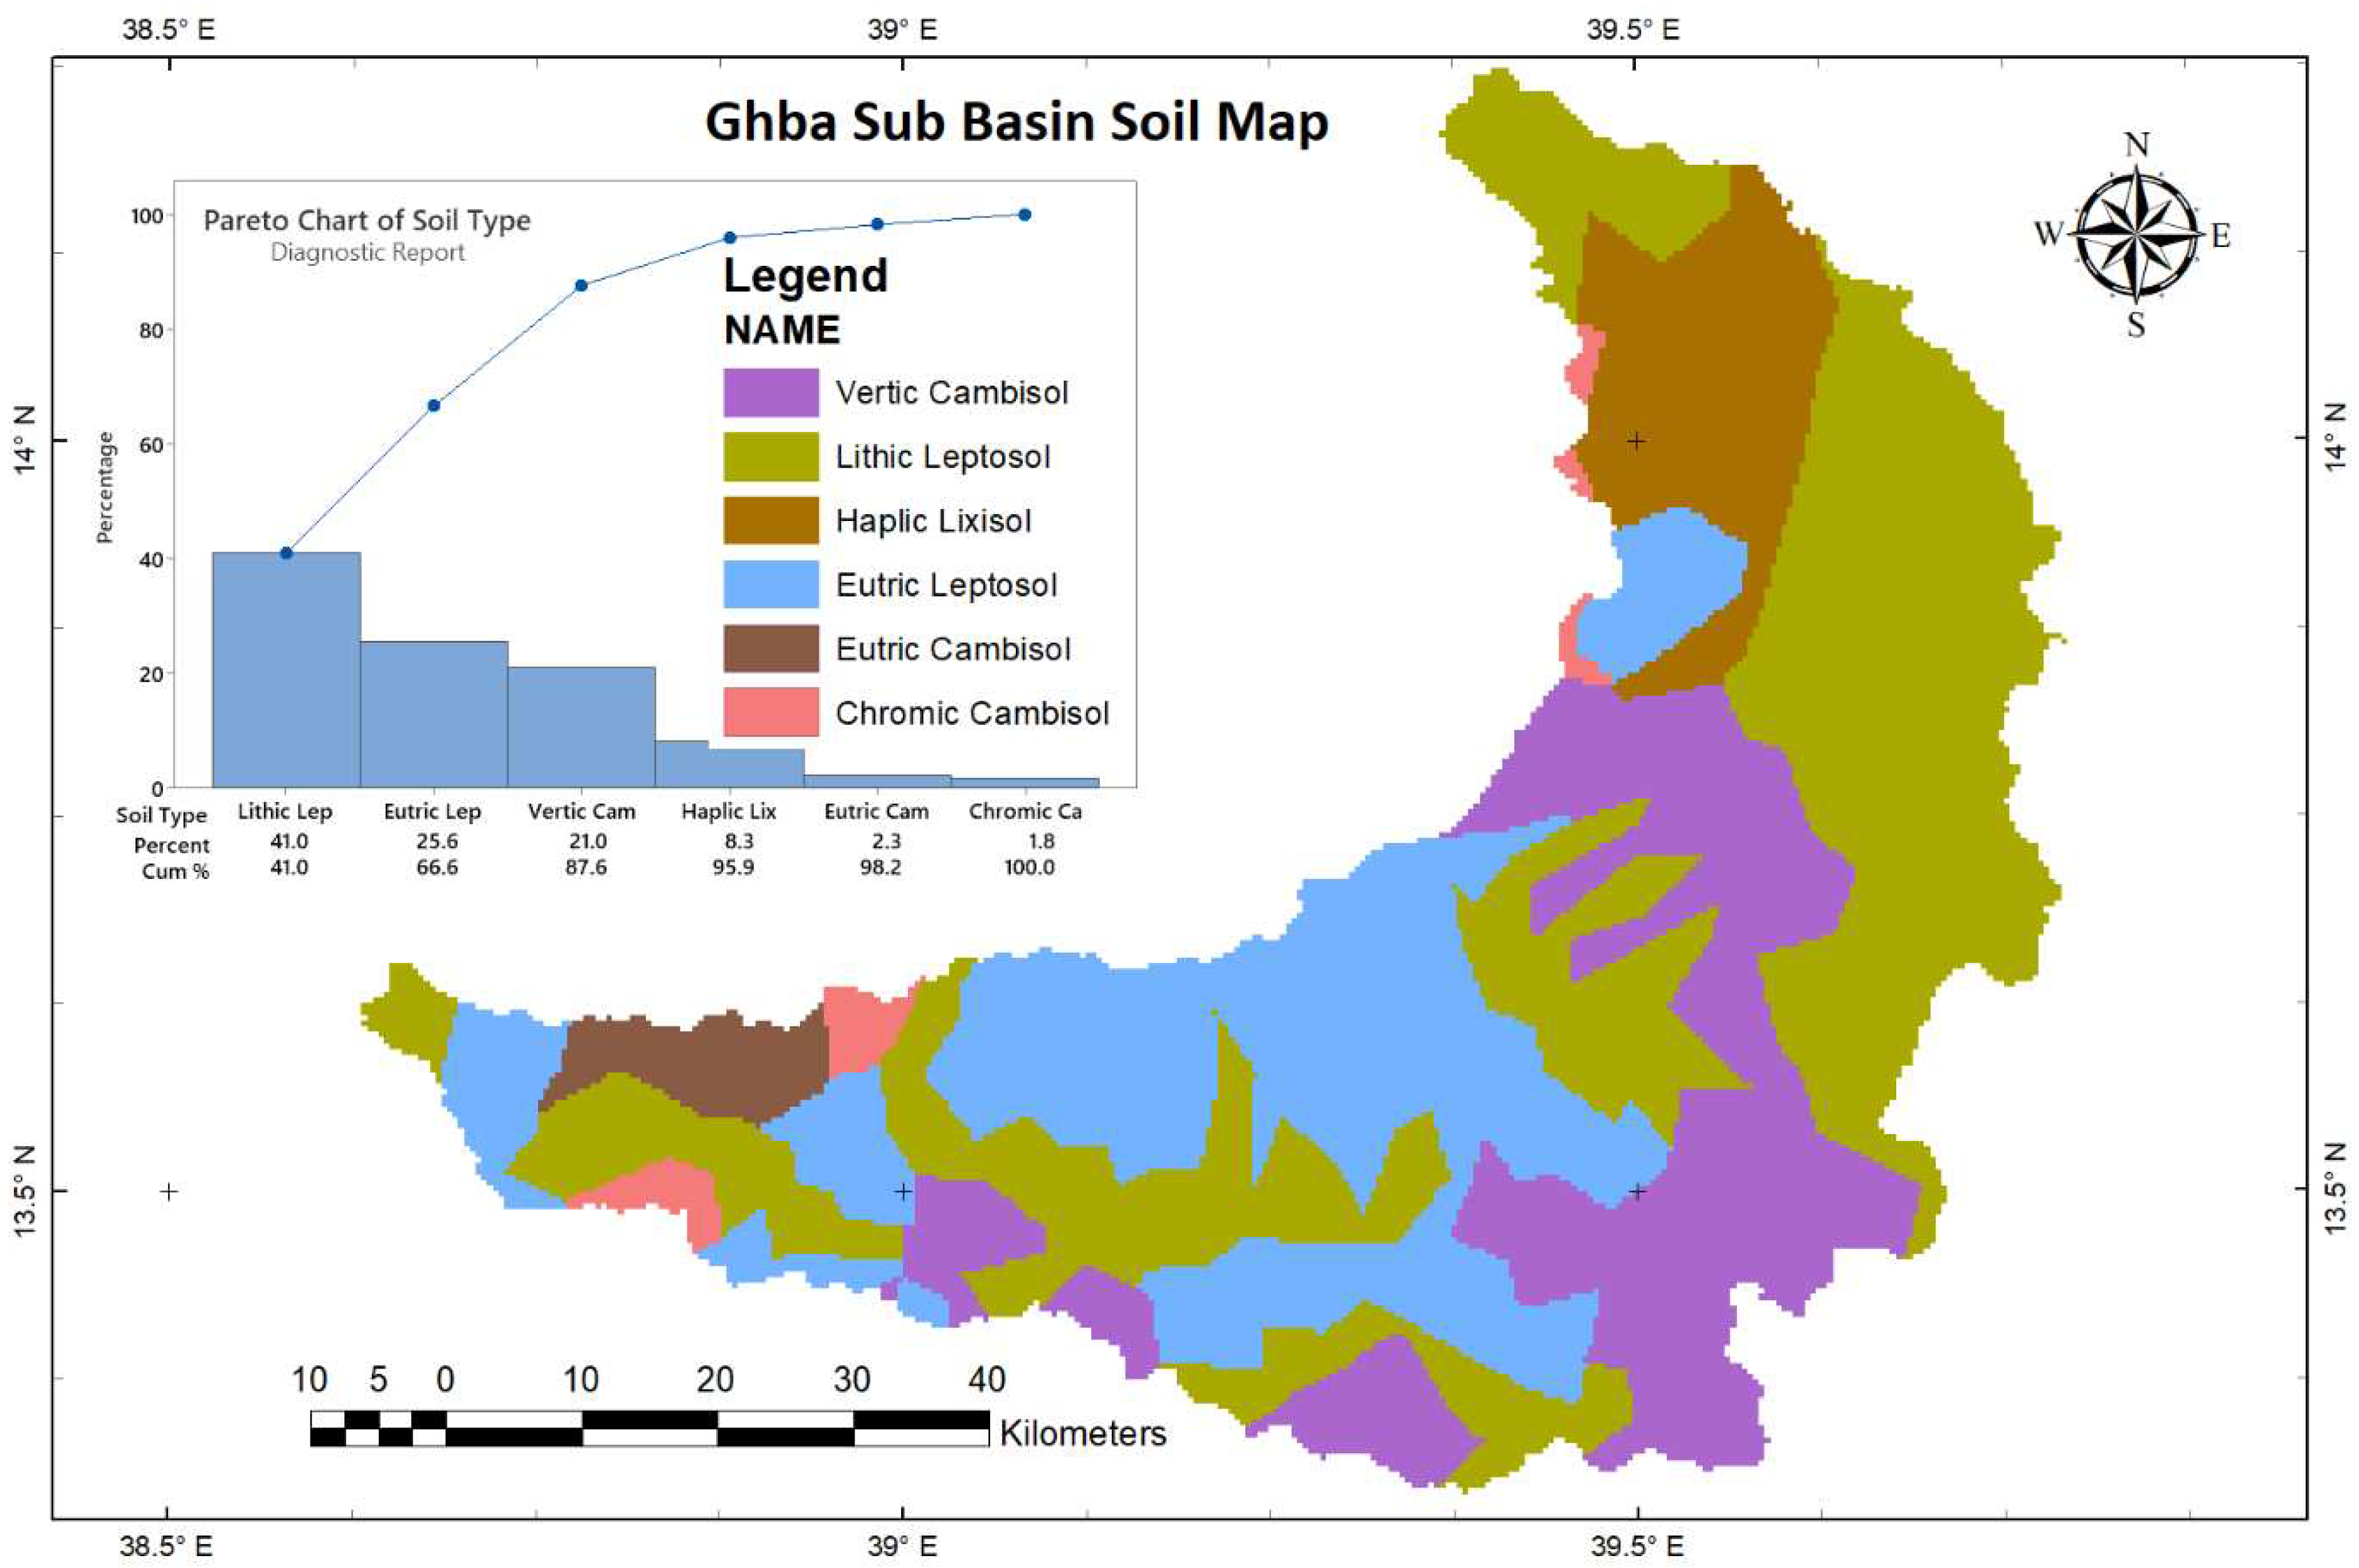
Lithic Leptosol (40.8%), Eutric Leptosol (25.7%) on the steep lands, Vertic Cambisol (21.1%), Haplic Lixisol (8.3%), Eutric Cambisol (2.3%), and Chromic Cambisol (1.8) are the predominant soil types found in the Ghba subbasin (Figure 3), The descriptions of 1381 soil auguring holes and 141 profile pits were used to verify this soil profile or map (Nyssen et al., 2019a). The soil map used in this study was created using a field-based, supervised method, which was preferred to digital or predictive soil mapping due to the complexity of the topography. A demonstrative sub-catchment was first mapped, and all of the data was then combined into a detailed map at a scale of 1: 2500,000. (Nyssen et al., 2015; Nyssen et al., 2019a; Scull et al., 2003).
Figure 1.
Map of the study region highlighting, elevation, catchments, rivers, flow gauges, and climate stations.
Figure 1.
Map of the study region highlighting, elevation, catchments, rivers, flow gauges, and climate stations.
Nyssen et al. (2019a) suggested a new methodology to develop the soil map of the study area by using the Aster DEM, SPOT images (January 2005), the ground collected soil data map, Landsat images (February 2003), SPOT images (January 2005) and aerial photographs (January 1994), earlier baseline soil data for the study area was accessed primarily small-scale maps based on FAO (Bedada, 2015; Hurni, 1983) at 1:1,000,000 scale, derived maps include the e-SOTER map (Batjes, 2012) and the corresponding sheets in the Soil Atlas of Africa (Figure 3).
Figure 2.
Land use and land cover maps of the Ghba Sub Basin.
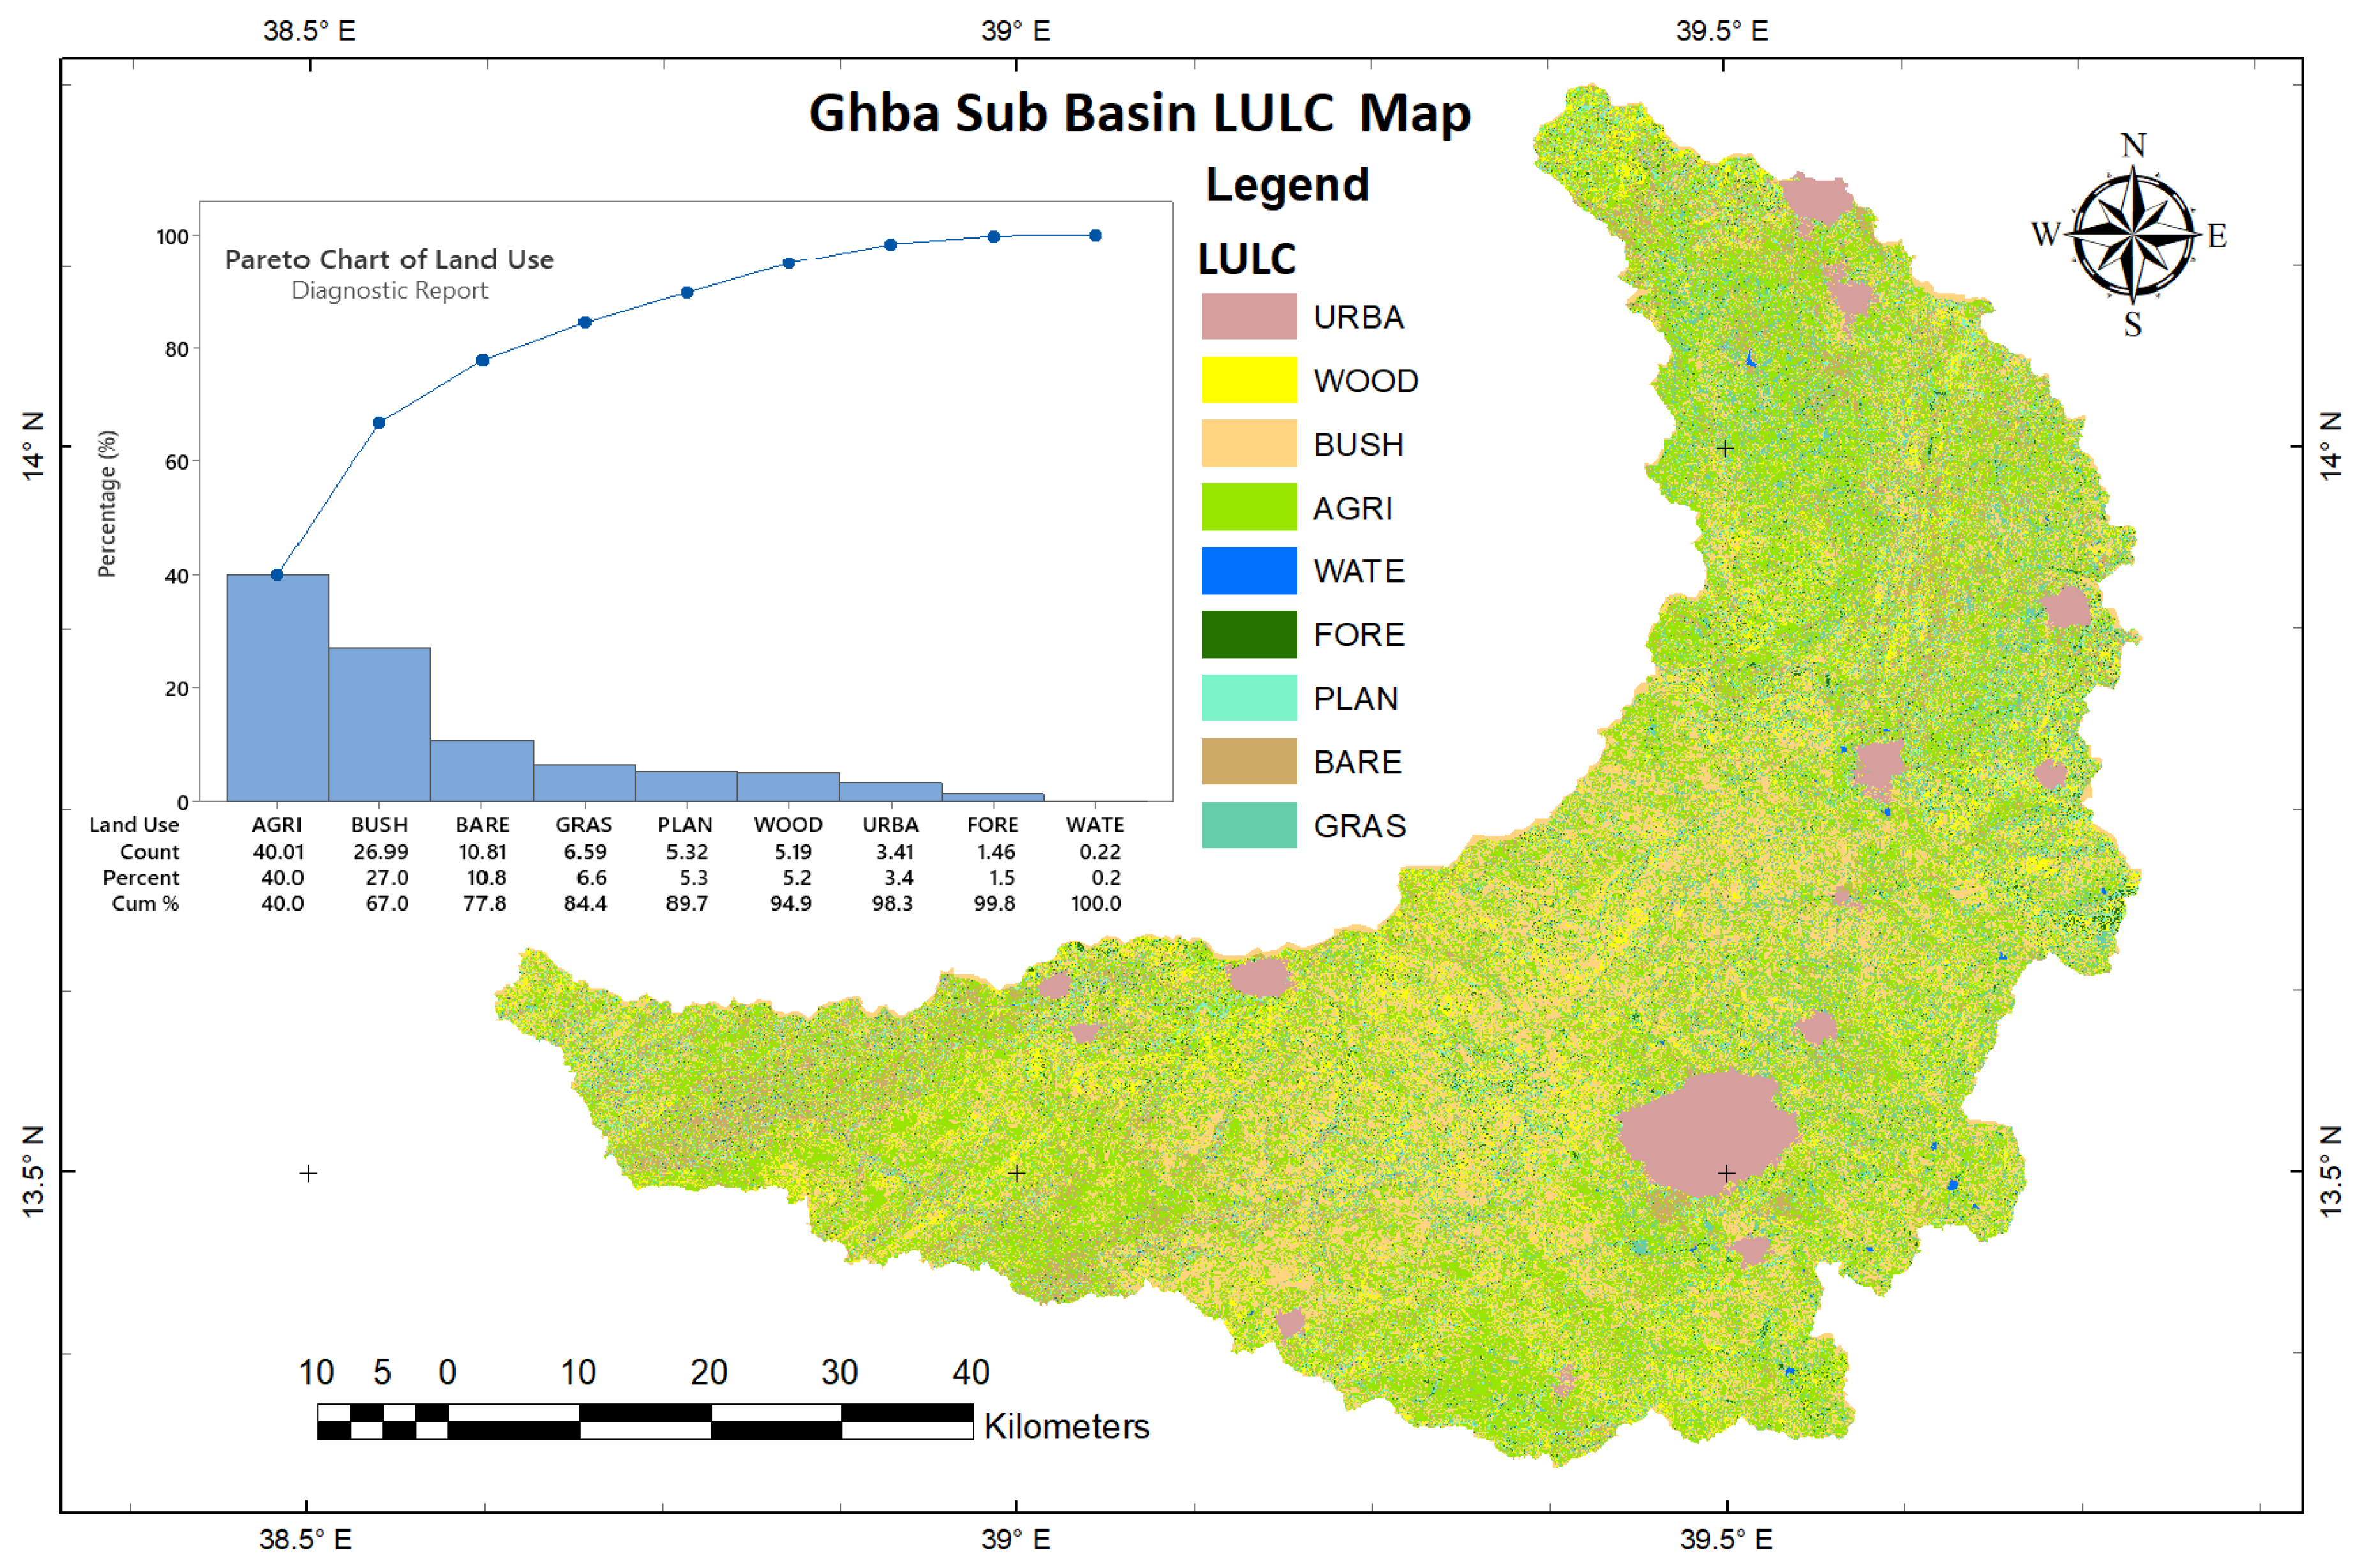
Figure 3.
Major Soil types of the Ghba sub basin.
The climate data of the study area is summarized in Figure 4, i.e., weighted average areal mean monthly precipitation (Prec), temperature (Temp), evapotranspiration (ET0), and discharge data across the subbasin for the development of any water resource analyses.
2.2. Model Description
To understand the projected supply side of the water resource the SDSM-WEAP model was developed, and different data sources were used in addition to data sets studied by Hiben et al. (2022b) , The National Center for Environmental Prediction (NCEP) provided these global climate data (GCM) for the A2 and B2 scenarios using the Hadley Centre Climate Model-version 3 (HadCM3). Additional information, such as population, livestock, water use rates, water consumption, and irrigated area, were obtained from the Ethiopian Statistical Agency (ESA), the Ministry of Water and Energy (MWA), and the relevant local authorities. Four scenario families (A1, A2, B1, and B2) are grouped by the SRES (Nakicenovic et al., 2000) that explore other growth pathways, covering a varied range of demographic, economic, and scientific driving forces and resulting GHG emissions. In this study, two SRES scenarios (A2, and B2) were used. These scenarios were selected based on their ability to explore future socioeconomic development and the applicability of advanced technology for agricultural growth.
Based on data availability and homogeneous meteorological stations (Hiben et al., 2022a) a statistical downscaling model (SDSM) was employed to downscale the large scale GCM outputs to local scale parameters. SDSM is a software that can be used to predict how climate change will impact a specific location. The software uses data from the past to generate projections for the future. In order to create these projections, two sets of data are needed: 26 variables from the NCEP reanalysis data for 1973-2017, and 26 variables from the HadCM3 data for the 1973–2100 A2 and B2 scenarios. The A2 and B2 scenarios were selected because they better reflect the expected changes in the region’s society and associated climate indicators. The SDSM model is used to calculate the statistical relationship between the NCEP variables and the local surface variables (precipitation, maximum temperature, and minimum temperature). The model is then calibrated and validated using the local daily observational data and the NCEP atmospheric predictors.
Local climate data are used to predict what the weather will be like in the future. For this study, weather data was collected from eleven different weather stations over a three-year period. The data was then simulated for three different time periods: the next 20 years (2018-2040), the next 50 years (2041-2070), and the next 80 (2071-2100) years. To make sure the data is reliable, the SDSM checks for missing or incorrect values before calibrating the model. After that, the most appropriate data is selected to create a downscaled climate scenario. Indicators like the partial correlation, correlation matrix, and P value are used to do this.
It’s important to calibrate a model so that it can create the best possible match between what is observed in the real world and what is being simulated by the model. In this study, data from a 28-year period (1983-2010) was used to calibrate the model, and the model was then validated against data from 2011 to 2017 to see how accurate it was (chapter 6). The model performed well based on a number of different measures, including how well it was able to explain the variation in temperature and precipitation data, and how close the model’s predictions were to the actual observed data. However, there is always room for improvement, and one way to improve the model’s performance is to apply bias correction to the data. This means removing or reducing any biases in the data that could distort the model’s predictions. In this study the equations by Gore et al. (2016) was used for bias correction. Equations 1 and 2 are used to debias the daily data on Tmax, Tmin, and precipitation.
The deb values are the corrected predictions for the years 2018 to 2100. The SCEN values are the uncorrected daily data by SDSM predictions for the same time period, while the CONT values are the downscaled outputs for the baseline years 1973 to 2017. The obs values are the actual values that were observed.
The overall work method of the current study is structured in Figure 5.
2.3. Input Data
The A2 and B2 SRES emission scenarios were selected for this study assumed that, given population expansion and socioeconomic change, the basin will undergo climate change. The SDSM-WEAP model was developed using data from meteorological stations, GCMs, the digital elevation model, and the LULC datasets. Streamflow measurements and climate data were acquired from the Ethiopian ministry of water and energy and metrological agency. Additional information, such as population, livestock, water use, water consumption, and irrigation rates, were collected from various sources and verified by socioeconomic surveys.
2.4. Calibration and Validation
Model calibration primarily aimed at obtaining a set of parameters appropriate to the basin/sub-basin to reasonably estimate and represent the hydrology of the system at the gauging stations (Nkiaka et al., 2018; Sirisena et al., 2020). The model calibration techniques can be achieved either by manual or automatic calibration, hence the automatic calibration needs to give threshold of parameters that represents to the system. Otherwise, the result will be vague (Espejel-Garcia et al., 2017). It’s quite advisable to perform the sensitivity analyses before calibration, this helps to reduce the time for calibration and validation process just by tuning only the sensitive model parameters to minimize the difference between observed and simulated values (Gou et al., 2020; Pianosi et al., 2016). To calibrate and validate the Ghba River, monthly streamflow gauge data from five locations were used from 2073 to 2017. For validation, data from 2011 to 2017 were used. To assess the effectiveness of the calibration results, statistical metrics including Nash-Sutcliffe efficiency (NSE) and the coefficient of determination (R2) were considered.
2.5. Scenario Development
According to the guidelines of the ICPP report, climate resilient water management entails all water users creating a plan for how to use water in the interests of everyone. This strategy involves individuals from several professions, sometimes with divergent interests. WEAP is a tool that helps us to create different possible future scenarios and to see how they would play out, in order to answer various questions about what might happen. This study looked at six different situations where there might not be enough water in the future. They examined how factors like population increase and climate change will impact the interplay between water supply and demand under the A2 and B2 scenarios.
There are different ways to try to adapt to climate change, some of which have been created and simulated to test how reliable and sustainable different strategies for managing water resources would be in the face of climate change. These simulations help us figure out which options would be best to meet future water demands while minimizing costs. The six different scenarios are explained below.
2.5.1. Baseline Scenario (BS)
Based on the subbasin’s present availability and demand for water, the first scenario was put out. We used this as a starting point to compare with other potential scenarios. We extended the current situation into the future to see how things might change. The current situation is what we based our model on. The model explores what might happen in the future if things change. The current situation in 2017 is protracted into the future (2018-2100). We anticipated that although population expansion would inevitably lead to an increase in water consumption, irrigation practices would remain the same.
2.5.2. Climate Change Scenario (CC)
This scenario looked at how climate change might affect water availability in the future, using a model called WEAP. They used data from the A2 and B2 downscaled climate change scenarios and applied a 1.9 percent population growth rate.
Advanced Irrigation Techniques Scenario (AIT)
People who live in the Ghba subbasin primarily rely on agriculture as a source of income. This area has experienced with severe agricultural droughts due to land degradation, economic water scarcity and climate change, which is affecting farmers. We looked at how modern irrigation system i.e., Center pivot, drip, sprinkler, pipe supported and so on could help solve some of these problems. In this scenario it was considered that by 2030, half of all agricultural land in the Ghba subbasin will be using more advanced irrigation technology, and by 2040, all of agricultural land will be covered.
2.5.3. Living Conditions Development Scenario (LCD)
The socioeconomic change scenario is just to introduce and evaluate the potential for wastewater discharge in the Ghba subbasin is assessed to be about 10 million cubic meters (MCM) in 2020. It would be 15 MCM in 2030, with an average annual increase of around 0.5 MCM. The amount of water that could be saved by constructing a wastewater treatment plant is determined by factoring in how much water the population uses. Such a facility is thought to be capable of saving about 30% of residential water. Both climate change scenarios are included when evaluating this tactic.
2.5.4. The Combination of AIT and LCD Scenarios
This scenario models what would occur in the A2 and B2 situations if the assumptions AIT and LCD were both true.
3. Results and Discussion
3.1. Model Calibration and Validation
According the model developed for the Ghba subbasin hydrology, the calibration period, the model performance was attained to simulate streamflow with R2, NSE, IA, RSR and PBIAS shows monthly hydrographs of measured and simulated streamflow model indices disclosed a stronger agreement with the calibration, and validation period. Figure 6 shows the observed and simulated monthly runoff for the Ghba River at three stations for the calibration and validation periods. Station disclosed also stronger agreement the mean monthly measured and simulated streamflow with R2 of 0.95, NSE of 0.94, and IA of 0.96 for the calibration period, and R2 of 0.80, NSE of 0.81, and IA of 0.93 for the validation period shown in Figure 6.
Likewise, previous studies have shown that the ability of the WEAP hydrologic model structure in revealing catchment hydrology processes in a different part of the world with the very good agreement, such as in assessing the possible impacts of climate and land-use change on potable water, irrigation, and animal husbandry water supply (e.g., Abrishamchi et al., 2007; Faiz et al., 2018; Javadinejad et al., 2019; Noori et al., 2022; Noori et al., 2020; Olsson et al., 2017).
3.2. FUTURE Climate Change Projection
3.2.1. High Population Growth Scenario (HPG)
If the population growth rate were to increase from 1.9 % to 4 %, everything else would stay the same, according to this scenario.
3.2.2. Downscaling Performance
Performance of the SDSM was evaluated using a number of statistical variables. Precipitation, Tmax, and Tmin E percent values were 25.1 percent, 68.2 percent, and 82 percent, respectively. During the model calibration process, the R2 values for the precipitation and the maximum and minimum temperature responses to the A2 and B2 scenarios ranged from 53 to 67 percent for the monthly and annual SDSM responses, respectively. During model validation with bias correction, the R2 values for the monthly and annual models ranged from 63 to 79 percent for precipitation to 90 to 98.1 percent for Tmax and Tmin. The RE declined by 4.23 percent while the RMSE dropped to 9.99 mm/month. Nearly all statistical measures were enhanced by the bias correction. This enables improved projection of the model input data, which is not possible with model calibration.
These findings demonstrate that, following bias correction, SDSM may be used to accurately predict Tmax, Tmin, and precipitation for the A2 and B2 scenarios. The findings are comparable to those of other investigations. This might be as a result of the longer calibration period we used (35 years). when the observed data have been collected over a lengthy period of time (35 years or more), allowing SDSM or other statistical downscaling techniques to create probability distribution functions with greater accuracy.
3.2.3. Precipitation Projections
In all three time periods, the average annual precipitation is decreasing according to the downscaled precipitation data for the climate change A2 and B2 scenarios (Figure 7). Table 2 displays projected mean annual precipitation. The A2 scenario sees an increase in mean annual precipitation of 24 % in the 20s, 26 % in the 50s, and 31% in the 80s, while the B2 scenario sees an increase of roughly 17% in the 20s, 24% in the 50s, and 26% in the 80s. The study’s findings demonstrated that the A2 scenario produced greater incremental rainfall than the B2 scenario. These findings are in line with those of prior investigations carried out in the Ghba subbasin. For example, studies by Fentaw et al. (2018b), Abera et al. (2018b) and Gebremeskel et al. (2018c) have found similar trends in precipitation projections.
In Ghba subbasin, Fentaw et al. (2018a) indicated that For mid-range RCP4.5 and high-level RCP8.5 climatic scenarios, precipitation would rise by +32 to +40% during all future time periods from the 20s to the 80s. Another study by Gebremeskel et al. (2018a), indicated that precipitation increases by 24 % and 25.3 % under both scenarios A1B and B1 in our study area.
3.2.4. Temperature Projection
The Ghba subbasin mean maximum and minimum temperatures are projected to be warmer than the comparable baseline (Table 1). Under A2 and B2, as well as for all time horizons, it is anticipated that maximum and minimum temperatures will rise. The mean annual minimum temperature increased in all scenarios throughout all time periods, increasing by 0.88°C, 1.4°C, 1.7°C, and 0.5°C, 1.1°C, 1.5°C in the 20s, 50s, and 80s, respectively, under the A2 and B2 scenarios (Figure 8). Under the A2 and B2 scenarios, the mean maximum temperature rose by approximately 0.45 oC, 1.3 oC, 1.5 oC, and approximately 0.4 oC, 0.91 oC, 1.3 oC in the 20s, 50s, and 80s, respectively (Figure 9). Similarly, several other studies (e.g., Fentaw et al., 2018a; Gizaw et al., 2017), revealed Under RCP4.5 and RCP8.5 as well as under the A1B and B1 climate scenarios, The anticipated temperature rise is more pronounced. These changes in precipitation and temperature in the Ghba subbasin are anticipated to improve the domestic and agricultural water supply, greatly lowering the subbasin’s unmet water demand.
The expected precipitation, minimum and maximum temperatures across the Ghba subbasin are shown in Table 1 as percentage increases.

Table 1.
Projected increases in the Ghba subbasin’s average periodic precipitation, T-max and T-min (oC), relative to the baseline period.
Table 1.
Projected increases in the Ghba subbasin’s average periodic precipitation, T-max and T-min (oC), relative to the baseline period.
| Predictand | 20s | 50s | 80s | |||
|---|---|---|---|---|---|---|
| A2 | B2 | A2 | B2 | A2 | B2 | |
| P (%) | 24 | 17 | 25 | 20 | 31 | 26 |
| Tmax (oC) | 1.4 | 0.5 | 2.3 | 1.5 | 2.9 | 2 |
| Tmin (oC) | 1.7 | 0.8 | 2.7 | 1.8 | 3 | 2 |
3.2.5. Baseline Scenario (BS) and High Population Growth Scenario (HPG)
Figure 10’s graph depicts how water consumption changes under two scenarios: the reference scenario (BS) and the high population expansion scenario (HPG). The study’s findings indicate that as population grows, so does the need for water. There would be enough water available to meet the demand if the population did not increase significantly. In the (BS), According to the study’s findings, the Ghba subbasin would experience an increase in water demand by the year 2100. This implies that by then, the typical water supply will only be able to meet half of the demand. Even though there was no unmet water demand in 2017 owing to economic water scarcity, only 20% of the demand was satisfied. The percentage of unmet demand is predicted to reach 30% by the year 2100. The baseline scenario shows that the water delivery system is experiencing a shortage while the demand for water is rising. The second scenario (HPG), which has a significant impact on both water supply and demand, shown that if population growth rates are high, unmet demand will rise. The overall average unmet demand of the three periods, i.e., the 20’s, 50’s, and 80’s, is 0 percent, 2 percent, and 16 percent respectively for BS, and 0 percent, 4 percent, and 24 percent respectively for HPG scenario. If the population growth rate were to increase from 1.8 percent (BS) to 4.2 percent, it would cause a rise in water consumption across all sectors, resulting in an unmet demand of 683 MCM, or 41 percent. Due to population development, high water consumption per person, and an increase in human activities including agriculture, tourism, and forestry, the supply of water would be significantly more constrained, leading to high insufficient supply in the Ghba subbasin.
3.2.6. Climate Change Scenario (CC)
In the Ghba subbasin, the WEAP model indicates that future water demand will rise under the two scenarios A2 and B2 for climate change. the requirement for water for home and agricultural use will keep rising in the climate change scenario. The findings indicate that unfulfilled water demand, as estimated in 2100 is 450 MCM and 360 MCM for scenarios A2 and B2 (Figure 11), and the overall average unmet demand of the three periods, i.e., the 20’s, 50’s, and 80’s, is 19%, 29%, and 30% respectively for A2, and 18%, 25%, and 24% respectively for B2 scenario. This means that up to 32 percent of the total water demand would be much more than the average unmet demand. According to another research by Gebremeskel et al. (2018c) about trends in water resources under the effect of climate change in the Tekeze basin and the Ghba subbasin , supplies will increase by up to 25% by 2050, significantly increasing water scarcity. A study conducted by Abera et al. (2018a) suggested an increase in Tekeze reservoir power storage potential of up to 25% and 30% under RCP4.5 and RCP8.5 climatic scenarios, respectively, for the average future temperature prediction. Due to a pattern of rising temperatures, predicted climate change could in the Ghba subbasin cause water and land surface evaporation to accelerate as well as transpiration. In numerous parts of the world, investigations have suggested that water flow may be decreasing. The decrease in water flow in the Ghba subbasin (Gebremicael et al., 2017) follows anthropogenic overexploitation and is closely tied to climate change. The majority of watersheds in the Tekeze basin, and the Ghba subbasin in particular, will be impacted by water stress. Population expansion, demand from industrialization, and climate change worsen already-existing water issues in the surface-water watershed. According to the water allocation model, Agriculture uses more than 75% of the water that is available to maintain local food security. The sector that uses the most water globally is agriculture (Yang et al., 2022), and the Ghba Subbasin is not a unique case. Use of domestic water increased to 13% in 2017, compared to a need for agricultural water of roughly 74%, plus an extra 3% for livestock. (Hiben et al., 2022b). According to our analysis, the Ghba subbasin, where agriculture is crucial to the local economy, particularly for small farmers, will be most affected by climate change.
3.2.7. Modern Irrigation Technique Scenario (MIT)
Under circumstances A2 and B2, the MIT’s intervention would reduce the amount of unfulfilled agricultural water needs by 75 MCM, to 375 and 285 MCM, respectively (Figure 12). This is a result of drip irrigation’s extensive use, which lowers water losses from evaporation and infiltration. This reduction might be brought about by increased farmer understanding and the adoption of modern, effective irrigation methods, as recommended by the Ethiopian Green Plan legacy. to guarantee effective resource management and lessen the consequences of drought, the current irrigation technology is less than enough. According to Michale et al. (2016), upcoming droughts are likely to upset societal stability by causing major shocks to food prices, and climate change will significantly reduce the subbasin’s primary agricultural productivity. Agriculture is anticipated to be more affected by climate change’s effects on water consumption than other industries. (Wang et al., 2016).
3.2.8. Enhanced Living Conditions (ELC)
For the purposes of this hypothetical scenario, we’ve assumed that 25% of wastewater is cleaned up and put to good use for things like washing, cleaning, and flushing. According to the findings, the quantity of unmet water demand will decrease by 165 MCM in scenarios A2 and B2 to 285 and 195 MCM, respectively. The quantity of unmet water demand will decrease by 165 MCM in scenarios A2 and B2 to 285 and 195 MCM, respectively (Figure 13). This drop may be related to the sewerage system’s design, water treatment, and reuse of treated water.
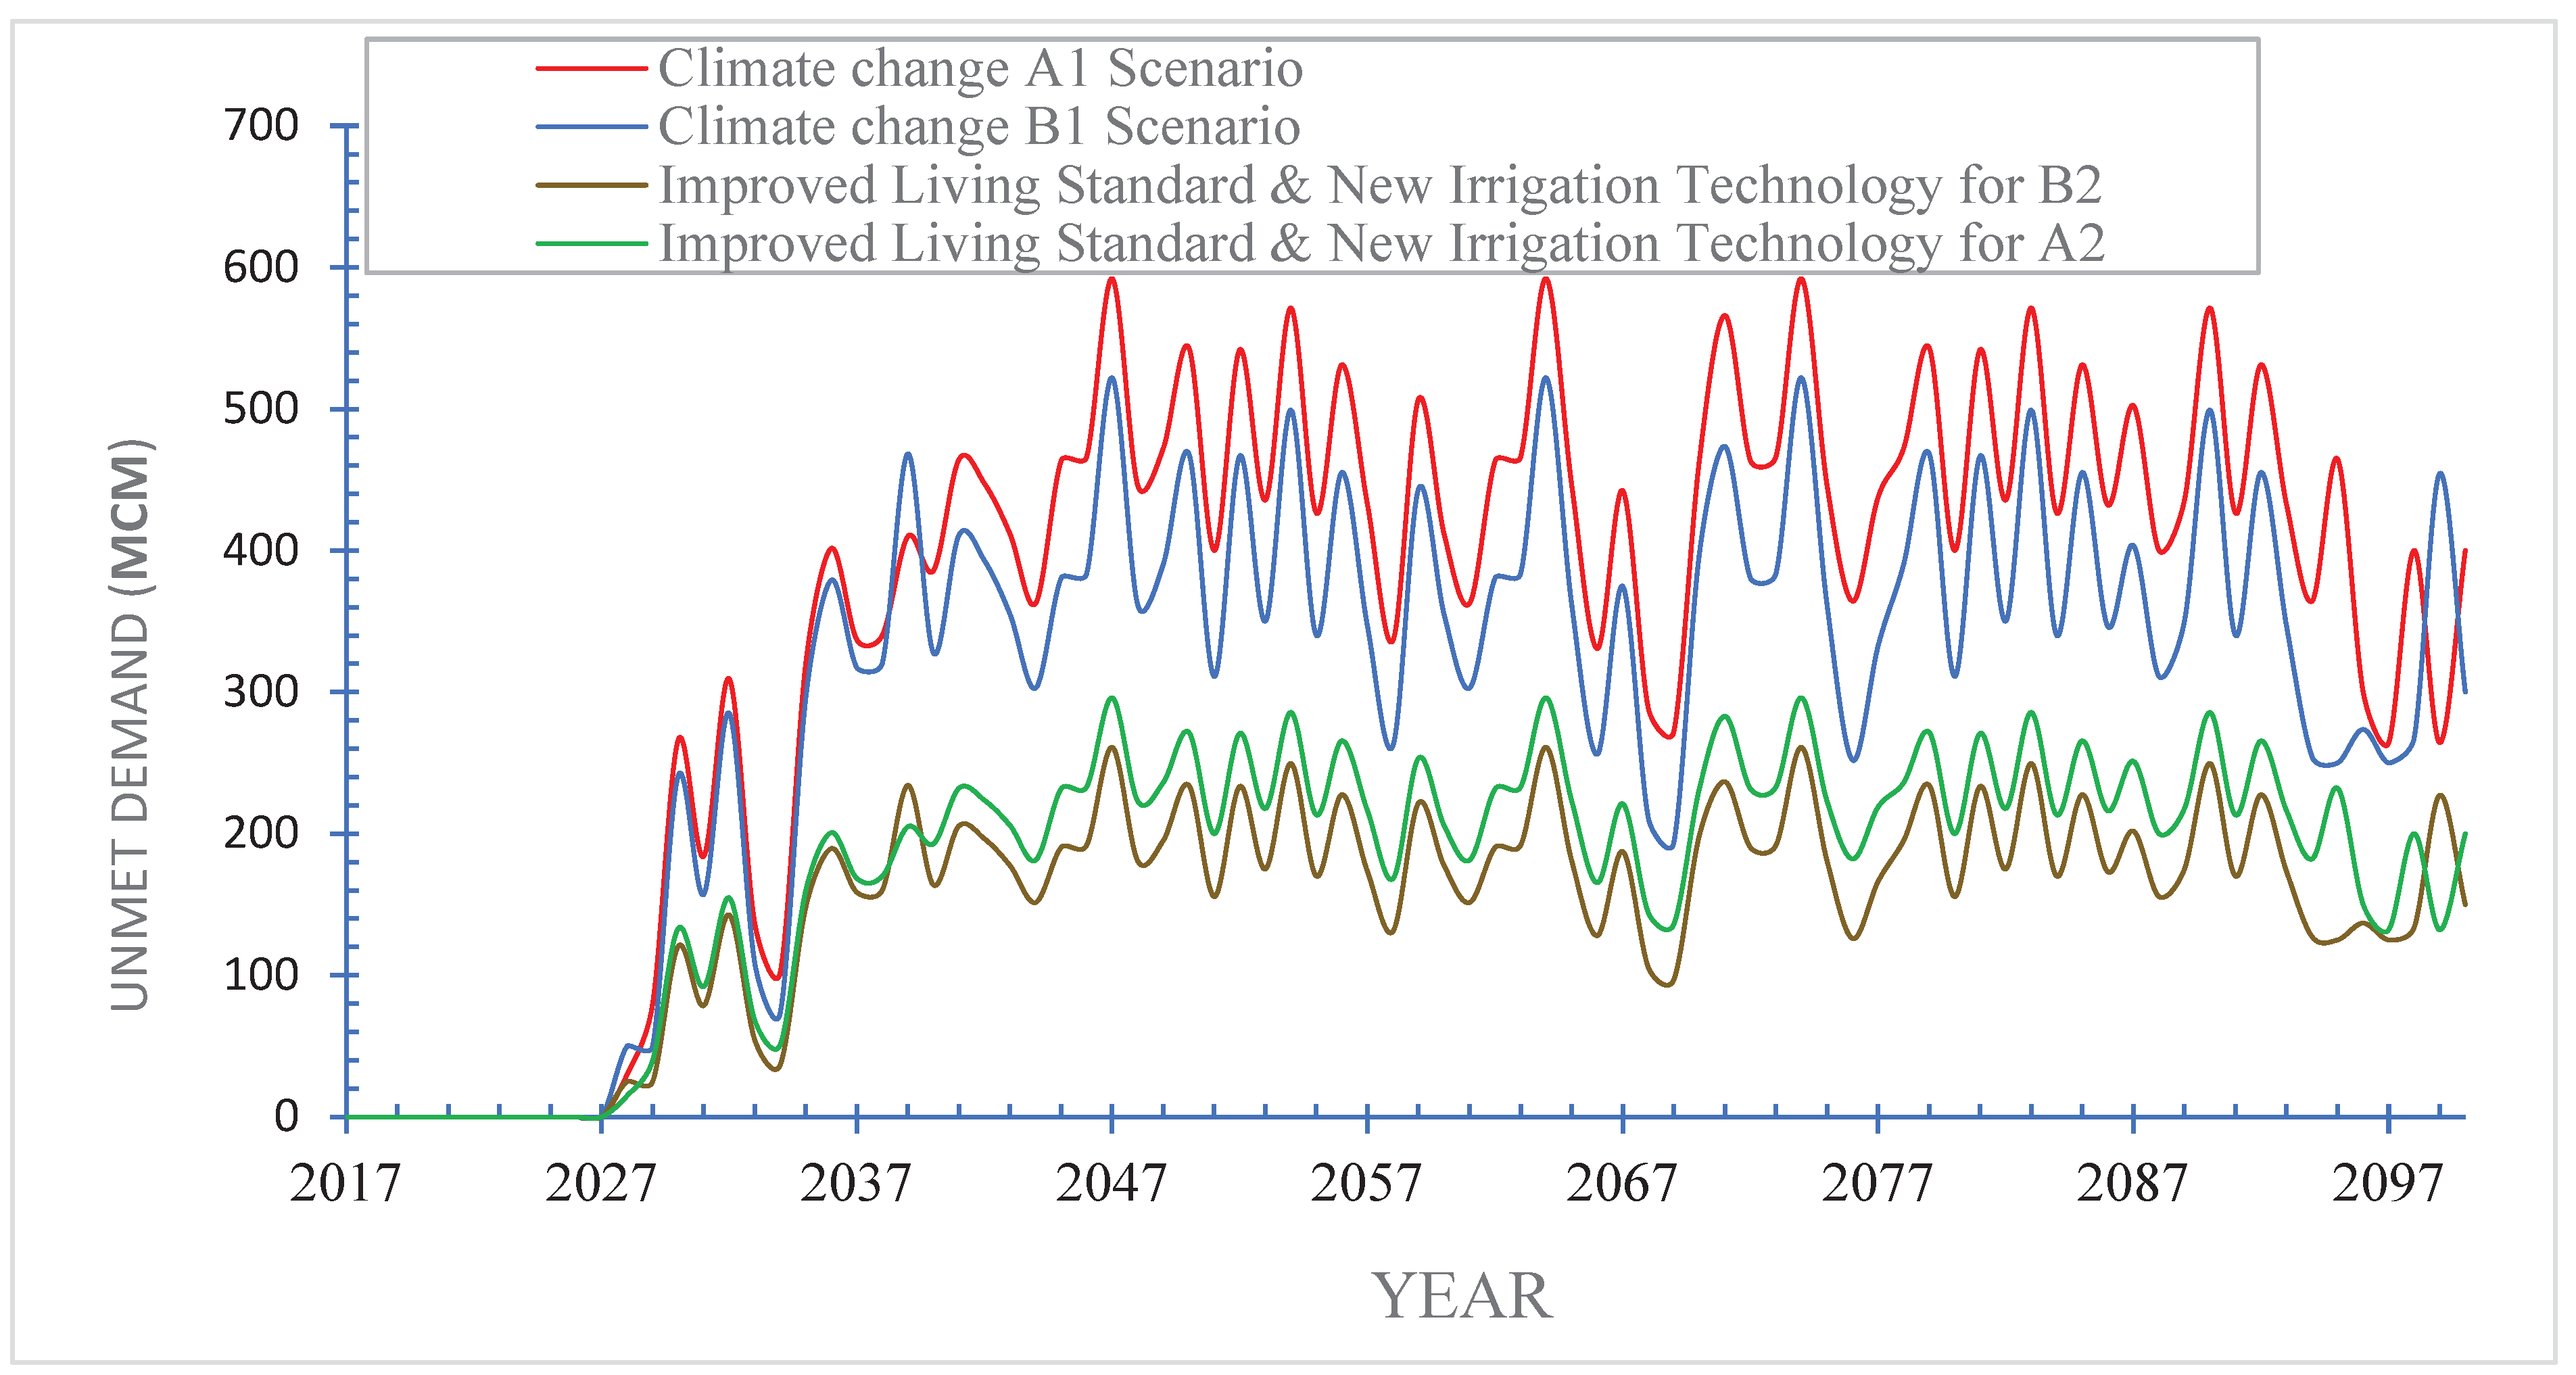
3.2.9. Combining the Two Adaptation Techniques (MIT + ELC)
The conservation and management of water resources in the Ghba subbasin will probably be improved by combining the two earlier adaption options. The century-long demand gap will continue to exist. According to the findings, the quantity of unmet water demand will decrease by 240 MCM under scenarios A2 and B2, reaching 210 and 120 MCM, respectively (Figure 14). The outcomes of this scenario indicate that, in scenarios A2 and B2, the amount of unmet water demand would decrease by about 16 and 12 percent, respectively.
To develop the area sustainably, it is imperative to boost resiliency to climate change and efficiently manage the Ghba subbasin’s water resources. This will satisfy the population’s demands, maximize the land used for agriculture, and prevent water scarcity from impeding socioeconomic development. Several management interventions to address water needs, many alternatives were simulated with the least amount of expense and environmental damage in order to lessen climate change’s impacts and increase the Ghba sub basin’s adaptive management capacity. When planning for water supply, the results need to be considered. Nijhawan et al. (2022), mentioned that in order to meet health goals and strengthen the resilience of community-managed water supplies, which provide safe drinking water to millions of people, Ethiopia’s adaptive capacities in understanding the resilience of water supplies to climate change are quickly becoming a top priority. As a result, the outcome showed that the two techniques combined do not guarantee a full supply in the Ghba subbasin. Zapana-Churata et al. (2022) showed that no method of water management would be able to satisfy all of a region’s water needs, but that it would be possible to lessen the region’s vulnerability by making the best use of the available resources showed that no method of water management would be able to satisfy all of a region’s water needs, but that it would be possible to lessen the region’s vulnerability by making the best use of the available resources. Moreover, Ayt Ougougdal et al. (2020) confirms the value of designing a water delivery system based on possible scenarios for climate change to assure efficient resource allocation in reaction to anticipated declines in terms of water availability and current demand. Water distribution system vulnerability measures have also been identified (Tornyeviadzi et al., 2021), the water distribution system’s a reaction to natural and man-made disasters perhaps utilized to gauge its ability to meet consumers’ needs. appropriate system administration and upkeep is essential to ensure its adequate response to future disasters. Future water saving in the Ghba subbasin is more likely under the situation in which adaption plan for managing irrigation water. Regarding the challenges brought on by population growth and climate change, it produced improved results. It was also demonstrated by Uddin et al. (2014), They placed irrigation at the top of the list of the 14 adaption strategies examined. In light of the aforementioned conclusions, it would be able to reduce water usage and the irrigation deficit by putting into practice the right management measures. The outcomes, in our opinion, also show that the evaluations of the suggested adaption measures are useful but insufficient to guarantee the water supply’s long-term viability for the Ghba subbasin. The comprehensive summary of the scenario developments for the Ghba subbasin’s resilient water allocation approach is presented in Table 2.
Table 2.
Summary of average unmet demand for all scenarios of the three periods.
| Predictand | 20s | 50s | 80s | |||
|---|---|---|---|---|---|---|
| A2 | B2 | A2 | B2 | A2 | B2 | |
| RS (%) | 0 | 2 | 16 | |||
| HPG (%) | 0 | 4 | 24 | |||
| CC (%) | 19 | 18 | 29 | 25 | 30 | 24 |
| NIT (%) | 14 | 13 | 25 | 21 | 25 | 21 |
| ILC (%) | 11 | 10 | 19 | 16 | 19 | 16 |
| NIT+ILC (%) | 8 | 7 | 14 | 12 | 14 | 12 |
4. Conclusions and Recommendation
The Ghba subbasin’s water availability and demand are examined in this study by fusing the WEAP and SDSM for predicting the future climate. The results show how these two methods may be used to assess the consequences of socioeconomic and climate change scenarios. According to the SDSM findings, the Ghba subbasin will see an increase in temperature and precipitation. The created WEAP model predicts that socioeconomic and climatic factors will be the two main contributors to water scarcity in the subbasin in the future. The findings show that population growth and climate change expand the water demand-to-need disparity. In 2100, there will be 210 MCM of unmet water demand, according to the A2 climate change scenario. We found that there will be a water deficit in every scenario. Despite the fact that the suggested adaptation measures had some success in protecting water supplies, they were insufficient to guarantee water sustainability for the Ghba subbasin. To ensure that water supplies are long-term sustainable, we must therefore strengthen our management practices in the watershed.
There are inherent uncertainties in all research involving climate modeling, particularly those pertaining to the data used and the modeling approach. Despite the fact that parameter calibration can help ensure model applicability, the conceptual nature of the SDSM can lead to overestimations of temperature and underestimates of precipitation. These sources of uncertainty are considered when validating and examining the model’s results. One of the limitations of the modeling approach used in this study is the sparse number of climate stations in the study area. Future research in the Ghba subbasin should incorporate a variety of GCMs in addition to NCEP using the newest RCP scenarios to better understand the modeling and simulation uncertainties. The thorough climatological data offered in this work, however, might be useful for projecting future changes in climate and identifying various climate resilient adaption alternatives.
Acknowledgments
The research project described in this publication received help from MG Water Resource Consultancy Firm, which provided data on the study area’s water resources. The Ministry of Water and Energy (Ethiopia) provided water resource data, while the Ethiopian National Meteorological Services Agency provided climate data. The authors are very appreciative of both of these sources.
References
- Abera, F.F.; Asfaw, D.H.; Engida, A.N.; Melesse, A.M. Optimal operation of hydropower reservoirs under climate change: The Case of Tekeze reservoir, Eastern Nile. Water 2018, 10, 273. [Google Scholar] [CrossRef]
- Abera, F.F.; Asfaw, D.H.; Engida, A.N.; Melesse, A.M. Optimal operation of hydropower reservoirs under climate change: The case of Tekeze reservoir, Eastern Nile. Water 2018, 10, 273. [Google Scholar] [CrossRef]
- Abrishamchi, A.; Alizadeh, H.; Tajrishy, M.; Abrishamchi, A. Water resources management scenario analysis in Karkheh River Basin, Iran, using WEAP model. Hydrol. Sci. Technol. 2007, 23, 1. [Google Scholar]
- Ougougdal, H.A.; Khebiza, M.Y.; Messouli, M.; Lachir, A. Assessment of Future Water Demand and Supply under IPCC Climate Change and Socio-Economic Scenarios, Using a Combination of Models in Ourika Watershed, High Atlas, Morocco. Water 2020, 12, 1751. [Google Scholar] [CrossRef]
- Batjes, N.H., 2012. ISRIC-WISE derived soil properties on a 5 by 5 arc-minutes global grid (ver. 1.2), ISRICWorld Soil Information.
- Bedada, W., 2015. Compost and fertilizer-alternatives or complementary?
- Behailu, M., Tadesse, N., Legesse, A. and Teklu, D.J.M., ILRI, EARO, 2004. Community based irrigation management in the Tekeze basin: Performance evaluation of small scale irrigation schemes.
- Cervigni, R. and Valentini, R., 2013. Toward climate-resilient development in Nigeria. World Bank Publications.
- Chesterman, S., Chevallier, R. and Neely, C., 2021. Long-term, low emission and climate resilient development pathways.
- Espejel-Garcia, D.; Saniger-Alba, J.A.; Wenglas-Lara, G.; Espejel-Garcia, V.V.; Villalobos-Aragon, A. A comparison among manual and automatic calibration methods in VISSIM in an expressway (Chihuahua, Mexico). Open J. Civ. Eng. 2017, 7, 539–552. [Google Scholar] [CrossRef]
- Faiz, M.A.; Liu, D.; Fu, Q.; Li, M.; Baig, F.; Tahir, A.A.; Khan, M.I.; Li, T.; Cui, S. Performance evaluation of hydrological models using ensemble of General Circulation Models in the northeastern China. J. Hydrol. 2018, 565, 599–613. [Google Scholar] [CrossRef]
- Fentaw, F.; Hailu, D.; Nigussie, A.; Melesse, A.M. Climate change impact on the hydrology of Tekeze Basin, Ethiopia: Projection of rainfall-runoff for future water resources planning. Water Conserv. Sci. Eng. 2018, 3, 267–278. [Google Scholar] [CrossRef]
- Fentaw, F.; Hailu, D.; Nigussie, A.; Melesse, A.M. Climate change impact on the hydrology of Tekeze Basin, Ethiopia: Projection of rainfall-runoff for future water resources planning. Water Conserv. Sci. Eng. 2018, 3, 267–278. [Google Scholar] [CrossRef]
- Escribano Francés, G.; Quevauviller, P.; San Martín González, E.; Vargas Amelin, E. Climate change policy and water resources in the EU and Spain. A closer look into the Water Framework Directive. Environ. Sci. Policy 2017, 69, 1–12. [Google Scholar] [CrossRef]
- Gebrehiwot, T.; Van der Veen, A.; Maathuis, B. Spatial and temporal assessment of drought in the Northern highlands of Ethiopia. Int. J. Appl. Earth Obs. Geoinf. 2011, 13, 309–321. [Google Scholar] [CrossRef]
- Gebremedhin, M.A.J.P.R.P.U.o.T.T.N., 2019. Spatio-temporal water resource responses to land use land cover change in semi-arid Opper Tekeze Basin, Northern Ethiopia. 57.
- Gebremeskel, G.; Kebede, A. Estimating the effect of climate change on water resources: Integrated use of climate and hydrological models in the Werii watershed of the Tekeze river basin, Northern Ethiopia. Agric. Nat. Resour. 2018, 52, 195–207. [Google Scholar] [CrossRef]
- Gebremeskel, G.; Kebede, A. Estimating the effect of climate change on water resources: Integrated use of climate and hydrological models in the Werii watershed of the Tekeze river basin, Northern Ethiopia. Agric. Nat. Resour. 2018, 52, 195–207. [Google Scholar] [CrossRef]
- Gebremeskel, G.; Kebede, A. Estimating the effect of climate change on water resources: Integrated use of climate and hydrological models in the Werii watershed of the Tekeze river basin, Northern Ethiopia. Agric. Nat. Resour. 2018, 52, 195–207. [Google Scholar] [CrossRef]
- Gebremicael, T.; Mohamed, Y.; Betrie, G.; van der Zaag, P.; Teferi, E. Trend analysis of runoff and sediment fluxes in the Upper Blue Nile basin: A combined analysis of statistical tests, physically-based models and landuse maps. J. Hydrol. 2013, 482, 57–68. [Google Scholar] [CrossRef]
- Gebremicael, T.; Mohamed, Y.; Van der Zaag, P. Attributing the hydrological impact of different land use types and their long-term dynamics through combining parsimonious hydrological modelling, alteration analysis and PLSR analysis. Sci. Total. Environ. 2019, 660, 1155–1167. [Google Scholar] [CrossRef] [PubMed]
- Gebremicael, T.G. Understanding the Impact of Human Interventions on the Hydrology of Nile Basin Headwaters, the Case of Upper Tekeze Catchments; CRC Press: Boca Raton, FL, USA, 2019; ISBN 9780367853167. [Google Scholar]
- Gebremicael, T.G.; Deitch, M.J.; Gancel, H.N.; Croteau, A.C.; Haile, G.G.; Beyene, A.N.; Kumar, L. Satellite-based rainfall estimates evaluation using a parsimonious hydrological model in the complex climate and topography of the Nile River Catchments. Atmospheric Res. 2022, 266, 105939. [Google Scholar] [CrossRef]
- Gebremicael, T.G.; Mohamed, Y.A.; Hagos, E.Y. Temporal and spatial changes of rainfall and streamflow in the Upper Tekezē–Atbara river basin, Ethiopia. Hydrology 2017, 21, 2127–2142. [Google Scholar] [CrossRef]
- Gizaw, M.S.; Biftu, G.F.; Gan, T.Y.; Moges, S.A.; Koivusalo, H. Potential impact of climate change on streamflow of major Ethiopian rivers. Clim. Chang. 2017, 143, 371–383. [Google Scholar] [CrossRef]
- Gore, J.A., Banning, J., Casper, A.F., Gilvear, D., Greenwood, M., Thoms, M., Wood, P.J.R.s.R. and century, m.f.t.s., 2016. River resource management and the effects of changing landscapes and climate. 295-312.
- Gou, J.; Miao, C.; Duan, Q.; Tang, Q.; Di, Z.; Liao, W.; Wu, J.; Zhou, R. Sensitivity analysis-based automatic parameter calibration of the VIC model for streamflow simulations over China. Water Resour. Res. 2020, 56, e2019WR025968. [Google Scholar] [CrossRef]
- Hagos, F., 2002. Land degradation and strategies for sustainable land management in the Ethiopian highlands: Tigray region. ILRI (aka ILCA and ILRAD).
- Hiben, M., Goitom, T. and Berhanu, T., 2016. Sectoral water allocation in the Ghba sub-basin, Agricultural water management in Tigray Tigray Water Resource Bureau Mekelle, Ethiopia pp. 24.
- Hiben, M.G.; Awoke, A.G.; Ashenafi, A.A. Hydroclimatic Variability, Characterization, and Long Term Spacio-Temporal Trend Analysis of the Ghba River Subbasin, Ethiopia. Adv. Meteorol. 2022, 2022, 3594641. [Google Scholar] [CrossRef]
- Hiben, M.G.; Gebeyehu, A.A.; Adugna, A.A.; Shang, Y. Estimation of Current Water Use over the Complex Topography of the Nile Basin Headwaters: The Case of Ghba Subbasin, Ethiopia. Adv. Civ. Eng. 2022, 2022, 1–14. [Google Scholar] [CrossRef]
- Hirons, M.; Mehrabi, Z.; Gonfa, T.; Morel, A.; Gole, T.; McDermott, C.; Boyd, E.; Robinson, E.; Sheleme, D.; Malhi, Y.; et al. Pursuing climate resilient coffee in Ethiopia—A critical review. Geoforum 2018, 91, 108–116. [Google Scholar] [CrossRef]
- Hurni, H. , 1983. Soil formation rates in Ethiopia (with scale 1: 1 000 000).
- Javadinejad, S.; Ostad-Ali-Askari, K.; Eslamian, S. Application of Multi-Index Decision Analysis to Management Scenarios Considering Climate Change Prediction in the Zayandeh Rud River Basin. Water Conserv. Sci. Eng. 2019, 4, 53–70. [Google Scholar] [CrossRef]
- Gebreselassie, M.G.; Moges, S.A. Spatial and temporal variability of dry spell lengths and indication of climate change in rainfall extremes at Tekeze River Basin, Ethiopia. Int. J. Water Resour. Environ. Eng. 2016, 8, 39–51. [Google Scholar]
- Miles, E.L.; Snover, A.K.; Hamlet, A.F.; Callahan, B.; Fluharty, D. Pacific Northwest regional assessment: The impacts of climate variability and climate change on the water resources of the columbia River basin. JAWRA J. Am. Water Resour. Assoc. 2000, 36, 399–420. [Google Scholar] [CrossRef]
- Nakicenovic, N., Alcamo, J., Davis, G., de Vries, B., Fenhann, J., Gaffin, S., Gregory, K., Grï, A., Jung, T.Y. and Kram, T., 2000. IPCC: Special Report on Emissions Scenarios.
- Nijhawan, A.; Howard, G.; Poudel, M.; Pregnolato, M.; Lo, Y.T.E.; Ghimire, A.; Baidya, M.; Geremew, A.; Flint, A.; Mulugeta, Y. Assessing the Climate Resilience of Community-Managed Water Supplies in Ethiopia and Nepal. Water 2022, 14, 1293. [Google Scholar] [CrossRef]
- Nkiaka, E.; Nawaz, N.R.; Lovett, J.C. Effect of single and multi-site calibration techniques on hydrological model performance, parameter estimation and predictive uncertainty: a case study in the Logone catchment, Lake Chad basin. Stoch. Environ. Res. Risk Assess. 2018, 32, 1665–1682. [Google Scholar] [CrossRef]
- Noori, A.; Bonakdari, H.; Hassaninia, M.; Morovati, K.; Khorshidi, I.; Noori, A.; Gharabaghi, B. A reliable GIS-based FAHP-FTOPSIS model to prioritize urban water supply management scenarios: A case study in semi-arid climate. Sustain. Cities Soc. 2022, 81, 103846. [Google Scholar] [CrossRef]
- Noori, A.; Bonakdari, H.; Morovati, K.; Gharabaghi, B. Development of optimal water supply plan using integrated fuzzy Delphi and fuzzy ELECTRE III methods—Case study of the Gamasiab basin. Expert Syst. 2020, 37, e12568. [Google Scholar] [CrossRef]
- Nyssen, J.; Frankl, A.; Zenebe, A.; Deckers, J.; Poesen, J. Land management in the Northern Ethiopian highlands: Local and global perspectives; past, present and future. Land Degrad. Dev. 2015, 26, 759–764. [Google Scholar] [CrossRef]
- Nyssen, J.; Tielens, S.; Gebreyohannes, T.; Araya, T.; Teka, K.; Van de Wauw, J.; Degeyndt, K.; Descheemaeker, K.; Amare, K.; Haile, M.; et al. Understanding spatial patterns of soils for sustainable agriculture in northern Ethiopia’s tropical mountains. PLoS ONE 2019, 14, e0224041. [Google Scholar] [CrossRef]
- Nyssen, J.; Tielens, S.; Gebreyohannes, T.; Araya, T.; Teka, K.; Van de Wauw, J.; Degeyndt, K.; Descheemaeker, K.; Amare, K.; Haile, M.; et al. Understanding spatial patterns of soils for sustainable agriculture in northern Ethiopia’s tropical mountains. PLOS ONE 2019, 14, e0224041. [Google Scholar] [CrossRef]
- Olsson, T.; Kämäräinen, M.; Santos, D.; Seitola, T.; Tuomenvirta, H.; Haavisto, R.; Lavado-Casimiro, W. Downscaling climate projections for the Peruvian coastal Chancay-Huaral Basin to support river discharge modeling with WEAP. J. Hydrol. Reg. Stud. 2017, 13, 26–42. [Google Scholar] [CrossRef]
- Oyedotun, T.D.T. Ensuring water availability in Mekelle City, Northern Ethiopia: evaluation of the water supply sub-project. Appl. Water Sci. 2017, 7, 4165–4168. [Google Scholar] [CrossRef]
- Pianosi, F.; Beven, K.; Freer, J.; Hall, J.W.; Rougier, J.; Stephenson, D.B.; Wagener, T. Sensitivity analysis of environmental models: A systematic review with practical workflow. Environ. Model. Softw. 2016, 79, 214–232. [Google Scholar] [CrossRef]
- Rochdane, S.; Reichert, B.; Messouli, M.; Babqiqi, A.; Khebiza, M.Y. Climate Change Impacts on Water Supply and Demand in Rheraya Watershed (Morocco), with Potential Adaptation Strategies. Water 2012, 4, 28–44. [Google Scholar] [CrossRef]
- Roth, V.; Lemann, T.; Zeleke, G.; Subhatu, A.T.; Nigussie, T.K.; Hurni, H. Effects of climate change on water resources in the upper Blue Nile Basin of Ethiopia. Heliyon 2018, 4, e00771. [Google Scholar] [CrossRef]
- Schlüter, M.; Hirsch, D.; Pahl-Wostl, C. Coping with change: responses of the Uzbek water management regime to socio-economic transition and global change. Environ. Sci. Policy 2010, 13, 620–636. [Google Scholar] [CrossRef]
- Scull, P.; Franklin, J.; Chadwick, O.A.; McArthur, D. Predictive soil mapping: a review. Prog. Phys. Geogr. Earth Environ. 2003, 27, 171–197. [Google Scholar] [CrossRef]
- Sirisena, T.A.J.G.; Maskey, S.; Ranasinghe, R. Hydrological Model Calibration with Streamflow and Remote Sensing Based Evapotranspiration Data in a Data Poor Basin. Remote. Sens. 2020, 12, 3768. [Google Scholar] [CrossRef]
- Tornyeviadzi, H.M.; Neba, F.A.; Mohammed, H.; Seidu, R. Nodal vulnerability assessment of water distribution networks: An integrated Fuzzy AHP-TOPSIS approach. Int. J. Crit. Infrastruct. Prot. 2021, 34, 100434. [Google Scholar] [CrossRef]
- Uddin, M.N.; Bokelmann, W.; Entsminger, J.S. Factors Affecting Farmers’ Adaptation Strategies to Environmental Degradation and Climate Change Effects: A Farm Level Study in Bangladesh. Climate 2014, 2, 223–241. [Google Scholar] [CrossRef]
- Wang, X.J.; Zhang, J.Y.; Shahid, S.; Guan, E.H.; Wu, Y.X.; Gao, J.; He, R.M. Adaptation to climate change impacts on water demand. Mitig. Adapt. Strateg. Glob. Chang. 2016, 21, 81–99. [Google Scholar] [CrossRef]
- Weldegebriel, S.K.; Yeshitela, K. Measuring the Semi-Century Ecosystem-Service Value Variation in Mekelle City Region, Northern Ethiopia. Sustainability 2021, 13, 10015. [Google Scholar] [CrossRef]
- Yang, X.; Pu, Y.; Weng, S.; Hou, M.; Wang, Z. Review of agricultural water-saving policies and measures in recent years—A case study of Jiangsu Province, China. Water Supply 2022, 22, 3951–3967. [Google Scholar] [CrossRef]
- Zapana-Churata, L.; March, H.; Sauri, D. Water demand management strategies in fast-growing cities. The case of Arequipa, Perú. Int. J. Water Resour. Dev. 2022, 38, 363–387. [Google Scholar] [CrossRef]
Figure 4.
Mean monthly precipitation (Prec), temperature (Temp), evapotranspiration (ET0), and discharge.
Figure 4.
Mean monthly precipitation (Prec), temperature (Temp), evapotranspiration (ET0), and discharge.
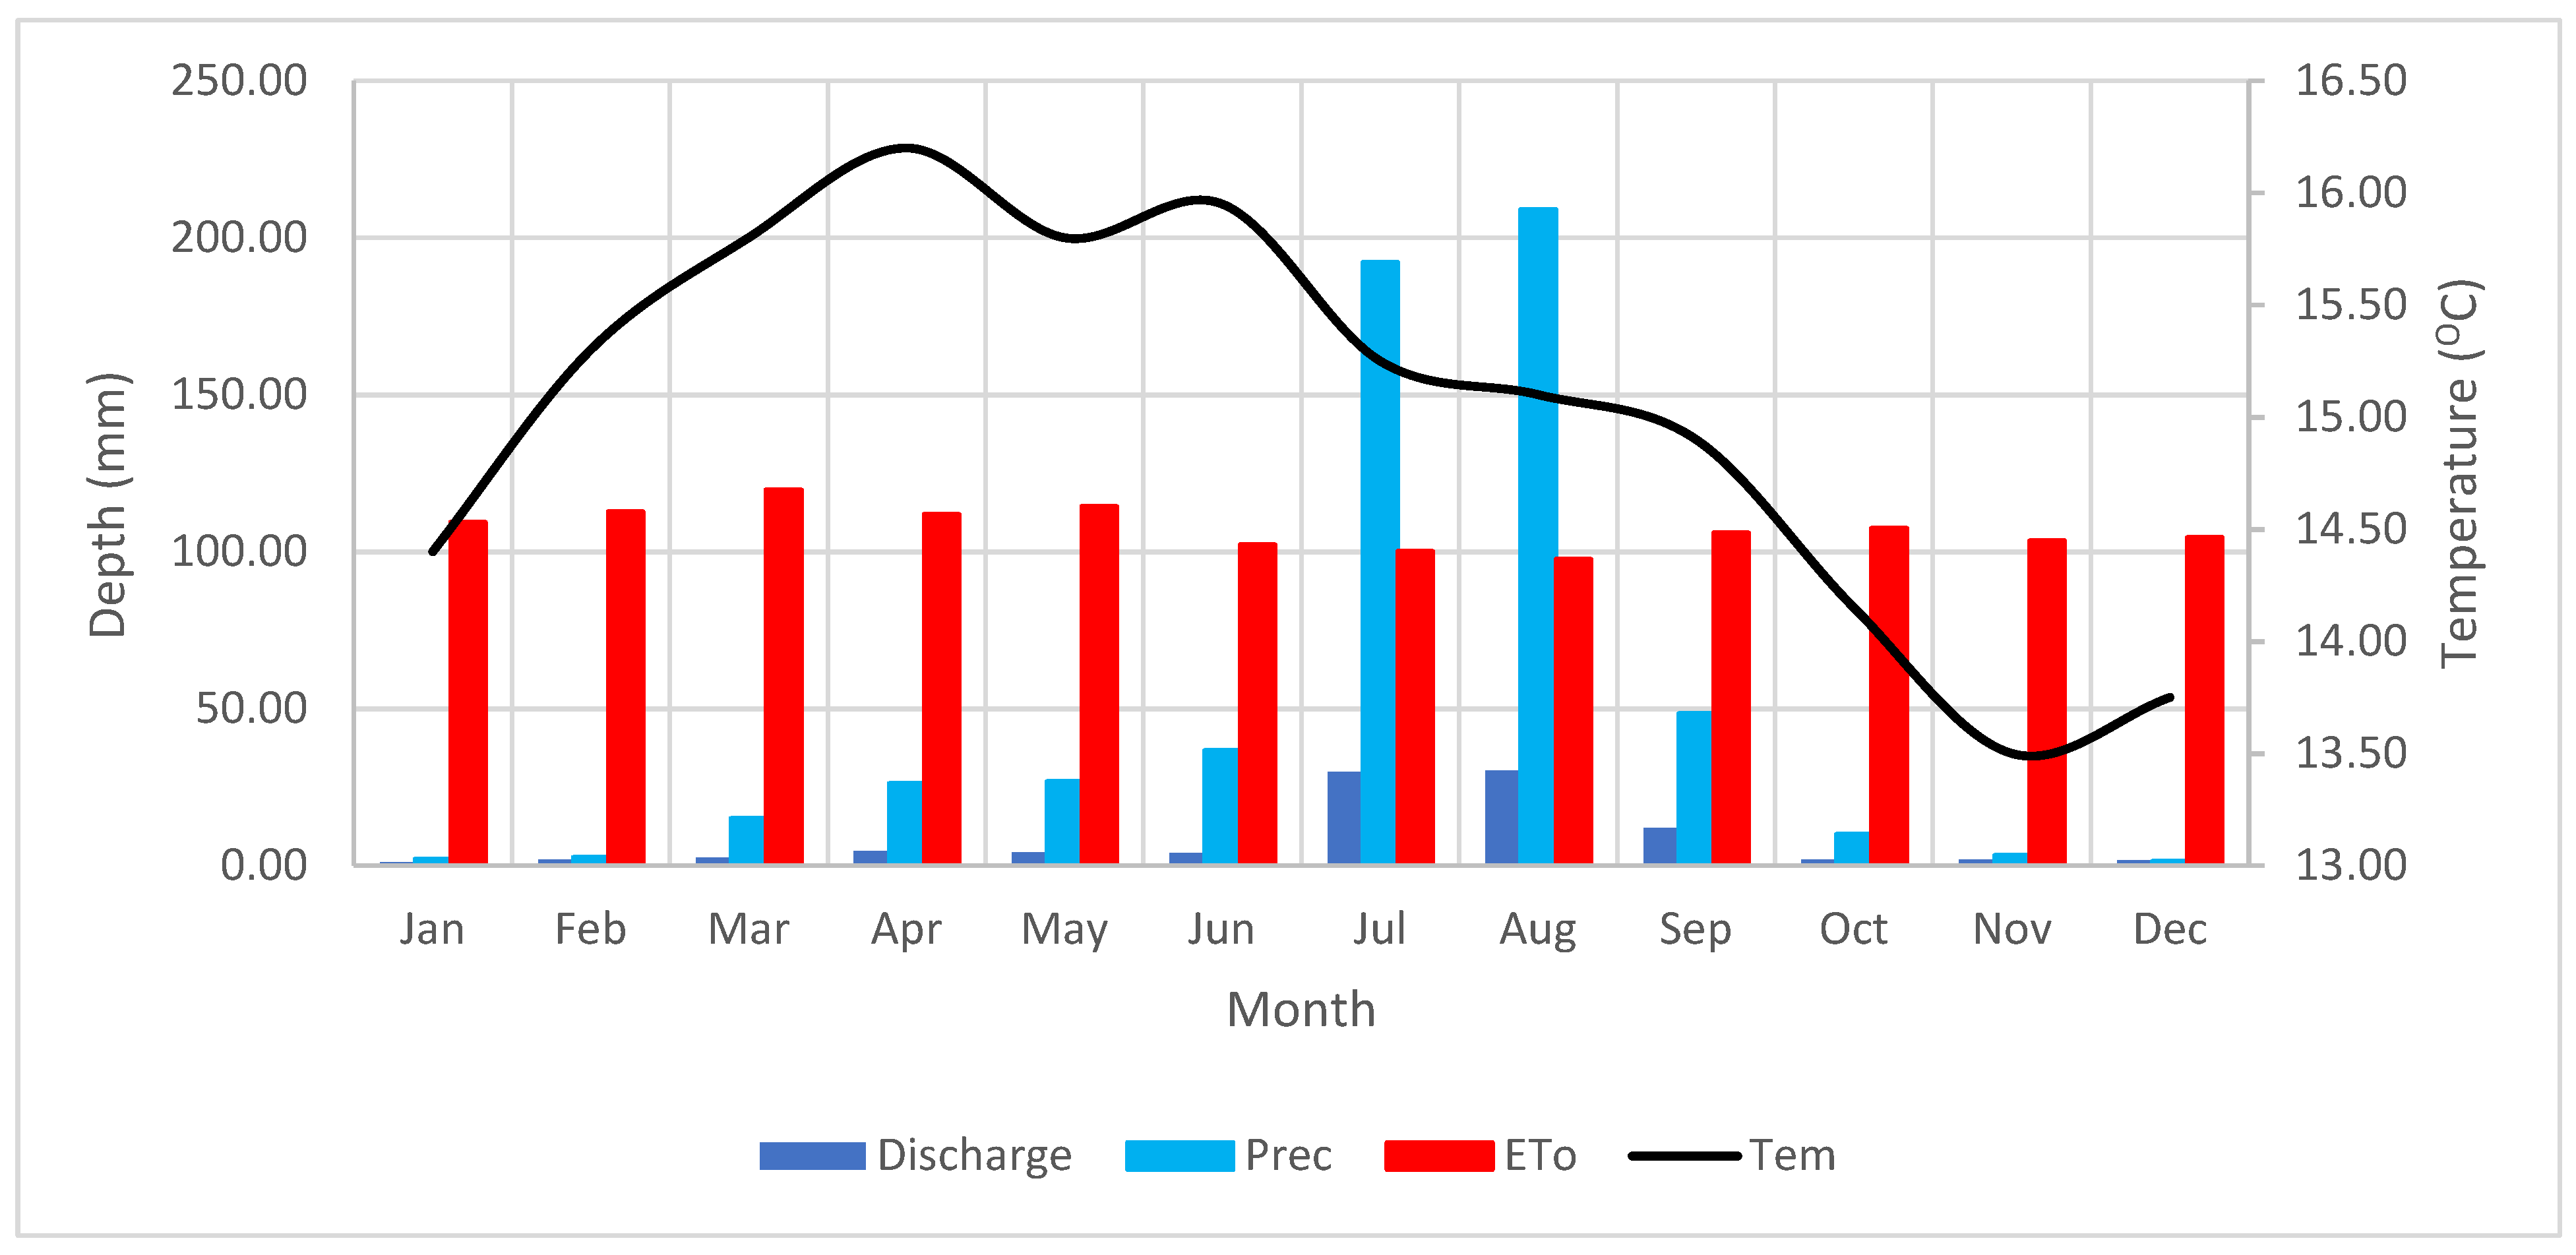
Figure 5.
Water allocation model structure.
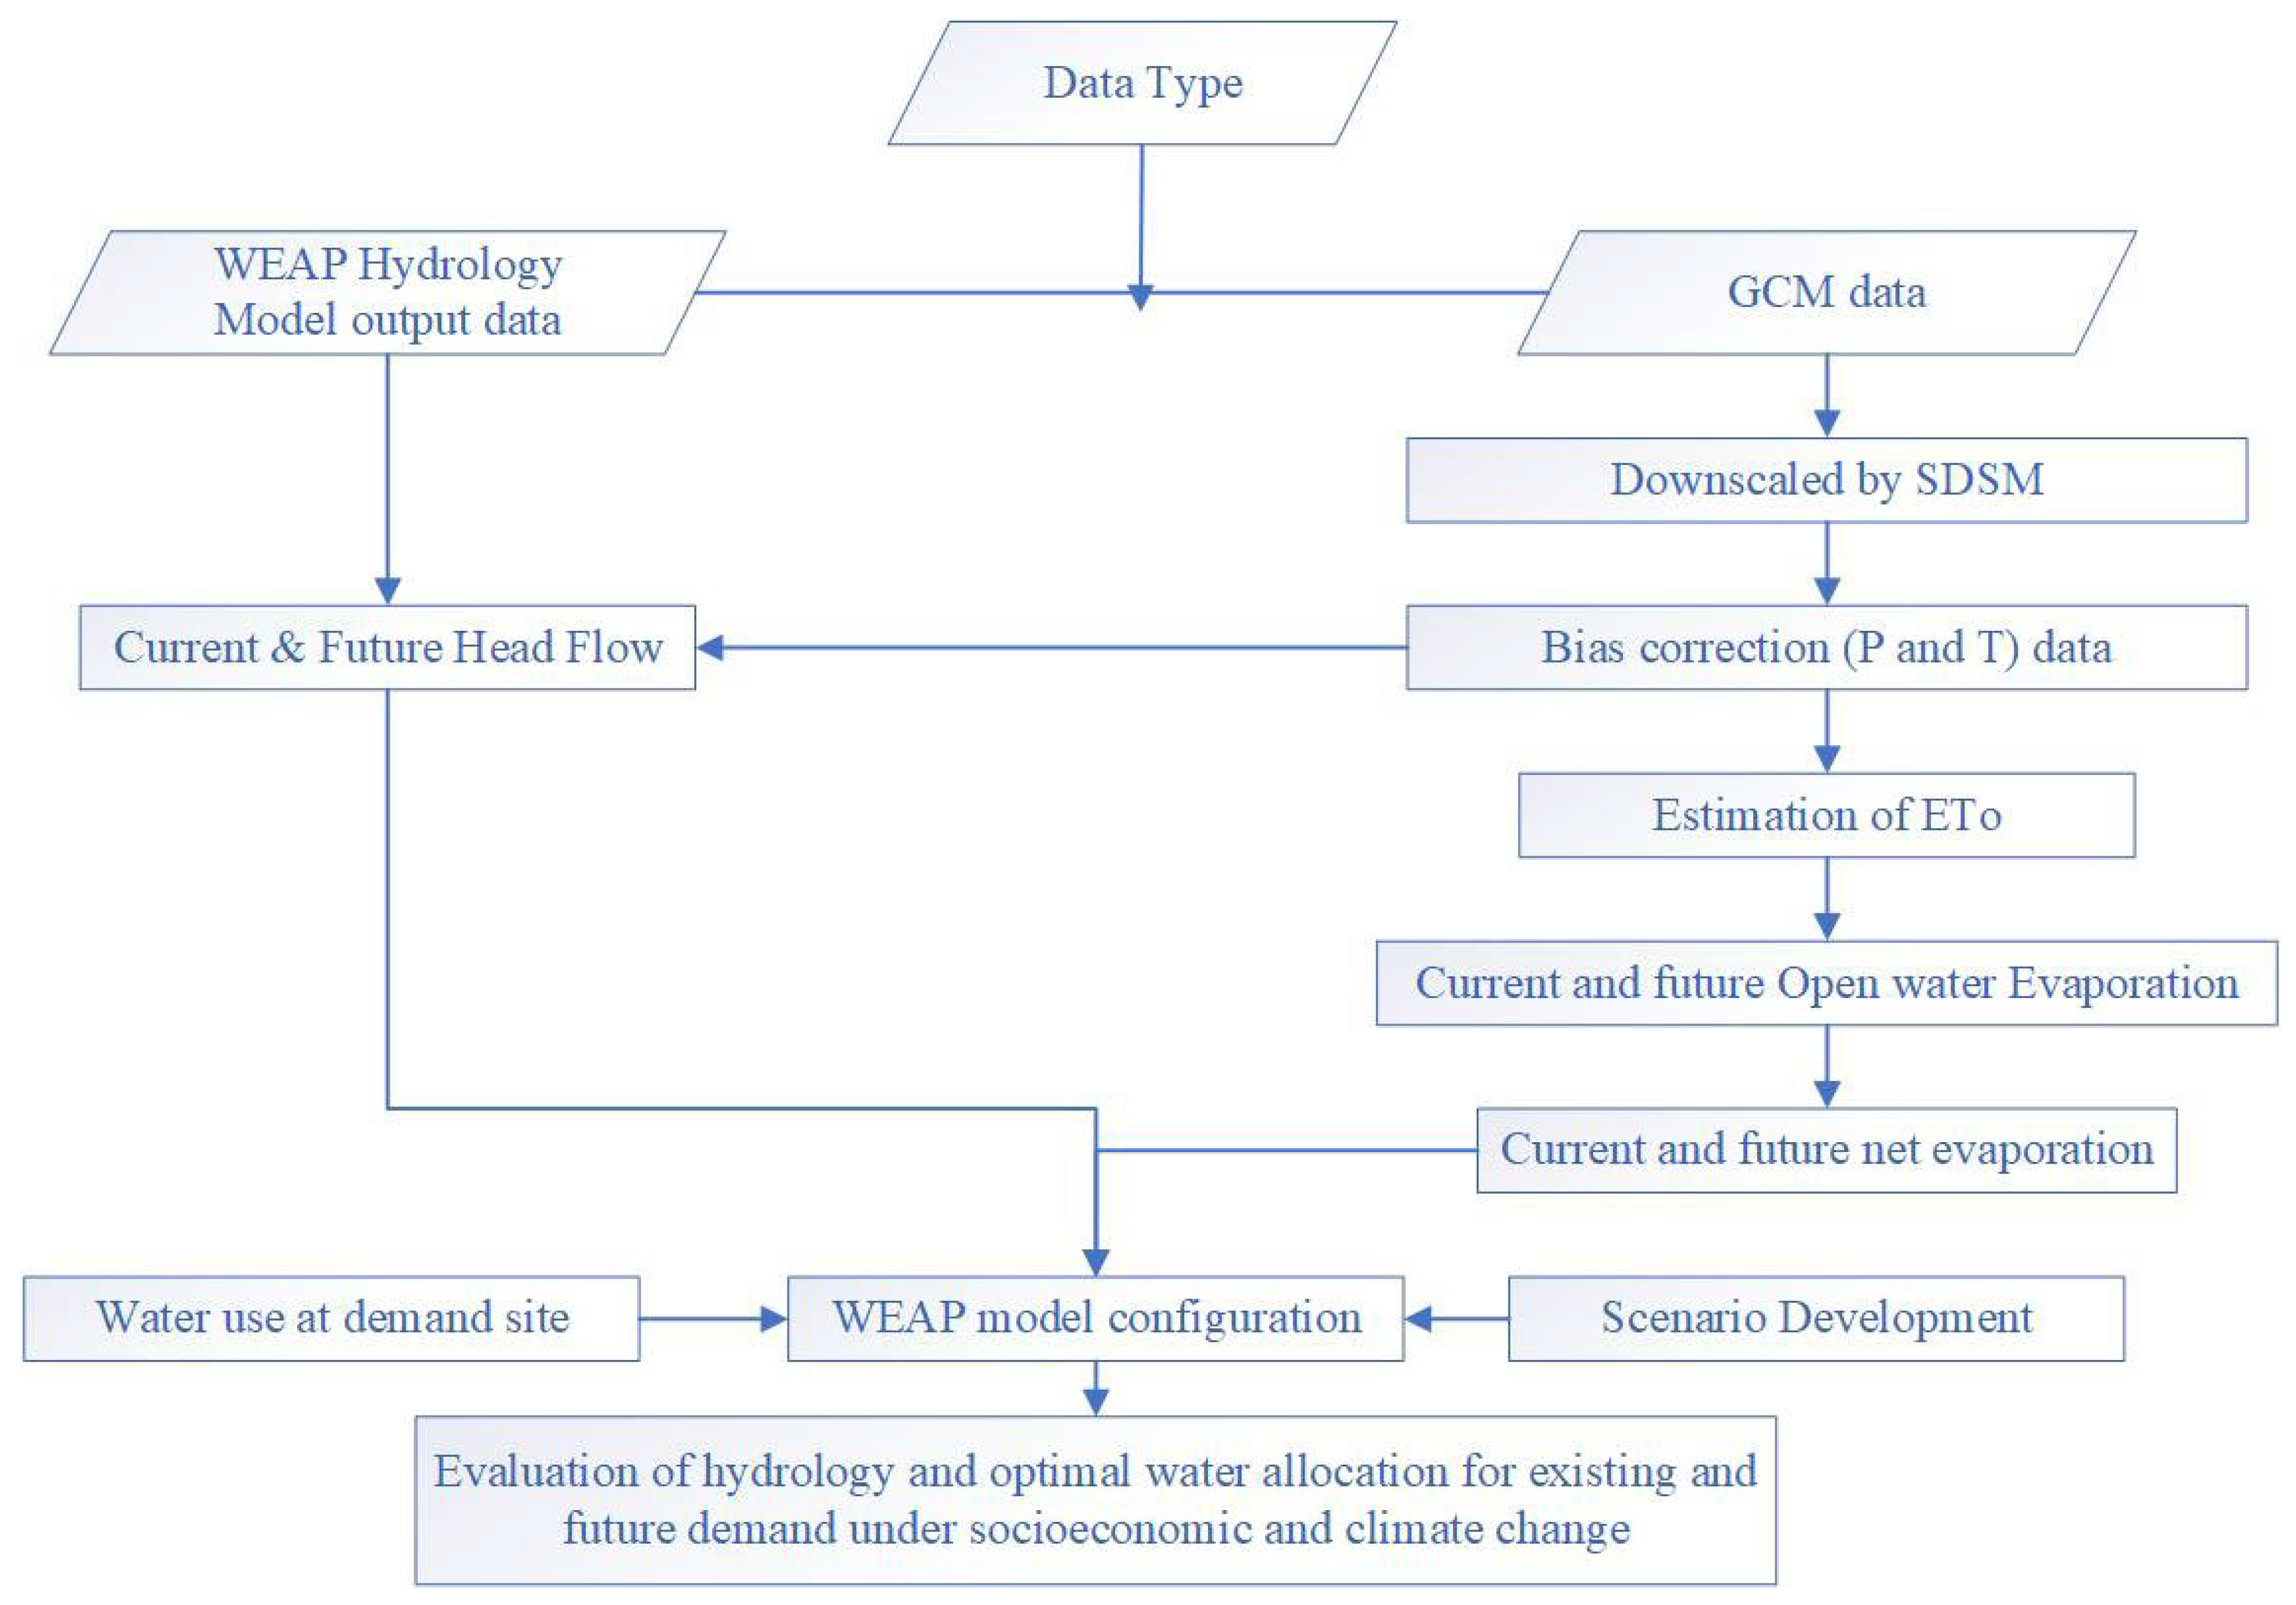
Figure 6.
Calibration and validation of Siluh (a), Genfel (b) and Agulai (c) hydro stations of WEAP model.
Figure 6.
Calibration and validation of Siluh (a), Genfel (b) and Agulai (c) hydro stations of WEAP model.
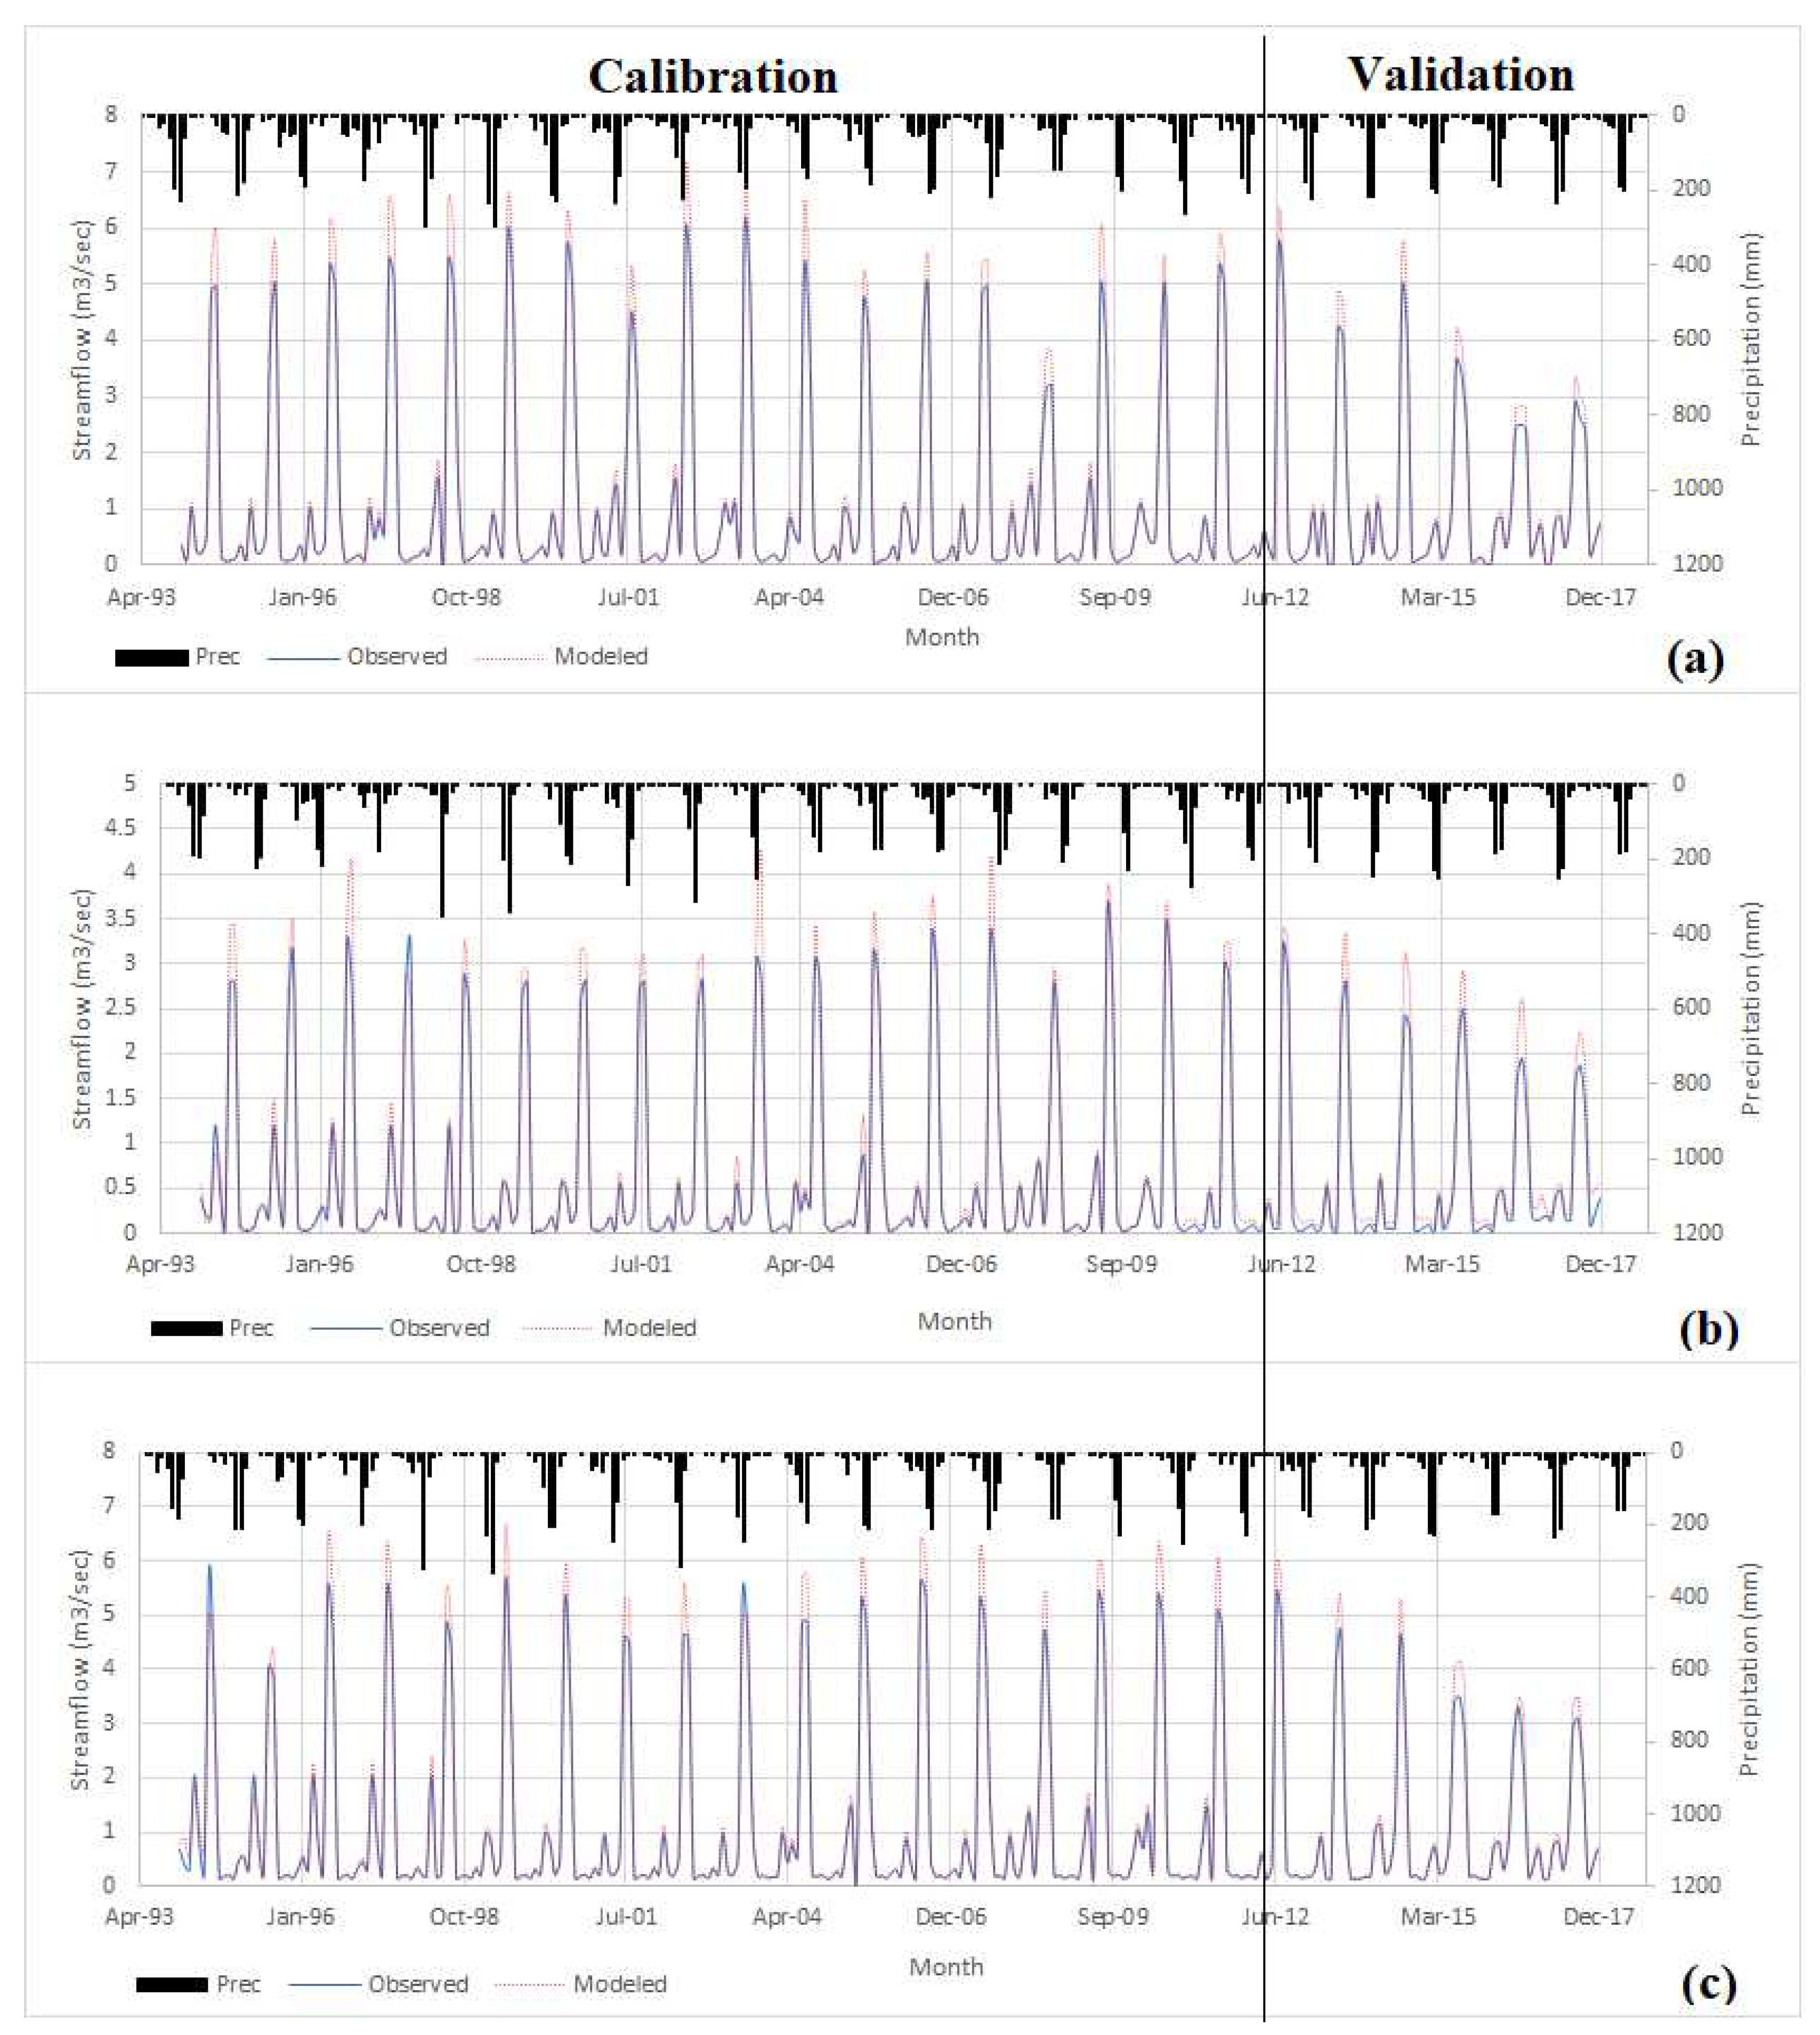
Figure 7.
Precipitation forecasted through the year 2100.
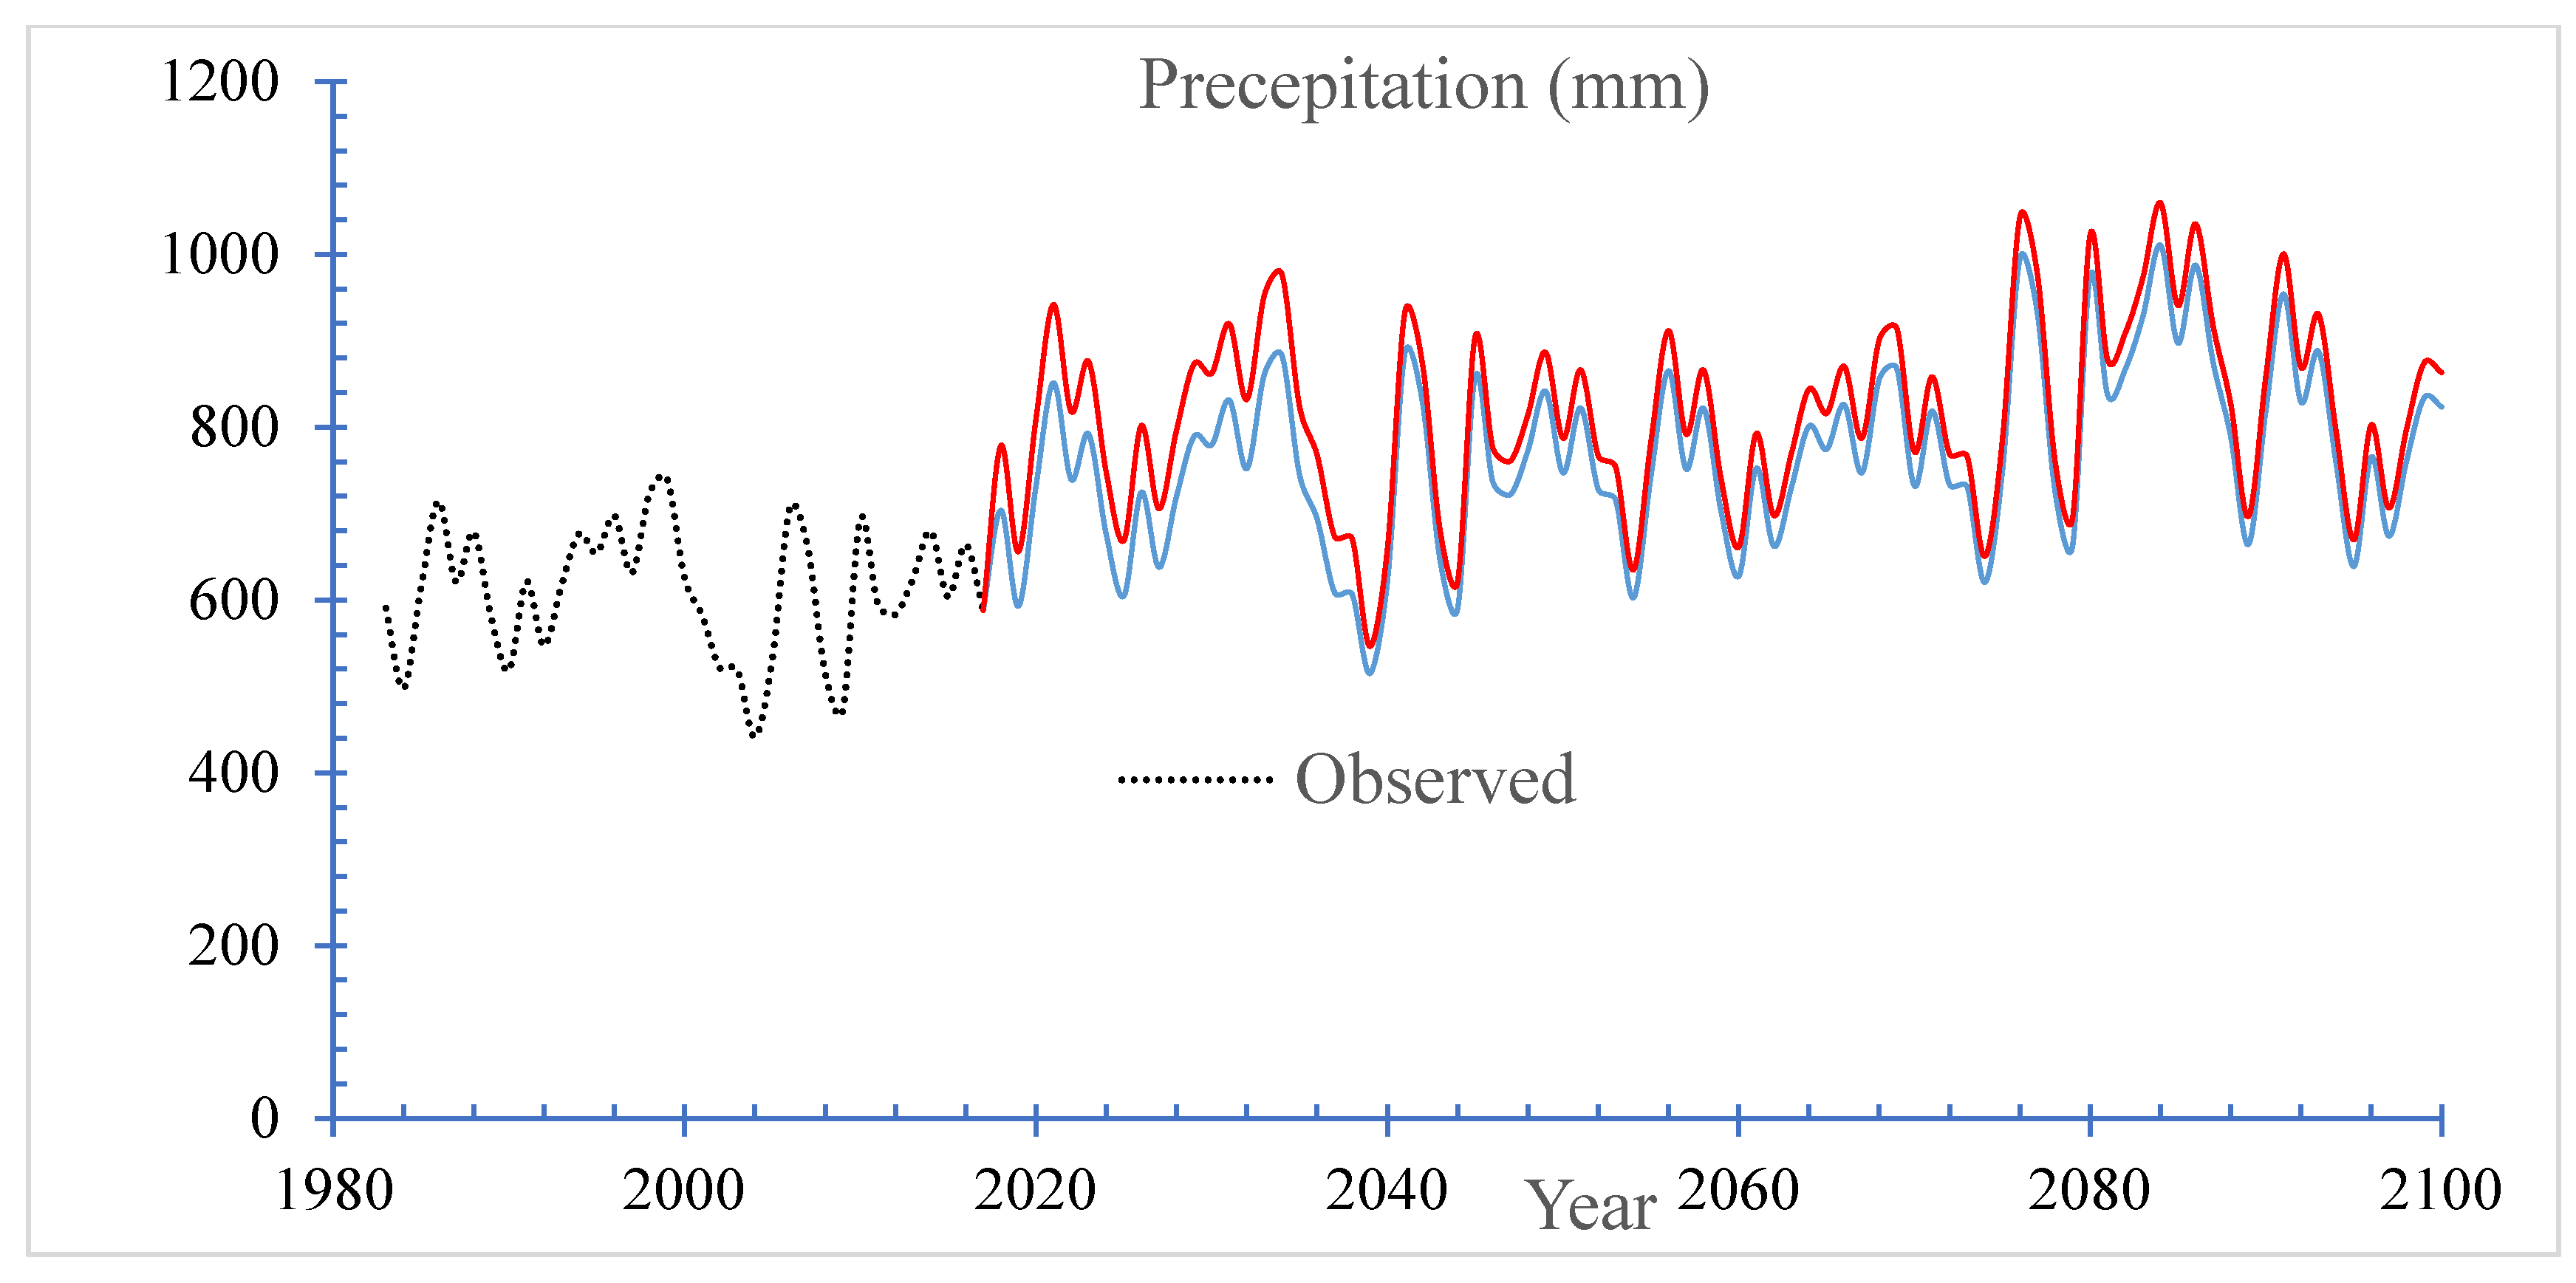
Figure 8.
Forecasted Change in Min Temperatures from now to 2100.
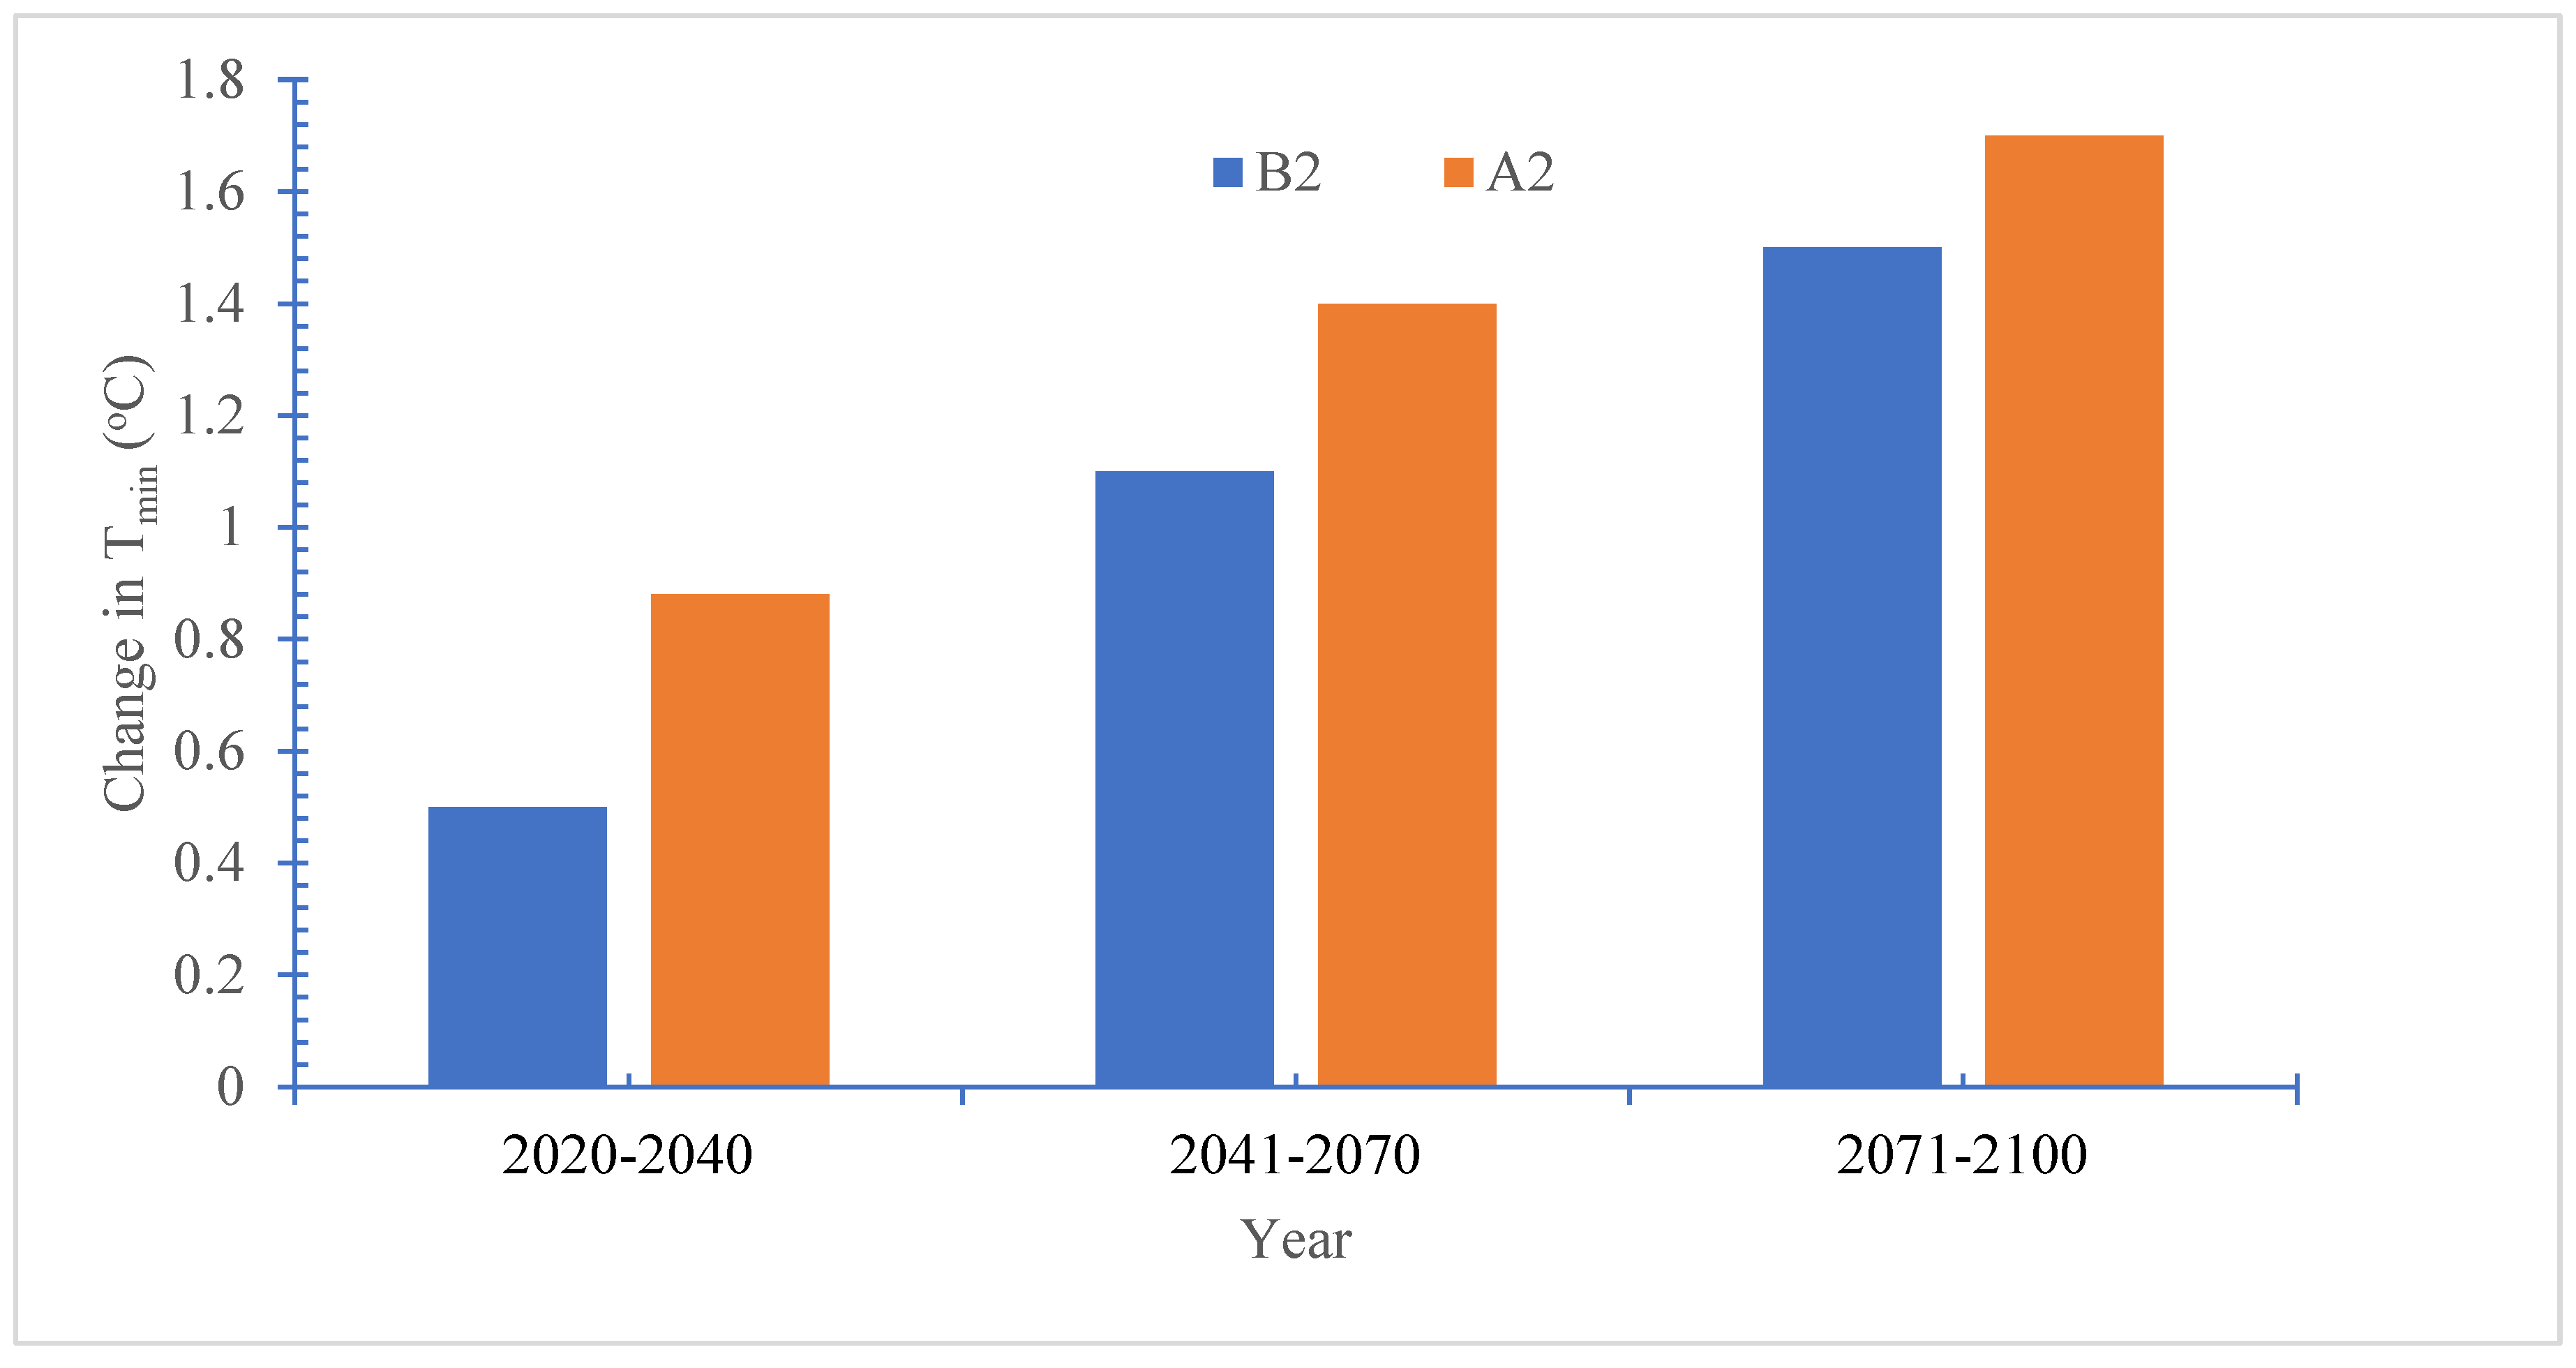
Figure 9.
Forecasted Change in Max Temperatures from now to 2100.
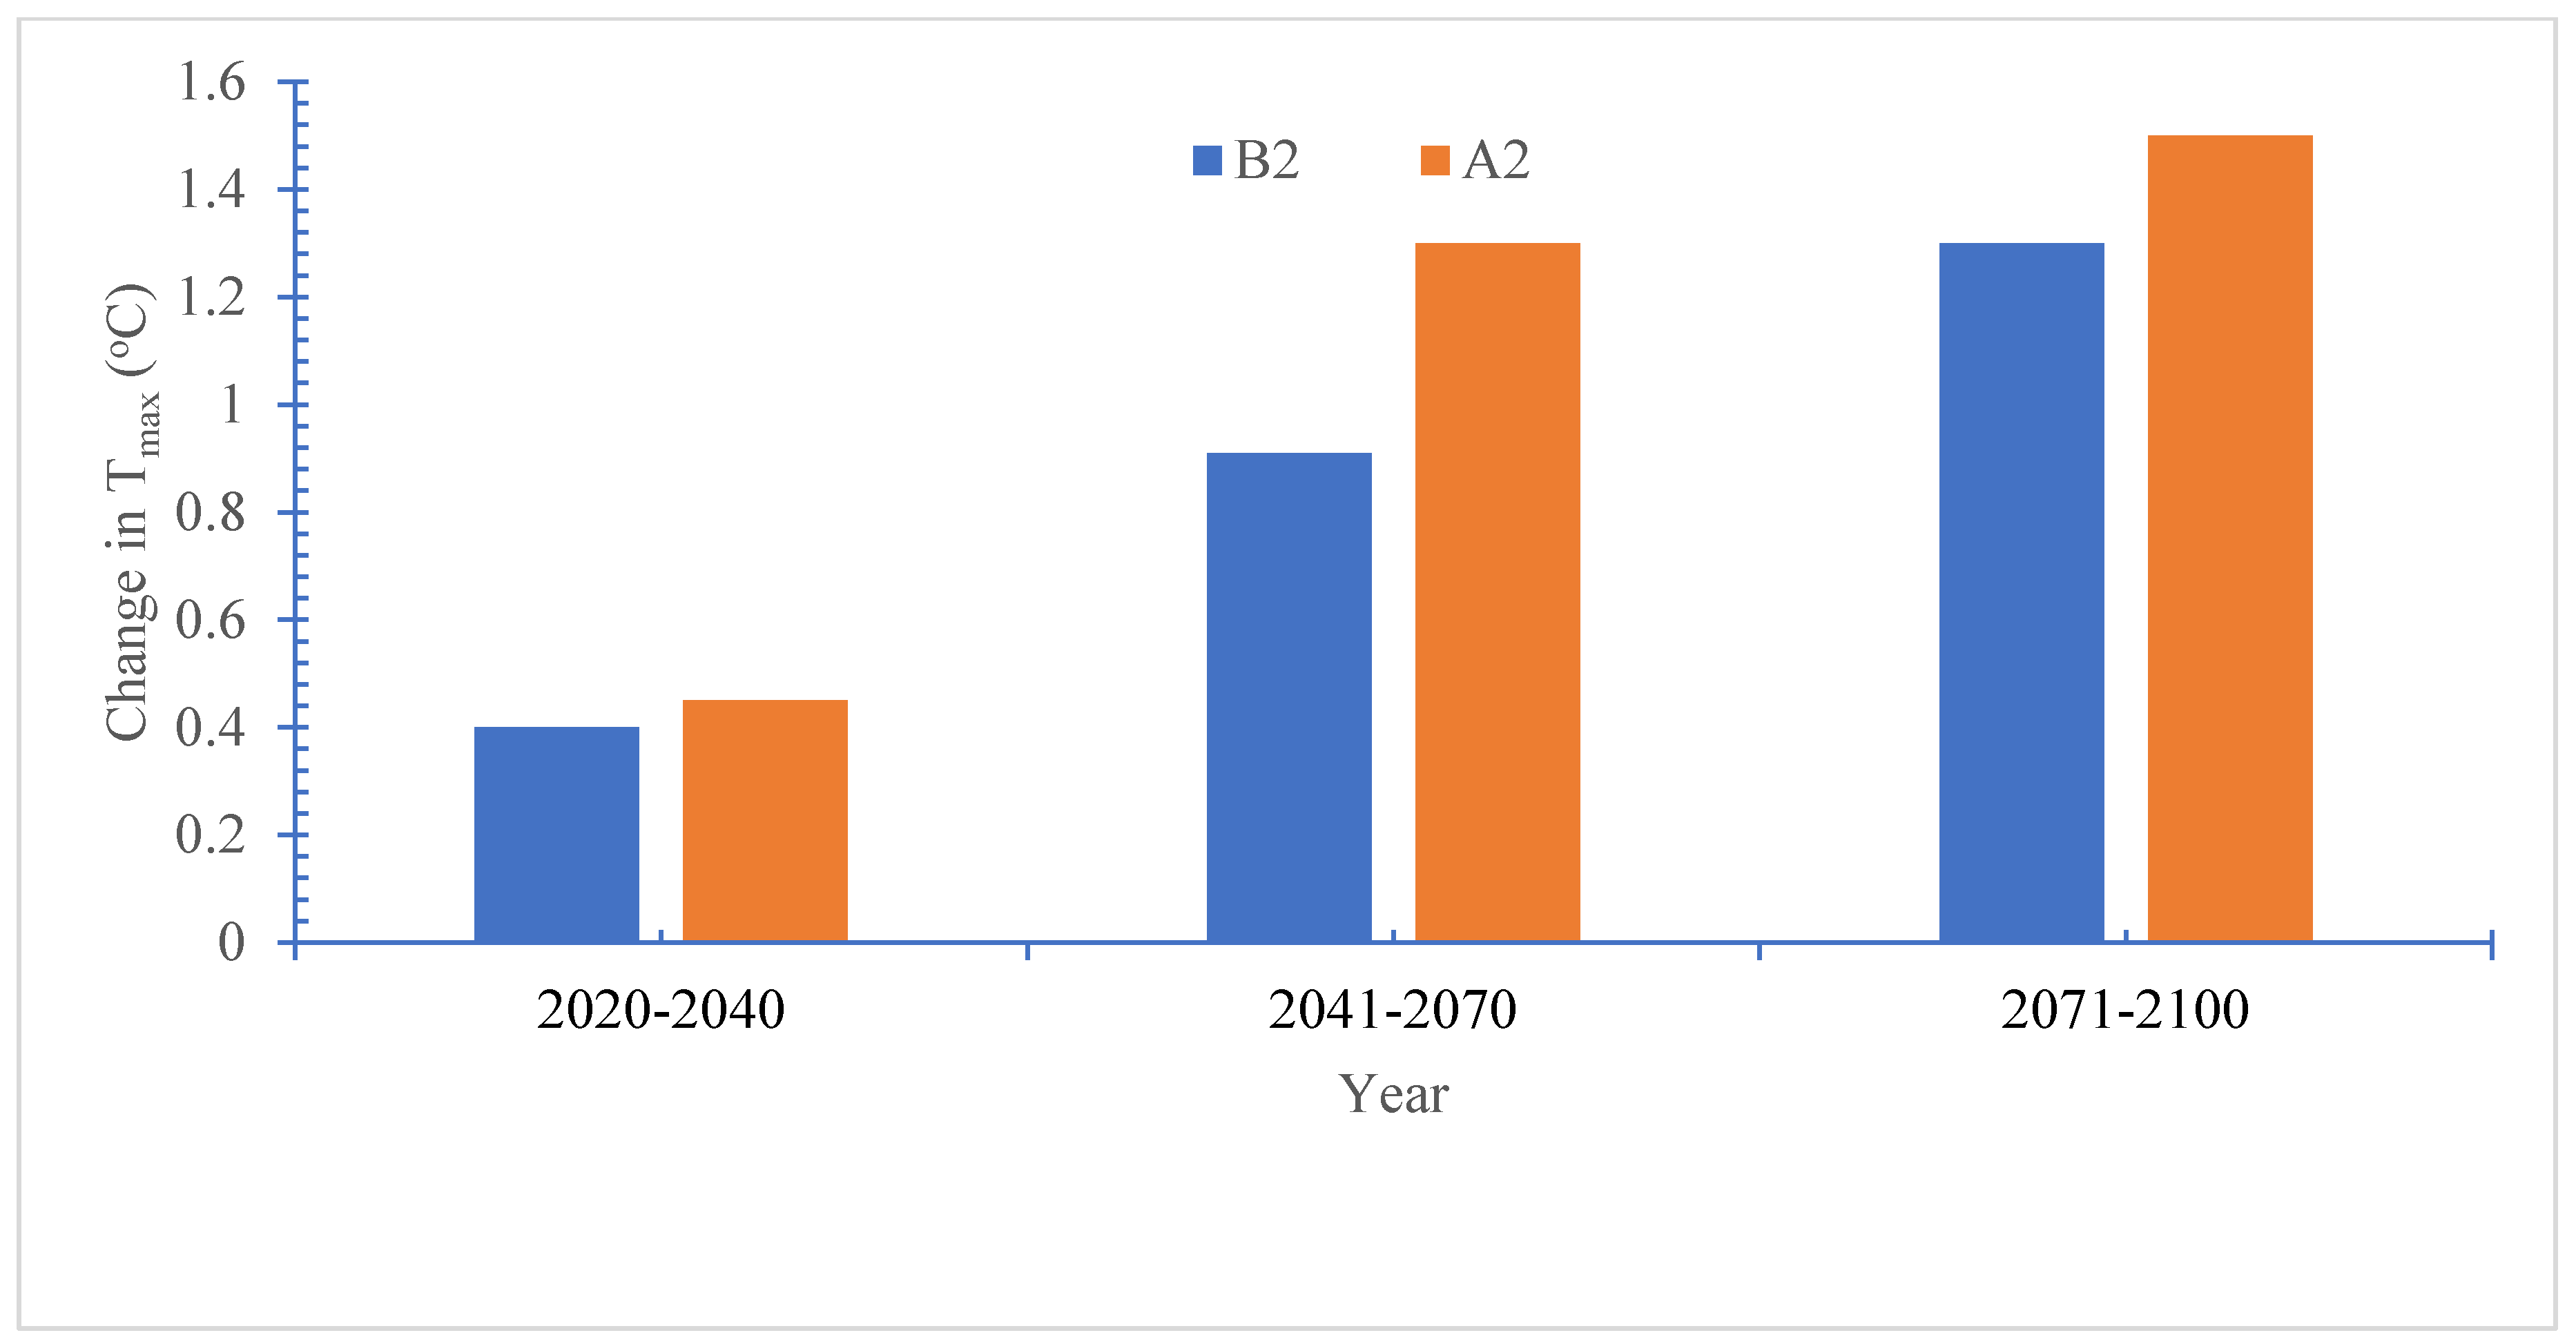
Figure 10.
the baseline and high population growth scenario’s unmet water demand.
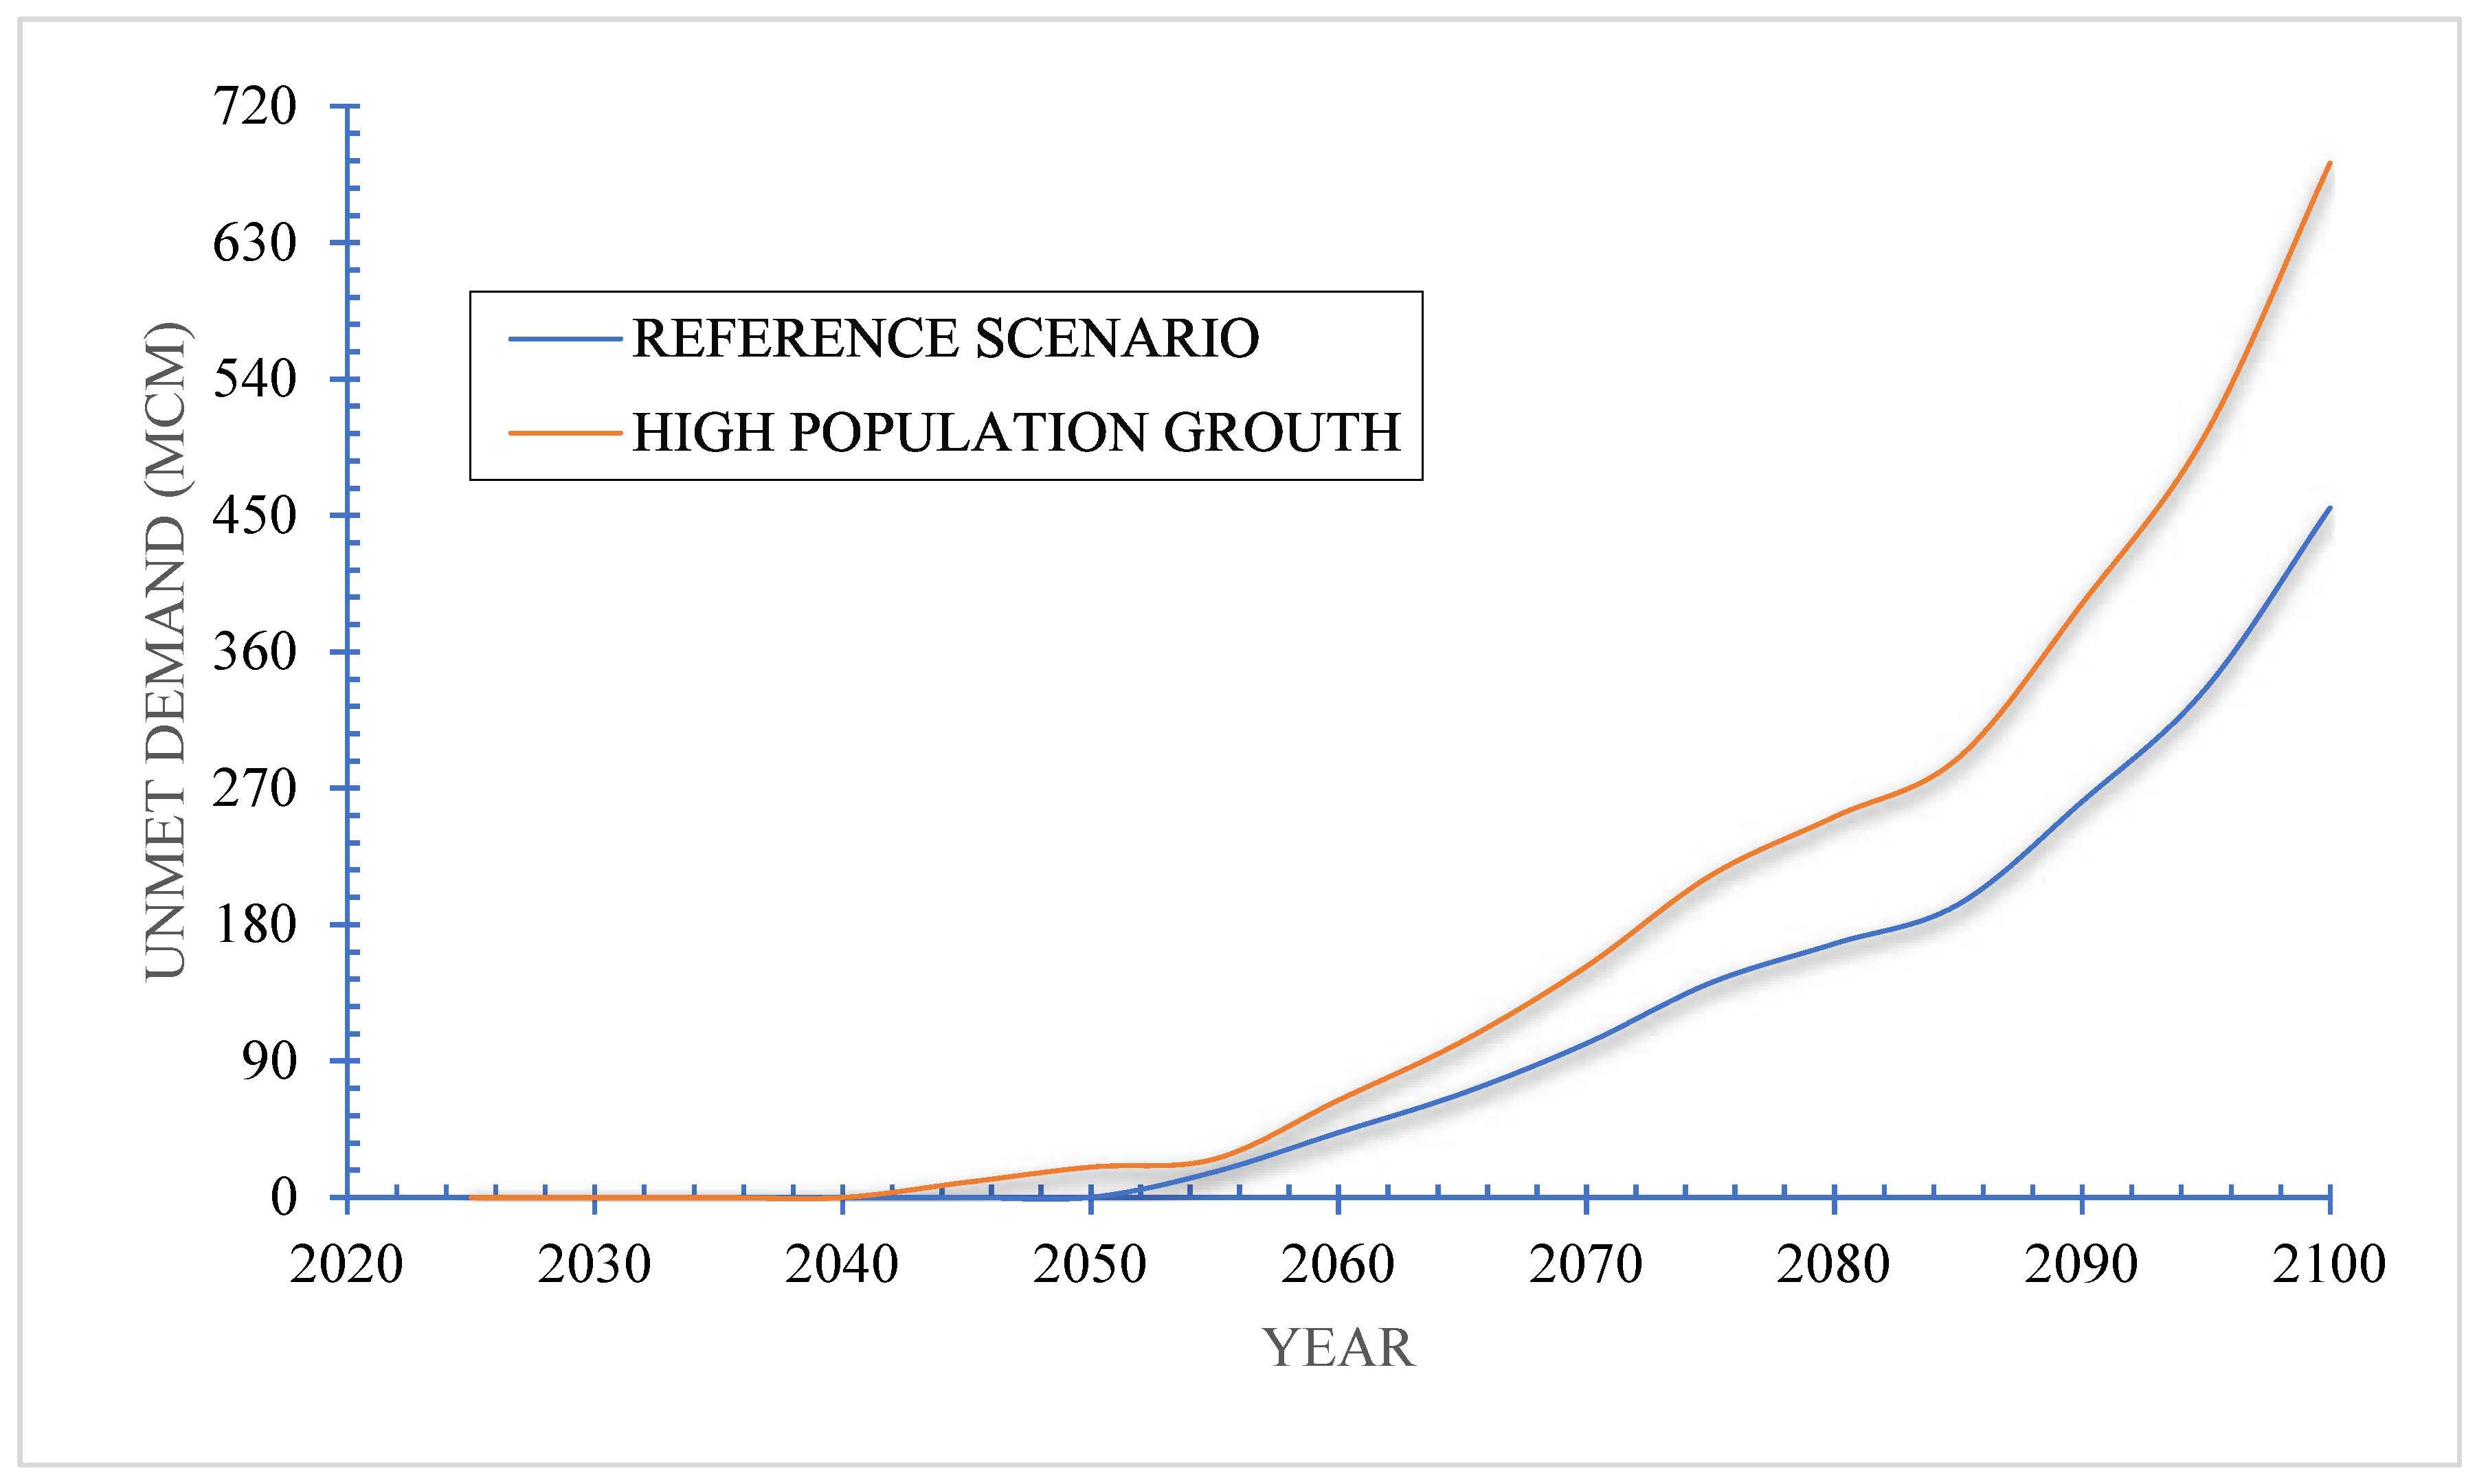
Figure 11.
Unmet annual water demand under a scenario of climate change.
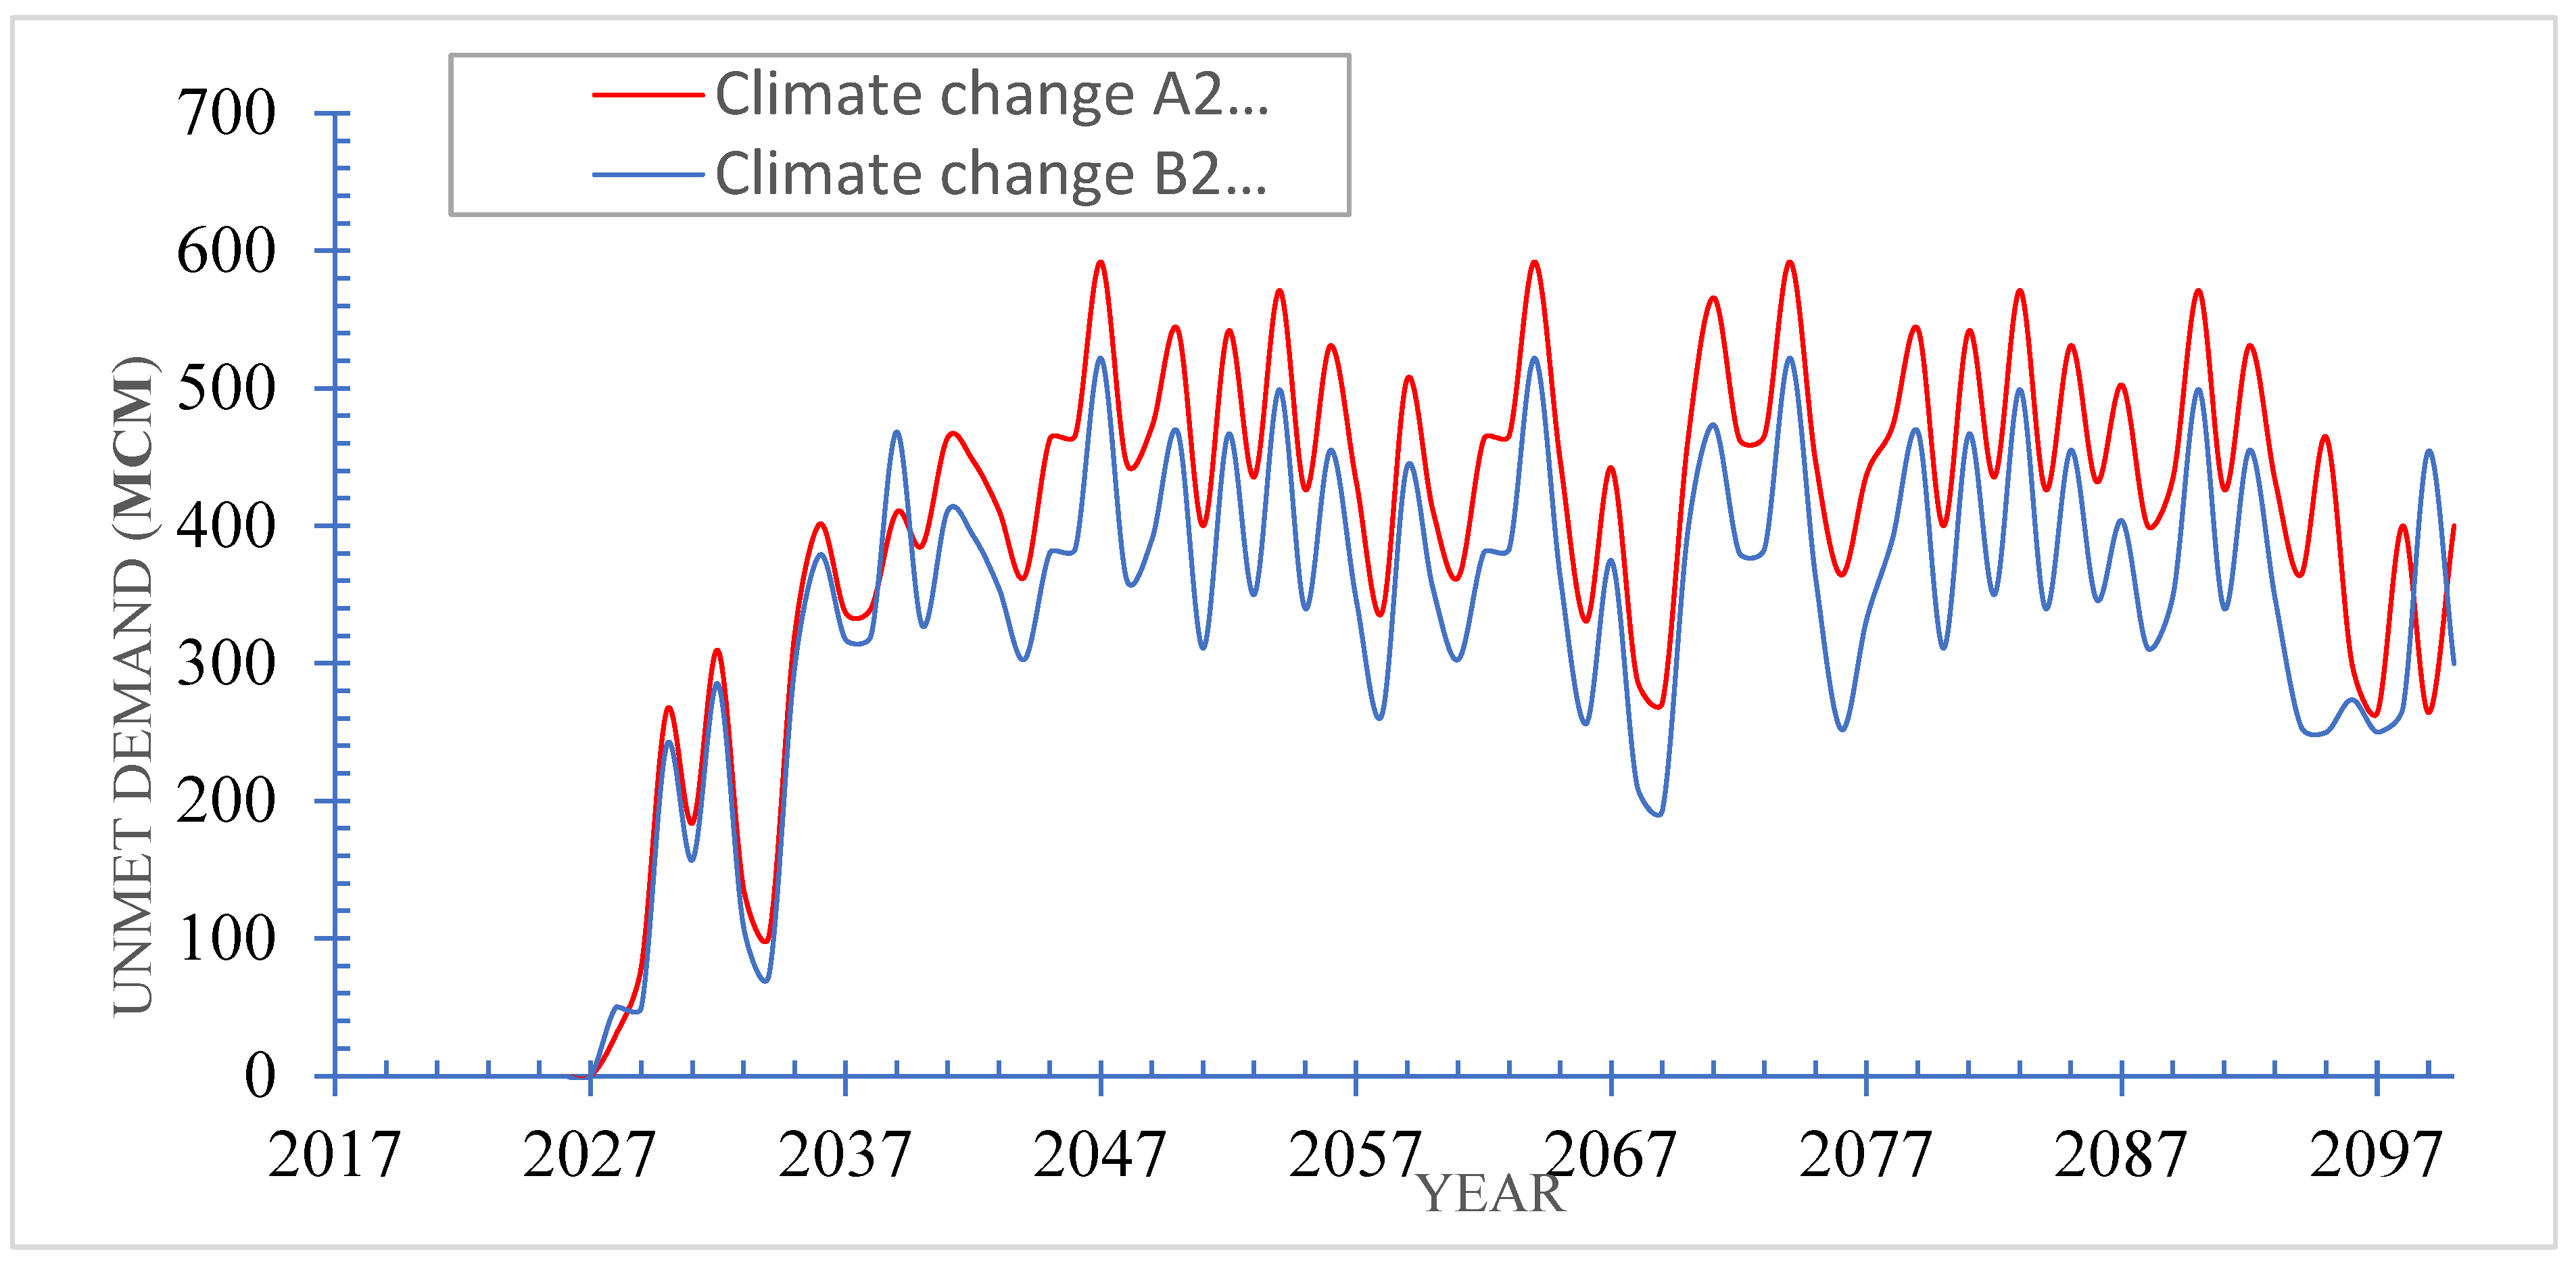
Figure 12.
Changes in the amount of unmet water demand under scenarios of climate change coupled to new irrigation techniques.
Figure 12.
Changes in the amount of unmet water demand under scenarios of climate change coupled to new irrigation techniques.
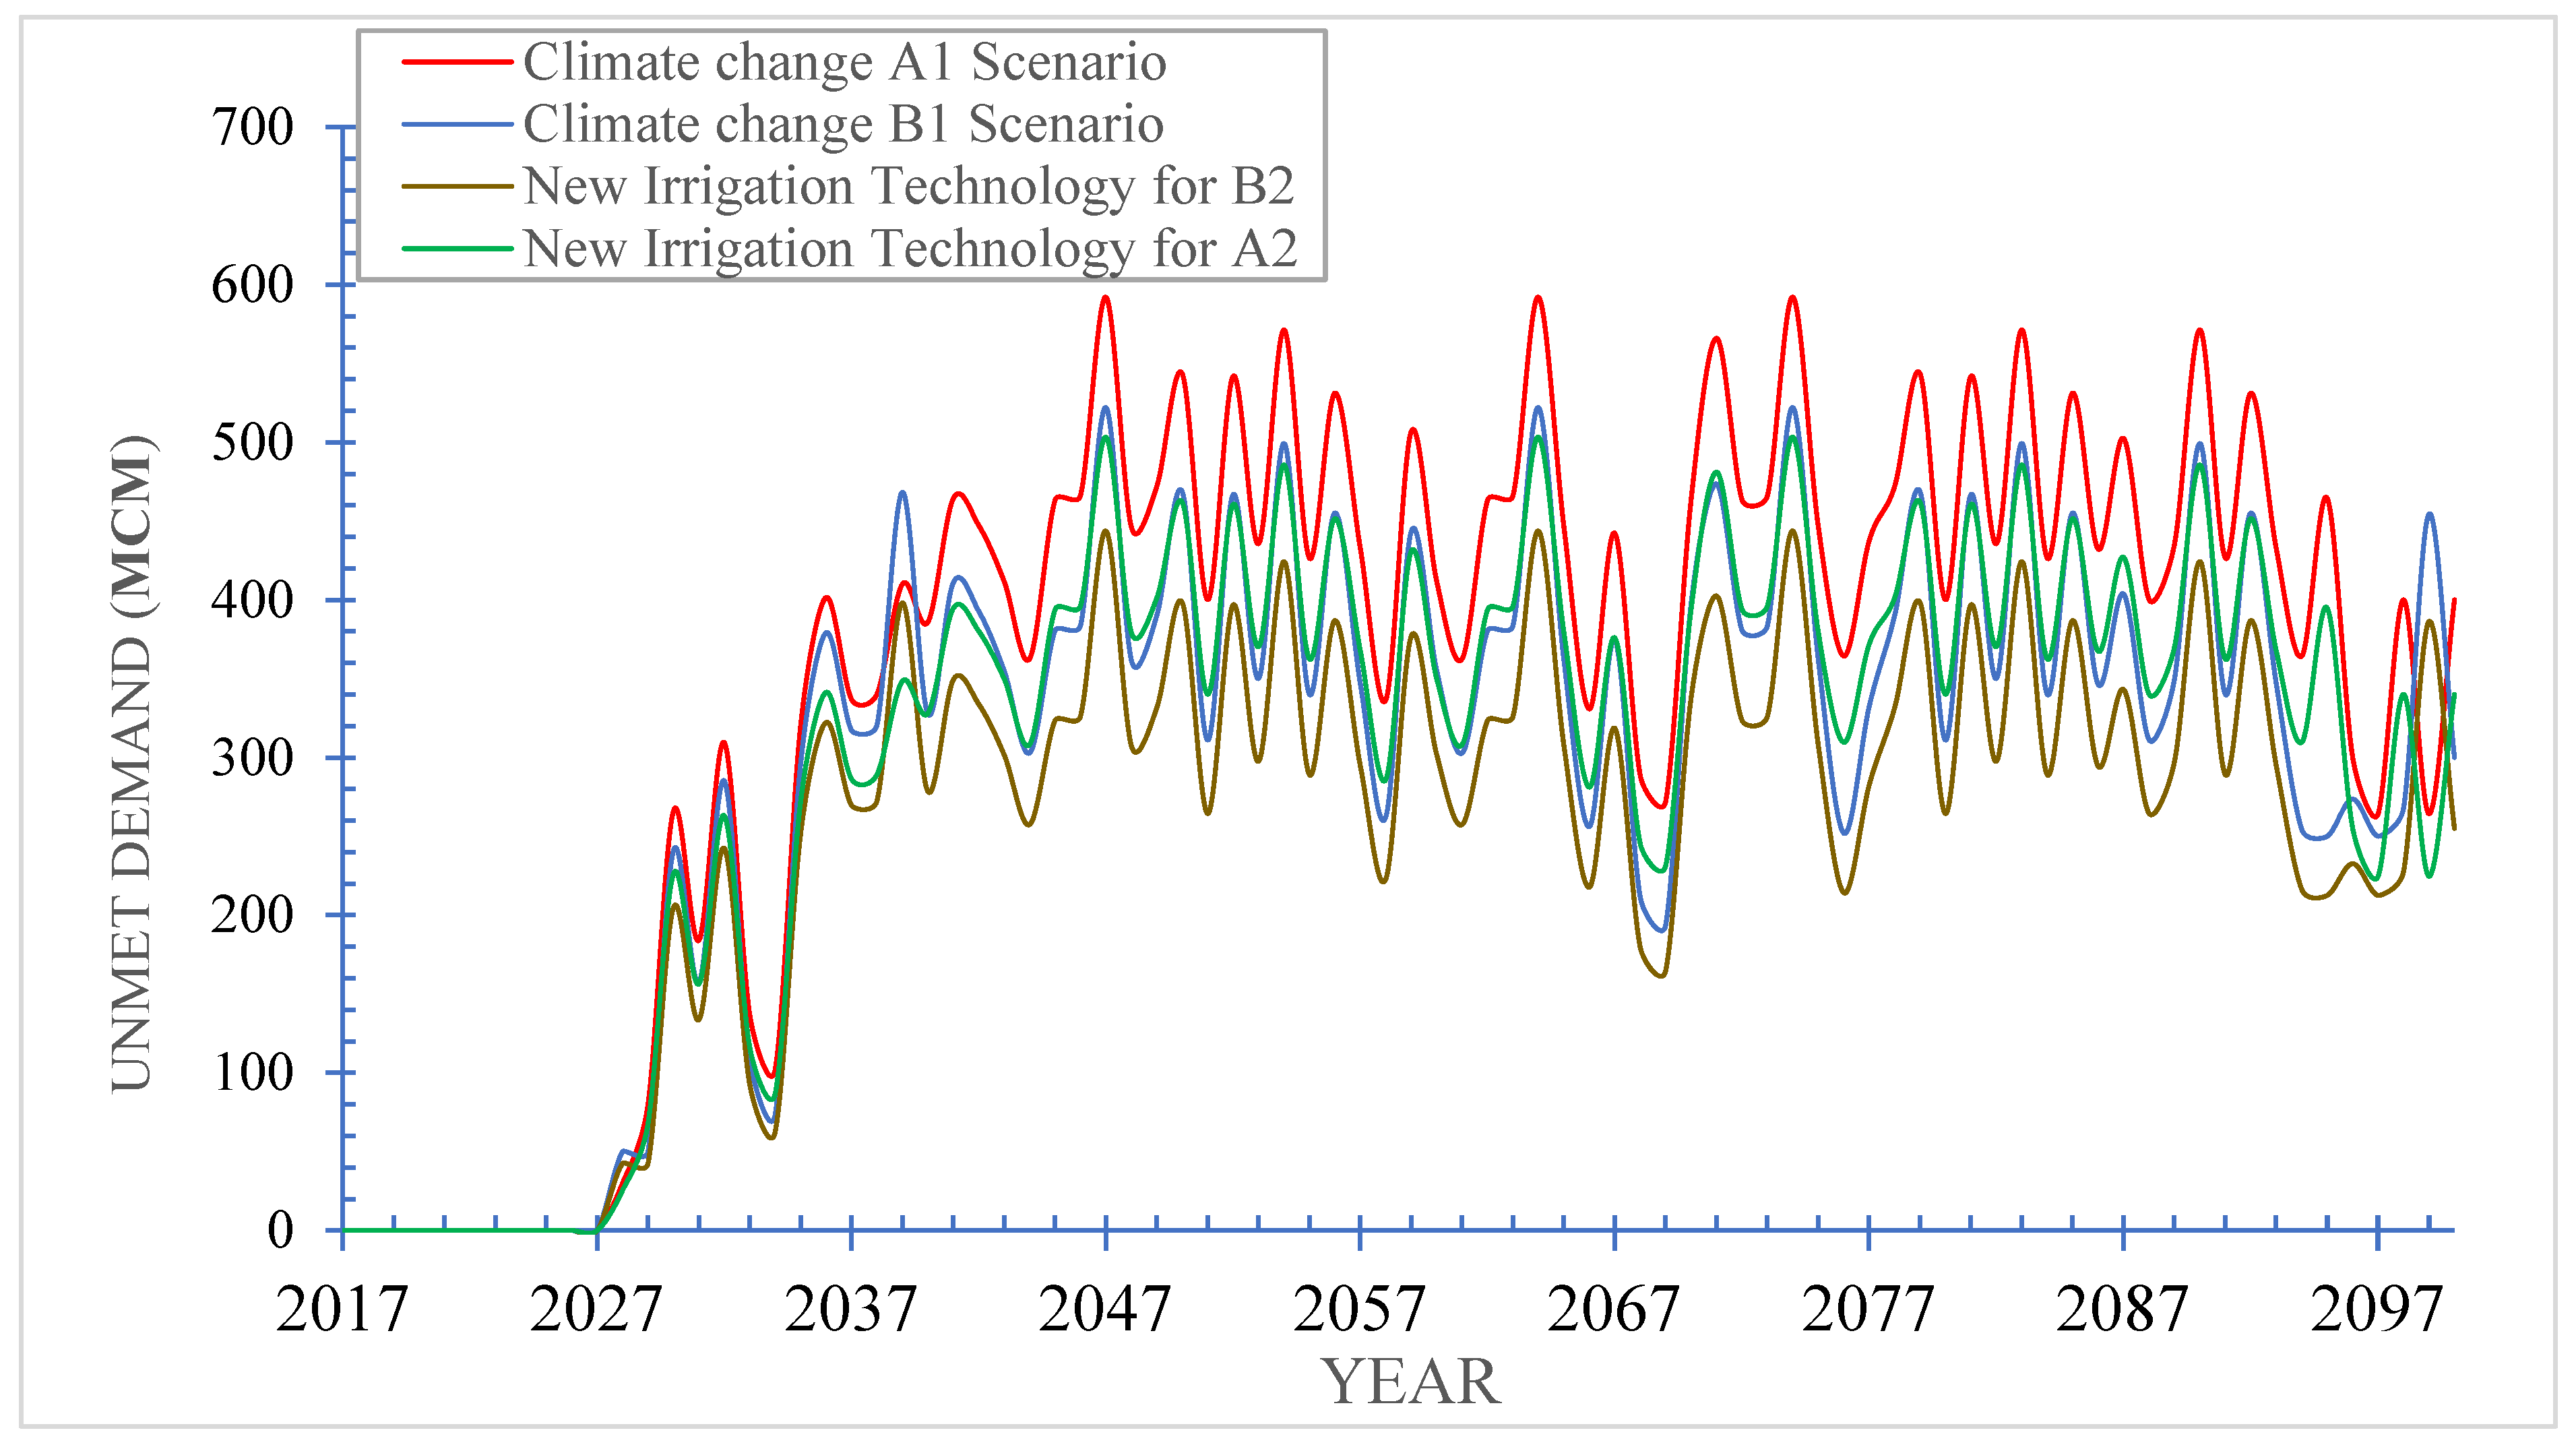
Figure 13.
With better living conditions comes a change in the unmet water demand under climate change.
Figure 13.
With better living conditions comes a change in the unmet water demand under climate change.
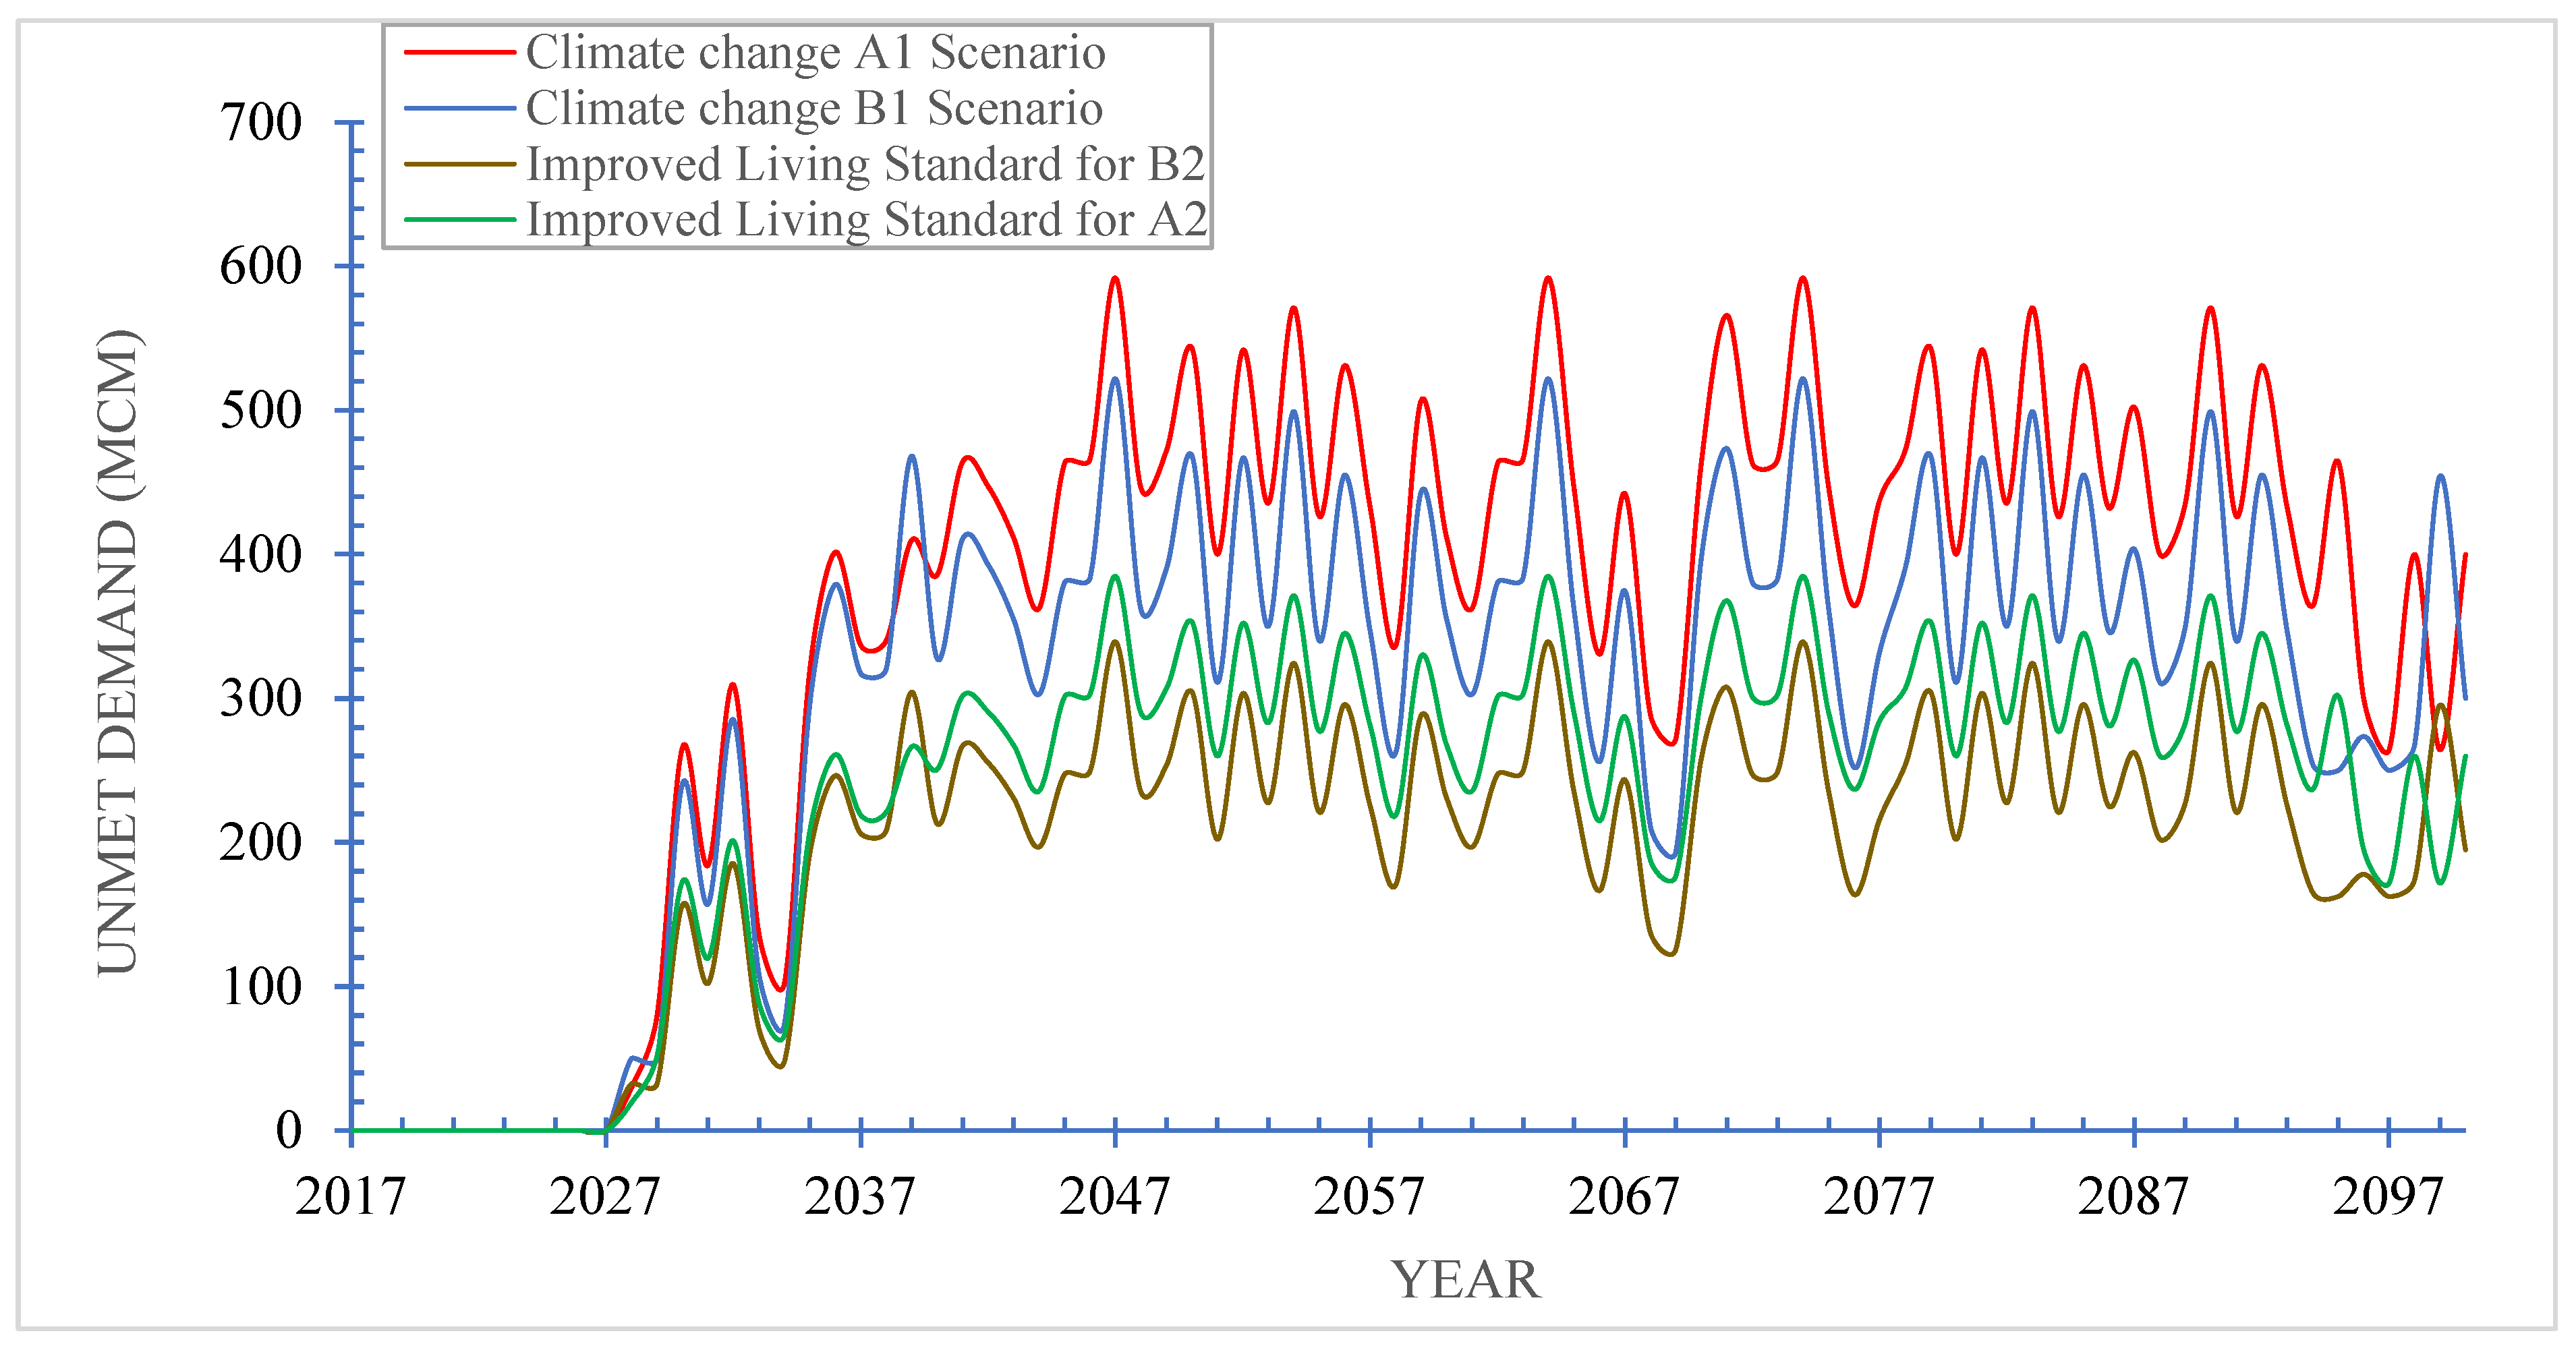
Figure 14.
As a result of the combination of two adaptation measures, under a climate change scenario.
Figure 14.
As a result of the combination of two adaptation measures, under a climate change scenario.
Disclaimer/Publisher’s Note: The statements, opinions and data contained in all publications are solely those of the individual author(s) and contributor(s) and not of MDPI and/or the editor(s). MDPI and/or the editor(s) disclaim responsibility for any injury to people or property resulting from any ideas, methods, instructions or products referred to in the content. |
© 2023 by the authors. Licensee MDPI, Basel, Switzerland. This article is an open access article distributed under the terms and conditions of the Creative Commons Attribution (CC BY) license (http://creativecommons.org/licenses/by/4.0/).
Copyright: This open access article is published under a Creative Commons CC BY 4.0 license, which permit the free download, distribution, and reuse, provided that the author and preprint are cited in any reuse.


