Submitted:
16 November 2023
Posted:
21 November 2023
You are already at the latest version
Abstract
Three new compounds (1, 11 and 12), together with 32 known ones, were isolated from the root bark of Morus alba L. using various chromatographic methods. The structures of the undescribed compounds were elucidated based on 1D, 2D NMR and HRESIMS data analysis, while the known ones were identified by comparison of their spectroscopic data with those reported in the literature. All the isolates were evaluated for their cytotoxic activities against human gastric cancer HGC27 cells by CCK-8 assay. Among them, compounds 5, 8, 10 and 30 exhibited cytotoxic activities on HGC27 cells with IC50 values of 10.24 ± 0.89 μM, 28.94 ± 0.72 μM, 6.08 ± 0.34 μM and 33.76 ± 2.64 μM, respectively. Furthermore, compound 10 was confirmed to reduce proliferation ability, increase apoptosis rate and inhibit cell migration pathway by annexin V/PI double staining experiment, transwell experiment and western blot analysis.
Keywords:
Morus alba L.
; gastric cancer
; HGC27 cells
; cytotoxic activities
1. Introduction
Morus alba L., the root bark of Morus mulberry, is a well-known traditional Chinese medicine (TCM) documented in Chinese Pharmacopoeia [1]. The root bark of M. alba has been widely used in Chinese herbal medicinal prescriptions for the treatment of pneumonia, hypertension, diabetes, arthritis [2,3]. Previous phytochemical studies revealed that M. alba contained a variety of polyphenolic constituents such as prenylated flavonoids, 2-arylbenzofurans, stilbene, coumarin and mulberry diels-alder-type adducts. In addition, Pharmacological studies exhibited that some polyphenols from M. alba had a broad spectrum of biological activities, such as hepatoprotective activity, whitening ability, and antiplatelet effects [4,5,6,7,8,9]. Previous studies also showed that diverse individual compounds or extracts from different parts of various mulberry plants (M. alba, M. australis, M. wittiorum and M. yunanensis) exhibited anti-tumor activity against different tumor cell lines, such as lung cancer, liver cancer, colon cancer, breast cancer, rectal adenocarcinoma, and renal adenocarcinoma [10,11,12,13,14]. Our preliminary pharmacological experiment showed that the 75% ethanol extract of M. alba exhibited certain anti-tumor activity against gastric cancer cells, which had rarely been reported. Thus, the present paper focuses on detailed phytochemical investigation of the 75% ethanol extract of M. alba and evaluation of anti-tumor activity against gastric cancer cells of the isolated individual compounds. As a result, thirty five compounds including three new ones were obtained. Among them, compound 10 (Albanol B) showing the most significant cytotoxicity with an IC50 value of 6.08 ± 0.34 μM. Moreover, the potential mechanism was preliminarily explored.
2. Results and Discussion
2.1. Isolation and Structure Elucidation
Phytochemical investigation on the 75% ethanol extract of the root bark of M. alba led to the isolation and identification of three new compounds (1, 11 and 12) and 32 known compounds (2–10, 13–35) as shown in Figure 1. The known compounds were identified by comparing their NMR and ESIMS data with those reported in the literature as mulberrofuran D (2) [17], Mulberofuran B (3) [18], Mulberofuran A (4), Albafuran A (5) [20], Mulberrofuran Y (6) [21], Moracin M (7) [22], Mulberrofuran G (8) [23], Mulberrofuran J (9) [24], Albanol B (10) [25]. Kuwanon T (13) [23], Morusin (14) [18], KuwanonA (15) [26], Notabilisin L (16) [27], 14-Methoxydihydromorusin (17) [28], Neocyclomorusin (18) [29], Cyclomulberrin (19) [30], Cyclomorusin (20) [29], Artoflavone (21) [31], Cudraflavone A (22) [32], Kuwanon C (23) [33], Mornigrol H (24) [34], Austraone A (25) [35], Sanggenol Q (26) [36], Cycloaltilisin 7 (27) [37], Sanggenol O (28) [23], Kuwanon E (29) [29], Benzokuwanon E (30) [38], Kuwanon G (31) [18], Albanin G (32) [39], Moracenin D (33) [40], Mulberrofuran P (34) [41], 7,4′-Dihydroxyflavone (35) [42].
Compound 1 was obtained as a brown amorphous powder. The molecular formula of 1 was determined as C25H28O5 according to its HR-ESI-MS at m/z 438.1831 [M + Na]+ (calcd. for C25H28O5Na, 438.1829), indicating the presence of 12 degrees of unsaturation. Absorption maxima in the UV spectrum of 1 at λmax 216 (4.21) and 316 (4.19) nm suggested that it was a 2-arylbenzofuran derivative [43]. In the 1H NMR spectrum (Table 1), three methyl groups at δH 1.62 (3H, s, H-10″), 1.89 (3H, s, H-4″), 3.86 (3H, s, -OCH3); four methylenes at δH 1.60 (2H, m, H-6″), 2.02 (2H, m, H-5″), 3.62 (2H, d, J = 7.2, H-1″), 4.79, 4.72 (2H, s, H-9″α, β); an olefinic singlet at δH 6.92 (1H, s, H-3), two aromatic doublet signals at δH 7.32 (1H, d, J = 8.4, H-4), δH 6.90 (1H, d, J = 8.4, H-5), a 1, 3, 5-trisubstituted aromatic system (ring B) at δH 6.80 (2H, d, J = 2.0, H-2′, 6′) and δ 6.26 (1H, s, H-4′) were observed. The 13C NMR (Table 1), DEPT and HSQC spectra showed 25 carbon signals, including three methyls, four methylenes, eight methines, and ten quaternary carbons. Comparison of the 1H and 13C-NMR spectral data of 1 with those of mulberofuran B (3) indicated that they shared similar chemical structures [18]. The marked difference occurred in the position of C-7″ of the geranyl group. The carbon signals for C-5″and C-7″ were shifted downfield to δC 36.7 (-4.2 ppm) and 76.1 (-49.3 ppm), while the C-6″, C-8″ and C-9″ signals in 1 were shifted upfield dramatically to δC 34.2 (+6.5 ppm), 148.6 (+16.3 ppm) and 111.5 (+85.7 ppm) (Table 1), respectively. Signals in the upfield of the 1H NMR spectrum of 1 were deduced to be a changed geranyl group, one of whose double bonds was hydrated. Two proton signals at δH 4.72 (1H, s) and 4.79 (1H, s) and a signal at δH 3.90 (1H, t, J = 6.8 Hz) suggested that a terminal methylene group and an oxygen-bearing methine group were present in the geranyl group. According to the HSQC spectrum that δC 111.5 and δC 76.1 was connected with δH 3.90 (1H, t, J = 6.8 Hz), δH 4.79 (1H, brs) and 4.72 (1H, s), respectively. In the HMBC spectrum (Figure 2), long-range correlations of H-9″/C-7″, 10″ and H-7″/C-5″, 9″, 10″, demonstrated that the geranyl group was replaced by a 7″-hydroxy-3″, 8″-dimethylbut-2″, 8″dioctenyl group [44]. Furthermore, H-1″ showed long-range correlations with C-6 and C-7a, supporting that the changed geranyl group was located at C-7. According to the above NMR data analysis, compound 1 (shown in Figure 1) was elucidated as 7″-hydroxy-3″, 8″-dimethylbut-2″, 8″-dioctenyl- 6-methoxy- 3′, 5′-dihydroxy-2-arylbenzofuran, and was named mulberofuran Z.
Compound 11 was obtained as a yellow powder. The molecular formula of 11 was determined as C25H26O7 according to its HR-ESI-MS at m/z 439.1751 [M + H]+ (calcd. for C25H27O7, 439.1751), indicating 13 degrees of unsaturation. The IR spectrum exhibited absorption peaks attributable to hydroxy groups (3415 cm-1), a conjugated carbonyl group (1656 cm-1), and aromatic rings (1621, 1554, 1448 cm-1). In the 1H NMR spectrum, signals due to an isopentyl group at δH 1.61 (3H, s, CH3-4′′), 1.71 (3H, s, CH3-5′′), 3.36 (2H, d, J = 6.0 Hz, H-1′′), and 5.13 (1H, brt, J = 6.0 Hz, H-2′′) were observed. The 1H NMR spectrum also showed ortho-coupled aromatic protons (ring B) at δH 7.67 (1H,d, J = 9.0 Hz, H-6′), 6.74 d (1H, d, J = 9.0 Hz, H-5′) and meta-coupled aromatic protons (ring A) at δH 6.12 (1H, brs, H-6), 6.33 (1H, brs, H-8). Two methyl groups δH 1.18 (3H, s, CH3-12), 1.29 (3H, s, CH3-13) and an AMX coupling system at δH 2.74 (1H, dd, J = 16.2, 6.0 Hz, H-9α), 3.00 (1H, dd, J = 16.2, 3.6 Hz, H-9β) and 3.99 (1H, dd, J = 6.0, 3.6 Hz, H-10) indicated the existence of an oxepin ring [45]. The 13C NMR, DEPT and HSQC spectra showed the presence of 25 carbons, including 4 methyl, 2 methylene, 6 methylene and 13 quaternary carbons. Comparison of the 1H NMR and 13C NMR data of compound 11 with those of the known compound artoxanthocarpuone A suggested that the difference between them was the location of the isopentyl group at C-3′ in 11 rather than at C-6 in artoxanthocarpuone A, which was further confirmed by the key long range correlations from δH 3.36 (H-1′′) to δC 159.4 (C-2′), 119.9 (C-3′), 156.4 (C-4′) and 130.3 (C-3′′) (Figure 2). Based on these observations, compound 11 can be assigned as shown in Figure 1 and named as artoxanthocarpuone C.
Compound 12 was obtained as a yellow powder. The molecular formula of 12 was determined as C25H26O7 according to its HR-ESI-MS at m/z 439.1749 [M + H]+ (calcd. for C25H27O7, 439.1751), indicating 13 degrees of unsaturation. The IR spectrum exhibited absorption peaks attributable to hydroxy groups (3372 cm-1), a conjugated carbonyl group (1645 cm-1). The UV spectrum showed absorbance maxima at 336 and 215 nm, typical of a flavone skeleton. The 1H NMR spectrum clearly exhibited the presence of an isopentyl group at δH 1.34 (3H, s, CH3-4′′), 1.58 (3H, s, CH3-5′′), 3.08 (2H, dd, J = 7.2, 5.4 Hz, H-1′′), and 5.07 (1H, t, J = 7.2 Hz, H-2′′). The 1H NMR spectrum also showed ortho-coupled aromatic protons (ring B) at δH 6.98 (1H, d, J = 8.4 Hz, H-6′), 6.42 (1H, d, J = 8.4 Hz, H-5′) and meta-coupled aromatic protons (ring A) at δH 5.91 (1H, s, H-6), 6.00 (1H, s, H-8). Two methyl groups δH 1.36 (3H, s, CH3-12), 1.28 (3H, s, CH3-13) and an AMX coupling system at δH 2.61 (1H, dd, J = 16.8, 5.4 Hz, H-9a), 2.95 (1H, dd, J = 16.8, 7.4 Hz, H-9b), and 3.80 (1H, dd, J = 16.2, 5.4 Hz, H-10) indicated the existence of an oxepin ring [45]. The 1H NMR and 13C NMR spectra of 12 were similar to those of the known compound kuwanon A [26]. The carbon signals at δC 70.2 (C-10) and 27.6 (C-9) in 12 instead of δC 128.9 (C-10) and 116.3 (C-9) in kuwanon A, along with the difference of their molecular weight, demonstrated the presence of a hydroxy group at C-10 in 12. This was further verified by the long-range correlations from H-9 to C-11, C-1′ and C-4′ and from H-10 to C-11 and C-3′ in the HMBC spectrum (Figure 2) [46]. The HMBC correlations of H-1′′/C-2, C-4 and H-2′′/C-3, C-4′′, C-5′′ suggested the isopentyl group was attached to C-3 position. According to the above data, compound 12 was established as depicted in Figure 1 and named as kuwanon Z.
2.2. Biological Activities of Compounds against HGC27 Cancer Cells
The effect of compounds (1–35) on the cell viability of HCG27 cells was evaluated by CCK-8 assay. As shown in Table 3, four compounds 5, 8, 10 and 30 had a better significant inhibitory effect on the viability of HCG27 cells compared with the model group (control). In contrast, other compounds had no significant inhibitory effects on the viability of HCG27 cells, therefore, compounds 5, 8, 10 and 30 were screened to evaluate the semi-inhibition concentration (IC50) values (Table 4). Among the four compounds, compound 10 showed the best cytotoxicity against HCG27 cells, with an IC50 value of 6.08±0.34 μM, and compounds 5, 8 and 30 showed weaker cytotoxic activities, with IC50 values of 10.24 ± 0.89 μM, 28.94 ± 0.72 μM and 33.76 ± 2.64 μM, respectively. Compound 10 effectively inhibited the clone formation of HGC27 cells (Figure 3a). When cells were treated with 20 μM compound 10, the number of cell clones formed in the administered group was significantly reduced and cell growth was significantly inhibited compared to the control group (Figure 3b). This suggests that compound 10 may cause apoptosis. We used Annexin V-FITC (Annexin V-Fluorescein Isothiocyanate) double staining assay to detect apoptotic cells. As shown in Figure 3c, the apoptosis rate of HGC27 cells treated with compound 10 significantly increased compared to the control group. Quantification of apoptotic cells by flow cytometry revealed that the percentage of HGC27 apoptotic cells increased in a dose-dependent manner (Figure 3d).

Table 2.
1H NMR and 13C NMR data for the compounds 11 and 12 (δ in ppm, J in Hz).
| 11a | 12b | |||
| No. | δH (J in Hz) | δC | δH (J in Hz) | δC |
| 2 | 158.6 | 163.1 | ||
| 3 | 115.7 | 122.1 | ||
| 4 | 179.7 | 183.1 | ||
| 4a | 102.0 | 105.4 | ||
| 5 | 157.3 | 163.2 | ||
| 6 | 6.12 brs | 98.9 | 5.91a s | 99.7a |
| 7 | 161.3 | 165.8 | ||
| 8 | 6.33 brs | 93.6 | 6.00a s | 94.0a |
| 8a | 157.3 | 157.1 | ||
| 9α | 2.74 dd (16.2, 6.0) | 23.0 | 2.61 dd (16.8, 5.4) | 27.5 |
| 9β | 3.00 dd (16.2, 3.6) | 2.95 dd (16.8, 7.4) | ||
| 10 | 3.99 dd (6.0, 3.6) | 91.5 | 3.80 dd (16.2, 6.0) | 70.2 |
| 11 | 70.9 | 78.1 | ||
| 12 | 1.18 s | 27.3 | 1.36 s | 25.8 |
| 13 | 1.29 s | 24.1 | 1.28 s | 20.8 |
| 1′ | 114.0 | 113.8 | ||
| 2′ | 159.4 | 154.7 | ||
| 3′ | 119.9 | 110.3 | ||
| 4′ | 156.4 | 157.0 | ||
| 5′ | 6.74 d (9.0) | 110.7 | 6.42 d (8.4) | 109.9 |
| 6′ | 7.67 d (9.0) | 126.8 | 6.98 d (8.4) | 129.5 |
| 1′′ | 3.36*d (6.0) | 22.5 | 3.08 dd (7.2, 5.4) | 24.8 |
| 2′′ | 5.13 t (7.2) | 123.2 | 5.07 t (7.2) | 122.6 |
| 3′ | 130.3 | 132.8 | ||
| 4′′ | 1.61 s | 25.5 | 1.34 s | 17.6 |
| 5′′ | 1.71.s | 17.9 | 1.58 s | 25.8 |
| 5-OH | 13.02 s |
a recorded at 600 (150) MHz in DMSO. b recorded at 600 (150) MHz in CD3OD. (*) refers to overlapped signals.
Cell migration is an essential process in tumor metastasis. The effect of compound 10 on migration was examined by the transwell method. The effect of compound 10 on the migration of HGC27 tumor cells was investigated in the premise of HGC27 cell death. As shown in (Figure 3e), in vitro migration studies showed that compound 10 significantly inhibited the migratory ability of HGC27 cells in a dose-dependent manner. The number of migrating HGC27 cells was reduced from 293 to 66 compared to the control group (Figure 3f). Caspase-3 is an important protein in the regulation of cell apoptosis. Western blot analysis showed after treating HGC27 cells with 10 μM and 20 μM of compound 10 for 48 h, the expression of apoptosis-related protein Caspase-3 was significantly increased compared with the control (Figure 4). Thus compound 10 had a substantial cytotoxic effect on HGC27 cells (Figure 4). We also analyzed Bax and Bcl-2 in the Bcl-2 family protein related to mitochondrial membrane permeability. As an inhibitor of apoptosis, Bcl-2 protein can stabilize mitochondrial membrane potential, while Bax protein can bind to Bcl-2 to form a dimer, thus playing an antagonistic role in Bcl-2 and promoting apoptosis. In addition, the dimer formed by Bax self-binding can also cause changes in cell membrane permeability, thereby reducing mitochondrial membrane potential and eventually leading to apoptosis (Figure 4). After treating HGC27 cells with 10 μM and 20 μM compound 10 for 48 h the expression of Bax in cells increased significantly, while the expression of Bcl-2 in cells decreased (Figure 4). Therefore, compound 10 may induce apoptosis through the mitochondrial apoptosis pathway.
3. Experimental
3.1. General Experimental Procedures
Optical rotations were measured on a Perkin-Elmer 341 polarimeter (Perkin-Elmer Corporation, Wellesley, MA, USA). IR and UV spectra were recorded using a PerkinElmer 1725X-FT spectrometer with KBr disks and a PerkinElmer Lambda 35 spectrometer, respectively. 1D and 2D NMR spectra were recorded on Bruker Avance 400 and 600 spectrometers. High resolution electrospray ionization mass spectrometry (HR-ESI-MS) was performed on a micrOTOF-QII mass spectrometer. TLC was carried out on precoated silica gel GF254 (10 – 40 μm, Qingdao Marine Chemical Group Co., Ltd. Qingdao, China). Analytical HPLC was carried out on Prominence LC-20AT with a model SPD-M20A detector and Ultimate ®C18 column (250 mm × 4.60 mm, 5 μm). Preparative HPLC was carried out on P3000 with a UV3000 detector (Chengdu LaiPu Science and Technology Co., Ltd, China) and Ultimate ®C18 column (250 mm × 21.2 mm, 5 μm; 250 mm × 50 mm, 10 μm, respectively). Silica gel (100-200, 200-300 mesh, Qingdao Marine Chemical Group Co., Ltd. Qingdao, China). All chemical solvents were obtained from Chron Chemicals Reagent of Chengdu.
3.2. Plant Material
The root bark of M. alba (Sang-Bai-Pi) was purchased in September 2019 from Lotus Pond Chinese Herbal Medicine market, Sichuan, China, and identified by Professor Weikai Bao (Chengdu Institute of Biology, Chinese Academy of Sciences). A voucher specimen (CIB-A-431) has been deposited at the Laboratory of Phytochemistry, Chengdu Institute of Biology, Chinese Academy of Sciences.
3.3. Extraction and Isolation
The dried root bark of M. alba (30.0 kg) were crushed into powder, and extracted three times with 75% ethanol (100 L × 3, each 3 days). The resulting solution was filtered, combined and concentrated under reduced pressure to give 3.0 Kg of brown residue. The 75% ethanol extract (3.0Kg) was partitioned between H2O and ethyl acetate. Tthyl acetate part (2.2 Kg) was obtainedand separated by silica gel column (6.0 Kg, 150 × 40 cm) eluted with petroleum and ethyl acetate (10: 1 to 1: 1) to yield four fractions (Fr.1-4).
Part of Fr.1 (88.0 g) was subjected to preparative reversed-phase HPLC (MeOH - H2O, 88:12) to afford seven subfractions (Fr.1.1-Fr.1.7). Compound 13 (6.0 g) was obtained from Fr.1.2 (8.3 g) by crystallization. Fr.1.3 (2.0 g) was fractionated with preparative reversed-phase HPLC (MeOH-H2O, 72:28) to give compounds 1 (22.0 mg), 26 (120.0 mg), 11 (8.0 mg), 12 (6.6 mg) and 16 (16.0 mg). Compound 15 (8.0 g) was isolated from Fr.1.4 (12.2 g) by crystallization. Compound 2 (310.0 mg) was obtained from Fr.1.5 (1.6 g) by preparative reversed-phase HPLC (CH3CN-H2O, 64:36). 14 (22.4 g) was isolated from Fr.1.6 (28.9 g) by crystallization. Compounds 17 (18.0 mg), 3 (130.0 mg), 18 (30.0 mg), 19 (46.0 mg), 4 (22.0 mg), 20 (36.0 mg) were separated from Fr.1.7 (503.0 mg) by preparative reversed-phase HPLC (CH3CN-H2O, 70:30).
Part of Fr.2 (33.0 g) was subjected to preparative reversed-phase HPLC (MeOH-H2O, 86:14) to yield six subfractions (Fr.2.1-Fr.2.6). Fr.2.2 (3.8 g) was further purified by preparative reversed-phase HPLC (CH3CN-H2O, 70:30) to get 28 (109.0 mg). 21 (28.0 mg) was isolated from Fr.2.4 (1.3 g) by preparative reversed-phase HPLC (MeOH-H2O, 89:11). Fr.2.5 (300.0 mg) and Fr.2.6 (653.0 mg) was further purified by preparative reversed-phase HPLC (MeOH-H2O, 90:10) and (MeOH-H2O, 84:16) to yield 27 (17.0 mg) and 22 (100.0 mg), respectively.
Part of Fr.3 (12.6 g) was subjected to preparative reversed-phase HPLC (MeOH-H2O, 86:14) to get six subfractions (Fr.3.1- Fr.3.7). Compounds 31 (15.7 mg), 30 (8.0 mg), and 7 (33.0 mg) were separated from Fr.3.1 (817.0 mg) through preparative reversed-phase HPLC (MeOH-H2O, 73:17). 23 (86.0 mg) and 5 (42.0 mg) were purified from Fr.3.2 (310.0 mg) by preparative reversed-phase HPLC (CH3CN-H2O, 63:27). 24 (28.0 mg) was obtained from Fr.3.3 (120.0 mg) by preparative reversed-phase HPLC (CH3CN-H2O, 60:40). Fr.3.4 (800.0 mg) was further purified by preparative reversed-phase HPLC (CH3CN-H2O, 64:36) to afford 6 (98.0 mg). Fr.3.5 (900.0 mg) was purified by preparative reversed-phase HPLC (MeOH-H2O, 78:22) to give 29 (37.0 mg).
Part of Fr.4 (36.0 g) was subjected to preparative reversed-phase HPLC (CH3CN-H2O, 64:36) to yield six subfractions (Fr.4.1-Fr.4.6). Fr.4.2 (13.6 g) was separated by preparative reversed-phase HPLC (CH3CN-H2O, 63:37) to afford 33 (303.0 mg), 34 (23.0 mg), and 35 (6.0 mg). Fr. 4.3 (800.0 mg) was purified by preparative reversed-phase HPLC (CH3CN-H2O, 45:55) to give 9 (168.0 mg). Compound 8 (40.0 mg) was further purified from Fr.4.5 (500.0 mg) by preparative reversed-phase HPLC (CH3CN-H2O, 52:48). Fr.4.6 (200.0 mg) was separated by preparative reversed-phase HPLC (CH3CN-H2O, 62:38) to yield 32 (160.3 mg). Compounds 10 (128.0 mg) and 25 (36.0 mg) were separated from Fr.4.7 (1.6 g) through preparative reversed-phase (MeOH-H2O, 74:26).
3.4. Spectroscopic Data
Compound 1, Brown amorphous powder, [α]D20 + 3.0 (c 0.22, MeOH); UV (MeOH) λmax (log ε) 216 (4.21), 316 (4.19) nm; IR (KBr) νmax 3423, 1615, 1490, 1362, 1266, 1155, 1084 cm−1; HR-ESI-MS at m/z 431.1831 [M + Na]+ (calcd. for C25H28O5Na, 431.1829); 1H and 13C NMR data, see Table 1.
Compound 11, Yellow powder, [α]D20 + 3.7 (c 0.22, MeOH); UV (MeOH) λmax (log ε) 216 (3.21), 327 (4.36) nm; IR (KBr) νmax 3415, 1656, 1621, 1554, 1448 cm-1; HRESIMS m/z 439.1751 [M + H]+ (calcd. for C25H27O7, 439.1751); 1H and 13C NMR data, see Table 2.
Compound 12, Yellow amorphous powder, [α]D20 + 10.6 (c 0.22, MeOH); UV (MeOH), λmax (log ε) 215 (2.61), 336 (3.18) nm; IR (KBr) νmax 3372, 1645, 1616, 1440, 1299, 1167 cm−1; HRESIMS m/z 439.1751 [M + H]+ (calcd. for C25H27O7, 439.1749); 1H and 13C NMR data, see Table 2.
3.5. Cell Culture
HGC27 cells were bought from American Type Culture Collection (ATCC). All cells grew adherently. HGC27 cells were cultured in RPMI 1640 media, and MRC-5 cells were cultured in a minimal essential medium (Gibco). All media contained 10% endotoxin-free, heat-inactivated FBS (Gibco) and were maintained at 37°C in a humidified atmosphere of 5% CO2. Cell passage was performed in 1:3 when the confluence reached 70%.
3.6. Cytotoxicity Assay and CCK-8 Assay
HGC27 cell lines (4 × 10³/well) were seeded in 96-well plates with 200 µL per well and incubated at 37 °C overnight. 35 compounds with more than 96% purity were prepared in our own laboratory. 35 compounds were first dissolved in DMSO (Sigma). Then they were diluted with the corresponding medium into 1 mg/mL concentration and stored at -20 °C. The final concentration of DMSO for all treatments was less than 0.1%. Cells were treated with the isolated compound (1-35) 10µM for 24h. Then, 10μL of CCK-8 reagent (biofrox Z6789D144) was added into each well, and incubated for 4 h at 37 ◦C. Finally, the optical density (OD) was then measured at 450 nm. Cell viability was calculated as follows: cell viability = (OD experiment – OD blank) / (OD control – OD blank) × 100%.
Cells were treated with varying concentrations of compounds 5, 8, 10 and 30 (1, 2.5, 5, 10, 20, 30 40 and 60µM) for 24h. Then, 10μL of CCK-8 reagent (biofrox Z6789D144) was added into cells, and incubated for 4 h at 37 ◦C. Finally, the absorbance was measured at 490 nm, and the IC50 values were calculated.
3.7. Colony Formation Assay
Colony formation assay was performed as described previously. Briefly, 500 cells per well were seeded in 12-well plates and allowed to adhere to the plate for 24 h, and then ABN-B was added to the wells at different concentrations. Following 48 h incubation, the medium was replaced with fresh medium with or without ABN-B, and the cells were further grown for an additional five days. After the cells were washed with PBS (pH 7.4) twice, the cells were stained with crystal violet solution (0.1%) diluted in ethanol 40% for 5 min. Then, the stain solution was removed using tap water, and the cells were air-dried. Finally, the number of colonies was counted.
3.8. Cell Apoptosis Assay
HGC27 cells were cultured in a 6-well plate at a density of 700,000 cells / well and incubated in a cell incubator for 24 h. When HGC27 cells were in the logarithmic growth phase, HGC27 cells were treated with 10 μM or 20 μM compound 10 for 48 h. Then cells were collected by trypsin digestion without EDTA and washed twice with cold PBS. 5 μL Annexin V / Alexa Fluor 488 solution was added to the cell suspension and incubated in the dark at room temperature for 5 min. Then 10 μL PI and 400 μL PBS solution were added. The stained cell suspension was transferred to a flow tube, and the proportion of apoptotic cells was detected using BD Facscanto II (BD Biosciences, USA), and the experimental results were statistically analyzed using Flowjo.
3.9. Transwell Migration Assay
Before the experiment, the cells were starved by culturing in a serum-free medium for 4 hours. Then, cells were collected, and 30, 000 cells were cells were treated with 10μM and 20μM Compound 10 inoculated into 500 μL serum-free medium in the upper chamber of Transwell (Corning), and 500μl culture medium with 10% FBS was added into the lower chamber. After 24 hours of incubation, the culture medium was discarded. Fixed with 4% paraformaldehyde (Beyotime, China) for 15 minutes, then stain with 0.4% crystal violet (Beyotime, China) for 15 minutes. The cells were observed and photographed under a light microscope.
3.10. Western Blot Analysis
Briefly, HGC27 cells in logarithmic growth phase were digested with trypsin, and after resuspended, adjusted to a density of 4 × 10⁵/mL, and inoculated into six-well plate with 2 mL in each well. When the cells grew to about 50%, the original medium was aspirated, and the medium containing 0.1% DMSO, 10 µM, and 20 µM compound 10 was added, respectively. A total of 4 groups: blank control group, 0.1%DMSO group, 10 µM group, and 20 µM group. Cell protein was extracted after 24 h. Protein concentration was measured using a BCA protein assay kit (Biosharp, Guanzhou, China). Next, equal amounts of proteins were separated by sodium dodecyl sulfate-polyacrylamide gel electrophoresis (SDS-PAGE) and then transferred to polyvinylidene fluoride (PVDF) membranes (Millipore, USA). After blocked with 5% non-fat milk for 1 h at room temperature (RT), the membranes were incubated with the specific primary antibodies (Signalway Antibody, Nanjing, China) overnight at 4◦C. After washing 3 times with Tris Buffered saline Tween 20 (TBST), the membranes were then incubated with horseradish peroxidase (HRP)-conjugated secondary antibodies (ProteinTech, Wuhan, China) for 1h at RT. The immune-blotting signals were detected using Beyo ECL Plus electrochemiluminescence reagent (Beyotime, Shanghai, China).
4. Conclusions
Phytochemical investigation of the 75% ethanol extract of the root bark of M. alba led to the isolation and identification of three new compounds (1, 11 and 12) and 32 known ones (2–10, 13–35). All compounds were tested for their cytotoxic activities against gastric cancer HGC27 cells. As a result, compounds 5, 8 and 30 exhibited certain degree cytotoxic activities with the IC50 values ranging from 10.24±0.89 μM, 28.94±0.72 μM and 33.76 ±2.64 μM, respectively. Compound 10 showed the significant cytotoxic activity with an IC50 value of 6.08 ± 0.34 μM. Then compound 10 was subjected to further experiments to explore its anti-tumor mechanism. It was found that compound 10 has inhibitory effects on proliferation and migration of human cancer HGC27 cells. In addition, compound 10 induced up-regulation of Bax protein expression and down-regulation of Caspase-3 and Bcl-2 protein expression, which may be related to mitochondrial dysfunction and decreased mitochondrial membrane potential. Therefore, we hypothesized that compound 10 could induce apoptosis of HGC27 cells through the mitochondrial apoptotic pathway. Here, This study was the first time to preliminarily explore the mechanism of compound 10 in inhibiting gastric cancer cell HGC27 in vitro. In conclusion, the present study provides a reference for the phytochemical and biological activities of Morus alba L.
References
- State Pharmacopoeia Committee. Chinese Pharmacopoeia; China Medical Pharmaceutical Science and Technology Publishing House: Beijing, China. 2010, p182.
- Asano, N.; Yamashita, T.; Yasuda, K.; Ikeda, K.; Kizu, H.; Kameda, Y.; Kato, A.; Nash, R.J.; Lee, H.S.; Ryu, K.S. Polyhydroxylated alkaloids isolated from mulberry trees (Morus alba L.) and silkworms (Bombyx mori L.). J. Agric. Food. Chem. 2001, 49, 4208–4213. [Google Scholar] [CrossRef] [PubMed]
- Čulenová, M.; Sychrová, A.; Hassan, S.T.S.; Berchová-Bímová, K.; P. Svobodová, P.; Helclová, A.; Michnová, H.; Hošek, J. Multiple In vitro biological effects of phenolic compounds from Morus alba root bark. J. Ethnopharmacol. 2020, 248, 112296. [Google Scholar] [CrossRef] [PubMed]
- Zhang, Q.J.; Li, D.Z.; Chen, R.Y.; Yu, D.Q. A new benzo-furanolignan and a new flavonol derivative from the stem of Morus australis. Chin. Chem. Lett. 2008, 19, 196–198. [Google Scholar] [CrossRef]
- Takahashi, M.; Takara, K.; Toyozato, T.; Wada, K. A novel bioactive chalcone of Morus australis inhibits tyrosinase activity and melanin biosynthesis in B16 melanoma cells. J. Oleo Sci. 2012, 61, 585–592. [Google Scholar] [CrossRef]
- Ko, H.H.; Wang, J.J.; Lin, H.C.; Wang, J.P.; Lin, C.N. Chemistry and biological activities of constituents from Morus australis. Biochim. Biophys. Acta. Gen. Subj. 1999, 1428, 293–299. [Google Scholar] [CrossRef]
- Zheng, Z.F.; Zhang, Q.J.; Chen, R.Y.; Yu, D.Q. Four new flavonoids from Morus australis. J. Asian. Nat. Prod. Res. 2012, 14 3, 263–269. [Google Scholar] [CrossRef]
- Zhang, Q.J.; Tang, Y.B.; Chen, R.Y.; Yu, D.Q. Three new cytotoxic Diels-Alder-type adducts from Morus australis. Chem. Biodivers. 2007, 4, 1533–1540. [Google Scholar] [CrossRef]
- Zhang, Q.J.; Zheng, Z.F.; Chen, R.Y.; Yu, D.Q. Two new dimeric stilbenes from the stem bark of Morus australis. J. Asian. Nat. Prod. Res, 2009, 11, 138–141. [Google Scholar] [CrossRef] [PubMed]
- Kikuchi, T.; Nihei, M.; Nagai, H.; Fukushi, H.; Tabata, K.; Suzuki, T.; Akihisa, T. Albanol A from the root bark of Morus alba L. induces apoptotic cell death in HL60 human leukemia cell line. Chem. Pharm. Bull. 2010, 58, 568–572. [Google Scholar] [CrossRef]
- Cui, L.; Lee, H S.; Oh, W K.; Ahn J S. Inhibition of sangginon G isolated from Morus alba on the metastasis of cancer cells. Chin. Herb. Med. (2011), 3, 23–26.
- Agabeyli, R A.; Antimutagenic activities extracts from leaves of the Morus alba, Morus nigra and their mixtures. Intl. J. Biol. 2012, 4, 166–172.
- Devi, B.; Sharma, N.; Kumar, D.; Jeet, K. Morus alba L inn: a phytopharmacological review. Int. J. Pharm. Pharma. Sci. 2013, 5, 14–18. [Google Scholar]
- Hong, S.S.; Hong, S.; Lee, H.J.; Mar, W.; Lee, D.A. A new prenylated flavanone from the root bark of Morus. Bull. Korean Chem. Soc. 2013, 34, 2528–2530. [Google Scholar] [CrossRef]
- Zhang, X.R.; Wang, S.Y.; Sun, W.; Wei, C. Isoliquiritigenin inhibits proliferation and metastasis of MKN28 gastric cancer cells by suppressing the PI3K/AKT/mTOR signaling pathway. Mol. Med. Rep. 2018, 18, 3429–3436. [Google Scholar] [CrossRef] [PubMed]
- Li, Y.W.; Xu, Y.Q.; Lei, B.; Wang, W.X.; Ge, X.; Li, J.R. Rhein induces apoptosis of human gastric cancer SGC-7901 cells via an intrinsic mitochondrial pathway. Braz. J. Med. Biol. Res. 2012, 45, 1052–1059. [Google Scholar] [CrossRef] [PubMed]
- Nomura, T.; Fukai, T.; Shimada, T.; Chen, I.S. Mulberrofuran D, a new isoprenoid 2-arylbenzofuran from the root barks of the mulberry tree (Morus australis Poir). Heterocycies 1982, 19, 1855–1860. [Google Scholar] [CrossRef]
- Chang, Y.S.; Jin, H.G.; Lee, H.; Lee, D.S.; Woo, E.R. Phytochemical constituents of the root bark from Morus alba and their Il-6 Inhibitory activity. Nat. Prod. Sci. 2019, 25, 268–274. [Google Scholar] [CrossRef]
- Wu, D.L.; Zhang, X.Q.; Huang, X.J.; He, X.M.; Wang, G.C.; Ye, W.C. Chenucal constituents from root barks of Morus atropurpurea. J. Chin. Med. Mater. 2010, 35, 1978–1982. [Google Scholar]
- Jeong, S.H.; Ryu, Y. B.; Curtis-Long, M. J.; Ryu, H. W.; Baek, Y. S.; Kang, J. E.; Lee, W.S.; Park, K.H. Tyrosinase Inhibitory polyphenols from roots of Morus Ihou. J. Agric. Food. Chem. 2009, 57, 1195–1203. [Google Scholar] [CrossRef]
- Shi, Y. Q.; Fukai, T.; Sakagami, H.; Chang, W.J.; Yang, F.Q.; Wang, F.P.; Nomura, T. Cytotoxic flavonoids with isoprenoid groups from Morus mongolica. J. Nat. Prod. 2001, 64, 181–188. [Google Scholar] [CrossRef] [PubMed]
- X. He, X. Chao, L. Yang, C. Zhang, R. Pi, H. Zeng, G. Li, Y. Xu, Y. Lin, The research on chemical ingredients of the heartwood of root of Morus atpropurpurea, Nat. Prod. Res. Dev. 2014 26 (2) (2014) 193-196.
- Jung, J.W.; Koo, W.M.; Park, J.H.; Seo, K.H.; Oh, E.J.; Lee, D.Y.; Lee, D.S.; Kim, Y.C.; Lim, D.W.; Han, D.; Baek, N.I. Isoprenylated flavonoids from the root bark of Morus alba and their hepatoprotective and neuroprotective activities. Arch. Pharm. Res. 2015, 38, 2066–2075. [Google Scholar] [CrossRef]
- Cui, X.Q.; Chen, H.; . Chen, R.Y. Study on Diels-Alder type adducts from stem bark of Morus yunanensis. J. Chin. Med. Mater. 2009, 34, 286–290. [Google Scholar]
- Cui, X.Q.; Wang, H.Q.; Liu, C.; Chen, R.Y. Study on anti-oxidant phenolic compounds from stem bark of Morus yunanensis. J. Chin. Med. Mater. 2008, 13, 1569–1572. [Google Scholar]
- He, X.M; Wu, D.L.; Zou, Y.X; Wang, G.C.; Zhang, X.Q.; Liao, S.T.; Sun, J.; Ye, W.C. Chemical constituents from root barks of Morus atropurpurea. J. Chin. Med. Mater. 2010, 35, 1978–1982. [Google Scholar] [CrossRef]
- Zhen, P.; Ni, G.; Guo, W.Q.; Shi, G.R.; Chen, R.Y.; Yu, D.Q. Isolation and identification of pharmaceutical chemical constituents from branches of Morus notabilis. Science of Sericulture 2016, 42, 0307–0312. [Google Scholar]
- Guo, Y.Q.; Tang, G.H.; Lou, L.L.; Li, W.; Zhang, B.; Liu, B.; Yin, S. Prenylated flavonoids as potent phosphodiesterase-4 inhibitors from Morus alba: Isolation, modification, and structure-activity relationship study. Eur. J. Med. Chem. 2018, 144, 758–766. [Google Scholar] [CrossRef] [PubMed]
- Kim, J.Y.; Lee, W.S.; Kim, Y.S.; Curtis-Long, M.J.; Lee, B.W.; Ryu, Y.B.; Park, K.H. Isolation of cholinesterase-Inhibiting flavonoids from Morus lhou. J. Agric. Food. Chem. 2011, 59, 4589–4596. [Google Scholar] [CrossRef] [PubMed]
- Geng, C.A.; Yao, S.Y.; Xue, D.Q.; Zuo, A.; Zhang, X.M; Jiang, Z.Y.; Ma, Y.B.; Chen, J.J. New isoprenylated flavonoid from Morus alba. J. Chin. Med. Mater. 2010, 35, 1560–5. [Google Scholar]
- Tseng, T.H.; Chuang, S.K.; Hu, C.C.; Chang, C.F.; Huang, Y.C.; Lin, C.W.; Lee, Y.J. The synthesis of morusin as a potent antitumor agent. Tetrahedron. 2010, 66, 1335–1340. [Google Scholar] [CrossRef]
- Fujimoto, T.; Hano, Y.; Nomura, T.; Uzawa, J. Components of root bark of cudrania tricuspidata 2. Structures of two new isoprenylated flavones, Cudraflavones A and B. Planta. Med. 1984, 50, 161–163. [Google Scholar] [CrossRef]
- Guo, S.; Liu, L.; Zhang, S.S.; Yang, C.; Yue, W.P.; Zhao, H.A.; Ho, C.T.; Du, J.F.; Zhang, H.; Bai, N.S. Chemical characterization of the main bioactive polyphenols from the roots of Morus australis (mulberry). Food. Funct. 2019, 10, 6915–6926. [Google Scholar] [CrossRef]
- Wang, L.; Yang, Y.; Liu, C.; Chen, R.Y. Three new compounds from Morus nigra L. J. Asian. Nat. Prod. Res. 2010, 12, 431–437. [Google Scholar] [CrossRef]
- Zheng, Z.P.; Tan, H.Y.; Wang, M.F. Tyrosinase inhibition constituents from the roots of Morus australis. Fitoterapia. 2012, 83, 1008–1013. [Google Scholar] [CrossRef]
- Qin, J.; Fan, M.; He, J.; Wu, X.D.; Peng, L.Y.; Su, J.; Cheng, X.; Li, Y.; Kong, L.M.; Li, R.T.; Zhao, Q.S. New cytotoxic and anti-inflammatory compounds isolated from Morus alba L. Nat. Prod. Res. 2015, 29, 1711–1718. [Google Scholar] [CrossRef] [PubMed]
- Patil, A.D.; Freyer, A.J.; Killmer, L.; Offen, P.; Taylor, P.B.; Votta, B.J.; Johnson, R.K. A new dimeric dihydrochalcone and a new prenylated flavone from the bud covers of Artocarpus altilis: potent inhibitors of cathepsin K. J. Nat. Prod. 2002, 65, 624–627. [Google Scholar] [CrossRef] [PubMed]
- Yang, D.S.; Li, Z.L.; Yang, Y.P.; Xiao, W.L.; Li, X.L. New geranylated 2-Arylbenzofuran from Morus alba. Chin. Herb. Med. 2015, 7, 191–194. [Google Scholar] [CrossRef]
- Zuo, G.Y.; Yang, C.X.; Ruan, Z.J.; Han, J.; Wang, G.C. Potent anti-MRSA activity and synergism with aminoglycosides by flavonoid derivatives from the root barks of Morus alba, a traditional chinese medicine. Med. Chem. Res. 2019, 28, 1547–1556. [Google Scholar] [CrossRef]
- Nomura, T.; Fukai, T.; Sato, E.; Fukushima, K. The formation of moracenin-D from kuwanon-G. Heterocycles. 1981, 16, 983–986. [Google Scholar] [CrossRef]
- Hano, Y.; Yamanaka, J.; Momose, Y.; Nomura, T. Sorocenols C-F, four new isoprenylated phenols from the root bark of Sorocea bonplandii Baillon. Heterocycles. 1995, 41, 2811–2821. [Google Scholar] [CrossRef]
- Liu, Y.J.; Wu, J.C.; Li, H.L.; Ma, Q.; Chen, Y.G. Alkaloid and flavonoids from the seeds of Whitfordiodendron filipes. Chem. Nat. Compd. 2016, 52, 188–190. [Google Scholar] [CrossRef]
- Shi, Y. Q.; Fukai, T.; Sakagami, H. Cytotoxic flavonoids with isoprenoid groups from Morus m ongolica. J. Nat. Prod. 2001, 64, 181–188. [Google Scholar] [CrossRef] [PubMed]
- Zhang, Y.L.; Luo, J.G.; Wan, C.X.; Zhou, Z.B.; Kong, L.Y. Geranylated 2-arylbenzofurans from Morus alba var. tatarica and their α-glucosidase and protein tyrosine phosphatase 1B inhibitory activities. Fitoterapia. 2014, 92, 116–126. [Google Scholar] [CrossRef]
- Jin, Y.J.; Lin, C.C.; Lu, T.M.; Li, J.H.; Chen, I.S.; Kuo, Y.H.; Ko, H.H. Chemical constituents derived from Artocarpus xanthocarpus as inhibitors of melanin biosynthesis. Phytochemistry. 2015, 117, 424–435. [Google Scholar] [CrossRef] [PubMed]
- Tuan Hiep, N.Y.; Kwon, J.Y.; Hong, S.G.; Kim, N.Y.; Guo, Y.Q.; Hwang, B.Y.; Mar, W.C.; Lee, D.H. Enantiomeric isoflavones with neuroprotective activities from the fruits of Maclura tricuspidata. Sci. Rep. 2019, 9, 1757. [Google Scholar] [CrossRef] [PubMed]
Figure 1.
Chemical structures of compounds 1–35.
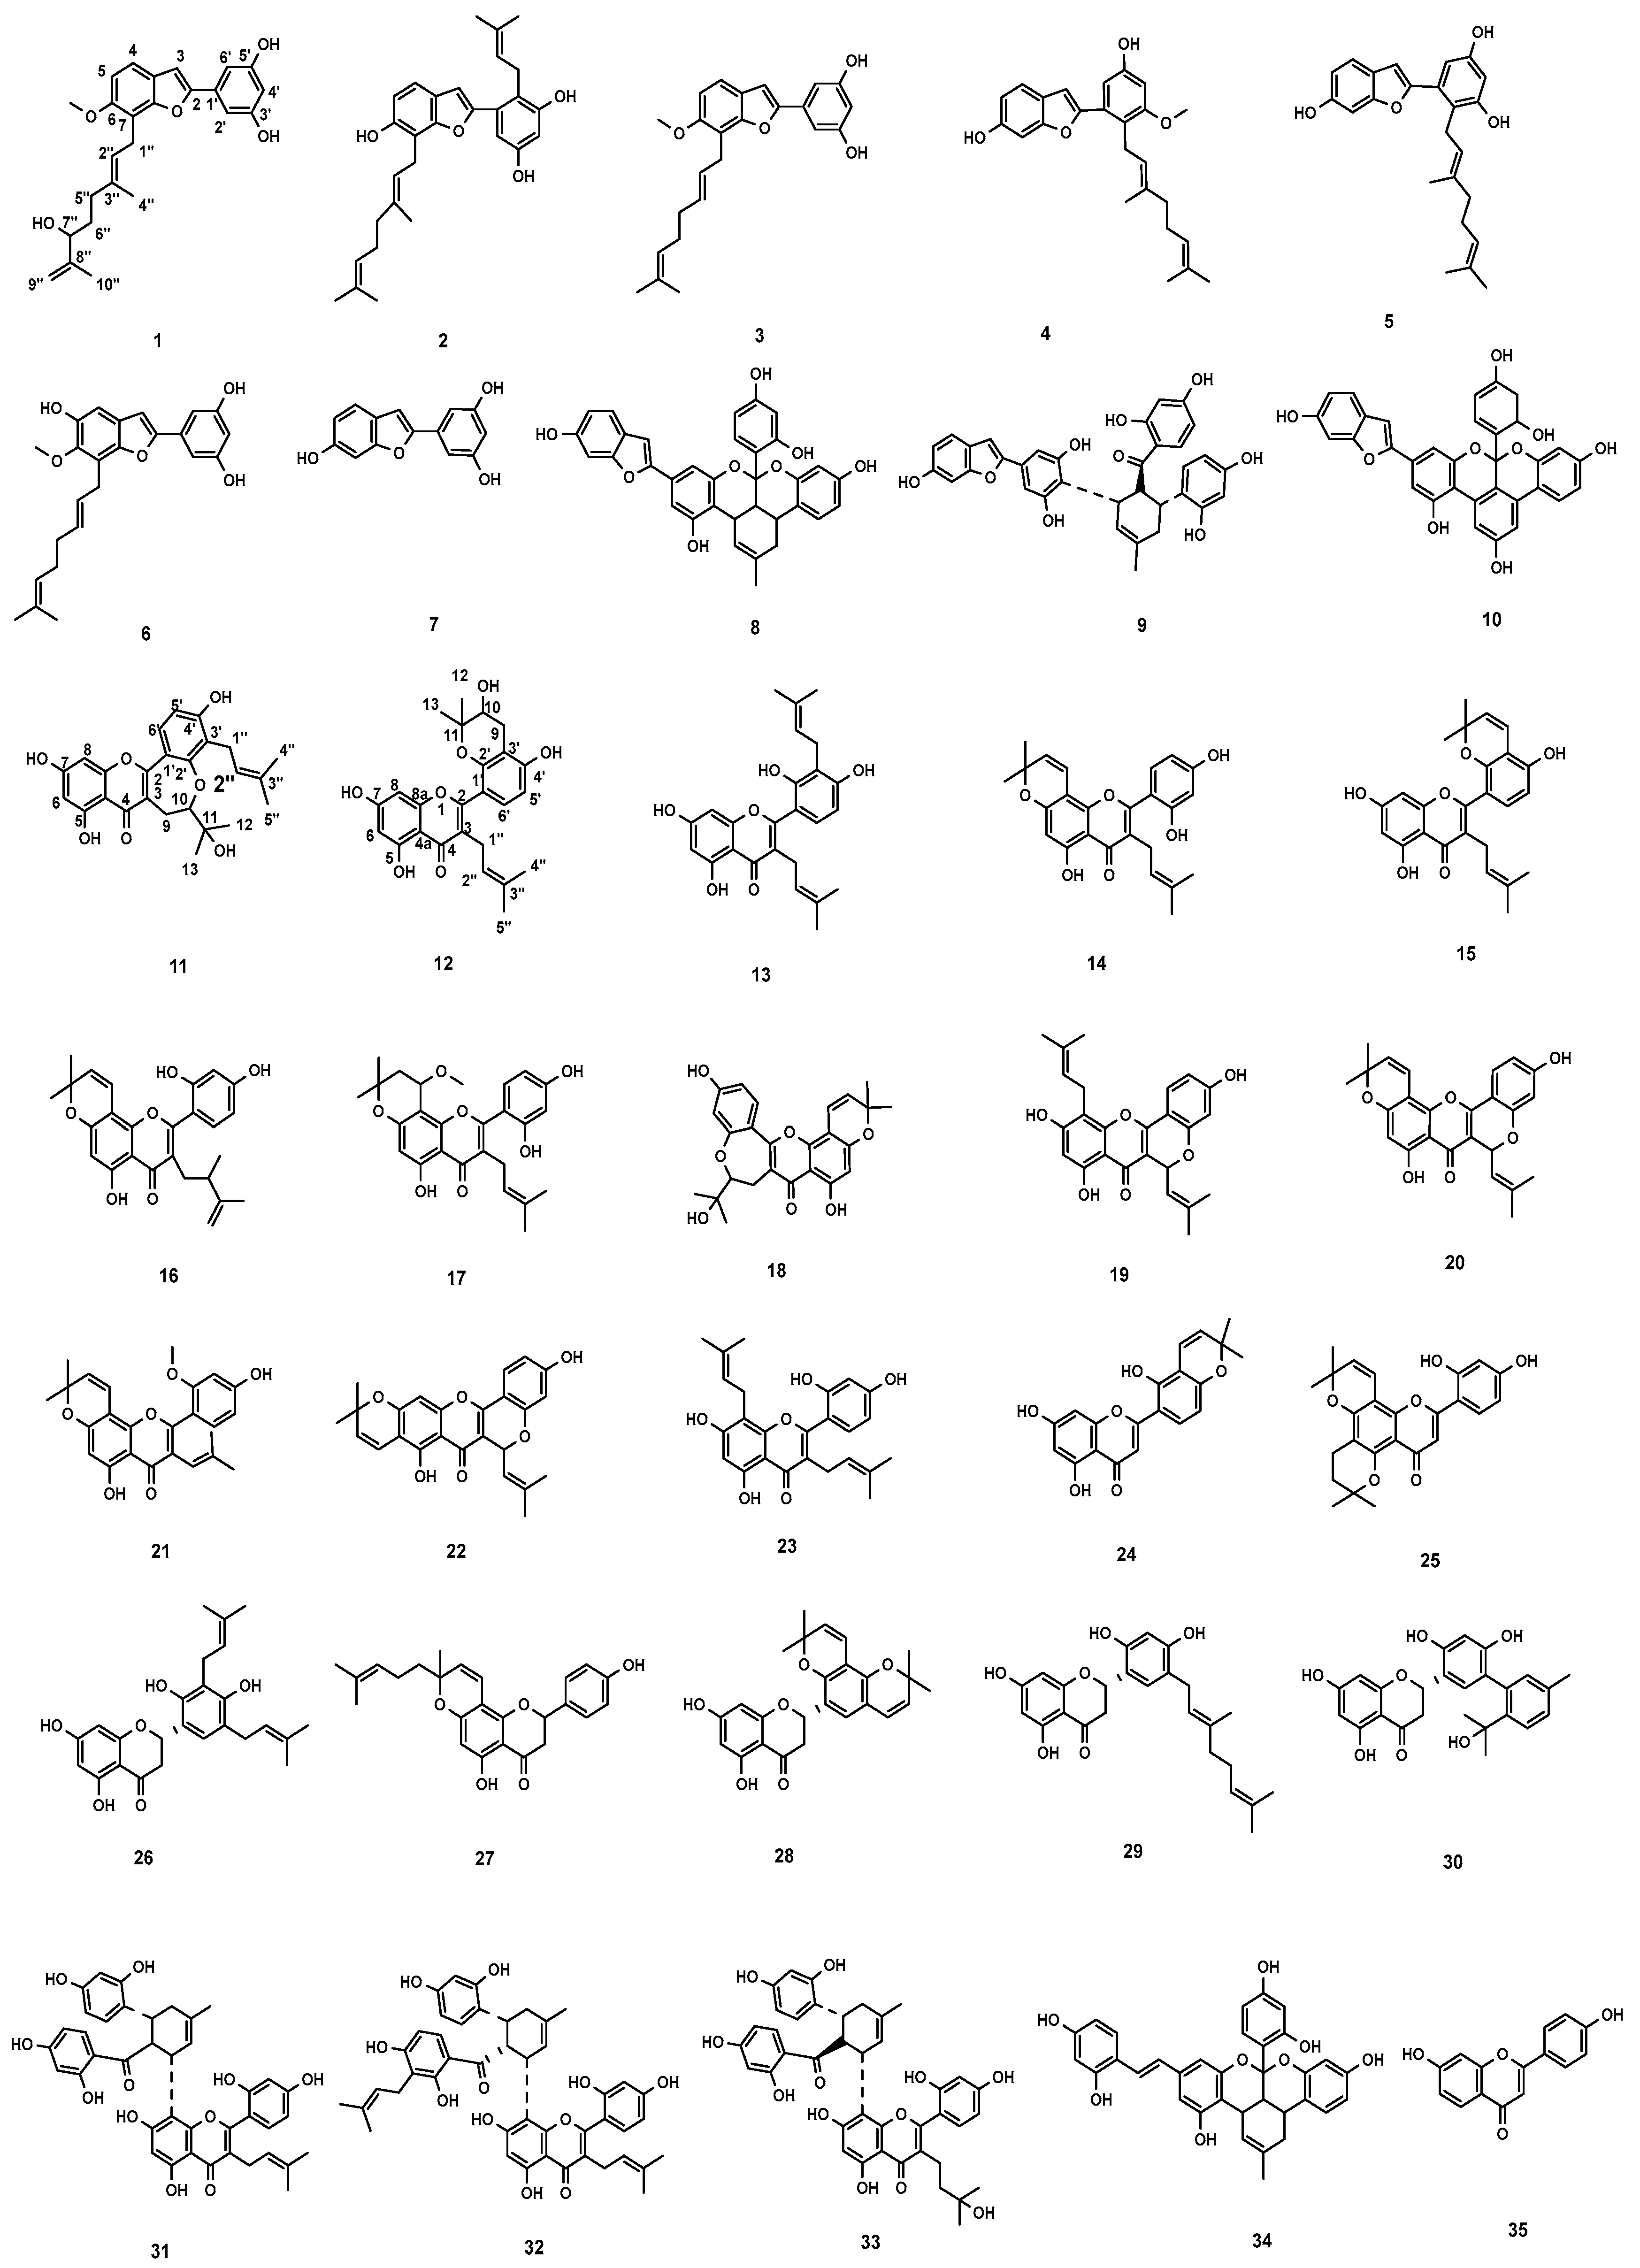
Figure 2.
The 1H-1H COSY and key HMBC correlations of compounds 1, 11 and 12.
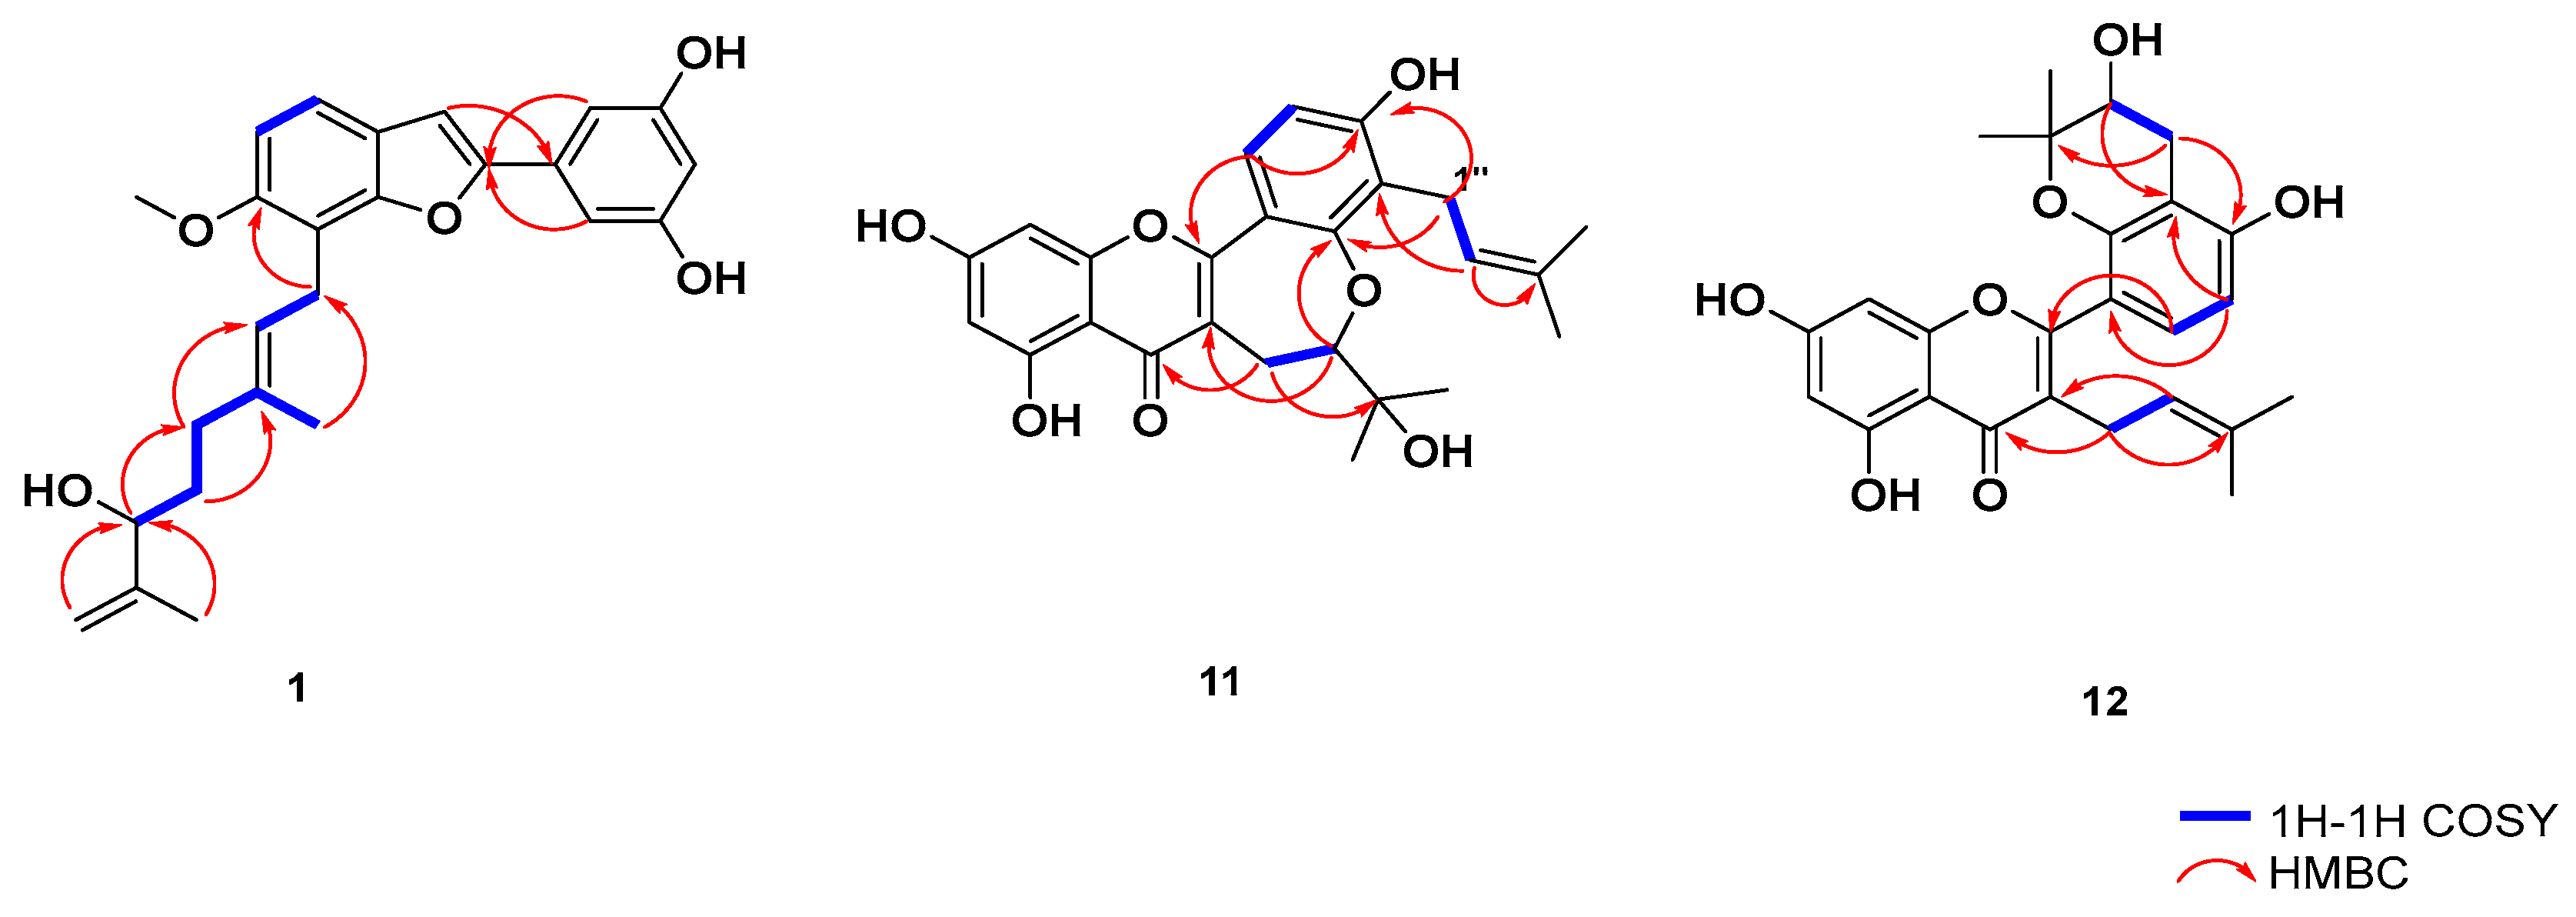
Figure 3.
Cells apoptosis and migration assay. a. Visual observation of cell clonogenicity. b. Statistical analysis of cell clonogenicity. Data are mean±SD (n=3). Differences between treatment groups and control groups are determined,*p< 0.05, **p< 0.01 as compared with control. c. Apoptosis caused by 10 in HGC27 cells. d. Treatment groups cells apoptosis rate were compared with control, *p< 0.05, Data are expressed as mean ±SD (n=3). e. the migration of HGC27 cells, f. Quantitative evaluations of cell migration induced by 10 in the transwell assay, treatment groups were compared with control, *p< 0.05, **p< 0.01.Data are expressed as mean ±SD (n=3). Note:control: blank control group, 10µM: 10µmol/mL group, 20µM: 20µmol/mL group.
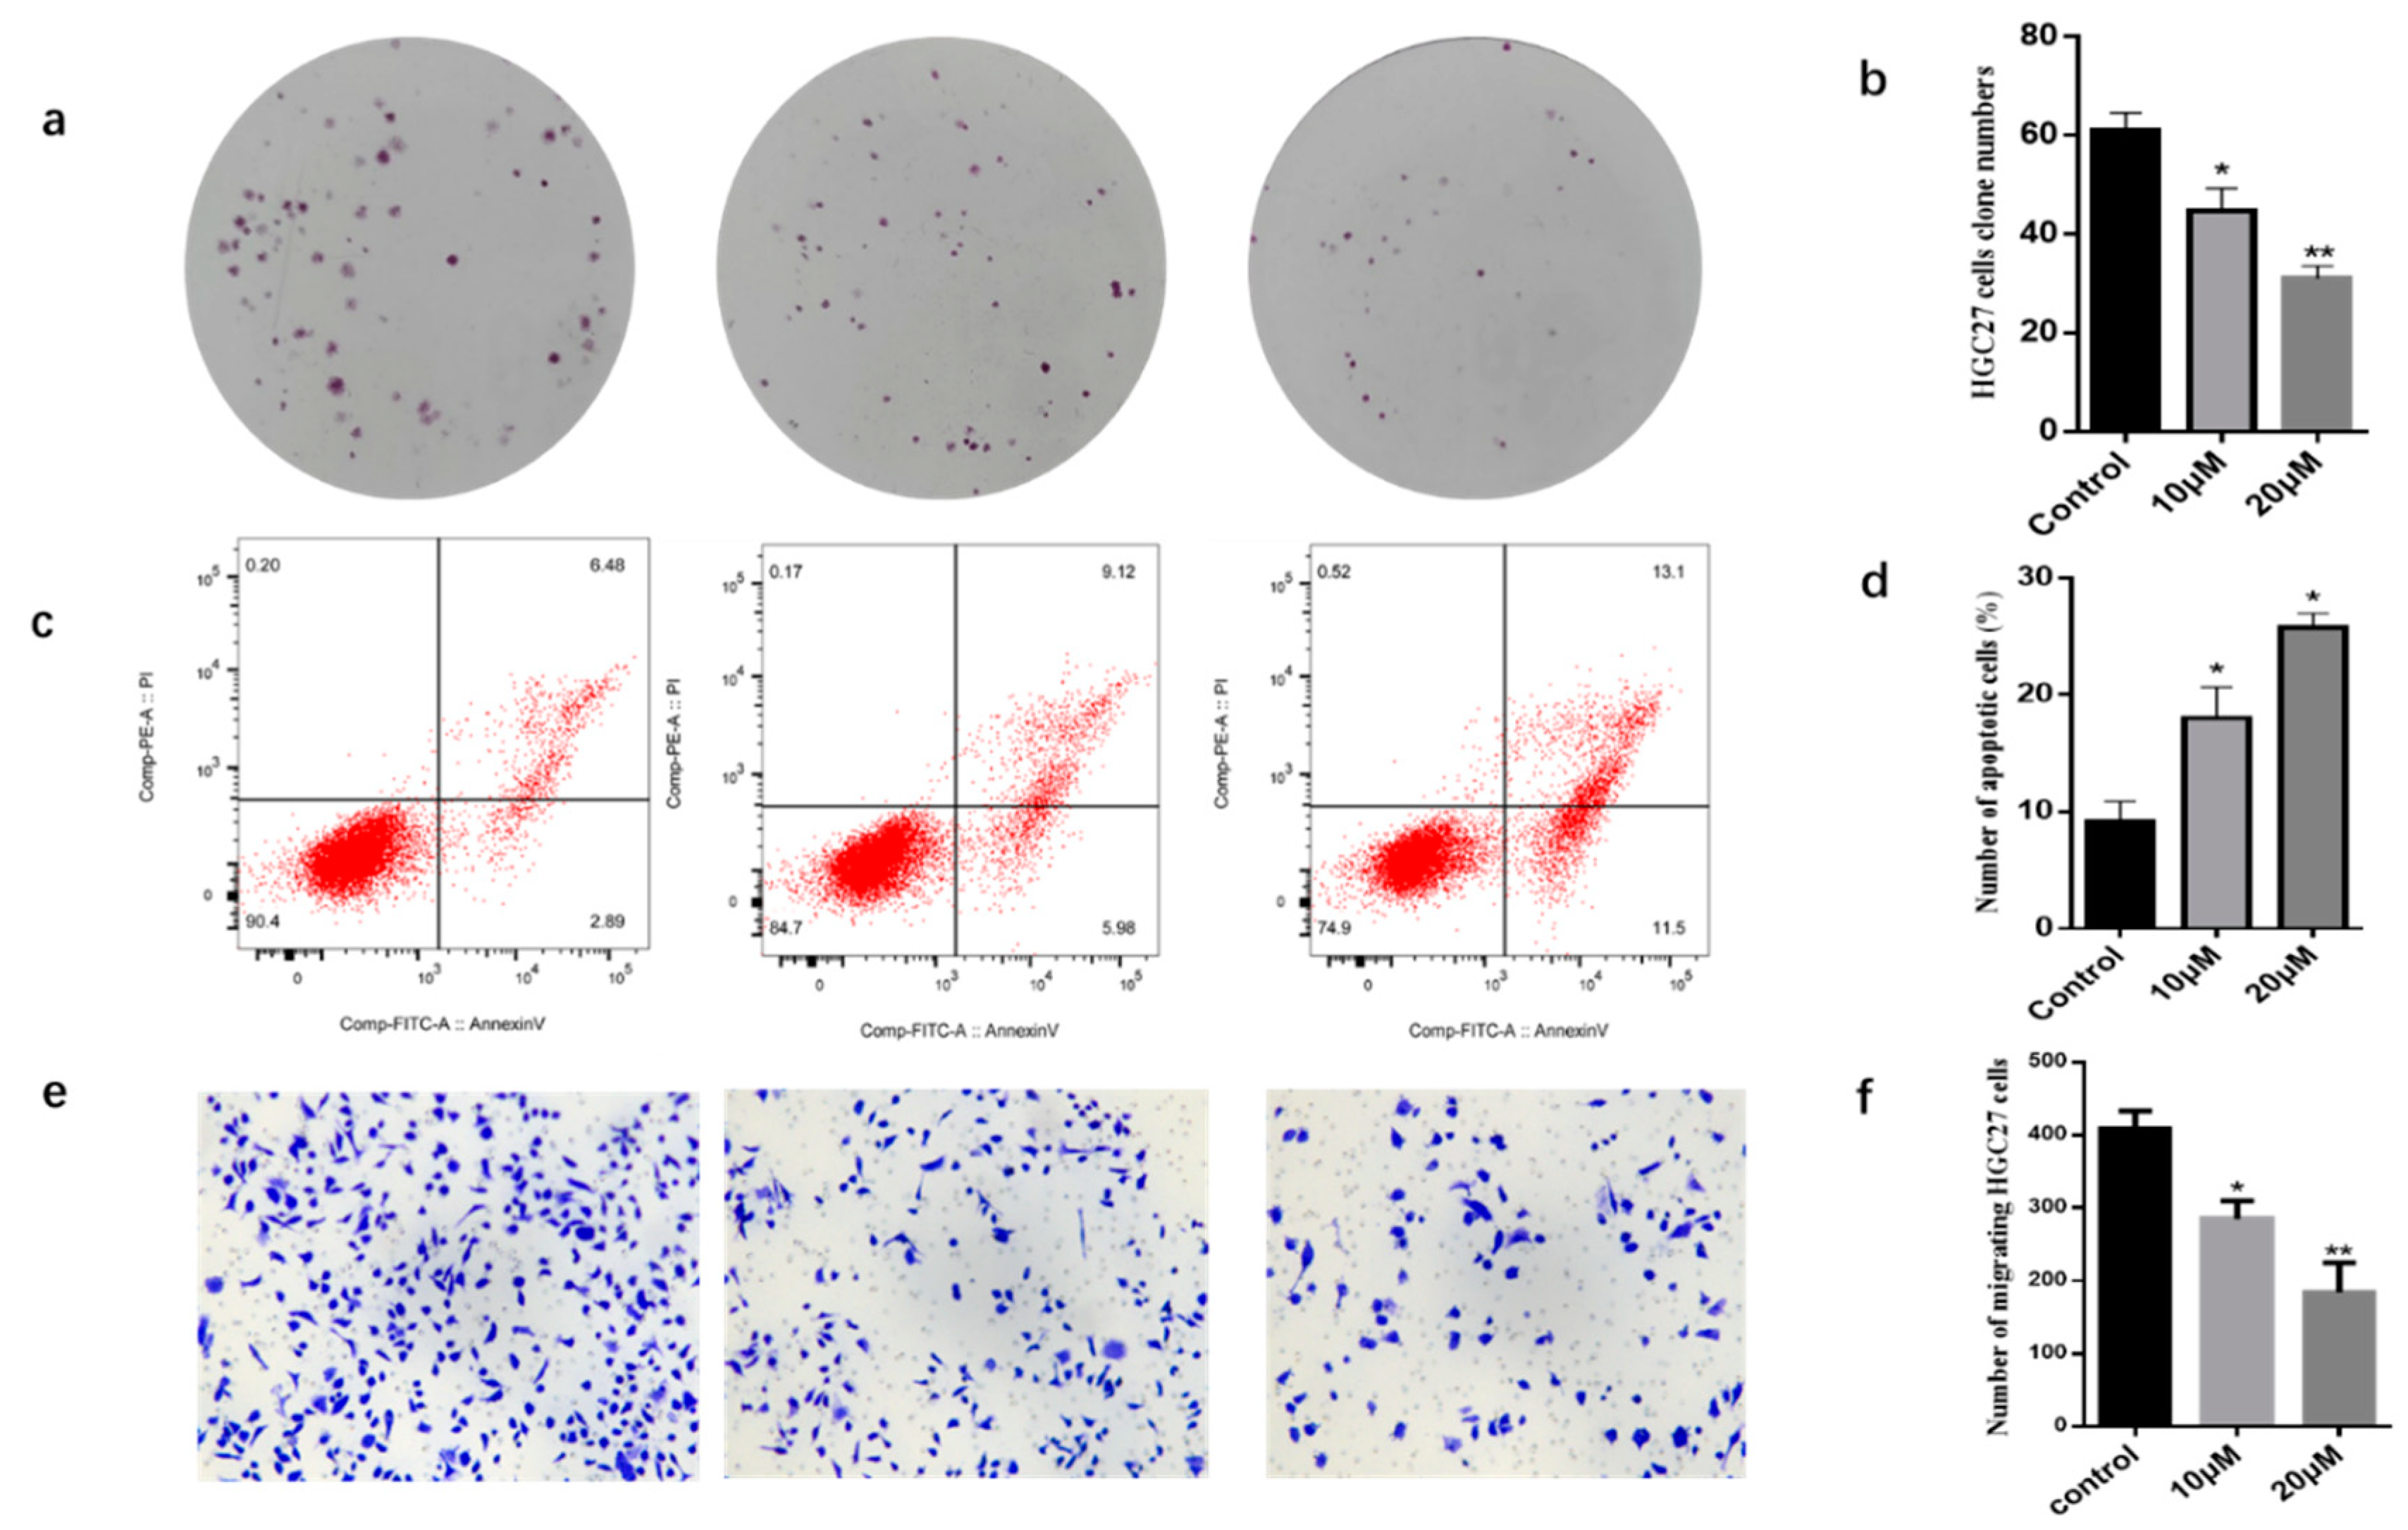
Figure 4.
Compound 10 influences the expression of relevant proteins. Detection of Caspase-3, Bcl-2 and Bax protein proteins expression level in HGC27cells by Western Blot, the treatment groups were compared with control,*p< 0.05, **p< 0.01.Data were expressed as mean ± SD (n=3). Note:control: blank control group, 10µM: 10µmol/mL group, 20µM: 20µmol/mL group.
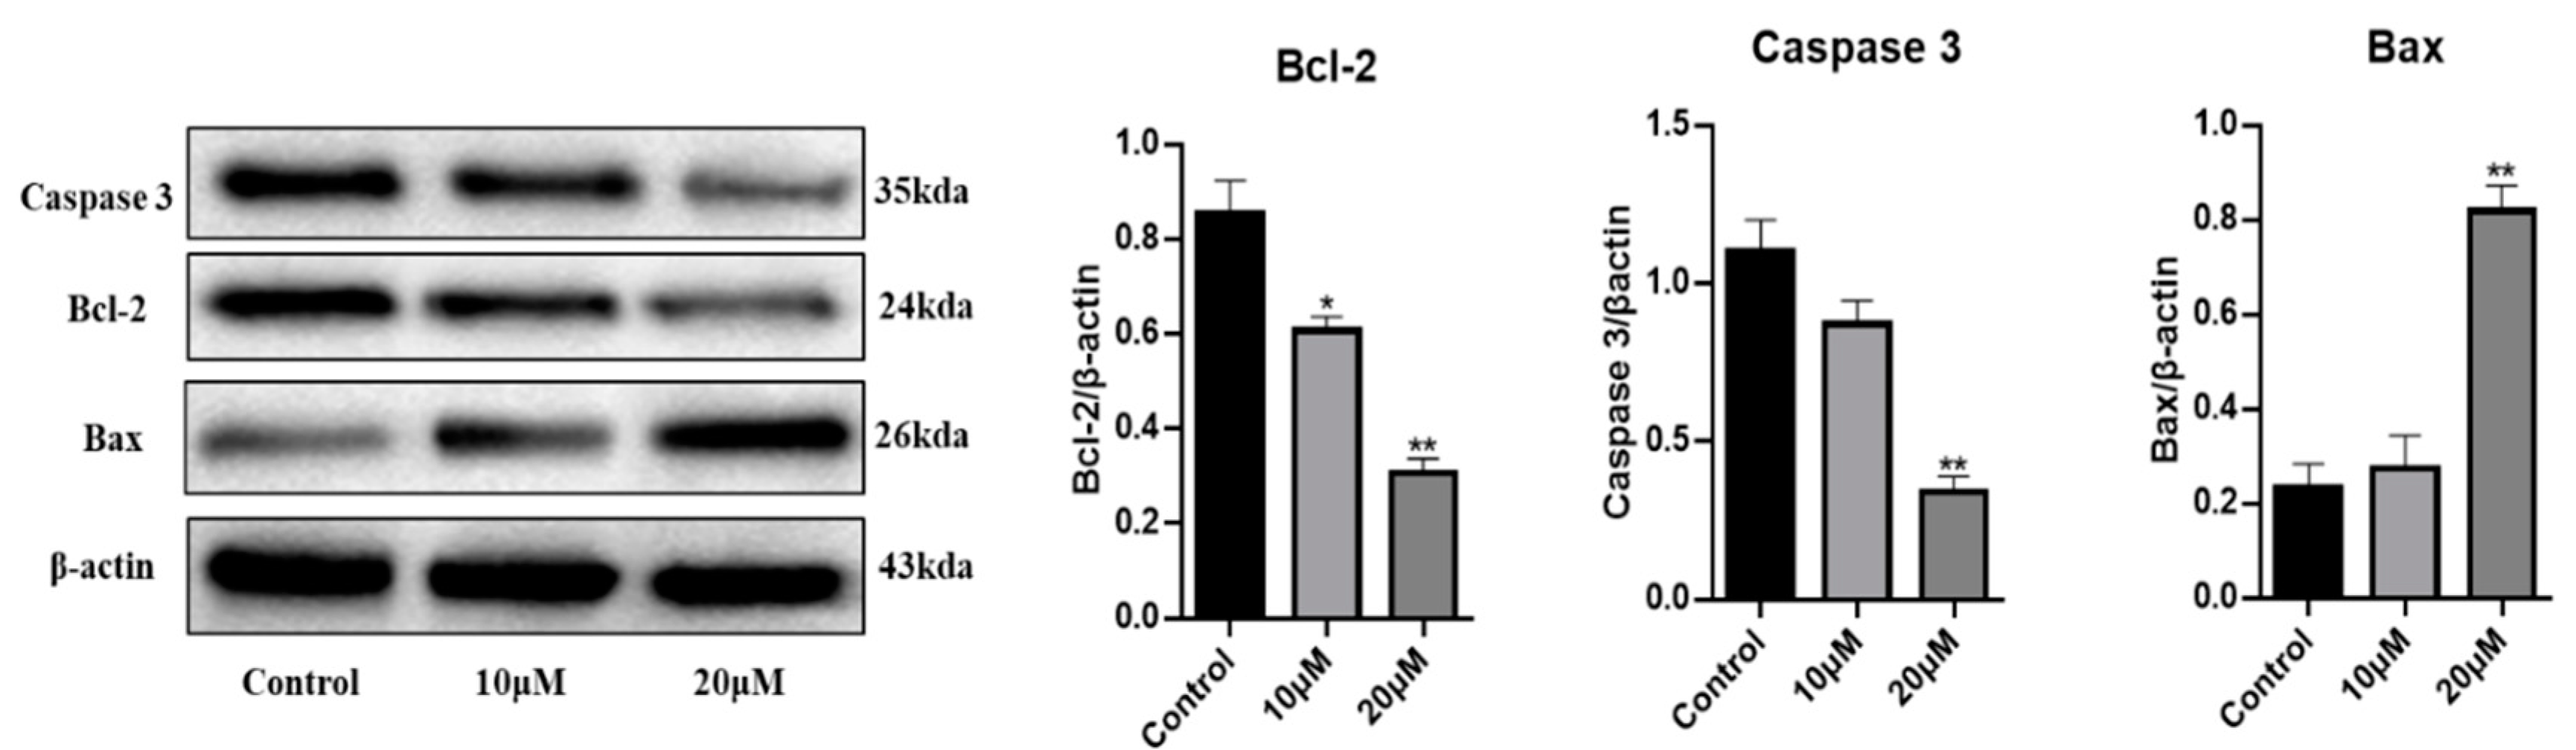
Table 1.
1H NMR (400 MHz) and 13C NMR (100 MHz) data of 1 in CD3OD (δ in ppm, J in Hz). (*) refers to overlapped signals.
Table 1.
1H NMR (400 MHz) and 13C NMR (100 MHz) data of 1 in CD3OD (δ in ppm, J in Hz). (*) refers to overlapped signals.
| No. | δH (J in Hz) | δC | No. | δH (J in Hz) | δC |
| 2 | 156.7 | 1′′ | 3.62 d (7.2) | 23.6 | |
| 3 | 6.92 s | 102.3 | 2′′ | 5.40 t (7.2) | 123.6 |
| 3a | 124.2 | 3′′ | 135.9 | ||
| 4 | 7.32 d (8.4) | 119.1 | 4′′ | 1.89 s | 16.4 |
| 5 | 6.90 d (8.8) | 109.3 | 5′′ | 2.02 m | 36.7 |
| 6 | 156.4 | 6′′ | 1.60 m | 34.2 | |
| 7 | 114.4 | 7′′ | 3.90 t (6.8) | 76.1 | |
| 7a | 155.3 | 8′′ | 148.6 | ||
| 1′ | 133.8 | 9′′α | 4.79 s | 111.5 | |
| 2′ | 6.80* d (2.0) | 104.1 | 9′′β | 4.72 s | |
| 3′ | 160.0 | 10′′ | 1.62 s | 17.5 | |
| 4′ | 6.26 s | 103.6 | -OCH3 | 3.86 s | 57.0 |
| 5′ | 160.0 | ||||
| 6′ | 6.80* d (2.0) | 104.1 |
Table 3.
Cell viability of Compounds 1-35 on HGC27 cells.
| Compound | Cell viability (%) | Compound | Cell viability (%) |
| 1 | 96.42 ± 4.57 | 19 | 95.67 ± 3.65 |
| 2 | 97.88 ± 2.26 | 20 | 93.72 ± 2.86 |
| 3 | 96.27 ± 2.37 | 21 | 98.96 ± 0.92 |
| 4 | 92.08 ± 4.25 | 22 | 96.86 ± 1.84 |
| 5 | 98.38 ± 0.58 | 23 | 83.99 ± 3.92 |
| 6 | 89.04 ± 3.06 | 24 | 94.57 ± 2.74 |
| 7 | 89.47 ± 2.04 | 25 | 88.99 ± 4.62 |
| 8 | 59.92 ± 2.16 | 26 | 95.22 ± 3.30 |
| 9 | 96.62 ± 0.54 | 27 | 92.97 ± 2.72 |
| 10 | 39.71 ± 3.27 | 28 | 102.55 ± 3.06 |
| 11 | 96.27 ± 4.14 | 29 | 98.20 ± 0.37 |
| 12 | 74.89 ± 1.58 | 30 | 46.84 ± 3.02 |
| 13 | 77.66 ± 6.40 | 31 | 98.51 ± 0.97 |
| 14 | 95.05 ± 2.78 | 32 | 83.55 ± 1.51 |
| 15 | 97.90 ± 1.74 | 33 | 88.55 ± 3.20 |
| 16 | 97.01 ± 1.83 | 34 | 98.26 ± 1.03 |
| 17 | 98.36 ± 1.65 | 35 | 90.74 ± 5.24 |
| 18 | 95.05 ± 2.30 | acontrol | 100.00 ± 1.31 |
a control:blank control.
Table 4.
Inhibitory effects of compounds 5, 8, 10 and 30 on HGC27 cells (mean ± SD, n= 3).
| Compound | IC50 (%) |
| 5 | 10.24 ± 0.89 |
| 8 | 28.94 ± 0.72 |
| 10 | 6.08 ± 0.34 |
| 30 | 33.76 ± 2.64 |
Disclaimer/Publisher’s Note: The statements, opinions and data contained in all publications are solely those of the individual author(s) and contributor(s) and not of MDPI and/or the editor(s). MDPI and/or the editor(s) disclaim responsibility for any injury to people or property resulting from any ideas, methods, instructions or products referred to in the content. |
© 2023 by the authors. Licensee MDPI, Basel, Switzerland. This article is an open access article distributed under the terms and conditions of the Creative Commons Attribution (CC BY) license (http://creativecommons.org/licenses/by/4.0/).
Copyright: This open access article is published under a Creative Commons CC BY 4.0 license, which permit the free download, distribution, and reuse, provided that the author and preprint are cited in any reuse.


