
Submitted:
15 November 2023
Posted:
16 November 2023
You are already at the latest version
Abstract
Wetland ecosystems provide valuable services to human beings, but they are also among the most threatened ecosystems in the world (1). Sixteen ecosystem services are identified through the South African Water Research Commission's Wet-Health Tool (2). This study sought to establish which of these ecosystem services are highly ranked/rated by the community members living in the Soutpansberg area in South Africa. This area is a strategic water source/watershed. The area is rich in biodiversity and is also experiencing competing administrative jurisdictions: the local traditional leadership and the municipal council. This study also sought to determine the influence of age, education status, employment status, and family income, among other demographic factors, on how people view the importance of services derived from wetlands. It also sought to establish whether people in urban settings view the ecosys-tem services obtained from wetlands similarly to people in rural settings. A literature review was conducted to understand the wetland ecosystem services and how communities benefit from these services. A close-ended questionnaire was used to collect data for the current study, which was circulated among the villagers around the wetlands, particularly those living close to the wetlands. One hundred and sixteen responses from the study were recorded. Food for livestock was ranked the greatest benefit or service derived from the wetlands rated by 82% of the participants, followed by the provision of cultivated foods at 60%, provision of water for human use at 58%, provision of harvestable resources at 42% and erosion control at 38% completes the top 5 ranked ecosystem services in the area. The study concluded that the participants living in rural areas had greater awareness of wetlands' ecosystem services than their urban counterparts.
Keywords:
wetland
; ecosystem services
; land cover
; biodiversity
; sustainability
; citizen science
1. Introduction
In a rapidly changing global environment, a careful understanding of the relationship between ecosystem services (ESs) and human well-being (HWB) is central to sustainability (3). This is compounded by the understanding that the environment is dynamic, changes all the time, and that researchers may not have unearthed everything there is to know about the environment; thus, knowledge about what researchers know may change rapidly (4,5). Wetland ecosystems have been the subject of various research discoveries and will continue going into the future (6).
Despite making only about 6% of the planet’s surface, wetlands are among the planet’s most productive ecosystems and provide a significant number of ecosystem services (1,7–10). Scholars such as Cheng et al., (2022) define ecosystem services as the benefits humans receive directly or indirectly from ecosystems. The services provided by wetlands are classified as provisioning, regulating, cultural, and supporting services, all of which are provided to human beings for free (12–14).
Holistically, wetland ecosystems provide these services for the benefit of human beings and critical habitats for various species (3). They serve as natural filters for waste as they trap dense materials that would otherwise pollute running water and make it harder to clean; hence, they are considered a critical agent in maintaining water quality. Wetlands offer natural carbon storage, and by permanently absorbing and storing atmospheric carbon dioxide through natural sinks, they mitigate the effects of climate change (15–17). Wetlands can also boost resistance to drought, floods, and damage caused by extreme weather conditions; considering expected future changes in hydrological patterns due to global climate change, they thus are important in achieving the United Nations Sustainable Development Goals (SDGs) (18–23).
For South Africa specifically, although the exact figures vary from time to time, wetlands surface area could be approximately 29,000 km2, accounting for just around 2.4% of the total land area (24–26). They are thus a critical component for rural communities’ livelihoods in South Africa, Southern Africa and the whole world (13,18,27); this is so because the majority of people in Southern Africa live in rural regions; thus, natural resources are critical to their livelihoods. Scholars such as Dalu and Chauke (2020), Ferreira et al., (2023), Jaramillo et al., (2020) and Sinthumule & Mudau (2019) already hinted that evidence exists, confirming that many people in South Africa rely on wetlands for subsistence; thus, there is an urgent need to analyze and anticipate the sustainability of various services that these wetlands provide, if this is to be maintained, particularly in rural areas, and for those wetlands that are outside of protected areas.
According to Sinthumule and Netshisaulu (2022), rural people depend on wetland water more than those in urban areas. Wetlands in rural regions with poor service delivery offer a variety of goods and services as well as a range of direct-use values essential for supporting human lives and livelihoods. This assertion is supported by a study conducted in the Hlabathi administrative region by Pantshwa and Buschke (2019), which found that many residents rely on wetlands for their daily water needs because 71.8% of the municipal area lacks access to piped water. Similarly, the residents of the Duthini village in the Limpopo Province of South Africa rely on the wetlands for drinking water because the municipal taps are dry throughout the year.
Despite all the benefits that scholars have identified worldwide, most wetlands degrade because of anthropogenic activities, poverty, and population growth. Wetlands are drained and turned into settlements to keep up with population growth that is increasing rapidly in South Africa (30). Furthermore, as the population increases, the demand for food and settlement increases, which drives up agricultural productivity and increases the amount of land that may be used for cultivation. Human settlement along the wetland areas results in the clearance of the natural wetland vegetation (14,31,32).
Wetlands rank among the very fragile and most threatened ecosystems in South Africa, which are continuously being degraded and poorly managed (33,34). Wetlands predominately exist on communal land in South Africa, where everyone can use common-pool resources and exploit the wetland (29). These wetlands are communal lands that rural communities consider very valuable as they benefit more from these systems than the government, which ideally should provide basic services, Pantshwa and Buschke (2019).
The objective of this study was to conduct a thorough assessment of the services that the community derive from the wetlands, using citizen science or knowledge from the community members themselves to develop management options for the wetlands. Due to the increase in human population and associated developments in the area, the wetland may have been subjected to considerable land-use changes over the past decades, accelerating alterations in the provisioning of ecosystem services (35). Still, unfortunately, this has never been quantified or researched in detail at a local scale to advise on policy or regulatory frameworks backed by facts from the people on the ground.
Wetlands provide a variety of ecosystem services, and not all wetlands provide the same ecosystem services (36). A detailed assessment of each wetland and its ecosystem services is important to determine the required management level where necessary (37). Individual wetland areas differ with regard to their characteristics, contexts, and degree to which they supply different ecosystem services to society. They also differ according to the level of use (3). Thus, society may deem some wetland/riparian areas more important. An assessment and comparison of perceptions by community members on wetland ecosystem service delivery is important because the level of understanding and concerns of the community members also determines the level of effort required in the formulation of policy or management options for the wetlands, especially for wetlands that are in rural areas and outside protected environments.
2. Study Area
The study area falls within a designated critical biodiversity area, a portion of the Vhembe Biosphere Reserve (33), situated in Thulamela Local Municipality of Vhembe District Municipality, in Limpopo Province, South Africa (Figure 1). This area has been identified as a strategic water source area (38), which is to be protected in line with the National Water Security Framework recommendations (39). According to StatsSA (2022), an average household in the study area comprises of four individuals.
Seven wetland ecosystems identified in the study area are located in Sambandou, Tshifudi, Tshitavha, Tshaulu, Mahunguwi and Thohoyandou. These wetlands fall in an area under the competing jurisdictional authority of the Thulamela Local Municipality and the Mphaphuli Traditional Authority. This area forms part of the Soutpansberg Mountains, a renowned area of endemism and a strategic water source for surface and groundwater (33). The area has a very high unemployment rate, estimated at 44% (41), with almost 54% of households headed by women and an average household size of five people. Only 26% of the population has piped water inside their dwellings (40).
The intertropical convergence zone primarily influences the area’s climate (35). Rainfall distribution in the area is classified as unimodal, with a rainy season predominantly between October and January (42). The average annual rainfall is between 200 and 400 mm (43).
3. Materials and Methods
3.1. Review of secondary information
A literature review was conducted to understand the wetland ecosystem services, how communities benefit from these services, how some of these services contribute to the achievement of Sustainable Development Goals, and the management of wetlands ecosystem services, especially in rural areas in South Africa, Southern Africa and the world over. The literature review provided an understanding of the various services, ranging from provisioning services, regulating services to cultural services. It also aided the researchers to appreciate what other areas other than the study area are experiencing around wetlands ecosystem services. The outcome included insight into the challenges that lead to the deterioration of the ecosystem services, including how other areas have developed management options for managing these services going into the future.
3.2. Research Design
Research designs specify the strategy and procedure used to collect, align and analyze the research question hypotheses, variables, and data collection methods. It also outlines the analytical techniques relative to the data type or information that should be collected in order to answer the research question/s (44,45). The design used in this research is descriptive, inferential (using T-test statistics), and correlational (using crosstabulation associations).
3.3. Target Population, sampling, and sample size
The Mphaphuli communities living near wetlands were the target groups for this study. These included Mahunguwi, Tshitavha, Tshifudi, Tshaulu, Thohoyandou, Makwarela and Sambandou. Stats SA (2017) states these villages have a combined population of 77216 and a surface area of 56.66 km2.
Not all people from these villages stay along or close to wetlands; hence, purposive sampling was used to identify respondents to questionnaires prepared for the study. One hundred and sixteen (116) respondents from the study were recorded, where 20 were recorded at Tshifudi, 20 at Tshitavha, ten (10) at Tshaulu, 26 at Thohoyandou, 20 at Sambandou and 20 at Mahunguwi. Households from the seven villages were selected using a purposive sampling approach. In homes with no one to answer the questionnaires, the researcher returned to the household at a different time (later that same day or the following weekend). If still no response was obtained, another household was selected.
The researchers obtained permission to conduct this research from the local chiefs at all seven villages or municipal representatives. The Mphaphuli Traditional Authority, where all seven villages belong, also granted permission for the study. After getting permission in June 2022, primary data was collected using interview-administered questionnaires between July and August 2022.
3.4. Research instruments and data collection method
A questionnaire with closed questions was designed to collect data for the current study. Some of the questions emanated from a study conducted by (46), where wetlands were one of the land covers that showed signs of reduction over the years, leading to questions about the associated implications on wetland ecosystem services.
The instrument used to gather information from the participants was a questionnaire with fully structured questions inviting responses on a Likert scale with five (5) options (strongly disagree, strongly agree, disagree, agree & neutral). Fully structured questions ensured standardization of the responses and saved time during analysis. Participants had to select their best answer for each question, and in certain sections, this was on a 5-point Likert scale ranging from 1 = strongly disagree to 5 = strongly agree. This questionnaire consisted of the following sections; section 1 (respondents’ biographic information), section 2 (additional information about the respondents), section 3 (wetland health and ecosystem services) and section 4 (suggestions on wetland health and ecosystem services maintenance).
The questionnaire used to collect data in this study contained both fixed responses and open-ended questions. Fixed-response questions were used to ensure the precision of responses from respondents, whereas open-ended questions were used to allow participants to express themselves in their own words.
The questionnaires were designed to collect socio-demographic and economic characteristics, respondents’ knowledge of wetland ecosystem services, and the indigenous knowledge and practices prevalent in the area. Likert-type questions were limited to five points, using a rating scale to measure respondents’ attitudes. Questionnaires were first written in English and then translated into Tshivenda by the author.
The Tshivenda version of the questionnaires was then translated back into English by the researcher. The questionnaires were pre-tested on six (6) respondents from Tshitavha (3) and Sambandou (3) villages. This pre-testing was essential to confirm that the questions were unambiguous. The pre-testing revealed rephrasing or reorganizing the questionnaire was required since specific questions needed clarification or simplifying.
3.5. Data Analysis
The collected data was organized and analyzed descriptively using SAS and SPSS v.21.0 software packages to identify descriptive and inferential associations. Descriptive statistics were presented as frequencies, expressed as percentages, and all associations between pairs of categorical variables were established using Pearson’s chi-squared test. All inferential statistics were interpreted at a 0.05 (5%) level of significance. With a cut-off point of 0.7, Cronbach’s alpha was used to test for internal consistency and factor analysis was used for data reduction.
For the T-statistic associations with a defined null hypothesis, which said the mean answer for each of the questions where the Likert scale was used should be equal to 3 (mid-point of all answer options) given that Strongly Agree = 5, Agree = 4, Neutral = 3, Disagree = 2 and Strongly Disagree = 1). A one-sample t-test was done to test the distribution of the mean for all such constructs. T(p) is the t-test static relating to the mean of 3, and the p-value is from the critical statistic. The p-value is the probability of observing a difference due to chance. The rejection criteria where a p-value smaller or equal to the level of significance was set at 5% = 0.05 throughout. For a specific question, if the null hypothesis is rejected, it implies significant statistical association either in agreement with the construct and if the mean was greater than three (3) or in disagreement if the mean was less than 3.
Cross Tabulations (Crosstab) are used to determine statistical interrelationships and interactions between variables (under the null hypothesis of statistical independence) and are simply data tables that present the results of the entire group of respondents as well as results from sub-groups of survey respondents. This form of analysis also helps determine the form of a relationship between two categorical variables or the domains themselves.
The chi-square test allows for testing of the significance of the relationship; that is, “it tests the goodness of fit”. Chi-Square is a test or statistic used to decide in the crosstab. The chi-square test, as well as the accompanying p-value, are derived through parametric / ANOVA (if data is continuous) or non-parametric / Kruskal-Wallis (KW) (if data is categorical).
The Kruskal-Wallis H test was used as data was categorical (sometimes also called the “one-way ANOVA on ranks”). It is a rank-based non-parametric test that can be used to determine if there are statistically significant differences between two or more groups of an independent variable on a continuous or ordinal dependent variable. It is considered the non-parametric alternative to the one-way ANOVA and an extension of the Mann-Whitney U test to allow the comparison of more than two independent groups. As the Kruskal-Wallis H test does not assume normality in the data and is much less sensitive to outliers, it can be used when these assumptions have been violated, and using a one-way ANOVA is inappropriate.
In a non-parametric test, the null hypothesis is that the two populations are equal; this is often interpreted as the two populations being equal in terms of their central tendency (distribution). The Kruskal-Wallis test finds a significant difference if the p-value is less or equal to the level of significance (=0.05); hence, when the hypothesis is rejected, just like in Anova, an effect is postulated. Significant p-values are highlighted in green, and the tests are done per constructs as grouped by the four (4) sections. In respect of the Kruskal Wallis test, it must be noted that if one finds no significant difference, this does not imply that the samples are the same; it must rather be taken to mean the test was inconclusive.
3.6. Validity and Reliability
Validity refers to the appropriateness and accuracy as applied to a research process. It is premised on the following questions: a) Does the investigation provide answers to the research questions for which it was undertaken? b) If so, does it provide these answers using appropriate methods and procedures? Reliability refers to the quality of a measurement procedure that provides repeatability and accuracy (45).
To maintain reliability, the researchers used the same procedure to obtain the results. Reliability was increased by ensuring that leading and subjective questions were avoided. The consistency of the results across items was measured with Cronbach Alpha. The data was analyzed using Cronbach’s alpha coefficient to test for internal consistency. The alpha coefficient can range from 0 to 1, with values of 0.60 to 0.70 deemed the lower limit of acceptability (47–49).
WET-EcoServices Version 2 includes 16 different ecosystem services, namely flood attenuation, streamflow regulation, sediment trapping, phosphate assimilation, nitrate assimilation, toxicant assimilation, erosion control, carbon storage, biodiversity maintenance, provision of water for human use, provision of harvestable resources, food for livestock, provision of cultivated foods, cultural and spiritual experience, tourism and recreation and lastly education and research.
4. Results and Discussions
The Mphaphuli communities living near wetlands were the target groups for this study. These included Mahunguwi, Tshitavha, Tshifudi, Tshaulu, Thohoyandou, Makwarela and Sambandou. According to Stats SA (2017), these villages have a combined population of 77216. Purposive sampling was used to identify respondents to questionnaires prepared for the study. One hundred sixteen (116) respondents from the study were recorded, where 20 were recorded at Tshifudi, 20 at Tshitavha, 10 at Tshaulu, 26 at Thohoyandou, 20 at Sambandou and 20 at Mahunguwi. 74% of the people are unemployed.
Table 1 summarizes the findings from the study, where the first column shows the percentage distribution (% yes) with respect to the 16 key benefits and services derived from the wetland in the area. It is apparent that “Food for livestock” is ranked the most important benefit or service derived from the wetland in the area, as identified or mentioned by 82% of the respondents. The provision of cultivated foods comes second, mentioned by 60%. At the third position was the provision of water for human use, as mentioned by 58%, followed by the provision of harvestable resources, mentioned by 42% and then erosion control as the fifth-ranked service at 38%. These five services were thus the top 5 ranked services.
The next ten (10) columns show the p-values derived when the test of association was performed between each of the 16 key benefits and services derived from the wetland in the area against the ten (10) identified socio-demographic variables from the village (Village of the respondent) to HH_Income (The family income per month-either from formal or informal employment). The Chi-Square Test of Independence determines whether there is an association between categorical variables (i.e., whether the variables are independent or related). It is a non-parametric test. The null hypothesis states that there is no association between the benefit and the variable against the alternative that there is association or dependence. The chi-square statistic compares the observed values to the expected values. This test statistic is used to determine whether the difference between the observed and expected values is statistically significant by comparing the p-value against the set level of significance of 0.05. When the p-value is less or equal to 0.05, the null hypothesis is rejected, and there is evidence of significant association. This is the case with the cells that are not greyed out in the above table. The cells that are greyed out are insignificant or, more technically, inconclusive in so far as the test statistic is concerned.
As of 2023, an individual living in South Africa with less than R1,058 per month was considered poor. Furthermore, individuals having R760 a month available for food were living below the poverty line according to South African national standards (50). More than 53% of the households in the study area have between 5-10 people, suggesting that combined, these people are considered poor in their majority as 60% of households fall under the R0-R2000 household income per month. The poor (as measured by HH_Income) are significantly associated or are the ones that believe flood attenuation and provision of water for human use are the main benefits and services derived from the wetlands in the area.
Flood attenuation as a key benefit and service derived from the wetland in the area, when examined by the village, shows that for those that derive this benefit, Thohoyandou Block F derives the most. Thohoyandou Block G, Sambandou and Tshitavha follow jointly in second place, and Tshifudi completes the group that derives this benefit. Two villages i.e., Mahunguwi and Tshaulu, registered no benefit at all derived.
Flood attenuation can help with flood risk management and may also have the potential to form a ‘wetland habitat’. During flood events, riparian buffers and wetlands can slow runoff and absorb excess water, reducing peak flows and lessening downstream flooding. It is therefore concerning that in the main, in each village, more people perceived that no benefit is derived at all compared to those who say they do.
A closer look at the wetlands across all the villages shows that there are people who built infrastructure inside or too close to wetlands, who would thus expect that wetlands should attenuate floods and protect their infrastructure. This has not been the case as some infrastructure, particularly in urban settings such as Thohoyandou, have been continuously damaged. Roads are peeling off, and houses show signs of mould or water seeping into the yards. Figure 2 illustrates some of the infrastructure affected by water, as this infrastructure is built either in or too close to wetlands.
In contrast, the majority of people in rural settings build their infrastructure far from wetlands.
Sediment trapping (as a key benefit and service derived from the wetland in the area) entails a temporary containment area that allows sediment to settle out before the runoff is discharged. Only in Sambandou do respondents attest to that as a benefit, but even then, it’s a benefit not realized by the majority, who responded in greater numbers to a ‘no benefit’ compared to those who indicated a benefit. All other villages recorded ‘no benefit’ – with Mahunguwi, Tshitavha and Tshifudi topping the list. The responses are summarised in Figure 3.
The respondents from all the villages combined did not believe that wetlands provide erosion control, as 62% of the respondents, with only 38% believing so. Effective erosion control can help avert surface runoff, mitigating soil and water and wildlife habitat loss. Only in Sambandou is this benefit recognized by the majority – otherwise, it is a benefit recognized by the minority in all other six villages. Tshitavha had the highest number who see no benefit in this regard. It may very well be that no efforts are directed in areas where no benefit is realized. The summary is reflected in Figure 4.
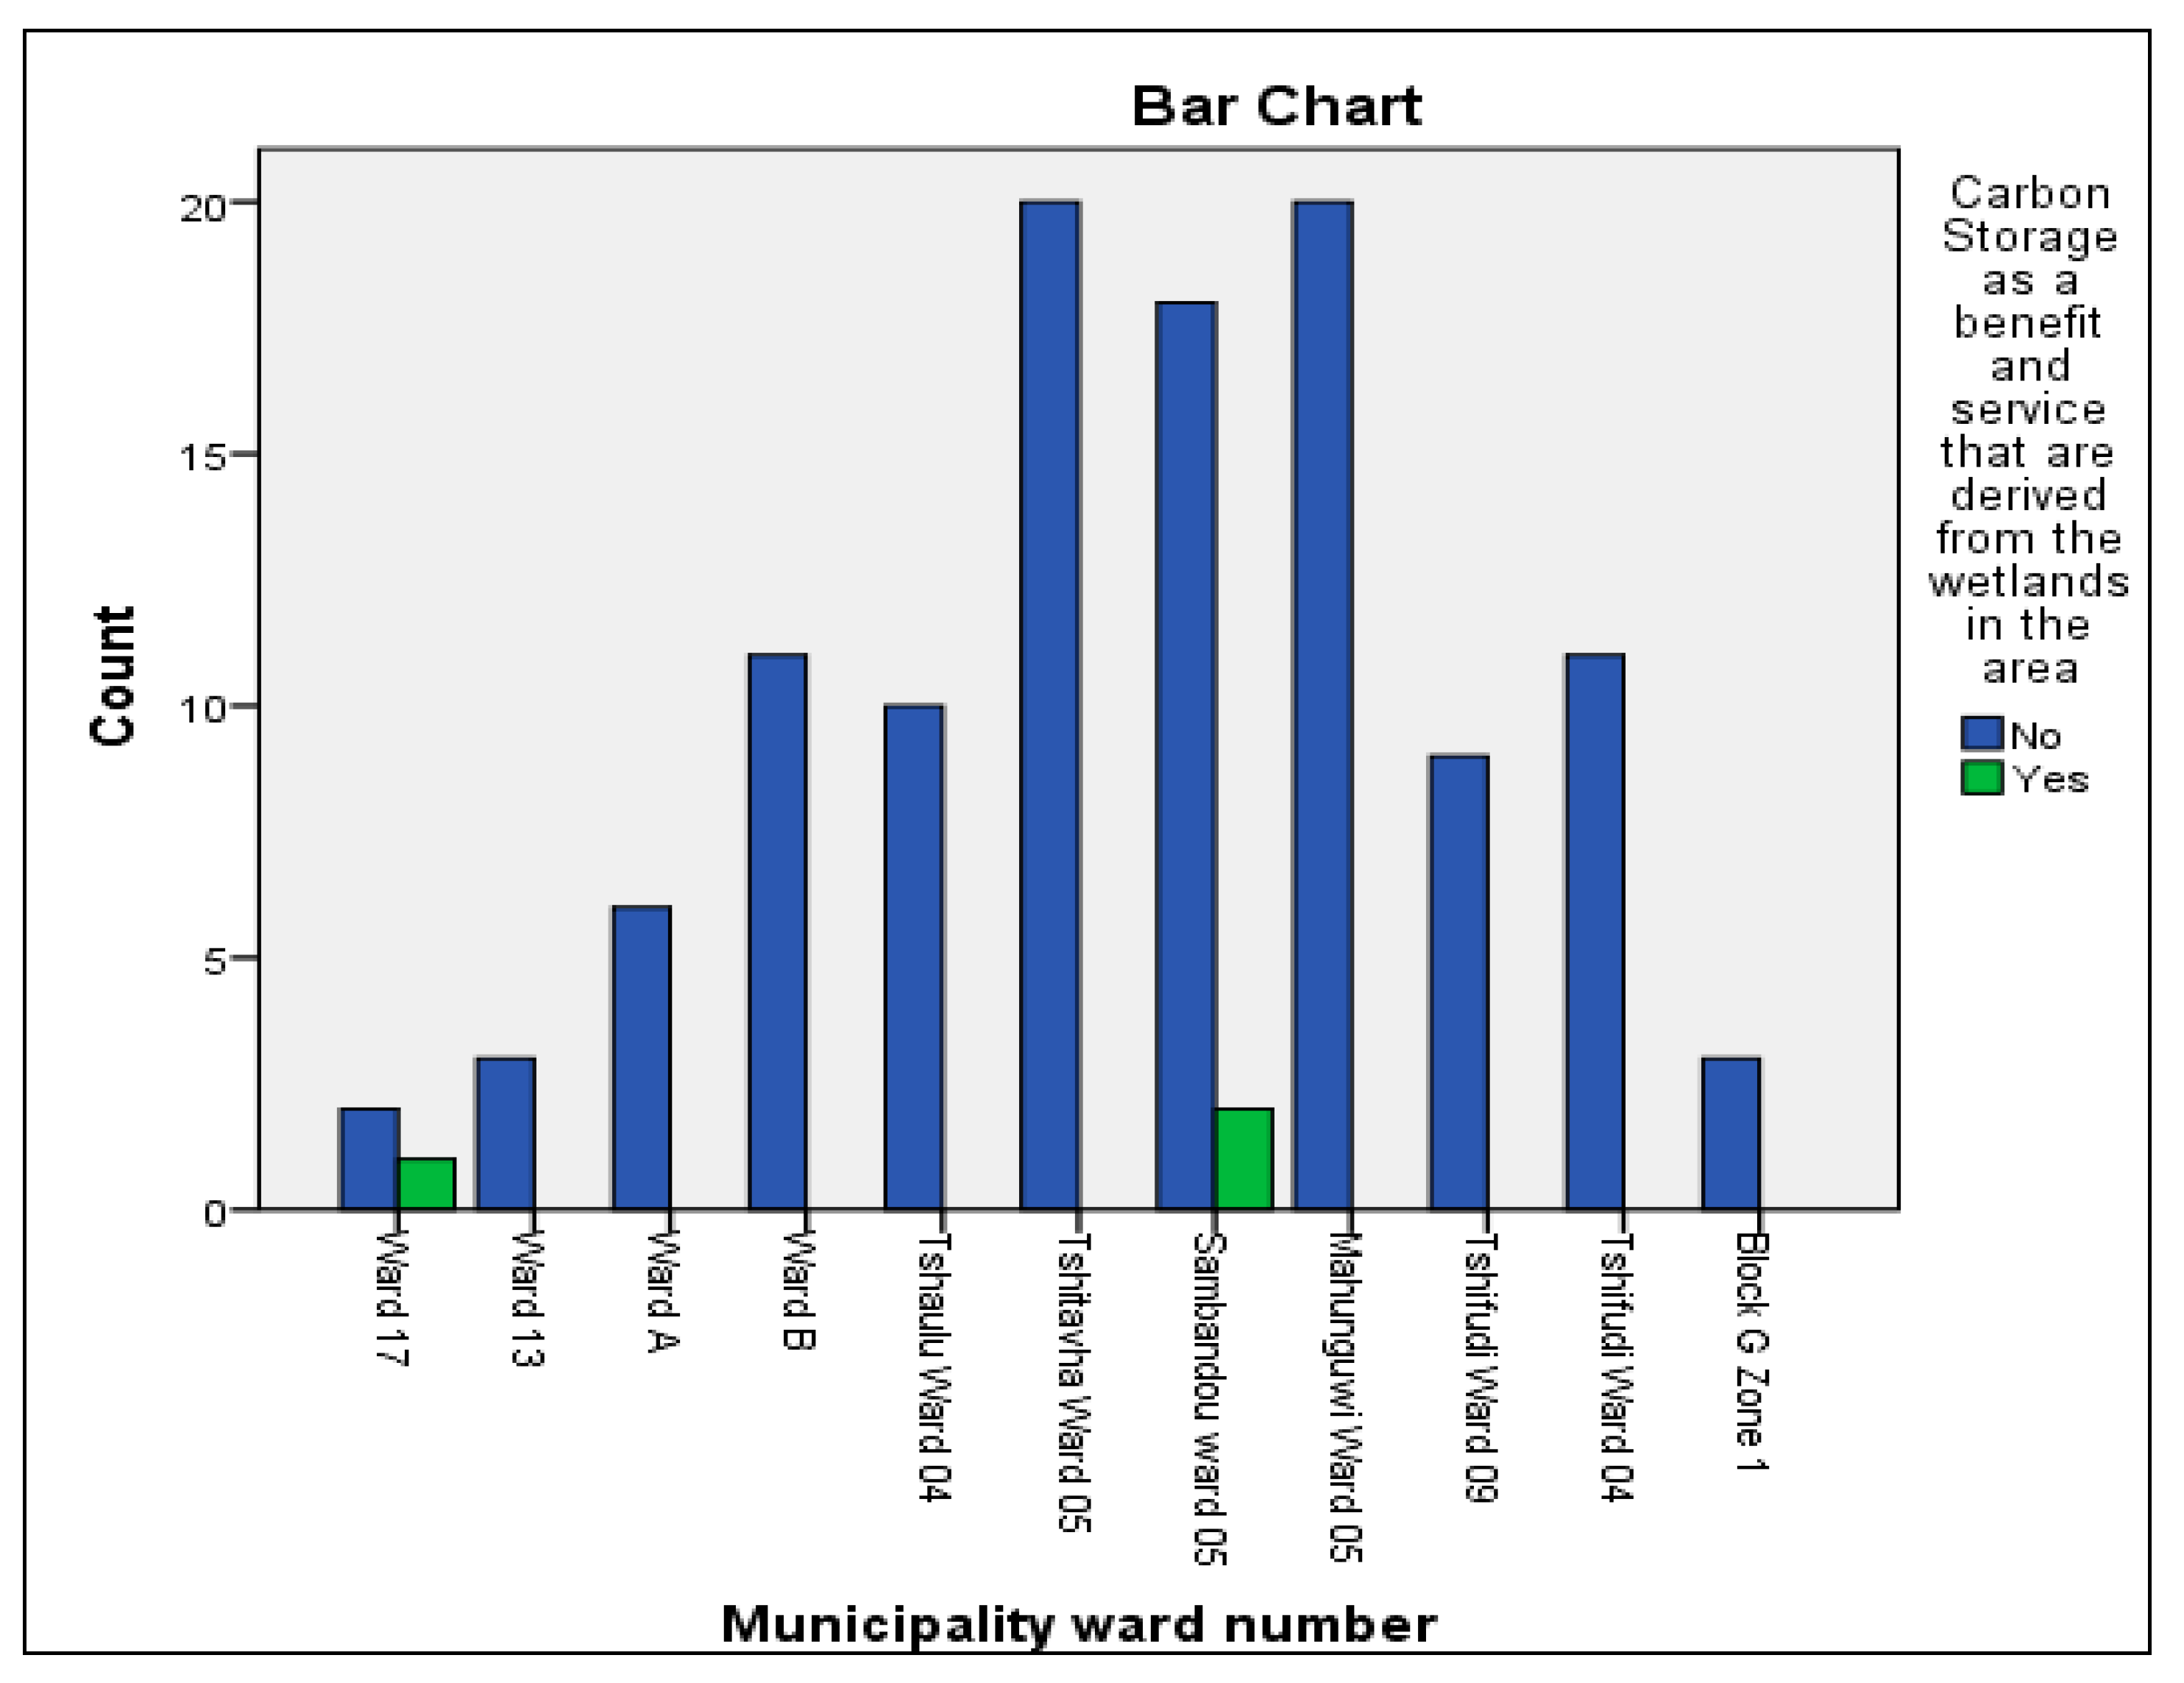
Carbon storage would prevent widespread carbon dioxide emissions from continuing to cause and exacerbate climate change through a complex method of capturing carbon dioxide emissions and storing them in coal seams, aquifers, depleted oil and gas reservoirs and other spaces deep under the earth’s surface. Carbon Storage as a benefit and service derived from the wetlands in the area is significant at the municipal ward level but not at the village level, as has been apparent in most associations. The inferences suggest that 97.4% see no benefit, which could simply be owing to the scientific acumen and technical complexity around the concept for a setting such as the above. Only two wards have some appreciation of this benefit, and these are Ward 17 and Sambandou Ward 05. All of these are summarised in Figure 5.
The provision of water for human use (as a key benefit and service derived from the wetland in the area) examined by the village shows appreciation from five of the seven villages. Interestingly, the two villages where the majority perceived no benefit, i.e., Thohoyandou Block F and Block G, are the economically well-to-do ones, with Block F showing the highest proportion of no benefit derived whilst Tshitavha showing the highest proportion of there being a benefit derived in as far as provision of water for human use as a key benefit and service derived from the wetland in the area is concerned. All in all, 57.8% see benefits, whilst 42.2% do not. As indicated elsewhere, this most likely relates to the economic and social means of survival between the urban/peri-urban vs rural/tribal/traditional villages.
The provision of water for human use (as a key benefit and service derived from the wetland in the area) examined by the municipal ward attests to the same inferences as by village except for that by ward, more granular details become apparent such as in ward 17, virtually not a single person sees a benefit of the provision of water for human use (as a key benefit and service derived from the wetland in the area). In contrast, in Tshitavha ward 05, 14.7% vs 2.6% (expressed as a function of all the study respondents) identify a benefit. In simple, those who see the benefit are more than five times in number compared to those who do not see the benefit.
Provision of water for human use (as a key benefit and service derived from the wetland in the area) examined by age alludes to the fact that of the 58% who appreciated the benefit, the 41-50 age category, followed by the 31-40 age category acknowledge the benefit the most. The same 31-40 age category also has the highest frequency in the ‘no benefit’ group. Alongside the 21-30 age category, the three age groups have the ‘yes there is a benefit’ group dominating in contrast to the other groups where the ‘there is no benefit’ group prevails. However, within the 51-60 age category, the two groups have very close thresholds. The elderly appreciate water availability the most, it seems.
The association between the provision of water for human use (as a key benefit and service derived from the wetland in the area) and family income shows that the R0-R2000 family income per month, the R2001-R4000 and the two other family income groups believe there is indeed a benefit in providing water for human use. It is only the above R10 000 family income group where the majority see no benefit. There is a 50%-50% split between the two groups in the R8001-R10000 family income. The inescapable conclusion is the effect of economic status, i.e., the rich see no benefit. In contrast, everyone else does see a benefit in the provision of water for human use as a key benefit and service derived from the wetland in the area. This is a key finding of this study, i.e., the role of socio-economic status in that regard.
The association between food for livestock (as a key benefit and service derived from the wetland in the area) and village reveals that 82% do indeed derive a benefit, whilst 18.9% do not think so. Within those who do not think so, the majority are accounted for in Thohoyandou block F and G. Of the 82% who regard food for livestock as a key benefit and service derived from the wetland in the area, Tshitavha tops the list, followed jointly by Sambandou and Mahunguwi and then Tshifudi. Everyone in Tshitavha and Tshaulu also realizes a benefit, and no one in those two villages has a dissenting opinion. Once again, the split along economic boundaries is clear and also indicative of the kind of activities that constitute sources of livelihood.
The provision of cultivated foods (as a key benefit and service derived from the wetland in the area) and village reflect the breakdown of 82%, with Mahunguwi accounting for the most, followed by Tshitavha and then Sambandou. Evidence shows that Mahunguwi is the least capacitated regarding family income per month, and the above suggests poorer villages are much more inclined to subsistence activities for livelihoods and, as such, have a better appreciation and regard for cultivated foods that allude to the provision being a benefit and once again, this reflects the socio-economic status of the villages but reflected at ward level. Within the ‘no benefit’ group, Tshifudi has the highest number in frequency, which also equals the number who regard the benefit. With the exemption of Thohoyandou Blocks F and G, all the other villages have, in the majority, the view that, indeed, the provision of cultivated foods is a key benefit and service derived from the wetland in the area.
The healthier the wetlands, the more services and benefits they derive from wetlands (51). In this study, however, 78% seem to believe that they do not receive the benefits they deserve from the wetlands in the form of ecosystem services, while 3% are uncertain about ecosystem services as benefits. The major observation from the study is that the vast majority seem to receive no benefit from wetlands.
5. Conclusions
The objective of this study was to conduct a thorough assessment of the services that the community derive from the wetlands, and establish associations between these services and the community characteristics that influences the choice of services the community believes they benefit the most.
It was noted that wetlands provide a variety of ecosystem services. However, not all wetlands provide the same ecosystem services. Therefore, a detailed assessment of each wetland and its ecosystem services is important to determine the required management level where necessary. Every wetland area is, therefore, likely to be of some importance. However, individual wetland areas differ according to their characteristics, contexts, and the degree to which they supply different ecosystem services to society and differ according to the level of use.
Of the 16 key benefits and services derived from the wetlands in the area, food for livestock is ranked the most key benefit and service, followed by the provision of cultivated foods, provision of water for human use, provision of harvestable resources, and erosion control completes the top five (5) ranking. In general, people living in urban areas did not consider wetland ecosystem services as important to them, whilst the ones in rural parts of the study area were much more aware of the ecosystem services they derive from the wetlands. Age of the respondents, location of the respondents in terms of whether in urban or in rural setting, including whether the respondent stayed in the area for more than ten years or not, family income and education all played a role in how the respondents perceived the ecosystem services they derive from wetlands. People in urban settings see benefits or services differently from those in rural settings, to the extent that those in rural areas look at the basic services such as provision of water and food for livestock as the fundamental ecosystem services they derive from wetlands.
Author Contributions
Conceptualisation, K.D. Musetsho. and M Chitakira; methodology, K.D. Musetsho and M Botha; WetEcoServices excel platform, K.D. Musetsho and M Botha; validation, K.D. Musetsho; formal analysis, K.D. Musetsho; investigation, K.D. Musetsho; resources, K.D. Musetsho.; data curation, K.D. Musetsho.; writing—original draft preparation, K.D. Musetsho.; writing—review and editing, K.D. Musetsho, M. Chitakira, M Botha.; visualization, K.D. Musetsho, M Botha.; supervision, M Chitakira.; project administration, K.D. Musetsho. All authors have read and agreed to the published version of the manuscript.
Funding
The study was funded from the Postdoctoral Fellowship grant awarded by the University of South Africa.
Acknowledgments
The following are acknowledged for the various roles they played: The University of South Africa, for the Postdoctoral Fellowship award. Naledzi Environmental Consultants (Pty) Ltd., for technical input. Rinae Tsedu for assistance with GIS Mapping. Dr A Chikobvu, for assisting with statistical analysis. Tshifudi, Tshitavha, Tshaulu, Mahunguwi, Sambandou and Thohoyandou villages participants and Mphaphuli Traditional Authority for permission to study
Conflicts of Interest
The authors declare no conflict of interest.
Patents
This research does not have patents.
References
- Ballut-Dajud, G.A.; Herazo, L.C.S.; Fernández-Lambert, G.; Marín-Muñiz, J.L.; Méndez, M.C.L.; Betanzo-Torres, E.A. Factors Affecting Wetland Loss: A Review. Land 2022, 11, 434. [Google Scholar] [CrossRef]
- Macfarlane DM, Ollis DJ, Kotze DC. WET-Health (Version 2.0) A refined suite of tools for assessing the present ecological state of wetland ecosystems - Technical Guide Report to the Water Research Commission [Internet]. 2020. Available online: www.wrc.org.
- Duku, E.; Mattah, P.A.D.; Angnuureng, D.B. Assessment of wetland ecosystem services and human wellbeing nexus in sub-Saharan Africa: Empirical evidence from a socio-ecological landscape of Ghana. Environ. Sustain. Indic. 2022, 15. [Google Scholar] [CrossRef]
- Esposito, M.; Tse, T. DRIVE: The Five Megatrends that Underpin the Future Business, Social, and Economic Landscapes. Thunderbird Int. Bus. Rev. 2017, 60, 121–129. [Google Scholar] [CrossRef]
- Uhrqvist, O.; Linnér, B.-O. Narratives of the past for Future Earth: The historiography of global environmental change research. Anthr. Rev. 2015, 2, 159–173. [Google Scholar] [CrossRef]
- Bunyangha, J.; Majaliwa, M.J.; Muthumbi, A.; Gichuki, N.; Egeru, A. Past and future land use/land cover changes from multi-temporal Landsat imagery in Mpologoma catchment, eastern Uganda. Egypt. J. Remote. Sens. Space Sci. 2021, 24, 675–685. [Google Scholar] [CrossRef]
- Herbert, E.R.; Boon, P.; Burgin, A.J.; Neubauer, S.C.; Franklin, R.B.; Ardón, M.; Hopfensperger, K.N.; Lamers, L.P.M.; Gell, P. A global perspective on wetland salinization: ecological consequences of a growing threat to freshwater wetlands. Ecosphere 2015, 6, 1–43. [Google Scholar] [CrossRef]
- Kreplin, H.N.; Ferreira, C.S.S.; Destouni, G.; Keesstra, S.D.; Salvati, L.; Kalantari, Z. Arctic wetland system dynamics under climate warming. WIREs Water 2021, 8, e21526. [Google Scholar] [CrossRef]
- Were, D.; Kansiime, F.; Fetahi, T.; Cooper, A.; Jjuuko, C. Carbon Sequestration by Wetlands: A Critical Review of Enhancement Measures for Climate Change Mitigation. Earth Syst. Environ. 2019, 3, 327–340. [Google Scholar] [CrossRef]
- Aber, J.S.; Pavri, F.; Aber, S.W. Wetland environments: A Global Perspective; Wiley: Hoboken, NJ, United States, 2012. [Google Scholar]
- Cheng, Q.; Zhou, L.; Wang, T. Assessment of ecosystem services value in Linghekou wetland based on landscape change. Environ. Sustain. Indic. 2022, 15. [Google Scholar] [CrossRef]
- Thamaga, K.H.; Dube, T.; Shoko, C. Advances in satellite remote sensing of the wetland ecosystems in Sub-Saharan Africa. Geocarto Int. 2021, 37, 5891–5913. [Google Scholar] [CrossRef]
- Sinthumule, N.I.; Netshisaulu, K.H. Wetland Resource Use and Conservation Attitudes of Rural vs. Urban Dwellers: A Comparative Analysis in Thohoyandou, Limpopo Province, South Africa. Water 2022, 14, 1290. [Google Scholar] [CrossRef]
- Dalu, T.; Chauke, R. Assessing macroinvertebrate communities in relation to environmental variables: the case of Sambandou wetlands, Vhembe Biosphere Reserve. Appl. Water Sci. 2019, 10, 16. [Google Scholar] [CrossRef]
- Bagstad, K.J.; Villa, F.; Batker, D.; Harrison-Cox, J.; Voigt, B.; Johnson, G.W. From theoretical to actual ecosystem services: mapping beneficiaries and spatial flows in ecosystem service assessments. Ecol. Soc. 2014, 19. [Google Scholar] [CrossRef]
- Lu, C.; Ren, C.; Wang, Z.; Zhang, B.; Man, W.; Yu, H.; Gao, Y.; Liu, M. Monitoring and Assessment of Wetland Loss and Fragmentation in the Cross-Boundary Protected Area: A Case Study of Wusuli River Basin. Remote. Sens. 2019, 11, 2581. [Google Scholar] [CrossRef]
- Harmáčková, Z.V.; Vačkář, D. Modelling regulating ecosystem services trade-offs across landscape scenarios in Třeboňsko Wetlands Biosphere Reserve, Czech Republic. Ecol Modell. 2015;295:207–15.
- Jaramillo, F.; Desormeaux, A.; Hedlund, J.; Jawitz, J.W.; Clerici, N.; Piemontese, L.; Rodríguez-Rodriguez, J.A.; Anaya, J.A.; Blanco-Libreros, J.F.; Borja, S.; et al. Priorities and Interactions of Sustainable Development Goals (SDGs) with Focus on Wetlands. Water 2019, 11, 619. [Google Scholar] [CrossRef]
- Seifollahi-Aghmiuni, S.; Nockrach, M.; Kalantari, Z. The Potential of Wetlands in Achieving the Sustainable Development Goals of the 2030 Agenda. Water 2019, 11, 609. [Google Scholar] [CrossRef]
- Kåresdotter, E.; Destouni, G.; Ghajarnia, N.; Hugelius, G.; Kalantari, Z. Mapping the Vulnerability of Arctic Wetlands to Global Warming. Earth's Futur. 2021, 9. [Google Scholar] [CrossRef]
- Thorslund, J.; Jarsjo, J.; Jaramillo, F.; Jawitz, J.W.; Manzoni, S.; Basu, N.B.; Chalov, S.R.; Cohen, M.J.; Creed, I.F.; Goldenberg, R.; et al. Wetlands as large-scale nature-based solutions: Status and challenges for research, engineering and management. Ecol. Eng. 2017, 108, 489–497. [Google Scholar] [CrossRef]
- Ferreira, C.S.; Kašanin-Grubin, M.; Solomun, M.K.; Sushkova, S.; Minkina, T.; Zhao, W.; Kalantari, Z. Wetlands as nature-based solutions for water management in different environments. Curr. Opin. Environ. Sci. Heal. 2023, 33. [Google Scholar] [CrossRef]
- hlén, I.; Vigouroux, G.; Destouni, G.; Pietroń, J.; Ghajarnia, N.; Anaya, J.; et al. Hydro-climatic changes of wetlandscapes across the world. Sci Rep. 2021, 11. [Google Scholar]
- Ollis, D.J.; Day, J.A.; Mbona, N.; Dini, J.A. South African wetlands: Classification of ecosystem types. In: The Wetland Book: I: Structure and Function, Management, and Methods. 2018.
- Kotze, D.; Macfarlane, D.; Mander, M.; Collins, N.; Texeira-Leite, A.; Lagesse, J.; et al. WET-EcoServices (Version 2) A technique for rapidly assessing ecosystem services supplied by wetlands and riparian areas FINAL REPORT With contributions from: EXECUTIVE SUMMARY Background and aims of the project. 2020.
- Everard, M.; Noble, D. The development of bird indicators for British fresh waters and wetlands. Aquat. Conserv. Mar. Freshw. Ecosyst. 2010, 20, S117–S124. [Google Scholar] [CrossRef]
- Andersson, E.; Borgström, S.; Mcphearson, T.; Barkdull, J.; Harris, P.G.; Baumgärtner, S.; et al. Natural assurance schemes : moving earlier in the risk management cycle with nature based solutions and strategies. Sustain. 2019, 11. [Google Scholar]
- Sinthumule, N.I.; Mudau, N.V. Participatory approach to flood disaster management in Thohoyandou. Jamba J Disaster Risk Stud. 2019. [CrossRef] [PubMed]
- Pantshwa, A.O.; Buschke, F.T. Ecosystem services and ecological degradation of communal wetlands in a South African biodiversity hotspot. R. Soc. Open Sci. 2019, 6, 181770. [Google Scholar] [CrossRef] [PubMed]
- Phethi, M.D.; Gumbo, J.R. Assessment of impact of land use change on the wetland in Makhitha village, Limpopo province, South Africa. Jamba-Journal Disaster Risk Stud. 2019, 11, 6. [Google Scholar] [CrossRef] [PubMed]
- Nephawe, M. Assessment of the impacts of land use changes on Duthuni wetland system using remote sensing, GIS and social survey, A case in Limpopo Province, South Africa. University of Venda; 2017.
- Libala, N.; Odume, O.N.; Palmer, C.G. Engaging communities towards restoring hillslope seep wetlands in the Tsitsa River catchment of South Africa. Anthropocene 2022, 39. [Google Scholar] [CrossRef]
- Skowno, A.L.; Poole, C.J.; Raimondo, D.C.; Sink, K.J.; Van Deventer, H.; Van Niekerk, L.; et al. National Biodiversity Assessment 2018: The status of South Africa’s ecosystems and biodiversity. Synthesis report. [Internet]. South African National Biodiversity Institute, an entity of the Department of Environment, Forestry and Fisheries. 2019 [cited 2022 Jul 25]. Available from: http://hdl.handle.net/20.500. 1214. [Google Scholar]
- Van Deventer, H.; Smith-Adao, L.; Petersen, C.; Mbona, N.; Skowno, A.; Nel, J.L. Review of available data for a South African Inventory of Inland Aquatic Ecosystems (SAIIAE). Water SA 2018, 44, 184–199. [Google Scholar] [CrossRef]
- Mathivha, F.I.; Kundu, P.M.; Singo, L.R. The impacts of land cover change on stream discharges in Luvuvhu River Catchment, Vhembe District, Limpopo Province, South Africa. WIT Trans Built Environ. 2016, 165, 259–270. [Google Scholar] [CrossRef]
- Gopal, B. Rapid Assessment of Wetland Ecosystem Services. Apn-GcrOrg [Internet]. 2013;121–34. Available online: http://www.apn-gcr.org/resources/files/original/3308156e2fdda35fca961c5c05f7989e.
- Karstens, S.; Inácio, M.; Schernewski, G. Expert-Based Evaluation of Ecosystem Service Provision in Coastal Reed Wetlands Under Different Management Regimes. Front. Environ. Sci. 2019, 7. [Google Scholar] [CrossRef]
- Le Maitre D, Seyler H, Holland M, Smith-Adao L, Maherry A, Nel J, et al. Identification, Delineation and Importance of the Strategic Water Source areas of South Africa, Lesotho and Swaziland for surface and groundwater. Pretoria; 2018.
- Nepfumbada, M.; Seetal, A. National water security framework for South Africa : Summary, principles and recommendations. Pretoria; 2020.
- StatsSA Statistical Release 2022 - P0301.4 [Internet]. Pretoria; 2022. Available from: www.statssa.gov.
- Statistics South Africa (Stats SA). Living Conditions of Households in South Africa: An analysis of household expenditure and income data using the LCS 2014/2015 [Internet]. Statistical release P0310. 2017 [cited 2022 Jul 25]. Available from: http://www.statssa.gov.za/P0310/P03102014.
- Reddy, S. Suggested farming systems and associated risks over southern Mozambique. Comunicação No. 24, Série Terra e Água, INIA. Maputo [Internet]. Maputo, Mozambique: Do Instituto Nacional de Investigacao Agronomica; 1985. p. 1–222. Available from: https://edepot.wur. 4797. [Google Scholar]
- Lombaard, J.; Badenhorst, D.; Van Schalkwyk, A. To line or not to line - New methodology applied to the Noordoewer/Vioolsdrift Dam spillway. In: Paper presented at the 26th International Congress on Large Dams, Vienna 1-7 July. Vienna: CRC Press/Balkema; 2018. pp. 760–74.
- Gray, D.E. Sampling strategy. SAGE. London, UK: SAGE Publications; 2014.
- Jugessur, Y.S.M.F. Reliability and Internal Consistency of data : Significance of Calculating Cronbach ’ s Alpha Coefficient in Educational Research. Int J Humanit Soc Sci Invent. 2022;11(4).
- Musetsho, K.D.; Chitakira, M.; Nel, W. Mapping Land-Use/Land-Cover Change in a Critical Biodiversity Area of South Africa. Int. J. Environ. Res. Public Heal. 2021, 18, 10164. [Google Scholar] [CrossRef]
- Toro, R.; Peña-Sarmiento, M.; Avendaño-Prieto, B.L.; Mejía-Vélez, S.; Bernal-Torres, A. Empirical Analysis of Cronbach’s Alpha Coefficient as a Function of Question Response Options, Sample Size and Outliers. Rev Iberoam Diagnostico y Eval Psicol. 2022, 63. [Google Scholar]
- Ravinder, E.B.; Saraswathi, A.B. Literature Review Of Cronbachalphacoefficient (A) And Mcdonald’s Omega Coefficient (Ω). Eur J Mol Clin Med. 2020, 07. [Google Scholar]
- Wakelin, K.J.; McAra-Couper, J.; Fleming, T.; Erlam, G.D. A process for assessing the reliability and validity of questions for use in online surveys: Exploring how communication technology is used between Lead Maternity Carer midwives and pregnant people in Aotearoa New Zealand. Methodol. Innov. 2023, 16, 91–101. [Google Scholar] [CrossRef]
- Cowling, N. Statista. 2023 [cited 2023 Nov 2]. National poverty line in South Africa 2023. Available online: https://www.statista. 1127. [Google Scholar]
- Acreman, M.C.; Harding, R.J.; Lloyd, C.; McNamara, N.P.; Mountford, J.O.; Mould, D.J.; Purse, B.V.; Heard, M.S.; Stratford, C.J.; Dury, S.J. Trade-off in ecosystem services of the Somerset Levels and Moors wetlands. Hydrol. Sci. J. 2011, 56, 1543–1565. [Google Scholar] [CrossRef]
Figure 1.
Location map of the study area.
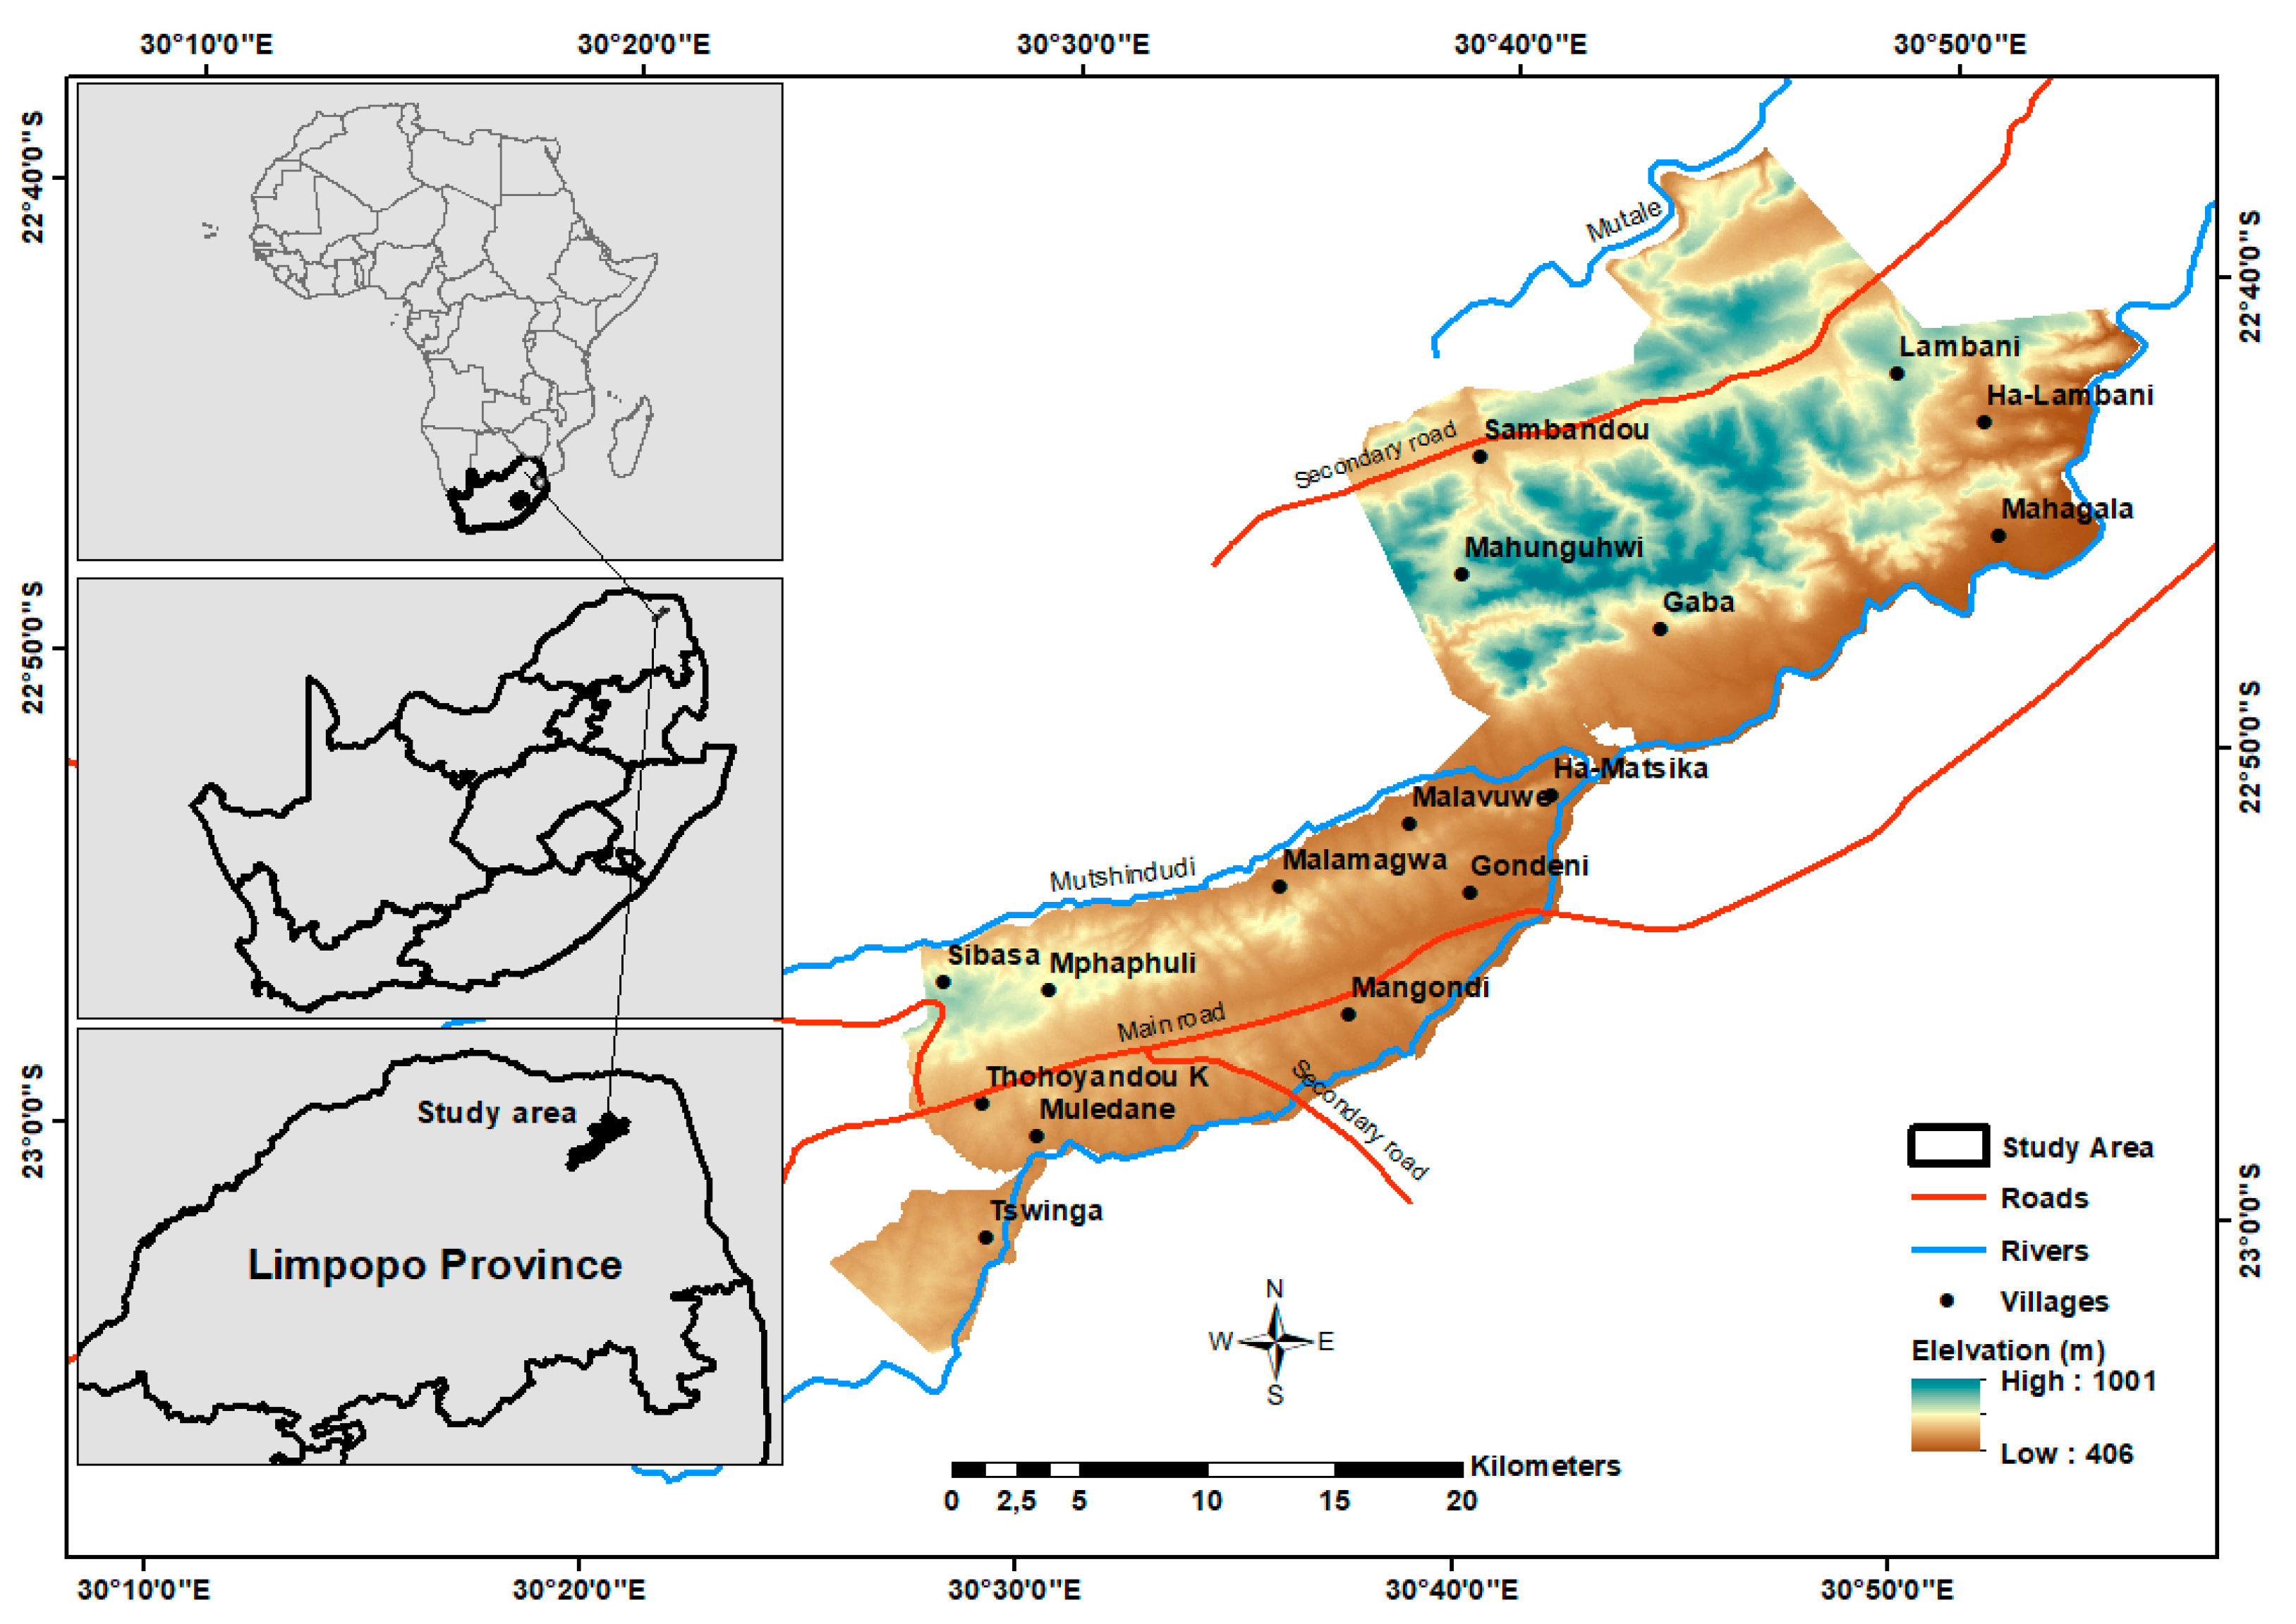
Figure 2.
Images of Infrastructure damaged.
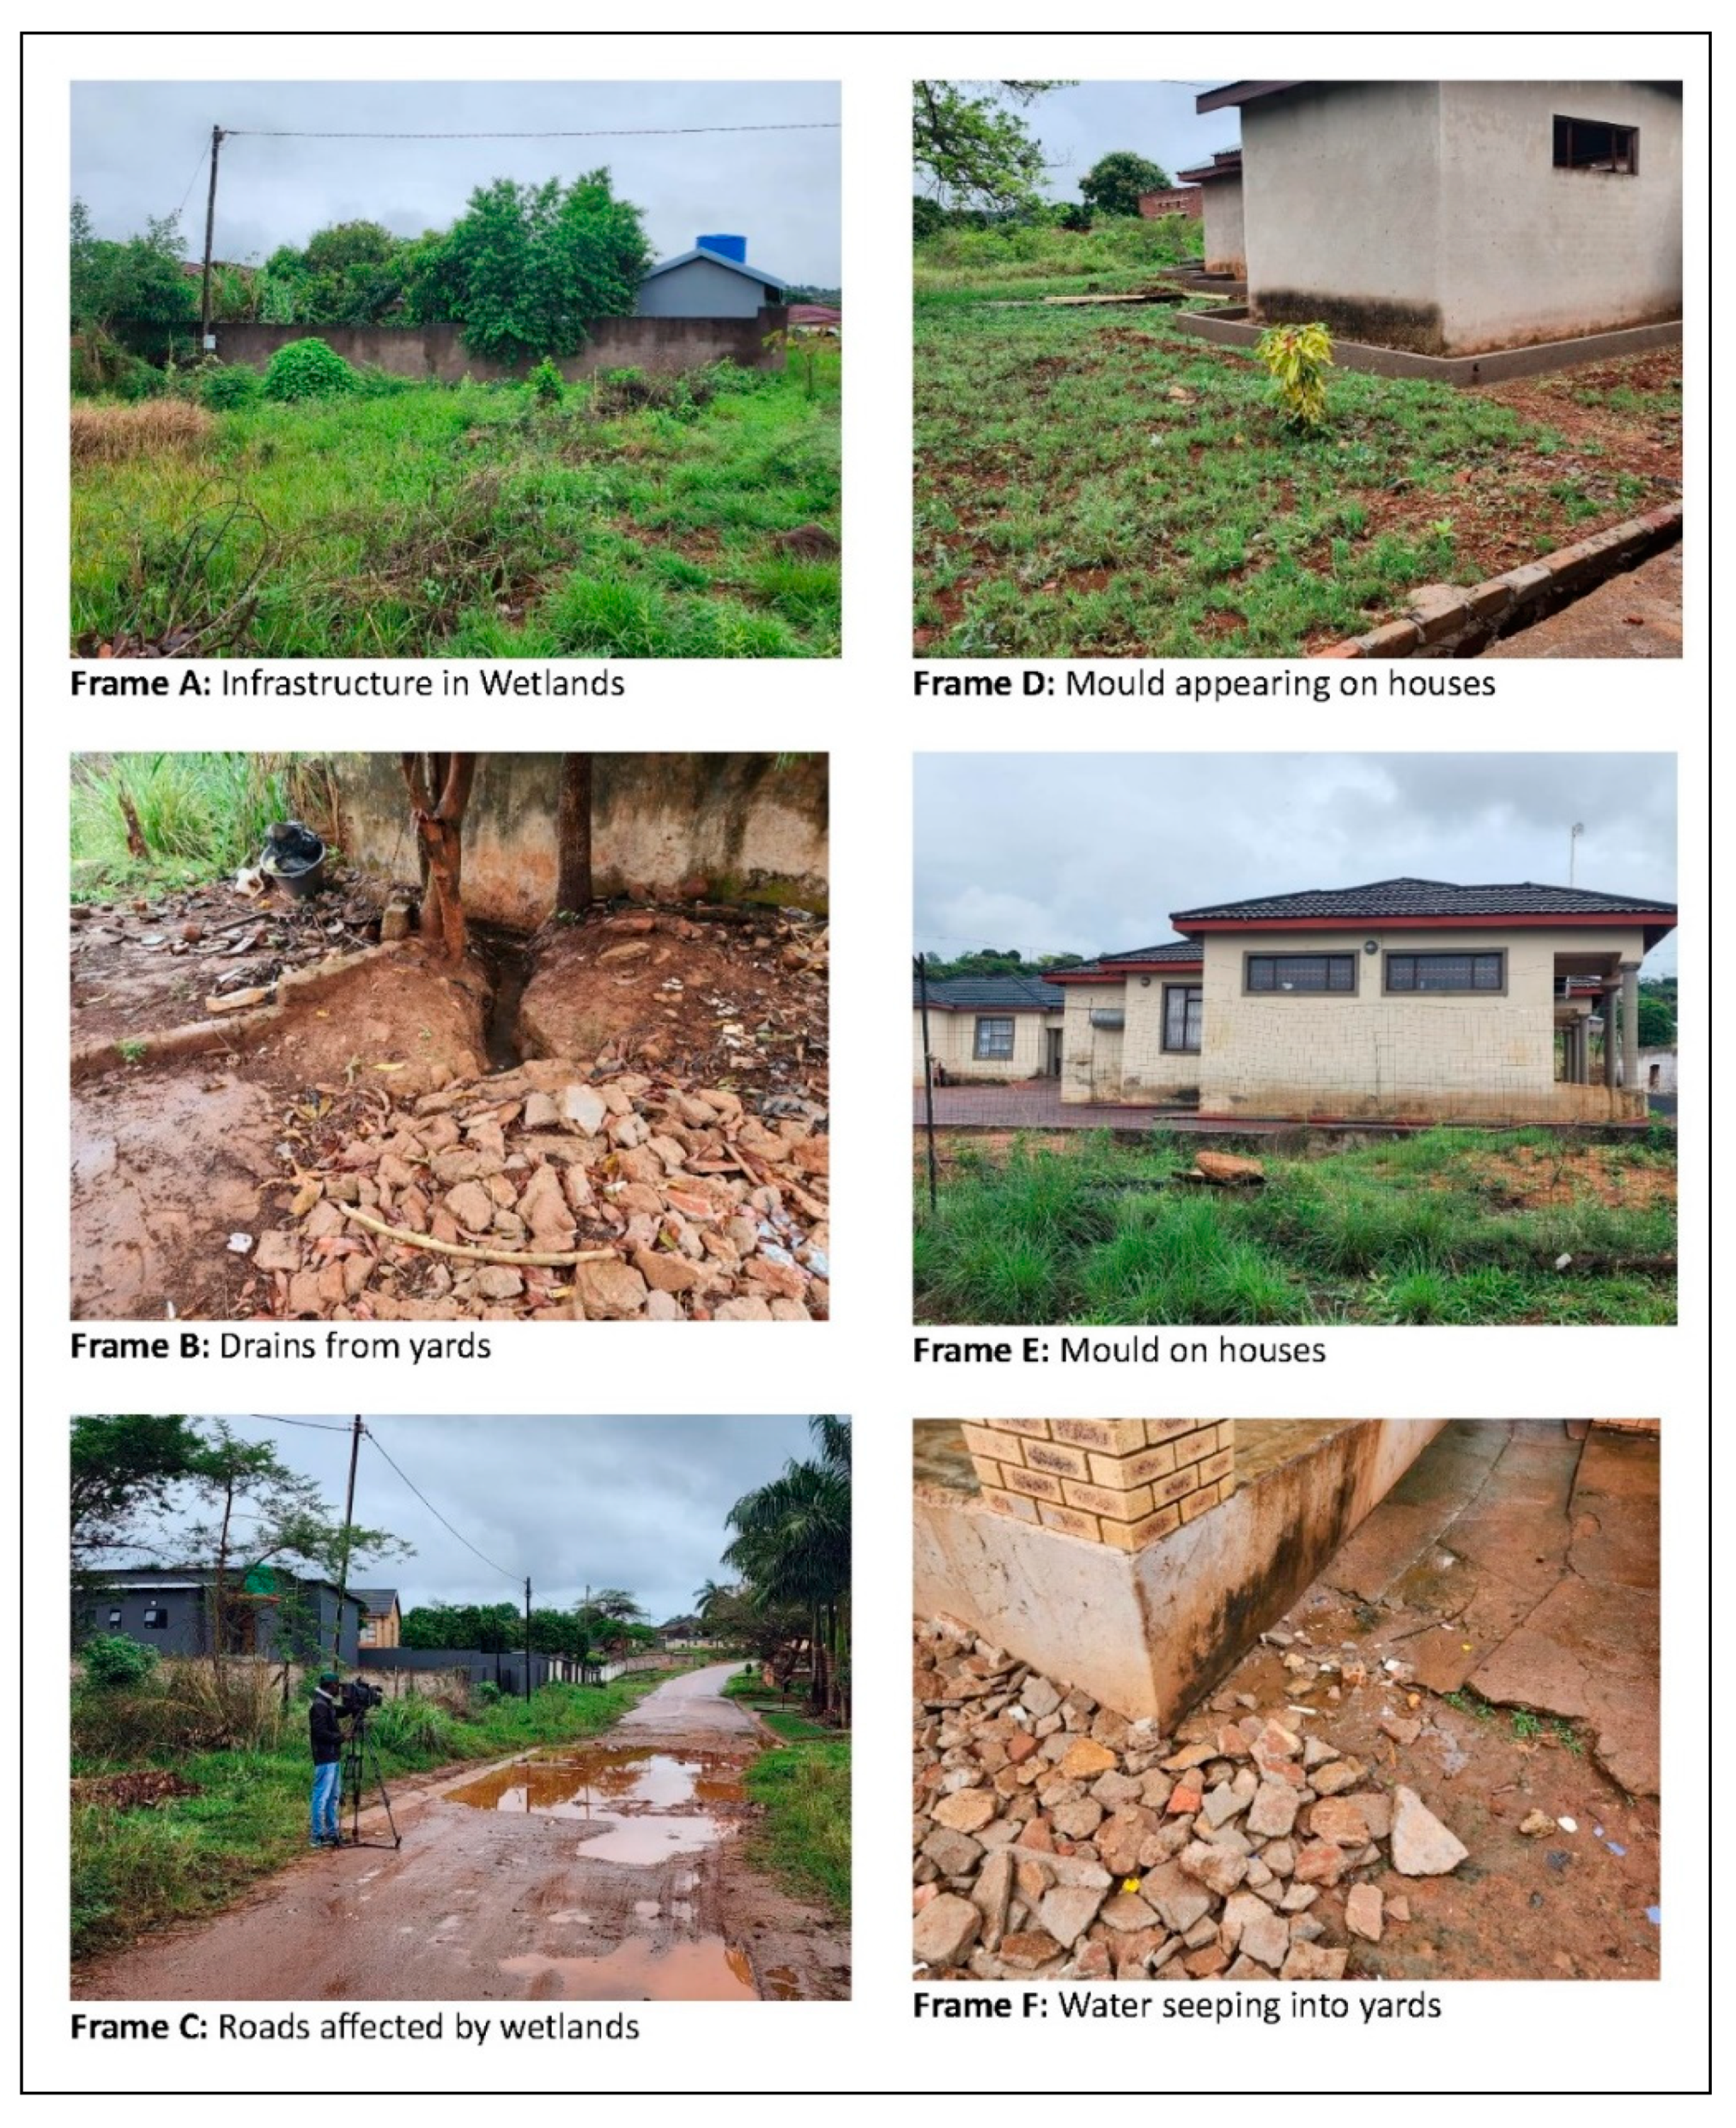
Figure 3.
Sediment trapping as a benefit for the villages.
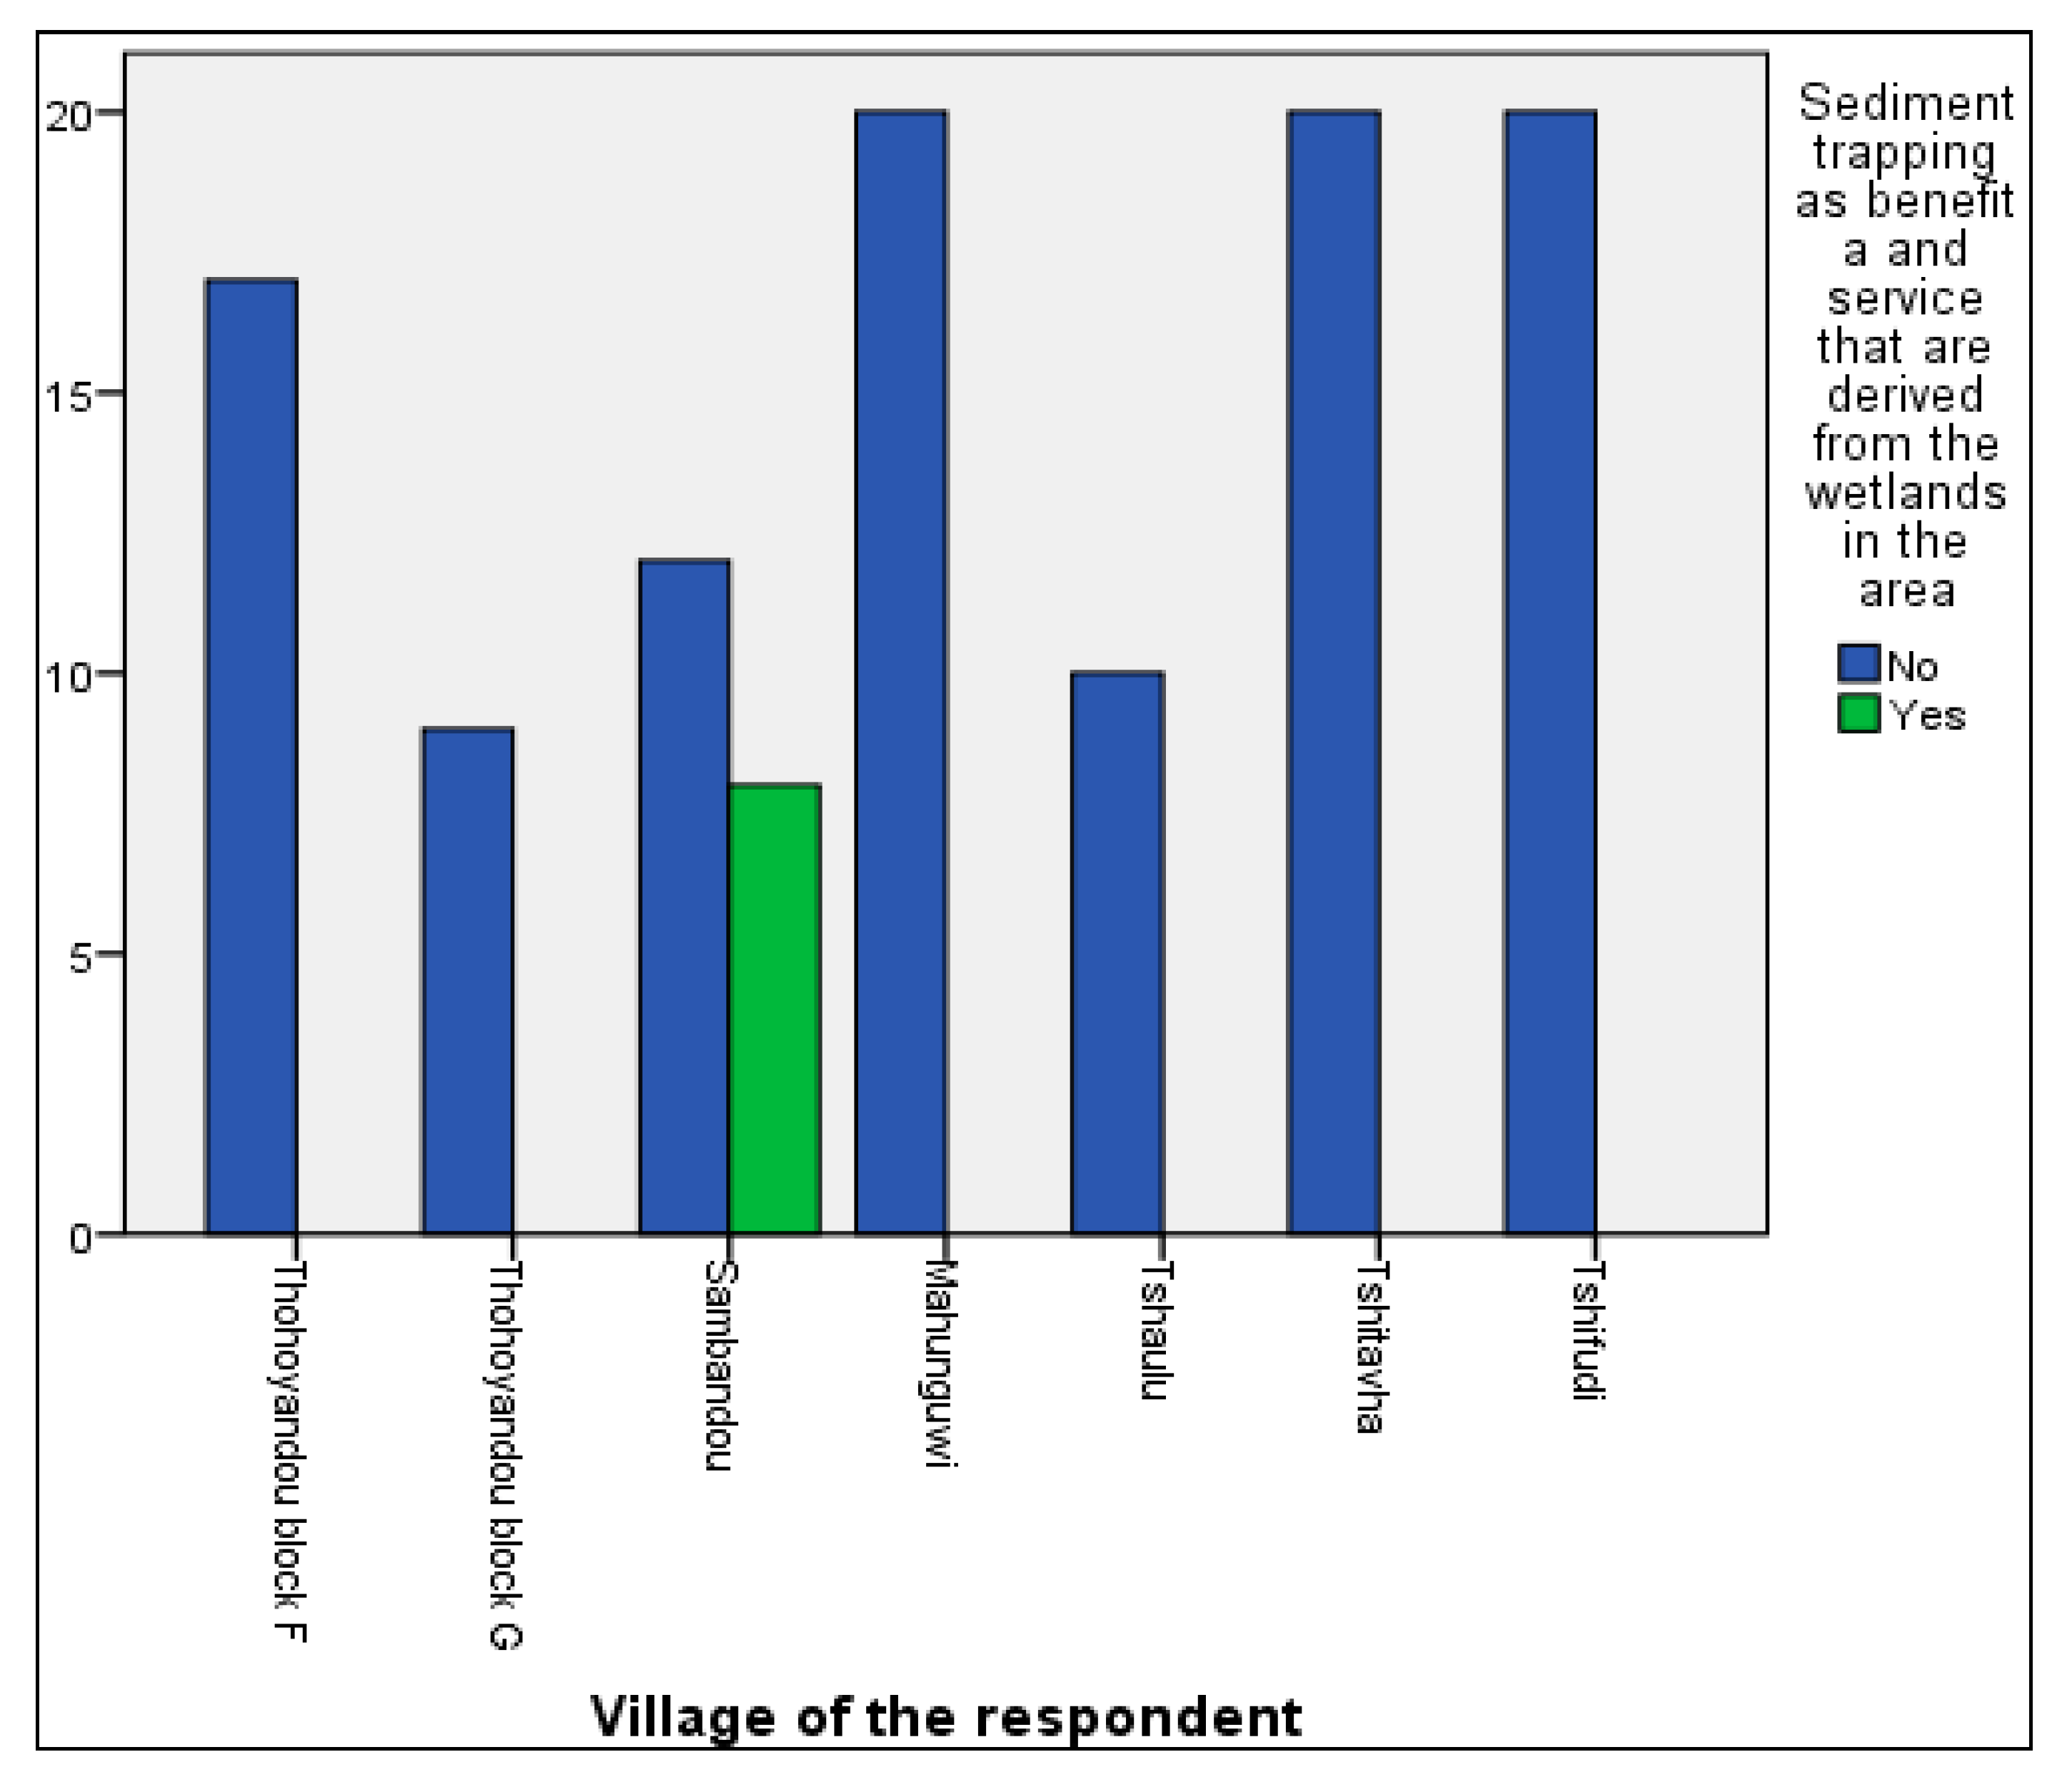
Figure 4.
Sediment trapping as a benefit and service from wetlands.
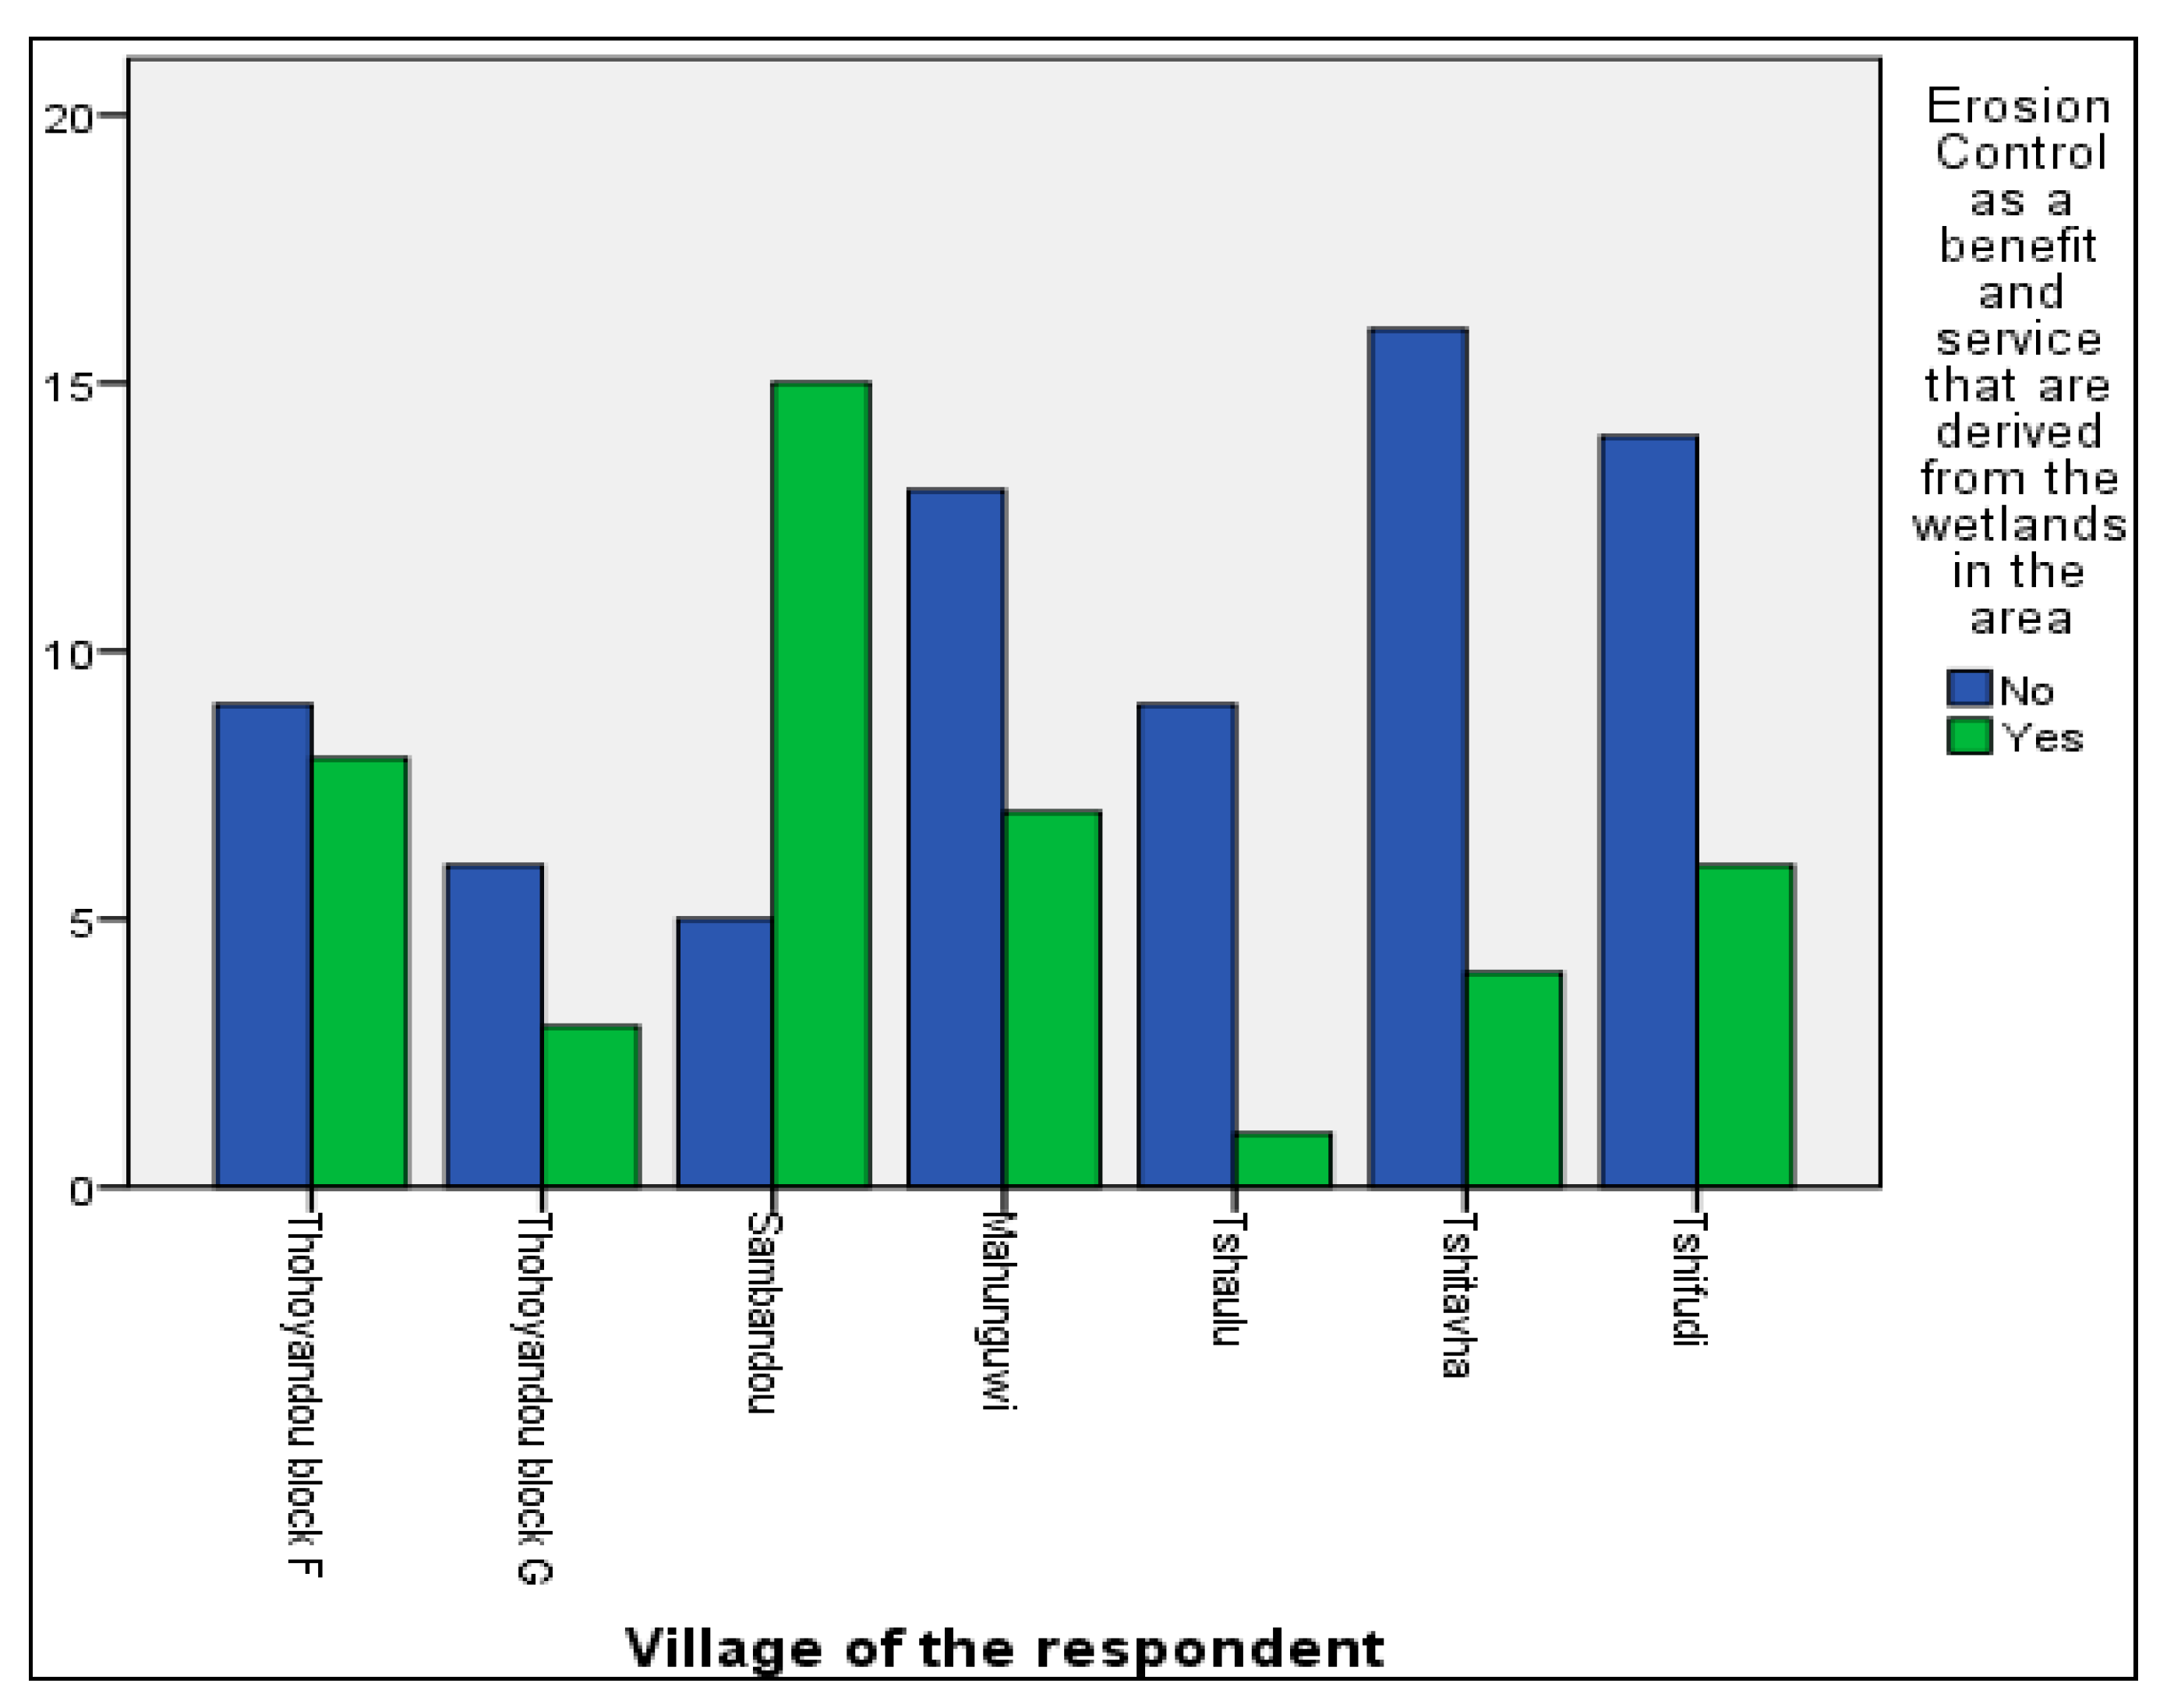
Figure 5.
Carbon Storage as a service or benefit in the area.
Disclaimer/Publisher’s Note: The statements, opinions and data contained in all publications are solely those of the individual author(s) and contributor(s) and not of MDPI and/or the editor(s). MDPI and/or the editor(s) disclaim responsibility for any injury to people or property resulting from any ideas, methods, instructions or products referred to in the content. |
© 2024 by the author. Licensee MDPI, Basel, Switzerland. This article is an open access article distributed under the terms and conditions of the Creative Commons Attribution (CC BY) license (https://creativecommons.org/licenses/by/4.0/).
Copyright: This open access article is published under a Creative Commons CC BY 4.0 license, which permit the free download, distribution, and reuse, provided that the author and preprint are cited in any reuse.


