
Submitted:
14 November 2023
Posted:
15 November 2023
You are already at the latest version
Abstract
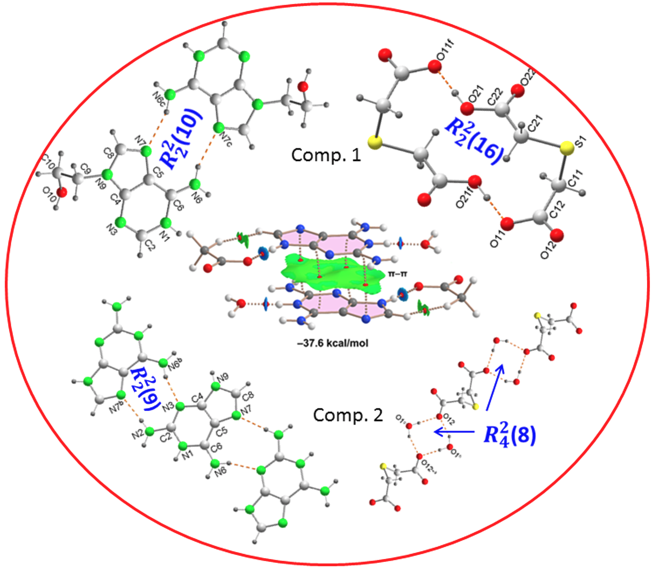
The synthesis and characterization of the multicomponent crystals formed by 2,2’-thiodiacetic acid (H2tda) and 2,6-diaminopurine (Hdap) or N9-(2-hydroxyethyl)adenine (9heade) are reported. The crystals are in the salt rather than cocrystal form, as witnessed by single crystal X-ray diffractometry where a structural analysis revealed their ionic nature, confirming the proton transfer from the 2,2’-thiodiacetic acid to the basic groups of the coformers. The new multicomponent crystals have molecular formulas [(H9heade+)(Htda)] (1) and [(H2dap+)2(tda2)]·2H2O (2), and were also characterized by FTIR, elemental analysis as well as thermogravimetric/differential scanning calorimetry (TG/DSC) analyses. In the crystal packing the ions interact with each other via O–H···N, O–H···O. N–H···O and N–H···N hydrogen bonds generating cyclic hydrogen bonded motifs with graph-set notation of R22(16), R22(10), R32(10), R33(10), R22(9), R32(8) and R42(8), to form different supramolecular homo- and hetero-synthons. In addition, in the crystal packing of 2, pairs of diaminopurinium ions display an strong anti-parallel ,-stacking interaction, with short inter-centroids and interplanar distances (3.39 and 3.24 Å respectively) and fairly tight angle (17.5°). These assemblies have been further analyzed energetically by using DFT calculations, MEP surface analysis and QTAIM characterization.
Keywords:
2
; 2’-thiodiacetic acid
; 6-diaminopurine
; N9-(2-hydroxyethyl)adenine
; crystal structures
; molecular salts
; proton transfer prediction
1. Introduction
The final objective of the so-called crystal synthesis is the preparation of crystals by design, for which it is necessary to understand the structure-property relationships, as well as the ability to control the molecular assembly in the programmed structure, for which it must be taken into account the contribution, both to the final structure and its properties, of inter- and intra-molecular interactions based specifically on hydrogen bonds and π−π stacking interactions, among others [1]. In this context, crystal engineering and covalent synthesis based on supramolecular synthons are essential tools for the design and synthesis of multicomponent crystals, which from a scientific point of view can be classified into solvates, salts and co-crystals. [2]. Along these lines, in the rational design of co-crystals or molecular salts, particularly in multicomponent crystals that contain acidic and basic constituents and where hydrogen bond interactions are present, an empirical rule is usually applied by which it is established that when ΔpKa = [pKa(base)-pKa(acid)] > 4, the process almost always leads to the formation of salts, if ΔpKa < −1 then co-crystals will probably form, while when ΔpKa is between −1 and 4, in principle, either of the two systems is possible. [3], this is what is called salt-co-crystal continuum [4]
Numerous organic acids are very frequently used in the preparation of multicomponent crystals, especially as pharmaceutical co-crystal formers [5], but not always for that purpose. On the other hand, numerous organosulfur derivatives constitute an important tool in the study of many materials [6], so that a conjunction between both types of functional groups can offer new coformers for the synthesis of new solid forms as an important method to modify the physicochemical properties of functional organic materials, given that the crystalline form of a compound confers important properties to said materials and can modify the thermal and mechanical stability of the crystal. Along these lines, it is worth remembering that the C-S bond is present in many natural products, drugs, proteins and advanced materials [7], so compounds that contain carboxylic groups and some thioether functional group with C-S-C connectivity can be attractive in the crystal synthesis by design.
2,2’-Thiodiacetic acid (H2tda) is a versatile dicarboxylic organosulfur compound that has been studied using its multidentate coordination and chelating capacity against many transition metals, and some have been found to be potent antibacterial and cytotoxic agents. [8]. But the synthesis of multicomponent crystals with this acid is very little studied. Molecular crystals are known in a 1:1 ratio with 1,7-phenanthroline [9], iso-nicotinamide [10], 4,4'-bipyridyl [11,12] and trans-1,2-bis(4-pyridyl) ethylene [13]. However, to date, only charge transfer complexes of thiodiacetic acid with ethylenediamine and o-phenylenediamine have been described. [14].
In the present article, 2,2′-thiodiacetic acid (H2tda) has been selected as a multicomponent crystal former to be combined with two purine derivatives, N9-(2-hydroxyethyl)adenine (9heade) and 2,6-diaminopurine (Hdap, also known as 2-aminoadenine) (Figure 1), through non-covalent hydrogen bonds. These organic molecules have several hydrogen atoms that can be donated and five atoms each, with the possibility of behaving as hydrogen bond acceptors.
9heade is a synthetic purine nucleoside that in form of 2’-phosphonates long time ago have proved to be display a moderate antitumor activity [15]. The actual trend in this context is supported on the well documented idea that such nucleotide analogs are excellent templates for the drug design because of the absence of the labile glycosidic bond (as well as the stability of the phosphonate moiety) can prevent its easily enzymatically or chemically hydrolysis. In such connection a recent advances have proved that Acyclic nucleoside phosphonates with adenine nucleobase inhibit Trypanosoma brucei adenine phosphoribosyltransferase in vitro [16].
On the other hand, it is well known that Hdap has a broad pharmaceutical interest because enzymatic oxidative deamination’s convert it in guanine [17]. That opens possibilities to use prodrug for relevant antiviral drugs, such as acyclovir, penciclovir or entecavir. Moreover very recent advances link Hdap with key stages to understand the origin of life in anaerobic conditions with abundant UV radiation, by means of the formation of functional photostable RNA/DNA oligomers [18].
In this context, the objective of this study is to prepare, characterize and obtain information on the protonation state of multicomponent crystals formed by H2tda with 9heade and Hdap. To better understand the characteristics of the crystalline products, they were analyzed by FTIR spectroscopy and single-crystal X-ray diffraction, and their stability was studied by Differential scanning calorimetry (DSC) and Thermogravimetric analysis (TGA). Furthermore, the role of inter− and intra−molecular interactions were also quantified energetically by using Density functional theory (DFT) calculations, Molecular Electrostatic Potential (MEP) surface analysis and “Atoms in molecules" theory (QTAIM) characterization.
2. Materials and Methods
All reagents were purchased from Aldrich or TCI and used without any further purification. Analytical grade solvents were used for the crystallization experiments.
2.1. Instrumentation
Elemental analyses for carbon, hydrogen, nitrogen and sulphur were performed with a Fisons-Carlo Erba 1108 microanalyser (Elemental Microanalysis Ltd, Okehampton, Devon, EX20 1UB, UK). The FT-IR spectra were recorded as KBr pellets (4000–400 cm–1) on a Jasco FT-IR 6300 spectrophotometer (Jasco Analítica, Madrid, Spain). TGA experiments were carried out on a Shimadzu Thermobalance TGADTG-50H Instrument from room temperature to 950 °C in a flow of air (100 mL min–1) and series of ~35 time-spaced FT-IR spectra per sample (also carried out for the own reagents) of evolved gasses were recorded using a coupled FT-IR Nicolet Magna 550 spectrophotometer (Thermo Fisher Scientific Inc., Waltham, MA, USA). Differential scanning calorimetry (DSC) measurement was recorded for the samples (6.460 mg, 1; 7.036 mg, 2) on a DSC-SHIMADZU mod. DSC-50Q instrument (Shimadzu Europe, F.R. Germany GbmH,) under an N2 atmosphere, at 26-400 °C (heating rate 10 °C/min). .
2.2. Single-Crystal X-ray Diffraction
Diffraction data were obtained using a Bruker D8 VENTURE PHOTON III-14 diffractometer from crystals mounted on glass fibres. Data were corrected for Lorentz and polarization effects and for absorption following multi-scan type [19].
The structures were solved by direct methods [20], which revealed the positions of all non-hydrogen atoms. These were refined on F2 by a full-matrix least-squares procedure using anisotropic displacement parameters [20]. Hydrogen atoms were located in the difference maps and the positions of O–H and N–H hydrogen atoms were refined (other ones were included as riders). Isotropic displacement parameters of H atoms were constrained to 1.2/1.5 Ueq of the carrier atoms. Molecular graphics were generated with DIAMOND software [21]. Crystal data, experimental details and refinement results are summarized in Table 1.
2.3. Preparation of crystals 1 and 2.
Water solutions (50 mL) of 9Heade (15.7 mg, 0.1 m mol) with H2tda (16.6 mg, 0.1 m mol) or Hdap (22.2 mg, 0.1 m mol) with H2tda (16.6 mg, 0.1 mmol), was kept at room temperature. Upon slow evaporation of the solvent about 5 days, colourless crystals 1–2 were obtained, respectively.
2.3.1. Crystals of [(H9Heade+)(Htda–)] (1)
Yield: 80% based on 9heade. IR (KBr, Pellet cm–1): 3347(s), 3386(s), 3076(s), 2990(w), 2960+2933(m), 2874(m), 2687+2361(vw), 1961+1815(w), 1702(s), 1672(s), 1618(m), 1548(w), 1410(s), 1281(s), 1382(m), 1236(s), 1071(s), 872(s). Anal. calcd. for C11H15N5O5S (329.34): C, 40.12; H, 4.59; N, 21.26; S, 9.74; found C, 40.92; H, 5.05; N, 21.73; S, 9.52%.
2.3.2. Crystals of [(Hdap+)2(tda2–)]·2H2O (2)
Yield: 85%. IR (KBr Pellet, cm–1): 3448(s), 3320(sh), 3209(br), 3071(s), 2973 (br), 2896(br), a series of 7 or more weak peaks at 2800-2250(w), 1697(s), 1653(m), 1627(m), 1598(s), 1577(sh), 1558(sh), 1508(sh), 1390(s), 940(s), 882 and/or 865(w) Anal. calcd. for C14H22N12O6S (486.49): C, 34.56; H, 4.56; N, 34.55; S, 6.59; found C, 35.35; H, 4.73; N, 34.10; S, 6.44%.
2.4. DFT calculations
The energetic analysis of the hydrogen bonding and π-π stacking interactions were performed using the Gaussian-16 [22] and the PBE0-D3/def2-TZVP level of theory [23,24]. The crystallographic coordinates were used to estimate the interactions in the solid state. The π-π stacking interaction in 2 was computed by calculating the difference between the energies of isolated monomers and their assembly. The binding energies were evaluated with correction for the basis set superposition error (BSSE) by using the Boys–Bernardi method [25]. The Bader’s "Atoms in molecules" theory (QTAIM) [26] was used to study and estimate the association energies of the H-bonding interactions discussed below by means of the AIMAll calculation package [27]. The molecular electrostatic potential surfaces (isosurface 0.001 a.u.) were computed using the Gaussian-16 software [22].
To analyze the nature of interactions in terms of being attractive or repulsive and revealed them in real space, we have used NCIPLOT visualization index that plots the reduced density gradient (RDG) regions [28] derived from the electronic density (ρ) [29]. The sign of the second Hessian eigenvalue (λ2) multiplied by the electron density [i.e. sign(λ2) ρ in atomic units] is used to the identification of attractive/stabilizing (blue-green coloured isosurfaces) or repulsive (yellow-red coloured isosurfaces) interactions using 3D-Plots. The NCIplot index parameters used in this manuscript are: RGD = 0.5; ρ cut off = 0.04 a.u.; color range: –0.04 a.u. ≤ sign(λ2) ρ ≤ 0.04 a.u.
3. Discussion and Results
The crystallization processes have been carried out considering the pKa values for each of the components. These values have been 4.12, predicted for H9heade+ [30], 4.98 for H2dap+ [31] and 3.13 for H2tda [32]. According to the pKa rule, the respective ΔpKa values [pKa(protonated base)–pKa(acid)] were 0.99 for (9heade)/(H2tda) and 1.85 for (Hdap)/(H2tda), placing them clearly within the salt-cocrystal continuum. Based on experimental data of salts/cocrystals extracted from the CSD [33], it has been commented that in the region of the salt-cocrystal continuum the probability of formation of a salt follows the empirical trend:
Pobs(salt, %) = 17×ΔpKa + 28
Accordingly, if applied to the systems now studied, the probability of proton transfer turns out to be 44.8% for 9heade/H2tda and 59.5% for the Hdap/H2tda system. Operating within this range may allow access to charged or neutral states, which, given the different properties of salts and cocrystals, is likely to depend on other factors. Three pictures of crystal of 1 are reported in the Supplementary Material, as S1.
The dicarboxylic acid used in the present study gave cocrystal/salt depending on the ΔpKa values. The salts were prepared by mixtures solutions of both components in water followed by solution crystallization (see Experimental Section). H2dta formed salts with N9-(2-hydroxyethyl)adenine (9heade), and 2,6-diaminopurine (Hdap) to provide the salt [(H9Heade+)(Htda–), 1:1] (1) and the salt hydrate [(Hdap+)2(tda2–)·2H2O, 2:1:2] (2). The structures of these crystalline multicomponent forms were determined by single crystal X-ray diffraction and FT-IR spectroscopy. The bulk phase purity was confirmed by thermal techniques (DSC and TGA). Furthermore, DFT calculations of novel forms are described.
3.1. Structural description and supramolecular analysis
The geometric parameters of H2tda, 9heade and Hdap in compounds 1 and 2 are comparable to those of the structures of these free compounds [34,35,36] and, therefore, will not be discussed in detail here. For the analysis of the crystal packing of 1 and 2, the geometric parameters corresponding to the hydrogen bond interactions are collected in Table 2 and the details on the π–π stacking interactions between aromatic rings in compound 2 are given in Table 3.
3.1.1. [(H9Heade+)(Htda–), 1:1] Salt.
Colourless crystals in the form of plates of 1 have been prepared by crystallization from water of 9heade and H2tda in a molar ratio of 2:1. The choice of crystallization in this molar ratio is based on the fact that H2tda contains two carboxylic groups, so a 2:1 cocrystal should theoretically have two acid-aminopyridine synthons involving two molecules of 9heade and one of H2tda. The reality has been the formation of crystals in a 1:1 ratio. Analysis of their crystal structure reveals that the crystals belong to the triclinic space group P (Table 1) with a H9heade+ cation and an Htda– anion in the asymmetric unit (Figure 2a). In the crystal structure, both ions form dimers (Figure 3a). In the cation, two adenine fragments are linked through two hydrogen bonds N6–H···N7c and N6c–H···N7 (Table 2) forming a homosynthon of motif (10) (Figure 3c), with a distance of 2.928(2) Å intermediate between those found in the polymorph II structure of 3.109 and 2.891 Å, which is formed by ribbons of 9Heade molecules [35]. On the other hand, the dimeric anion units are formed through strong hydrogen bonds O21–H···O11f and almost linear O21f–H···O11 (O–H···O, 179°) (Table 2), also giving rise to a homosynthon of graph-set (16) (Figure 3d). In this dimer the C-S-C bond angle is 100.861(9)°, somewhat less than that found in the H2tda structure of 95.8° [34]. Both dimeric units are connected to each other through new hydrogen bonds. A carboxylic group and another carboxylate of two (Htda)– interact with each other through a linear homosynthon (O21-H···O11, 2.505 Å) and this scheme acts as a double acceptor interacting with an aminopurine group, as a double donor , N6–H···O22d and N1–H···O11b with formation of a graph-set heterosynthon (10) (Figure 3e), where the N1–H···O11b bond clearly shows the proton transfer from the carboxylate O11-C12-O12 to the N1 atom which is the most basic nitrogen atom of the adenine residue of the 9head [37].
In crystal packing, the dimers of cations and anions are arranged alternately forming ribbons along the "b" axis, which in turn join each other in the direction of the "c" axis by means of a new hydrogen bond, where the OH of the 2-hydroxyethyl fragment participates as donor and the O12 of the carboxylate as acceptor (Figure 3f). This arrangement in the packing is not flat but has the shape of a ladder where each rung is formed by cationic and anionic dimers, as can be seen in the projection on the "ab" plane of 2 (Figure 3b). Various C–H···O (3.319-3.75 Å, 1135.5-172.7°) and C–H···S (3.748 Å, 130.6°) interactions involving methylene groups of both components reinforce the stability of the crystal structure.
3.1.2. [(Hdap+)2(tda2–)·2H2O, 2:1:2] Salt hydrate.
The crystallization of aqueous solutions of dap and H2tda in a 2:1 molar ratio gives rise to colorless crystals in the form of blocks that effectively have the aforementioned molar ratio, constituting compound 2. The crystal structure has been resolved and refined into the monoclinic space group C2/c and contains a Hdap+ cation, a half tda2– anion and a water of crystallization molecule in the asymmetric unit (Figure 2b), so that the compound has formula (Hdap)2(tda)·2H2O, with the two cations symmetrically related. The presence of water of crystallization molecules has probably prevented the expected formation of acid-pyridinamine heterosynthons involving O–H···N and N–H···O hydrogen bonds. The general crystalline structure can be considered as segregated by two well-differentiated substructures, one of them cationic formed only by Hdap+ cations, and the other anionic constituted by tap2– anions and the two crystallization water molecules (Figure 4a).
The cationic substructure is simple and is formed by bands of coplanar Hdap+ cations, in the direction of the “a” axis, linked through head-to-tail interactions, by means of hydrogen bonds between an NH bond of each of amino groups as donors (N2, N6) and non-protonated nitrogen atoms (N3, N7) of nearest neighboring cations as acceptors, forming (9) motifs (Figure 4b). This arrangement is different from that found both in the structure of dap·H2O and in (Hdap)2+(hpt)2–·7H2O (hpt2– = 2-(2-carboxylatophenyl) acetate) [30].
For its part, the anionic substructure is constituted in such a way that, unlike what happens in 1, the bideprotonated anions tda2– are linked by means of water molecules, through hydrogen bonds where the oxygen atoms O12 of both carboxylates behave as acceptors, thus forming graph-set (8) heterosynthons that alternate with the anions along the “a” axis (Figure 4b), in a ladder-shaped arrangement.
The cationic and anionic substructures are linked to each other by means of new hydrogen bonds in which the protonated nitrogen atoms of each cation and one of the two amino N-H, which do not participate in the cationic bond, act as donors against the hydrogen atoms from water molecules (N1–H···O1b) and the other carboxylate O atoms from different equivalent positions (N6–H···O11d and N9–H···O11a) (Table 2). These interactions give rise to two new heterosynthons with ring motifs (10) and (8), respectively (Figure 4b). In this way, the anionic substructure joins two planar cationic substructures in an open book-like fashion, with an angle of 99.9(4)°, which corresponds to the C-S-C bond ring, where the thioether atom acts as a hinge (Figure 5).
The final result is a three-dimensional network where, along axis "b", the substructures are interleaved (Figure 4a). However, observed in the "ac" plane, it resembles a laminated network alternately linked by S-atoms (Figure 6a) and by aromatic ring-ring π,π-stacking interactions, between bilayers, in the cationic substructure (Figure 6b) with inter-centroid distances of 3.48 or 3.49 Å (Table 3) but an interplanar dihedral angle of 0° between the involved purines at distance of 3.23 Å.
3.2. IR spectra
In this section all wavenumbers are giver in cm−1. It has been shown that deprotonation of a carboxylic acid to form a carboxylate not only equalizes the C=O bond length, but also has a significant effect on the C–O/C=O strain vibrations observed in IR spectra. Thus, while the carboxylates give rise to two carbonyl strain bands, one strong asymmetric near 1600 cm−1 and the other weakly symmetric near 1400 cm−1 [38], the carboxylic acids in the co-crystals show strong C–O bands above 1600 cm−1 (near 1700 cm−1), along with weak C=O bands near 1275 cm−1 confirming a non-ionized state of the adduct [39].
An analysis of the IR spectra obtained for both compounds (see S2 and S3) shows the presence of broad bands at 1950 cm−1 and 2450 cm−1 indicating the presence of O–H···N hydrogen bond interactions [40]. This broadness hinders the observation of the typical series of weak peaks related to the stretching mode(s) of N+-H (2800-2250 cm−1).
We can anticipate that the IR spectrum of 1 (S2) will be rather difficult for tentative assignations of bands to specific stretching and bending modes. A convenient manner to interpret the IR spectra of the here reported compound is looking at the IR spectra of the corresponding N-components The spectrum of 1 revealed the presence of H9heade+ with the bands of νas (3347 cm−1), νs (3286 cm−1) and δ (1672 cm−1) of -NH2, ν(3183 cm−1) δ(1510 cm−1) of N9-H, broadness peaks at 2800-2250 cm−1 (among other, peaks at 2687, 2361 cm−1) and δ(1548 cm−1) of N1+-H) and ν(1071 or 1044 cm−1) of ν(C-O) (both for the C-O(H) in H9heade+ or in Htda−). Note that the ν(O-H) of both H9heade+ and Htda− are not identified. That as well as the broadness of the peaks related to the stretch of N+-H (also rather typical in IR spectra of tertiary amine hydrochlorides) are clearly related the hydrogen bonding, that lower frequencies (and so wavenumbers) and broad bands. Out-of plane deformations, π(C2-H) and π(C8-H) are related to defined peaks at 872 and 852 cm−1 (usually in the range 900-860 cm−1). In addition, the anion Htda- produce the ν(C=O) band at 1702 cm−1, νas(1618 cm−1), νs(1382 cm−1) of –COO- and the in-plane δ(O-H) 1236 cm−1 of –COOH.
The IR spectrum of 2 (S2) revealed intense boarding of abortions in the range 3600-1300 cm−1, due to the N-H···N, N-H··O and O-H···O interactions. However, few features are remarkable as follows. First, the νas(H2O) at 3448 cm−1 is clearly identified. Second, board the νas(NH2) 3320 cm−1 and the overlaps contribution νs(NH2)+νs(H2O) 3209 cm−1. Third, the series of peaks in the region 2800-2250 cm−1 (typically at 2700~2250 cm−1 [39,40]) related to the stretching of N+-H for tertiary amine hydrochlorides, here evidencing the N1+-H bond of tautomer 2,6-(N1,N9)diaminopurinium(1+) cation, proved by the crystallographic results for 2. The out-of-plane π(C-H) weak bands, expected at 900-860 cm−1, are observed at 882 and 865 cm−1. And fourth, two in-plane δ(N-H) absorptions are observed at 1558 cm−1 (sh) and 1508 cm−1 (w). Overlapped νas(COO) 1598 cm−1 and 1577 cm−1absorptions and with νs(COO) 1390 cm−1are the clearest evidence of the dianion tda2−.
3.3. Salt-Cocrystal Continuum
In the salt-cocrystal continuum discussion, in addition to the procedures based on the number and position of the IR bands of the carboxylic/carboxylate group and on the estimation of the ΔpKa value discussed above, there are other prediction methods that consider certain structural parameters that govern the synthesis multicomponent crystals between carboxylic acids and bases, dominated by hydrogen bonds.
1) When carboxylic acids are used as conformers, an analysis of the C-O bond distances can provide a distinction whether obtained solid features salt or cocrystal character. If both C-O distances differ by less than 0.03 Å the compound must be considered as a salt, whereas when one suspects cocrystal structure, the distances C=O and C-OH within the carboxyl group differ by more than 0.08 Å. [41] The distances C=O and C-OH for compounds studied here have values of 1.235/1.221 and 1.283/1.308 for 1 and 1.224 Å and 1.231 Å for 2, respectively, resulting in an difference of 0.048 and 0.087 Å for the two carboxylic groups of 1 and of 0.007 for 2. These values correspond well with the values of salts containing carboxylic acids as coformers, which means the existence of proton transfer from the acid to the base. However, at 1 the value found for the second carboxylic group, slightly higher than 0.08 A, is consistent with the absence of proton transfer and, consequently, the veracity of the method proposed by Gobetto et al.
2) Alternatively, to examine the balance between cocrystallization and proton transfer in a set of acid-base reactions, Aakeröy et al., [42] have performed a comparison of crystal data for a series of salts and cocrystals. In this study, it is observed that the average ratio of carbonyl, C = O bond distance to C-OH bond distance in cocrystals is 1.08, while the ratio of C-O/C-O bond distance for the carboxylate anion is 1.02. If we apply this concept to compounds, the values of the C-O/C-O ratios obtained are 1.039–1.071 Å for 1 and 1.005 Å for 2. Clearly, these values support our notion that 2 is a salt and 1 incorporates carboxylic groups, deprotonated and neutral, confirming the assignment, already predicted in the IR spectra and by the ΔpKa values for each of these systems studied. These values are consistent with those calculated for other multicomponent crystals with thiodiacetic acid as a coformer, already mentioned above [8,9,10,11,12,13,14].
3.4. Thermal analysis
TGAs can provide information on melting, crystallization, sublimation, decomposition, and solid state transitions, and also enable the observation and quantification of volatile compounds such as residual solvents and gaseous by-products. In this work we provide the TGA behaviour for both the novel cocrystal salts (for details see S4 and S5) and the used reagents (S6.1-S6.6).
The weight loss plots versus temperature (°C) for 1 and 2 are shown in Figure 7. Compound 1 is rather stable against temperature. It start the decomposition (180-250 °C, 7.34% of weight loss) evolving H2O and CO2, followed by a sharp step (250-465 °C, 51.12% of weight loss) producing of H2O, CO2, CO, SO2, H2C=CH2 and at least an unidentified gas (probably HSCN) plus some N2O. A third step (465-650 °C, 40.19% of weight loss) yields H2O, CO2, CO, and the usual three N-oxides (N2O, NO and NO2) but not NH3! Interestingly the TGA analysis of free 9heade does not produce this gas (see S6.3). A stable but small residue is formed (1.16% or 1.03% at 650 or 950 °C). This data is consistent to a partial overlapped burning of the both ligands as well as the expected stability of the purine moiety of 9heade.
Compound 2 samples retain a variable content of moisture and water. They show a sharp water loss (135-180 °C) but initiates the thermal decomposition of organics at 235 °C, that occurs in two steps (235-400 °C, 27.85%, H2O, CO2, CO, probably HSCN and SO2 followed by 400-800 °C, H2O, CO2, CO, NH3, N2O, NO and NO2). A stable residue (~2 %) remains at 800-900 °C.
3.5. DSC Analysis
Figures S7 and S8 show the heat flow versus the temperature for compounds 1 and 2, respectively. It can be seen that the melting points of these compounds are different from those of the 2.2'-thiodiacetic acid (128-131 °C) and those of 9heade (242 °C) and HDAP (> 300 °C). We find that for 1 and 2 the melting point is among the melting points of the corresponding coformers.
The DSC curve for 1 shows an endothermic peak at 189.8 °C immediately followed by two weak at 203.9 °C and 276.1 °C. The first peak was attributed to the fusion of salt, and subsequent peaks could be explained by a small polymorphic transformation and its fusion.
The DSC curve for 2 shows two endothermic regions. This behavior may be due to partial dissociation among its components. The first peak, with a maximum of 142.5 °C, which correlates well with the fusion point of the 2.2'-thiodiacetic acid, moved slightly due to the heating speed of 10 °C/min. The following maximum corresponds to Hdap, which decomposes/sublimates at 254.3 °C. Therefore, although there were additional weak peaks in the XRD pattern, this product seems to be 2.6-Diaminopurine. The 2 dihydrate shape showed wide and shallow twin peaks to 73.7 °C and 100.5 °C that could be attributed to the loss of water molecules of its crystalline network and, subsequently, to the evaporation of water. One broad and small endothermic peak showed up at 335.8°C that corresponded to the melting point of the Hdap.
3.6. DFT calculations
The theoretical study is devoted to the energetic analysis of the H-bonded synthons described in Figure 3 and Figure 4. Moreover, we have also evaluated the π-stacking interaction between the protonated aza-adeninium rings that are important in the crystal packing of compound 2.
First, we have computed the MEP surfaces of the salts to explore the relative H-bond donor/acceptor ability of the coformers. In case of compound 2, we have used a model where the 2,2’-thiodiacetic acid has been replaced by an acetate for simplicity. The MEP surfaces are given in Figure 8, showing that in compound 1 the MEP minimum is located at the O-atom of the carboxylate group (–59.6 kcal/mol) followed by that at the carboxylic O-atom (–49.0 kcal/mol). The MEP values at the N-atoms of the adenine ring are significantly smaller (–11.9 and –9.4 kcal/mol) due to the cationic nature of the adeninium ring. In contrast, the values at the NH2 group are very large (53.9 and 45.2 kcal/mol) due to the protonation in N1. The MEP maximum is located at the OH group of the pendant arm. In compound 2, the MEP values at the carboxylate group are very large and negative (–94.1 and –81.5 kcal/mol) and correspond to the MEP minima. The MEP values are also negative at the N-atoms of the aza-adeninium ring (–41.4 and –17.6 kcal/mol). The MEP maxima are located at the H-atoms of the water molecule that is H-bonded to the N+–H group of the aza-adeninium ring (+94.1 and +87.8 kcal/mol). Finally, the MEP values are also large and positive at the NH2 groups, ranging from 67.9 to 81.6 kcal/mol. This MEP analysis anticipates the formation strong H-bonds and agrees well with the variety of H-bonded synthons described above.
In order to evaluate the energies of the H-bonds, we have characterized the assemblies shown in Figure 9 by a combination of QTAIM and NCIplot methods. The strength of each H-bond has been computed using the reliable method proposed by Emaniam et al. [43]. That is, the association energy of the HBs is calculated using the electron density (ρ) at the bond CP and the equation E = –233.1 × ρ + 0.7. This is very convenient for the systems studied in this manuscript (salts) where electrostatic effects are dominant (pure Coulombic attraction). Therefore, using the QTAIM approach the contribution of the H-bond can be estimated free from the influence of ion-pair electrostatic force. The strength of each H-bond is indicated in Figure 9 (in red) revealing that the O–H•••O interactions generating the R_2^2(16) synthon are the strongest ones, in line with the MEP analysis shown in Figure 8. Each H-bond is characterized by a bond critical point (CP, small red sphere) and bond path (dashed bond) connecting the H to the O/N-atoms. Moreover, RDG isosurfaces also appear coincident to the location of the bond CPs, with colors that range from green for the weak interactions to bluish for the moderate ones and finally dark blue for the strongest ones. In case to the R_2^2(16) synthon, an extended green isosurface also appears between the COOH groups, suggesting the formation of weak van der Waals interactions.
The QTAIM/NCIplot analysis also evidences the existence of some weak CH···O,S interactions that were not described in Figure 3 and Figure 4 (marked with arrows in Figure 8b). The energies of the different synthons are also provided in Figure 9, evidencing that the (16) and (10) synthons are the most significant energetically because they involve the strongest H-bond donor and acceptor groups. The (10) synthon connecting the adeninium rings by NH···N bonds is the weakest in line with the small MEP values at the N-atoms. In general, the large interaction energies of the synthons confirm the importance of these H-bonds in the solid state of compound 1, as described in Figure 3.
A similar analysis has been performed for compound 2, as depicted in Figure 10. The H-bonds are characterized by the corresponding bond CPs, bond paths and RDG isosurfaces. The (8) synthon involving the two water molecules is the most favorable (–28.5 kcal/mol). As also observed in 1, the synthons involving OH···O and NH···O H-bonds [(8), (8) and (8)] are stronger than the (9) synthon with two NH···N H-bonds between the aza-adeninium rings. The large binding energy of the (8) synthon evidences the strong influence that the co-crystallized water molecules exert in the crystal packing of 2, preventing the formation of additional heterosynthons.
Finally, we have evaluated the π-π-stacking interaction in compound 2, by using the model depicted in Figure 11. It can be observed a strong complementarity of the aza-adeninium rings, since the RDG isosurface embraces the whole π-cloud of the rings including one of the exocyclic NH2 groups. The dimerization energy computed using the supramolecular approach is large and negative (–37.6 kcal/mol) likely due to the influence of ion-pair effects. Such large interaction energy (even stronger that the H-bonded synthons) confirms the relevance of the π-π stacking interaction in the crystal packing of compound 2, as evidenced in Figure 6.
4. Conclusions
The uncertainly of the ΔpKa values in the interval between -1 and 4, regarding the salt-co-crystal continuum and ΔpKa rules, has been resolved in this case by really obtaining stable multicomponent ionic co-crystals between N1,N9-(2-hydroxyethyl)adeninium(1+) or N1,N9-2,6-diaminopurinium(1+) and 2,2’-thiodiacetic acid anions (Htda− or tda2− respectively). Exhaustive N–H···N/N–H···O/ O–H···N and/or O–H···O hydrogen bonds are present in both ionic co-crystals that give rise to different supramolecular synthons. Single crystal X-ray diffraction analysis revealed that not primary synthons between carboxylic acid and aminopurine moiety are present, but was observed that in [(H9Heade+)(Htda−)] (1) one single-point O–H···O and three-point supramolecular synthon of graph-set (10) and in [(Hdap+)2(tda2−)]·2H2O (2) a single-point N–H O and three-point supramolecular synthon of graph-set 8) played an important role in the crystallization of these co-crystals. This has been confirmed using DFT calculations and the QTAIM analysis, where the strength of each H-bond has been evaluated. In general, OH···O and OH···H H-bonds involving both coformers and water molecules are stronger than the NH···N ones between the adeninium(1+) and 6-aza-adeninium(1+) units. As we can anticipate, the FT-IR spectra and TGA of both studied compounds are in agreement with the crystallographic results, being noticeable both the stretching expression of N+-H moiety and the highest thermal stability of the water-free crystal 1.
Supplementary Materials
The following supporting information can be downloaded at the website of this paper posted on Preprints.org, Figure S1: Crystals of [(H9Heade+)(Htda–)]; Figure S2: FT-IR spectrum of [(H9Heade+)(Htda–)]; Figure S3: FT-IR spectrum of [(H2dap+)2(tda2–)]·2H2O; Figure S4: TGA of [(H9Heade+)(Htda–)]; Figure S5: TGA of [(H2dap+)2(tda2–)]·2H2O; Figure S6: TGA of Starting Reagents; Figure S7: DSC of [(H9Heade+)(Htda–)]; Figure S8: DSC of [(H2dap+)2(tda2–)]·2H2O.
Author Contributions
Conceptualization and methodology, J.N.-G. and A.M.-H.; computational calculations, A.F.; crystallography, D.Ch-L. and A.C; software, A.M.-H. and A.F.; investigation, J.C.-B. and M.E.G.-R.; writing—original draft preparation, J.N.-G, A.C. and A.F.; writing—review and editing, J.C.-B., and M.E.G.-R.; visualization, J.C.-B., M.E.G.-R.; supervision, J.N.-G, A.C. and A.F.; project administration, J.N.-G., A.C. and A.F.; funding acquisition, D.Ch-L., J.N.-G. and A.F. All authors have read and agreed to the published version of the manuscript.
Funding
This research was funded in part by MICIU/AEI, Spain (project PID2020-115637GB-I00 FEDER funds) and Universidad de Granada, Spain (project B-FQM-478-UGR20 FEDER funds).
Institutional Review Board Statement
Not applicable.
Informed Consent Statement
Not applicable.
Data Availability Statement
Not applicable.
Acknowledgments
The Excellence Network “Metal Ions in Biological Systems” MetalBio CTQ2017-90802-REDT and the Research group FQM-283 (Junta de Andalucía, Spain) are gratefully acknowledged for financial support.
Conflicts of Interest
The authors declare no conflict of interest.
References
- Kavanagh, O. N.; Walker, G.; Lusi, M. Graph-Set Analysis Helps To Understand Charge Transfer in a Novel Ionic Cocrystal When the ΔpKa Rule Fails. Cryst. Growth Des. 2019, 19, 5308–5313. [Google Scholar] [CrossRef]
- Grothe, E.; Meekes, H.; Vlieg, E.; ter Horst, J. H.; de Gelder, R. Solvates, Salts, and Cocrystals: A Proposal for a Feasible Classification System. Cryst. Growth Des. 2016, 16, 3237–3243. [Google Scholar] [CrossRef]
- Bolla, G.; Sarma, B.; Nangia, A. K. Crystal Engineering of Pharmaceutical Cocrystals in the Discovery and Development of Improved Drugs. Chem. Rev. 2022, 122, 11514–11603. [Google Scholar] [CrossRef] [PubMed]
- Childs, S. L.; Stahly, G. P.; Park, A. The Salt-Cocrystal Continuum: The Influence of Crystal Structure on Ionization State. Mol. Pharmaceutics 2007, 4, 323–338. [Google Scholar] [CrossRef] [PubMed]
- Shi, L.; Chen, Zh.; Kafafy, H.; Zhang, Zh.; Zhu, G.; Yao, J.; Zhang, G. Synthesis, powder diffraction pattern, crystal structure determination of the pharmaceutical co-crystal of levetiracetam and 3,5-dinitrosalicylic acid. Powder Diffr. 2023, 1-9. [CrossRef]
- Liu, M.; Qian, Y.; Wu, Y.; Zhang, F. Multicomponent synthesis of di-aryl dithiocarbamates via electron donor–acceptor photoactivation with thianthrenium salts. Green Chem., 2023, 25, 3852–3856. [Google Scholar] [CrossRef]
- Ilardi, E. A.; Vitaku, E.; Njardarson, J. T. Data-Mining for Sulfur and Fluorine: An Evaluation of Pharmaceuticals To Reveal Opportunities for Drug Design and Discovery. J. Med. Chem. 2014, 57, 2832–2842. [Google Scholar] [CrossRef]
- Bałczewski, P.; Biczak, R.; Turek, M.; Pawłowska, B.; Różycka-Sokołowska, E.; Marciniak, B.; Deska, M.; Skalik, J. Ammonium 2,2′-thiodiacetates – Selective and environmentally safe Herbicides. Ecotoxicol. Environ. Saf. 2018, 163, 408–416. [Google Scholar] [CrossRef]
- Pedireddi, V. R. Design and Synthesis of Novel Aza-Aromatic Host-Guest Complexes: Crystal Structures of 1,7-Phenanthroline with Thiodipropionic and Thiodiglycolic Acids. Cryst. Growth Des. 2001, 1, 383–385. [Google Scholar] [CrossRef]
- Aakeröy, Ch. B.; Beatty, A. M.; Helfrich, B. A. A High-Yielding Supramolecular Reaction. J. Am. Chem. Soc. 2002, 124, 14425–14432. [Google Scholar] [CrossRef]
- Pedireddi, V. R.; Chatterjee, S.; Ranganathan, A.; Rao, C. N. R. A Study of Supramolecular Hydrogen Bonded Complexes formed by Aliphatic Dicarboxylic Acids with Azaaromatic Donors. Tetrahedron 1998, 54, 9457–9474. [Google Scholar] [CrossRef]
- Ranganathan, A.; Kulkarni, G. U.; Rao, C. N. R. An Experimental Charge Density Study of the N–H+···O– Bonds in a Proton-Transfer System in Comparison with Regular N–H···O and O–H···N Hydrogen Bonds. Isr. J. Chem. 2004, 44, 145–156. [Google Scholar] [CrossRef]
- Tsaggeos, K.; Masiera, N.; Niwicka, A.; Dokorou, V.; Siskos, M. G.; Skoulika, S.; Michaelides, A. Crystal Structure, Thermal Behavior, and Photochemical Reactivity of a Series of Co-Crystals of trans-1,2-Bis(4-pyridyl) Ethylene with Dicarboxylic Acids. Cryst. Growth Des. 2012, 12, 2187–2194. [Google Scholar] [CrossRef]
- Gomathi, V.; Theivarasu, C. Hydrogen-bonded assemblies in the molecular crystals of 2,200-thiodiacetic acid with ethylenediamine and o-phenylenediamine. Acta Cryst. 2017, C73, 97–103. [Google Scholar] [CrossRef]
- Kitade, Y.; Hayashi, M.; Yatome, C.; Ghajima, M.; Nagase, H. Inhibitory Effect on the HT-1080 Tumor Cell Invasion in Vitro Using 9-(2’-hydroxyethyl) Adenine 2’-Phosphates. Bioorg. Med. Chem. Lett. 1997, 7, 833–836. [Google Scholar] [CrossRef]
- Doleželová, E.; Klejch, T.; Špaček, P.; Slapničková, M.; Guddat, L.; Hocková, D.; Zíková, A. Acyclic nucleoside phosphonates with adenine nucleobase inhibit Trypanosoma brucei adenine phosphoribosyltransferase in vitro. Sci Rep 2021, 11, 13317. [Google Scholar] [CrossRef]
- Cooperwood, J. S.; Gumina, G.; Boudinot, F. D.; Chu, C. K. Nucleoside and Nucleotide Prodrugs. In Recent Advances in Nucleosides: Chemistry and Chemotherapy; Elsevier: Amsterdam, The Netherlands, 2002; pp. 91–147. [Google Scholar]
- Szabla, R.; Zdrowowicz, M.; Spisz, P.; Green, N. J.; Stadlbauer, P.; Kruse, H.; Šponer, J.; Rak, J. 2,6-diaminopurine promotes repair of DNA lesions under prebiotic conditions. Nat Commun 2021, 12, 3018. [Google Scholar] [CrossRef] [PubMed]
- Sheldrick, G.M. SADABS, Program for Empirical Absorption Correction of Area Detector Data; University of Göttingen: Germany, 2001. [Google Scholar]
- Sheldrick, G.M. SHELXT – Integrated space-group and crystal structure Determination. Acta Crystallogr. 2015, A71, 3–8. [Google Scholar] [CrossRef]
- Putz, H.; Brandenburg, K. Diamond - Crystal and Molecular Structure Visualization Version 4.6.2, Crystal Impact GbR: Bonn, Germany, 2020.
- Gaussian 16, Revision B.01, Frisch, M. J.; Trucks, G. W.; Schlegel, H. B.; Scuseria, G. E.; Robb, M. A.; Cheeseman, J. R.; Scalmani, G.; Barone, V.; Petersson, G. A.; Nakatsuji, H.; Li, X.; Caricato, M.; Marenich, A. V.; Bloino, J.; Janesko, B. G.; Gomperts, R.; Mennucci, B.; Hratchian, H. P.; Ortiz, J. V.; Izmaylov, A. F.; Sonnenberg, J. L.; Williams-Young, D.; Ding, F.; Lipparini, F.; Egidi, F.; Goings, J.; Peng, B.; Petrone, A.; Henderson, T.; Ranasinghe, D.; Zakrzewski, V. G.; Gao, J.; Rega, N.; Zheng, G.; Liang, W.; Hada, M.; Ehara, M.; Toyota, K.; Fukuda, R.; Hasegawa, J.; Ishida, M.; Nakajima, T.; Honda, Y.; Kitao, O.; Nakai, H.; Vreven, T.; Throssell, K.; Montgomery, J. A., Jr.; Peralta, J. E.; Ogliaro, F.; Bearpark, M. J.; Heyd, J. J.; Brothers, E. N.; Kudin, K. N.; Staroverov, V. N.; Keith, T. A.; Kobayashi, R.; Normand, J.; Raghavachari, K.; Rendell, A. P.; Burant, J. C.; Iyengar, S. S.; Tomasi, J.; Cossi, M.; Millam, J. M.; Klene, M.; Adamo, C.; Cammi, R.; Ochterski, J. W.; Martin, R. L.; Morokuma, K.; Farkas, O.; Foresman, J. B.; Fox, D. J. Gaussian, Inc., Wallingford CT, 2016.
- Grimme, S.; Antony, J.; Ehrlich, S.; Krieg, H. A consistent and accurate ab initio parametrization of density functional dispersion correction (DFT-D) for the 94 elements H-Pu. J. Chem. Phys. 2010, 132, 154104–154118. [Google Scholar] [CrossRef]
- Weigend, F. Accurate Coulomb-fitting basis sets for H to Rn. Phys. Chem. Chem. Phys. 2006, 8, 1057–1065. [Google Scholar] [CrossRef]
- Boys, S.F.; Bernardi, F. The calculation of small molecular interactions by the differences of separate total energies. Some procedures with reduced errors. J. Mol. Phys. 1970, 19, 553–566. [Google Scholar] [CrossRef]
- Bader, R. F. W. A Bond Path: A Universal Indicator of Bonded Interactions. J. Phys. Chem. A, 1998, 102, 7314–7323. [Google Scholar] [CrossRef]
- AIMAll (Version 13.05.06), Todd A. Keith, TK Gristmill Software, Overland Park KS, USA, 2013.
- Contreras-García, J.; Johnson, E.R.; Keinan, S.; Chaudret, R.; Piquemal, J.-P.; Beratan, D.N.; Yang, W. J. J. Chem. Theory Comput., 2011, 7, 625-632. [CrossRef] [PubMed]
- Johnson, E. R.; Keinan, S.; Mori-Sánchez, P.; Contreras-García, J.; Cohen, A.J.; Yang, W. J. Am. Chem. Soc., 2010, 132, 6498–6506. [CrossRef]
- Kapinos, L.E.; Operschall, B.P.; Larsen, E.; Sigel, H. Understanding the Acid–Base Properties of Adenosine: The Intrinsic Basicities of N1, N3 and N7. Chem. Eur. J. 2011, 17, 8156–8164. [Google Scholar] [CrossRef] [PubMed]
- Reinert, H.; Weiss, R. Chemical complex behavior of pyrimidine derivatives. XI. Stability constants of some purine and pyrimidine-copper complexes. Hoppe-Seylers Z. Physiol. Chem. 1969, 350, 1310–1320. [Google Scholar] [CrossRef] [PubMed]
- Arena, G.; Musumeci, S.; Rizzareli, E.; Sammartano, S. Potentiometric Investigation of Simple and Mixed Complexes of Cupric Ion in Aqueous Solution. Inorg. Chim. Acta 1978, 27, 31–35. [Google Scholar] [CrossRef]
- Cruz-Cabeza, A. J.; Lusi, M.; Wheatcroft, H. P.; Bond, A. D. The role of solvation in proton transfer reactions: implications for predicting salt/co-crystal formation using the ΔpKa rule. Faraday Discuss., 2022, 235, 446–466. [Google Scholar] [CrossRef] [PubMed]
- Paul, S. The Crystal Structure of Thiodiglycollic Acid. Acta Crystallogr. 1967, 23, 490–494. [Google Scholar] [CrossRef]
- Takenaka, A.; Shibata, M.; Sasada, Y. Three Crystalline Forms of N9-(2-hydroxyethyl)adenine Resulting from the Different Stacking of Hydrogen-Bonded Layers. Acta Crystallogr., Sect. C: Cryst. Struct. Commun. 1986, 42, 1336–1340. [Google Scholar] [CrossRef]
- Alduhaish, O.; Arman, H. D.; Wang, H.; Alfooty, K.; Chenen, B. Solvent Dependent Structures of Hydrogen-Bonded Organic Frameworks of 2,6-Diaminopurine. Cryst. Growth Des. 2014, 14, 3634–3638. [Google Scholar] [CrossRef]
- Atria, A.M.; Garland, M.T.; Baggio, R. 2,6-Diamino-9H-purine monohydrate and bis(2,6-diamino-9H-purin-1-ium) 2-(2-carboxylatophenyl)acetate heptahydrate: two simple structures with very complex hydrogen-bonding schemes. Acta Cryst. 2010, C66, o547–o552. [Google Scholar] [CrossRef]
- Socrates, G. (Ed.), Infrared and Raman Characteristic Group Frequencies–Tables and Charts, 3rd ed. John Wiley & Sons, Ltd, Chichester, UK, 2001.
- Bellamy, L. J. The infrared spectra of complex molecules, Vol. 1, third edition, John Willey and Sons, New York, 1975.
- Nakanishi, K. Infrared absorption spectroscopy-Practial, Holden-Day Inc, San Francisco, USA, Four reprint, 1966.
- Cerreia Vioglio, P.; Chierotti, M. R. , Gobetto, R. Pharmaceutical aspects of salt and cocrystal forms of APIs and characterization challenges. Adv. Drug Deliv. Rev. 2017, 117, 86–110. [Google Scholar] [CrossRef]
- Aakeröy, C. B.; Rajbanshi, A.; Li, Z. J.; Desper, J. Mapping out the synthetic landscape for re-crystallization, co-crystallization and salt formation. CrystEngComm, 2010, 12, 4231–4239. [Google Scholar] [CrossRef]
- Emamian, S.; Lu, T.; Kruse, H.; Emamian, H. Exploring Nature and Predicting Strength of Hydrogen Bonds: A Correlation Analysis Between Atoms-in-Molecules Descriptors, Binding Energies, and Energy Components of Symmetry-Adapted Perturbation Theory. J. Comput. Chem. 2019, 40, 2868–2881. [Google Scholar] [CrossRef]
Figure 1.
Chemical diagrams of 2,6-Diaminopurine (Hdap), N9-(2-hydroxyethyl)adenine (9heade) and 2,2’-thiodiacetic acid (H2tda).
Figure 1.
Chemical diagrams of 2,6-Diaminopurine (Hdap), N9-(2-hydroxyethyl)adenine (9heade) and 2,2’-thiodiacetic acid (H2tda).
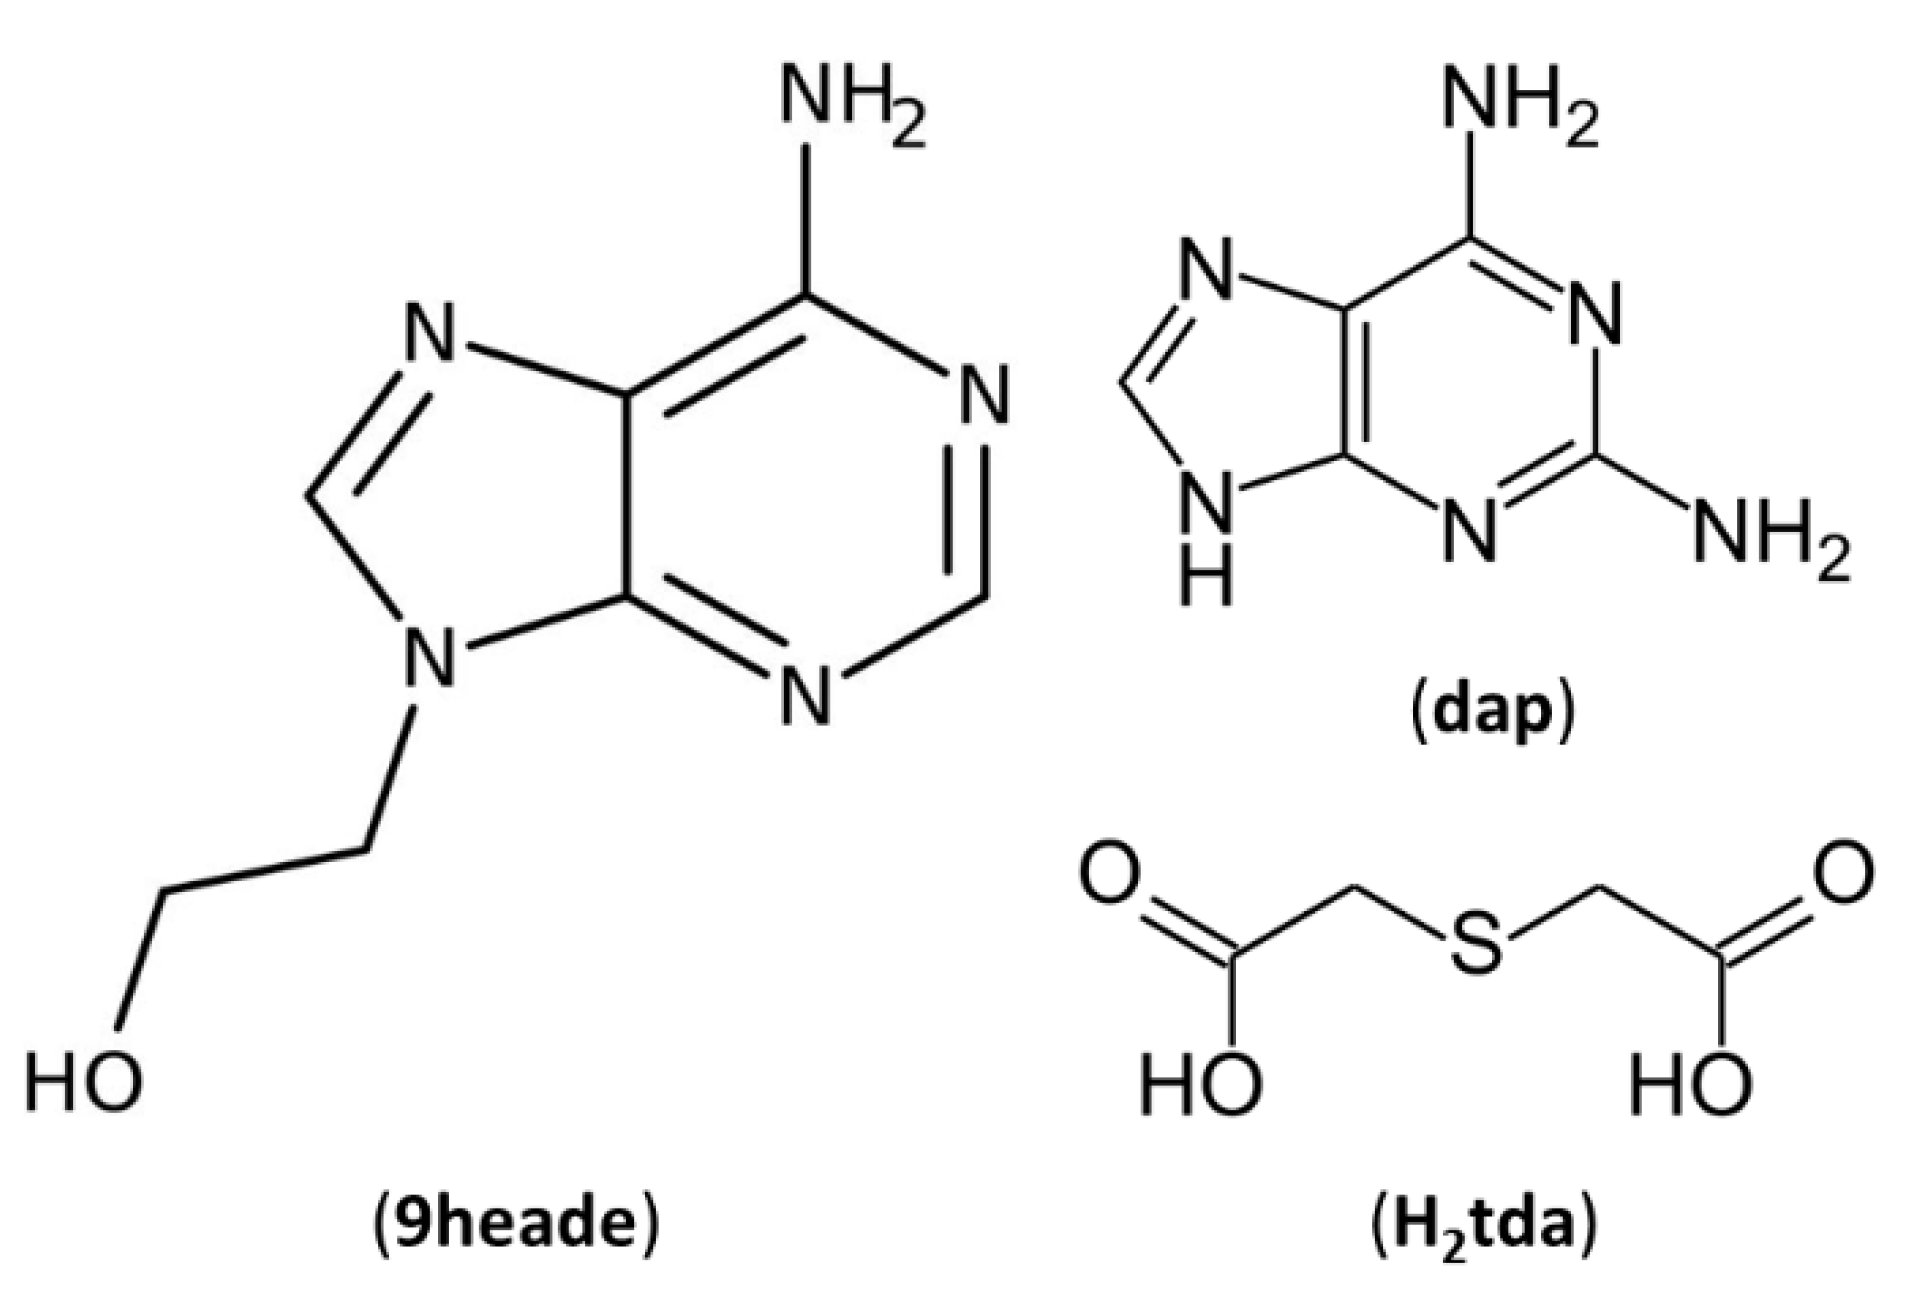
Figure 2.
Perspective view of the unit asymmetric of: a) [(H9Heade+)(Htda-)] (1) and b) [(Hdap+)2(tda2-)]·2H2O (2) with atom labelling.
Figure 2.
Perspective view of the unit asymmetric of: a) [(H9Heade+)(Htda-)] (1) and b) [(Hdap+)2(tda2-)]·2H2O (2) with atom labelling.
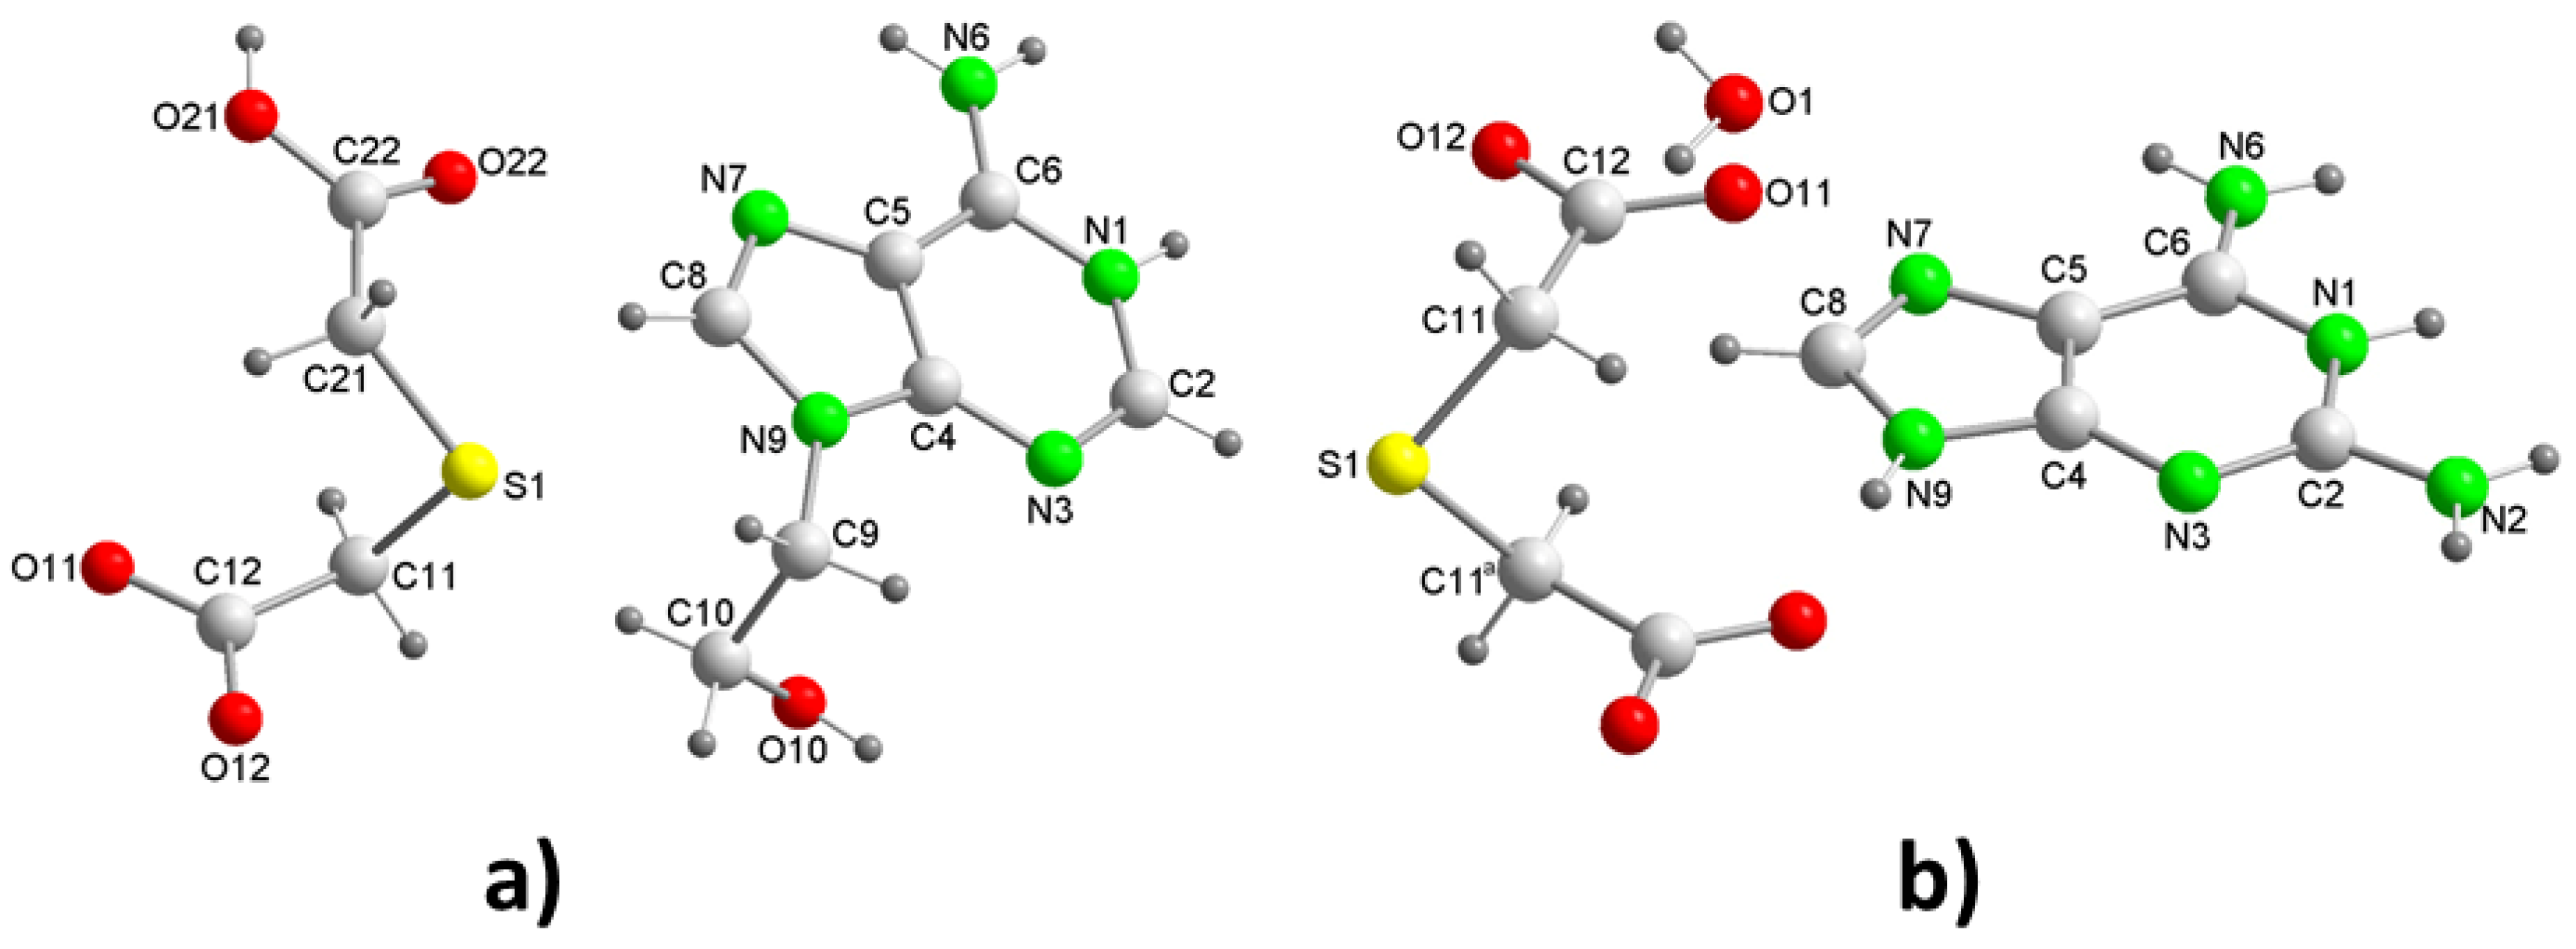
Figure 3.
Crystal packing of the molecules in (1), projected onto the “bc” and “ab” planes (a and b, respectively). View of centrosymmetric ring motifs with a R22(10) graph-set for (H9heade)+ (c), and a R22(16) graph-set for (tda)2- (d). View of the cation-anion intermolecular interactions and the supramolecular synthons (e and f). For symmetry codes see tables.
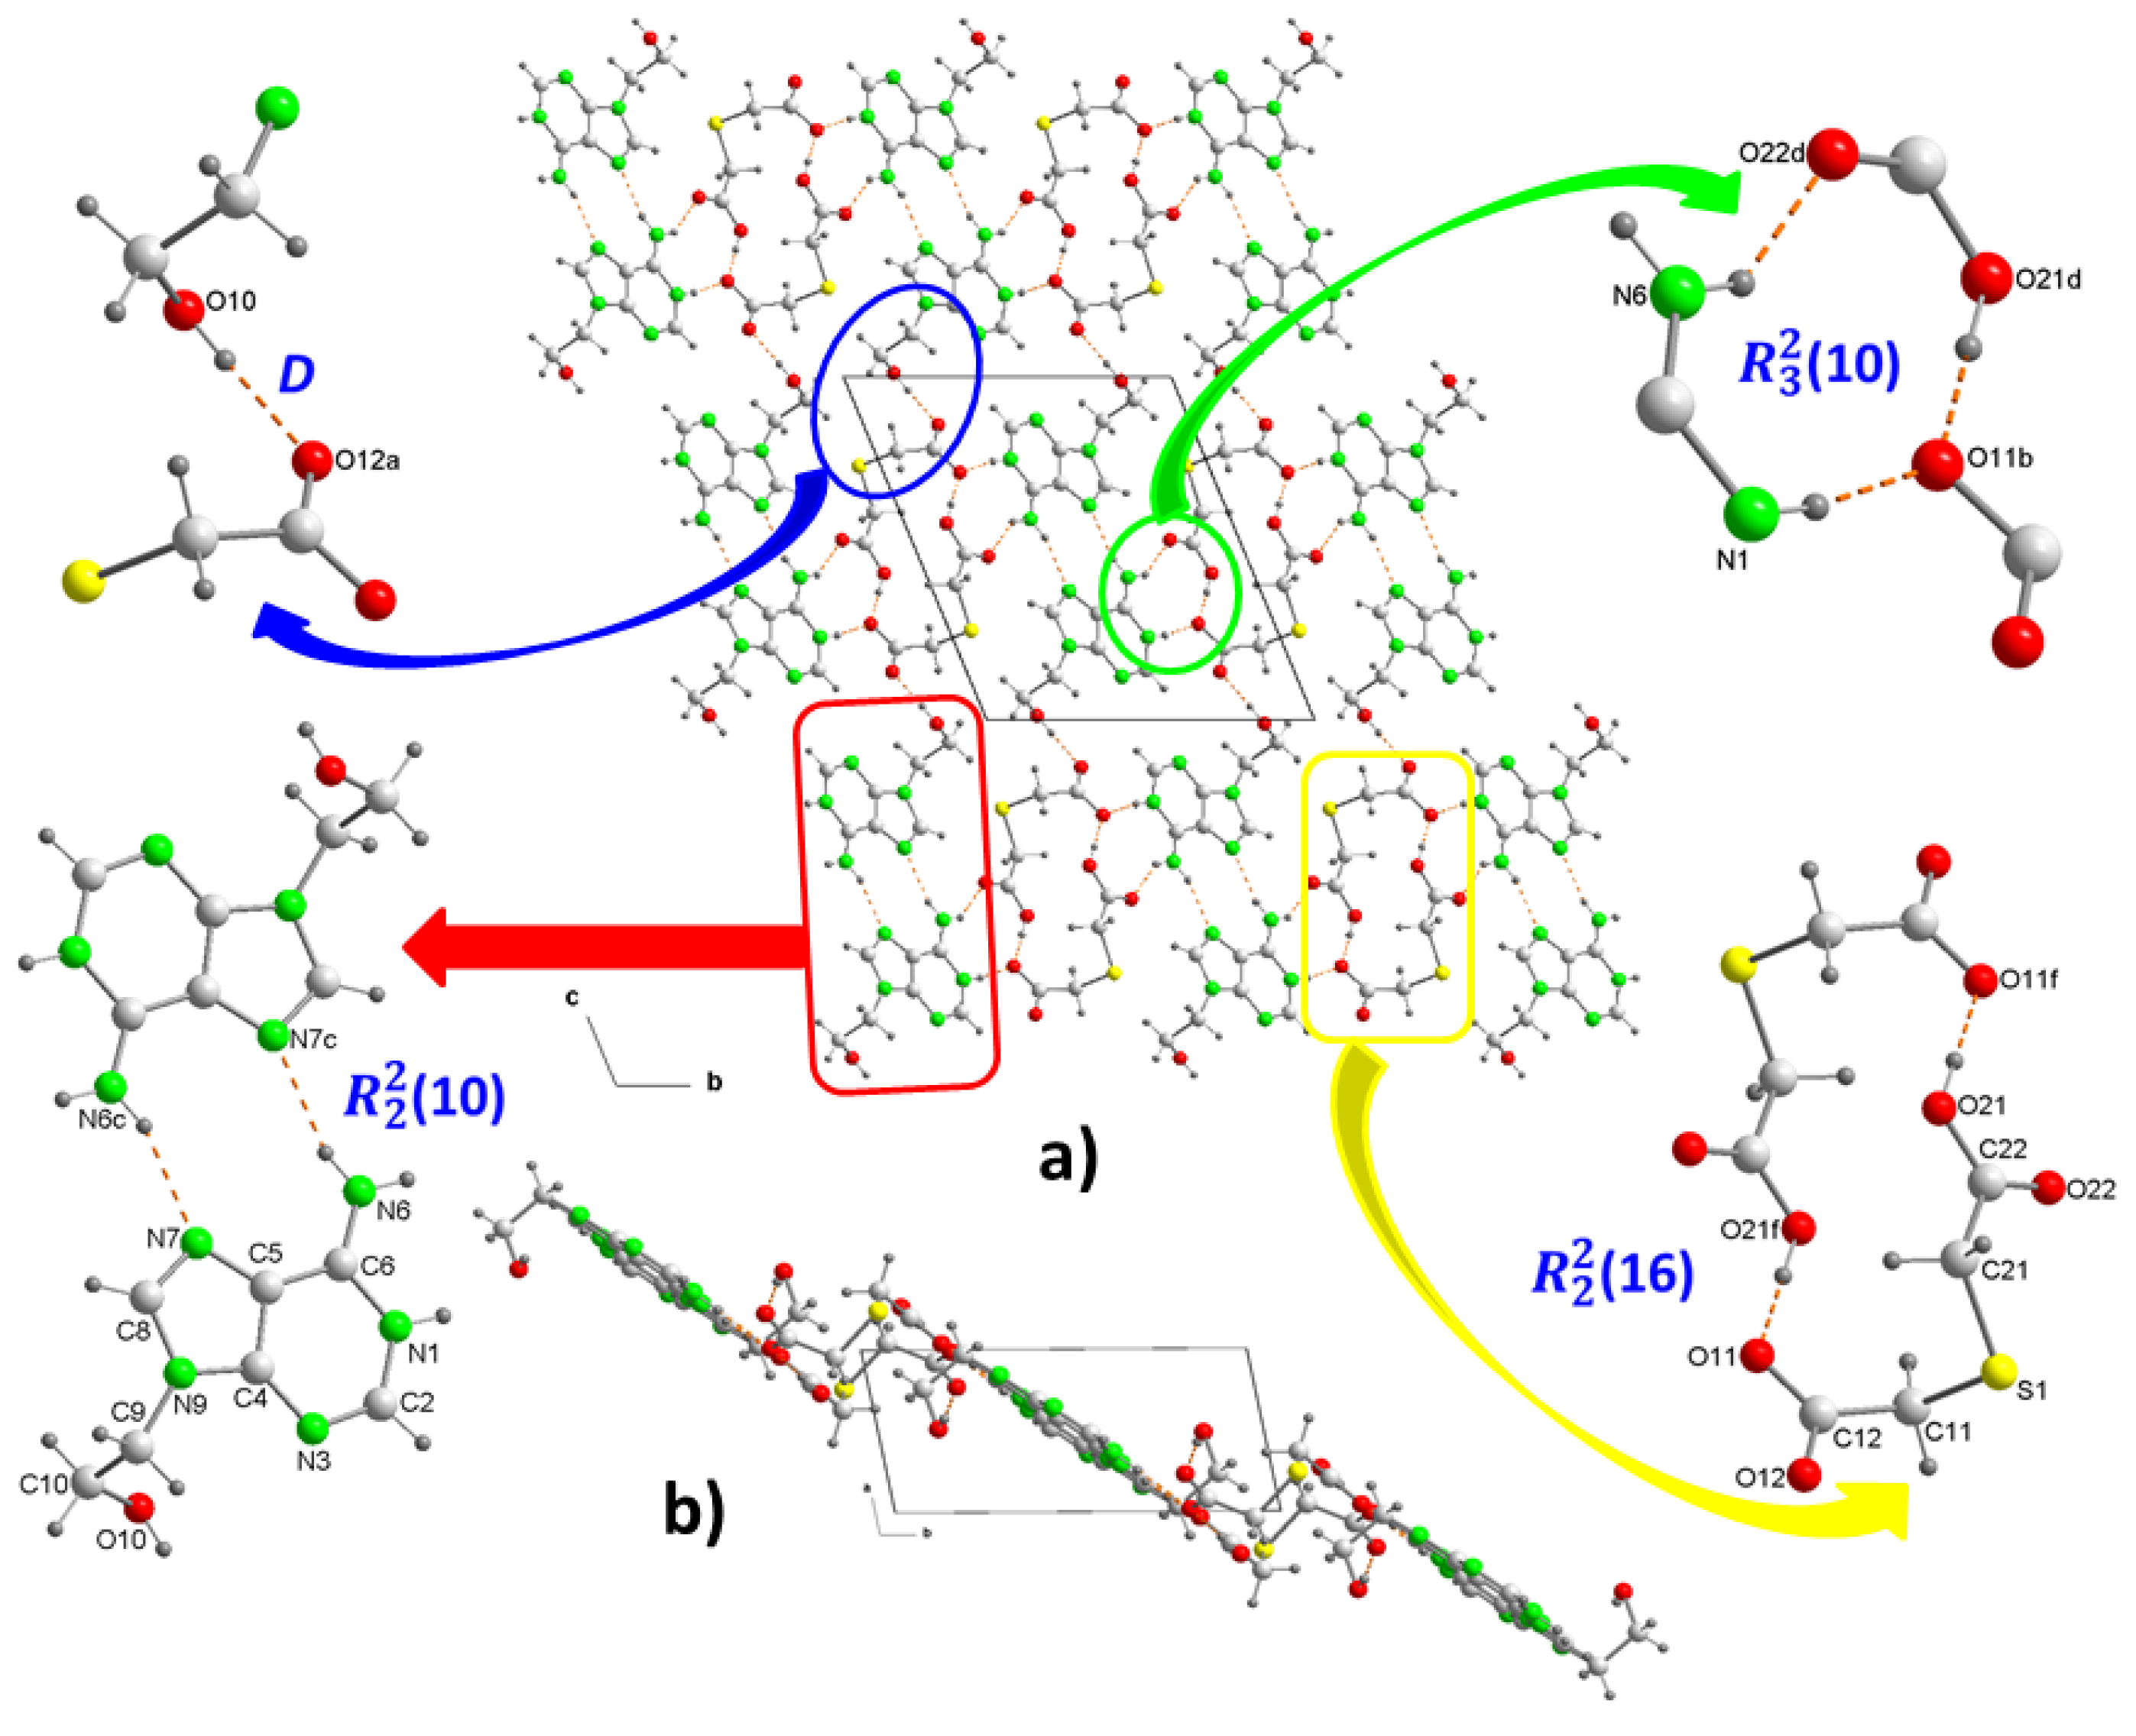
Figure 4.
Crystal packing in (2) projected onto the “bc” plane, showing the intermolecular interactions and the supramolecular synthons. For symmetry codes see tables.
Figure 4.
Crystal packing in (2) projected onto the “bc” plane, showing the intermolecular interactions and the supramolecular synthons. For symmetry codes see tables.
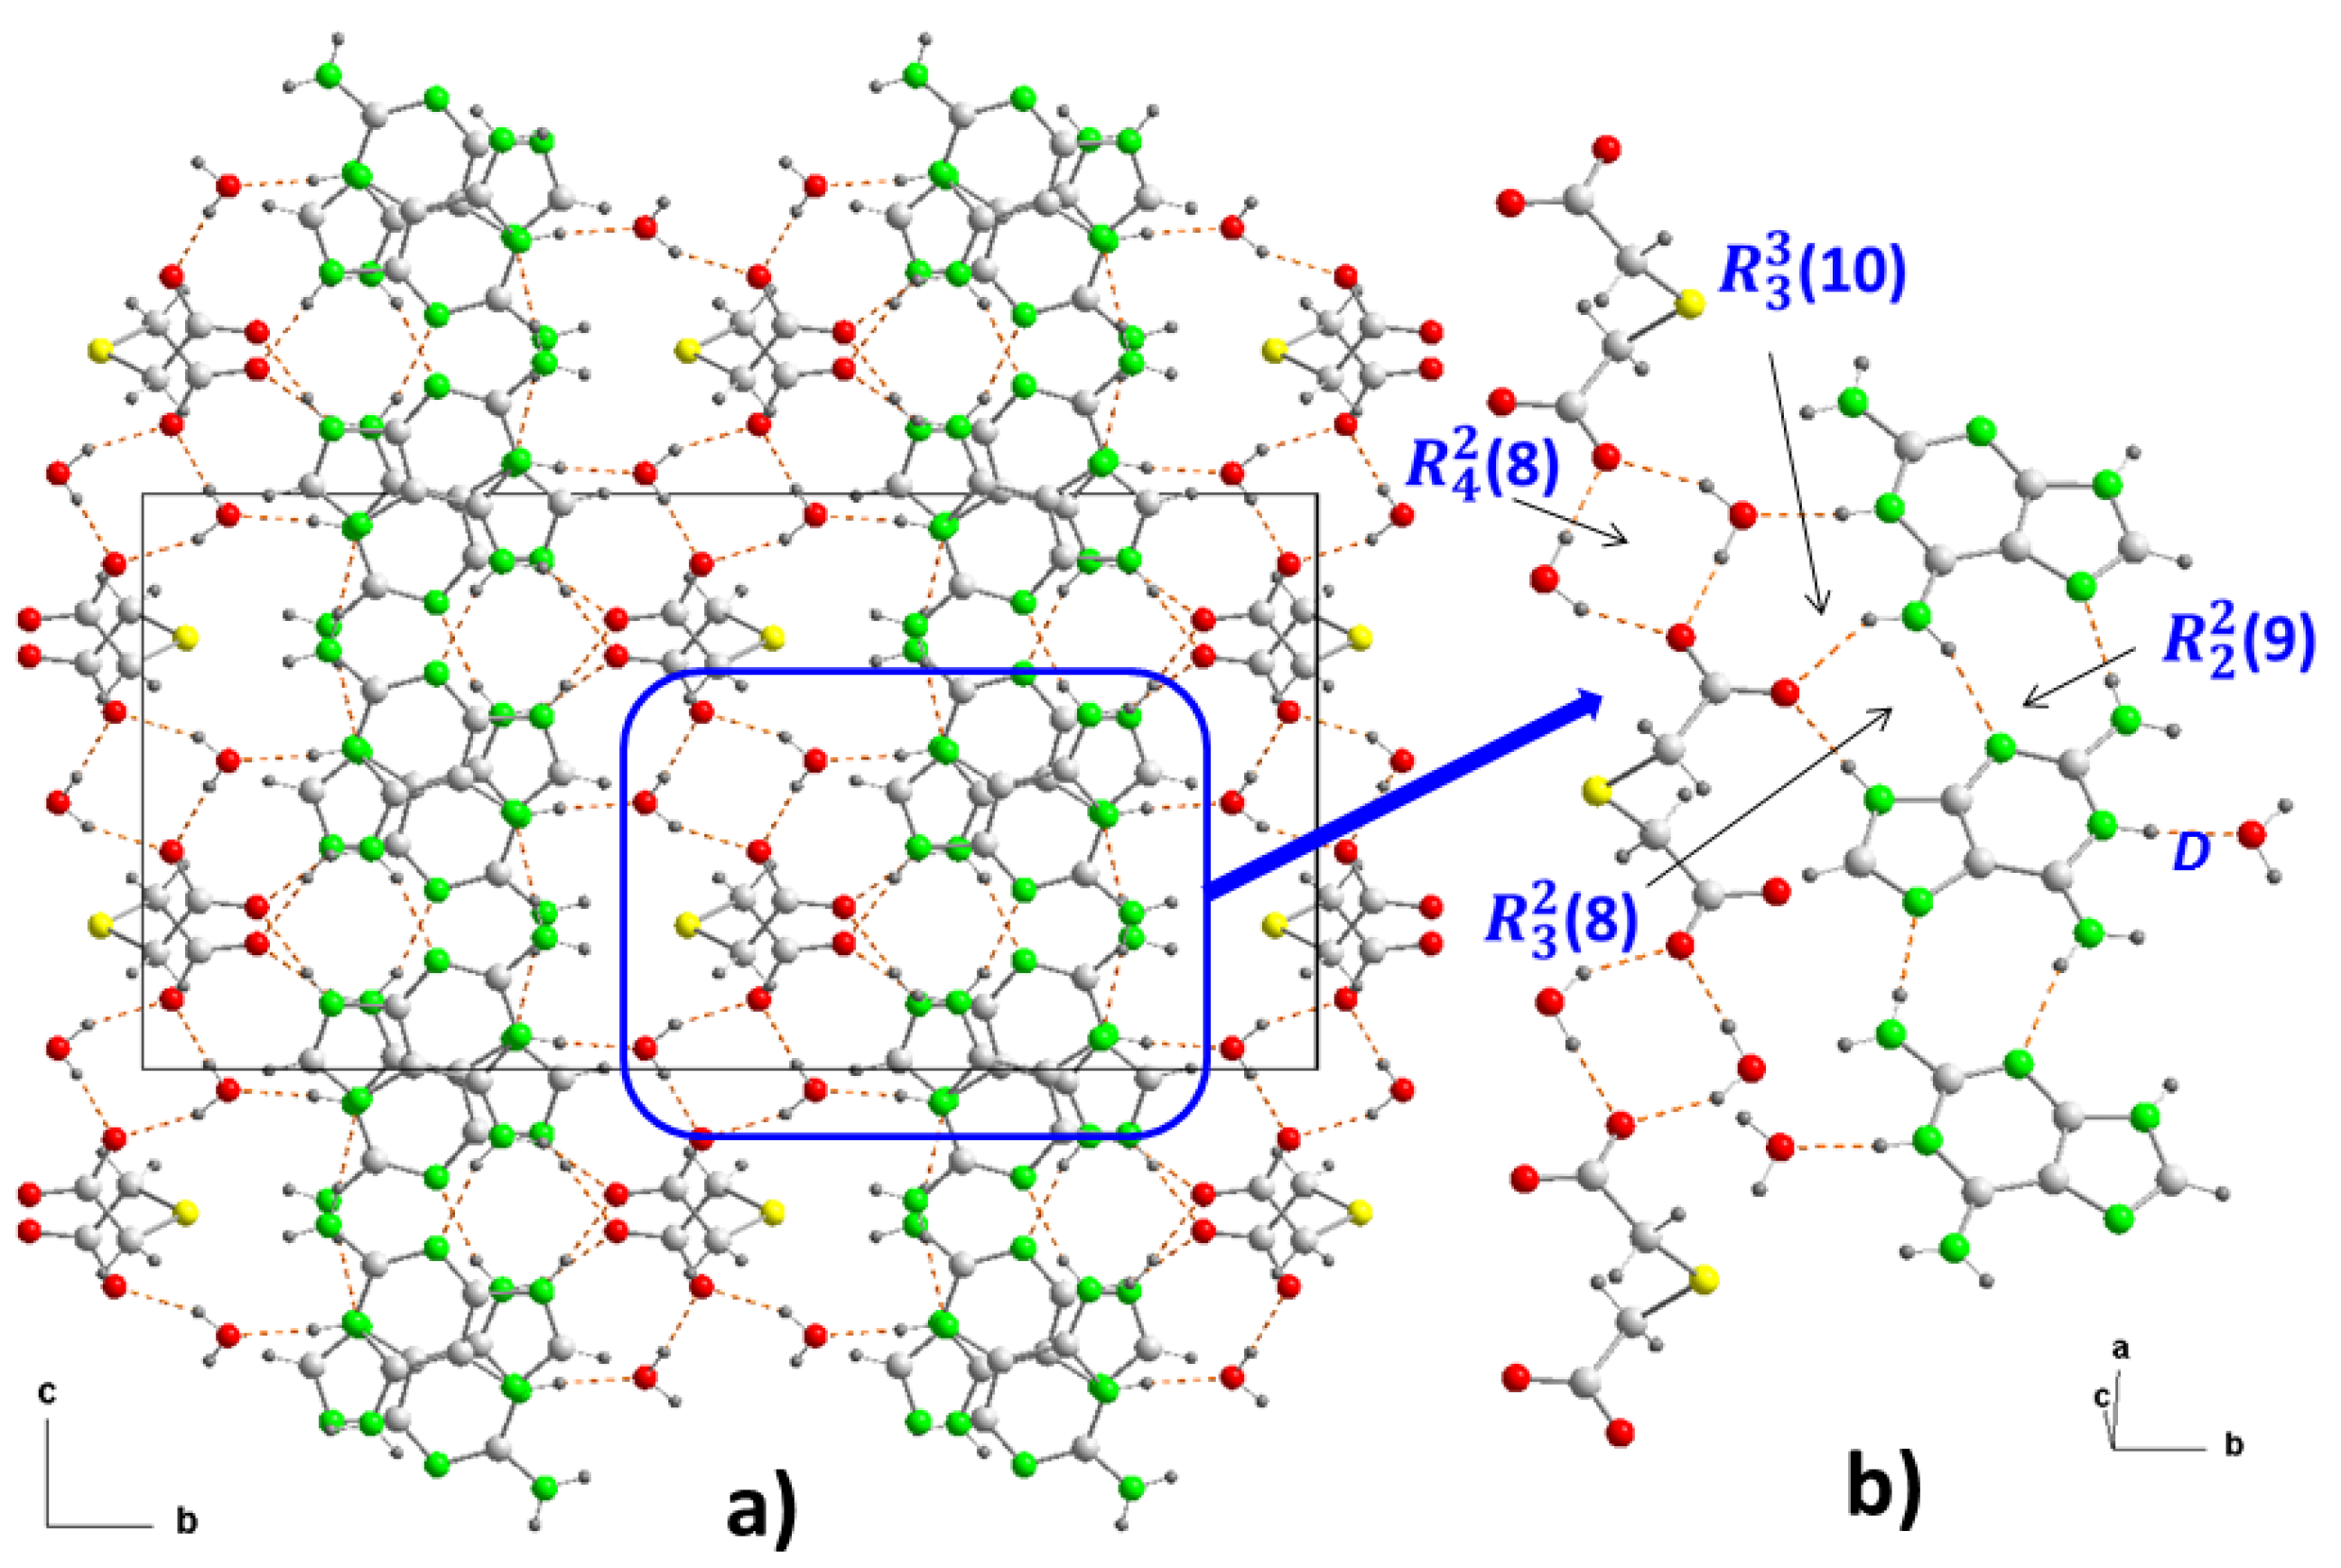
Figure 5.
(a) Detail of the hydrogen bonding interactions at (2), between the anionic substructure and two cationic substructures, and (b) view in the direction perpendicular to the b-axis.
Figure 5.
(a) Detail of the hydrogen bonding interactions at (2), between the anionic substructure and two cationic substructures, and (b) view in the direction perpendicular to the b-axis.
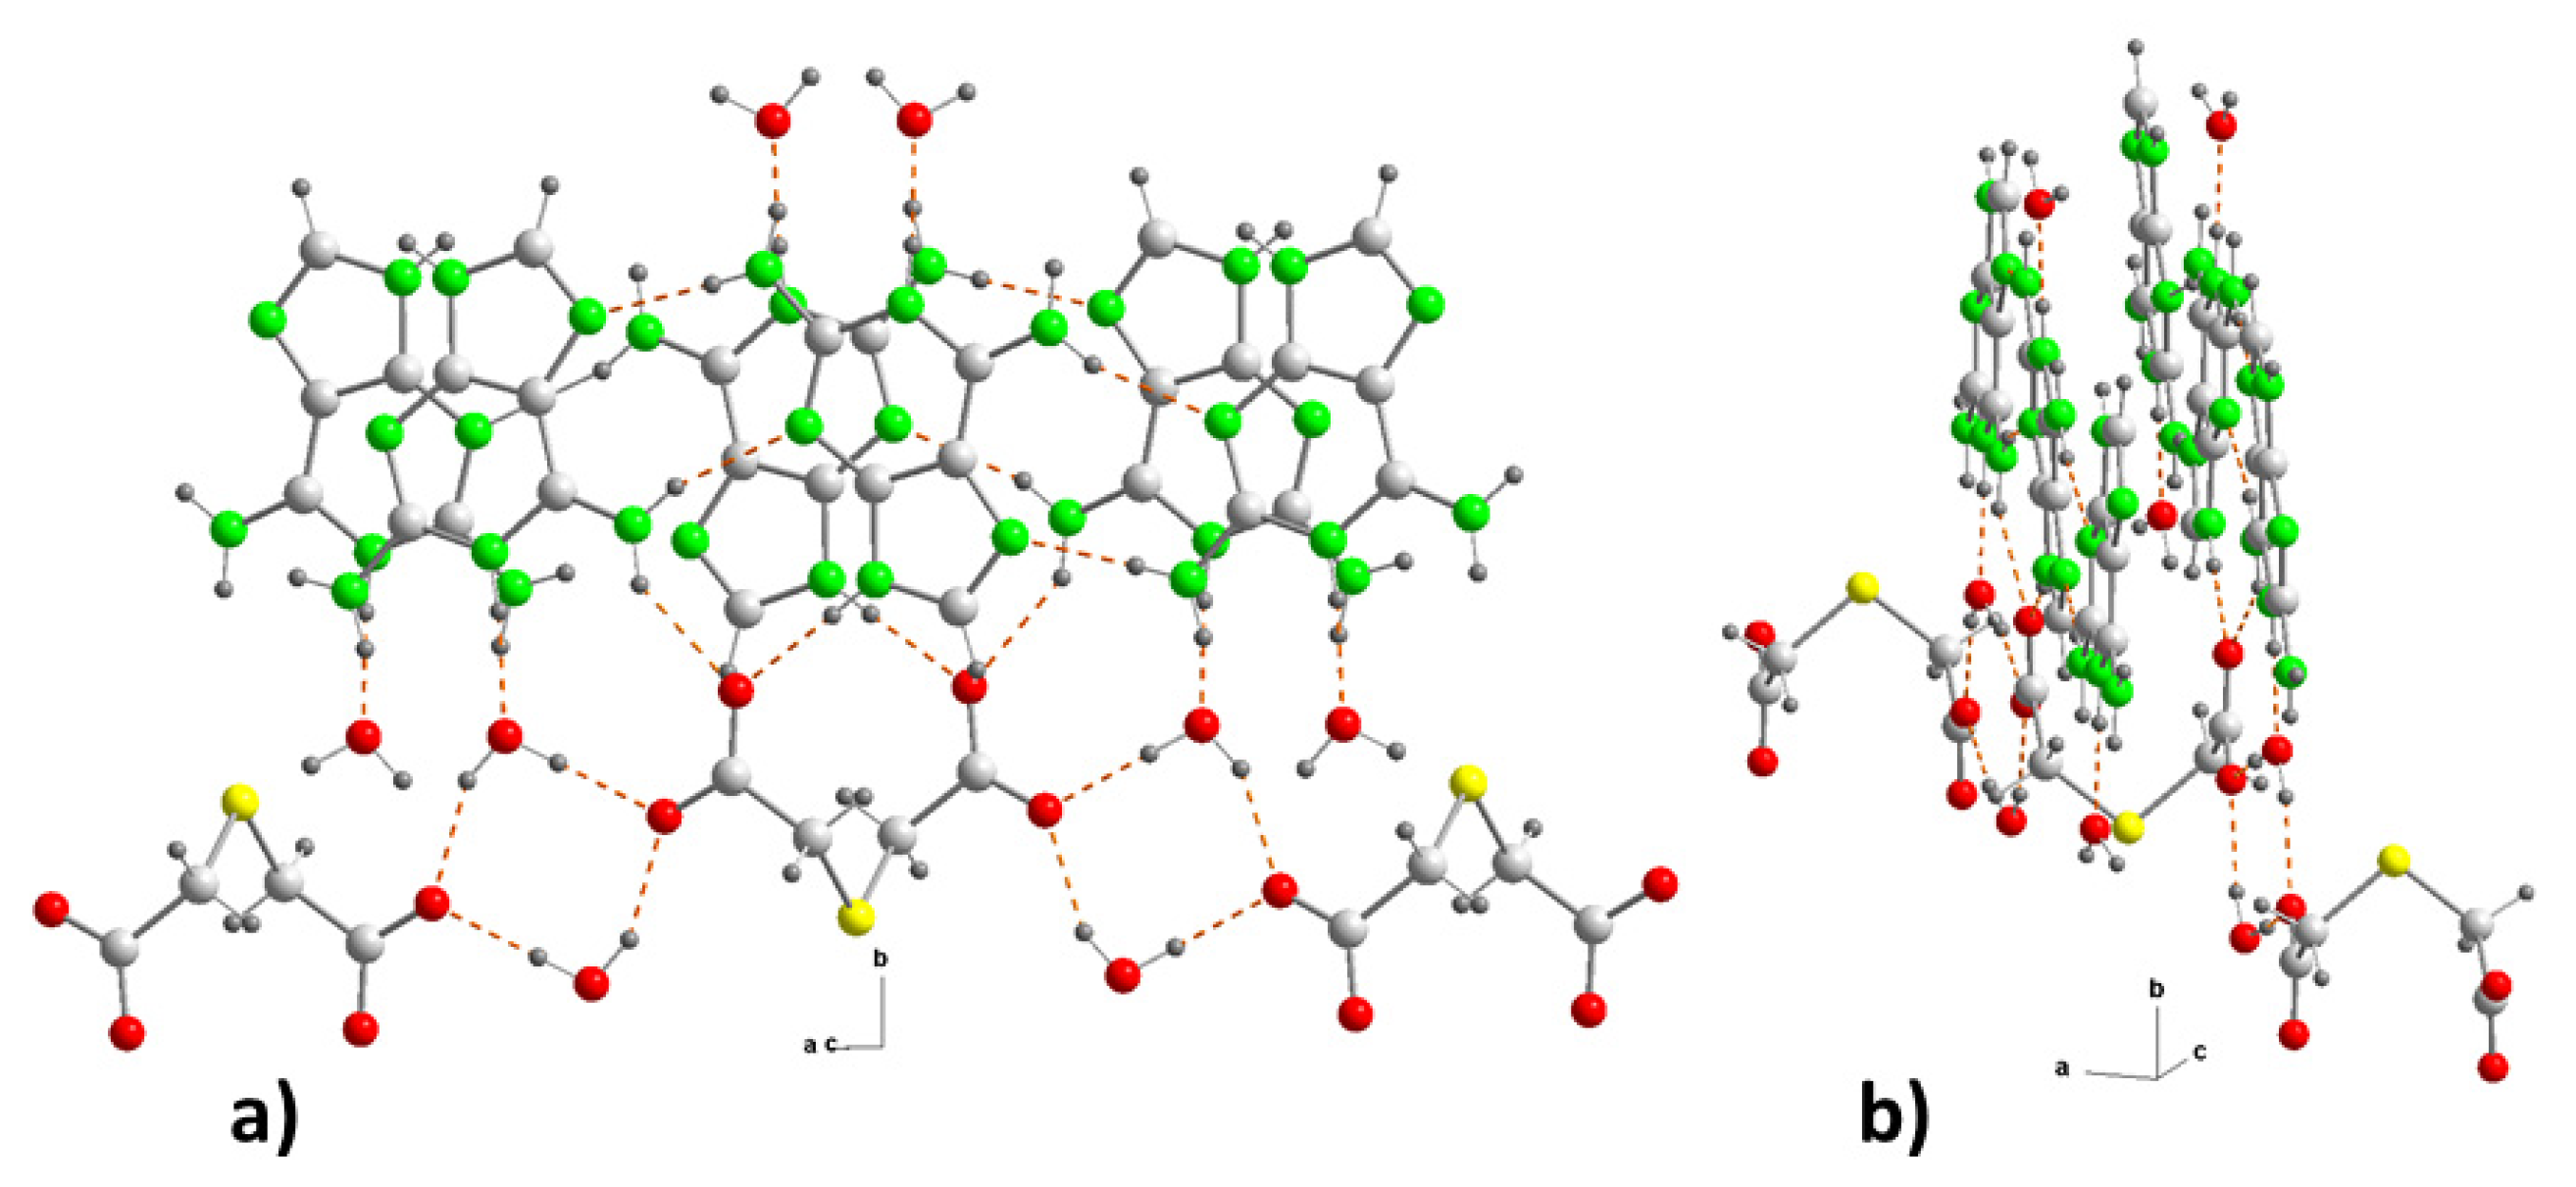
Figure 6.
(a) Crystal packing in (2) projected onto the “ac” plane showing the layered structure along the b-axis. (b) Detail of the π−π stacking interactions in (2) along the “ca” direction. Hydrogen bonds are shown as orange dashed lines and ring-ring interactions as blue dashed lines. For symmetry codes see tables.
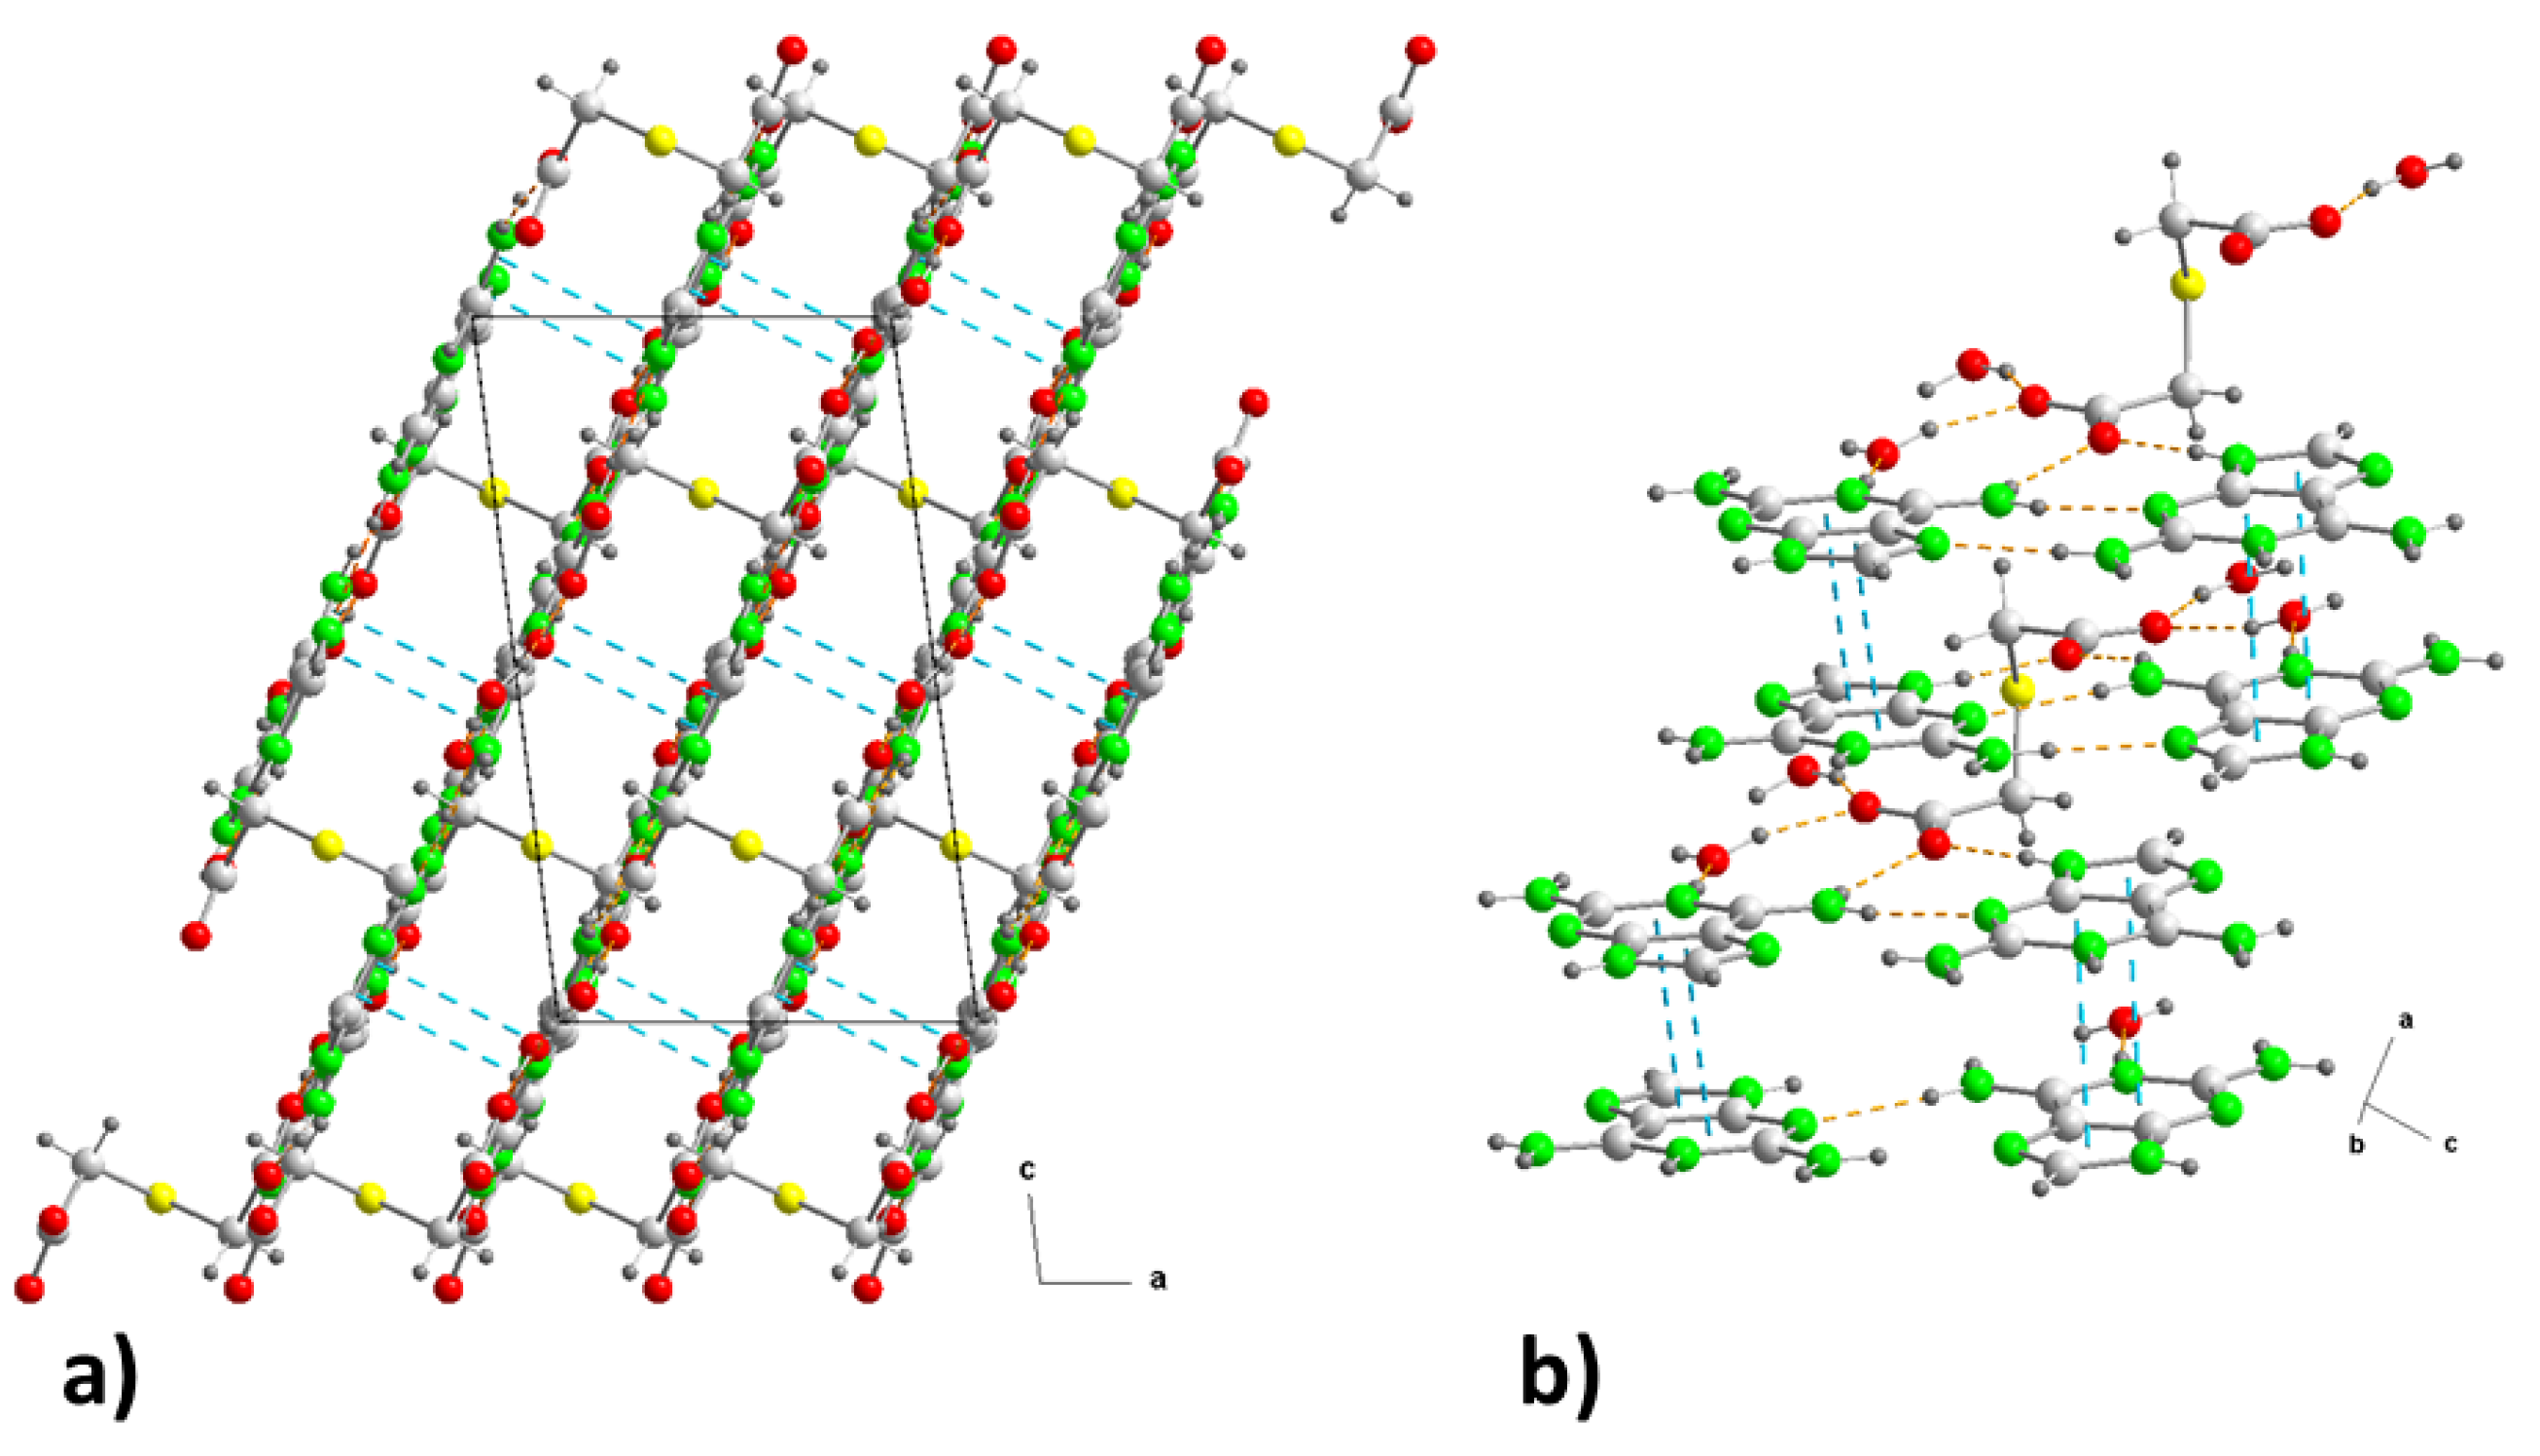
Figure 7.
TGA behavior of compounds 1 (left) and 2 (right).
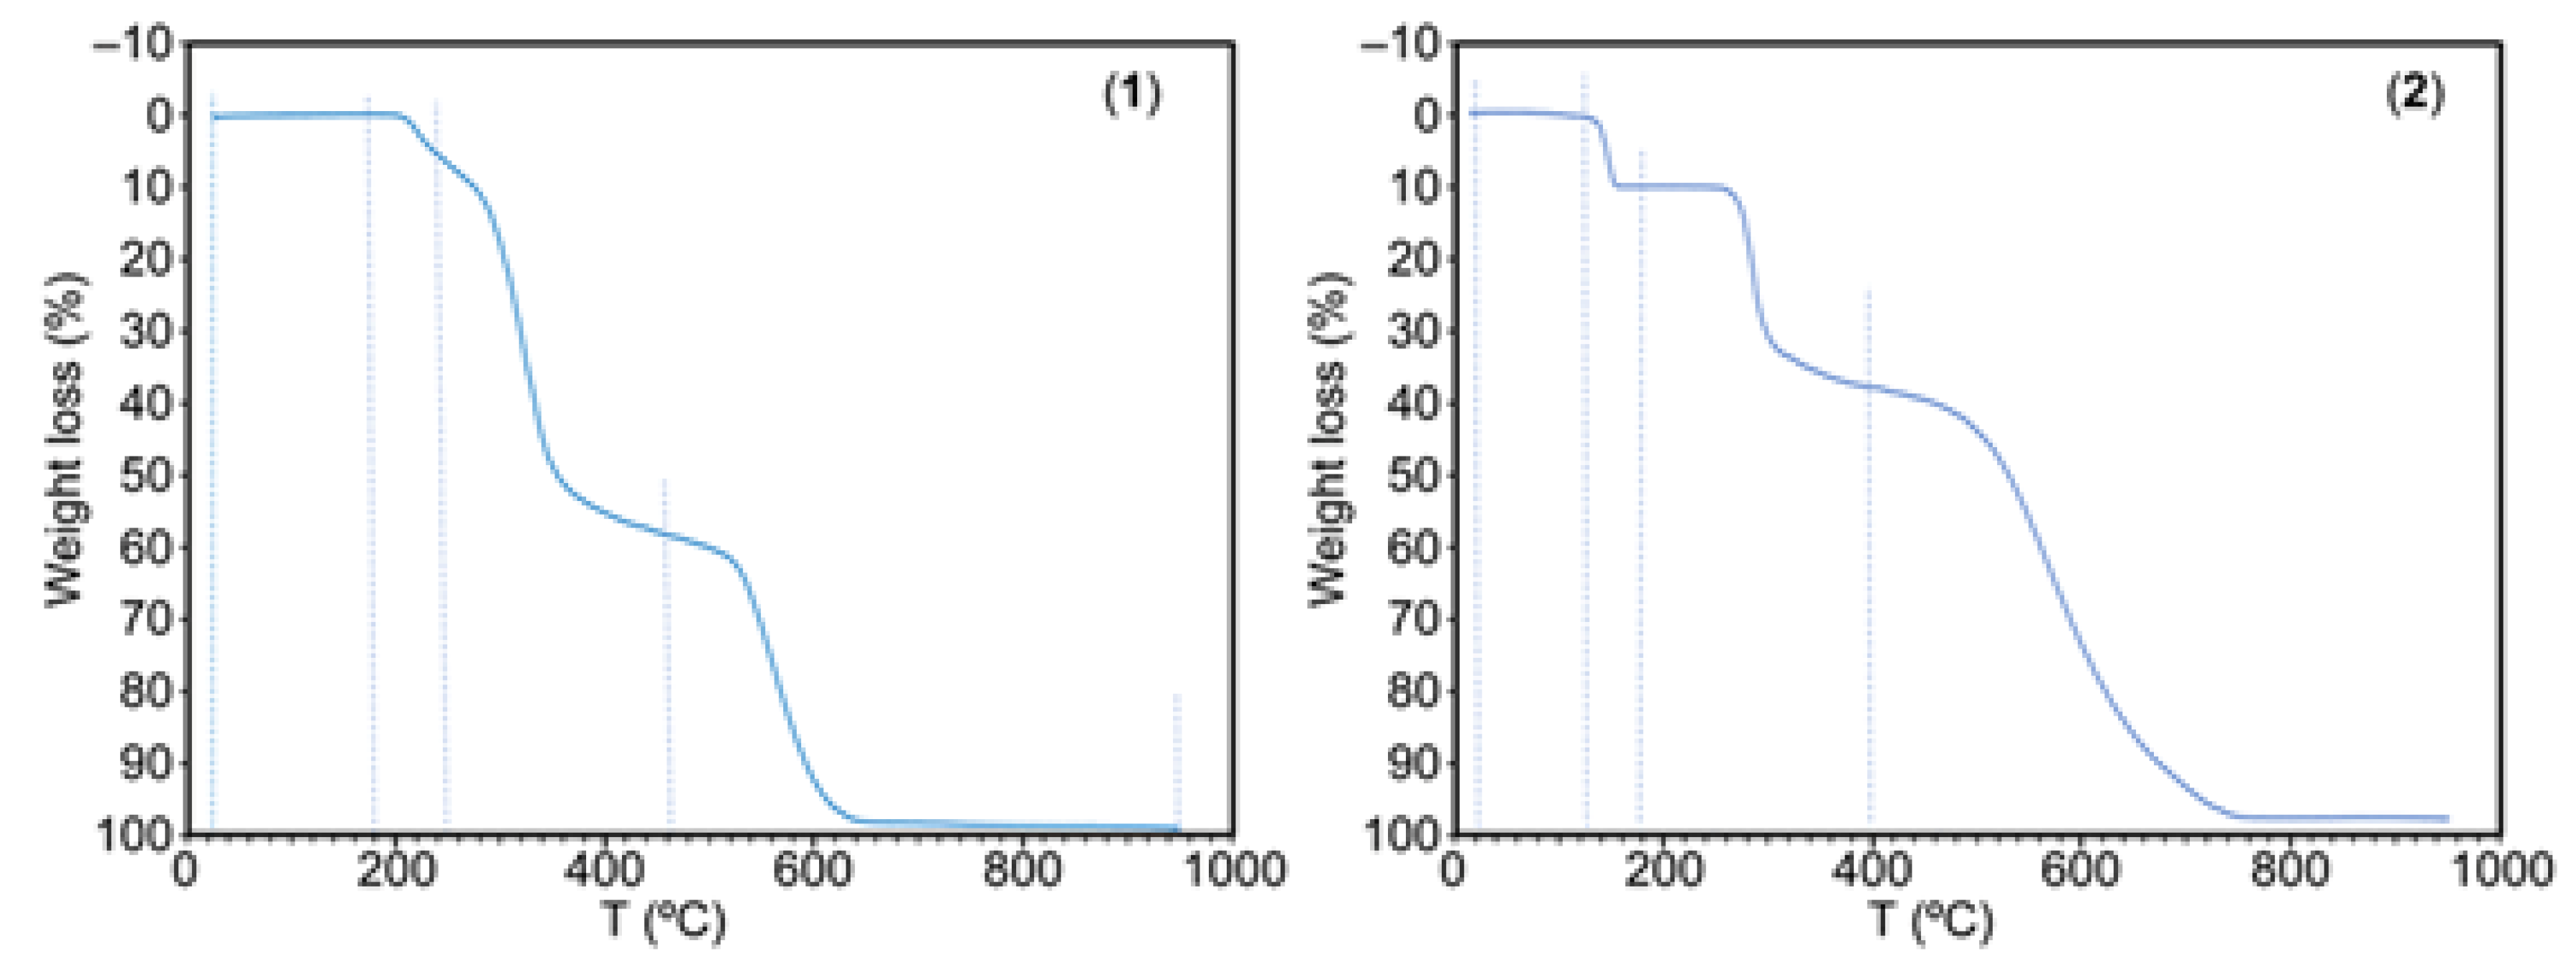
Figure 8.
MEP surfaces of the salts of 1 (a) and a model of 2 (b) at the PBE0-D3/def2-TZVP level of theory (density isovalue 0.001 a.u.). The energies are given in kcal/mol.
Figure 8.
MEP surfaces of the salts of 1 (a) and a model of 2 (b) at the PBE0-D3/def2-TZVP level of theory (density isovalue 0.001 a.u.). The energies are given in kcal/mol.
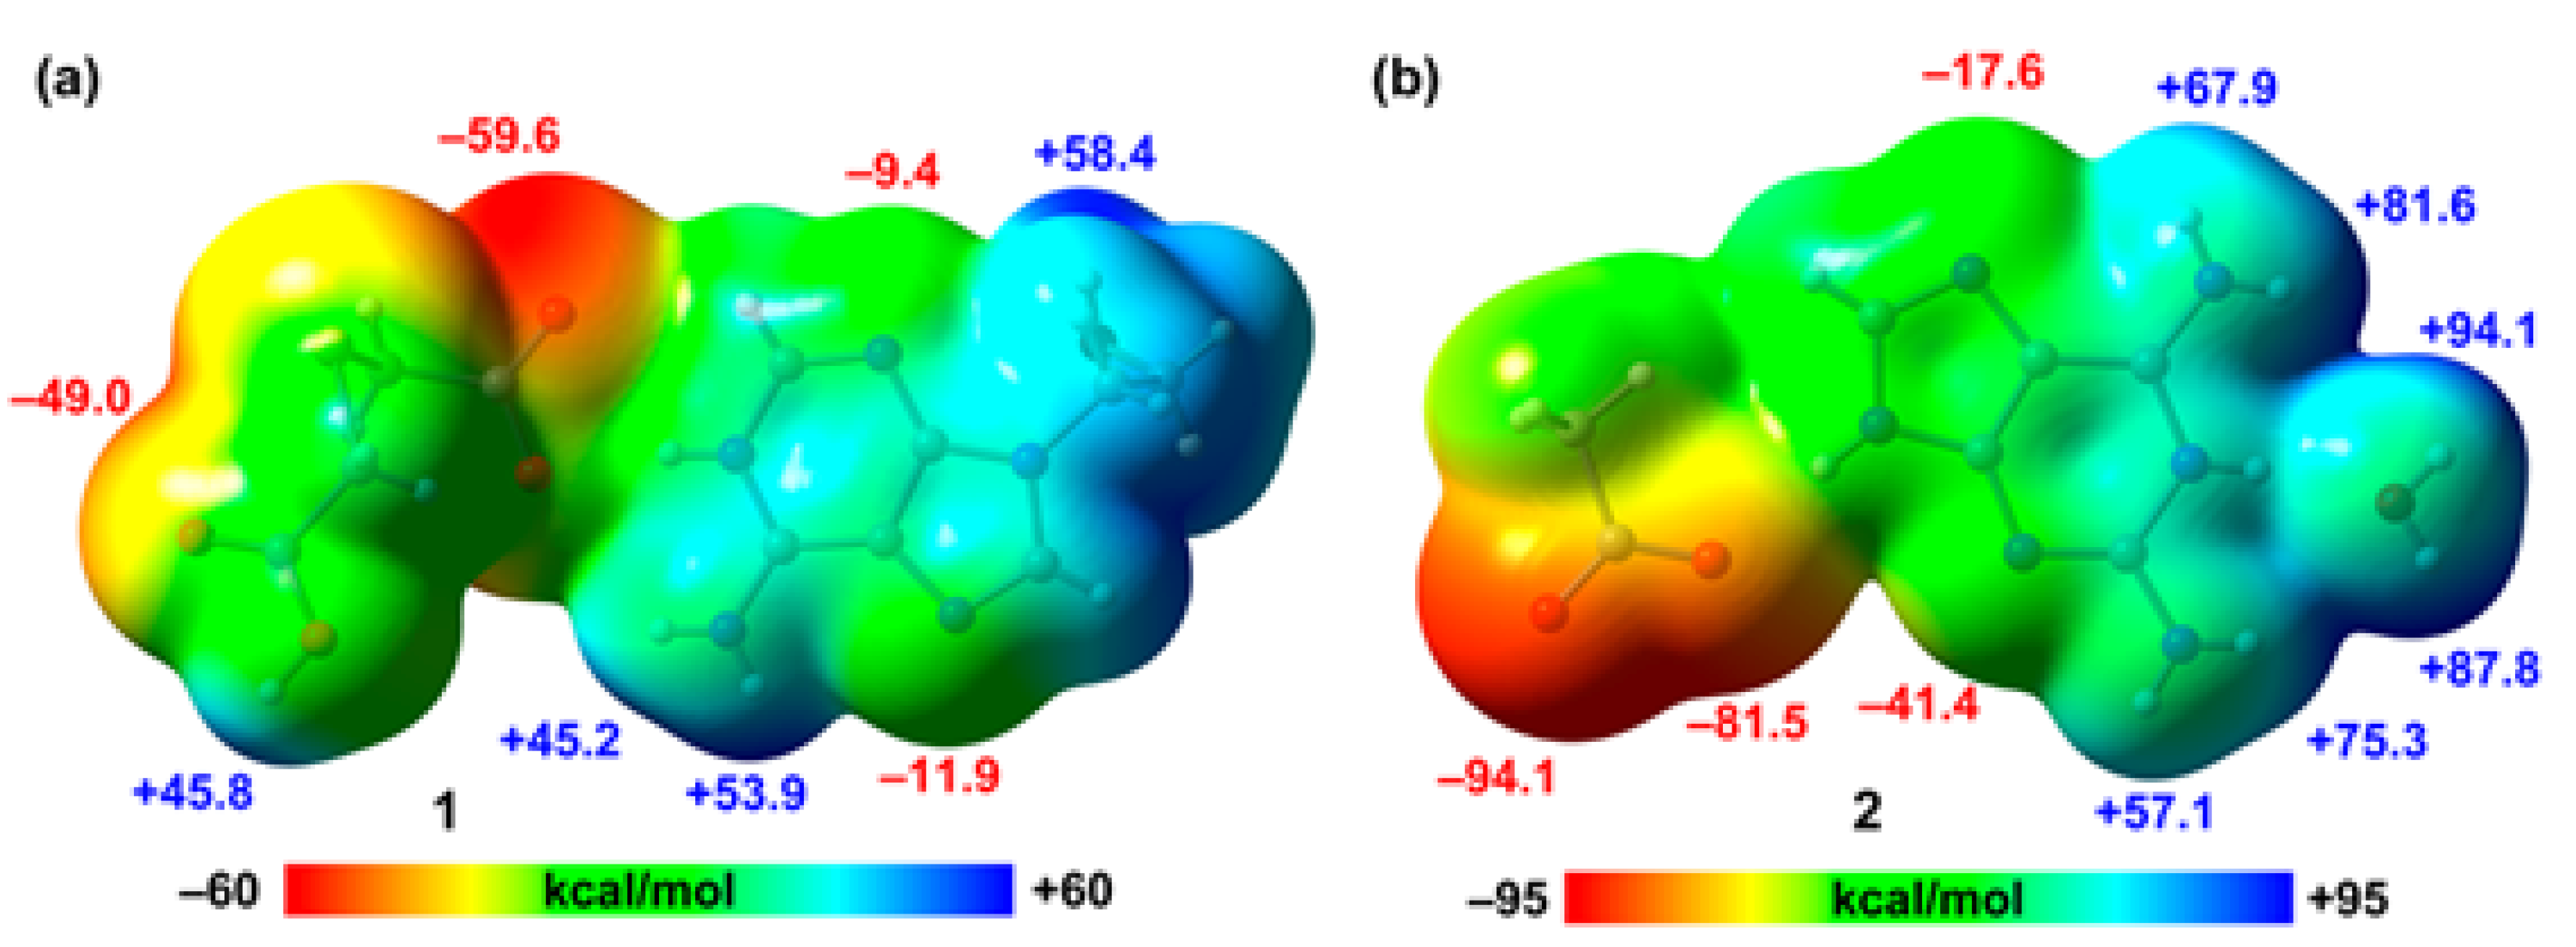
Figure 9.
QTAIM/NCIPlot analysis of intermolecular bond CPs (red spheres), bond paths and RDG isosurfaces of the H-bonded dimer (a) and tetramer of (b) of compound 1. The individual association energies of the H-bonds are indicated using a red font next to the bond CPs.
Figure 9.
QTAIM/NCIPlot analysis of intermolecular bond CPs (red spheres), bond paths and RDG isosurfaces of the H-bonded dimer (a) and tetramer of (b) of compound 1. The individual association energies of the H-bonds are indicated using a red font next to the bond CPs.
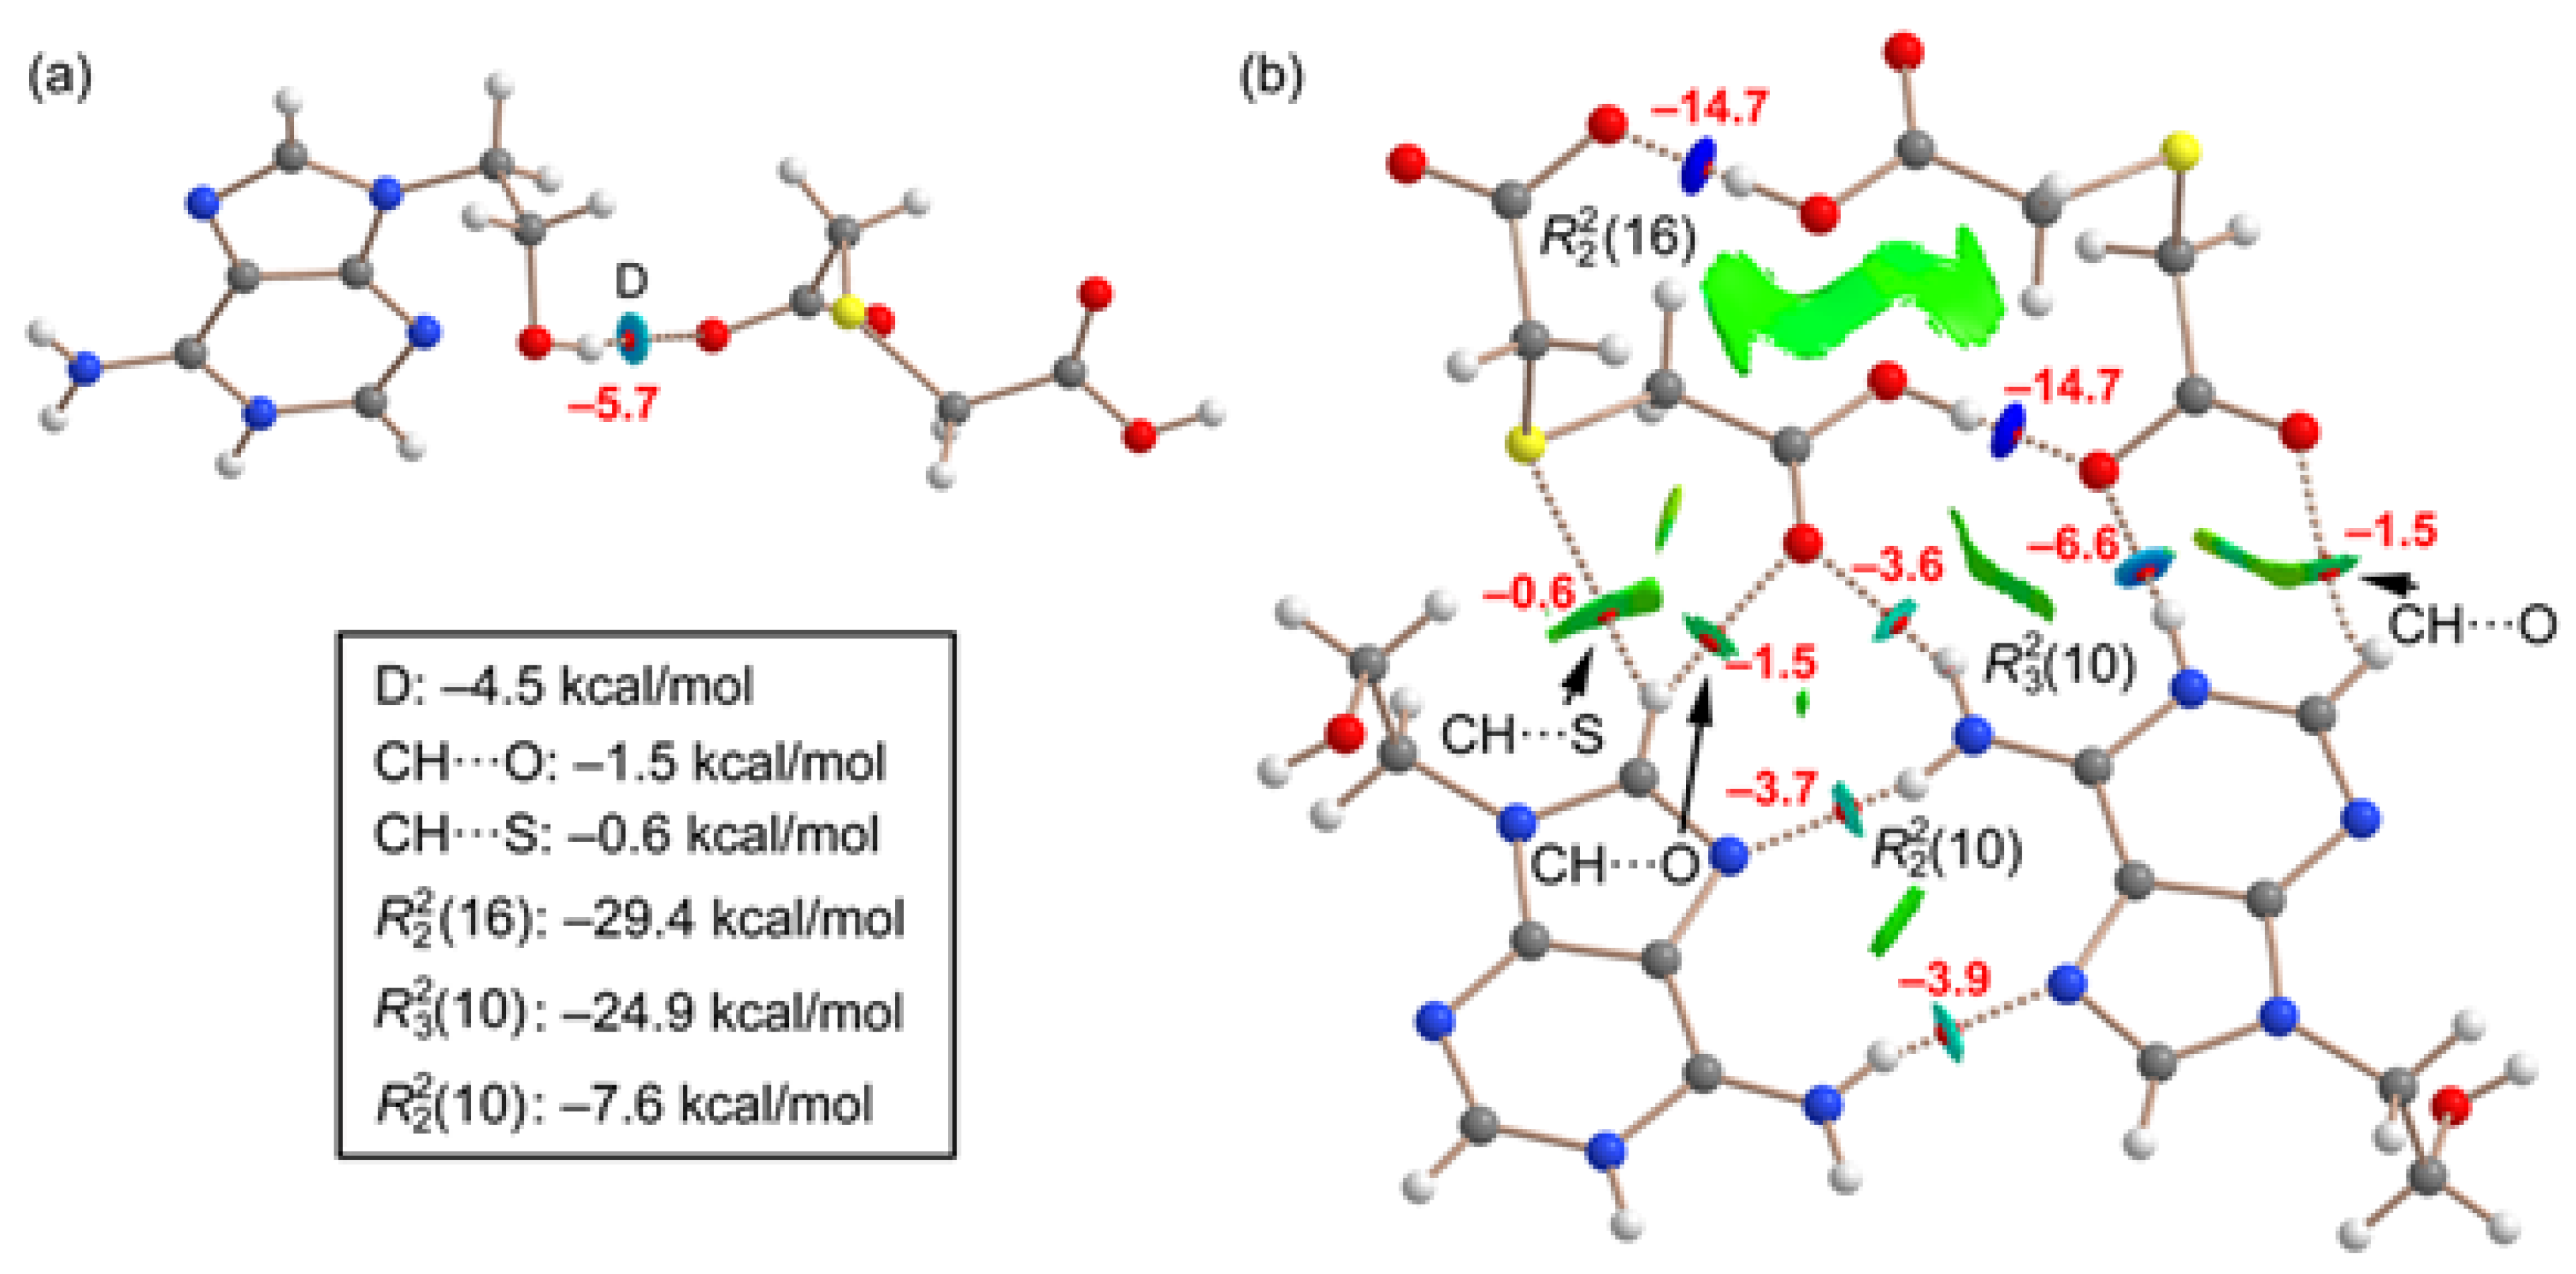
Figure 10.
QTAIM/NCIPlot analysis of intermolecular bond CPs (red spheres), bond paths and RDG isosurfaces of the H-bonded assembly of compound 2. The individual association energies of the H-bonds are indicated using a red font next to the bond CPs.
Figure 10.
QTAIM/NCIPlot analysis of intermolecular bond CPs (red spheres), bond paths and RDG isosurfaces of the H-bonded assembly of compound 2. The individual association energies of the H-bonds are indicated using a red font next to the bond CPs.
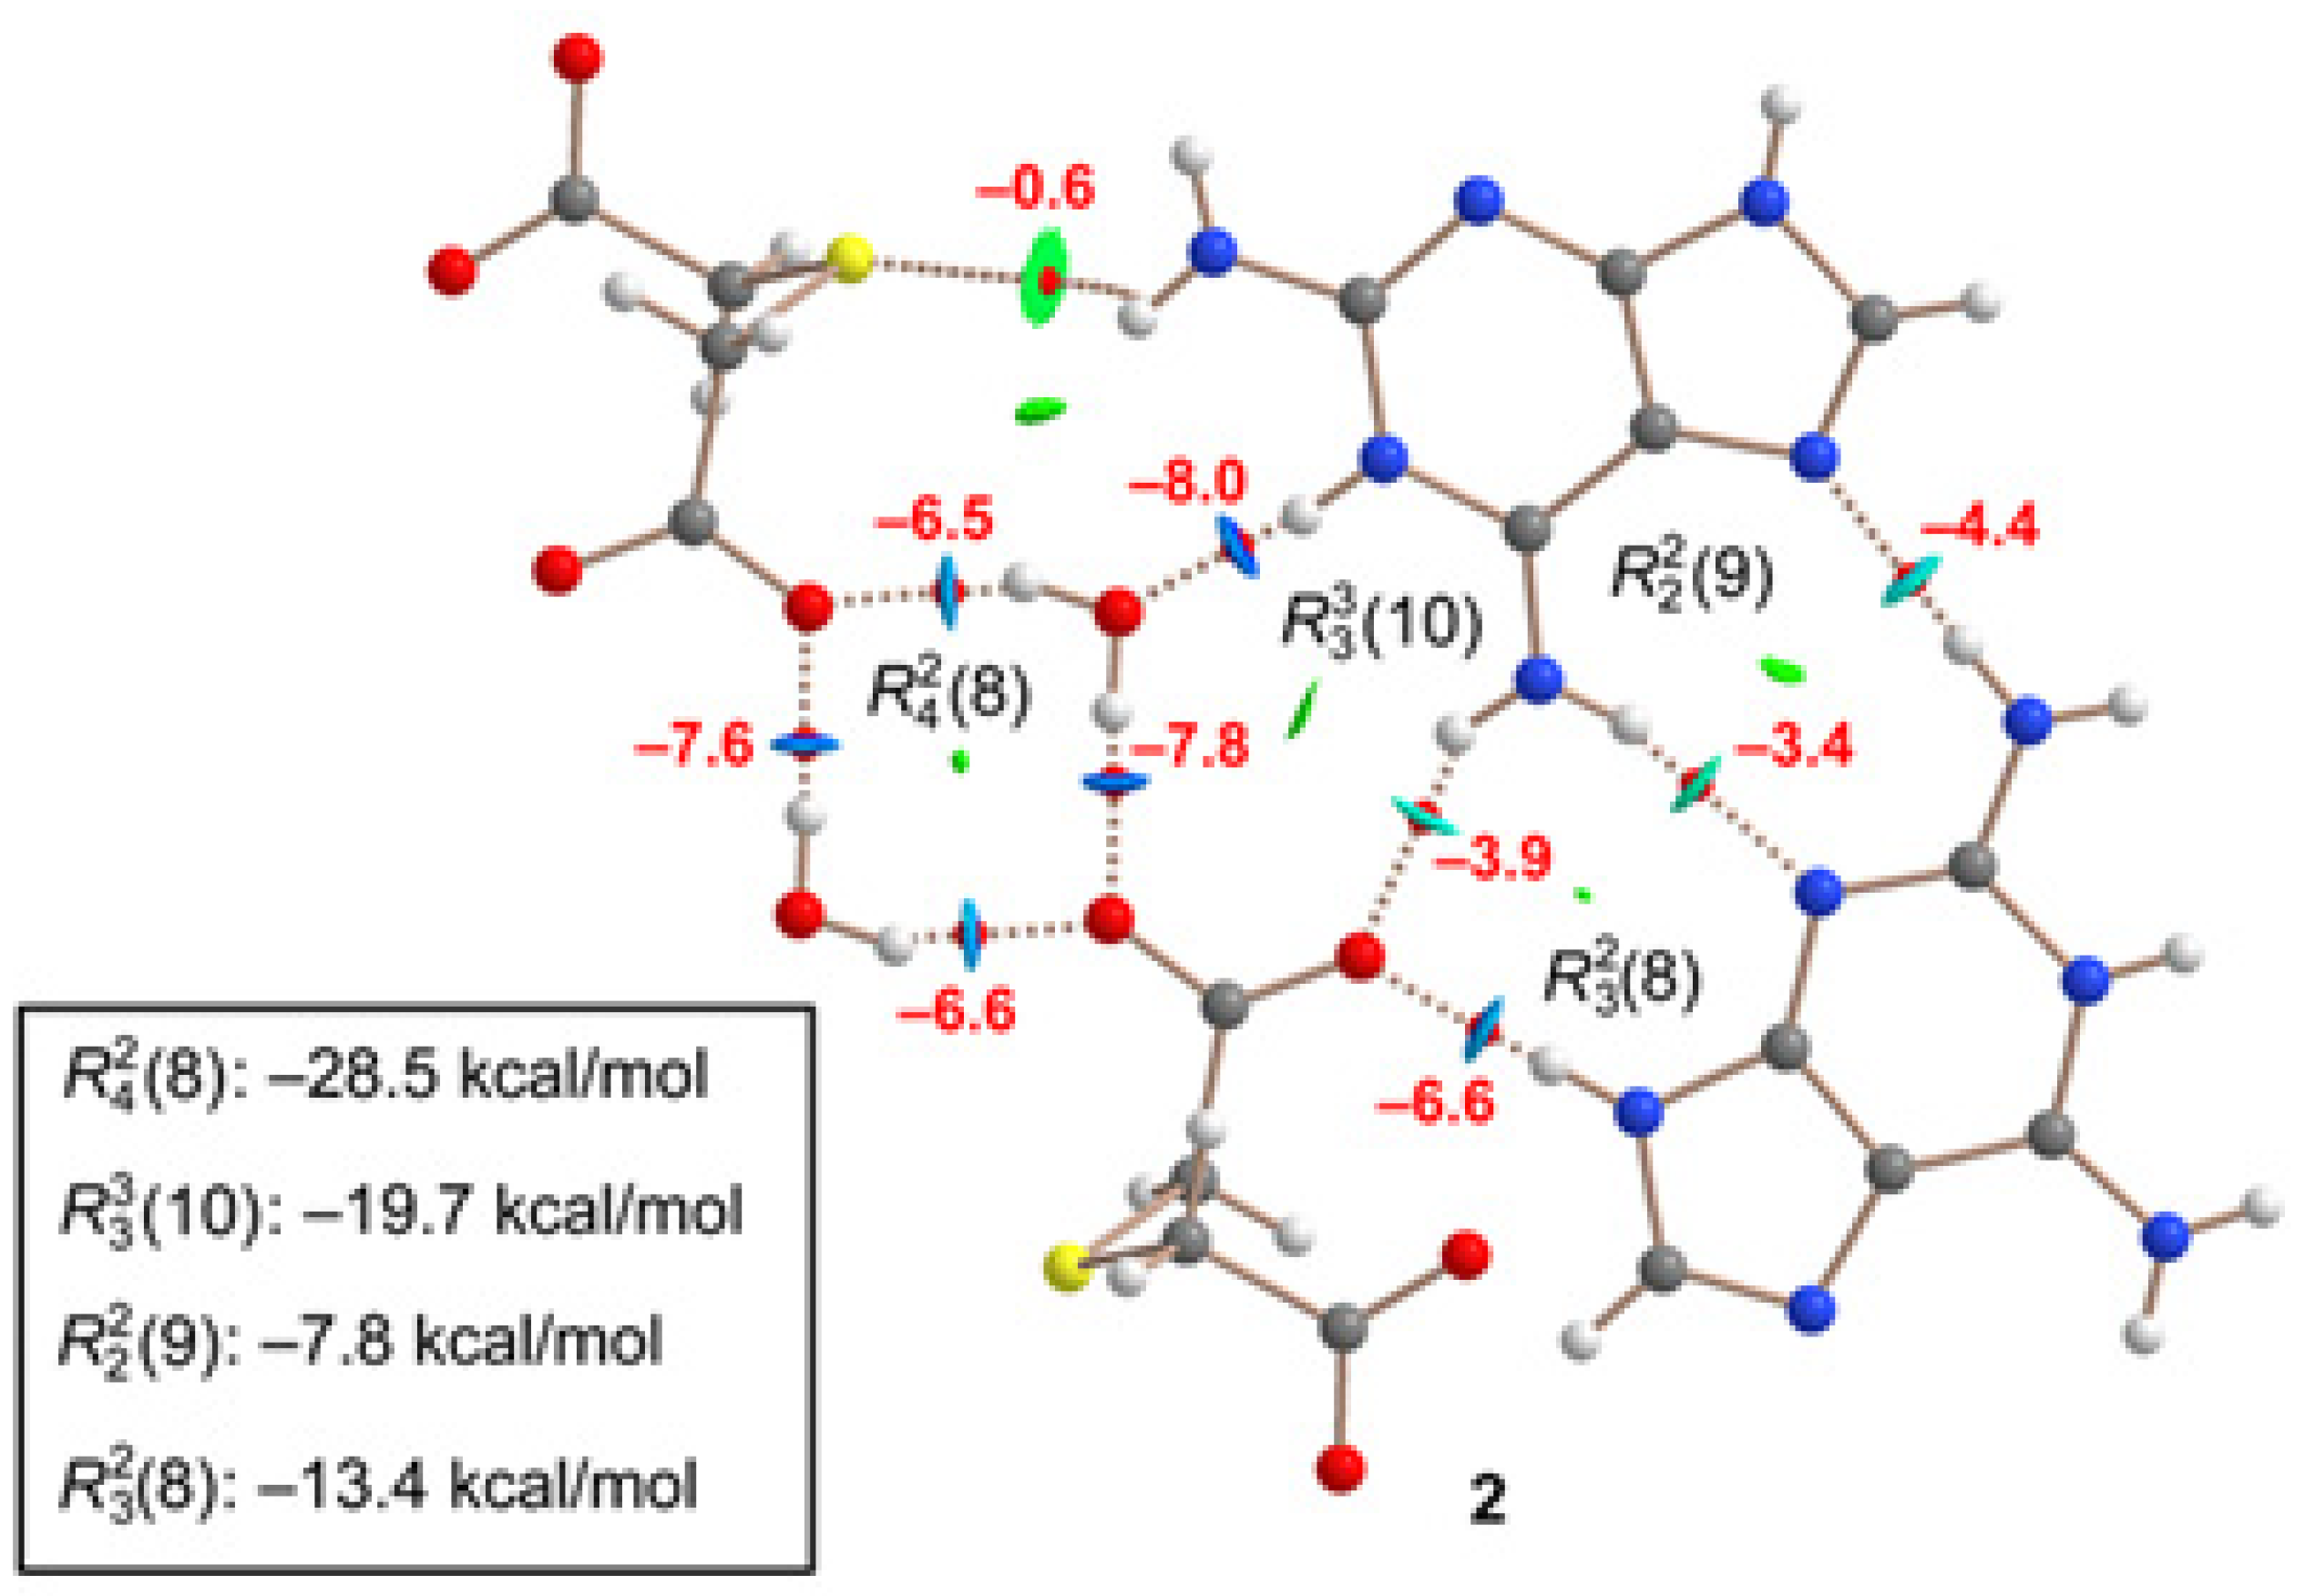
Figure 11.
QTAIM/NCIPlot analysis of a model of the π-π-stacking assembly of compound 2 and the computed dimerization energy.
Figure 11.
QTAIM/NCIPlot analysis of a model of the π-π-stacking assembly of compound 2 and the computed dimerization energy.
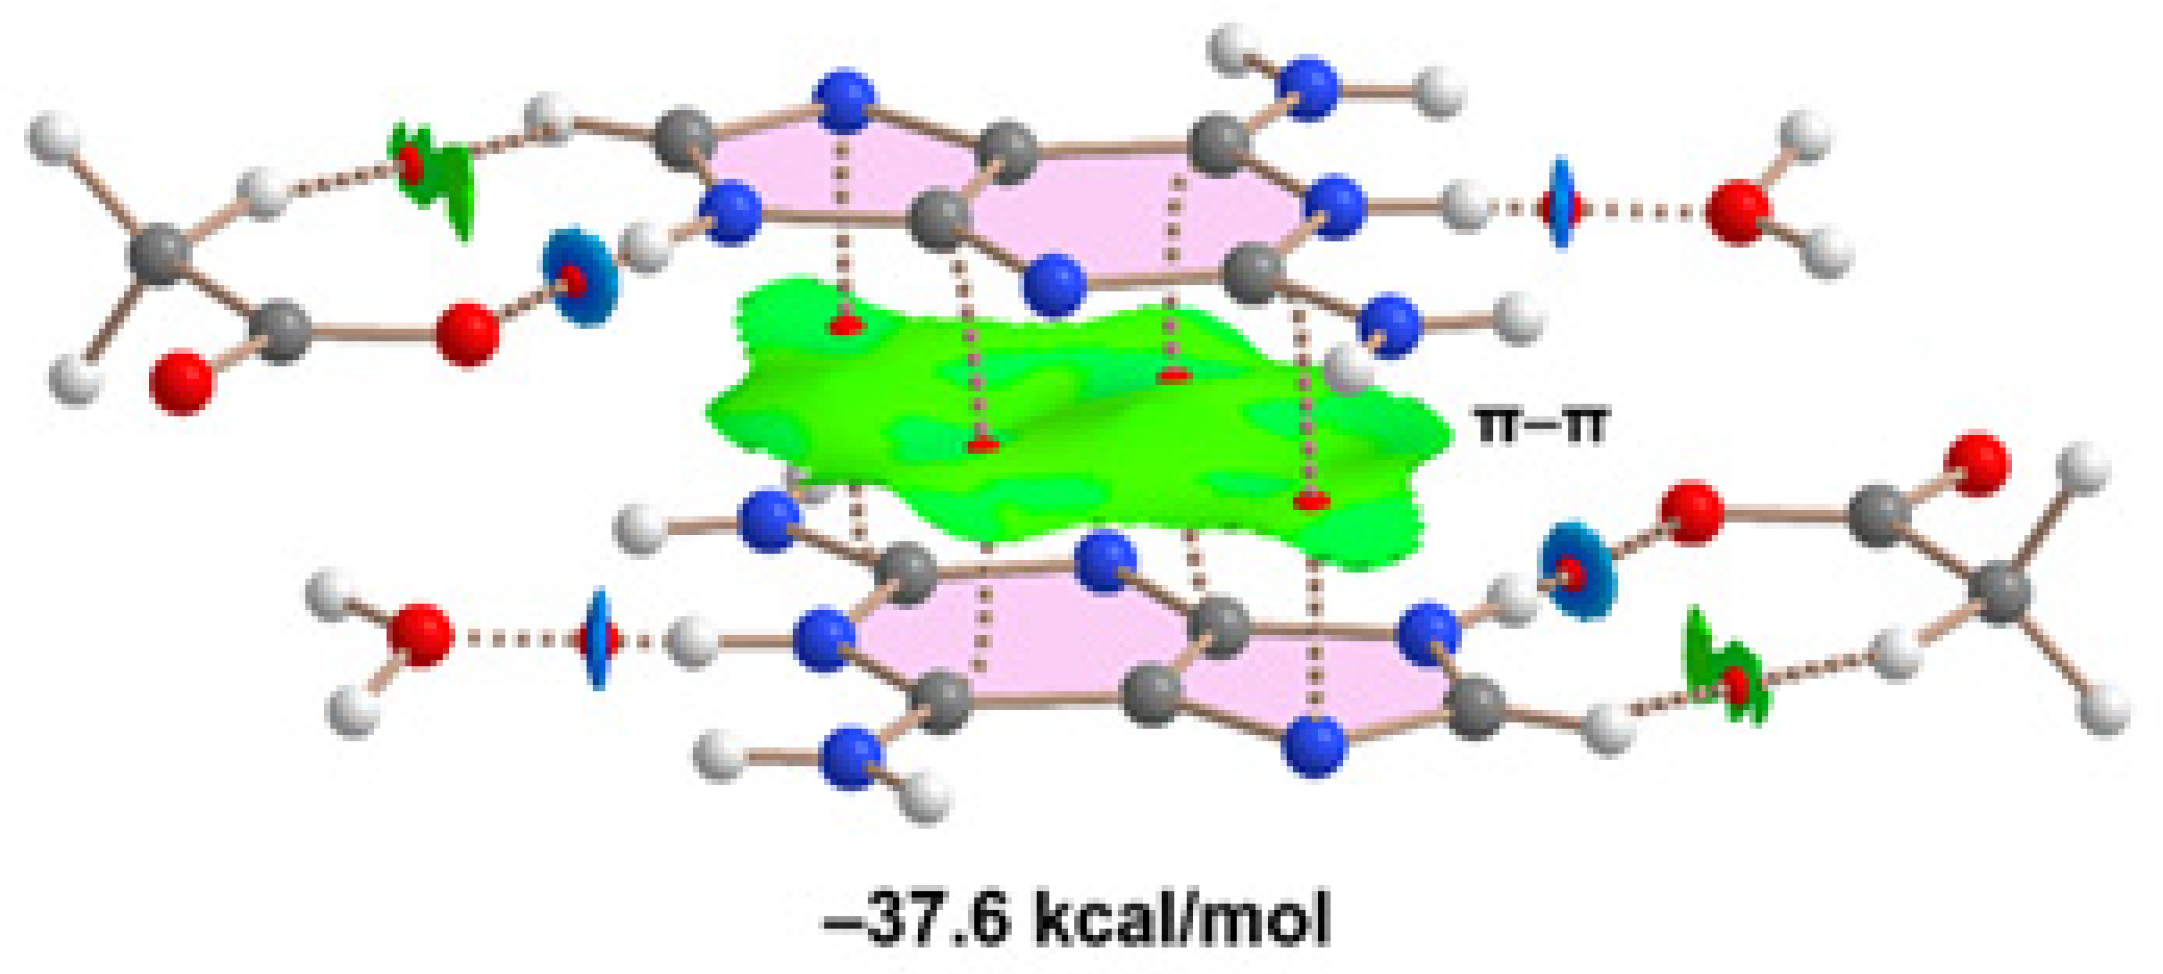

Table 1.
Crystal data and structure refinement for [(H9Heade+)(Htda−)] (1) and [(Hdap+)2(tda2−)]·2H2O (2).
Table 1.
Crystal data and structure refinement for [(H9Heade+)(Htda−)] (1) and [(Hdap+)2(tda2−)]·2H2O (2).
| Compound | 1 | 2 |
| Empirical formula | C11H15N5O5S | C14H22N12O6S |
| Formula weight | 329.34 | 486.49 |
| Temperature / K | 100(2) | 299(2 |
| Wavelength / Å | 0.71073 | 1.54178 |
| Crystal system | Triclinic | Monoclinic |
| Space group | P | C2/c |
| Unit cell dimensions | ||
| a / Å | 4.7676(2) | 7.1171(8 |
| b / Å | 11.8744(5) | 24.422(3) |
| c / Å | 13.3350(6) | 12.0629(18) |
| α / º | 111.563(1) | 90 |
| β / º | 94.144(2) | 96.949(8) |
| γ / º | 99.129(2) | 90 |
| Volume / Å–3 | 686.15(5) | 2081.3(5) |
| Z | 2 | 4 |
| Calc. density / Mg/m3 | 1.594 | 1.553 |
| Absorp. coefc. / mm–1 | 0.271 | 1.949 |
| F(000) | 344 | 1016 |
| Crystal size / mm | 0.21 × 0.11 × 0.04 | 0.12 × 0.10 ×0.08 |
| θ range / ° | 2.950 - 30.504 | 3.620 - 67.156 |
| Limiting indices / h,k,l | –6/6, –16/16, –18/18 | –7/8, –28/25, –14/13 |
| Refl. collect / unique [Rint] | 31591/4178 [0.0820] | 8717/1856 [0.1315] |
| Completeness θ / °, % | 25.242, 99.8 | 67.679, 97.9 |
| Absorp. correct. | Semi-empirical | Semi-empirical |
| Max. /min. transm. | 1.000/0.935 | 1.000/0.773 |
| Data / parameters | 4178/214 | 1856/174 |
| Goodness-of-fit on F2 | 1.077 | 1.019 |
| Final R indices | R1 = 0.0494, wR2 = 0.0880 |
R1 = 0.0681, wR2 = 0.1208 |
| R indices (all data) |
R1 = 0.0765, wR2 = 0.1001 |
R1 = 0.1360, wR2 = 0.1483 |
| Largest dif. peak/hole e.Å–3 | 0.537/–0.352 | 0.409/–0.298 |
| CCDC number | 2191905 | 2191904 |
Table 2.
Hydrogen bond parameters [Å, °] for [(H9Heade+)(Htda−)] (1) and [(Hdap+)2(tda2−)]·2H2O (2). The letters in brackets refer to the symmetry codes shown in the text and figures.
Table 2.
Hydrogen bond parameters [Å, °] for [(H9Heade+)(Htda−)] (1) and [(Hdap+)2(tda2−)]·2H2O (2). The letters in brackets refer to the symmetry codes shown in the text and figures.
| Comp. | D–H···A | D–H | H···A | D···A | ∠DHA | Symmetry code |
| 1 | O10-H10···O12(a) | 0.84(3) | 1.91(3) | 2.741(2) | 171(2) | -x+1,-y,-z |
| O21-H21···O11(f) | 0.91(2) | 1.60(3) | 2.505(2) | 179(2) | -x,-y,-z+1 | |
| N1-H1···O11(b) | 0.89(2) | 1.88(2) | 2.765(2) | 171(2) | x,y+1,z | |
| N1-H1···O12(b) | 0.89(2) | 2.38(2) | 2.999(2) | 127.4(2) | x,y+1,z | |
| N6-H6A···N7(c) | 0.85(2) | 2.11(2) | 2.928(2) | 163(2) | -x+1,-y+1,-z+1 | |
| N6-H6B···O22(d) | 0.88(2) | 2.07(2) | 2.849(2) | 146.9(2) | -x,-y+1,-z+1 | |
| C2-H2···O12(b) | 0.95 | 2.52 | 3.096(2) | 118.9 | x,y+1,z | |
| C8-H8···O22(e) | 0.95 | 2.37 | 3.233(2) | 150.7 | x+1,y,z | |
| C9-H9A···S1(e) | 0.99 | 3.03 | 3.748(2) | 130.6 | x+1,y,z | |
| C11-H11A···O21(f) | 0.99 | 2.57 | 3.319(2) | 132.6 | -x,-y,-z+1 | |
| C11-H11B···O10(g) | 0.99 | 2.42 | 3.365(2) | 160.4 | -x,-y,-z | |
| C21-H21A···O21(h) | 0.99 | 2.60 | 3.375(2) | 135.5 | -x+1,-y,-z+1 | |
| C21-H21B···O22(e) | 0.99 | 2.27 | 3.252(2) | 172.7 | x+1,y,z | |
| 2 | N1-H1···O1(b) | 1.08(4) | 1.56(4) | 2.637(5) | 177(4) | x+1/2,-y+1/2,z-1/2 |
| N2-H2A···N7© | 0.93(5) | 1.99(5) | 2.920(5) | 172(4) | x+1/2,-y+1/2,z+1/2 | |
| N6-H6A···O11(d) | 0.96(5) | 1.92(5) | 2.805(5) | 152(4) | -x+1/2,-y+1/2,-z | |
| N6-H6B···N3(e) | 0.94(5) | 2.07(5) | 2.991(5) | 166(4) | x-1/2,-y+1/2,z-1/2 | |
| N9-H9···O11(a) | 0.93(5) | 1.79(5) | 2.713(5) | 175(4) | -x+1,y,-z+1/2 | |
| O1-H1A···O12(f) | 1.00(10) | 1.62(10) | 2.607(6) | 170(8) | -x,y,-z+1/2 | |
| O1-H1B···O12(g) | 0.79(10) | 1.93(10) | 2.628(6) | 146(10) | x,-y,z+1/2 |
Table 3.
Intermolecular π···π interaction parameters (Å, °)* for [(H9Heade+)(Htda−)] (1).
| π···π | Cg(I)···Cg(J) | α |
| Cg(1)···Cg(2)(i) | 3.476 | 0.202 |
| Cg(2)···Cg(1)(i) | 3.476 | 0.202 |
| Cg(2)···Cg(2)(i) | 3.391 | 0 |
*Cg(1): ring (N7/C5/C4/N9/C8); Cg(2): ring (N1/C2/N3/C4/C5/C6). Symmetry code: (I) -x+3/2,-y+1/2,-z. Cg(I)···Cg(J): Distance between ring centroids; α: Dihedral angle between planes I and J.
Disclaimer/Publisher’s Note: The statements, opinions and data contained in all publications are solely those of the individual author(s) and contributor(s) and not of MDPI and/or the editor(s). MDPI and/or the editor(s) disclaim responsibility for any injury to people or property resulting from any ideas, methods, instructions or products referred to in the content. |
© 2023 by the authors. Licensee MDPI, Basel, Switzerland. This article is an open access article distributed under the terms and conditions of the Creative Commons Attribution (CC BY) license (http://creativecommons.org/licenses/by/4.0/).
Copyright: This open access article is published under a Creative Commons CC BY 4.0 license, which permit the free download, distribution, and reuse, provided that the author and preprint are cited in any reuse.


