Submitted:
14 November 2023
Posted:
15 November 2023
You are already at the latest version
Abstract
For a long-only active equity manager (or investor), the ability to hedge the downside risk before a significant price correction is a valuable skill. The authors proposed constructing a signal that provides timing information for a manager to hedge the downside risk. This systematic signal can help a manager put on a hedge before the price corrections of the dot com bubble in 2000 and the global financial crisis in 2008. The signal is constructed for each GICS sector index in the S&P 500. When a sector’s PE indicates a high valuation and, at the same time, if the high valuation sector’s correlations with some other sectors are out of their historical norm, then these two conditions contribute a timing signal for the significant price swing of the index during the following six months. After observing the timing signal, managers can benefit significantly by hedging the downside risk. The signal can also be interpreted as the beginning of a high volatility regime for a sector.
Keywords:
market timing
; risk management
; risk hedging
; equity market crashes
1. Introduction and Literature Review
Extensive literature is dedicated to market crashes. The primary focus of numerous studies concerns identifying bubble conditions, volatility spillovers, and undertaking crash forecasts (Lle & Ziemba, 2019; Yousaf & Hassan, 2019). Sornette (2009) defines crashes based on anomalous price patterns. In one of the seminal papers, Abreu and Brunnermeier (2003) characterize a crash as a sudden plummet in price from an inflated level driven by a bubble, descending to its fundamental value. Rational arbitrageurs recognize that the market will eventually collapse, yet they aim to capitalize on the expanding bubble and its lucrative returns in the interim. Of course, this behavior further increases the price and patterns of the herding behavior of noise traders. Ideally, rational arbitrageurs aim to exit the market just before the crash occurs. Recent studies explore different approaches for predicting endogenous financial asset bubbles (Deng et al., 2022; Focardi & Fabozzi, 2014; Guan et al., 2021). Accurate forecasts provide valuable insights for mitigating their impact and devising effective crisis management strategies.
One early study by Ausloos et al. (2002) mentions that log-periodic oscillations are found before crashes in several financial indices. In a study about stock market crashes from 2007 to 2009, Lleo and Ziemba (2012) utilized the bond stock earnings yield model to predict stock market crises in different countries. This model can easily predict stock market crashes with high-interest rates relative to earnings but not others related to political reasons (European debt crisis and the political stalemate in Washington). The literature rigorously investigates many ratios as predictors of equity corrections using methodology such as the price-to-earnings (PE) ratio, the cyclically adjusted PE ratio, and the ratio of the market value of all publicly traded stocks to the current level of the GNP (Lle and Ziemba, 2019). In another study, Focardi and Fabozzi (2014) utilize the ratio of financial to operational profits in corporations. Their study criticizes the approach that considers a bubble as a deviation from fundamental/rational price because, in practice, future cash flows cannot be precisely forecasted, and deviations from rational prices cannot be clearly identified. Based on their framework, bubbles can be identified based on the excess growth of financial markets regarding the real economy. Moreover, financial flows should be evaluated based on the real economy and inflation.
Continuing the line of literature on log periodic power law models, Cajueiro et al. (2009) investigate whether crashes in the Brazilian stock market could be identified using intraday observations. Another econophysics approach presented by Torrecillas et al. (2019) suggests that the dot com bubble can be identified. Within this framework, the primary focus is to find the moment in stock trading where the transition between efficient market behavior and herding behavior occurs. A power-law distribution of stock-price changes within a segment indicates herding behavior and the start of the dot.com bubble. Recent literature also explores the role of social media in herding behavior and market crashes. Guan et al. (2021) focus on the brief market collapse during the COVID-19 pandemic. The authors show how market sentiments affect prices and how negative market sentiments are mitigated in digitally intense sectors. Sul et al. (2017) argue how positive and negative sentiments are spread through tweets affecting daily investment decisions and prices for firms in the S&P 500. Deng and Zhou (2022) use machine learning approaches to predict individual stocks’ price crashes in the Chinese stock market, one of the most compelling equities markets, for various capitalizations. Also, some studies use theoretical stochastic processes and other probabilistic models to study financial crashes (Jarrow, 2012).
In a separate strand of research on this topic, options are utilized to study financial market crises. Leiss et al. (2022) constructed risk-neutral return probability distributions from S&P 500 options data over 2003–2013. During the pre-crisis period, increasing option implied returns are observed. The study finds that the realized-minus-implied risk premium was approximately 8% in the pre-crisis and has doubled to 16% in the post-crisis period. By a similar approach, Xu et al. (2020) utilize S&P-500 calls and puts to predict upside (downside) uncertainty related to the upward (downward) movements in the US equity market. Also, the authors show the spillover of these risks to international markets.
On the other hand, Xiong et al. (2016) focus on forecasting only forward-looking left tail risk using a series of multiple regression analyses. Other studies have utilized GARCH stable models (Molina-Munoz et al., 2022). Also, Molina-Munoz et al. (2022) enrich their framework by incorporating tail index measures. Boubaker et al. (2022) encompass data from 27 countries from 1918 to 2019 to identify a structural turning point associated with each bubble following a burst. In another study, Tsakonas et al. (2022) introduce an innovative method to predict major downturns in financial markets. This method performs a nonlinear analysis of the logarithmic returns of the index and then uses the moving Lyapunov exponent as a signal for financial market crashes.
Our study contributes to the literature by further investigating how financial ratios can accurately predict financial market bubbles. Investors’ ability to time major price corrections and crashes can improve their risk-adjusted performance (Berge et al., 2008). The individuals are incentivized to time the market outcomes in the persistence of bubbles. Moreover, our work provides a framework for investors about the timing of hedging the risk of losses from a market crash while maintaining the potential for gains. A situation with an exceptionally high sector PE sector ratio with out-of-historical norm correlations with other sectors indicates significant price swings in the index within the subsequent six months. Finally, although previous literature provides frameworks that are based on a stock market index or individual stocks (Lle & Ziemba, 2019; Deng et al., 2022; da Silva, 2022), our analysis utilizes data on a sector level and provides a valuable tool for practitioners to implement an appropriate hedging strategy on sector level.
The rest of the study is organized as follows: In the second section, we discuss how the data were collected and the methodology based on sector PE and sector correlation matrix. In the third section, we briefly discuss the intuition behind the signal and how it can benefit investors’ investment processes, such as generating performance or managing risk. This is illustrated through various example, in particular, the dot-com bubble crash in 2000 and the global financial crisis of 2008. Finally, in the fourth section, we give some concluding remarks.
2. Data and Methodology
We collected sector-level data for each of the S&P 500 GICS sector indexes. The historical data was downloaded from the Bloomberg terminal. The S&P 500 GICS sectors used in this study are Energy, Materials, Industrials, Consumer Discretionary, Consumer Staples, Health Care, Financials, Information Technology, Communication Services, and Utilities1. The first sector-level data item is the daily total return for each sector index. The historical return data started in January 1990. The second data item is the sector index’s daily PE ratio. The historical PE ratio started in April 19902. In summary, there are two sets of daily historical data series. The first set is daily returns, and the second is PE ratios.
The rest of the section will describe the methodology for constructing the timing signal. The first step is to transform the ten sectorial daily PE data series into series expressed in Z-score. We adopted a robust version of the Z-score suggested by Rousseeuw and Hubert (2011). For the rest of the paper, we mean the robust version when we refer to the Z-score. The Z-score is constructed as follows, and xi is an observation:
where MAD (median of all absolute deviations from the median) is defined as:
As a rule of thumb, outliers tend to have zi values greater than two (or less than negative two). In summary, we transform the ten sectorial daily PE series into ten Z-score series. A Z-score series is constructed iteratively as the PE data grows daily. The Z-score as of a specific date is built by gathering the PE data up to the given date. Convert the PE data into Z-scores using equations (1) and (2). The PE Z-score is the Z-score as of the given date. This process repeats for the next day when we have one more new observation of PE. This approach prevents the construction of PE Z-score as of a specific date using PE data that is not available yet as of the given date.
The second step involves building a daily series of a ten-by-ten sector correlation matrix. Starting from January 1995, as of each trading day and using all the available daily return history up to the given day, we estimate an exponentially weighted moving average (EWMA) correlation matrix. Following Chapter 23 of Hull (2018), we set the decline rate parameter (λ) to 0.94.
After completing the two steps mentioned above, we are ready to describe the construction of the timing signal for hedging downside risk. This process applies to each of the sectors separately. We construct the timing signal for each of the sectors individually. Whenever a sector PE Z-score is above 2.5 (i.e., the valuation for the sector index is high), we also check this sector’s correlation with the other nine sectors. Using the daily series of the correlation matrix, we have a daily historical series of a particular correlation up to the date when we are doing the checking. From the daily historical series of nine different correlations, we can transform each of these nine correlations into nine different Z-scores (based on each correlation’s history up to this point). Then, from these nine different correlation Z-scores (as of the date we are checking), we count how many are less than negative two (i.e., two sectors are less correlated or even become negatively correlated). When this count is more than three (and the sector’s PE Z-score is above 2.5), we have a timing signal for hedging the downside risk. The sector index tends to exhibit big price swings in the following six months after the timing signal appears.
3. Result and Discussion
The intuition behind the signal is the following. Based on historical observation, when the equity market crashes as a bubble deflates, the stocks related to the bubble tend to exhibit high valuations before the crash. Therefore, we focus on the days when the PE Z-score is above 2.5 when constructing the timing signal. However, history also teaches us that one can observe high valuation for a long time before a crash happens. Hence, we need a second piece of information to narrow our focus when formulating a timing signal. In this case, the second piece of data is the correlation between the sector with high valuation and the other nine sectors. Suppose some of these nine correlations exhibit extremely low correlation (or extreme negative correlation). In that case, it may indicate that the sector index with a high valuation has been behaving as 'out of line' comparing to its historical norm. Assuming these extreme correlations will revert to the norm, this phenomenon may be used as a leading indicator for the upcoming price correction of the sector with high valuation. As defined in the previous section, when the count of correlation Z-score below -2 is more than three, this criterion signals the time to consider hedging the downside risk for the sector index with a high valuation, especially for long-only managers. There are typically multiple significant up-and-down price swings after seeing the signal. Therefore, buying one (or more) put option(s) is an excellent way to put on the hedge when using this timing signal by asset managers (or investors). A put option allows an investor to participate in the upside of a price swing while protecting the loss from the downside of a price swing.
The following are two case studies to illustrate our proposed timing signal. The first case study is the dot-com bubble crash of 2000. The second case study is the crash of the global financial crisis in 2008. On January 3rd, 2000, we got a timing signal. The results related to this signal data are shown in Table I. On this signal date, the information technology sector index PE Z-score is 3.63. The PE Z-score had been above 2.5 for a while. However, it was the first time the number of correlation Z-scores below negative two was more than 3. Five Z-score correlations were below negative two: -2.82 (Materials/Information Technology), -3.13 (Industrials/Information Technology), -2.96 (Consumer Discretionary/Information Technology), -2.65 (Consumer Staples/Information Technology), -2.24 (Financials/Information Technology). We calculate the return of the information technology sector index after we observe the signal.

Table 1.
information technology sector index expressed in Z-score. The count represents the number of sectors correlated with the information technology sector index with a Z-score less than negative two. The first date of return calculation is the signal date plus two trading days. The sector label represents the correlation Z-score.
| Signal Date | 2000-01-03 | 2000-04-03 | 2000-08-07 |
| PE Z-score | 3.63 | 3.50 | 2.56 |
| Count | 5 | 4 | 4 |
| 1st month return (%) | -2.36 | -6.41 | 6.09 |
| 2nd month return (%) | 10.60 | -6.30 | -19.57 |
| 3rd month return (%) | 14.00 | 7.53 | -2.54 |
| 4th month return (%) | -15.32 | 2.00 | -15.80 |
| 5th month return (%) | -15.03 | 1.10 | -13.02 |
| 6th month return (%) | 24.65 | -5.12 | 17.26 |
| Energy | -1.67 | -2.46 | -2.03 |
| Materials | -2.82 | -2.77 | -2.16 |
| Industrials | -3.13 | -1.42 | -0.49 |
| Consumer Discretionary | -2.96 | -2.37 | -0.65 |
| Consumer Staples | -2.65 | -3.25 | -2.81 |
| Health Care | -1.58 | -1.77 | -2.67 |
| Financials | -2.24 | -1.43 | -0.22 |
| Information Technology | |||
| Communication Services | -1.12 | -0.01 | 0.15 |
| Utilities | -1.83 | -0.82 | -0.75 |
We compute six different monthly returns for each signal date. The first date used for return calculation is January 5th, 2000 (i.e., signal date + two trading days); this extra lag simulates the implementation delay. It is because it takes time to put on a hedge. Then, we calculate the first, second, third, fourth, fifth, and sixth monthly returns after observing the signal3. Table I shows the fourth and fifth monthly returns are both about -15%. Berge et al. (2008) also document the lag between observing their BSEYD signal and the actual price correction. The BSEYD entered the danger zone in May 1987, and the correction occurred four months later in October 1987. However, the second, third, and sixth monthly returns are very positive. This kind of big up-and-down price swings are expected to be observed while a bubble is deflating. Suppose a long-only strategy manager can hold options in their portfolio. In that case, the manager can consider buying put options to protect the downside risk while still being able to capture the potential upside. The timing signal presented itself again on 2000-04-03. If a manager had put on a long-term hedge during the first signal date, this new signal date would be less critical. Table I shows that the price swings are less intense than we observed during the first signal date. Nevertheless, this particular signal date can still provide some downside protection. The sum of all negative returns is still more significant than that of all positive returns. After more than six months since the first signal date, the timing signal appeared again on 2000-08-07. The information technology index turned significantly downward after this signal date. The returns for the second, fourth, and fifth months are big negative numbers (i.e., -19.57%, -15.80%, and -13.02). After this signal date, the signal does not appear again for the rest of the time during our analysis. Our analysis ends at the end of September 2023. In summary, the timing signal could help managers (or investors) avoiding significant losses while the dot-com bubble deflates. Figure 1 shows the information technology index and the three signal dates (the three vertical lines on the chart).
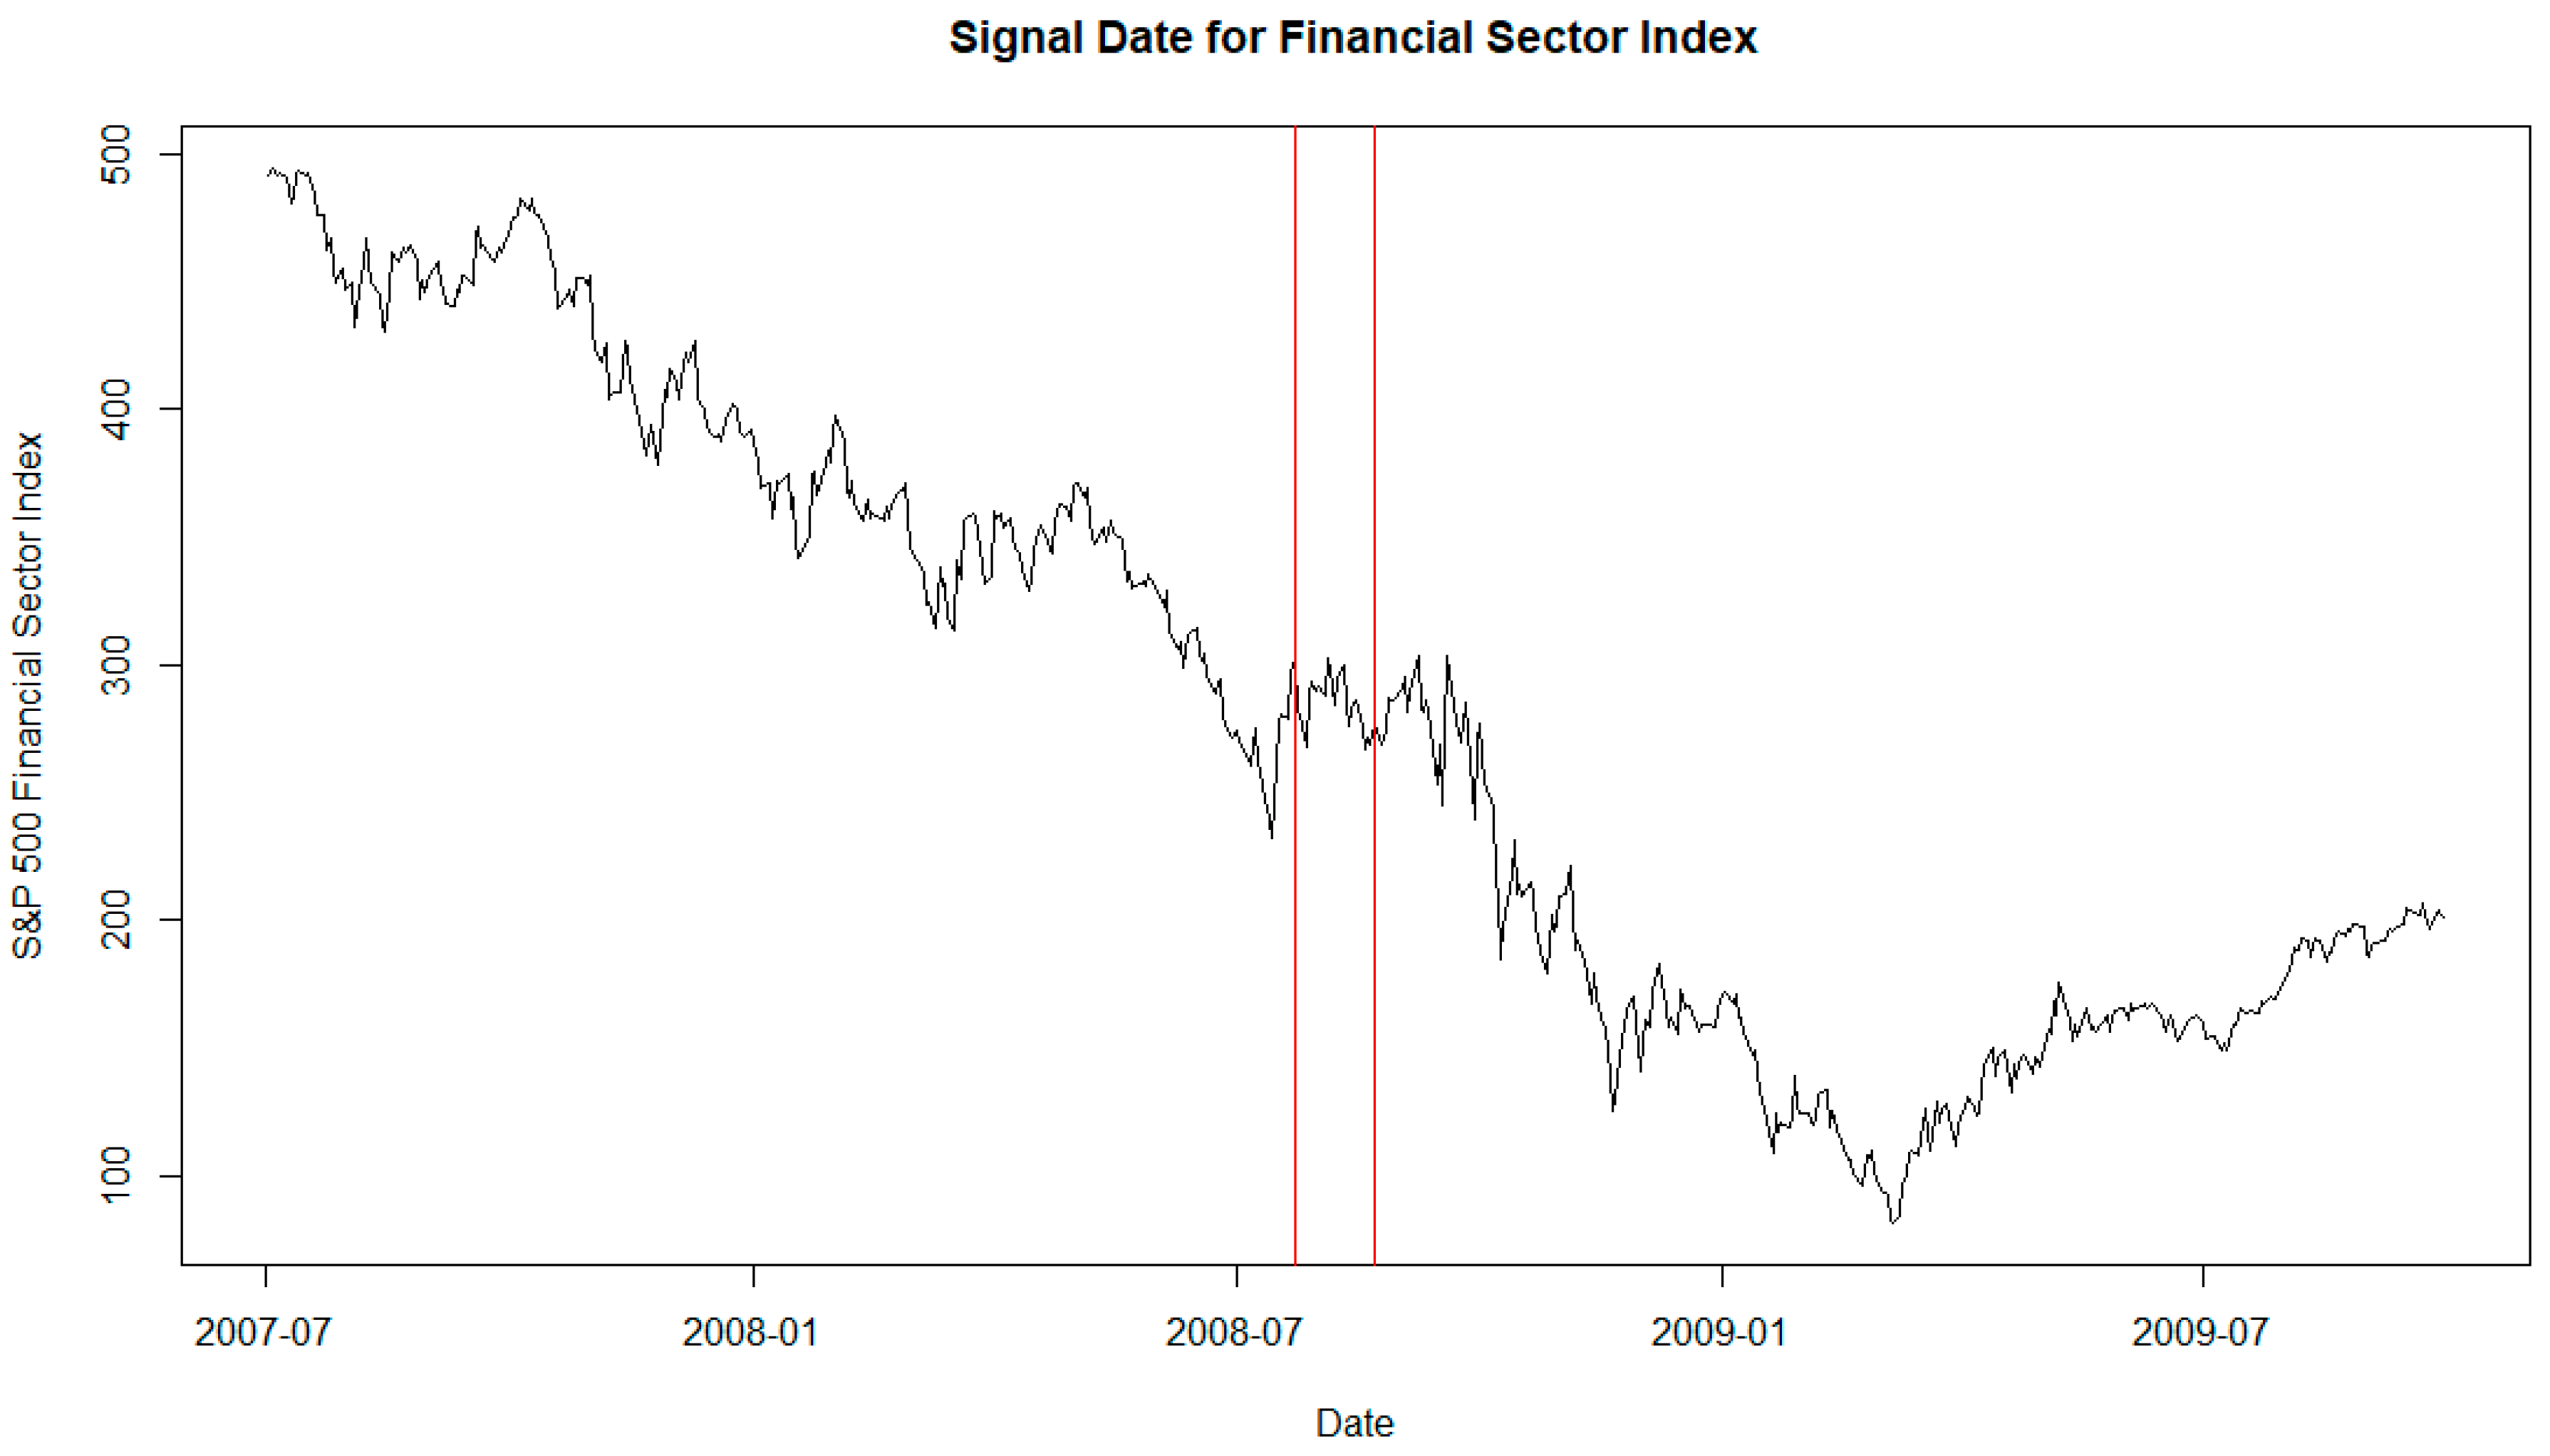
The second case study is the crash of the global financial crisis in 2008. On average, a decline more than the largest one-day drop during the global financial crisis is expected to occur approximately once every 27 years (Aboura, 2014). The results of the timing signal for the financial sector index are shown in Table II. The first signal for the financial sector index appeared on 2008-07-23. The third, fourth, and fifth monthly returns are -21.55%, -15.98%, -11.17%. This particular signal date provides an early warning signal for the upcoming price corrections. The timing signal comes up again on 2021-04-12. The index drops -4.27% during the third month after observing the signal. However, there are no significant price swings in this case. The signal date falls within the global COVID-19 pandemic, and the financial sectors did not appear to be in a bubble. The index was still recovering from its bottom in March 2020. The financial sector index might exhibit very different behavior before and during the pandemic. This may explain the false alarm for this particular signal date. Figure 2 shows the financial index and the first signal date (the chart's first vertical line from the left). The second vertical line is the signal date based on the bond-stock earning yield differential (BSEYD). We will discuss the BSEYD in more detail later in this section.
Table 2.
Case Study of the Global Financial Crisis Crash. The signal date represents the date when the timing signal was observed. The PE Z-score is the PE of the S&P 500 financials sector index expressed in Z-score. The count represents the number of sectors correlated with the financial sector index with a Z-score less than negative two. The first date of return calculation is the signal date plus two trading days. The sector label represents the correlation Z-score.
| Signal Date | 2008-07-23 | 2021-04-12 |
| PE Z-score | 2.54 | 2.50 |
| Count | 4 | 5 |
| 1st month return (%) | -4.35 | 6.14 |
| 2nd month return (%) | 2.00 | 2.81 |
| 3rd month return (%) | -21.55 | -4.27 |
| 4th month return (%) | -15.98 | 1.54 |
| 5th month return (%) | -11.17 | 4.05 |
| 6th month return (%) | 2.27 | -0.32 |
| Energy | -2.63 | -0.07 |
| Materials | -2.35 | -0.04 |
| Industrials | -0.04 | 0.24 |
| Consumer Discretionary | 0.70 | -4.97 |
| Consumer Staples | -0.75 | -2.07 |
| Health Care | -0.77 | -2.03 |
| Financials | ||
| Information Technology | -0.06 | -3.30 |
| Communication Services | -2.13 | -2.55 |
| Utilities | -3.77 | -1.77 |
Other than providing early warnings for the two major well-known crashes in recent financial history, the timing signal also managed to catch some significant price corrections in the following three sectors: utilities, energy, and healthcare. Table III shows the timing signal results for the utility sector. For the signal that appeared on 2020-01-16, the utility sector index dropped about 18% during the second month after observing the signal. However, we believe this 18% drop is more related to the COVID-19 crisis and not a burst of a bubble in the utilities sector. There was no utility sector bubble before the pandemic crisis. For the other two signal dates, 1998-06-11 and 1998-10-09, the price swings were less violent than those discussed earlier. Table IV shows the timing signal results for the healthcare sector. There is only one signal date that appeared on 1999-04-19. The healthcare sector index returns for the second, fourth, and sixth months are -5.08%, -10.98%, and -6.80. The signal did provide an asset manager the chance to hedge the downside risk. Table V shows the timing signal results for the energy sector. There are four signal dates. For three signal dates (1999-04-21, 2000-03-07, and 2017-11-06), the timing signal can be beneficial if a manager hedges the downside risk. For the signal date 2017-06-14, the signal provided no material benefit.
Table 3.
Timing signal for the utility sector. The signal date represents the date when the timing signal was observed. The PE Z-score is the PE of the S&P 500 utilities sector index expressed in Z-score. The count represents the number of sectors whose correlation with the utility sector index correlates with a Z-score less than negative two. The first date of return calculation is the signal date plus two trading days. The sector label represents the correlation Z-score.
| Signal Date | 1998-06-11 | 1998-10-09 | 2020-01-16 |
| PE Z-score | 2.56 | 2.52 | 2.51 |
| Count | 7 | 5 | 4 |
| 1st month return (%) | -1.21 | -1.14 | 5.40 |
| 2nd month return (%) | -4.26 | 1.36 | -18.14 |
| 3rd month return (%) | 0.73 | 1.03 | 6.57 |
| 4th month return (%) | 12.07 | -4.38 | -7.70 |
| 5th month return (%) | -3.88 | -3.81 | 9.04 |
| 6th month return (%) | 3.08 | 1.64 | -4.65 |
| Energy | -2.62 | -0.24 | 2.87 |
| Materials | -2.33 | -1.96 | -0.52 |
| Industrials | -2.78 | -3.53 | -2.71 |
| Consumer Discretionary | -1.82 | -3.60 | -2.31 |
| Consumer Staples | -2.67 | -1.09 | 0.46 |
| Health Care | -3.17 | -2.92 | -0.75 |
| Financials | -2.57 | -4.74 | -2.65 |
| Information Technology | -3.23 | -2.39 | -1.29 |
| Communication Services | -1.76 | 0.57 | -1.78 |
| Utilities |
Table 4.
Timing signal for the health care sector. The signal date represents the date when the timing signal was observed. The PE Z-score is the PE of the S&P 500 healthcare sector index expressed in Z-score. The count represents the number of sectors whose correlation with the utilities sector index has a correlation Z-score less than negative two. The first date of return calculation is the signal date plus two trading days. The sector label represents the correlation Z-score.
| Signal Date | 1999-04-19 |
| PE Z-score | 3.19 |
| Count | 4 |
| 1st month return (%) | -1.99 |
| 2nd month return (%) | -5.08 |
| 3rd month return (%) | 8.46 |
| 4th month return (%) | -10.98 |
| 5th month return (%) | 11.17 |
| 6th month return (%) | -6.80 |
| Energy | -2.34 |
| Materials | -2.82 |
| Industrials | -2.13 |
| Consumer Discretionary | 0.99 |
| Consumer Staples | -1.06 |
| Health Care | |
| Financials | -0.85 |
| Information Technology | 0.35 |
| Communication Services | 1.09 |
| Utilities | -2.37 |
Table 5.
Timing signal for the energy sector. The signal date represents the date when the timing signal was observed. The PE Z-score is the PE of the S&P 500 utilities sector index expressed in Z-score. The count represents the number of sectors whose correlation with the utility sector index correlates with a Z-score less than negative two. The first date of return calculation is the signal date plus two trading days. The sector label represents the correlation Z-score.
| Signal Date | 1999-04-21 | 2000-03-07 | 2017-06-14 | 2017-11-06 |
| PE Z-score | 5.03 | 3.84 | 8.10 | 4.32 |
| Count | 4 | 4 | 4 | 6 |
| 1st month return (%) | 0.82 | 2.41 | -0.31 | -1.00 |
| 2nd month return (%) | 4.26 | -0.16 | -0.96 | 6.45 |
| 3rd month return (%) | 1.50 | 9.99 | 1.10 | 1.90 |
| 4th month return (%) | 2.67 | -3.32 | 6.67 | -8.65 |
| 5th month return (%) | 0.60 | -7.74 | -0.14 | -0.79 |
| 6th month return (%) | -11.63 | 15.45 | 0.98 | 8.31 |
| Energy | ||||
| Materials | -0.13 | -2.23 | -0.28 | -2.06 |
| Industrials | -1.85 | -3.01 | -1.39 | -1.89 |
| Consumer Discretionary | -2.19 | -1.98 | -2.19 | -0.23 |
| Consumer Staples | -1.70 | -3.55 | -2.27 | -2.30 |
| Health Care | -3.37 | -2.24 | -1.73 | -2.05 |
| Financials | -1.81 | -1.82 | -0.50 | -2.08 |
| Information Technology | -2.09 | -1.88 | -2.25 | -0.92 |
| Communication Services | -2.27 | -0.80 | -0.84 | -2.08 |
| Utilities | -0.47 | 0.08 | -3.47 | -3.72 |
Table VI shows the timing signal result for consumer discretionary and industrial sectors. The three columns on the left are for the consumer discretionary sector index. The three columns on the right are for the industrial sector index. Unlike other signal dates we have discussed, there were no significant price swings within six months after observing the timing signal. After a closer inspection, we noticed that all these signal dates for these two sectors fall within the time of the COVID-19 global pandemic. These two sectors were not in a bubble before the pandemic. As we have conjectured earlier, these two sector indexes might exhibit very different behavior before and during the pandemic. Like other systematic risk factors, such as war, the pandemic can result in a significant price swing that market data cannot easily predict (Deng et al., 2022). Finally, there is no timing signal for the materials and consumer staples sector index.
Table 6.
Timing signal for the consumer discretionary and industrials sector. The signal date represents the date when the timing signal was observed. The PE Z-score is the PE of the S&P 500 consumer discretionary (or industrials) sector index expressed in the Z-score. The count represents the number of sectors whose correlation with the utility sector index correlates with a Z-score less than negative two. The first date of return calculation is the signal date plus two trading days. The sector label represents the correlation Z-score. The three columns on the left are for the consumer discretionary sector index. The three columns on the right are for the industrial sector index.
| Signal Date | 2020-11-10 | 2021-01-12 | 2021-04-14 | 2021-01-26 | 2021-04-21 | 2021-08-25 |
| PE Z-score | 4.92 | 5.90 | 7.95 | 4.23 | 7.07 | 4.24 |
| Count | 4 | 4 | 4 | 4 | 4 | 4 |
| 1st month return (%) | 1.88 | 1.74 | -6.02 | 9.34 | 2.10 | -3.07 |
| 2nd month return (%) | 3.19 | -4.41 | 3.04 | 2.30 | -1.63 | 3.75 |
| 3rd month return (%) | 4.23 | 6.15 | 5.88 | 6.15 | 2.23 | 1.75 |
| 4th month return (%) | -6.22 | 1.08 | -0.54 | 1.34 | 2.45 | -1.91 |
| 5th month return (%) | 5.26 | -2.12 | 0.93 | 0.19 | -2.75 | 2.52 |
| 6th month return (%) | 6.66 | 4.37 | -2.50 | 0.42 | -1.12 | -5.20 |
| Energy | -2.03 | -1.18 | -2.16 | 0.38 | -0.60 | 0.42 |
| Materials | -2.29 | -2.51 | -1.84 | 0.58 | 0.45 | 0.54 |
| Industrials | -5.32 | -4.59 | -4.40 | |||
| Consumer Discretionary | -4.41 | -3.12 | -2.42 | |||
| Consumer Staples | -0.76 | -0.92 | -2.19 | -2.88 | -1.63 | -2.32 |
| Health Care | -0.33 | -2.52 | -1.17 | -1.61 | -1.20 | -3.20 |
| Financials | -6.74 | -4.93 | -5.82 | 0.03 | 0.50 | 0.57 |
| Information Technology | 1.11 | -0.83 | 0.13 | -4.09 | -2.42 | -2.07 |
| Communication Services | 1.37 | -0.01 | 0.32 | -2.14 | -2.04 | -0.54 |
| Utilities | -1.02 | -0.65 | -0.77 | -0.71 | -2.36 | -1.46 |
One possible way to take advantage of this timing signal is to buy put options a few months out to hedge the downside risk while keeping the upside potential. There are many possible ways to implement this kind of put option hedge. For example, a manager can roll over the put option hedge each month for six months.
The Bond-Stock Earnings Yield (BSEYD) is another well-studied predictor for market corrections (Berge et al.,2008; Lleo & Ziemba, 2015; Lleo & Ziemba, 2017). The definition of BSEYD is nominal treasury bond yield minus earnings yield. Our analysis uses the 10-year treasury yield downloaded from the FRED database. We repeated a similar analysis using BSEYD rather than PE ratios in constructing the timing signals. We use 2.0 as the BSEYD Z-score cutoff4. The analysis period is the same as before, from January 1995 to September 2023. No timing signal is found for the following eight sectors: Energy, Materials, Industrials, Consumer Discretionary, Consumer Staples, Health Care, Communication Services, and Utilities. For the Information Technology sector, only one signal date was found using BSEYD when the dot com bubble was deflating. The signal date was 2000-01-03, which is the same signal date based on PE ratios we presented earlier. Table VII is a summary of this signal date. There was only one signal date for the financial sector using BSEYD. The signal date was 2008-08-22. The signal date when using PE ratios was 2008-07-23. Table VIII is a summary of this signal date. This signal date can be beneficial to investors. We found that the maximum count of extreme sector correlation is three while the BSEYD Z-score is above 2.0. The second vertical line from the left in Figure 2 corresponds to this signal date. When comparing these two predictors (PE ratio vs BSEYD), BSEYD produces fewer signal dates than PE ratio.
Table 7.
Case Study of the Dot Com Bubble Crash using BSEYD. The signal date represents the date when the timing signal was observed. The BSEYD Z-score is the BSEYD of the S&P 500 information technology sector index expressed in Z-score. The count represents the number of sectors correlated with the information technology sector index with a Z-score less than negative two. The first date of return calculation is the signal date plus two trading days. The sector label represents the correlation Z-score.
| Signal Date | 2000-01-03 |
| BSEYD Z-score | 2.12 |
| Count | 5 |
| 1st month return (%) | -2.36 |
| 2nd month return (%) | 10.60 |
| 3rd month return (%) | 14.00 |
| 4th month return (%) | -15.32 |
| 5th month return (%) | -15.03 |
| 6th month return (%) | 24.65 |
| Energy | -1.67 |
| Materials | -2.82 |
| Industrials | -3.13 |
| Consumer Discretionary | -2.96 |
| Consumer Staples | -2.65 |
| Health Care | -1.58 |
| Financials | -2.24 |
| Information Technology | |
| Communication Services | -1.12 |
| Utilities | -1.83 |
Table 8.
Case Study of the Global Financial Crisis Crash using BSEYD. The signal date represents the date when the timing signal was observed. The PE Z-score is the PE of the S&P 500 financials sector index expressed in Z-score. The count represents the number of sectors correlated with the financial sector index with a Z-score less than negative two. The first date of return calculation is the signal date plus two trading days. The sector label represents the correlation Z-score.
| Signal Date | 2008-08-22 |
| BSEYD Z-score | 2.05 |
| Count | 3 |
| 1st month return (%) | 9.92 |
| 2nd month return (%) | -31.02 |
| 3rd month return (%) | -18.46 |
| 4th month return (%) | -4.39 |
| 5th month return (%) | -3.21 |
| 6th month return (%) | -15.33 |
| Energy | -2.06 |
| Materials | -2.01 |
| Industrials | 0.43 |
| Consumer Discretionary | 0.54 |
| Consumer Staples | 0.03 |
| Health Care | -0.23 |
| Financials | |
| Information Technology | 0.39 |
| Communication Services | 0.25 |
| Utilities | -2.05 |
4. Discussion and Conclusion
In this research, we proposed a systematic signal that can be used to time the hedging of downside risk. The timing signal only uses two data items as input. The sector-level daily PE ratios and daily total returns. First, we focus on the time periods when a sector index exhibits high valuation. For the purpose of this signal, we regard a sector index has a high valuation when its PE Z-score is greater than 2.5. Then, we check the correlation between the high-valuation sector and nine other sector indexes. These nine correlations are transformed into nine Z-scores based on each correlation’s own historical daily data. If there are more than three correlation Z-scores that are less than negative two, then we have a signal. During the six-month period after the signal appears, usually, there will be intense up and down price swings. The signal is able to provide beneficial timing information during the deflating of the dot com bubble and global financial crisis (housing bubble). This methodology can also generate beneficial timing information for other S&P 500 sector indexes. Most of the existing studies usually focus on the equity market index rather than sector indexes. We are filling a gap in the literature. Another advantage of this signal is that the methodology is easy to implement and maintain. Moreover, the data requirement for the signal is not demanding. Daily total returns and PE ratios are the two data inputs for building the signal. For risk management purposes, one can also interpret the signal as an indicator for the beginning of a high volatility regime for a sector index. One of the future research projects is to improve the current signal by incorporating other hedging signals. Another possible extension is to investigate the possible application of this methodology to time the crash of an individual stock.
| 1 | The real estate sector is excluded from this study because it has a shorter data history than the other ten sectors. |
| 2 | Not all sectors have the PE data from April 1990. However, all sectors have daily PE data starting from August 1991. |
| 3 | For the monthly return calculation, we define a monthly return as the return during four weeks. For example, the first monthly return is from 2000-01-05 to 2000-02-01. |
| 4 | It is rare for Z-score to be bigger than 2.5. |
References
- Aboura, S. (2014). When the US stock market becomes extreme?. Risks, 2(2), 211-225. [CrossRef]
- Abreu, D., & Brunnermeier, M. K. (2003). Bubbles and crashes. Econometrica, 71(1), 173-204. [CrossRef]
- Ausloos, M., Ivanova, K., & Vandewalle, N. (2002). Crashes: symptoms, diagnoses and remedies. In Empirical Science of Financial Fluctuations: The Advent of Econophysics (pp. 62-76). Springer Japan.
- Berge, K., Consigli, G., & Ziemba, W. T. (2008). The predictive ability of the bond-stock earnings yield differential model. Journal of Portfolio Management, 34(3), 63-80. [CrossRef]
- Boubaker, S., Liu, Z., Sui, T., & Zhai, L. (2022). The mirror of history: How to statistically identify stock market bubble bursts. Journal of Economic Behavior & Organization, 204, 128-147. [CrossRef]
- Cajueiro, D. O., Tabak, B. M., & Werneck, F. K. (2009). Can we predict crashes? The case of the Brazilian stock market. Physica A: Statistical Mechanics and its Applications, 388(8), 1603-1609. [CrossRef]
- da Silva, P. P. (2022). Crash risk and ESG disclosure. Borsa Istanbul Review, 22(4), 794-811. [CrossRef]
- Deng, S., Zhu, Y., Duan, S., Fu, Z., & Liu, Z. (2022). Stock Price Crash Warning in the Chinese Security Market Using a Machine Learning-Based Method and Financial Indicators. Systems, 10(4), 108. [CrossRef]
- Focardi, S. M., & Fabozzi, F. J. (2014). Can We Predict Stock Market Crashes?. Journal of Portfolio Management, 40(5), 183. [CrossRef]
- Guan, C., Liu, W., & Cheng, J. Y. C. (2021). Using social media to predict the stock market crash and rebound amid the pandemic: the digital ‘haves’ and ‘have-mores’. Annals of Data Science, 1-27. [CrossRef]
- Hull, J. C. (2018). Options futures and other derivatives 10th edition. Pearson Education New York.
- Jarrow, R. (2012). Detecting asset price bubbles. Journal of Derivatives, 20(1), 30. [CrossRef]
- Leiss, M., Nax, H. H., & Sornette, D. (2015). Super-exponential growth expectations and the global financial crisis. Journal of Economic Dynamics and Control, 55, 1-13. [CrossRef]
- Lleo, S., & Ziemba, W. T. (2015). Some historical perspectives on the bond-stock earnings yield model for crash prediction around the world. International Journal of Forecasting, 31(2), 399-425. [CrossRef]
- Lleo, S., & Ziemba, W. T. (2017). Does the bond-stock earnings yield differential model predict equity market corrections better than high P/E models?. Financial Markets, Institutions & Instruments, 26(2), 61-123. [CrossRef]
- Lleo, S., & Ziemba, W. T. (2012). Stock market crashes in 2007–2009: were we able to predict them?. Quantitative Finance, 12(8), 1161-1187. [CrossRef]
- Lleo, S., & Ziemba, W. T. (2019). Can Warren Buffett forecast equity market corrections?. The European Journal of Finance, 25(4), 369-393. [CrossRef]
- Molina-Muñoz, J., Mora-Valencia, A., & Perote, J. (2020). Market-crash forecasting based on the dynamics of the alpha-stable distribution. Physica A: Statistical Mechanics and its Applications, 557, 124876. [CrossRef]
- Munoz Torrecillas, M. J., Yalamova, R., & McKelvey, B. (2016). Identifying the Transition from Efficient-Market to Herding Behavior: Using a Method from Econophysics. Journal of Behavioral Finance, 17(2), 157-182. [CrossRef]
- Rousseeuw, P. J., & Hubert, M. (2011). Robust statistics for outlier detection. Wiley interdisciplinary reviews: Data mining and knowledge discovery, 1(1), 73-79. [CrossRef]
- Sornette, D. (2009). Why stock markets crash: critical events in complex financial systems. Princeton university press.
- Sul, H. K., Dennis, A. R., & Yuan, L. (2017). Trading on twitter: Using social media sentiment to predict stock returns. Decision Sciences, 48(3), 454-488. [CrossRef]
- Yousaf, I., & Hassan, A. (2019). Linkages between crude oil and emerging Asian stock markets: New evidence from the Chinese stock market crash. Finance Research Letters, 31, 207-217. [CrossRef]
Figure 1.
Signal Dates for the Information Technology Sector Index. The three signal dates are: 2000-01-03, 2000-04-03, and 2000-08-07.
Figure 1.
Signal Dates for the Information Technology Sector Index. The three signal dates are: 2000-01-03, 2000-04-03, and 2000-08-07.
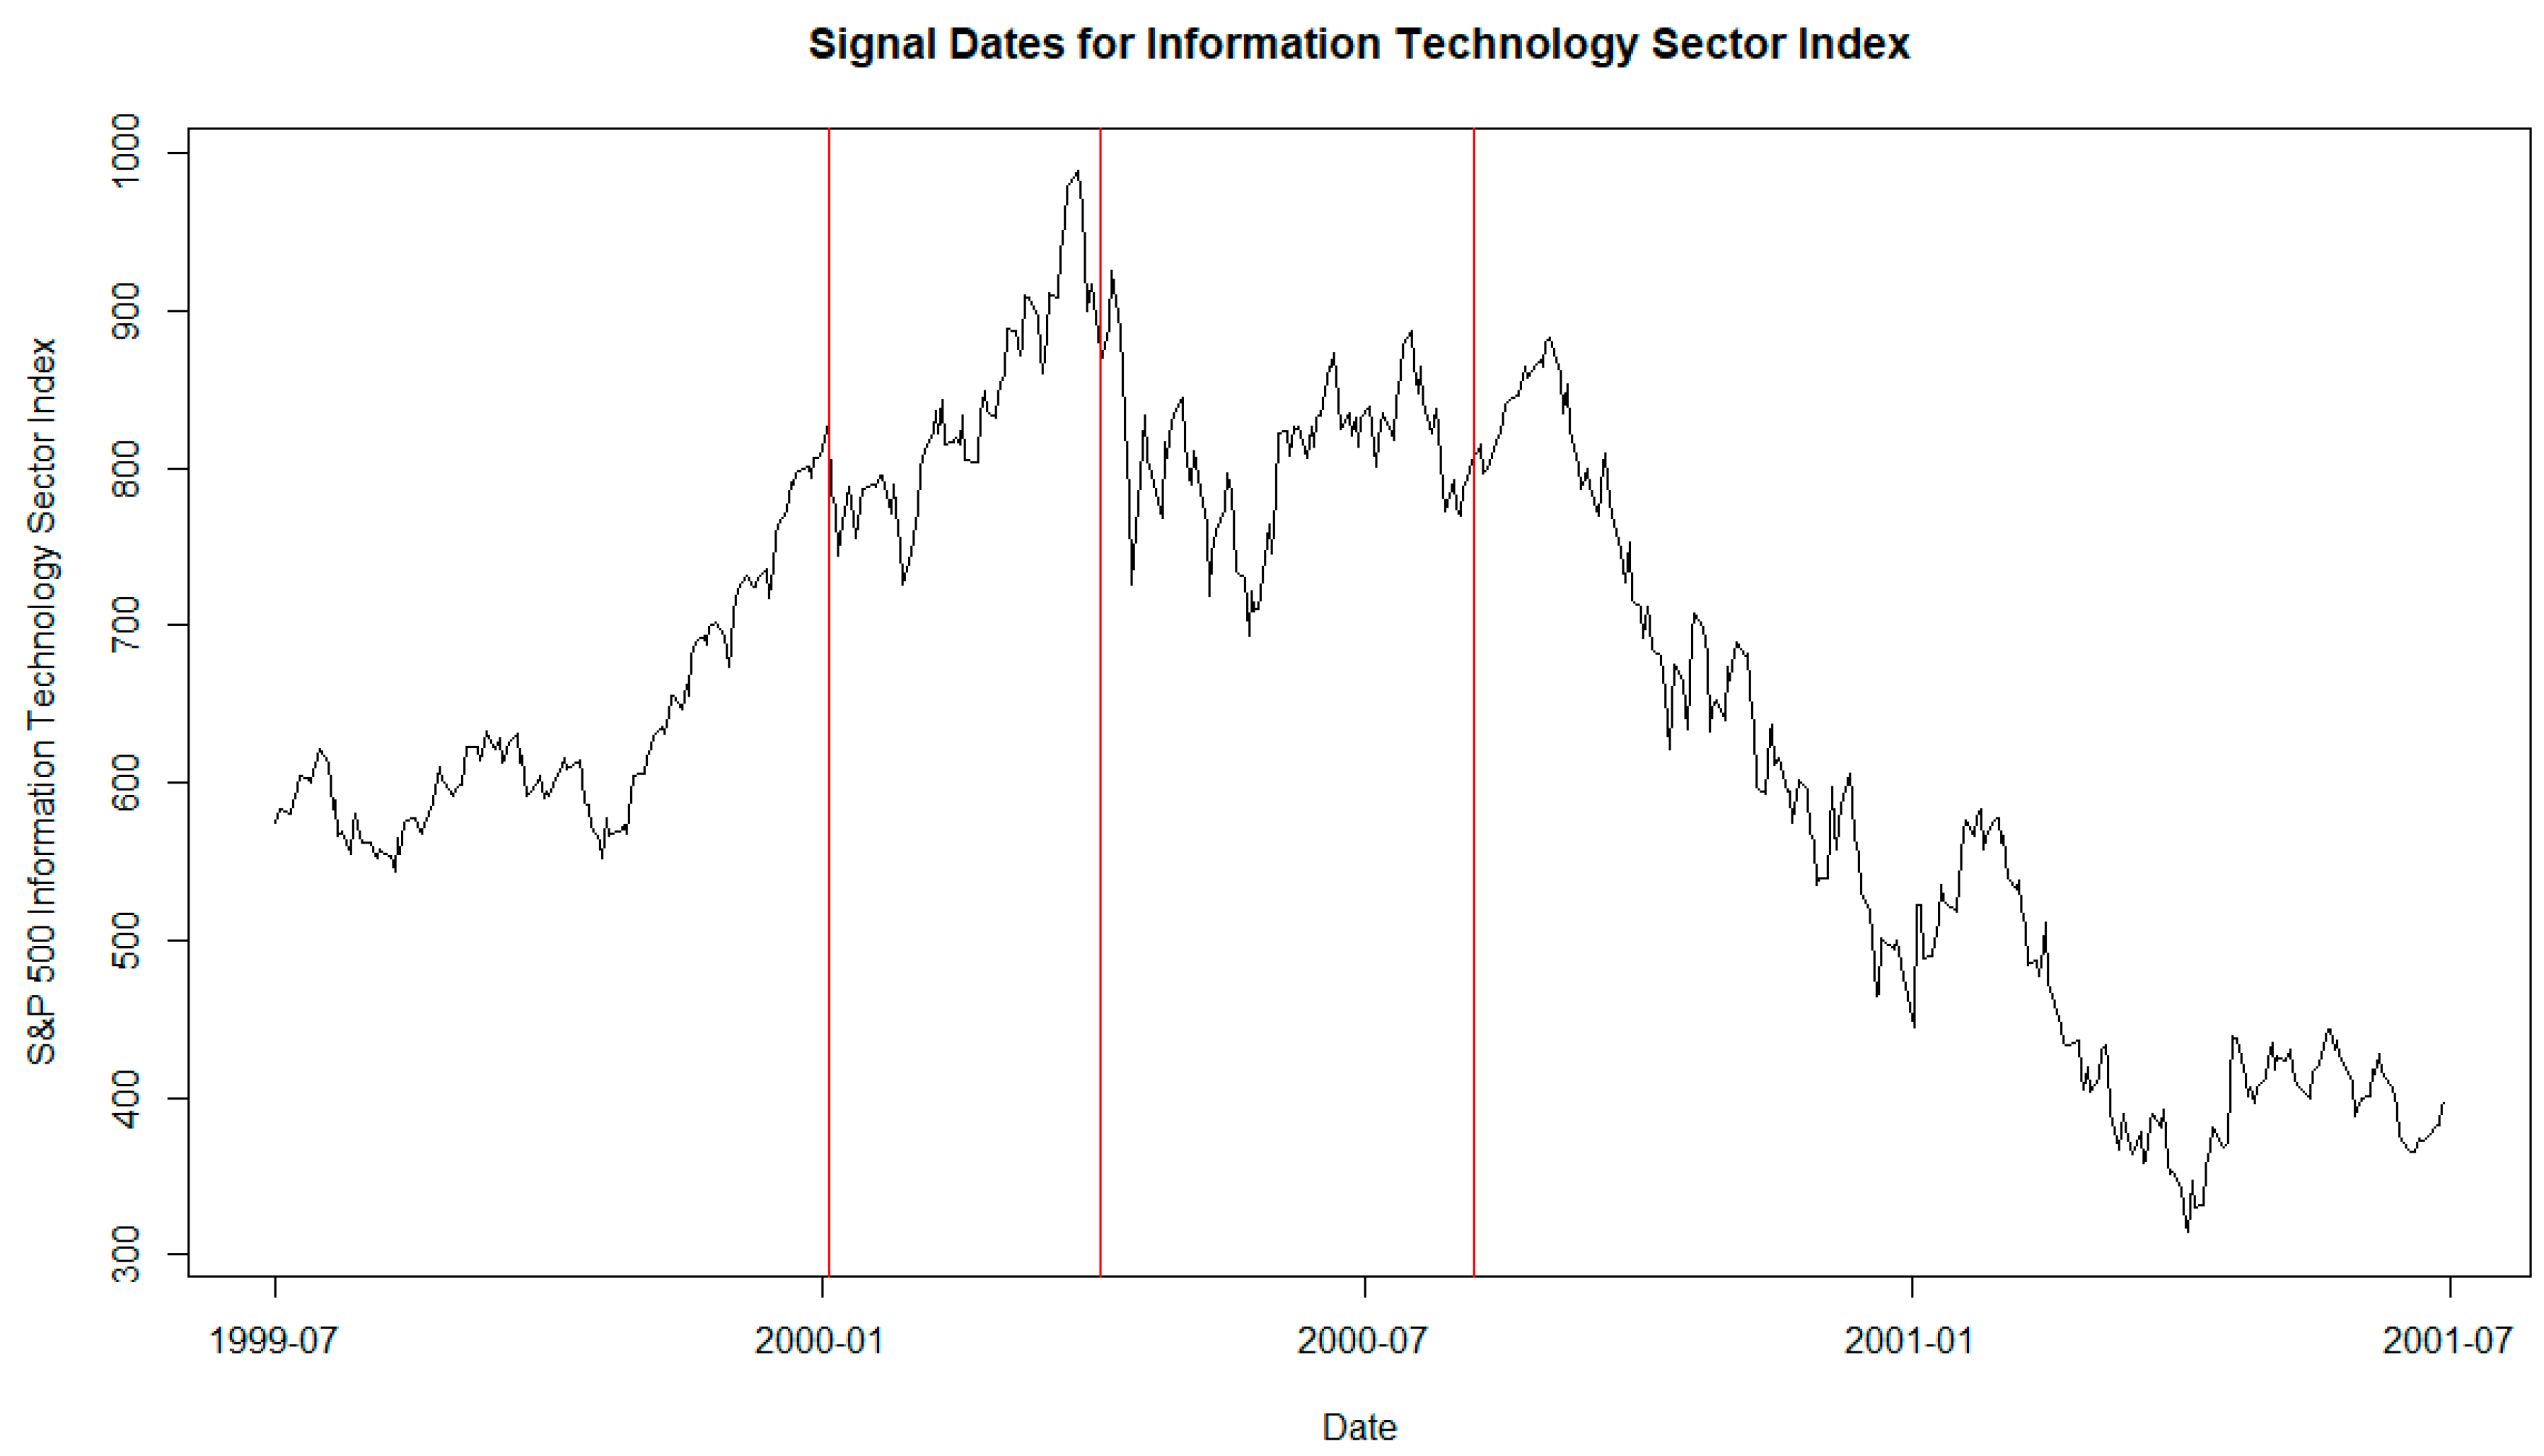
Figure 2.
Signal Dates for the Financial Sector Index. The first vertical line on the left is the signal date based on the PE Z-score. The second vertical line on the right is the signal date based on the BSEYD Z-score. The signal dates are: 2008-07-23, and 2008-08-22.
Figure 2.
Signal Dates for the Financial Sector Index. The first vertical line on the left is the signal date based on the PE Z-score. The second vertical line on the right is the signal date based on the BSEYD Z-score. The signal dates are: 2008-07-23, and 2008-08-22.
Disclaimer/Publisher’s Note: The statements, opinions and data contained in all publications are solely those of the individual author(s) and contributor(s) and not of MDPI and/or the editor(s). MDPI and/or the editor(s) disclaim responsibility for any injury to people or property resulting from any ideas, methods, instructions or products referred to in the content. |
© 2023 by the authors. Licensee MDPI, Basel, Switzerland. This article is an open access article distributed under the terms and conditions of the Creative Commons Attribution (CC BY) license (http://creativecommons.org/licenses/by/4.0/).
Copyright: This open access article is published under a Creative Commons CC BY 4.0 license, which permit the free download, distribution, and reuse, provided that the author and preprint are cited in any reuse.


