Submitted:
14 November 2023
Posted:
16 November 2023
You are already at the latest version
Abstract
Breast cancer (BC) ranks among the most prevalent cancers diagnosed in women. Its treatment necessitates precision tailored to the cancer's genetic makeup for enhanced efficacy. Research has been directed towards natural compounds for their anti-BC properties, aiming to augment existing treatment modalities. Chromolaena tacotana (Klatt) R.M. King and H. Rob, commonly referred to as Ch. tacotana, is a notable source of bioactive hydroxy-methylated flavonoids. However, the specific anti-BC mechanisms of these flavonoids, particularly those present in the plant's inflorescences, remain partly undefined. This study focuses on assessing a chalcone derivative extracted from Ch. tacotana inflorescences for its potential to concurrently activate regulated autophagy and intrinsic apoptosis in Luminal A and triple-negative BC cells. We determined the chemical composition of the chalcone using ultraviolet (UV) and nuclear magnetic resonance (NMR) spectroscopy. Its selective cytotoxicity against BC cell lines was assessed using the MTT assay. Flow cytometry and western blot analysis were employed to examine the modulation of proteins governing autophagy and the intrinsic apoptosis pathway. Additionally, in silico simulations were conducted to predict interactions between the chalcone and various anti-apoptotic proteins, including the mTOR protein. The chalcone was identified as 2',4-dihydroxy-4',6'-dimethoxy-chalcone (DDC), also known as Flavokavain C (FKC). This compound demonstrated selective inhibition of BC cell proliferation and triggered autophagy and intrinsic apoptosis. It induced cell cycle arrest in the G0/G1 phase and altered mitochondrial outer membrane potential (∆ψm). The study observed the activation of autophagic LC3-II and mitochondrial pro-apoptotic proteins in both BC cell lines. The regulation of Bcl-XL and Bcl-2 proteins varied according to BC subtype, yet they showed promising molecular interactions with DDC. Among the examined pro-survival proteins, mTOR and Mcl-1 exhibited the most favorable binding energies and were downregulated in MCF-7 and MDA-MB-231 cell lines. Further research is needed to fully understand the molecular dynamics involved in the activation and interaction of autophagy and apoptosis pathways in cancer cells in response to potential anticancer agents like the hydroxy-methylated flavonoids from Ch. tacotana.
Keywords:
Chromolaena tacotana
; chalcone
; breast cancer
; intrinsic apoptosis
; autophagy
1. Introduction
Breast cancer (BC) remains a significant public health challenge worldwide, despite advances in early detection. It comprises various molecular subtypes, many of which exhibit resistance to standard therapies [1]. Triple-negative breast cancer (TNBC) is particularly challenging to treat and is linked to a poorer prognosis. This difficulty arises from its lack of estrogen receptors (ER), progesterone receptors (PR), and human epidermal growth factor receptor 2 (HER2+) [1]. Other ER-positive breast cancer types include HER2+, luminal A, and luminal B subtypes, with luminal A being the most prevalent. Luminal B breast cancer, while also ER-positive, is characterized by an overexpression of the HER2+ gene [2].
Flavonoids are natural polyphenolic compounds that provide beneficial effects on human health, due to their biological properties as antioxidant, antimicrobial, immunosuppressive, anti-inflammatory and anti-cancerigen [3]. Chalcones are a subclass of flavonoids with great diversity in pharmacological activities. Structurally consist of two aromatic rings attached by three carbon units having α and β unsaturated ketone (1,3-diaryl-2-propen-1-one). The skeleton is an intermediate structure used in biosynthesis of flavonoids [4]. Natural and synthetic chalcones have emerged as important molecules with various therapeutic properties as anti-cancer effects [5], including cytotoxicity for a wide range of cancer types as leukemia, hepatoma, colorectal cancer, stomach cancer, prostate cancer, epidermoid carcinoma and breast cancer, through mechanism than involve apoptosis induction by death receptors activation or Bcl-2 family proteins regulation. Their anticancer properties have been associated with their radical structures including O-substitution: hydroxyl and methoxy groups, O-glycosylated and O-dimmers chalcones; prenylated substitution (prenyl, geranyl, furano, and pyrano chalcones) between others, and formation of Diels-Alder Adducts (isoprene, monoterpene, coumarins and other classes of flavonoids) [6].
Certain naturally occurring chalcones have shown effectiveness against breast cancer cells. Butein, for instance, influences estrogen metabolism by inhibiting the aromatase enzyme, with an IC50 value of 3.75 μM [7]. Isoliquiritigenin, a polyhydroxy chalcone derived from Glycyrrhiza glabra roots, has demonstrated both antitumorigenic activity and estrogen receptor (ER) α-dependent growth promotion in breast cancer cells, additionally inducing apoptosis [8,9].
Xanthohumol, a prenylated chalcone isolated from the female hop plant Humulus lupulus, exhibited in vitro antiproliferative effects and induced apoptosis in MDA-MB-231 breast cancer cells. This is achieved through the downregulation of Bcl-2 and matrix metalloproteinases (MMP-2 and MMP-9) at a concentration of 6.7 μM, which consequently activates Bax, Caspase-3, and Caspase-9 [10,11]. Isobavachalcone, sourced from Psoralea corylifolia L, enhances sensitivity to E2-induced paclitaxel resistance by down-regulating CD44 expression in ER-positive breast cancer cells [12]. Additionally, a prenylated chalcone named Xanthoangelol B, isolated from Ashitaba (Angelica keiskei Koidzumi, Apiaceae), induces apoptotic cell death through the activation of caspase-3, via a mechanism that does not involve the Bax/Bcl-2 signal transduction pathway [13].
Flavokavains (FKs) are a class of hydroxychalcones identified in various plants including Piper methysticum, P. triangularis var. pallida, and Didymocarpus corchorifolia [14]. This group includes 2'-hydroxy 4,4',6'-trimethoxychalcone (FKA), 6'-hydroxy-2',4'-dimethoxychalcone (FKB), and 2’,4-dihydroxy-4´,6´-dimethoxy-chalcone (FKC). These compounds have demonstrated anticancer properties against MCF-7 and MDA-MB-231 breast cancer cell lines, inducing apoptosis and causing G2/M phase cell cycle arrest. They also influence the processes of cell migration and invasion [15–17]. Specifically, FKB has been observed to induce cell death through p21-mediated cell cycle arrest and p38 activation in HeLa cervical cancer cells. Interestingly, its mechanism does not involve oxidative stress-induced apoptosis, as indicated by the concurrent activation of antioxidant-related pathways and iron sequestration pathways following the activation of ER-resident stress proteins [18]. FKC, in particular, has been studied for its potent inhibitory effects on colon cancer cell proliferation. It induces cell cycle arrest and promotes apoptosis, which is associated with endoplasmic reticulum stress and the regulation of MAPK and Akt signaling pathways [19]. Recent studies have shown that breast cancer cells treated with synthetic FKC exhibit suppressed colony formation, G2/M phase cell cycle arrest, apoptosis, and DNA damage in a dose-dependent manner [17].
The Chromolaena genus is distributed across temperate regions of Africa, Latin America, Southern Asia, and Australia [20]. Traditionally in ethnomedicine, Chromolaena species have been employed in treating a variety of ailments, including malaria, nasal congestion, inflammation, eye disorders, asthma, cough, flu, headache, colds, and, more recently, cancer [21,22]. Over 190 compounds have been isolated and identified from 27 species within this genus, encompassing a diverse array of chemical classes such as flavonoids, alkaloids, triterpenoids, diterpenoids, sesquiterpenoids, steroids, fatty acids, coumarins, and chalcones [23].
Approximately nine chalcones have been isolated from the Chromolaena genus. These include pinocembrin chalcone (2',4',6'-Trihydroxychalcone) from Chromolaena chasea; and several compounds from Chromolaena odorata: 2ʹ,4-dihydroxy-4ʹ,5ʹ,6ʹ-trimethoxy chalcone (ChDora), 2ʹ-hydroxy-3ʹ,4,4ʹ,5ʹ,6ʹ-pentamethoxychalcone (Odoratin), 2ʹ-hydroxy-4,4ʹ,5ʹ,6ʹ-tetramethoxychalcone, 4,6′-dihydroxy-2′,3′,4′-trimethoxychalcone, 6′-hydroxy-4,2′,3′,4′-tetramethoxychalcone [23,24], 2ʹ,4-dihydroxy-3ʹ,4ʹ,6ʹ-trimethoxychalcone, 2ʹ-hydroxy-3’,4,4ʹ,6ʹ-tetramethoxychalcone [25], and 2-hydroxy-4,′5,′6,′4,5-pentamethoxychalcone [26]. ChDora has shown weak cytostatic activity against U251-SP and PC-3 human tumor cell lines, with an IC50 value of 92.72 μM [27]. Odoratin, in contrast, has been observed to decrease cell viability in Cal51, HeLa, and MCF-7 breast cancer cells in a dose-dependent manner [23].
2. Results
The dichloromethane extract, derived from the inflorescences of the studied plant, was found to be rich in flavonoids. The specific chalcone investigated in this research was isolated from this flavonoid-rich extract. To elucidate the chemical structure of this compound, a combination of analytical techniques was employed. Ultraviolet (UV) spectroscopy data were collected, using various displacement reagents including AcONa (sodium acetate), MeONa (sodium methoxide), AlCl3/HCl (aluminum chloride/hydrochloric acid), and H3BO3 (boric acid). Additionally, the structure was further characterized through both proton nuclear magnetic resonance (1H NMR) and carbon-13 nuclear magnetic resonance (13C NMR) spectroscopy. High-resolution electrospray ionization mass spectrometry (HR-ESI-MS) experiments also contributed to the comprehensive structural determination of this compound. These analytical methods collectively provided a detailed understanding of the molecular structure of the chalcone isolated from the dichloromethane extract.
2.1. Structural analysis.
The chalcone was obtained as an orange crystalline solid, soluble in acetone, and a melting point of 196 °C. Its Rf value was 0.55 (silica gel, CHCl3: MeOH 9.8: 0.2). It has a very faint yellow spot, almost white. It fluoresces yellow when viewed under UV light at λ = 366 nm and turns brown when exposed to NH3 vapors.
The 1H NMR (proton nuclear magnetic resonance) spectrum of the chalcone demonstrated 10 distinct signals, corresponding to 14 hydrogen atoms. This included two signals indicative of vinyl hydrogens, characteristic of unsaturated compounds like chalcones, and two signals for methoxy group hydrogens, suggesting methoxy substituents within the molecule. The pattern of meta coupling signals in ring A pointed to a tetra-substitution configuration. In ring B, two symmetrical signals for four protons in meta-disposition suggested a double substitution. Additionally, the spectrum showed two signals for hydroxyl-type hydrogens, one in each ring, specifically at 8.96 ppm (ring B) and 14.41 ppm (ring A), confirming the molecule’s total hydrogen count as 16.
In the 13C NMR APT (Attached Proton Test) spectrum, 15 carbon signals were detected, accounting for 17 carbon atoms in the molecule. These signals included three for quaternary carbons, six for C-H carbons, two for O-CH3 carbons from methoxy groups, and four for C-O carbons. A significant chemical shift was observed at δ = 192.47 ppm, indicative of the carbonyl carbon common in flavonoids. The methoxy groups were further substantiated by signals at δ = 55.17 ppm and δ = 55.60 ppm in the negative phase. Additionally, intense signals at δ = 130.50 ppm and δ = 115.93 ppm in the negative phase suggested two pairs of methine-type carbons symmetrically positioned in ring B. These NMR analyses provide a detailed insight into the molecular structure of the chalcone, revealing its complex array of functional groups and substitution patterns.

Table 1.
1H and 13C NMR (300 MHz, Acetone-d6), and, UV nm spectral data for 2’,4-dihydroxy-4´,6´-dimethoxy-chalcone (DDC) obtained from inflorescences of Ch. tacotana.
Table 1.
1H and 13C NMR (300 MHz, Acetone-d6), and, UV nm spectral data for 2’,4-dihydroxy-4´,6´-dimethoxy-chalcone (DDC) obtained from inflorescences of Ch. tacotana.
| 2’,4-dihydroxy-4´,6´-dimethoxy-chalcone (DDC) | ||||||
|---|---|---|---|---|---|---|
| Position | NMR | Displacement Analysis | ||||
| δH (J in Hz) | δC (ppm) | |||||
| C-1 C-2 C-3 C-4 C-5 C-6 C-α C-β C-β´ C-1´ C-2´ C-3´ C-4´ C-4´-OCH3 C-5´ C-6´ C-6´-OCH3 |
- 7.64 (2H, dd, J= 2.4 Hz) 6.94 (2H, dd, J= 2.4 Hz) - 6.94 (2H, dd, J= 2.4 Hz) 7.64 (2H, dd, J= 2.4 Hz) 7.78 (1H, d, J = 15.5 Hz) 7.91 (1H, d, J = 15.5 Hz) - - - 6.10 (2H, dd, J= 2.4 Hz) - 3.88 (3H, s) 6.10 (2H, dd, J= 2.4 Hz) - 4.02 (3H, s) |
127.1 130.5 115.93 159.83 115.93 130.5 124.15 142.84 192.47 105.92 166.38 93.77 168.26 55.17 90.87 162.79 55.60 |
Reactive | Band II (nm) | Band I (nm) |
Displacement (nm) |
| MeOH | 240 | 367 | - | |||
| MeOH+MeONa | 245 | 402 | B II:5, B I:35 | |||
| MeOH+AcONa | 245 | 372 | B II:5, B I:5. | |||
| MeOH+AcONa+H3BO3 | 240 | 372 | B I:5 | |||
| MeOH+AlCl3 | 240 | 383 | B I: 16 | |||
| MeOH+AlCl3+HCl | 240 | 476 | B I:9. | |||
The UV-Visible (UV-Vis) spectroscopy analysis of the chalcone, particularly with the displacement reagents AcONa and H3BO3, provided further insights into its structure. The analysis indicated a likely hydroxyl substitution at the C-4 position in ring B. However, the possibility of a hydroxyl substituent at the C-4' and C-2' positions was ruled out, though the substitution of other radicals at these positions remained a possibility, as detailed on the right side of Table 1. Additionally, it was observed that the compound does not undergo hydrolysis in acidic conditions.
The exact mass of the chalcone was calculated as 300.09588 ± 3.89 ppm. This calculation was based on data from electrospray ionization (ESI) mass spectrometry in both negative and positive ion modes. In the negative ion mode, the [M-H]- ion was measured at 299.08, and in the positive ion mode, the [M+H]+ ion was at 301.10. These results supported the determination of the molecular formula as C17H16O5, which has a calculated mass of 300.09. This information, alongside the chemical structure representation provided in Figure 1 and additional details in Supplementary figure S2, allowed for a comprehensive understanding of the chalcone's molecular structure.
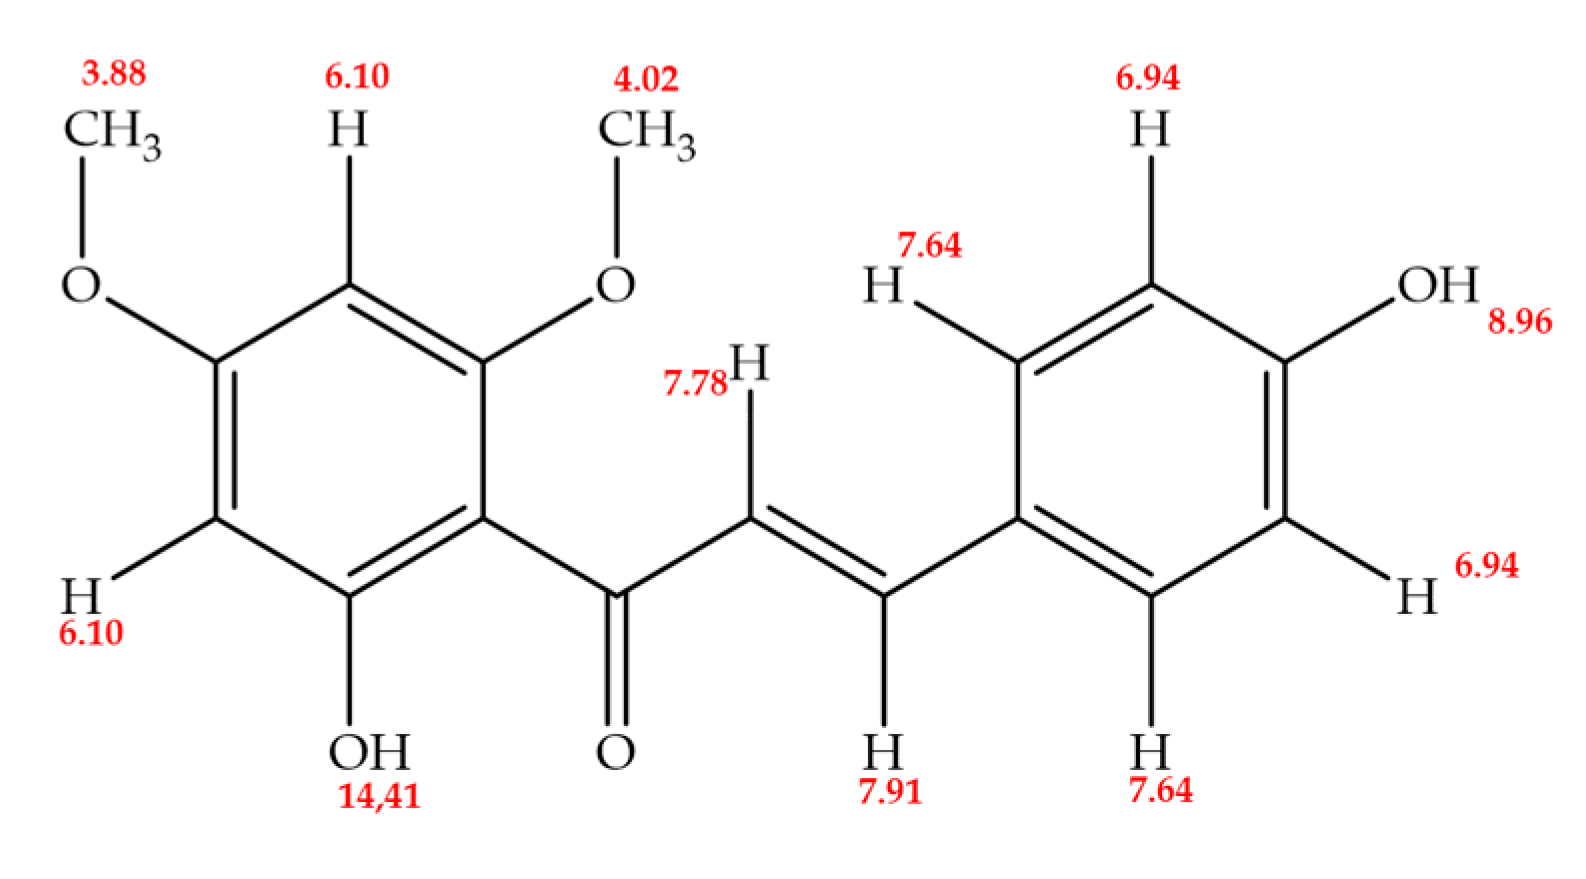
Figure 1.
Structure of 2’,4-dihydroxy-4´,6´-dimethoxy-chalcone (DDC).
2.2. 2',4-dihydroxy-4',6'-dimethoxy chalcone induces selective cytotoxicity in BC cells
The study investigated the impact of 2’,4-dihydroxy-4´,6´-dimethoxy-chalcone (DDC) on the growth of two breast cancer (BC) cell lines, MCF-7 and MDA-MB-231, as well as on non-tumorigenic mammary gland cells, MCF-12F. This assessment was carried out using the MTT assay, a standard method for evaluating cell viability, with each well containing 10,000 cells. The results indicated that DDC reduced cell viability in a concentration-dependent manner, as illustrated in Figure 2A-C. A crucial aspect of the findings was the determination of the half-maximal inhibitory concentration (IC50) values, which measure the effectiveness of a substance in inhibiting a biological function. For the breast cancer cell lines MCF-7 and MDA-MB-231, the IC50 values were 52.5 µM and 66.4 µM, respectively. In contrast, the IC50 for the non-tumor MCF-12F cells was significantly higher at 232.8 µM, as shown in Figure 2D.
These IC50 values highlighted a marked disparity in cytotoxicity between the cancerous and non-cancerous cells, indicating a significant degree of selectivity (p < 0.001) of DDC towards the breast cancer cells. The selectivity index (SI), a ratio indicating the relative safety of the compound, was 4.4 for MCF-7 and 3.5 for MDA-MB-231 when compared to the SI values obtained for the positive controls, paclitaxel (PTX) and resveratrol (RV), as depicted in Figure 2E. This selectivity is important as it suggests that DDC might be effective in targeting breast cancer cells while having a lesser effect on normal cells, a desirable characteristic in cancer therapeutics.
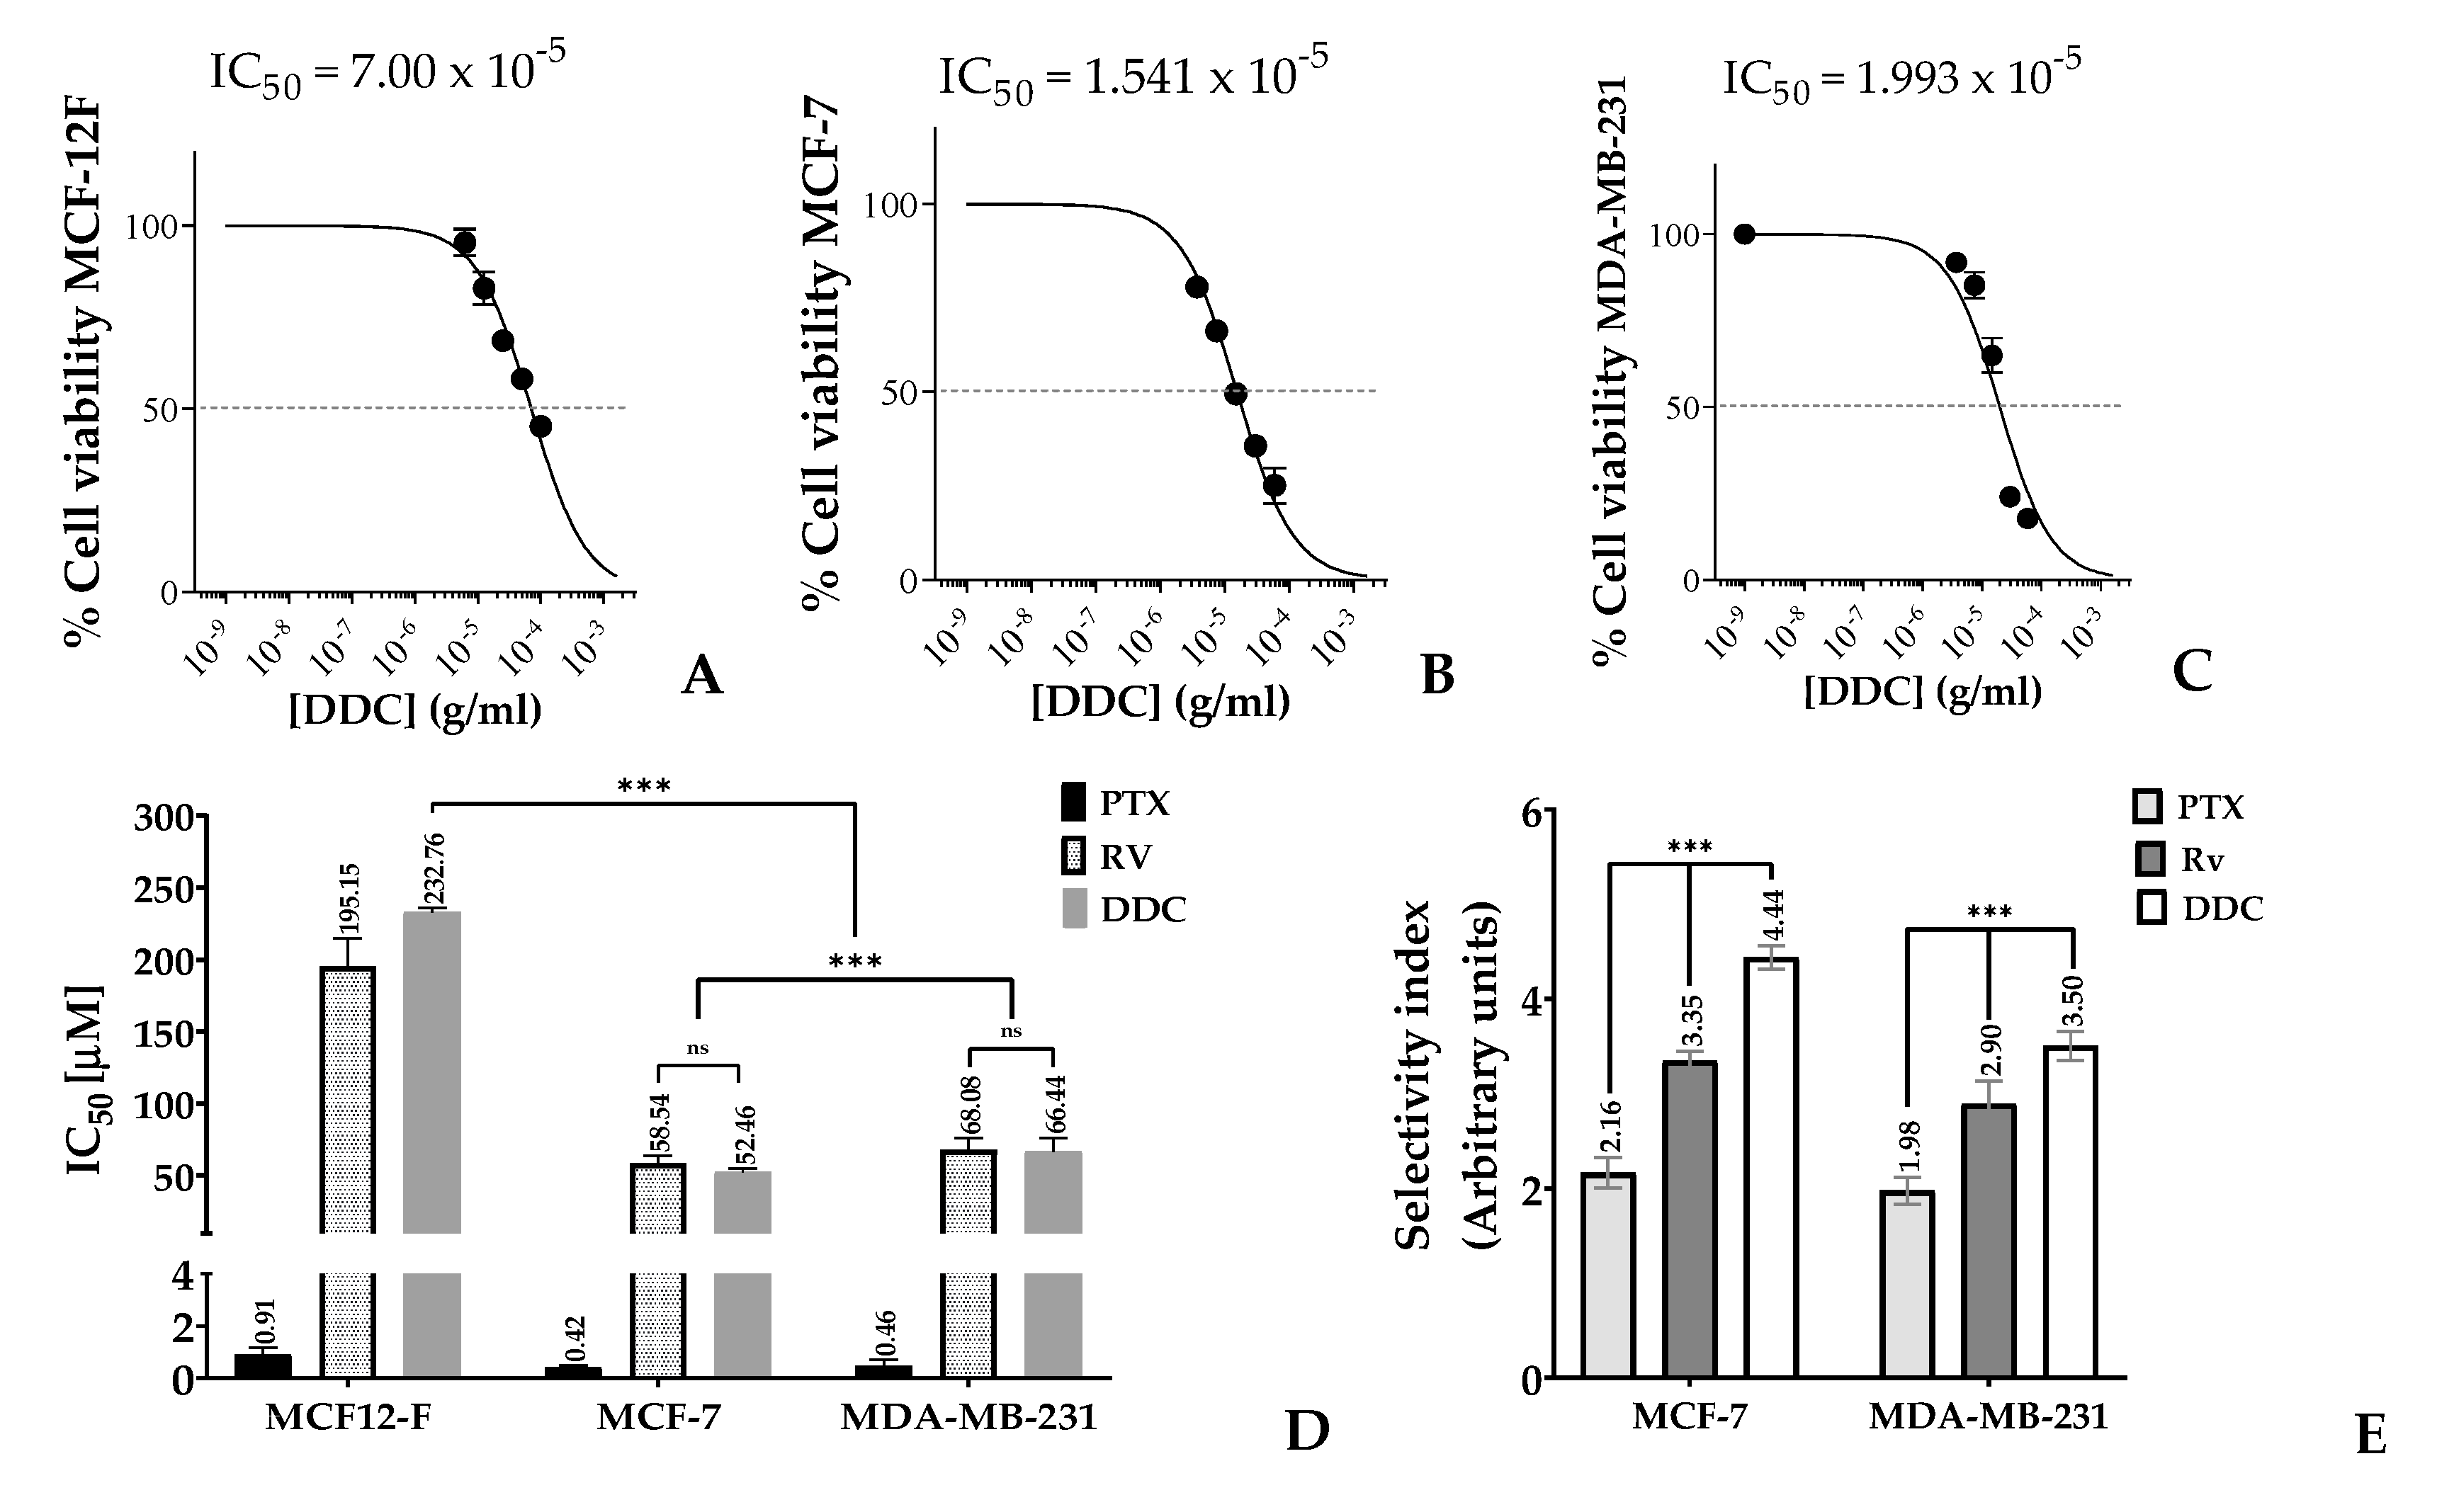
Figure 2.
Selective inhibition of cell viability in response to 2’,4-dihydroxy-4´,6´-dimethoxy-chalcone (DDC). (A-C). MCF12-F, MCF-7 and MDA-MB-231 percentage of viability in response to chalcone treatment at 48 hours (D) Half-maximal concentration (IC50), and (E). selectivity index on BC cells, using the positive control for apoptosis Paclitaxel (PTX) and for autophagy Resveratrol (RV). Data from three independent experiments, each performed in triplicate were carried out and data were analyzed in GraphPad Prism 8.0, (La Jolla, CA, USA). p-values indicate statistical significance p-value < 0.001***.
2.3. Cell cycle progression in response to the natural chalcone
DDC, identified as a naturally occurring chalcone, demonstrated a notable impact on the cell cycle of breast cancer cells. Specifically, it induced a blockade in the G1 phase in a significant majority of the cells within the studied breast cancer lines, MCF-7 and MDA-MB-231. This G1 phase arrest was observed in 65.7% of MCF-7 cells and 62.5% of MDA-MB-231 cells. In addition to this predominant G1 phase arrest, a smaller fraction of cells experienced cell cycle arrest in the G2/M phase, accounting for 24.1% in MCF-7 and 28.7% in MDA-MB-231 breast cancer cell lines.
These results were then compared to the effects of known chemotherapeutic agents, doxorubicin and combretastatin A-4, which were used as positive controls in the study. Doxorubicin is recognized for its ability to induce cell cycle arrest in the G1 phase, while combretastatin A-4 is known for its G2/M phase arrest capabilities. The findings with DDC showed a closer resemblance to the cell cycle effects of doxorubicin rather than combretastatin A-4. The detailed outcomes of this comparison, including the specific phases of cell cycle arrest induced by each agent, are illustrated in Figure 3.
This ability of DDC to induce a G1 phase blockade in breast cancer cells highlights its potential as an anticancer agent, particularly considering its efficacy in targeting specific phases of the cell cycle which is a crucial aspect of cancer treatment strategies.
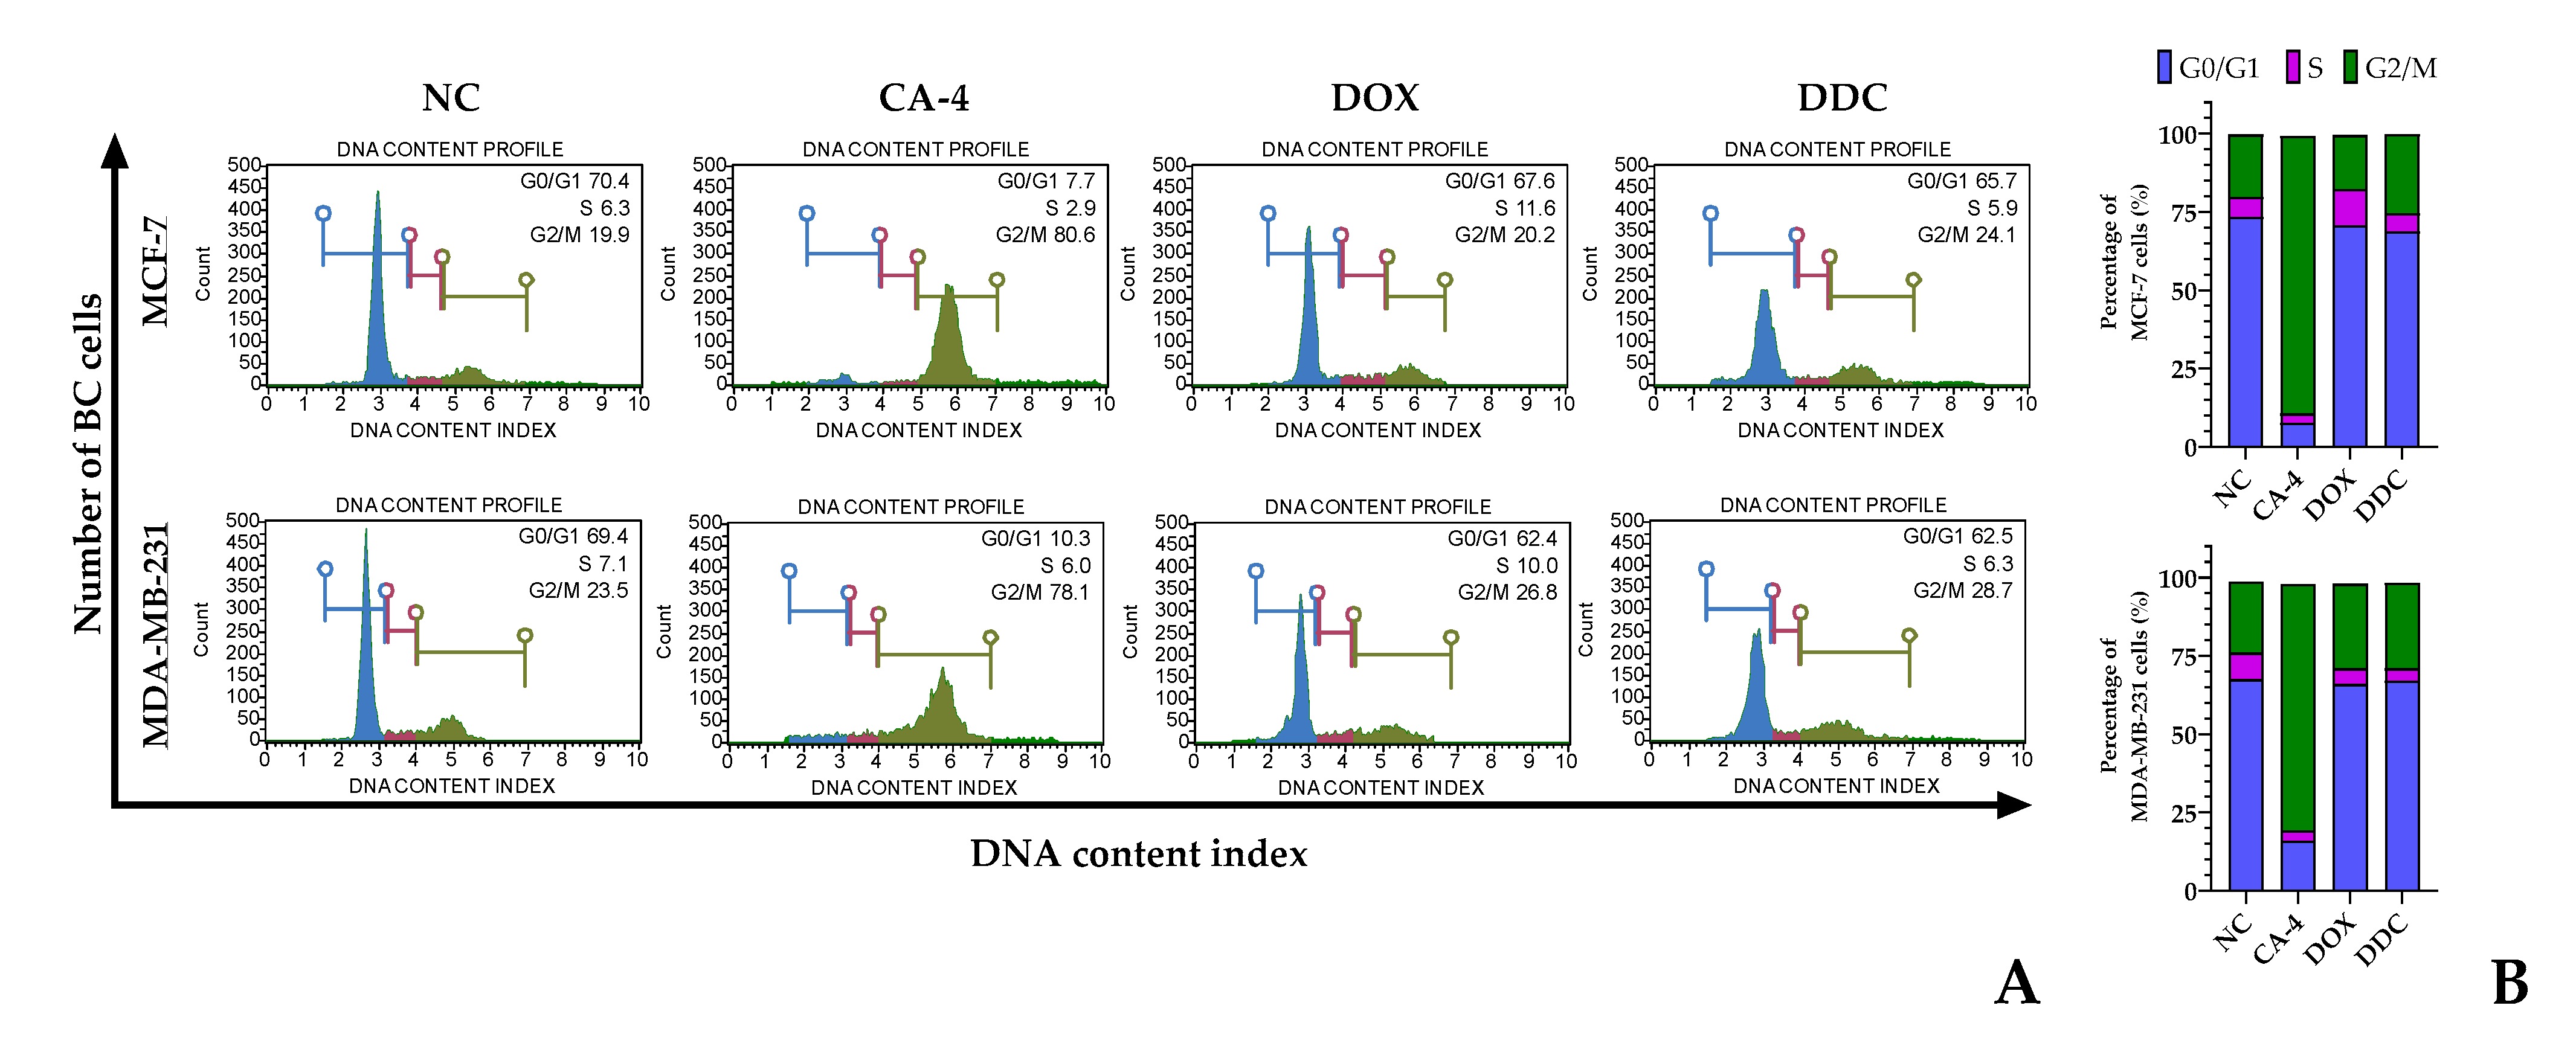
Figure 3.
Flow cytometric analysis of the cell cycle in BC cells in response to 2',4-dihydroxy-4',6'-dimethoxy-chalcone (DDC). (A) Histograms show the distribution of untreated cells or negative control (NC) combretastatin A-4 (CA-4) and doxorubicin (DOX)-treated cells used as positive controls of G2/M phase (in green) and G0/G1 phase (in blue), respectively, and DDC-treated cells at IC50 for 24 h and stained with propidium iodide. S phase is shown in violet. (B-C) Percentage of total untreated and treated MCF-7 and MDA-MB-231 BC cells distributed in each phase of the cell cycle (G0/G1, S, and G2/M).
2.4. Chalcone targeting autophagy in BC cells
The study aimed to assess the induction of autophagy in breast cancer (BC) cells exposed to 2’,4-dihydroxy-4´,6´-dimethoxy-chalcone (DDC) by detecting the LC3-II protein, a marker of autophagy. This protein localizes within autophagosomes, which are key structures in the autophagy process. Flow cytometry was utilized to detect LC3-II in chalcone-treated BC cells at 48 hours, and the findings were corroborated by western blot analysis at both 24 and 48 hours.
The results revealed an increase in the LC3-II signal following DDC treatment in BC cells. Notably, the intensity of this signal and the proportion of LC3-II expressing cells were higher in MCF-7 cells treated with DDC, surpassing even the levels detected in cells treated with resveratrol, which was used as a positive control, as depicted in Figure 4. Quantitatively, the autophagy levels, measured by the ratio of LC3-II expressing cells in treated cells compared to negative controls, were found to increase by 7.7-fold in MCF-7 and 6.3-fold in MDA-MB-231 cells (Figure 4B).
Furthermore, western blot analysis confirmed a significant increase in LC3-II protein expression in the BC cells treated with DDC. Complementing these findings, the study also analyzed the phosphorylation of mTOR, a key regulatory protein in autophagy. The phosphorylated mTOR levels decreased with the duration of treatment. However, the effect on another protein, p62, varied depending on the cell line. While p62 expression persisted in MCF-7 cells up to 48 hours after chalcone treatment, it decreased in MDA-MB-231 cells in a time-dependent manner, as shown in Figure 4C.
These findings underscore the potential of DDC in inducing autophagy in BC cells, with variations in response between different cell lines. The upregulation of LC3-II and the modulation of autophagy-related proteins like mTOR and p62 highlight the complex interplay of cellular mechanisms influenced by DDC treatment.
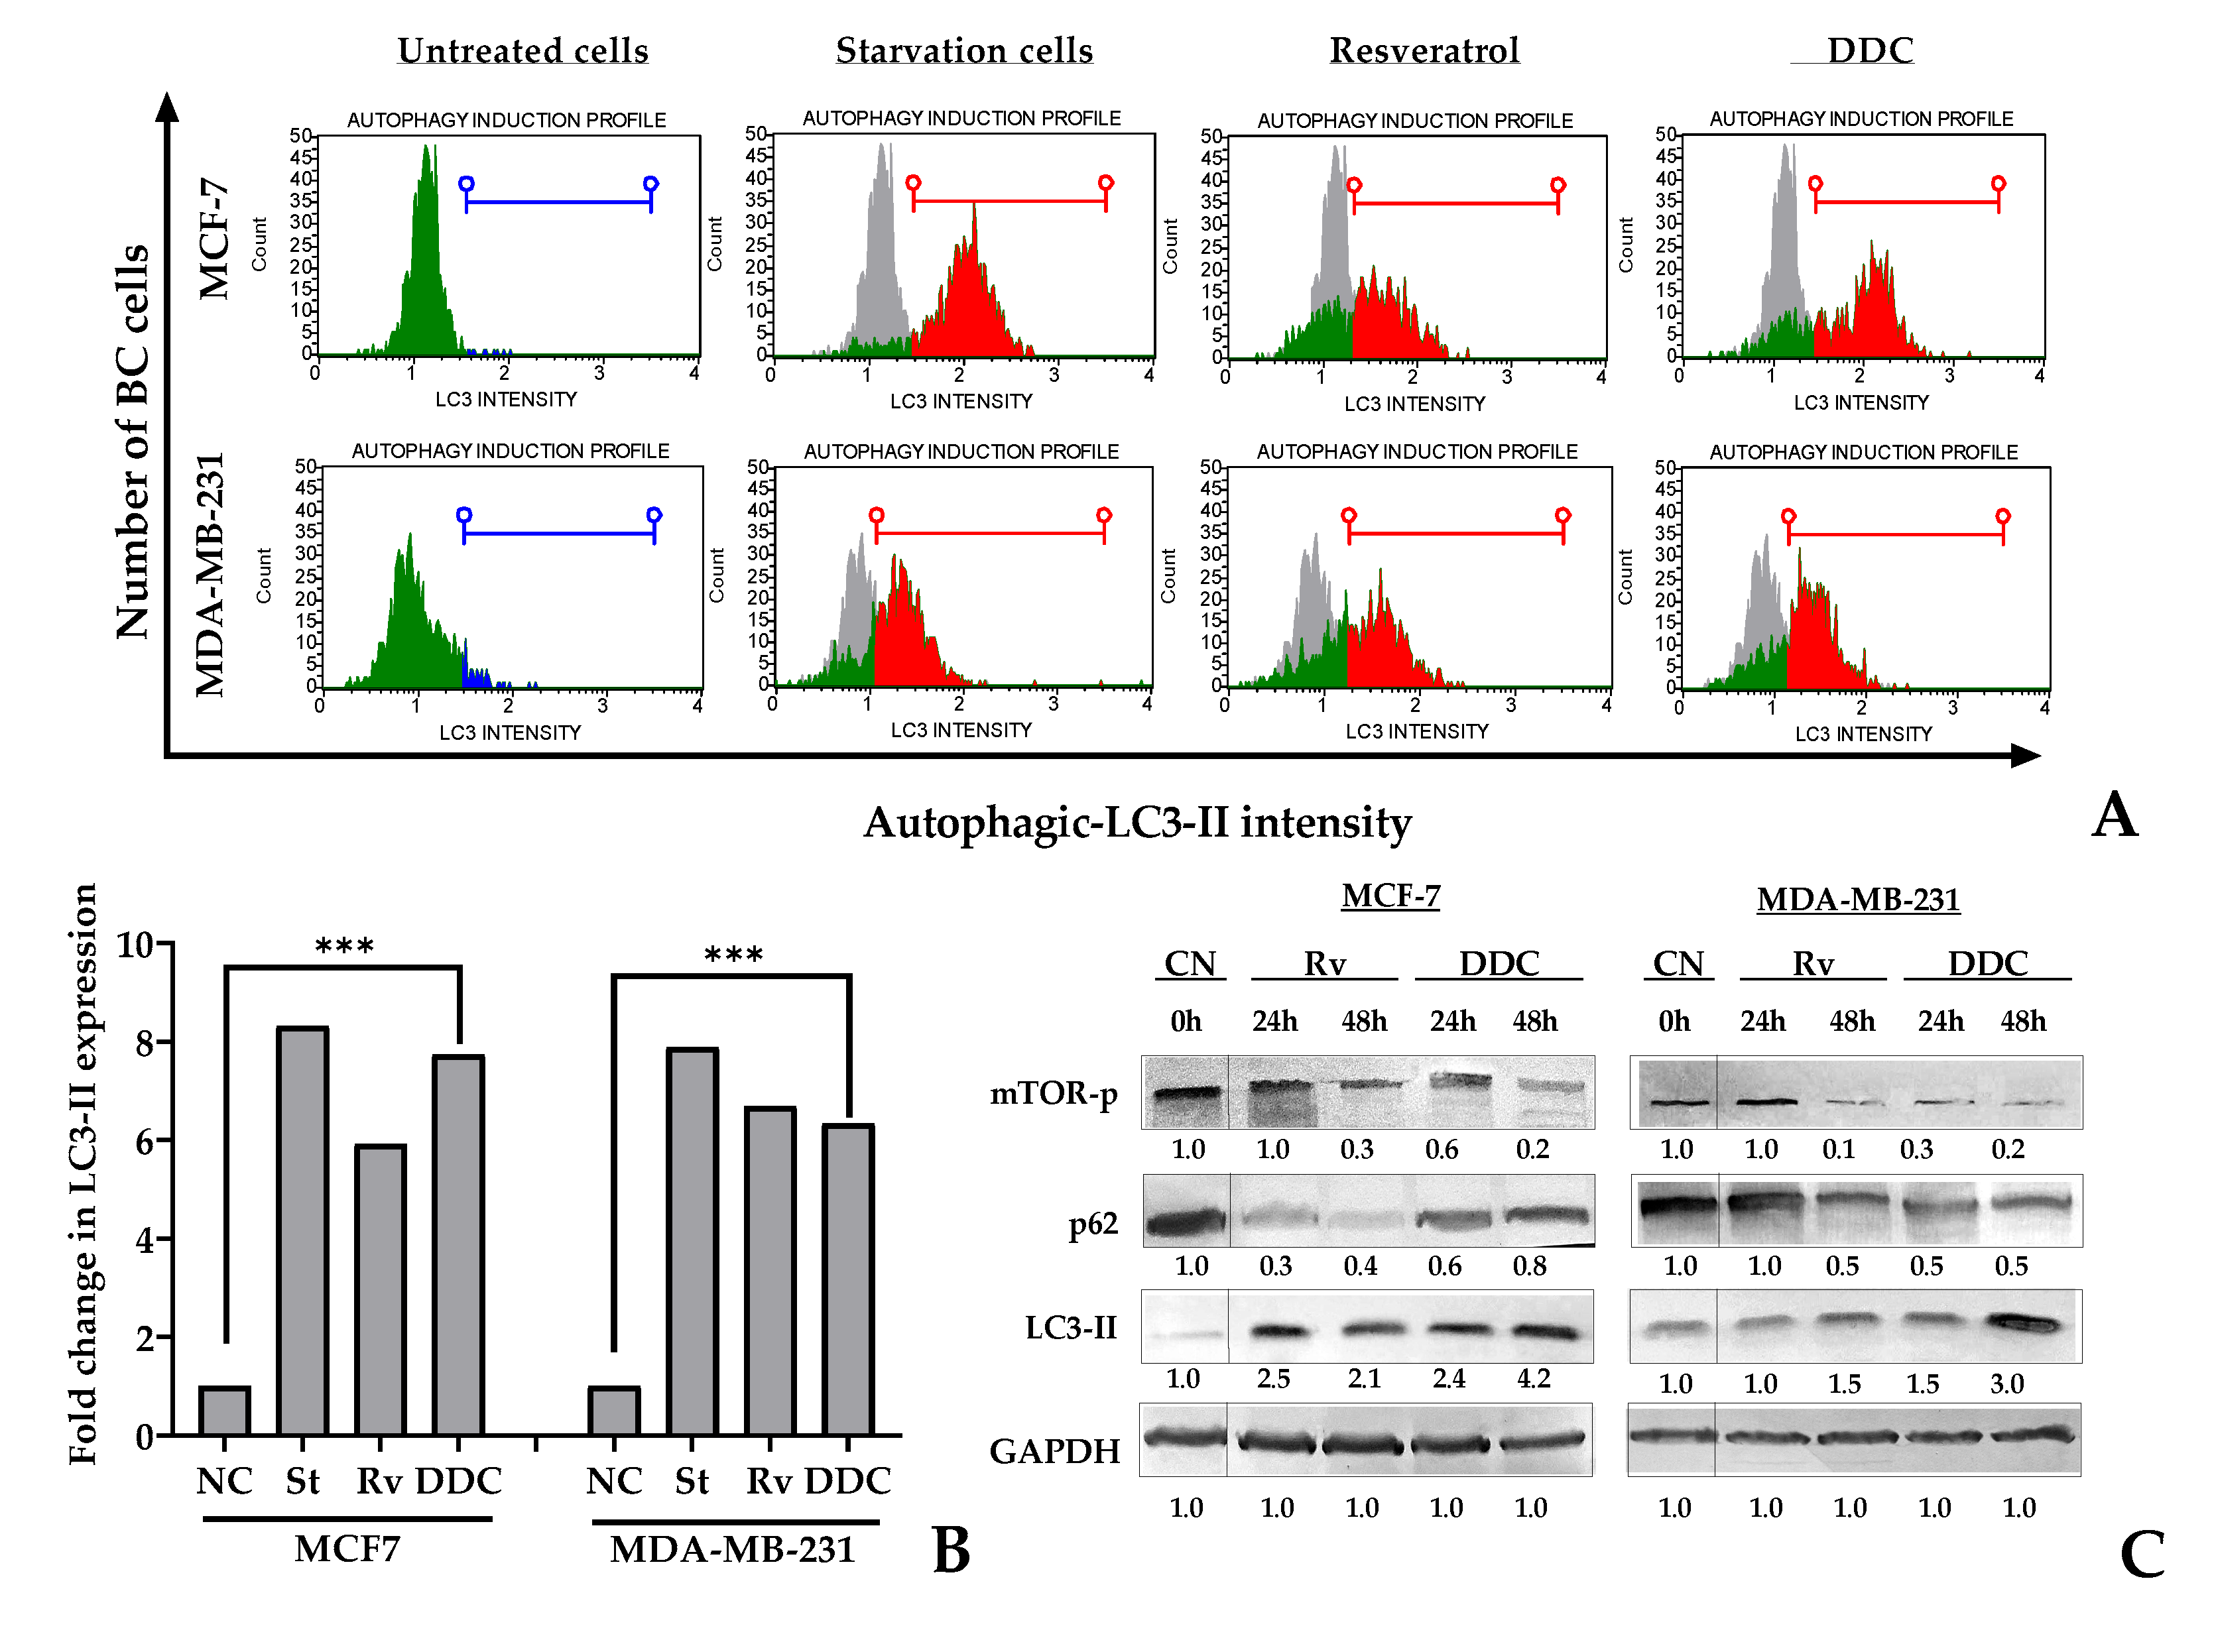
Figure 4.
mTOR dependent autophagy in BC cells in response to 2’,4-dihydroxy-4´,6´-dimethoxy-chalcone (DDC). (A) Histogram plots representing negative and positive LC3-II detection in BC cells after DDC treatment in green and red respectively. Untreated cells as the negative control (NC) in grey, starvation cells and resveratrol-treated cells as positive controls. (B) Fold change between the treated cells or positive controls and negative control, indicating the quantitate autophagy per sample. (C) Western blot of mTOR-Ser2448, p62 and autophagic LC3-II proteins. Semiquantitative analysis was performed according to the relative densitometric units obtained by using ImageJ, later normalized against the negative controls.
2.5. BC genotype-dependent variations in apoptosis triggering by DDC
To determine the apoptotic effect of 2’,4-dihydroxy-4´,6´-dimethoxy-chalcone (DDC) on breast cancer (BC) cells, flow cytometry was employed for analyses at 24 and 48 hours post-treatment, using the IC50 concentration of DDC. Paclitaxel (PTX) served as the positive control, while untreated cells were the negative control. The study utilized two assays: the detection of Annexin-V binding to externalized phosphatidylserine (PS) on the cell membrane, a marker of early apoptosis, along with the DNA dye 7-AAD to differentiate between early and late apoptosis stages. Additionally, the presence of active Caspases 3/7, with or without 7-AAD, was assessed for confirmation.
The results showed that DDC treatment induced apoptosis in BC cells. However, a notable resistance to complete the apoptosis process was observed in MCF-7 cells, which predominantly remained in the early phase of apoptosis even after 48 hours, as indicated by both Annexin-V and Caspase 3/7 detection. Conversely, a significant proportion of MDA-MB-231 cells advanced to late apoptosis at 48 hours. This led to a higher overall rate of apoptosis in TNBC cells.
Further analysis through Western blotting confirmed the activations of cleaved-caspases 3 and 7, indicating apoptosis. A higher amount of active caspase-3 was found in the BC cell lines, while cleaved caspase-7 activity was more pronounced in MDA-MB-231 cells compared to MCF-7 cells. Additionally, the study evaluated XIAP, a caspase inhibitor protein, revealing a significant reduction in its expression in MDA-MB-231 cells post-treatment, in contrast to MCF-7 cells, where no significant change was noted.
These findings highlight the variable response of different BC cell lines to DDC-induced apoptosis, particularly noting the stronger apoptotic effect in TNBC cells compared to others, and underscoring the potential therapeutic relevance of DDC in breast cancer treatment.
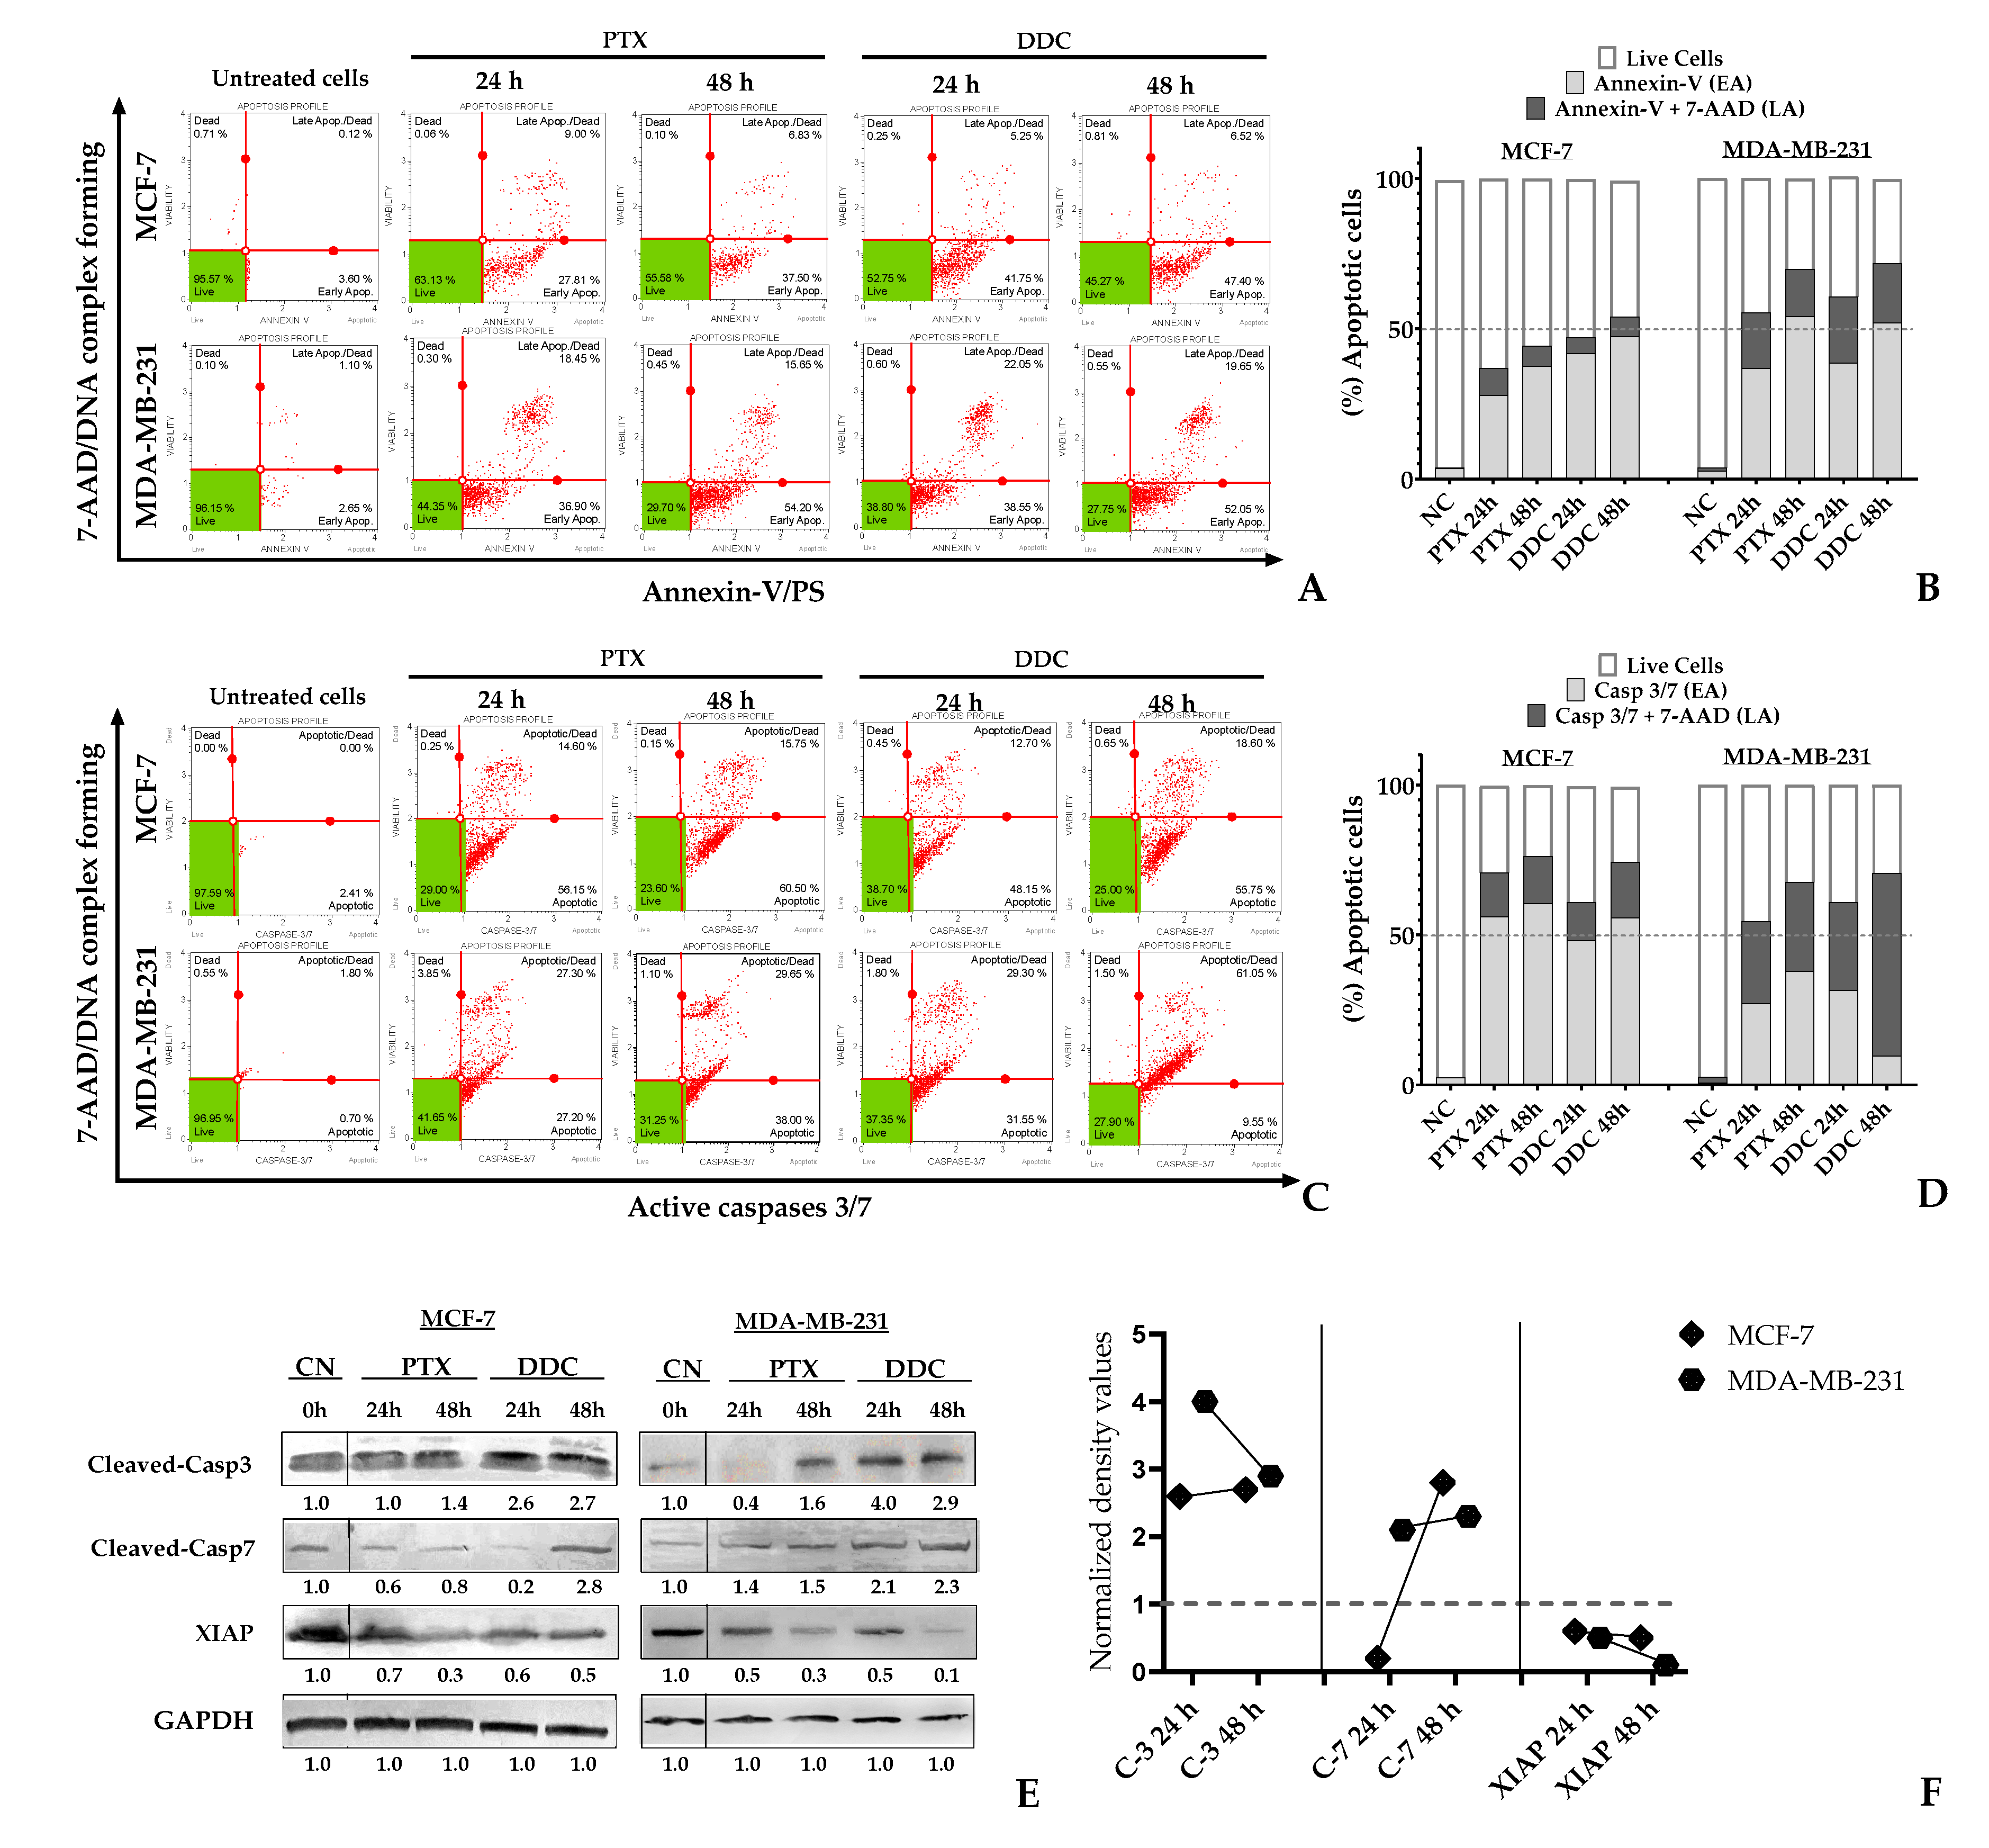
Figure 5.
Apoptosis induction on MCF-7 and MDA-MB-231 cells in response to 2’,4-dihydroxy-4´,6´-dimethoxy-chalcone (DDC) at 24 h and 48 h. EA (early apoptosis) LA (late apoptosis), NC correspond to untreated cells. PTX was used as positive control. A and C. The dot (in red) represent a single cell analyzed, in the green area are localized live cells. A. The upper panel correspond to Annexin V/7-AAD detection on cells B. The bar graph indicates the percentage of cells in early (Annexin-V) or late (Annexin-V/7-AAD) apoptosis. C. The bottom panel correspond to activation of Caspases 3/7 treated cells D. The bar graph indicates the percentage of cells in early (Casp3/7 stained cells) or late (Casp3/7 and 7-AAD detection) apoptosis. E. Western blot analysis of protein expression levels of cleaved-caspases 3 and 7 proteins, and the antiapoptotic XIAP protein. GAPDH was used as a loading control F. Normalized density values of protein expression levels in chalcone treated BC cells.
2.6. TNBC and Luminal A BC cells differ in the pathway leading to intrinsic apoptosis in response to DDC.
Alterations in the mitochondrial outer membrane potential (∆ψm) were observed in breast cancer (BC) cells after treatment with the natural compound diethyldithiocarbamate (DDC), as depicted in Figure 6. According to flow cytometric analysis, both BC cell lines, namely MDA-MB-231 and MCF-7, exhibited depolarization similar to that induced by the positive control, valinomycin. Notably, a higher proportion of MDA-MB-231 cells demonstrated a loss of membrane potential compared to the MCF-7 cells, with approximately 70% and 58% affected, respectively, as shown in Figure 6B.
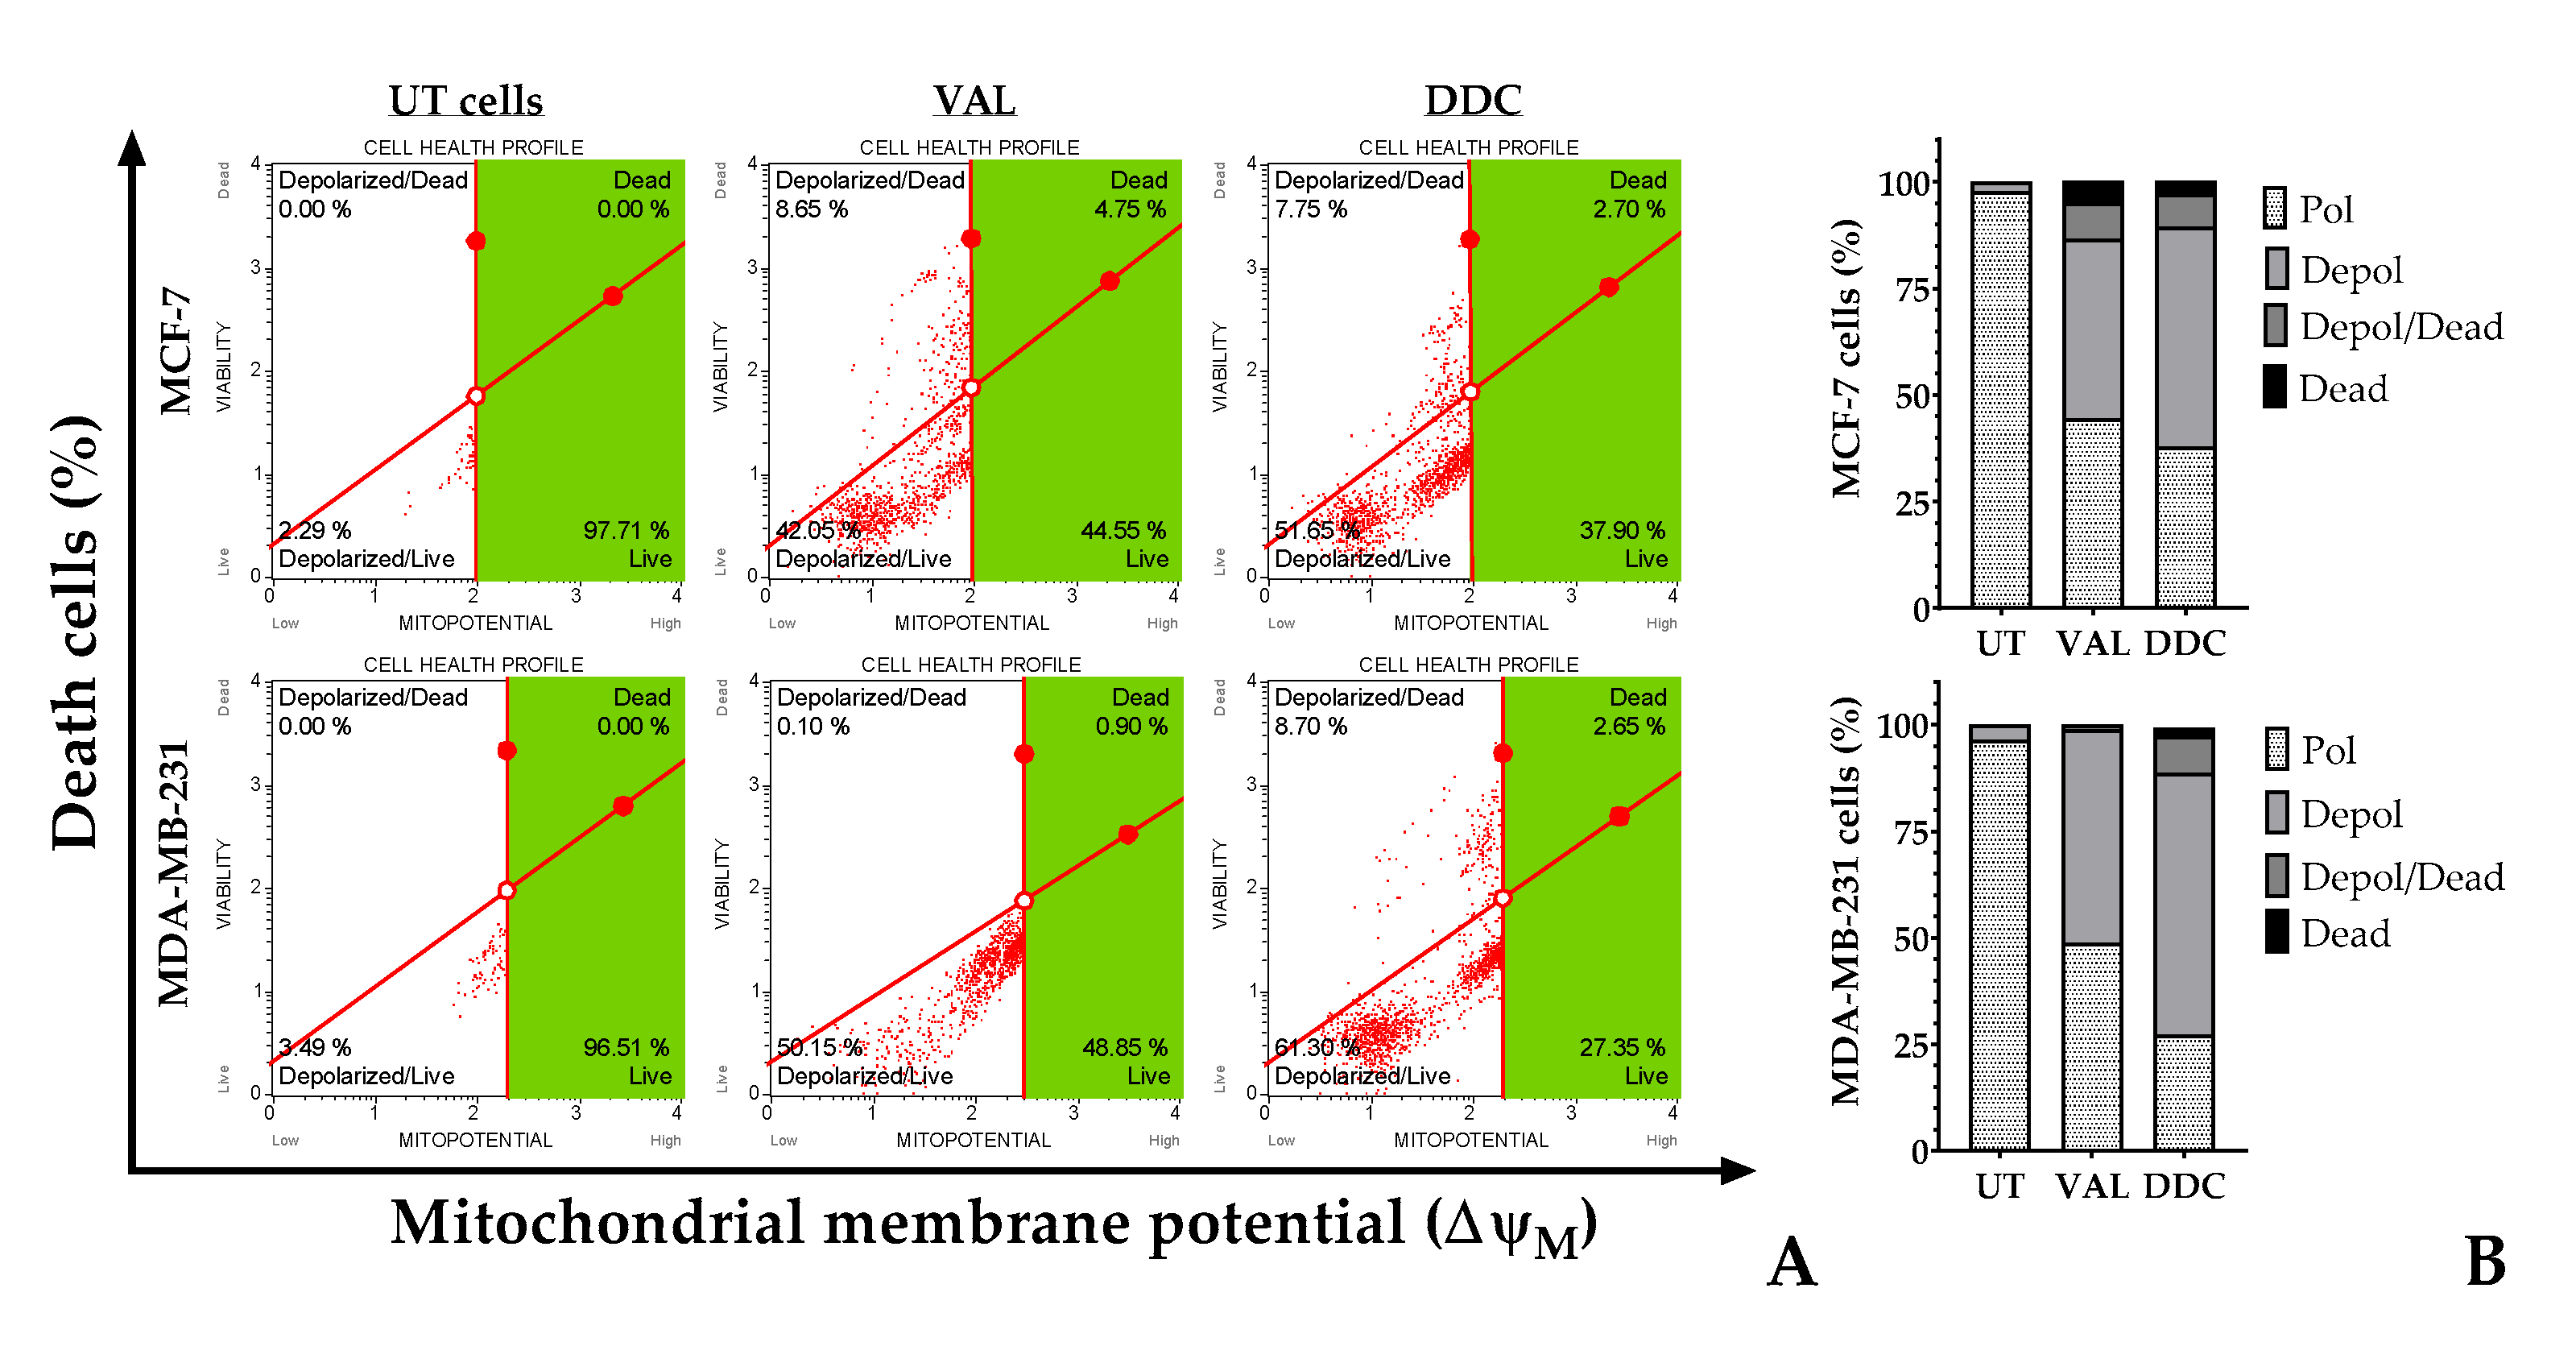
Figure 6.
Flow cytometric analysis of mitochondrial membrane potential (∆ψm) in BC cells exposed to 2’,4-dihydroxy-4´,6´-dimethoxy-chalcone (DDC) at 24 h. (A) Red dot represents each analyzed BC cell. The green area represents the region of cells with high ∆ψm or live cells. Valinomycin at 100 nM served as a positive control (VAL), while untreated cells (UT) were used as the negative control. (B) Distribution of percentage of BC cells with polarized or depolarized the mitochondrial membrane.
Western blot analysis was conducted to assess the protein levels involved in the intrinsic apoptosis pathway. Densitometric data were normalized based on GAPDH expression as a loading control. In both breast cancer (BC) cell lines treated with diethyldithiocarbamate (DDC), there was an increase in the expression of pro-apoptotic proteins p53, Bax, and Bim. However, the elevation in p53 levels was not statistically significant. Regarding the anti-apoptotic Bcl-2 family proteins, notable differences were observed. In MCF-7 cells, a significant reduction in Bcl-2 and Mcl-1 protein levels was noted, while Bcl-XL levels increased at 48 hours post-treatment. In contrast, in MDA-MB-231 cells, Bcl-2 levels initially decreased up to 24 hours but returned to baseline levels at 48 hours post-treatment, as shown in Figure 7. In the same cell line, both Bcl-XL and Mcl-1 exhibited a time-dependent decrease in protein levels.
Flow cytometry was employed to detect phosphorylation of the Bcl-2 protein at serine 70 (S70pBcl-2), which represents its active form, as well as its non-phosphorylated, inactive state. In untreated breast cancer (BC) cells, the S70pBcl-2 form was predominantly observed. However, treatment with chalcone resulted in significant dephosphorylation of this protein, leading to its inactivation. Specifically, in MCF-7 cells, dephosphorylation reached up to 97%, and in MDA-MB-231 cells, up to 78% after 48 hours of treatment, as demonstrated in Figure 7D,E. This effect mirrored the response observed with the positive control, paclitaxel (PTX).
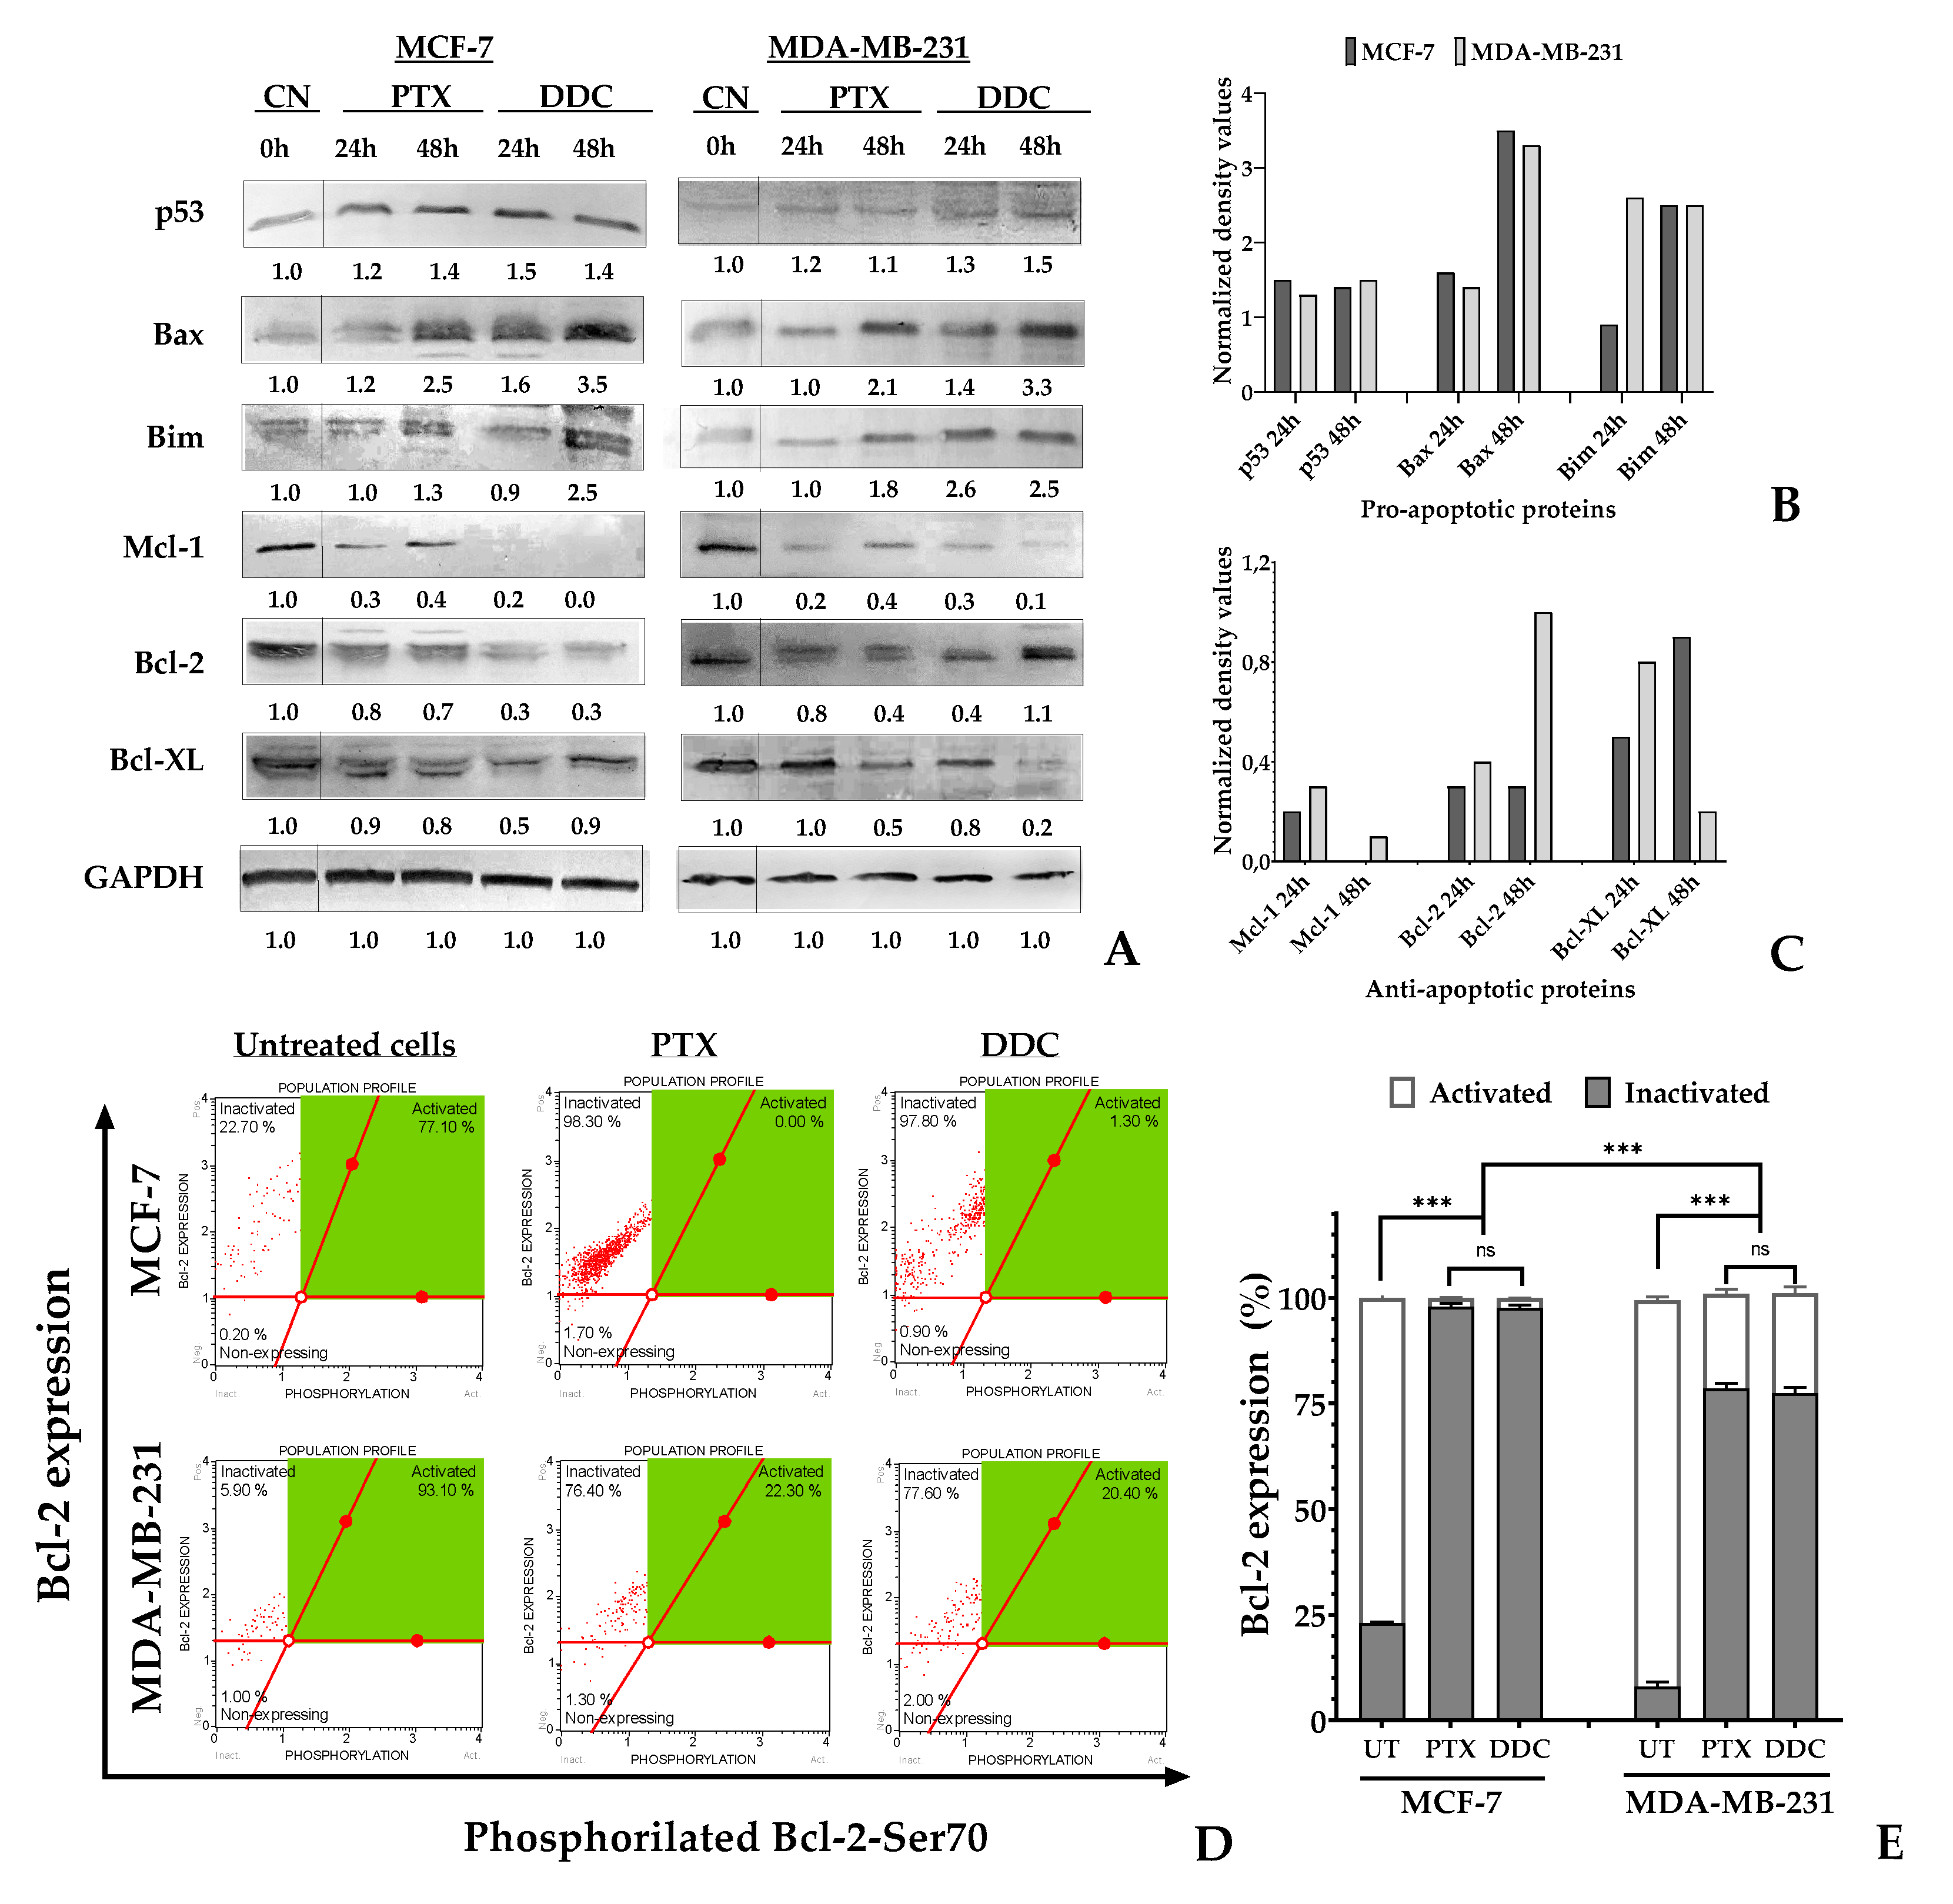
Figure 7.
Intrinsic apoptosis induction on BC cells in response to 2’,4-dihydroxy-4´,6´-dimethoxy-chalcone (DDC). (A) Western blot analysis of pro-apoptotic p53, Bax, Bim, and anti-apoptotic Mcl-1, Bcl-2, and Bcl-XL protein levels in BC cells treated with DDC and the positive control PTX for 24 and 48 hours. (B-C) The bar graphs of normalized density values of pro- and anti-apoptotic protein levels in DDC-treated BC cells. (D) Flow cytometry analysis showing density plots of the status of Bcl-2 protein in BC cells treated with DDC and PTX for 48 h. The X-axis represents the Bcl-2-Ser70 protein form while the Y-axis represents the total expression of the Bcl2 protein. The dot (in red) represents a single cell analyzed, and the green region corresponds to the area of active Bcl-2 cells (E). The bar graph indicates the percentage of untreated (UT) and treated cells with active and inactive Bcl-2 protein expression. p-values indicate statistical significance (*** p < 0.001) or ns: not significant.
2.7. In silico analysis
2.7.1. Docking and molecular dynamics (MD) simulation between DDC and pro-survival proteins.
n-silico analysis, incorporating both molecular docking and molecular dynamics (MD) simulations, was utilized to investigate the interactions between the diethyldithiocarbamate (DDC) ligand and five key proteins that play a role in negatively regulating apoptosis: Bcl-2, Bcl-XL, Mcl-1, mTOR, and XIAP, as referenced in studies [30,31]. The initial phase involved molecular docking studies, which aimed to delineate possible binding modes and calculate the binding affinity of DDC with each of the selected proteins. This was followed by MD simulations, which provided insights into the stability of the resulting ligand-protein complexes over time. To gain a more nuanced understanding of the binding dynamics, the Molecular Mechanics Poisson-Boltzmann Surface Area (MM-PBSA) method was subsequently applied, offering a refined computation of the binding free energy associated with these interactions.
In the molecular docking studies, AutoDock Vina was employed as the computational tool, as cited in references [32,33]. The results, illustrated in Figure 8, revealed that all the proteins under study exhibited similar binding energies when interacting with the diethyldithiocarbamate (DDC) ligand. It is noteworthy that among these proteins, XIAP displayed the lowest binding energy, indicating a potentially stronger interaction with the DDC ligand compared to the others.
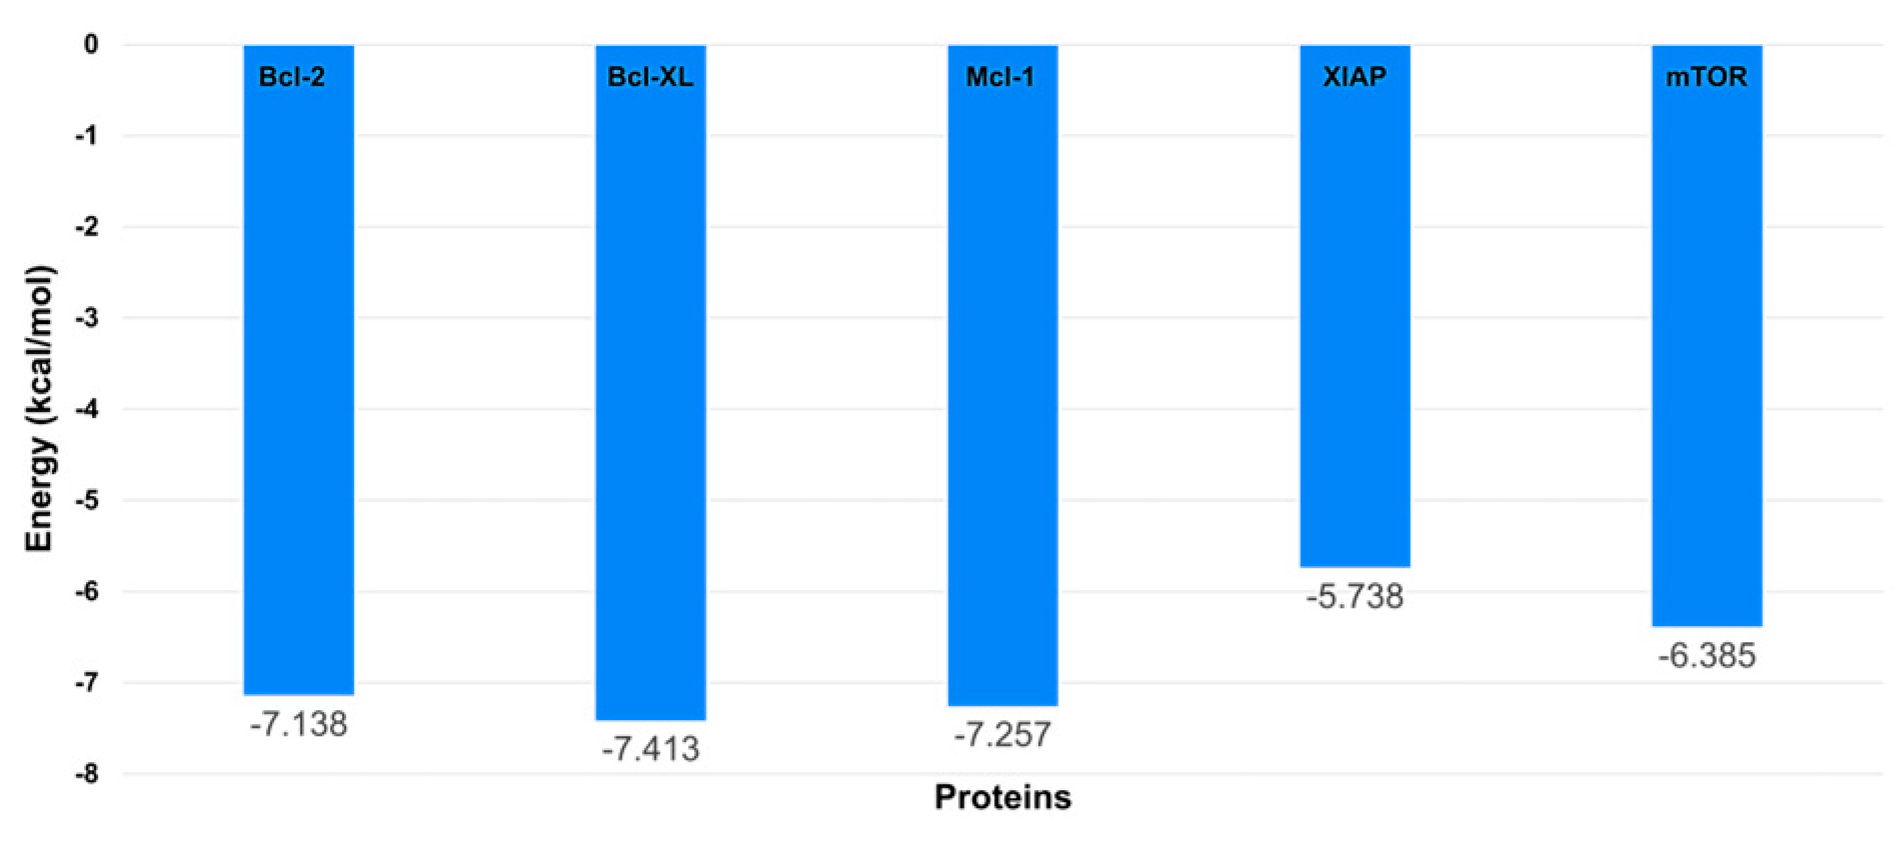
Figure 8.
Docking results showing the binding affinities of the DDC ligand with each protein.
An analysis of the root mean square deviation (RMSD) values, as depicted in Figure 9A–E, revealed that all proteins demonstrated stable interactions with the diethyldithiocarbamate (DDC) ligand throughout the molecular dynamics simulation. Notably, the mTOR protein exhibited particularly enhanced stability in its interaction with the DDC ligand, especially after the 40 nanosecond (ns) mark, compared to its stability when not bound to any ligand. This finding is further supported by the analysis of root mean square fluctuation (RMSF) values, shown in Figure 9F,J. The lower fluctuation levels observed in the systems containing the DDC ligand suggest that the presence of the ligand contributes to the overall stabilization of the system.
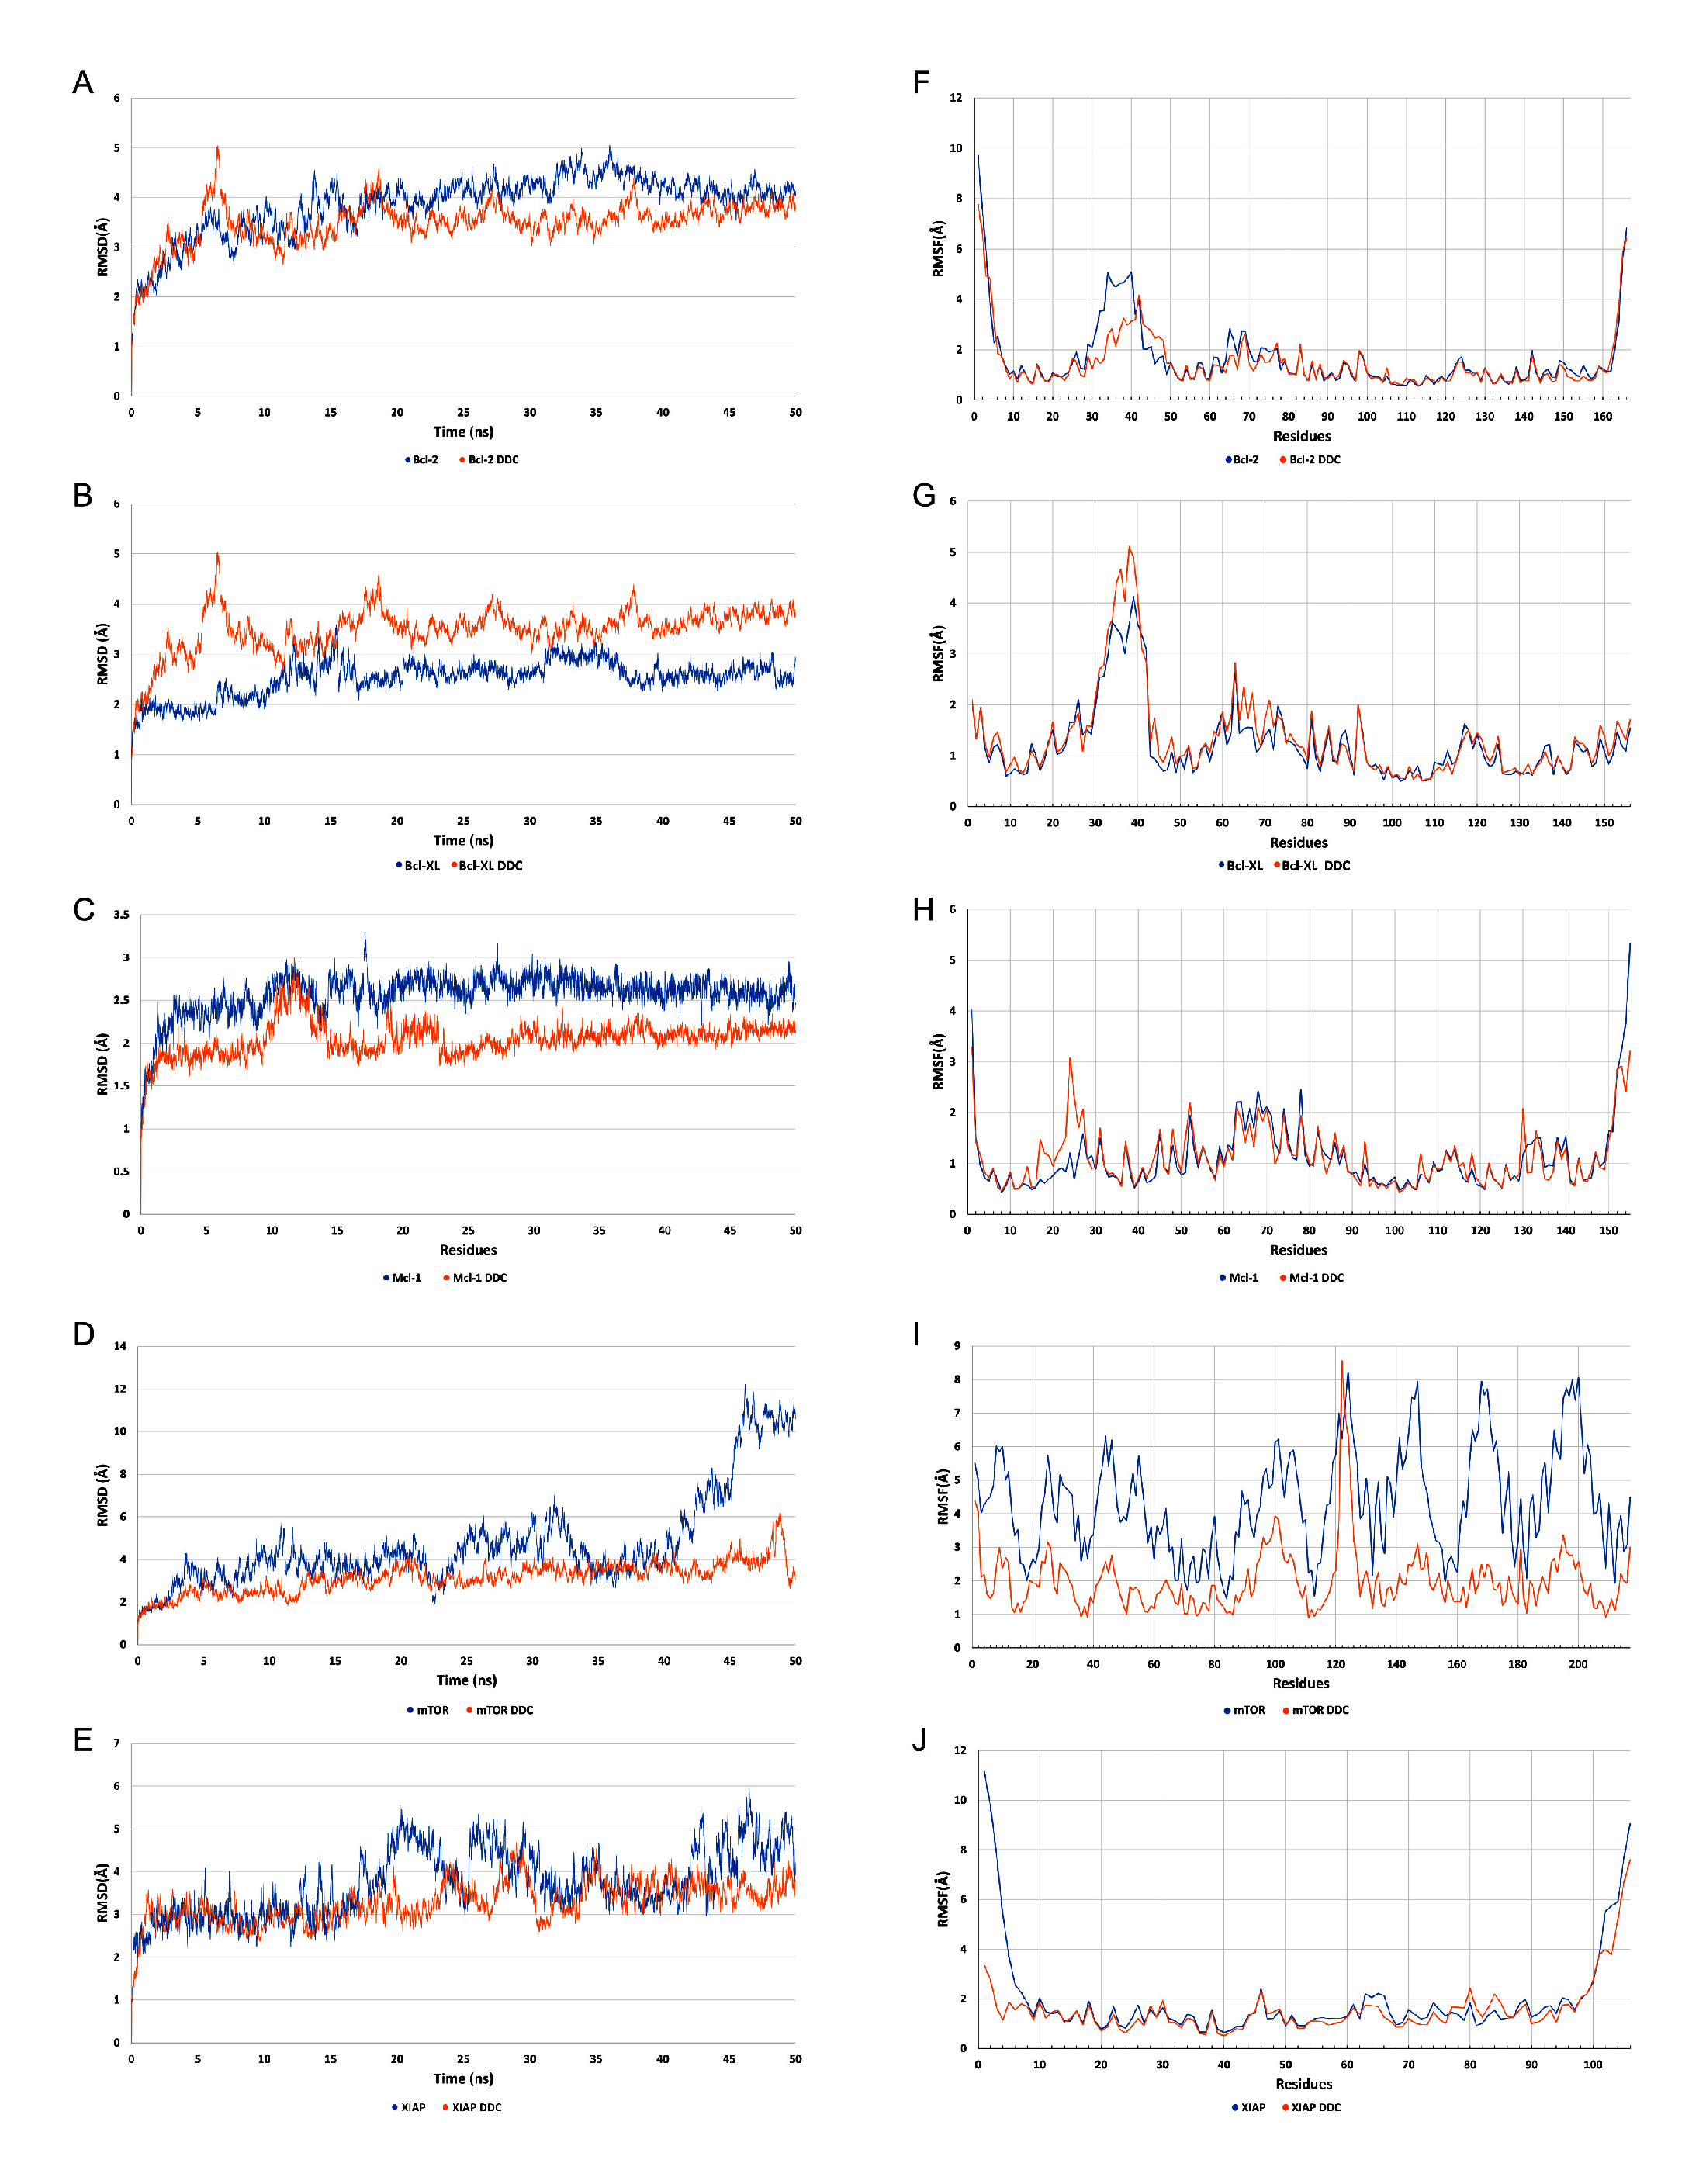
Figure 9.
Figures A to E display the root-mean-square deviation (RMSD) trajectories for several regulatory proteins interacting with diethyldithiocarbamate (DDC). Specifically, these include (A) Bcl-2, (B) Bcl-XL, (C) Mcl-1, (D) mTOR, and (E) XIAP. In these figures, the RMSD values for the standalone proteins are represented by blue traces, whereas the orange traces illustrate the RMSD of the protein-ligand complexes, indicating their interactions with DDC. Figures F to J provide the root-mean-square fluctuation (RMSF) profiles for the same set of proteins: (F) Bcl-2, (G) Bcl-XL, (H) Mcl-1, (I) mTOR, and (J) XIAP. Here, the unliganded state of each protein is depicted in blue shades, while the orange traces signify their bound states with DDC.
Figure 10 illustrates the mTOR protein as a dimer, with the diethyldithiocarbamate (DDC) ligand positioned at its interface. The root-mean-square deviation (RMSD) and root-mean-square fluctuation (RMSF) values collectively underscore the stabilizing effect of the DDC ligand on the mTOR dimer structure. Additionally, the proteins Bcl-2, Bcl-XL, Mcl-1, and XIAP, when complexed with the DDC ligand, show minimal variations in both RMSD and RMSF, indicating stable interactions. A notable observation is the high mobility of loop regions at either the N-terminus or C-terminus of these proteins, highlighting their inherent flexibility.
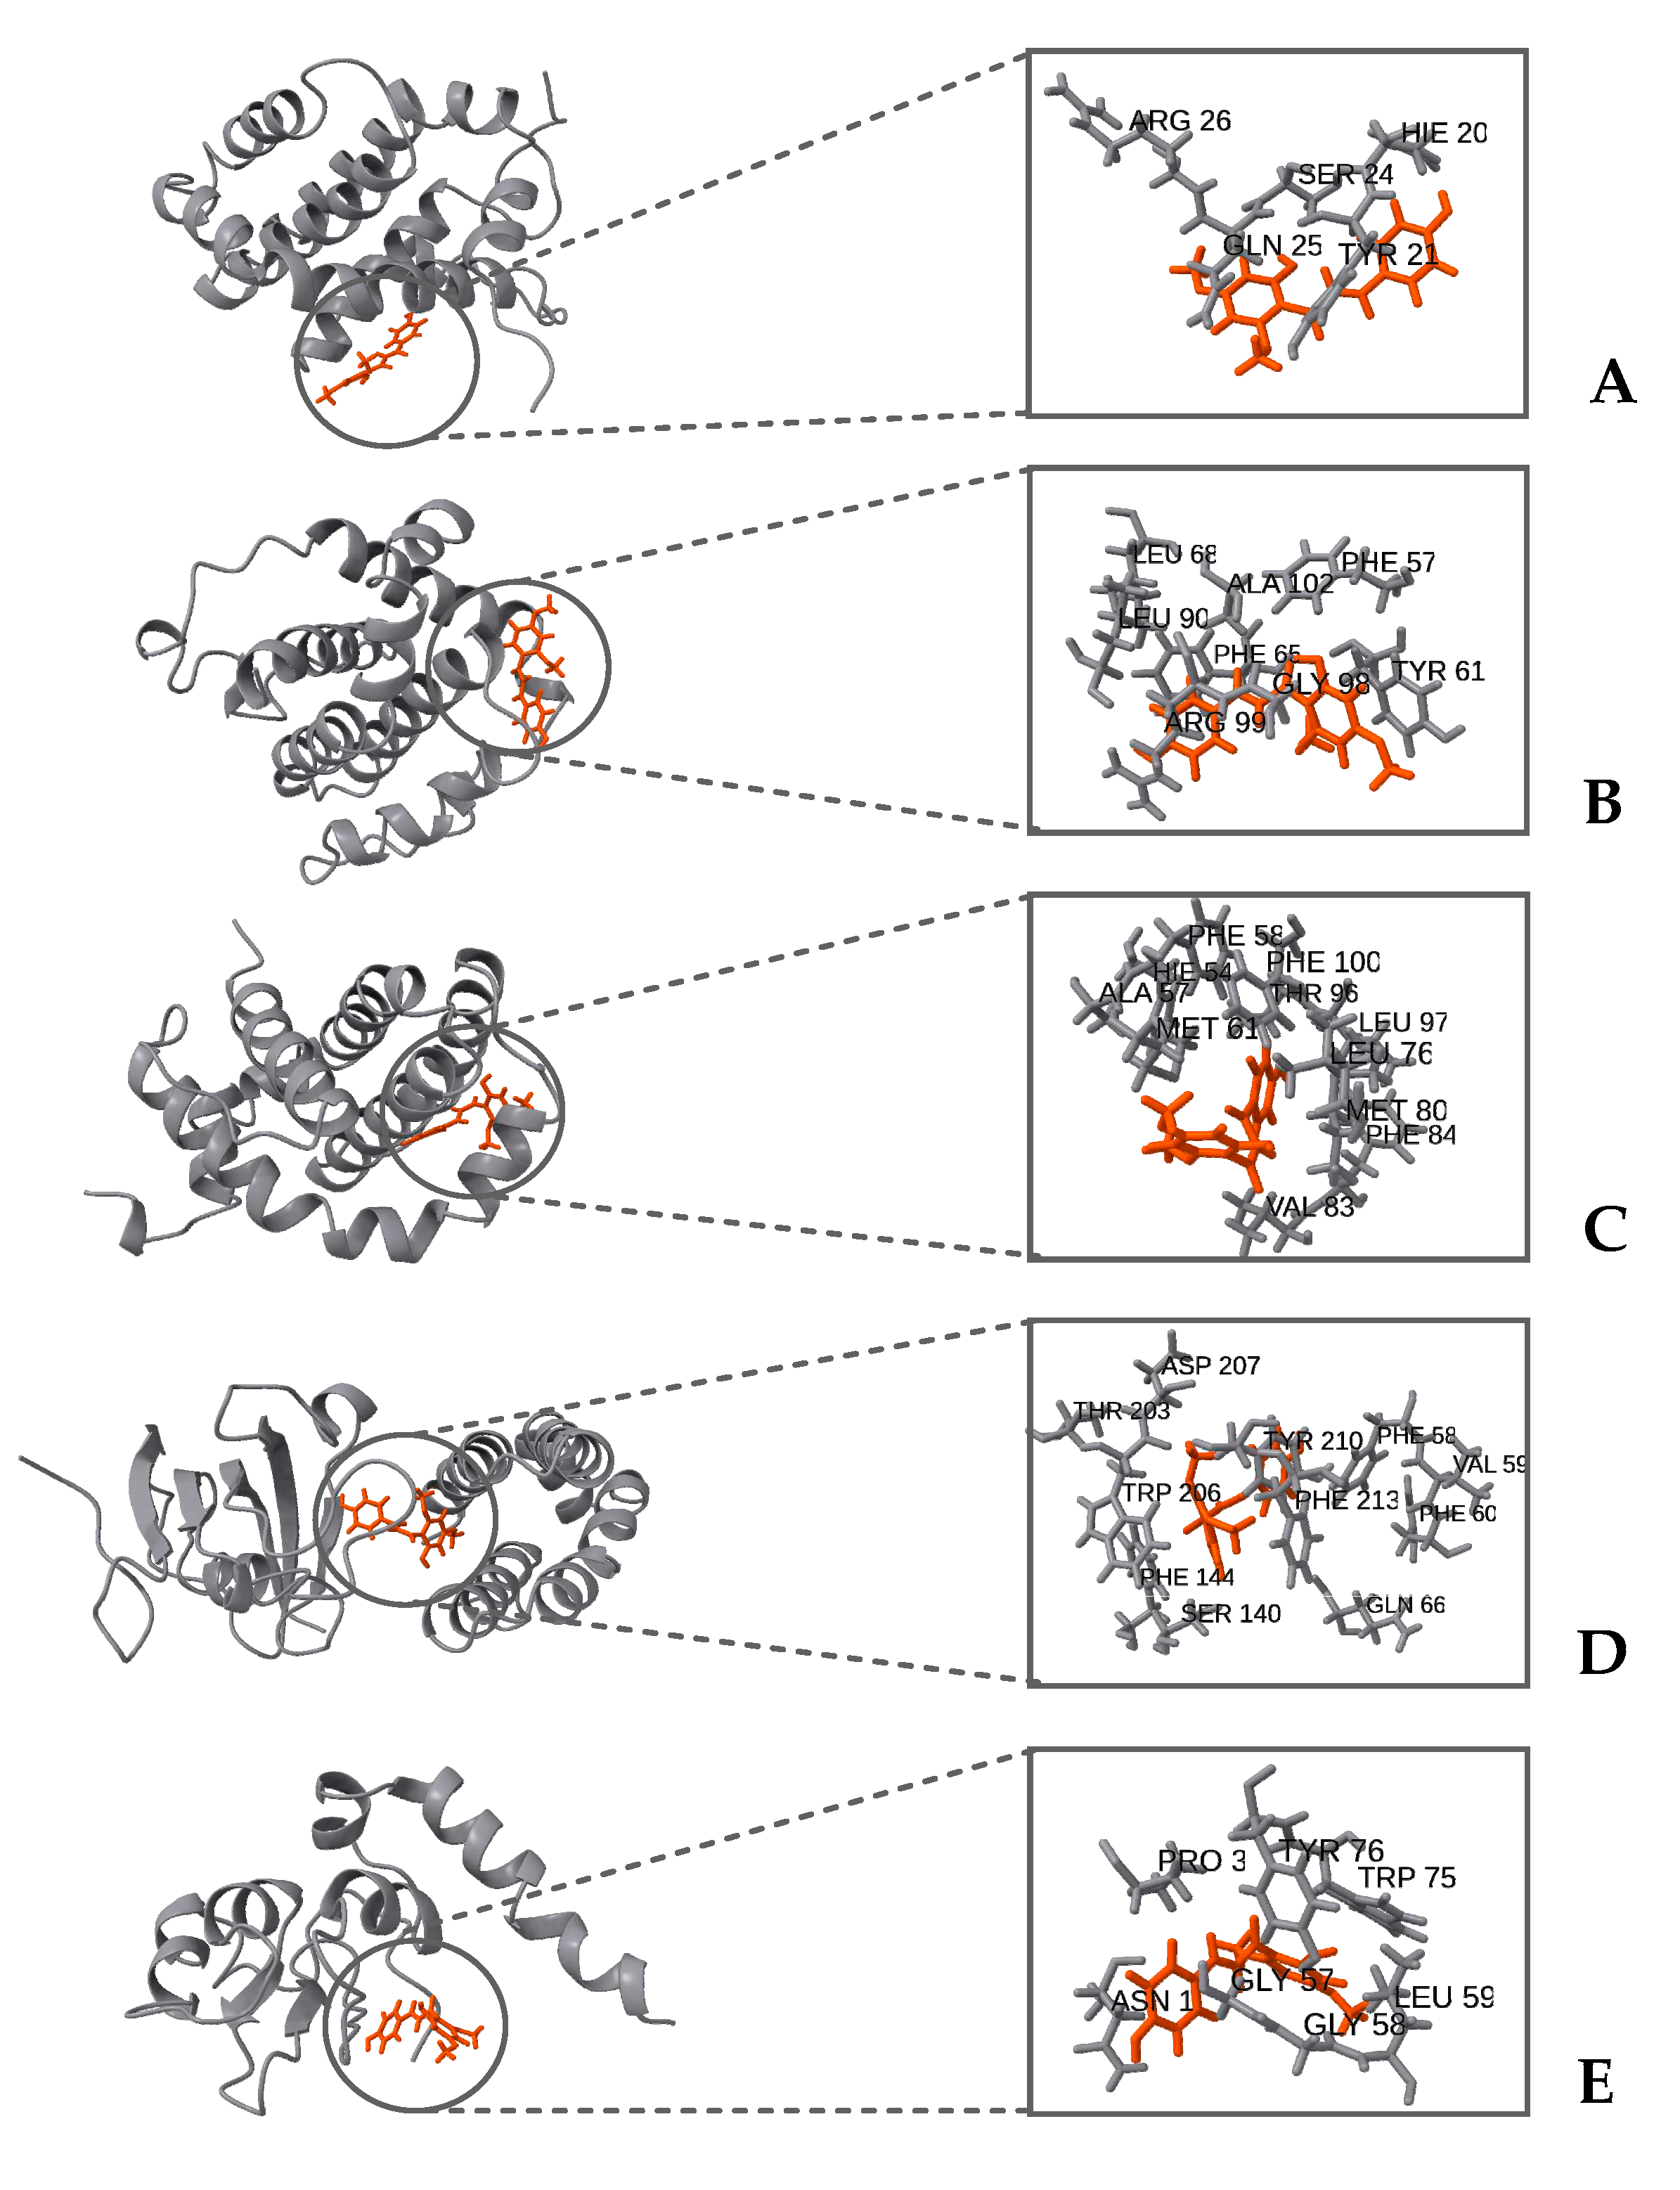
Figure 10.
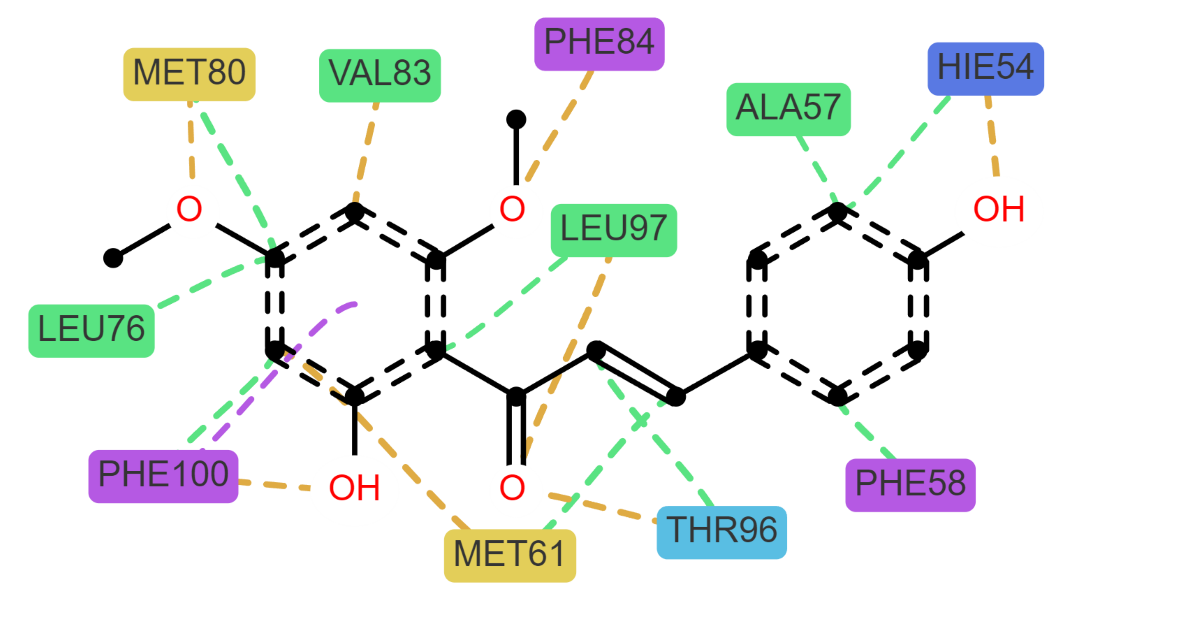
Comprehensive view of pro-survival proteins complexed with the ligand DDC, highlighting the major interacting residues. Proteins are depicted in gray, with the DDC ligand represented in orange. (A) Bcl-2, (B) Bcl-XL, (C) Mcl-1, (D) mTOR, and (E) XIAP.
Figure 10.
Comprehensive view of pro-survival proteins complexed with the ligand DDC, highlighting the major interacting residues. Proteins are depicted in gray, with the DDC ligand represented in orange. (A) Bcl-2, (B) Bcl-XL, (C) Mcl-1, (D) mTOR, and (E) XIAP.
2.7.2. Interaction between DDC and pro-survival proteins analysis
To decipher the interactions occurring throughout the molecular dynamics (MD) simulations, the Prolif Python library was utilized for detailed analysis, as referenced in [34]. The analysis encompassed the entire trajectory of each simulation. Residues that were engaged in interactions for more than 30% of the simulation's duration were specifically considered. Additionally, particular types of interactions, such as hydrophobic interactions and van der Waals (VdW) contacts, were accounted for if they occurred for over 10% of the trajectory. Figure 11 showcases both a bar plot and a two-dimensional plot that together illustrate the range and frequency of these various interactions.
Predominantly, two types of interactions were discerned between the diethyldithiocarbamate (DDC) ligand and the target proteins: hydrophobic interactions and van der Waals (vdW) contacts. Hydrophobic interactions are notably critical for the stabilization of protein-ligand complexes, as they play a significant role in the systems observed, as supported by references [35,36]. Additionally, π-stacking interactions, though less prevalent, were also observed among the proteins.
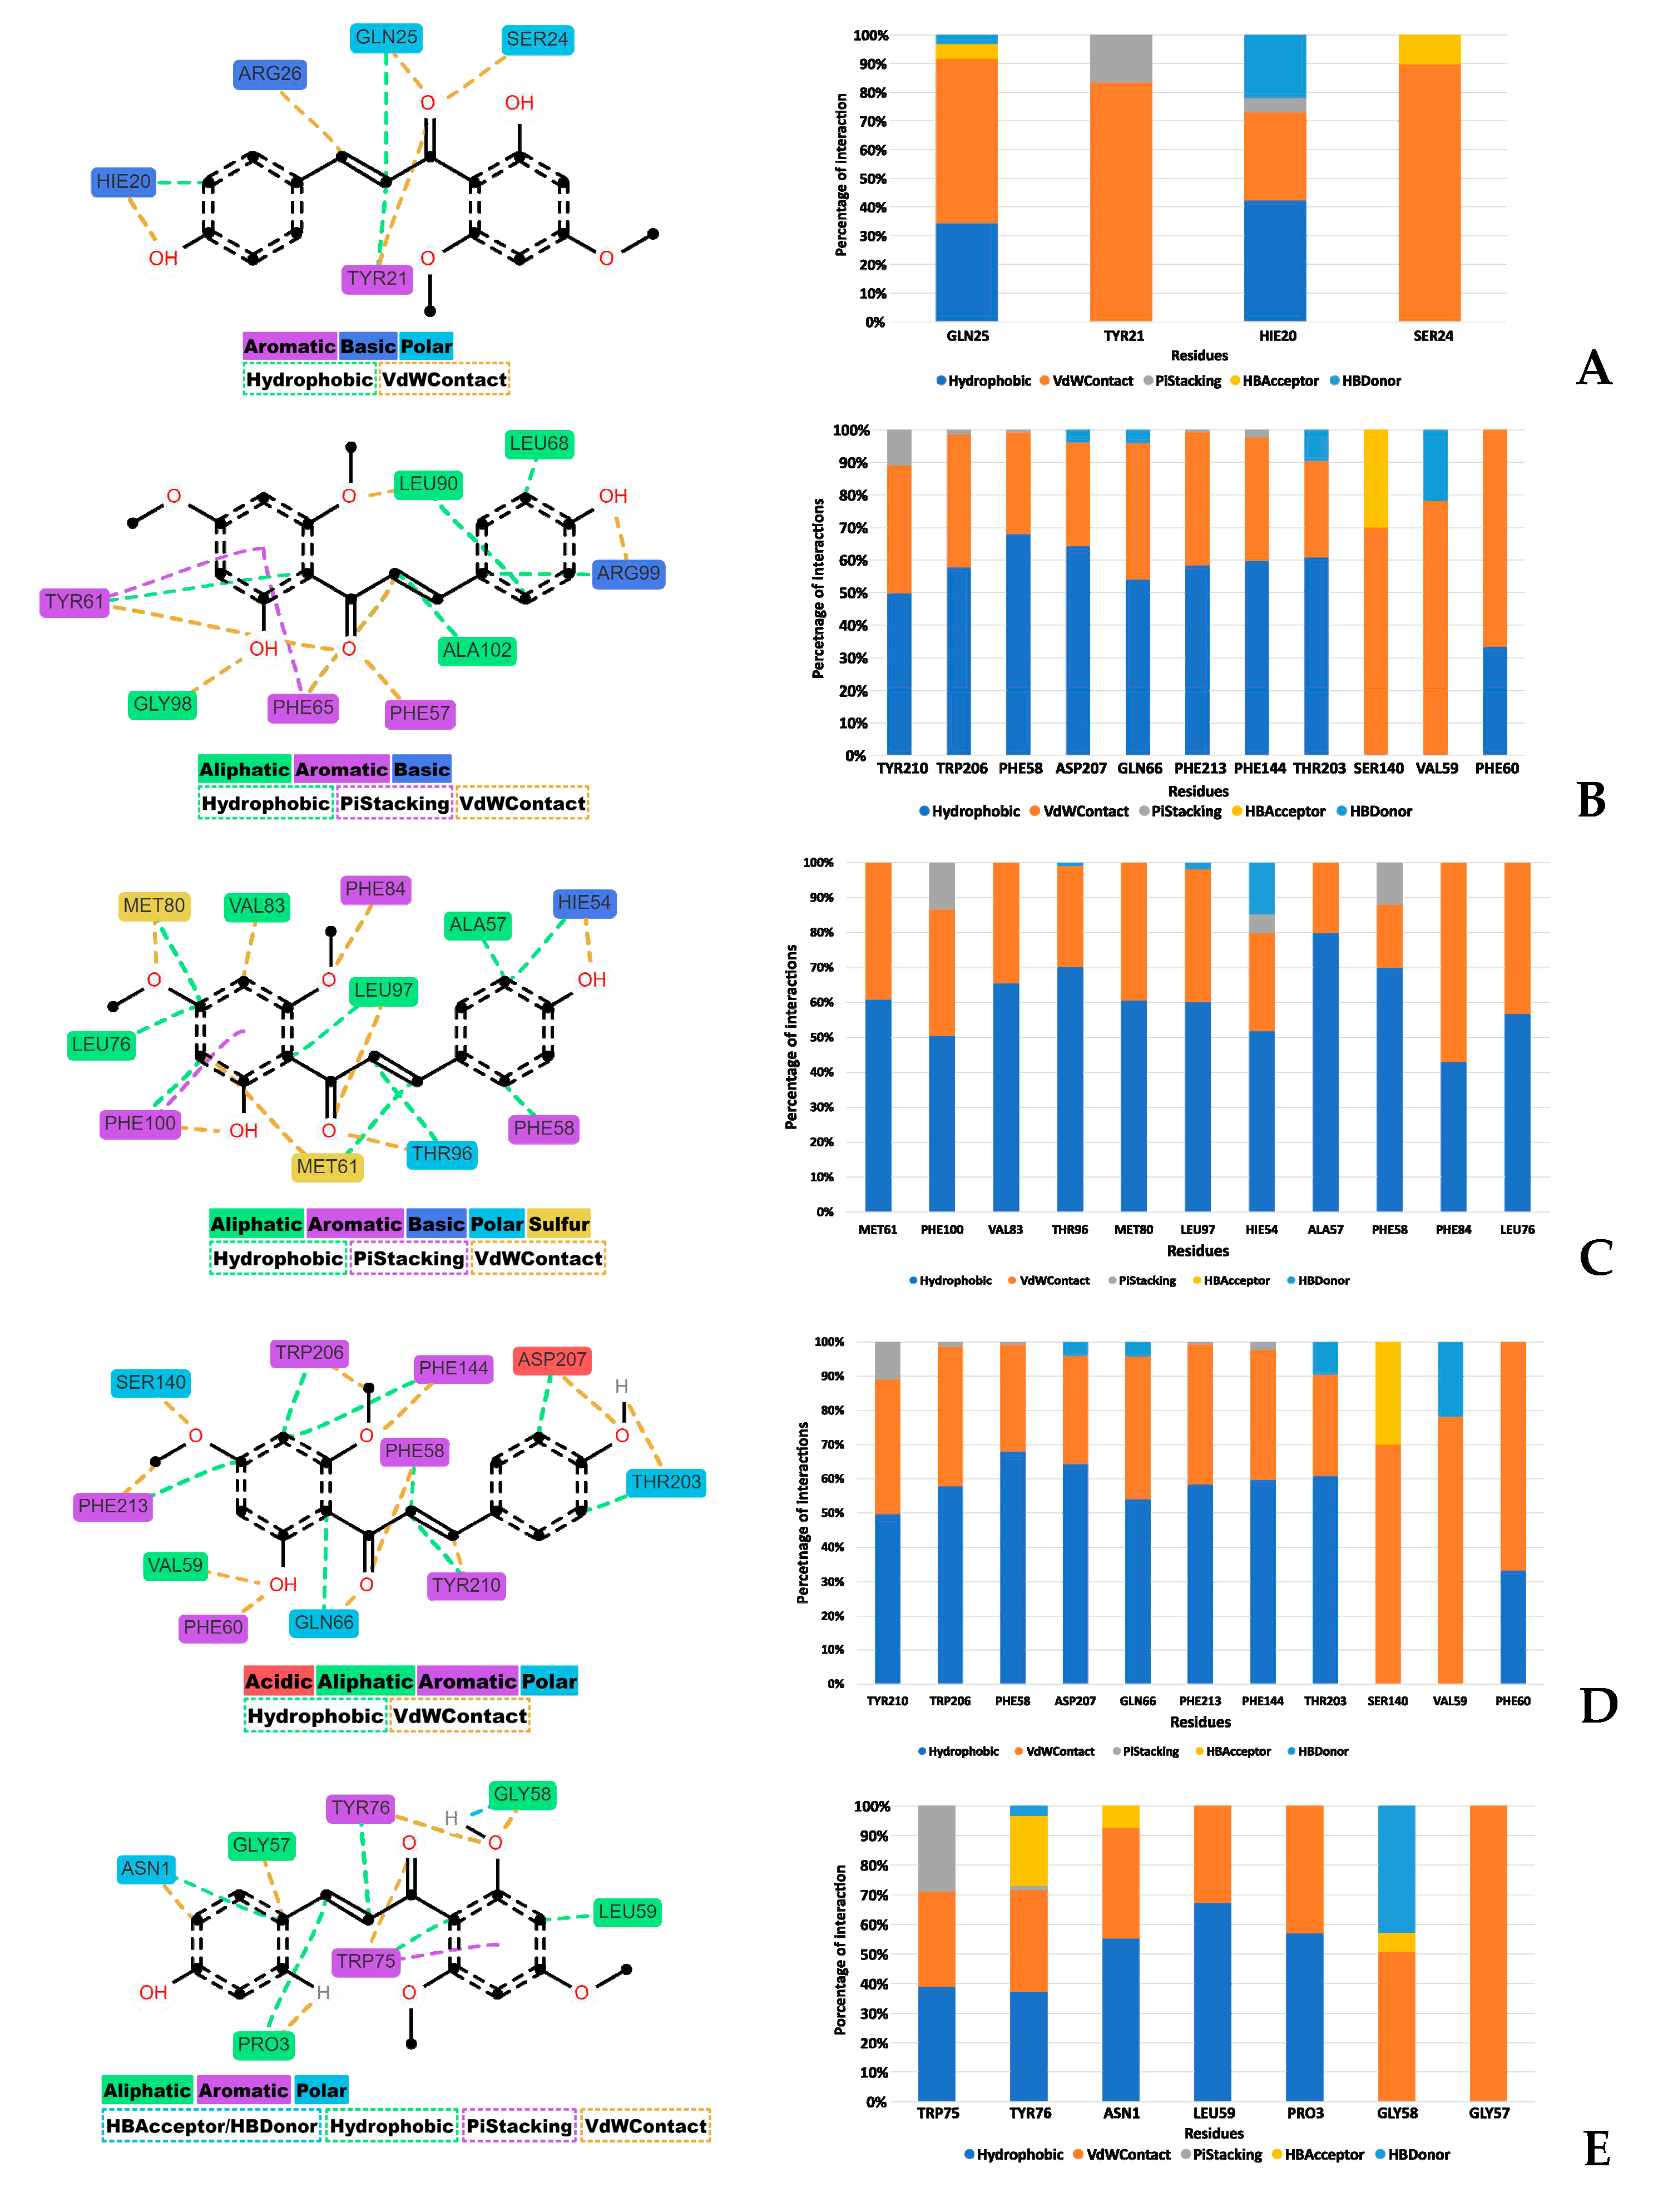
Figure 11.
Depiction of interactions between proteins and the DDC ligand, emphasizing residues that are engaged in interactions for more than 30% of the simulation duration. The subfigures represent different proteins: (A) Bcl-2, (B) Bcl-XL, (C) Mcl-1, (D) mTOR, and (E) XIAP.
Figure 11.
Depiction of interactions between proteins and the DDC ligand, emphasizing residues that are engaged in interactions for more than 30% of the simulation duration. The subfigures represent different proteins: (A) Bcl-2, (B) Bcl-XL, (C) Mcl-1, (D) mTOR, and (E) XIAP.
For each protein, distinct interactions with the diethyldithiocarbamate (DDC) ligand were identified. Bcl-2 exhibited hydrogen bond acceptor (HBAcceptor) interactions at residues GLN25 and SER24. Bcl-XL demonstrated π-cation interactions at ARG99, along with hydrogen bond acceptor interactions at the same residue, and hydrogen bond donor (HBDonor) interactions at GLY89 and GLY98. MCL-1 showed hydrogen bond acceptor interactions at THR96, MET80, and HIE54. mTOR revealed hydrogen bond acceptor interactions at SER140, and hydrogen bond donor interactions at multiple residues including TRP206, PHE58, ASP207, GLN66, PHE213, THR203, and VAL59. Lastly, XIAP displayed hydrogen bond acceptor interactions at TYR76, ASN1, and GLY58, and hydrogen bond donor interactions at TYR76 and GLY58.
2.7.3. Binding free energy analysis via MM-PBSA
To evaluate the stability of the protein-ligand interactions, the binding free energy of each complex was calculated utilizing the Molecular Mechanics Poisson-Boltzmann Surface Area (MM-PBSA) method. This analysis encompassed the entire duration of the simulation trajectories, as illustrated in Figure 12. The results indicated that the proteins mTOR, Mcl-1, and Bcl-XL showed comparable binding free energy values. In contrast, the Bcl-2 protein exhibited the highest binding free energy among the studied proteins.
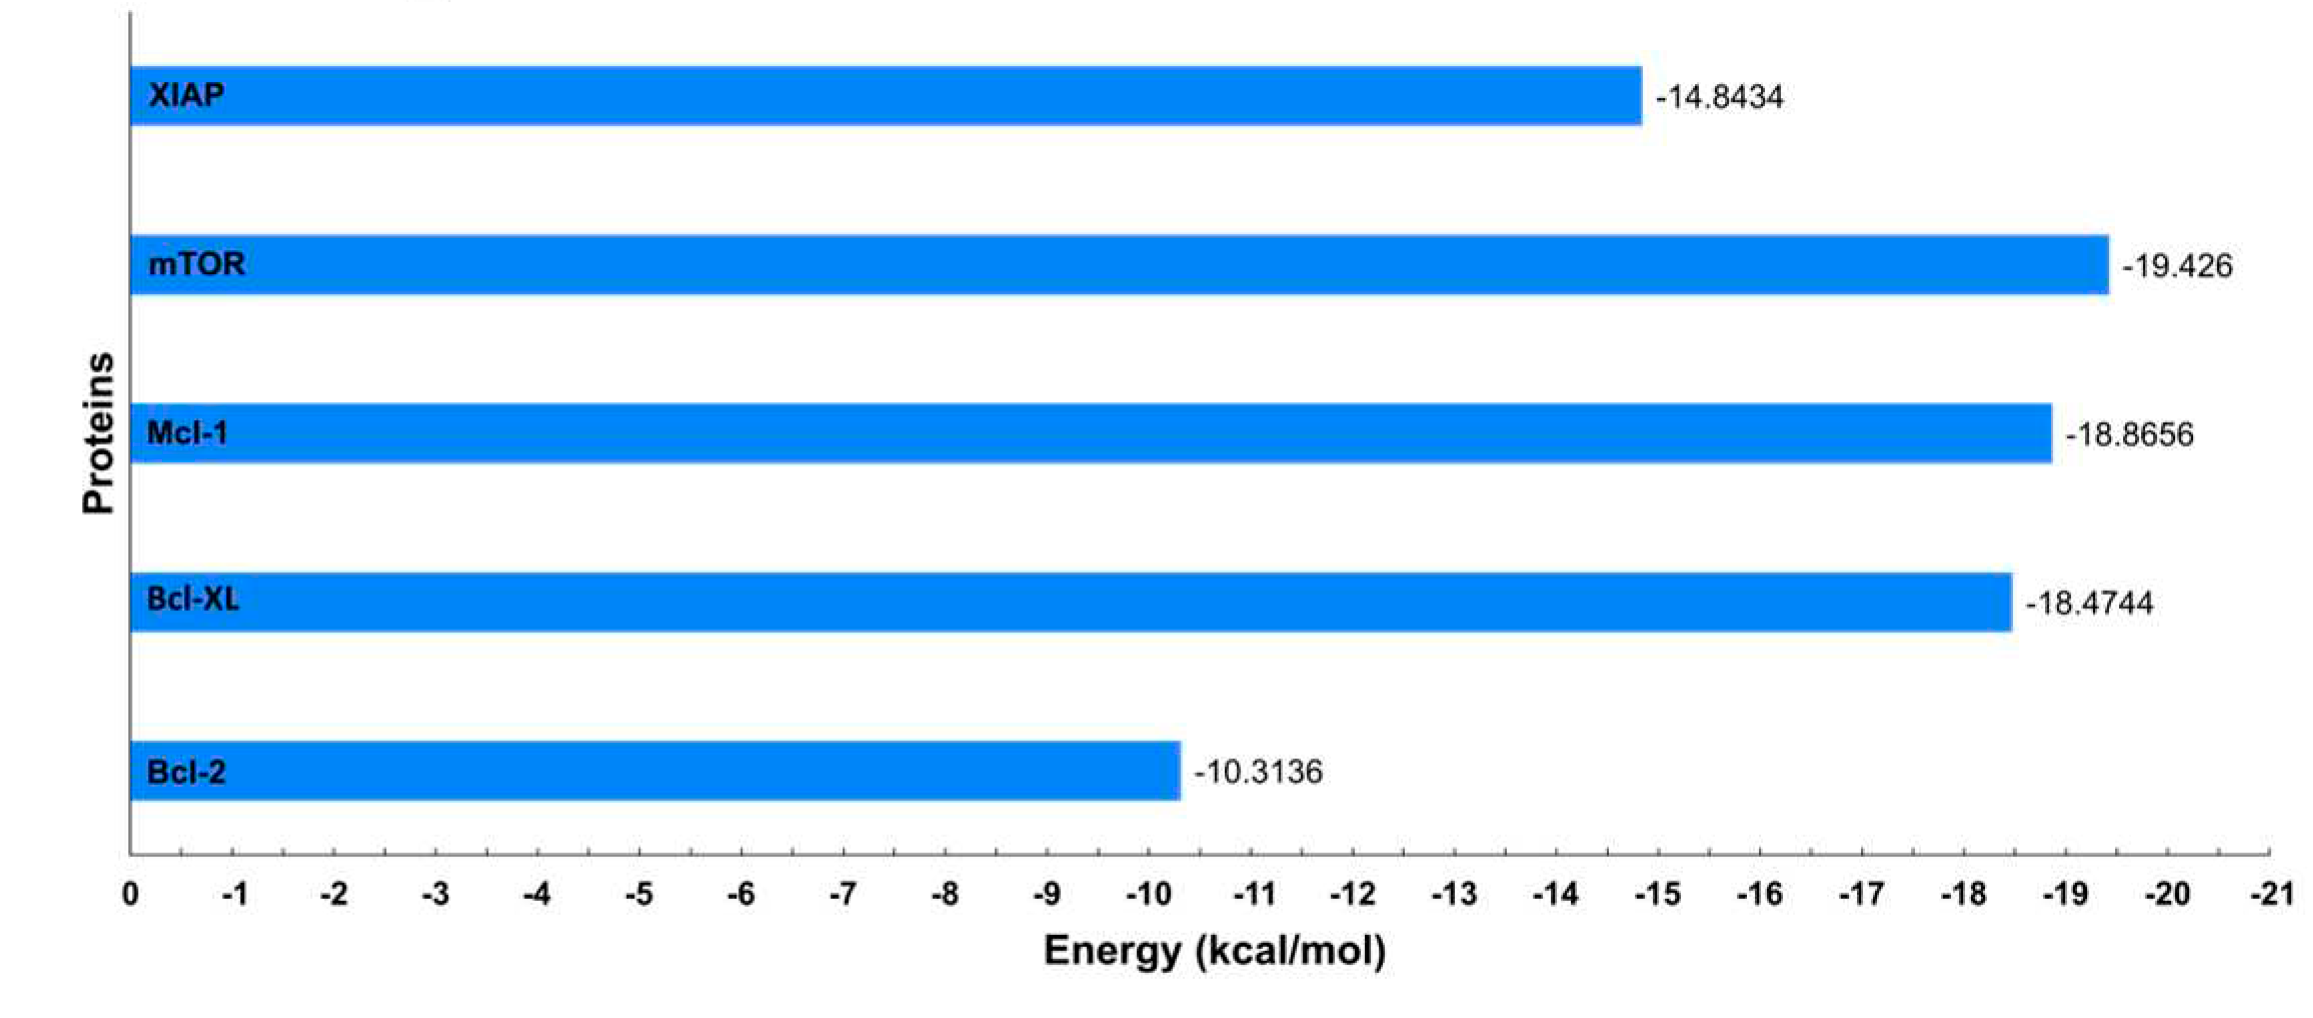
Figure 12.
Binding free energy values calculated through MM-PBSA for each protein in complex with the ligand DDC.
Figure 12.
Binding free energy values calculated through MM-PBSA for each protein in complex with the ligand DDC.
3. Discussion
Approximately 79 flavonoids, comprising 9 chalcones, have been isolated and identified from the genus Chromolaena, as noted in reference [23]. This research culminated in the isolation and identification of a specific chalcone derived from the inflorescences of Chromolaena tacotana. The experimental molecular weight of this chalcone was calculated to be 300.09588 unified atomic mass units (u.m.a), corresponding to the molecular formula C17H16O5.
The 1H NMR spectrum of the chalcone exhibits characteristic signals. Methoxyl groups are evident in high fields, with chemical shifts at δ = 3.88 and 4.02 ppm. Additionally, signals around δ = 7.78 and 7.91 ppm, each integrating for one hydrogen, correspond to vinyl hydrogens coupled to α and β carbons, a feature typical of chalcones. At δ = 6.10 and 6.13 ppm, a coupling constant (J_HH) of 2.4 Hz is observed, indicative of meta-coupling in ring A, suggesting a meta-tetra-substituted pattern. In ring B, signals at δ = 6.94 and 7.64 ppm (doublet of doublets, J = 2.4 Hz) correlate to four protons in meta positions, implying a double substitution in a symmetrical arrangement, as summarized in Table 1.
The 13C NMR APT spectrum reveals 15 signals for 17 carbons. A signal at δ = 192.42 ppm identifies the carbonyl carbon, a hallmark of the flavonoid structure. The signals at δ = 55.62 ppm and 55.17 ppm in the negative phase are attributed to methoxyl groups. This molecule presents five characteristic carbon signals in the negative phase linked to a proton (CH), while the remaining are quaternary carbons. The signals at δ = 168.26, 166.38, 162.79, and 159.83 ppm are noteworthy, each being linked to an oxygen atom.
The COSY H-H spectrum elucidates the vicinal coupling between the C-α and C-β protons, confirming the presence of vinylic protons in the structure. It also reveals the ortho-positioning of two methines (CH) in ring B. Signals at δ = 13.050 ppm and δ = 115.93 ppm are pronounced in the negative phase, indicative of two pairs of methine-type carbons in a symmetrical chemical environment, located in ring B. This symmetry and the observed chemical shifts suggest a para-substitution pattern in the ring, as detailed in Table 1.
Based on the connectivity established between various hydrogens and their corresponding carbons, as determined from HMQC and HMBC experiments, the compound under study is identified as 2',4-dihydroxy-4´,6´-dimethoxychalcone, as illustrated in Figure 1. The NMR data for this chalcone closely align with the spectral assignments of a novel chalcone synthesized earlier, where fifteen peaks were observed in the 13C NMR spectrum. Specifically, the peak at 193.2 ppm is assigned to a carbonyl group. Peaks with double intensities at 55.6, 106.5, and 161.2 ppm correspond to 3´-OMe/5´-OMe, C-2´/C-6´, and C-3´/C-5´, respectively. Additionally, the peak at 55.9 ppm is attributed to the 2-OMe´ group, as documented in reference [37].
The mass of the chalcone, as calculated experimentally, aligns with the structure elucidated through NMR analysis, exhibiting variations of less than 5 ppm. Due to their acidic nature, chalcones are prone to easy deprotonation. In the mass spectral analysis, this particular molecule demonstrated a loss of 30 m/z, which is consistent with the sequential elimination of two CH3 groups (each with m/z 15). Moreover, a prominent peak at m/z 119 was observed, likely resulting from cleavage between the carbonyl group and the alpha carbon, including ring B. Another notable cleavage pathway, indicated by an m/z of 180, involves initial deprotonation of ring B leading to an intermediate of m/z 164, followed by a subsequent loss of CO, yielding a fragment of m/z 136.
This behavior parallels findings reported by Zhang [38], who characterized the structures of similar compounds. Zhang noted common neutral losses in methoxy-containing chalcones, including H2, H2O, CO, CO2, and methyl radicals. He further elucidated that specific neutral losses followed stepwise pathways, such as the loss of m/z 44, which can be attributed to the combination of CH3 and HCO, or CH4 and CO, along with the elimination of CO2
Numerous studies have been conducted on the cytotoxic activity of both natural and synthetic chalcones. A significant limitation in many of these studies is the absence of data on the selectivity index (SI), which is crucial for evaluating the therapeutic potential of these compounds. SI is defined as the ratio of the toxic concentration to the effective bioactive concentration in normal cells [39]. The current study demonstrates that the natural chalcone diethyldithiocarbamate (DDC), derived from Chromolaena tacotana, exhibits pronounced cytotoxicity against breast cancer (BC) cells. This aligns with previous findings on the cytotoxic properties of synthetic flavokawains (FKCs), where MCF-7 cells displayed greater sensitivity compared to MDA-MB-231 cells, as indicated in Figure 2. Notably, the IC50 values for these cell lines were found to be 52.5 µM and 66.4 µM, respectively, as shown in Figure 2D. These variations may be attributable to differences in the cell seeding density and the methodology used for absorbance measurement at 570 nm, a recommended wavelength for assessing formazan formation [40].
In addition, the cytotoxicity of DDC was evaluated on non-tumorous MCF-12 mammary gland cells to determine the Selectivity Index (SI). Our findings revealed an SI value exceeding 3.5 (Figure 2E), suggesting a low adverse impact on surrounding healthy cells. According to Weerapreeyakul et al. [41], an SI value above 3.0 is indicative of a compound's potential as an effective anticancer agent. These results underscore the importance of the SI in assessing the therapeutic viability of such compounds, thereby warranting further investigation.
During treatment with diethyldithiocarbamate (DDC), a notable alteration in the normal cell cycle progression was observed in both breast cancer (BC) cell lines, leading to cell cycle arrest in the G0/G1 phase, as depicted in Figure 4. This observation contrasts with a previous study [42], which reported that flavokawains (FKC) induce cell cycle arrest in the G2/M phase. The experiments conducted in our study utilized synchronized cells, ensuring consistency in cell cycle stages across samples. The results obtained with DDC were in alignment with the effects of Doxorubicin, a widely used chemotherapeutic agent for breast cancer treatment. Doxorubicin is known to cause cell cycle arrest in the G0/G1 phase in these BC cells, as corroborated by findings in literature [43,44].
Previous research indicates that natural chalcones, including butein, xanthohumol, isoliquiritigenin, chalcotanina, and flavokawains, may exhibit cytotoxic effects, particularly inducing apoptosis in breast cancer (BC) cells [28,43,45]. However, prior to this study, there was no evidence demonstrating the simultaneous induction of both apoptosis and autophagy in BC cells by flavokawains (FKC). Our research unveils that treatment with diethyldithiocarbamate (DDC) triggers not only apoptosis but also a significant autophagic response, as indicated by the detection of the LC3-II protein. Notably, the proportion of cells undergoing autophagy was higher in MCF-7 cells in comparison to MDA-MB-231 cells. In contrast, triple-negative breast cancer (TNBC) cells, represented by MDA-MB-231, exhibited a more pronounced induction of apoptosis. This is substantiated by the increased levels of pro-apoptotic proteins and the downregulation of XIAP and other anti-apoptotic proteins, as confirmed by Western blot analysis.
Various anticancer drugs are known to induce autophagy through different mechanisms. Some directly target the central autophagy machinery, while others, such as mTOR inhibitors, regulate autophagy indirectly by affecting key cellular pathways [46]. In our study, we observed that diethyldithiocarbamate (DDC) not only inhibits mTOR but also elevates the LC3-II protein levels in both breast cancer (BC) cell lines, indicating the induction of autophagy. A notable distinction was the increased expression of the p62 protein in MCF-7 cells, but not in triple-negative breast cancer (TNBC) cells. Autophagy can be activated through various pathways, encompassing both selective and non-selective types. In selective autophagy, p62 serves as a shuttling protein, transporting ubiquitinated substrates to the autophagosome for degradation [46]. This mechanism might not be essential for inducing autophagy in TNBC cells, as suggested by our results, which are detailed in Figure 4.
The induction of apoptosis by chalcones, particularly through the activation of caspase-3, is a well-documented phenomenon [28,47-49]. In our study, the data suggest that diethyldithiocarbamate (DDC) preferentially activates caspase-3 over caspase-7, as illustrated in Figure 5. Once activated, cleaved caspase-3 translocates to the nucleus, where it plays a crucial role in the cleavage of DNA and other substrates, thereby participating in the proteolytic events characteristic of apoptosis [50,51]. On the other hand, caspase-7 is primarily involved in the detachment of apoptotic cells from the adjacent extracellular matrix (ECM) [52]. Additionally, our findings indicate a reduction in the expression of the XIAP protein following DDC treatment. This reduction could explain the activation of caspases 3 and 7, possibly through the disruption of their interaction with the BIR2 domain located in the N-terminal region of XIAP [53], thereby facilitating the apoptotic process, as depicted in Figure 5.
Anticancer agents are known to modify mitochondrial permeability, often resulting in depolarization, loss of mitochondrial membrane potential (∆ψm), and subsequent release of apoptotic factors [54]. Our data demonstrate that treatment with diethyldithiocarbamate (DDC) initiates the mitochondrial pathway of apoptosis in breast cancer (BC) cells. This is evidenced by the reduction in ∆ψm (Figure 6), accompanied by increased levels of mitochondrial pro-apoptotic proteins Bax and Bim. Conversely, the levels of anti-apoptotic proteins Mcl-1, Bcl-2, and Bcl-XL decrease following DDC treatment. However, there is a notable tendency for Bcl-XL in MCF-7 and Bcl-2 in MDA-MB-231 cells to restore their protein levels after 48 hours of treatment, which suggests that tumor cells might activate defense mechanisms to counteract the stress induced by DDC [55]. This response appears to be dependent on specific anti-apoptotic Bcl-2 family members, varying between different types of BC. Notably, the downregulation of Mcl-1 is consistent in both luminal A and triple-negative BC (TNBC).
Additionally, proteins Mcl-1, Bcl-2, and Bcl-XL are known to negatively regulate autophagy. Their inhibition, as observed in our study, leads to the release of Beclin-1, which forms a core complex essential for autophagosome nucleation [56]. These findings collectively support the simultaneous induction of autophagy and intrinsic apoptosis by DDC in BC cells.
Bcl-2 phosphorylation at serine 70 (S70pBcl-2) plays a critical role in forming anti-apoptotic heterodimers with Bax or Bak. These heterodimers contribute to the enhancement of the outer mitochondrial membrane's permeability, thereby inhibiting apoptosis [57]. Our study's findings reveal a significant decrease in Bcl-2 phosphorylation following diethyldithiocarbamate (DDC) treatment, with reductions of 97% in luminal A and 78% in triple-negative breast cancer (TNBC) cells. This substantial decrease in phosphorylation disrupts the anti-apoptotic Bak/Bcl-2 and Bax/Bcl-2 complexes, potentially facilitating the initiation of intrinsic apoptosis and possibly autophagy.
In-silico studies, encompassing molecular docking, molecular dynamics (MD) simulations, and Molecular Mechanics Poisson-Boltzmann Surface Area (MM-PBSA) calculations, provided substantial insights into the interaction dynamics between the diethyldithiocarbamate (DDC) ligand and a set of pro-survival proteins, including Bcl-2, Mcl-1, Bcl-XL, XIAP, and mTOR, as analyzed in vitro. The molecular docking studies initially offered preliminary insights into potential binding affinities and interaction modes, which were further refined through MD simulations (Figure 8, Figure 9, Figure 10, Figure 11 and Figure 12). Notably, each protein displayed stable interactions with DDC, as indicated by root-mean-square deviation (RMSD) and root-mean-square fluctuation (RMSF) analyses (Figure 9). However, the data suggest that DDC binding does not introduce significant perturbations or induce notable conformational changes within these proteins (Figure 10).
The interactions between the proteins and the DDC ligand primarily involved hydrophobic and van der Waals (vdW) contacts, essential for stabilizing the respective complexes. These interactions are likely a combination of hydrogen bonding, hydrophobic contacts, and ionic interactions, all contributing to the stabilization of DDC within the protein binding pockets. Moreover, the solvation effects, as calculated by the PBSA component of MM-PBSA, also play a crucial role in this stabilization process, highlighting the importance of solvent molecules in mediating these interactions [58].
While the Bcl-2 antiapoptotic proteins demonstrated favorable interactions with DDC, they did not achieve the binding energy levels observed with mTOR. This discrepancy could be due to either suboptimal interactions or potential repulsive forces, emphasizing the complex nature of protein-ligand interactions. Additionally, factors like ligand strain upon binding and entropic contributions might influence the binding energies.
It is important to note that binding free energy is a cumulative measure of various energetic components, each with its significance in the binding process (Figure 11). Although the Bcl-2 protein showed high binding free energy, it also exhibited a complex network of interactions, including hydrogen bonds, hydrophobic, and vdW contacts, likely leading to its inactivation by dephosphorylation in both MCF-7 and MDA-MB-231 cells (Figure 7D,E). Furthermore, the solvation effects, as part of the MM-PBSA calculation, emphasized the pivotal role of solvent molecules in these interactions, significantly contributing to the overall stability of the protein-ligand complexes.
4. Materials and methods
4.1. Chalcone extraction and isolation.
The plant material used in this study was collected from La Vega, Cundinamarca, Colombia, at an altitude of 1,250 meters above sea level (m.a.s.l.). A specimen of the plant was deposited for identification at the Herbarium of Pontificia Universidad Javeriana, Bogotá, Colombia. It was identified as Chromolaena tacotana (Klatt) R.M. King and H. Rob, with the voucher number HPUJ30170.
The inflorescences, dried at 60°C to less than 8% humidity, were ground in a RTE-648 mill (Tecnal, Sao Paulo, Brazil) and sieved through a 60-mesh screen (0.25mm) (EMS-08, Electrolab, Mumbai, India). A total of 490.17 g of the resulting powder underwent Soxhlet extraction using petroleum ether (Sigma-Aldrich, St Louis, MO, USA). This was followed by dichloromethane (CH2Cl2) extraction (Merck Group, Darmstadt, Germany) to remove fats and chlorophylls. The solvent was then evaporated under vacuum at 45°C using a R-300 rotary vacuum evaporator (BÜCHI Labortechnik AG, Flawil, Switzerland) at 60 rpm. The residue, termed the DCI fraction, weighed 30.82 g and was measured using an Explorer balance (Ohaus, New Jersey, USA).
The DCI fraction was flocculated with a methanol (MeOH) and water mixture (1:1) (Merck Group, Darmstadt, Germany). Subsequent liquid-liquid extraction with CH2Cl2 yielded the DC-II fraction. A total of 7.8563 g of the DC-II fraction was then subjected to column chromatography (CC) using Silica gel (63-200 μm) (Silicagel 60, Merck Group, Darmstadt, Germany). The elution process involved a gradient of petrol:ethyl acetate (AcOEt) with ratios of 8:2, 7:3, and 6:4, followed by ethanol (EtOH) (Merck Group, Darmstadt, Germany), resulting in five separate fractions. Fraction 3 underwent further CC using a chloroform (CHCl3) and methanol (MeOH) mixture (9.8:0.2), yielding 162.2 µg of a single compound. This compound was subsequently purified and crystallized through successive washings with acetone (Merck Group, Darmstadt, Germany).
4.2. Structural identification
1H and 13C NMR spectra were acquired using an Avance Bruker 300 spectrophotometer (Bruker Biospin, Mannheim, Germany), operating at frequencies of 300 MHz for hydrogen and 75 MHz for carbon. The spectra were recorded in acetone-d6 solvent (Merck Group, Darmstadt, Germany). Mass spectral data were obtained using ultra-high-pressure liquid chromatography (UPLC) coupled to a quadrupole time-of-flight (QTOF) mass spectrometer detector, specifically a Shimadzu LCMS-9030 (Kyoto, Japan), via direct injection. The positions of O-CH3 and OH groups were determined using UV-VIS spectroscopy within the 230 to 500 nm range, conducted on a Jenway 6405 UV-VIS spectrophotometer (Staffordshire, UK). This analysis utilized displacement reagents including AlCl3, HCl, AcONa, MeONa, and H3BO3 (Merck Group, Darmstadt, Germany).
4.3. Breast cell lines and culture conditions
The MDA-MB-231 (HTB-26) and MCF-7 breast cancer cell lines were cultured in RPMI 1640 medium (Lonza, Basel, Switzerland). The cancer cell media were supplemented with 10% heat-inactivated fetal bovine serum (Biowest, Nuaillé, France) and 1.0% penicillin/streptomycin (Lonza, Basel, Switzerland). Conversely, the normal epithelial MCF-12F (CRL-10783) mammary gland cells were grown in DMEM/F-12 medium (Sigma-Aldrich, St Louis, MO, USA). The DMEM/F-12 medium was enriched with 7.0% fetal horse serum, 10 µg/ml human insulin, 20 ng/ml epidermal growth factor, 500 ng/ml hydrocortisone, 100 mg/ml cholera toxin, and 1.0% penicillin/streptomycin, all obtained from Sigma-Aldrich, St Louis, MO, USA.
4.4. Cytotoxic activity and selectivity of 2',4-dihydroxy-4',6'-dimethoxychalcone
The cytotoxic activity of diethyldithiocarbamate (DDC) was assessed using the MTT reduction assay, specifically measuring the inhibitory concentration (IC50) that reduces cell viability by 50%. A total of 10,000 cells were seeded in each well of 96-well plates and treated with various concentrations of DDC, ranging from 80 to 5 µg/ml. Cells treated with 0.5% DMSO (Thermo-Fisher Scientific, Waltham, MA, USA) served as the negative control. Following a 48-hour incubation period at 37°C and 5.0% CO2 in a Binder BD-115 incubator (Tuttlingen, Germany), 0.5 mg/ml MTT reagent (Sigma-Aldrich, St. Louis, MO, USA) was added to each well and incubated for an additional 4 hours. The resulting Formazan crystals were dissolved in DMSO, and absorbance was measured at 570 nm using a Bio-Rad microplate reader (Bio-Rad, Hercules, CA, USA). The IC50 values were estimated through nonlinear regression analysis using GraphPad Prism 8.0 software (La Jolla, CA, USA). The selectivity index (SI) is calculated as the ratio of the IC50 in normal cells to the IC50 in cancer cells [39, 85].
4.5. Effects of 2',4-dihydroxy-4',6'-dimethoxychalcone on cell cycle progression in BC cells
To evaluate the impact of diethyldithiocarbamate (DDC) on cell cycle distribution, specifically the G0/G1, S, and G2/M phases, flow cytometry analysis was conducted using the Muse™ Cell Analyzer. A total of 100,000 cells per well were seeded in a 24-well plate and, after attachment, were treated with DDC at the IC50 concentration for 24 hours at 37°C and 5.0% CO2. Combretastatin A-4 and doxorubicin Paclitaxel (Luminex Corporation, Austin, TX, USA) were used as positive controls for G2/M [59] and G0/G1 cell cycle arrest [60], respectively. Synchronized, untreated cells served as the negative control.
Post-treatment, cells underwent trypsinization and were resuspended in 1X PBS (Lonza, Basel, Switzerland). They were then gradually fixed in fresh, cold 70% ethanol and incubated at 4 °C for 24 hours. The Muse® Cell Cycle Kit (Luminex Corporation, Austin, TX, USA), which employs PI-based staining to quantify DNA content, was used to distinguish and measure the percentage of cells in each phase of the cell cycle (G0/G1, S, and G2/M) following the manufacturer's instructions. Data acquisition was performed using the MUSE cell analyzer (Luminex Corporation, Austin, TX, USA). During this process, values are generated and displayed on a histogram, with the distribution of cells being compared against the positive and negative control populations.
4.6. Susceptibility of BC cells to autophagy induced by the natural chalcone
4.6.1. Detection of LC3-II by flow cytometry assay
To evaluate autophagy activation, flow cytometry was employed to detect LC3-II in cells treated with diethyldithiocarbamate (DDC). For this purpose, 40,000 cells per well were seeded in a 48-well plate. Once attached, these cells were exposed to DDC at the IC50 concentration and incubated for 24 hours at 37°C and 5.0% CO2. As positive controls for autophagy, cells subjected to overnight starvation and resveratrol treatment were used [61], while cells treated with 0.5% DMSO (Thermo-Fisher Scientific, Waltham, MA, USA) served as the negative control.
Following the 24-hour treatment period, the Muse® Autophagy Kit (Luminex Corporation, Austin, TX, USA), which includes an anti-LC3-II Alexa Fluor™ 555 antibody, was utilized according to the manufacturer's guidelines. Data acquisition was carried out using the MUSE cell analyzer (Luminex Corporation, Austin, TX, USA). During this process, values were collected and displayed on a histogram graph. For each sample, the data was expressed as the median percentage of cells that tested either positive or negative for the LC3-II autophagic marker.
4.6.2. Western blot analysis
To verify the induction of autophagy, western blot analysis was conducted using 40 µg of total protein extracted from breast cancer (BC) cells. The cells were lysed using Cell Lysis Buffer II (Thermo-Fisher Scientific, Waltham, MA, USA) following treatment with diethyldithiocarbamate (DDC) for 24 and 48 hours, as well as with the positive control resveratrol (Rv). The proteins were separated on 7.5 or 12% SDS-PAGE gels and subsequently transferred onto polyvinylidene fluoride (PVDF) membranes (Thermo-Fisher Scientific, Waltham, MA, USA). The membranes were blocked for 1 hour using 5.0% (w/v) BSA in TTBS and then incubated overnight at 4 °C with primary antibodies: anti-mTOR-Ser2448 (Proteintech), p62, and anti-LC3-II (GeneTex, Irvine, CA, USA). Anti-GAPDH (GT239) (GeneTex, Irvine, CA, USA) was employed as the loading control.
Following primary antibody incubation, the membranes were incubated for 2 hours at room temperature with either anti-mouse IgG or anti-rabbit IgG secondary antibodies (1:5000) (Merck Group, Darmstadt, Germany) [28]. Bands were visualized using the 1-Step™ TMB-Blotting Substrate Solution (Thermo-Fisher Scientific, Waltham, MA, USA), which generates a blue precipitate. Band density was normalized and semi-quantified using ImageJ software.
4.7. Apoptosis in response to 2',4-dihydroxy-4',6'-dimethoxychalcone
4.7.1. Apoptosis
Live cell detection and the differentiation between early or late apoptosis were conducted using the Muse® Annexin V & Dead Cell Reagent Kit and the Muse® Caspase-3/7 Kit (both from Luminex Corporation, Austin, TX, USA). For these assays, 40,000 breast cancer (BC) cells per well were seeded in a 24-well plate and treated with diethyldithiocarbamate (DDC) at the IC50 concentration for 24 hours. Paclitaxel was used as the positive control, while cells treated with 0.5% DMSO molecular grade (Thermo-Fisher Scientific, Waltham, MA, USA) served as the negative control.
Following treatment, both the medium and cells were collected by centrifugation, washed in 1X PBS, and then resuspended. The cells were subsequently stained with the reagent solutions according to the manufacturer's protocols provided in each Muse® Kit (Luminex Corporation, Austin, TX, USA). Apoptotic cells were detected using the Guava® Muse® Cell Analyzer (Luminex Corporation, Austin, TX, USA), with the analysis being performed in the Muse® software version 1.8.
4.7.2. Western Blotting.
Untreated breast cancer cells, after being treated with diethyldithiocarbamate (DDC) for 24 and 48 hours, and cells treated with paclitaxel (PTX) as the positive control, were processed following the method described in section 4.6.2. For analysis, these cells were examined using specific antibodies: anti-caspase-7 (GTX31704), anti-cleaved caspase-3 (Thermo Fisher Scientific, Waltham, MA, USA), and anti-XIAP (D2Z8W).
4.8. Analysis of intrinsic pathway of apoptosis in TNBC cells
4.8.1. Changes in the outer mitochondrial membrane potential (∆ψm)
To assess changes in mitochondrial membrane potential (∆ψm) in response to diethyldithiocarbamate (DDC) treatment, flow cytometry analysis was performed. Twenty-five thousand cells were seeded in each well of a 48-well plate and incubated overnight at 37 °C with 5.0% CO2. The adherent cells were then treated with DDC at the IC50 concentration and 100 nM Valinomycin for 24 hours. The Muse® MitoPotential Kit (Luminex Corporation) was utilized to determine whether DDC induces depolarization of the mitochondrial membrane. Changes in ∆ψm in the triple-negative breast cancer (TNBC) cells were detected using the Guava® Muse® Cell Analyzer (Luminex Corporation) and analyzed with the Muse® software version 1.8.
4.8.2. Pro- and anti-apoptotic proteins analysis by Western blot
To identify pro- and anti-apoptotic mitochondrial proteins in breast cancer (BC) cells, 40 µg of total protein extracted from untreated cells and cells treated with the chalcone (DDC) for 24 and 48 hours, as well as cells treated with paclitaxel (PTX) as a positive control, were processed following the protocol outlined in section 4.6.2. The analysis employed the following antibodies: anti-Bim-EL (GT1234), anti-Bcl-2 (N1N2) (GeneTex, Irvine, CA, USA), anti-Bax (D2E11), anti-Bcl-XL (54H6), and anti-Mcl-1 (D2W9E) (Cell Signaling Technology), to determine the levels of pro- and anti-apoptotic proteins.
4.8.3. Phospho-Bcl-2 protein detection
To analyze the phosphorylation of the Bcl-2 protein at serine 70 (S70pBcl-2), flow cytometry was employed. Initially, two hundred thousand cells were seeded in each well of a 12-well plate and incubated overnight at 37 °C with 5.0% CO2. Post-incubation, the adherent cells were treated with the chalcone (DDC) and paclitaxel (PTX) at their respective IC50 concentrations for 48 hours. The assessment of Bcl-2 protein phosphorylation was conducted using the Muse™ Bcl-2 Activation Dual Detection Kit (Luminex Corporation), which includes two directly conjugated antibodies: anti-phospho-Bcl-2 (Ser70)-Alexa Fluor®555 for the active form and anti-Bcl-2-PECy5 for the inactive form of Bcl-2.
Following treatment, cells were dissociated, harvested, and processed for fixation, permeabilization, and staining. Data acquisition and analysis were carried out using the Muse™ Cell Analyzer and its associated software. The experiment was conducted in triplicate under identical conditions, and the results are presented as the mean of these replicates.
4.9. Statistical analysis for biological test
Data from the experiments were presented as the mean ± standard deviation (SD) of three biological replicates (n = 3). To determine the statistical significance of differences between the control group and treatment groups, a two-way ANOVA test followed by Tukey's multiple comparison test was employed. These statistical analyses were conducted using GraphPad Prism software, version 8.0 (La Jolla, CA). Statistical significance was established at p-values of < 0.05** and < 0.001***, indicating significant differences between the means.
4.10. Molecular Docking and Molecular dynamics
Molecular docking simulations were performed using AutoDock Vina version 1.2.0 [32,33], utilizing the Vina force field to predict and evaluate binding affinities between selected proteins and ligands. The search space for the docking was defined by a cubic box, centered on the ligands, with each side measuring 35 Å. A grid spacing of 0.375 Å was set as the default for these simulations.
The exhaustiveness parameter in the docking simulations was set to 50, a value chosen to ensure an efficient and thorough search for the global minimum within the designated search space. This setting strikes a balance between computational cost and the accuracy of the docking predictions. The docking pose with the lowest binding free energy was selected from these simulations to serve as the initial configuration for subsequent molecular dynamics simulations.
Protein structures were sourced from the Protein Data Bank (PDB), with the respective PDB IDs for the proteins under study being: Mcl-1 (5FDR) [31], Bcl-XL (3ZLN), XIAP (5OQW), mTOR (4JSV), and Bcl-2 (6O0P). Structures that included an inhibitor bound to the protein were preferred. In cases where such structures were unavailable, the CastP server was utilized to predict and analyze protein cavities, pockets, or tunnels.
For the docking preparations, water molecules and other solvents were removed from the protein structures using ChimeraX software [62]. Subsequently, the proteins were converted into pdbqt format using the AutoDock Tools of the ADFR Suite [TO10b]. This step involved the addition of polar hydrogen atoms and the assignment of Gasteiger partial charges to the atoms, thereby generating the necessary pdbqt files required for the docking simulations.
Ligands were prepared for docking using the MEEKO software, available at https://github.com/forlilab/Meeko (accessed on April 12, 2023). MEEKO's functionalities include the addition of polar hydrogen atoms to the ligands (where necessary) and the computation of Gasteiger charges. This processing results in the generation of corresponding pdbqt files, which are suitable for use in docking simulations.
4.10.1. Molecular Dynamics simulation preparations
For the ligands, new charges were calculated to achieve a more accurate representation of the molecules. RESP charges were computed using Gaussian 16 with the B3LYP/6-311g basis set [63]. The parameters and coordinate files for the ligands were generated using Antechamber, a component of AmberTools [64]. The systems comprising protein-ligand complexes were prepared using Leap, another tool within AmberTools. For these simulations, the ff14SB force field [65] was employed for proteins, while the GAFF force field [66] was used for ligands. Each system was then solvated with TIP3P water molecules [67], and Na+ or Cl− ions were added to neutralize the system's charge.
4.10.2. Molecular dynamics configuration
To enhance the molecular-level description of the ligands, their charges were recalculated using the Restricted Electrostatic Potential (RESP) method. This recalibration was carried out using the Gaussian 16 software suite [63], employing the B3LYP functional and the 6-311g basis set. These settings were chosen to accurately represent the electron correlation and distribution within the ligands. The quantum mechanical calculations performed in Gaussian were pivotal for deriving the electrostatic potential, which was then used to extract the RESP charges.
After completing the quantum mechanical calculations, the Antechamber tool was employed to create parameter and coordinate files for the ligands. This tool was essential for converting the calculated RESP charges and molecular coordinates into a format compatible with the AMBER suite of programs, thereby facilitating their use in subsequent simulation processes.
The preparation of the protein-ligand complexes, or systems, was carried out using the Leap module within the AmberTools package [64]. Leap was instrumental in assigning force field parameters to the atoms in the system and generating the required input files for molecular dynamics simulations. The ff14SB force field [65] was applied to the protein components to provide accurate potential energy parameters for simulating protein dynamics. For the ligands, the General Amber Force Field (GAFF) [66] was chosen due to its versatility and effectiveness in representing a wide range of organic molecules.
Each system, consisting of a protein-ligand complex, was solvated in a periodic box of TIP3P water molecules [67]. The TIP3P model was selected for its reliable representation of water's structural and dynamic properties, thereby offering a physiologically relevant simulation environment. To maintain the overall neutrality of the system, which is crucial for the stability and accuracy of the simulations, either sodium (Na+) or chloride (Cl−) ions were added to counteract the net charge of the protein-ligand complexes.
Molecular dynamics simulations were conducted using the AMBER18 simulation package [64], following a carefully structured protocol. The initial phase of the simulation focused on the energy minimization of water molecules in the system. This step was executed for a maximum of 5000 cycles (specified by maxcyc=5000), transitioning from steepest descent to conjugate gradient optimization after the first 1000 cycles (controlled by ncyc=1000). During this phase, the SHAKE algorithm was disabled (ntf=1) to permit unrestrained movement of hydrogen atoms. Concurrently, the solute, comprising the protein-ligand complex, was stabilized with positional restraints, applying a force constant of 100 kcal/mol-Å2. This restraint was essential to maintain the protein structure during the water minimization process.
After the initial minimization of water molecules, the entire system was subjected to a comprehensive energy minimization. This step aimed to eliminate potential steric clashes and alleviate strained molecular conformations. The process entailed up to 100,000 cycles of minimization (set by maxcyc=100000), transitioning from steepest descent to conjugate gradient methods after the initial 1000 cycles (controlled by ncyc=1000). During this stage, the SHAKE algorithm remained disabled (ntf=1), allowing for the free movement of all atoms in the system.
Following energy minimization, the system underwent a heating phase, where its temperature was gradually increased to 300 K over 500 picoseconds (ps). During this phase, the protein-ligand complex (solute) was subject to positional restraints with a reduced force constant of 2 kcal/mol-Å2. This allowed the system to slowly adapt to the increasing temperature within an NVT ensemble (constant number of particles, volume, and temperature).
After the heating phase, the system was subjected to pressure equilibration for an additional 500 picoseconds (ps) within an NPT ensemble (constant number of particles, pressure, and temperature). This step allowed the system to adapt to the desired pressure conditions. Subsequently, the system underwent an equilibration phase for 1 nanosecond (ns), followed by a production run of 10 ns. Trajectories from the final 2 ns of the production run were extracted and utilized for Molecular Mechanics Poisson-Boltzmann Surface Area (MM-PBSA) calculations, in accordance with methodologies established in previous literature.
4.10.3. MMPBSA
The binding free energies of the protein-ligand complexes, following molecular dynamics simulations, were calculated using the MMPBSA.py module within the AmberTools18 package [58]. The Molecular Mechanics Poisson-Boltzmann Surface Area (MM-PBSA) method is known for striking a balance between accuracy and computational efficiency in predicting binding free energies in molecular complexes.
For our analysis, the entire trajectory from the production phase of the molecular dynamics simulation was used. The input parameter (inp=1) was set to sequentially read and process trajectory frames, enabling a detailed and continuous analysis of the system's energy profile throughout the simulation. We opted not to use the radii optimization feature (radiopt=0), maintaining a consistent set of radii derived from the force field parameters for both the simulation and subsequent analysis.
In our calculations, we chose to exclude the entropy contribution to the binding free energy. While entropy is an important factor in the binding process, its accurate computation is computationally intensive and does not always enhance the precision of binding free energy estimations. In some instances, including entropy can result in less accurate predictions [69–71]. Therefore, considering the balance between computational resources and accuracy, entropy was omitted from our binding free energy calculations in this study.
4.10.4. RMSD, RMSF and Rg
Analysis of root-mean-square deviation (RMSD), root-mean-square fluctuation (RMSF), and radius of gyration (Rg) was conducted using the cpptraj module [72] from the AMBER software suite. These calculations provide crucial insights into the structural stability, flexibility, and compactness of the protein-ligand complexes over the course of the simulation.
For RMSD calculations, which assess the conformational stability, the first frame of the production phase served as the reference structure. The RMSD values were calculated for each frame against this reference, offering a temporal profile of structural deviations during the simulations.
RMSF analysis, conducted with the same reference frame, provides details on the flexibility and mobility of individual residues or atoms in the protein. This analysis highlights regions with significant conformational changes throughout the simulation.
The Rg was calculated to assess the compactness and overall dimensions of the proteins, effectively measuring their size and conformational changes over time, which is crucial for understanding protein folding and stability.
Additionally, the Prolif Python library [34] was employed for a detailed assessment of protein-ligand interactions throughout the simulation trajectory. This library allows for the analysis of these interactions frame-by-frame over the entire simulation, providing a comprehensive view of the dynamic interplay between the protein and the ligand. This interaction analysis is vital for understanding the ligand's binding specificity and affinity towards the protein, offering key insights into their molecular interaction mechanisms.
5. Conclusion
The selective cytotoxic effects of 2',4-dihydroxy-4',6'-dimethoxychalcone on MCF-7 and MDA-MB-231 breast cancer (BC) cells are characterized by the concurrent induction of autophagy and apoptosis, along with cell cycle arrest in the G0/G1 phase. In MCF-7 cells, autophagy is promoted through increased levels of LC3-II and inhibition of the mTOR protein, which is directly and stably interacted with by diethyldithiocarbamate (DDC). This interaction results in effective autophagy induction. Conversely, in triple-negative breast cancer (TNBC) cells, the emphasis is on the activation of mitochondrial apoptosis. This is marked by a decrease in mitochondrial membrane potential and consequent activation of pro-apoptotic proteins such as Bax, Bim, and p53, following the deregulation of Mcl-1, Bcl-XL, Bcl-2, and XIAP, leading to caspase-3 and -7 mediated apoptosis. This study suggests that 2',4-dihydroxy-4',6'-dimethoxychalcone, derived from Chromolaena tacotana, may possess therapeutic potential for breast cancer treatment, operating through differential activation of autophagy and mitochondrial apoptosis in a cell-type-dependent manner.
Supplementary Materials
The following supporting information can be downloaded at the website of this paper posted on Preprints.org: Figure S1: Nuclear Magnetic Resonance Spectroscopy of 2’4-dihidroxi-4’,6’-dimetoxichalcona: A. 1H NMR and B. 13C NMR spectrum and Figure S2. HPLC/QTOF analysis ESI positive ion mode of 2’4-dihidroxi-4’,6’-dimetoxichalcona [M+H]+: 301,10871.
Author Contributions
Conceptualization, G.M., R.T., J.Y., and C.C.; methodology, G.M., C.C., J.Y. R.P. and R.T.; validation, G.M., and C.C.; formal analysis, G.M., C.C., J.Y., and R.T.; investigation, G.M., C.C., A.E., M.P., R.P., and J.Y.; resources, G.M., J.Y., and C.C.; writing—original draft preparation, G.M., J.Y., and C.C.; writing—review and editing, G.M., and J.Y.; supervision, G.M., and R.T.; project administration G.M., and J.Y.; funding acquisition, G.M., and C.C.; All authors have read and agreed to the published version of the manuscript.
Funding
This research was funded by Ministerio de Ciencia, Tecnología e Innovación de Colombia, grant number: Contrato-407-2020; Universidad de Ciencias Aplicadas y Ambientales ID: 125484467618, Universidad Simón Bolívar and Pontificia Universidad Javeriana ID: 00008846. The APC was funded by Universidad Simón Bolivar.
Institutional Review Board Statement
The current study was conducted in accordance with the Colombia Biosafety Standards in Laboratory, Decree 2676 of 2000, and approved by the Research and Ethics Committee of Science Faculty of Pontificia Universidad Javeriana (9 May 2019 ), and the Ministerio de Medio Ambiente y Desarrollo Sostenible, contract for access to genetic resources and their derived products, in accordance with the provisions of Decrees 730 of 1997 and 3570 of 2011 awarded to the Universidad de Ciencias Aplicadas y Ambientales Contract No. 291, The Pontificia Universidad Javeriana Contract No. 287, Otro Sí No. 9, and The Universidad Simón Bolívar Contract No. 342, Otro Sí No. 1, resolution No. 1543 of 2022.
Data Availability Statement
The data presented in this study supporting the results are available in the main text and Supplementary Material. Additional data are available upon reasonable request from the corresponding author.
Acknowledgments
The authors gratefully acknowledge many helpful and insightful discussions with Julian Esteban Contreras Patiño, a professional in chromatography and mass spectrometry, and Jhon Edwar Díaz teacher in NMR both from Pontificia Universidad Javeriana.
Conflicts of Interest
The authors declare no conflict of interest. The funders had no role in the design of the study; in the collection, analyses, or interpretation of data; in the writing of the manuscript; or in the decision to publish the results.
Sample Availability
Samples of Chalcones are available from the authors.
References
- Maqbool, M.; Bekele, F.; Fekadu, G. Treatment Strategies Against Triple-Negative Breast Cancer: An Updated Review. 2022. [CrossRef]
- Tran, B., Bedard, P.L. Luminal-B breast cancer and novel therapeutic targets. Breast Cancer Res 2011, 13, 221. [CrossRef]
- Panche, A.N.; Diwan, A.D.; Chandra, S.R. Flavonoids: An Overview. J Nutr Sci 2016, 5. [CrossRef]
- Falcone Ferreyra, M.L.; Rius, S.P.; Casati, P. Flavonoids: Biosynthesis, Biological Functions, and Biotechnological Applications. Front Plant Sci 2012, 3, 34352. [Google Scholar] [CrossRef] [PubMed]
- Yadav, V.R.; Prasad, S.; Sung, B.; Aggarwal, B.B. The Role of Chalcones in Suppression of NF-ΚB-Mediated Inflammation and Cancer. Int Immunopharmacol 2011, 11, 295–309. [Google Scholar] [CrossRef] [PubMed]
- Zhang, E.-H.; Wang, R.-F.; Guo, S.-Z.; Liu, B. An Update on Antitumor Activity of Naturally Occurring Chalcones. Evidence-Based Complementary and Alternative Medicine 2013, 2013, 22. [Google Scholar] [CrossRef]
- Mokbel, K. The Evolving Role of Aromatase Inhibitors in Breast Cancer. Int J Clin Oncol 2002, 7, 279–283. [Google Scholar] [CrossRef] [PubMed]
- Maggiolini, M.; Statti, G.; Vivacqua, A.; Gabriele, S.; Rago, V.; Loizzo, M.; Menichini, F.; Amdò, S. Estrogenic and Antiproliferative Activities of Isoliquiritigenin in MCF7 Breast Cancer Cells. Journal of Steroid Biochemistry and Molecular Biology 2002, 82, 315–322. [Google Scholar] [CrossRef]
- Wang, K.L.; Yu, Y.C.; Hsia, S.M. Perspectives on the Role of Isoliquiritigenin in Cancer. Cancers (Basel) 2021, 13, 1–37. [Google Scholar] [CrossRef] [PubMed]
- Girisa, S.; Saikia, Q.; Bordoloi, D.; Banik, K.; Monisha, J.; Daimary, U.D.; Verma, E.; Ahn, K.S.; Kunnumakkara, A.B. Xanthohumol from Hop: Hope for Cancer Prevention and Treatment. IUBMB Life 2021, 73, 1016–1044. [Google Scholar] [CrossRef] [PubMed]
- Yong, W.K.; Abd Malek, S.N. Xanthohumol Induces Growth Inhibition and Apoptosis in ca Ski Human Cervical Cancer Cells. Evid Based Complement Alternat Med 2015, 2015. [Google Scholar] [CrossRef]
- Shi, J.; Chen, Y.; Chen, W.; Tang, C.; Zhang, H.; Chen, Y.; Yang, X.; Xu, Z.; Wei, J.; Chen, J. Isobavachalcone Sensitizes Cells to E2-Induced Paclitaxel Resistance by down-Regulating CD44 Expression in ER+ Breast Cancer Cells. J Cell Mol Med 2018, 22, 5220–5230. [Google Scholar] [CrossRef] [PubMed]
- Jeong, Y.J.; Kang, K.J. Effect of Angelica Keiskei Extract on Apoptosis of MDA-MB-231 Human Breast Cancer Cells. Journal of the Korean Society of Food Science and Nutrition 2011, 40, 1654–1661. [Google Scholar] [CrossRef]
- Abu, N.; Ho, W.Y.; Yeap, S.K.; Akhtar, M.N.; Abdullah, M.P.; Omar, A.R.; Alitheen, N.B. The Flavokawains: Uprising Medicinal Chalcones. Cancer Cell Int 2013, 13. [Google Scholar] [CrossRef] [PubMed]
- Abu, N.; Akhtar, M.N.; Yeap, S.K.; Lim, K.L.; Ho, W.Y.; Zulfadli, A.J.; Omar, A.R.; Sulaiman, M.R.; Abdullah, M.P.; Alitheen, N.B. Flavokawain A Induces Apoptosis in MCF-7 and MDA-MB231 and Inhibits the Metastatic Process in Vitro. PLoS One 2014, 9. [Google Scholar] [CrossRef] [PubMed]
- Abu, N.; Akhtar, M.N.; Yeap, S.K.; Lim, K.L.; Ho, W.Y.; Abdullah, M.P.; Ho, C.L.; Omar, A.R.; Ismail, J.; Alitheen, N.B. Flavokawain B Induced Cytotoxicity in Two Breast Cancer Cell Lines, MCF-7 and MDA-MB231 and Inhibited the Metastatic Potential of MDA-MB231 via the Regulation of Several Tyrosine Kinases In Vitro. BMC Complement Altern Med 2016, 16. [Google Scholar] [CrossRef]
- Lin, X.; Xing, S.; Chen, K.; Yang, H.; Hu, X. Flavokavain C Suppresses Breast Cancer Cell Viability and Induces Cell Apoptosis by Triggering DNA Damage. Biol Pharm Bull 2023, 46, 684–692. [Google Scholar] [CrossRef] [PubMed]
- Yeap, S.K.; Abu, N.; Akthar, N.; Ho, W.Y.; Ky, H.; Tan, S.W.; Alitheen, N.B.; Kamarul, T. Gene Expression Analysis Reveals the Concurrent Activation of Proapoptotic and Antioxidant-Defensive Mechanisms in Flavokawain B-Treated Cervical Cancer HeLa Cells. Integr Cancer Ther 2017, 16, 373–384. [Google Scholar] [CrossRef] [PubMed]
- Phang, C.W.; Karsani, S.A.; Sethi, G.; Malek, S.N.A. Flavokawain C Inhibits Cell Cycle and Promotes Apoptosis, Associated with Endoplasmic Reticulum Stress and Regulation of MAPKs and Akt Signaling Pathways in HCT 116 Human Colon Carcinoma Cells. PLoS One 2016, 11. [Google Scholar] [CrossRef] [PubMed]
- The New York Botanical Garden. Available online: https://www.nybg.org/ (accessed on 11-05-2023).
- Taleb-Contini, S.H.; Schorr, K.; Da Costa, F.B.; De Oliveira, D.C.R. Detection of Flavonoids in Glandular Trichomes of Chromolaena Species (Eupatorieae, Asteraceae) by Reversed-Phase High-Performance Liquid Chromatography. Revista Brasileira de Ciências Farmacêuticas 2007, 43, 315–321. [Google Scholar] [CrossRef]
- Herrera-Calderon, O.; Arroyo-Acevedo, J.L.; Rojas-Armas, J.; Chumpitaz-Cerrate, V.; Figueroa-Salvador, L.; Enciso-Roca, E.; Tinco-Jayo, J.A. Phytochemical Screening, Total Phenolic Content, Antioxidant and Cytotoxic Activity of Chromolaena Laevigata on Human Tumor Cell Lines. Annu Res Rev Biol 2017, 21. [Google Scholar] [CrossRef]
- Ojo, O.; Mphahlele, M.P.; Oladeji, O.S.; Mmutlane, E.M.; Ndinteh, D.T. From Wandering Weeds to Pharmacy: An Insight into Traditional Uses, Phytochemicals and Pharmacology of Genus Chromolaena (Asteraceae). J Ethnopharmacol 2022, 291. [Google Scholar] [CrossRef] [PubMed]
- Pérez, C. Química del género Chromolaena (Compositae). 1994, 12, 141-145.
- Dhar, R.; Kimseng, R.; Chokchaisiri, R.; Hiransai, P.; Utaipan, T.; Suksamrarn, A.; Chunglok, W. 2′,4-Dihydroxy-3′,4′,6′-Trimethoxychalcone from Chromolaena Odorata Possesses Anti-Inflammatory Effects via Inhibition of NF-ΚB and P38 MAPK in Lipopolysaccharide-Activated RAW 264.7. Macrophages. 2017, 40, 43–51. [Google Scholar] [CrossRef] [PubMed]
- Barua, R.N.; Sharma, R.P.; Thyagarajan, G.; Hertz, W. Flavonoids of Chromolaena Odorata. Phytochemistry 1978, 17, 1807–1808. [Google Scholar] [CrossRef]
- Zhang, M.L.; Irwin, D.; Li, X.N.; Sauriol, F.; Shi, X.W.; Wang, Y.F.; Huo, C.H.; Li, L.G.; Gu, Y.C.; Shi, Q.W. PPARγ Agonist from Chromolaena Odorata. J Nat Prod 2012, 75, 2076–2081. [Google Scholar] [CrossRef] [PubMed]
- Mendez-Callejas, G.; Torrenegra, R.; Muñoz, D.; Celis, C.; Roso, M.; Garzon, J.; Beltran, F.; Cardenas, A. A New Flavanone from Chromolaena Tacotana (Klatt) R. M. King and H. Rob, Promotes Apoptosis in Human Breast Cancer Cells by Downregulating Antiapoptotic Proteins. Molecules 2023, 28, 58. [Google Scholar] [CrossRef] [PubMed]
- Rodriguez, J.; Gómez, L.M.; Gutierrez, A.C.; Mendez-Callejas, G.; Reyes, A.I.; Tellez, L.C.; Oscar, A.; Rodriguez, E.; Rubén, G.; Torrenegra, D. Chromolaena Tacotana (Klatt) R. M. King and H. Rob. Source of Flavonoids with Antiproliferative and Antioxidant Activity. Indian J Sci Technol 2018, 11. [Google Scholar] [CrossRef]
- Bolomsky, A.; Vogler, M.; Köse, M.C.; Heckman, C.A.; Ehx, G.; Ludwig, H.; Caers, J. MCL-1 Inhibitors, Fast-Lane Development of a New Class of Anti-Cancer Agents. Journal of Hematology & Oncology 2020 13:1 2020, 13, 1–19. [Google Scholar] [CrossRef]
- Pelz, N.F.; Bian, Z.; Zhao, B.; Shaw, S.; Tarr, J.C.; Belmar, J.; Gregg, C.; Camper, D.M. V.; Goodwin, C.M.; Arnold, A.L.; et al. Discovery of 2-Indole-Acylsulfonamide Myeloid Cell Leukemia 1 (Mcl-1) Inhibitors Using Fragment-Based Methods. J Med Chem 2016, 59, 2054–2066. [Google Scholar] [CrossRef]
- Eberhardt, J.; Santos-Martins, D.; Tillack, A.F.; Forli, S. AutoDock Vina 1.2.0: New Docking Methods, Expanded Force Field, and Python Bindings. J Chem Inf Model 2021, 61, 3891–3898. [Google Scholar] [CrossRef] [PubMed]
- Trott, O.; Olson, A.J. AutoDock Vina: Improving the Speed and Accuracy of Docking with a New Scoring Function, Efficient Optimization and Multithreading. J Comput Chem 2010, 31, 455. [Google Scholar] [CrossRef] [PubMed]
- Bouysset, C.; Fiorucci, S. ProLIF: A Library to Encode Molecular Interactions as Fingerprints. J Cheminform 2021, 13, 1–9. [Google Scholar] [CrossRef]
- Ferenczy, G.G.; Kellermayer, M. Contribution of Hydrophobic Interactions to Protein Mechanical Stability. Comput Struct Biotechnol J 2022, 20, 1946. [Google Scholar] [CrossRef] [PubMed]
- Varma, A.K.; Patil, R.; Das, S.; Stanley, A.; Yadav, L.; Sudhakar, A. Optimized Hydrophobic Interactions and Hydrogen Bonding at the Target-Ligand Interface Leads the Pathways of Drug-Designing. PLoS One 2010, 5. [Google Scholar] [CrossRef]
- Hwang, D.; Hyun, J.; Jo, G.; Koh, D.; Lim, Y. Synthesis and Complete Assignment of NMR Data of 20 Chalcones. Magnetic Resonance in Chemistry 2011, 49, 41–45. [Google Scholar] [CrossRef] [PubMed]
- Zhang, J.; Brodbelt, J.S. Structural Characterization and Isomer Differentiation of Chalcones by Electrospray Ionization Tandem Mass Spectrometry. Journal of Mass Spectrometry 2003, 38, 555–572. [Google Scholar] [CrossRef] [PubMed]
- Indrayanto, G.; Putra, G.S.; Suhud, F. Validation of In-Vitro Bioassay Methods: Application in Herbal Drug Research. Profiles Drug Subst Excip Relat Methodol 2021, 46, 273–307. [Google Scholar] [CrossRef] [PubMed]
- Riss, T.L.; Moravec, R.A.; Niles, A.L.; Duellman, S.; Benink, H.A.; Worzella, T.J.; Minor, L. Cell Viability Assays. Assay Guidance Manual 2016.
- Weerapreeyakul, N.; Nonpunya, A.; Barusrux, S.; Thitimetharoch, T.; Sripanidkulchai, B. Evaluation of the Anticancer Potential of Six Herbs against a Hepatoma Cell Line. Chinese Medicine (United Kingdom) 2012, 7, 1–7. [Google Scholar] [CrossRef] [PubMed]
- Li, X.; Jin, L.; Ma, Y.; Jiang, Z.; Tang, H.; Tong, X. Xanthohumol Inhibits Non-Small Cell Lung Cancer by Activating PUMA-Mediated Apoptosis. Toxicology 2022, 470. [Google Scholar] [CrossRef] [PubMed]
- Rusetskaya, N.V.; Lukyanova, N.Y.; Chekhun, V.F. Molecular profile and cell cycle in MCF-7 and MCF-7/Dox cells exposed to conventional and liposomal forms of doxorubicin. Exp Oncol. 2009, 31. [Google Scholar] [PubMed]
- Sun, Z.; Zhou, D.; Yang, J.; Zhang, D. Doxorubicin Promotes Breast Cancer Cell Migration and Invasion via DCAF13. FEBS Open Bio 2022, 12, 221–230. [Google Scholar] [CrossRef] [PubMed]
- Şöhretoğlu, D.; Arroo, R.; Sari, S.; Huang, S. Flavonoids as Inducers of Apoptosis and Autophagy in Breast Cancer. Discovery and Development of Anti-Breast Cancer Agents from Natural Products 2021, 147–196. [Google Scholar] [CrossRef]
- Thorburn, A.; Thamm, D.H.; Gustafson, D.L. Autophagy and Cancer Therapy. Mol Pharmacol 2014, 85, 830–838. [Google Scholar] [CrossRef] [PubMed]
- Lin, P.H.; Chiang, Y.F.; Shieh, T.M.; Chen, H.Y.; Shih, C.K.; Wang, T.H.; Wang, K.L.; Huang, T.C.; Hong, Y.H.; Li, S.C.; et al. Dietary Compound Isoliquiritigenin, an Antioxidant from Licorice, Suppresses Triple-Negative Breast Tumor Growth via Apoptotic Death Program Activation in Cell and Xenograft Animal Models. Antioxidants 2020, 9. [Google Scholar] [CrossRef]
- Yang, L.H.; Ho, Y.J.; Lin, J.F.; Yeh, C.W.; Kao, S.H.; Hsu, L.S. Butein Inhibits the Proliferation of Breast Cancer Cells through Generation of Reactive Oxygen Species and Modulation of ERK and P38 Activities. Mol Med Rep 2012, 6, 1126–1132. [Google Scholar] [CrossRef] [PubMed]
- Michalkova, R.; Mirossay, L.; Kello, M.; Mojzisova, G.; Baloghova, J.; Podracka, A.; Mojzis, J. Anticancer Potential of Natural Chalcones: In Vitro and In Vivo Evidence. Int J Mol Sci 2023, 24, 10354. [Google Scholar] [CrossRef] [PubMed]
- Kitazumi, I.; Tsukahara, M. Regulation of DNA Fragmentation: The Role of Caspases and Phosphorylation. FEBS Journal 2011, 278, 427–441. [Google Scholar] [CrossRef] [PubMed]
- Lin, Y.F.; Lai, T.C.; Chang, C.K.; Chen, C.L.; Huang, M.S.; Yang, C.J.; Liu, H.G.; Dong, J.J.; Chou, Y.A.; Teng, K.H.; et al. Targeting the XIAP/Caspase-7 Complex Selectively Kills Caspase-3-Deficient Malignancies. J Clin Invest 2013, 123, 3861–3875. [Google Scholar] [CrossRef] [PubMed]
- Shogren-Knaak, M.; Ishii, H.; Sun, J.M.; Pazin, M.J.; Davie, J.R.; Peterson, C.L. Histone H4-K16 Acetylation Controls Chromatin Structure and Protein Interactions. Science (1979) 2006, 311, 844–847. [Google Scholar] [CrossRef] [PubMed]
- Boice, A.; Bouchier-Hayes, L. Targeting Apoptotic Caspases in Cancer. Biochim Biophys Acta Mol Cell Res 2020, 1867. [CrossRef]
- Battogtokh, G.; Cho, Y.Y.; Lee, J.Y.; Lee, H.S.; Kang, H.C. Mitochondrial-Targeting Anticancer Agent Conjugates and Nanocarrier Systems for Cancer Treatment. Front Pharmacol 2018, 9. [Google Scholar] [CrossRef] [PubMed]
- Lucantoni, F.; Salvucci, M.; Düssmann, H.; Lindner, A.U.; Lambrechts, D.; Prehn, J.H.M. BCL(X)L and BCL2 Increase the Metabolic Fitness of Breast Cancer Cells: A Single-Cell Imaging Study. Cell Death Differ 2021, 28, 1512–1531. [Google Scholar] [CrossRef] [PubMed]
- Tai, W.T.; Shiau, C.W.; Chen, H.L.; Liu, C.Y.; Lin, C.S.; Cheng, A.L.; Chen, P.J.; Chen, K.F. Mcl-1-Dependent Activation of Beclin 1 Mediates Autophagic Cell Death Induced by Sorafenib and SC-59 in Hepatocellular Carcinoma Cells. Cell Death Dis 2013, 4. [Google Scholar] [CrossRef] [PubMed]
- Ruvolo, P.P.; Deng, X.; May, W.S. Phosphorylation of Bcl2 and Regulation of Apoptosis. Leukemia 2001 15:4 2001, 15, 515–522. [Google Scholar] [CrossRef] [PubMed]
- Gopal, S.M.; Klumpers, F.; Herrmann, C.; Schäfer, L. V. Solvent Effects on Ligand Binding to a Serine Protease. Physical Chemistry Chemical Physics 2017, 19, 10753–10766. [Google Scholar] [CrossRef] [PubMed]
- Méndez-Callejas, G.M.; Leone, S.; Tanzarella, C.; Antoccia, A. Combretastatin A-4 Induces P53 Mitochondrial-Relocalisation Independent-Apoptosis in Non-Small Lung Cancer Cells. Cell Biol Int 2014, 38, 296–308. [Google Scholar] [CrossRef] [PubMed]
- Bar-On, O.; Shapira, anit; Hershko, D.D. Anti-Cancer Drugs; Wolters Kluwer Health | Lippincott Williams & Wilkins, 2007, 18.
- Park, D.; Jeong, H.; Lee, M.N.; Koh, A.; Kwon, O.; Yang, Y.R.; Noh, J.; Suh, P.G.; Park, H.; Ryu, S.H. Resveratrol Induces Autophagy by Directly Inhibiting MTOR through ATP Competition. Sci Rep 2016, 6. [Google Scholar] [CrossRef] [PubMed]
- Pettersen, E.F.; Goddard, T.D.; Huang, C.C.; Meng, E.C.; Couch, G.S.; Croll, T.I.; Morris, J.H.; Ferrin, T.E. UCSF ChimeraX: Structure Visualization for Researchers, Educators, and Developers. Protein Science 2021, 30, 70–82. [Google Scholar] [CrossRef] [PubMed]
- Frisch, M.J.; Trucks, G.W.; Schlegel, H.B.; Scuseria, G.E.; Robb, M.A.; Cheeseman, J.R.; Scalmani, G.; Barone, V.; Petersson, G.A.; Nakatsuji, H.; Li, X.; et al. Gaussian˜16 Revision C.01, 2016. Gaussian Inc. Wallingford CT.
- Case, D.A.; Aktulga, H.M.; Belfon, K.; Ben-Shalom, I.Y.; Berryman, J.T.; Brozell S.R.; Cerutti, D.S.; Cheatham, T.E.; III; Cisneros, G.A.; Cruzeiro, V.W.D.; et al. AMBER 2023. University of California, San Francisco, CA, 20323.
- Maier, J.A.; Martinez, C.; Kasavajhala, K.; Wickstrom, L.; Hauser, K.E.; Simmerling, C. Ff14SB: Improving the Accuracy of Protein Side Chain and Backbone Parameters from Ff99SB. J Chem Theory Comput 2015, 11, 3696–3713. [Google Scholar] [CrossRef] [PubMed]
- Wang, J.; Wolf, R.M.; Caldwell, J.W.; Kollman, P.A.; Case, D.A. Development and Testing of a General Amber Force Field. J Comput Chem 2004, 25, 1157–1174. [Google Scholar] [CrossRef] [PubMed]
- Onufriev, A. V.; Izadi, S. Water Models for Biomolecular Simulations. Wiley Interdiscip Rev Comput Mol Sci 2018, 8, e1347. [Google Scholar] [CrossRef]
- Miller, B.R.; McGee, T.D.; Swails, J.M.; Homeyer, N.; Gohlke, H.; Roitberg, A.E. MMPBSA.Py: An Efficient Program for End-State Free Energy Calculations. J Chem Theory Comput 2012, 8, 3314–3321. [Google Scholar] [CrossRef] [PubMed]
- Ben-Shalom, I.Y.; Pfeiffer-Marek, S.; Baringhaus, K.H.; Gohlke, H. Efficient Approximation of Ligand Rotational and Translational Entropy Changes upon Binding for Use in MM-PBSA Calculations. J Chem Inf Model 2017, 57, 170–189. [Google Scholar] [CrossRef] [PubMed]
- Genheden, S.; Ryde, U. Comparison of the Efficiency of the LIE and MM/GBSA Methods to Calculate Ligand-Binding Energies. J Chem Theory Comput 2011, 7, 3768–3778. [Google Scholar] [CrossRef] [PubMed]
- Hou, T.; Wang, J.; Li, Y.; Wang, W. Assessing the Performance of the MM/PBSA and MM/GBSA Methods. 1. The Accuracy of Binding Free Energy Calculations Based on Molecular Dynamics Simulations. J Chem Inf Model 2011, 51, 69–82. [Google Scholar] [CrossRef] [PubMed]
- Roe, D.R.; Cheatham, T.E. PTRAJ and CPPTRAJ: Software for Processing and Analysis of Molecular Dynamics Trajectory Data. J Chem Theory Comput 2013, 9, 3084–3095. [Google Scholar] [CrossRef]
Disclaimer/Publisher’s Note: The statements, opinions and data contained in all publications are solely those of the individual author(s) and contributor(s) and not of MDPI and/or the editor(s). MDPI and/or the editor(s) disclaim responsibility for any injury to people or property resulting from any ideas, methods, instructions or products referred to in the content. |
© 2023 by the authors. Licensee MDPI, Basel, Switzerland. This article is an open access article distributed under the terms and conditions of the Creative Commons Attribution (CC BY) license (http://creativecommons.org/licenses/by/4.0/).
Copyright: This open access article is published under a Creative Commons CC BY 4.0 license, which permit the free download, distribution, and reuse, provided that the author and preprint are cited in any reuse.


