Submitted:
14 November 2023
Posted:
15 November 2023
You are already at the latest version
Abstract
Autonomous target recognition (ATR) plays a crucial role in maintaining situational awareness during environmental monitoring. Unmanned aerial vehicles (UAVs) equipped with autonomous target recognition technology can gather and analyze real-time information about targets, including their locations, sizes, and types. However, UAV-captured images in complex real-world environments often display significant variations in perspective and scale due to changes in UAV altitude and distance. Existing methods for autonomous target recognition on UAVs struggle to capture targets from large field-of-view and multi-scale images, resulting in low recognition accuracy and high false-positive rates.
This paper introduces two novel Slimmable neural network models, namely SE-YOLOv5s and ST-YOLOv5s, which are based on the YOLOv5s architecture. These models incorporate the Squeeze and Excitation and Swin-Transformer mechanisms to enhance the ability to extract features from large field-of-view and multi-scale images. To evaluate their performance, experiments were conducted on the Visdrone19 aerial dataset. Compared to the state-of-the-art YOLOv5s algorithm, the utilization of SE-YOLOv5s and ST-YOLOv5s for autonomous target recognition on low-altitude drones resulted in improvements in both accuracy and false-positive rates.
These proposed methods combine Slimmable neural network design with feature enhancement mechanisms, addressing the challenges posed by complex real-world environments in UAV missions. The advancements in autonomous target recognition on low-altitude drones will significantly contribute to enhancing situational awareness in future environmental monitoring.
Keywords:
Autonomous target recognition
; Unmanned aerial vehicles
; Slimmable Neural Network
; SE-YOLOv5s
; ST-YOLOv5s
0. Introduction
With the continuous progress of science and technology, monitoring equipment is developing towards informatization and intelligence, and unmanned platforms are widely used in environmental monitoring. For unmanned platforms, automatic target recognition technology is the key technology to realize situation awareness. At present, the UAV platform lacks autonomous ability in the process of environmental monitoring and relies heavily on communication links and ground terminals to realize information interaction [1]. Therefore, how to realize the autonomous detection and identification of aerial targets is the key to improving the autonomous situational awareness of UAVs [19]. Environmental information (mainly target image information) is collected and analyzed by the UAV airborne image sensor, and the acquired images and videos are preprocessed by the airborne computing platform, so that image feature extraction and target detection are realized on the UAV platform, which provides accurate support for further decision-making [20].
However, current Slimmable target recognition models have not fully addressed the independent operation of deep learning algorithms on onboard computing devices, which makes achieving true onboard detection challenging even if the algorithms perform well [22]. To overcome the limitations of computational capabilities on unmanned aerial vehicle (UAV) platforms, it is crucial to enrich methods for aerial target recognition and detection by introducing Slimmable neural networks and incorporating the Squeeze and Excitation (SE) and Swin-Transformer mechanisms. These enhancements strengthen the model’s adaptability to changes in perspective and scale, enabling it to possess stronger recognition capabilities [23]. Finally, comparative experiments using the publicly available VisDrone19 dataset have confirmed that both the SE-YOLOv5s and ST-YOLOv5s models outperform the YOLOv5s model in terms of performance [24]. Furthermore, experiments using actual aerial data have been conducted to validate the detection and recognition performance of the models on low-altitude UAV aerial imagery. The main contributions of this paper are as follows:
- The Squeeze and Excitation (SE) attention module [2] is introduced into the backbone network.
- The integration of the Swin Transformer and Transformer into the Neck network of YOLOv5s, combined with C3, allowing for accurate object localization in high-density scenes.
- Experimental validation using the VisDrone19 dataset demonstrating improved model accuracy, thereby proving that the enhanced model possesses higher autonomous object recognition capabilities.
1. Related Work
Before the application of deep learning techniques in the field of object detection and recognition, traditional algorithms primarily relied on image-based features [25]. These methods involved a combination of manually designed image features, sliding window approaches, and the classification algorithm Support Vector Machine (SVM) to achieve the task. The specific approach included manual feature extraction for object recognition, followed by regression algorithms for object localization to accomplish the detection and recognition tasks. Representative features included Histogram of Oriented Gradients (HOG) [3], Scale Invariant Feature Transform (SIFT) [5], and Harr-like features [6].
However, traditional object detection methods face several challenges in practical applications. Firstly, these methods rely on manually designed features, and the performance of the detection algorithm is solely dependent on the developer’s expertise, making it difficult to leverage the advantages of large-scale data. Secondly, the sliding window approach used in traditional detection algorithms involves exhaustive traversal of all possible object positions, resulting in high algorithm redundancy, computational complexity, and space complexity. As a result, traditional algorithms struggle to meet the requirements for high accuracy and real-time performance in practical applications. Furthermore, traditional detection algorithms only exhibit good detection performance for specific classes of objects.
Currently, deep learning-based object detection algorithms can be categorized into two main types based on the features of their network structures: the first type is the two-stage deep learning-based object detection algorithm [25], and the second type is the end-to-end deep learning-based object detection algorithm, also known as the one-stage object detection algorithm [26]. In comparison, two-stage object detection algorithms generally achieve higher accuracy than one-stage object detection algorithms. However, one-stage object detection algorithms often have higher recognition efficiency due to their unique structural characteristics. Figure 1 illustrates the development roadmap of object recognition algorithms in recent years.
The two-stage algorithm. Two-stage algorithms, also known as region-based object detection algorithms, follow a series of steps. Firstly, a large number of candidate regions are selected from the input image. Then, convolutional neural networks (CNNs) are utilized to extract features from each candidate region. Finally, a classifier is employed to determine the category of each candidate region. In 2014, Girshick proposed the R-CNN [8], which established the framework for two-stage object detection algorithms. This algorithm was the first to combine deep learning techniques with traditional object candidate region generation algorithms. However, R-CNN has clear drawbacks. In the first step, the algorithm generates approximately 2000 candidate regions from the image. Each candidate region undergoes CNN computations and is finally classified using an SVM, resulting in slow detection speed even with GPU acceleration. In 2015, He et al. addressed the limitations of R-CNN by proposing a new network architecture called SPP-Net [9]. SPP-Net calculates feature maps only once for the entire image and then gathers features within the regions of arbitrary sub-images, generating fixed-length feature representations. SPP-Net accelerated R-CNN testing by 10-100 times and reduced training time by three times. In the same year, Girshick integrated the idea of SPP-Net to design a new training algorithm called Fast R-CNN [10]. It overcame the drawbacks of R-CNN and SPP-Net while improving training speed and accuracy. Both R-CNN and Fast R-CNN employ traditional image processing algorithms to generate candidate regions from the original image, leading to high algorithmic complexity. To address these limitations, Chirshick et al. introduced Faster R-CNN [28], which employs a Region Proposal Network (RPN) to generate candidate regions and delegates the selection process to the neural network. This method significantly reduces the search time for candidate regions and achieves a detection accuracy of 75.9(%) on the PASCAL VOC test set. Subsequently, numerous improved algorithms for Faster R-CNN have emerged. Dai designed Region-based Fully Convolutional Networks (R-FCN) [2], and Ren demonstrated the importance of carefully designed deep networks for object classification and reconstructed Faster R-CNN using the latest ResNet backbone network [11].
The one-stage algorithm. The main characteristic of two-stage algorithms is that they divide the entire detection process into two stages: Region Proposal and Detection. Many researchers have continuously improved the structure of such algorithms by pruning redundant parts. However, the two-stage nature of the algorithm itself limits its speed. Therefore, researchers have been studying end-to-end one-stage algorithms, where the image only needs to be input into the neural network, and the position and category information of the objects in the image can be directly obtained at the output end. In 2016, Redmon et al. proposed the YOLO (You Only Look Once) algorithm. This algorithm divides the image into a grid of 7×7 cells, and each cell predicts rectangular bounding boxes containing objects and their respective class probabilities using deep CNN. Each bounding box contains five pieces of data: the coordinates of the center of the bounding box, its width, height, and the confidence score of the object. YOLO integrates object detection and recognition, avoiding the redundant steps of region proposal, making it advantageous in terms of fast detection speed, achieving up to 45 frames per second. Additionally, YOLO supports the detection of non-natural images. However, compared to previous detection algorithms, YOLO may produce more localization errors. Subsequently, Redmon drew inspiration from the idea of Faster R-CNN and introduced the anchor mechanism into the algorithm. By using K-means clustering, better anchor templates are computed from the training set, resulting in an improved version called YOLO9000. In 2018, the author further enhanced the YOLO algorithm and proposed the YOLOv3 method, which designed a novel multi-scale Darknet53 network architecture to improve the feature extraction capability of the model. In 2020, Bochkovskiy et al. continued to optimize the network model and built the YOLOv4 backbone network. By adopting the Cross-Stage Partial Network (CSPNet) idea and designing the CSPDarkNet backbone network, the transmission of convolutional neural network feature information was effectively improved. The YOLOv4 model also incorporated a spatial pyramid pooling module in the neck network to enhance its recognition performance.
YOLOv5 is an improved algorithm based on YOLOv4, which brings better accuracy and detection speed. Compared to YOLOv4, YOLOv5 reduces model size and inference time while improving detection accuracy. It exhibits faster training speed and better generalization ability, making it suitable for real-time object detection in modern applications. To make YOLOv5 applicable to a wider range of practical problems, the authors designed four different-sized models: YOLOv5s, YOLOv5m, YOLOv5l, and YOLOv5x [29]. Among them, YOLOv5x is the largest-scale network, offering the highest detection accuracy. However, its detection speed is relatively slower and it is more suitable for detection environments with higher hardware configurations. The performance comparison of the four models is shown in Table 1, where mAP represents the mean average precision measured on the COCO dataset.
By comparing the results, it was observed that although YOLOv5s exhibits a slight decrease in algorithmic accuracy, its detection speed increases significantly. Additionally, it has the smallest parameter size, making it more easily deployable on computationally limited onboard computing devices. Therefore, this study focuses on improving YOLOv5s to achieve better detection performance in scenarios such as small and densely packed objects in unmanned aerial imagery.
2. Model for Autonomous Target Recognition
Compared to general images, low-altitude aerial imagery offers a broader field of view and contains a larger number of objects within a single image [30]. Furthermore, small-scale objects are more prevalent in aerial imagery. Therefore, it is necessary to redesign the network architecture of the Slimmable YOLOv5s model to enhance its ability to detect small objects. This can be achieved by incorporating attention mechanisms and Swin-Transformer modules into the network structure, aiming to improve the network’s performance in detecting small objects in low-altitude aerial images.
2.1. Slimmable On-Board Target Recognition Neural Network SE-YOLOv5s
The effectiveness of convolutional neural networks (CNNs) in feature extraction can be significantly improved by introducing attention mechanisms [31]. To further enhance the performance, it is important to adjust the weighted sum of the feature maps to give more importance to attention features. The most effective approach to improving attention modules is to use trustworthy attention weights, which are allocated through global comparisons to enhance their reliability. Many attention modules employ a combination of local convolutions and limited receptive fields, which restricts the acquisition of global information and may not provide sufficient resources for subsequent tasks [32]. To explore richer global structural information, various methods of enhancing attention attempt to increase network depth or utilize larger convolutional kernels [34].
Various methods have been proposed to enhance the discriminative power of feature representations. One such method involves incorporating a residual module that consists of two consecutive global pooling layers, two fully connected layers, and a sigmoid activation function [35]. These modules are designed to output features at different scales. The Squeeze-and-Excitation Network (SENet) consists of two steps: squeeze and excitation. In the squeeze step, complex feature maps are globally averaged pooled to obtain compressed global feature descriptors for the current feature map. In the excitation step, a bottleneck structure is employed to capture channel-wise weights of the feature maps, which are then used as inputs to the next layer.
The feature maps are obtained through a series of convolutional and pooling operations. In traditional feature maps, each channel has the same importance [36]. However, different feature channels have varying importance in distinguishing between the target object and the background. Therefore, it is necessary to assign corresponding learnable weights to all feature channels of the mapped features to better differentiate between the target object and the background. By utilizing the importance weights of feature channels, the original values of features on each channel are multiplied by their respective importance weights to obtain the true mapped values on each channel. The principles and structures of the squeeze and excitation modules are illustrated in Figure 2, where different colors represent different importance levels of the channels.
is the input of the feature map, w and h are the width and height of the spatial channels, respectively. denotes the transformation operator responsible for mapping the input x to the next feature map. The feature compression is performed by compressing each two-dimensional feature channel into a one-dimensional vector, which has a global receptive field in . We use w in to generate weights for each feature channel, indicating the correlation between channels. The importance weights of the output channels after the operation from are scaled to match the weight tensor with the feature channels. Finally, the weight tensor is element-wise multiplied with the feature map to obtain a new feature map . The network structure of SENet is shown in Figure 3.
The SENet structure can be easily integrated into a regular convolutional neural network. It enhances the receptive field and improves the weighted feature channels associated with the target object during the feature extraction stage. This effectively suppresses the feature channels that are independent of the target object and enhances the semantic information in the feature maps. In SENet, the squeeze-and-excitation process consists of the following steps:
- After the input feature map is processed by the convolutional modules in SENet, a global average pooling operation is performed to obtain a sequence of M real numbers.
- The M-dimensional real-valued sequence is then fed into a fully connected layer, which reduces the dimensionality of the sequence to 1/r (where r is the reduction ratio). The fully connected layer applies the ReLU activation function to increase the number of channels and calculates the channel-wise weight coefficients using the sigmoid activation function.
- The weight coefficients are multiplied element-wise with the corresponding feature channels to update the feature map.
The Backbone of YOLOv5s exhibits strong feature mapping capabilities, which contribute to its excellent performance in the field of object detection. The Backbone consists of the Focus module and the CSP module. The slicing operation in the Focus module performs well during the transformation of multi-dimensional input image feature maps. The CSP module is responsible for reducing the computational complexity and memory consumption of the model. During training, the main and auxiliary paths can propagate forward and backward separately to improve information flow and gradient propagation. Additionally, the CSP module can reduce the number of network layers without compromising the feature representation, thereby improving model speed and computational efficiency. This paper introduces the SE (Squeeze-and-Excitation) attention mechanism. Since the Squeeze-and-Excitation mechanism enhances network expressiveness and receptive fields, it is more suitable to be introduced at higher network levels. Therefore, in the YOLOv5s model, the SELayer module is added to certain convolutional layers in the final stages of the Backbone network, improving the model’s performance and strengthening its feature representation capability in complex environments. The modified structure of the SE-YOLOv5s model with the SE integration is illustrated in Figure 4.
In this study, the SElayer module is introduced at different convolutional layer outputs in the backbone network. Specifically, we choose to place the SELayer module after BCSP1 in the main feature extraction network to achieve improved object detection and recognition performance.
2.2. Slimmable On-Board Target Recognition Neural Network ST-YOLOv5s
The Swin Transformer algorithm [16] implements a hierarchical Transformer by employing the Windows Multi-head Self-Attention (W-MSA) and Windows Shift Multi-head Self-Attention (WS-MSA) mechanisms. This enables it to extract multi-scale features from images, similar to how CNNs operate, thereby serving as a backbone network for tasks such as object detection and image segmentation. Swin Tiny (referred to as Swin-T) is a Swin-Transformer model with a computational complexity comparable to that of ResNet-50 [15]. Different layers in Swin Transformer can output features at varying scales, with parameters depicted in Figure 5, floating-point operations, and other metrics being largely similar.
The Swin-Transformer Block in Swin-T consists of two modules: the Window Multi-head Self-Attention (W-MSA) module and the Shifted Window Multi-head Self-Attention (SW-MSA) module. As shown in Figure 5, the information flows through the left module, which includes a Layer Norm layer, a W-MSA unit, a Multi-Layer Perceptron (MLP) layer, and skip connections, to perform window-based multi-head self-attention calculations. Subsequently, the information passes through the right module, which comprises a Layer Norm layer, a SW-MSA unit, an MLP layer, and skip connections, to carry out shifted window multi-head self-attention calculations. The input and output dimensions of both modules are consistent, and they are directly concatenated.
As shown in Figure 6, the Swin-T model consists of 2, 2, 6, and 2 Swin Transformer modules in stages 1 to 4, respectively, with downsampling factors of 4, 8, 16, and 32. To reduce the overall complexity of the system to an acceptable level, all pixels are treated as groups of pixel points, allowing for the representation of each pixel point with fewer nodes. For an input image (H, W, 3), the Patch Partition layer divides it into a grid of 4x4 patches, transforming the image data dimensions to (H/4, W/4, 48). The image data is then passed through the Linear Embedding layer, doubling the number of channels, resulting in dimensions of (H/4, W/4, 96). By adjusting the number of pixels at different layers, the speed of the entire system can be controlled. The Swin Transformer Block in C1 performs multi-head self-attention calculations based on a 7x7 window, extracting image features. The output feature map dimensions remain the same, i.e., (H/4, W/4, 96). Two separate models are trained using the same approach but at different times to improve detection accuracy. In the subsequent process, each Patch Merging layer divides the input feature map into 2x2 patches and doubles the number of channels, achieving downsampling of the feature map. The dimensions of the feature map are successively transformed to (H/8, W/8, 192), (H/16, W/16, 384), and (H/32, W/32, 768), similar to pooling operations in CNNs. The Swin-Transformer Block groups in C2, C3, and C4 are used solely for feature extraction from the image data and do not affect the dimensions of the feature map [12].
The Swin-T model utilizes a hierarchical Transformer module that enables feature extraction at different scales. Its sliding window strategy helps capture global contextual information in images, and the multi-head attention mechanism allows for learning task-relevant information in their respective representation subspaces [14]. The Swin-Transformer is a visual model based on the Transformer architecture, and the most similar aspect it shares with YOLOv5s is their backbone network structure used for object detection. If one intends to replace the Swin-Transformer with the backbone network structure in YOLOv5s, typically the replacement would take place in the backbone part of YOLOv5s. The default architecture of the YOLOv5s backbone network is CSPDarknet53, so the first step would involve removing the CSPDarknet53 backbone network structure and then replacing it with the Swin-Transformer.
Through model training, it was found that replacing the CSP backbone of YOLOv5s with Swin-T did not yield satisfactory results, with the best precision still not reaching 45(%). This analysis suggests that the modified model parameters increase, requiring longer training time, which poses greater difficulty for the aerial object detection and recognition dataset. A new approach is to combine Swin-T + C3. Ji Wen et al. achieved performance improvement in traffic sign detection tasks by using the combination of Swin-T and C3 [12]. C3 is a Slimmable feature extraction module capable of capturing high-level semantic information from images, while Swin-T can extract multiple feature maps at different scales. This combination enables Swin-T to better utilize the high-level semantic features extracted by C3 while improving the accuracy and efficiency of the model. The improved network structure is illustrated in Figure 7.
3. Experiment and analysis
The core part of this thesis is to elaborate the experimental design, experimental process and data analysis results in detail. This chapter will show our research methods and experimental progress, and draw research conclusions through in-depth analysis of experimental data. In this chapter, we will first introduce the purpose of the experiment, experimental equipment and materials, experimental methods and processes, and then record, organize and visualize the experimental data in detail. Finally, we will make an in-depth analysis of the experimental results and draw a conclusion. This chapter will fully demonstrate the reliability and accuracy of the research, and provide a solid foundation for subsequent discussions and conclusions.
3.1. Experimental preparation
This section mainly introduces the data, platform equipment, evaluation index and related preparation work. The purpose of this section is to ensure the smooth progress of the experiment and provide accurate and reliable data. First, we will list the experimental data used and explain its specifications. Secondly, we will describe in detail the preparation work before the experiment, including the control of laboratory environment, equipment specifications and so on. Through these detailed descriptions and preparations, we will lay a solid foundation for the subsequent experimental process and ensure the accuracy and repeatability of the experimental results.
3.1.1. Introduction of data
The dataset used in this study is the VisDrone19 aerial imagery dataset [13], which was collected and annotated by the AISKYEYE team at Tianjin University. It consists of a total of 8,599 aerial images, with 6,471 images in the training set, 1,580 images in the testing set, and 548 images in the validation set. Table 2 provides an overview of the basic statistics of the dataset.
The image data in the VisDrone19 dataset is collected from 14 cities in China and their surrounding areas. The images have varying resolutions, ranging from 480 pixels × 360 pixels to 2000 pixels × 1500 pixels [17]. The dataset includes several object categories, including people, pedestrians, cars, trucks, vans, buses, tricycles, motorcycles, and bicycles. The dataset contains a wide range of image scales and varying levels of aerial object density. Additionally, it encompasses aerial images captured in different urban settings during both daytime and nighttime scenes.
3.1.2. Experimental platform
This experiment primarily focuses on evaluating the object detection and recognition performance of the YOLOv5s network model under different improvement strategies using the VisDrone19 dataset. The VisDrone19 dataset contains a large volume of image data, making the training time for the model considerably long. Therefore, it requires a certain level of computational resources. In this experiment, both a personal laptop and the AutoDL cloud server platform were utilized for training and testing the network model. The training environment details are presented in Table 3.
The test environment of the experiment is shown in Table 4.
3.1.3. Evaluating Indicator
The evaluation metrics for algorithms can be categorized into two aspects. Firstly, the accuracy of the algorithm is commonly assessed using precision (P) and recall (R), which refer to the measures of precision and recall rate, respectively. Precision represents the ability of the algorithm to correctly identify positive instances, while recall measures the algorithm’s ability to identify all positive instances. Secondly, the real-time performance of the algorithm is evaluated. The spatial complexity of the model is typically assessed using parameters (Params) to evaluate the model’s space complexity. The time complexity of the algorithm is evaluated using the number of floating-point operations per second (GFLOPs), and the detection speed of the model is measured using frames per second (FPS).
The accuracy evaluation of target detection and recognition is different from the label prediction of machine learning. How to evaluate whether the prediction frame is accurate or not, the threshold of Intersection over Union (IOU) is introduced here to evaluate. IOU indicates the intersection ratio and union area of the dimension box and the prediction box. Both accuracy and recall are based on IOU formula. The specific calculation formula is as follows:
Among them, TP (True Positives) means that the prediction frame is consistent with the labeling frame, that is , FP means that the detection frame is labeled on the wrong object, and TN (True Negatives) means that the target is not detected. In addition, the Average Precision (AP) and the average precision (mAP) are usually used. mAP is calculated by calculating the AP value of each category and then averaging. The specific calculation formula is as follows:
In order to evaluate the real-time performance of the algorithm, it is necessary to calculate the parameters, calculation and detection speed of the network model. The parameters are mainly calculated by the parameters of each layer, the convolution kernel size (,), the number of network channels () and the number of output channels (), and the specific formula is as follows:
The calculation amount GFLOPs indicates that the computer can perform one billion floating-point operations per second, and the calculation formula of BFLOPs is:
The detection speed is measured by FPS, that is, the number of pictures that can be detected per second. The higher the FPS, the faster the detection speed of the algorithm.
3.2. Model Training and Evaluation Based on Visdrone19 Aerial Data
In order to conduct ablation experiments, different training models set the same training parameters. The image size at the input end of the network is 640pixel×640pixel. In terms of training parameter setting, batch-size is set to 8, epoch is set to 300, and the initial learning rate is set to 0.01 by default. The unique data enhancement method in YOLOv5s structure and cosine annealing attenuation algorithm are adopted to optimize the parameters.
In order to analyze the influence of introducing SE attention mechanism and improving the network based on Swin-Transformer on aerial target detection, the network models of SE-YOLOv5s and ST-YOLOv5s are trained with VisDrone19, and the convergence curve of model training is shown in Figure 8.
By analyzing the convergence curves of accuracy, mAP and recall of YOLOv5s, SE-YOLOv5s and ST-YOLOv5s on the verification set, it can be seen that the training amount of the three models is not much different, and they all converge in 100 epoch. Visualize the changes of parameters such as mAP, Precision and Recall obtained by the three algorithms in the training process, and it is obvious that SE-YOLOv5s and ST-YOLOv5s have obviously improved YOLOv5s on mAP and Recall. This is because SE module can enhance the features of small target images, and Swin-Transformer’s multi-head attention mechanism and feature pyramid structure can make it stand out in aerial target detection. There are often various types of small targets in aerial images, and Swin-Transformer can detect and identify these different types of small targets.
The experimental results of various algorithm models on VisDrone19 test set are shown in Table 5, and the comparison of the accuracy of different algorithms is shown.
Through the experimental results, it can be found that after adding attention mechanism and Transformer module to YOLOv5s, the mAP of target detection has been improved to some extent, and the improvement effect of SE-YOLOv5s is the most obvious, with an increase of 2.1%. In terms of accuracy, the lifting effect of SE-YOLOv5s is better than that of ST-YOLOv5s, with an increase of 4.3%. The recall rates of the three algorithms are close.
As can be seen from Table 6, after SE-YOLOv5 joined the SElayer module, although the weight of each channel was dynamically calculated through Squeeze operation and Excitation operation, and the features related to the target task were enhanced, the accuracy of the algorithm was effectively improved, but at the cost of increasing the network computation, SE-YOLO V5 and ST-YOLO V5 sacrificed 20.3FPS and 24.5FPS respectively. However, there is no excessive loss in the parameter quantity and size of the algorithm model, so compared with the complex YOLOv5 model, it achieves the goal of Slimmable. The model parameters of various neural networks trained on VisDrone19 test set are shown in the following table.
Compared with YOLOv5s training model, the FPS of SE-YOLOv5s and ST-YOLOv5s neural network models is smaller, and the theoretical model size and calculation amount are similar, which takes a little longer.
A typical example of different algorithms detecting on VisDrone data set is shown in Figure 9. It can be found that, compared with the basic YOLOv5s, the two improved algorithms have higher detection rate for small targets, and YOLOv5s has not detected the vehicles in the service area. However, the false detection rate of ST-YOLOv5s is higher than that of SE-YOLOv5s. As can be seen from the Figure 9, ST-YOLOv5s recognizes the gas station as a Truck. For the detection example, we can intuitively feel that the size of the target in the aerial image is closely related to the flight altitude. When the UAV flies to a certain height, the captured image contains more information, and the target becomes difficult to observe. For example, to detect the Car at the gas station in Figure 9, the field of vision needs to be focused on a smaller range. Therefore, neural network is required to have a good receptive field. Comparing the detection results of the above three algorithms, it is found that the detection effect of SE-YOLOv5s is better than the other two algorithms for long-distance small targets with smaller visual field, which shows that SE-YOLOv5s has better receptive field than the other two neural networks.
A typical example of different algorithms to detect and identify targets for images taken from various perspectives in VisDrone dataset is shown in Figure 9. Comparing the images taken from different perspectives, it can be seen that the available features of the target in aerial images are closely related to the perspective. When the drone flies directly above the target, most of the targets in the captured images have global features, but some targets only include local features. For example, it is difficult to observe the whole picture of the objects at the edge of the image because they are partially occluded. Therefore, neural network is required to extract multi-scale features and identify targets by using local features.
As can be seen from Figure 9, YOLOv5s did not detect two kinds of targets, namely bicycles and motorcycles, and the detection effects of ST-YOLOv5s and SE-YOLOv5s in the image detection of head-up shooting angle were similar. Overlooking Angle For the target at the edge of the image, SE-YOLOv5 failed to detect it because of occlusion. Compared with SE-YOLOv5s, ST-YOLOv5s can detect more objects at the edge of the image and partially blocked because it can extract not only global features but also local features.
4. Summary and future research
This paper investigates target detection and recognition for low-altitude unmanned aerial vehicles (UAVs). It analyzes the principles of existing target detection algorithms specifically designed for low-altitude UAVs. Building upon this analysis, in order to deploy target detection and recognition algorithms into the close-range situational awareness systems of UAVs, improvement strategies are proposed by incorporating SE (Squeeze-and-Excitation) mechanism and Swin-Transformer module. The SE-layer is connected to the CSP output end of the backbone, and the Swin-Transformer is combined with the C3 layer in the Neck network. Experimental evaluations are conducted on the publicly available VisDrone19 dataset, comparing the performance of the YOLOv5s baseline model with the two improved models while maintaining consistency in input parameters. The trained models are verified and compared through comprehensive analysis. The results on the validation set of VisDrone19 demonstrate that both SE-YOLOv5s and ST-YOLOv5s outperform YOLOv5s in terms of accuracy for detecting and recognizing targets in low-altitude aerial images captured by UAVs, albeit with a slight increase in computational complexity. However, this study does not adequately address the issue of deploying the algorithm for real-time detection on UAV platforms. Future research directions should focus on further improving the model’s accuracy based on Slimmable models or exploring Slimmable techniques for large-scale deep neural networks.
Author Contributions
Conceptualization, K.-Q.Y.; methodology, B.L. and X.-Q.Z.; software, K.-Q.Y. and C.-Z.S.; validation, K.-Q.Y. and J.-Y.W.; formal analysis, K.-Q.Y. and B.L.; investigation, C.-Z.S. and J.-Y.W.; resources, B.L. and J.-Y.W.; writing—original draft preparation, K.-Q.Y.; writing—review and editing, B.L. and X.-Q.Z.; visualization, J.-Y.W.; supervision, B.L. and X.-Q.Z.. All authors have read and agreed to the published version of the manuscript.
Funding
This research received no external funding
Conflicts of Interest
The authors declare no conflict of interest.
Abbreviations
The following abbreviations are used in this manuscript:
| ATR | Autonomous target recognition |
| UAV | Unmanned aerial vehicles |
| SE | Squeeze and Excitation |
| SVM | Support Vector Machine |
| HOG | Histogram of Oriented Gradients |
| SIFT | Scale Invariant Feature Transform |
| CNNs | Convolutional Neural Networks |
| RPN | Region Proposal Network |
| R-FCN | Region-based Fully Convolutional Networks |
| CSPNet | Cross-Stage Partial Network |
| SENet | Squeeze-and-Excitation Network |
| W-MSA | Windows Multi-head Self-Attention |
| WS-MSA | Windows Shift Multi-head Self-Attention |
| MLP | Multi-Layer Perceptron |
| FPS | Frames Per Second |
| GFLOPs | Floating-point Operations Per Second |
| IOU | Intersection over Union |
| AP | Average Precision |
References
- Hu Y, Xu Z Q, Liu W J, et al. Drone Object Recognition Based on RetinaNet[J]. Modern Computer, 2021: 66-74.
- Dai J F, Li Y, He K M, et al. R-FCN: Object Detection via Region-based Fully Convolutional Networks[C]. 30th Conference on Neural Information Processing Systems (NIPS), 2017.
- Dalal N, Triggs B. Histograms of oriented gradients for human detection[C]. Conference on Computer Vision and Pattern Recognition, 2005: 886-893.
- Zhang, Honghai;Wu, Shixin;Feng, Ouge;Tian, Tian;Huang, Yuting;Zhong, Gang.Research on Demand-Based Scheduling Scheme of Urban Low-Altitude Logistics UAVs[J].APPLIED SCIENCES-BASEL,2023,Vol.13(9): 5370.
- Lowe D, G. Object recognition from local scale-invariant features[J]. Proceedings of the Seventh IEEE International Conference on Computer Vision, 1999, 2: 1150-1157 vol.2.
- Papageorgiou C, Oren M, Poggio T A. A general framework for object detection[J]. Sixth International Conference on Computer Vision (IEEE Cat. No.98CH36271), 1998: 555-562.
- Research on Deep Learning in the Era of Big Data[J]. High Technology Letters, 2017, 27: 27-37.
- Girshick R, Donahue J, Darrell T, et al. Rich feature hierarchies for accurate object detection and semantic segmentation[C]. 27th IEEE Conference on Computer Vision and Pattern Recognition (CVPR), 2014: 580-587.
- He K M, Zhang X Y, Ren S Q, et al. Spatial Pyramid Pooling in Deep Convolutional Networks for Visual Recognition[J]. Ieee Transactions on Pattern Analysis and Machine Intelligence, 2015, 37(9): 1904-1916.
- Girshick R, Ieee. Fast R-CNN[C]. IEEE International Conference on Computer Vision, 2015: 1440-1448.
- Ren S Q, He K M, Girshick R, et al. Object Detection Networks on Convolutional Feature Maps[J]. Ieee Transactions on Pattern Analysis and Machine Intelligence, 2017, 39(7): 1476-1481.
- Redmon J, Divvala S, Girshick R, et al. You Only Look Once: Unified, Real-Time Object Detection[C]. 2016 IEEE Conference on Computer Vision and Pattern Recognition (CVPR), 2016: 779-788.
- Redmon J, Farhadi A, Ieee. YOLO9000: Better, Faster, Stronger[C]. 30th IEEE/CVF Conference on Computer Vision and Pattern Recognition (CVPR), 2017: 6517-6525.
- Redmon J, Farhadi A. Yolov3: An incremental improvement[J]. arXiv preprint. arXiv:1804.02767, 2018.
- Bochkovskiy A, Wang C-Y, Liao H-Y M. YOLOv4: Optimal Speed and Accuracy of Object Detection[J]. ArXiv, 2020, abs/2004.10934.
- He K M, Gkioxari G, Dollar P, et al. Mask R-CNN[C]. 16th IEEE International Conference on Computer Vision (ICCV), 2017: 2980-2988.
- Liu W, Anguelov D, Erhan D, et al. SSD: Single Shot MultiBox Detector[C]. 14th European Conference on Computer Vision (ECCV), 2016: 21-37.
- K.R., Akshatha;A.K., Karunakar;B., Satish Shenoy;K., Phani Pavan;Dhareshwar, Chinmay V;Johnson, Dennis George.Manipal-UAV person detection dataset: A step towards benchmarking dataset and algorithms for small object detection.[J].ISPRS Journal of Photogrammetry & Remote Sensing,2023,Vol.195: 77-89.
- Yu Zhang;Yan Zhang;Ruigang Fu;Zhiguang Shi;Jinghua Zhang;Di Liu;Jinming Du.Learning Non-local Quadrature Contrast for Detection and Recognition of Infrared Rotary-wing UAV Targets in Complex Background[J].IEEE Transactions on Geoscience and Remote Sensing,2022,Vol.60: 1.
- Kevin, W. Tong;Jie Wu;Yu-Hong Hou.Robust Drogue Positioning System Based on Detection and Tracking for Autonomous Aerial Refueling of UAVs[J].IEEE Transactions on Automation Science and Engineering,2023,: 1.
- Jian Yang;Yang Hu;Zhuliang Yu;Fangzhou Chen;Xiao Xu.In-Depth Coordination and Extension: Decentralized Onboard Conflict Resolution of UAVs in the Low Altitude Airspace[J].IEEE Transactions on Intelligent Vehicles,2023,: 1-14.
- He, Chunqian;Li, Dongsheng;Wang, Siqi.A lightweight convolutional neural network model for target recognition[J].Journal of Physics: Conference Series,2020,Vol.1651(1): 012138.
- Lento Manickathan;Claudio Mucignat;Ivan Lunati.A lightweight neural network designed for fluid velocimetry[J].Experiments in Fluids,2023,Vol.64(10).
- Zhe, Geng; Hai, Deng; Himed, B. Ground Moving Target Detection Using Beam-Doppler Image Feature Recognition[J].IEEE Transactions on Aerospace and Electronic Systems,2018,Vol.54(5): 2329-2341.
- Cong Liu;Yunqing Liu;Qiong Zhang;Xiaolong Li;Tong Wu;Qi Li.A two-stage classification algorithm for radar targets based on compressive detection[J].EURASIP Journal on Advances in Signal Processing,2021,Vol.2021(1): 1-15.
- Fei Lu;Fei Xie;Shibin Shen;Jiquan Yang;Jing Zhao;Rui Sun;Lei Huang.The One-Stage Detector Algorithm Based on Background Prediction and Group Normalization for Vehicle Detection[J].Applied Sciences,2020,Vol.10(5883): 5883.
- Jianwei Li;Zhentao Yu;Lu Yu;Pu Cheng;Jie Chen;Cheng Chi.A Comprehensive Survey on SAR ATR in Deep-Learning Era[J].Remote Sensing,2023,Vol.15(1454): 1454.
- Xintao Ding;Qingde Li;Yongqiang Cheng;Jinbao Wang;Weixin Bian;Biao Jie.Local keypoint-based Faster R-CNN[J].Applied Intelligence,2020,Vol.50(10): 3007-3022.
- Mohammed Abdul Jaleel Maktoof;Israa Tahseen Ali Alattar;Ibraheem Nadher Ibraheem.Comparison YOLOv5 Family for Human Crowd Detection[J].International Journal of Online and Biomedical Engineering,2023,Vol.19(4).
- Danilo Avola;Luigi Cinque;Angelo Di Mambro;Anxhelo Diko;Alessio Fagioli;Gian Luca Foresti;Marco Raoul Marini;Alessio Mecca;Daniele Pannone.Low-Altitude Aerial Video Surveillance via One-Class SVM Anomaly Detection from Textural Features in UAV Images[J].Information,2022,Vol.13(2): 2.
- Jiahao Luo;Fang Zhou;Jun Yang;Mengdao Xing.DAFCNN: A Dual-Channel Feature Extraction and Attention Feature Fusion Convolution Neural Network for SAR Image and MS Image Fusion[J].Remote Sensing,2023,Vol.15(12): 3091.
- Xingqing Nie;Xiaogen Zhou;Zhiqiang Li;Luoyan Wang;Xingtao Lin;Tong Tong.LogTrans: Providing Efficient Local-Global Fusion with Transformer and CNN Parallel Network for Biomedical Image Segmentation[A].2022 IEEE 24th Int Conf on High Performance Computing & Communications; 8th Int Conf on Data Science & Systems; 20th Int Conf on Smart City; 8th Int Conf on Dependability in Sensor, Cloud & Big Data Systems & Application (HPCC/DSS/SmartCity/DependSys)[C],2022.
- Won Joon Yun;Yunseok Kwak;Hankyul Baek;Soyi Jung;Mingyue Ji;Mehdi Bennis;Jihong Park;Joongheon Kim.SlimFL: Federated Learning With Superposition Coding Over Slimmable Neural Networks[J].IEEE/ACM Transactions on Networking,2022,: 1-16.
- Duan Huang,;YanTing Xiong,;Zhuangzhuang Xing,;and Qi Zhang.Implementation of energy-efficient convolutional neural networks based on kernel-pruned silicon photonics[J].Optics Express,2023,Vol.31(16): 25865-25880.
- Zaiyu Pan;Jun Wang;Zhengwen Shen;Shuyu Han.Disentangled Representation and Enhancement Network for Vein Recognition[J].IEEE Transactions on Circuits and Systems for Video Technology,2023,Vol.33(8): 1.
- WU Xiaoli, WEI Wentao, CALDWELL Sabrina, XUE Chengqi, WANG Linlin.Optimization method for a radar situation interface from error-cognition to information feature mapping[J].Journal of Systems Engineering and Electronics,2022,Vol.33(4): 924-937.
Figure 1.
This is a flow chart showing the development of target detection and recognition algorithms. It started with VJ Det algorithm in 2001 and ended with YOLOv5 algorithm in 2021. Later, it is divided into the one-stage target detection and recognition algorithm and two-stage target detection and recognition algorithm.
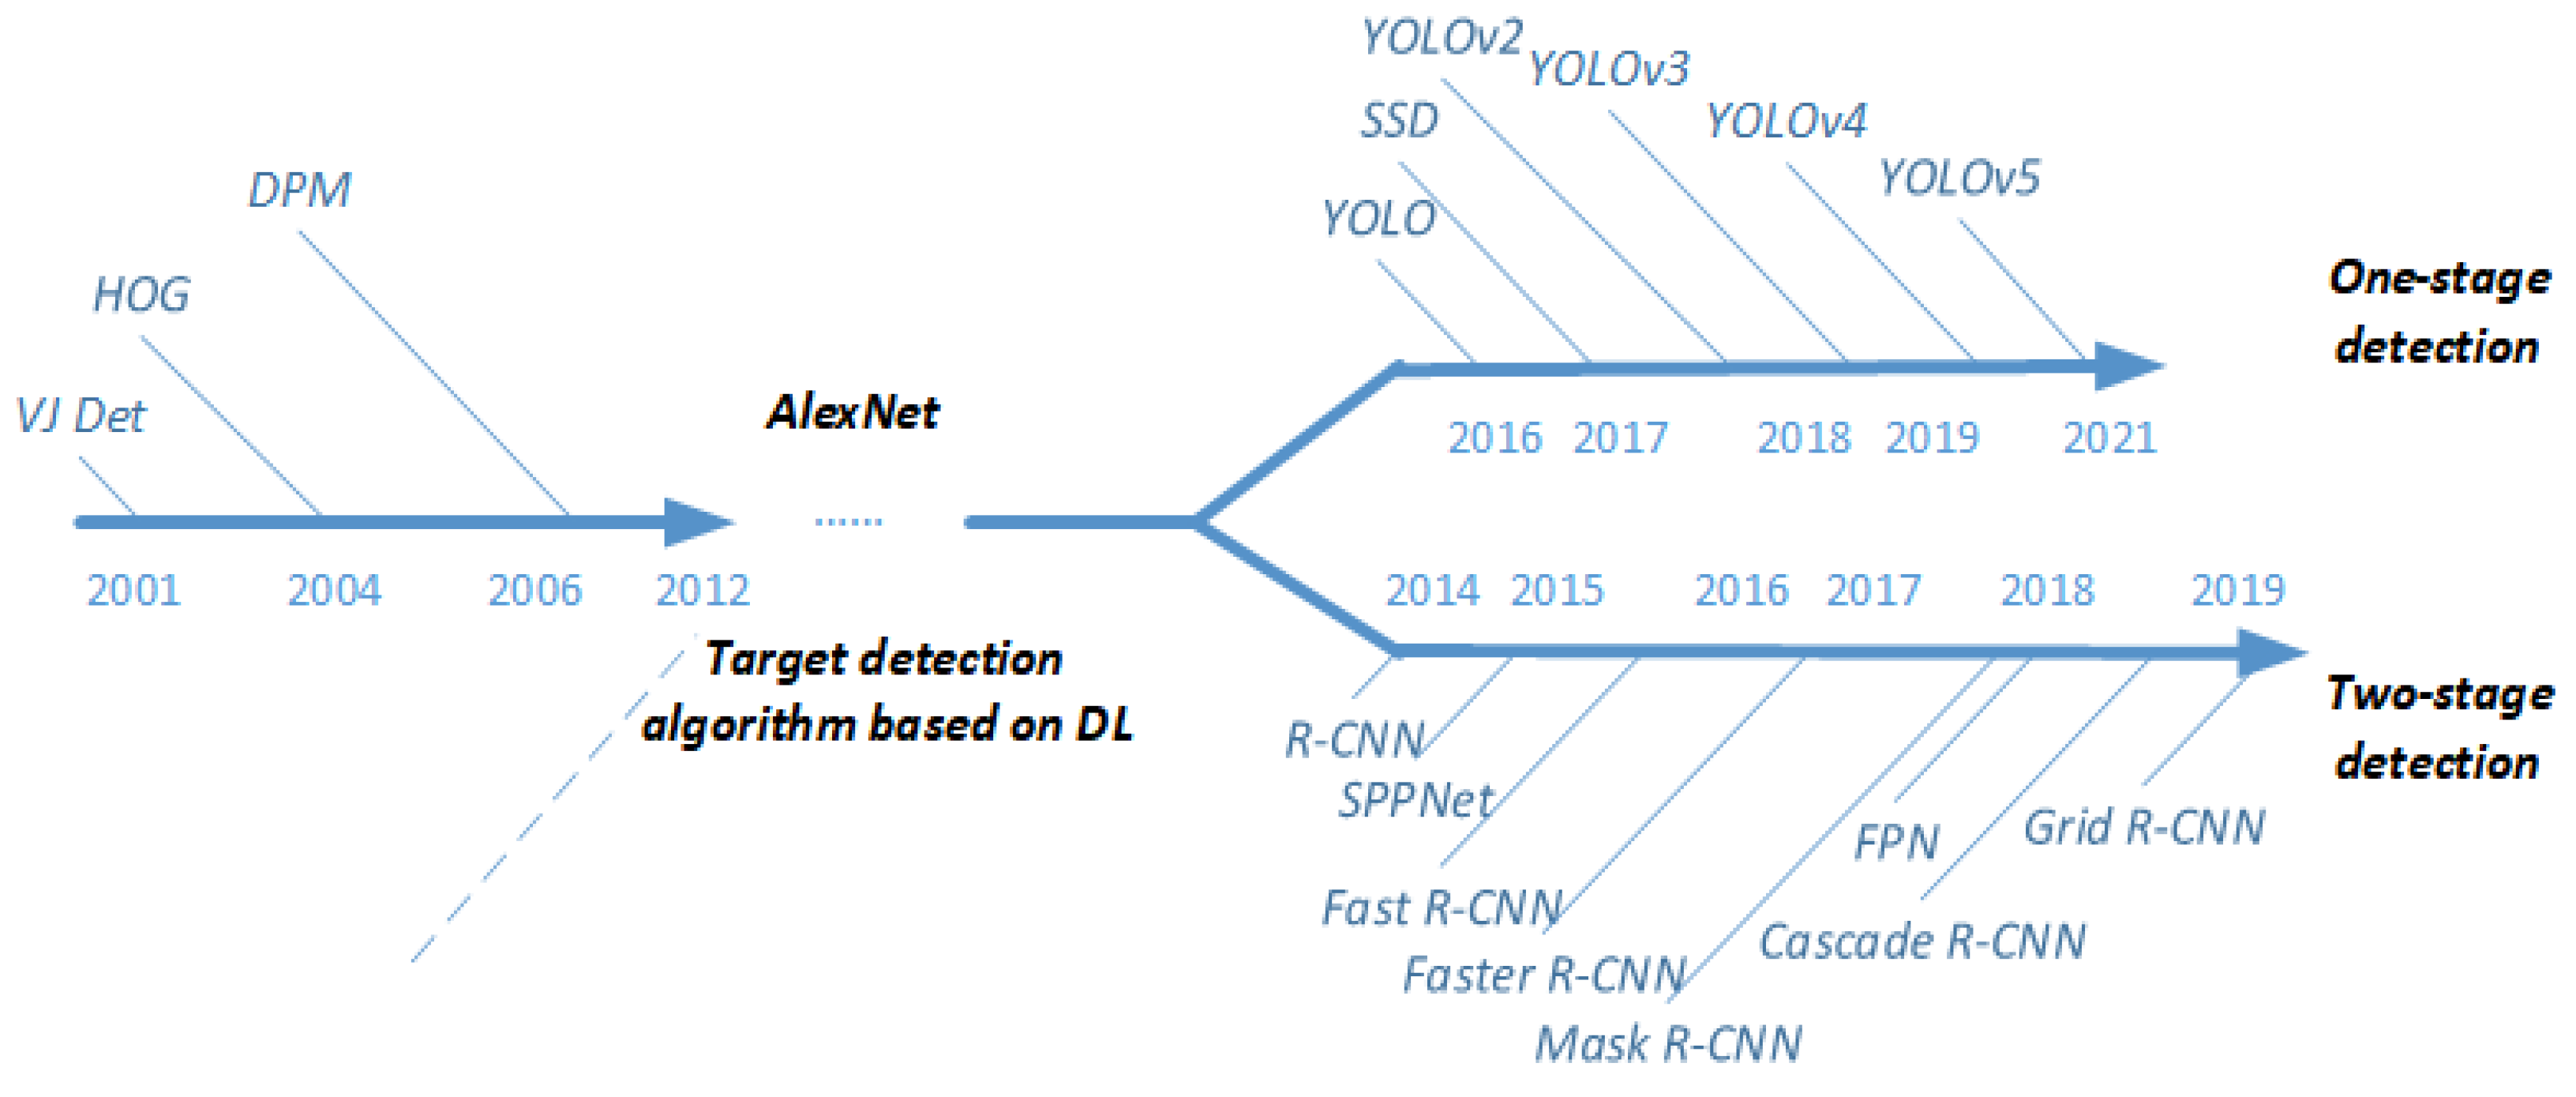
Figure 2.
This is a diagram showing the experimental principle and structure of SE model. The structure of SE model mainly includes two parts: Squeeze and Excitation. The working principle is to enhance the performance of the model by strengthening the channel features of the input feature map.
Figure 2.
This is a diagram showing the experimental principle and structure of SE model. The structure of SE model mainly includes two parts: Squeeze and Excitation. The working principle is to enhance the performance of the model by strengthening the channel features of the input feature map.
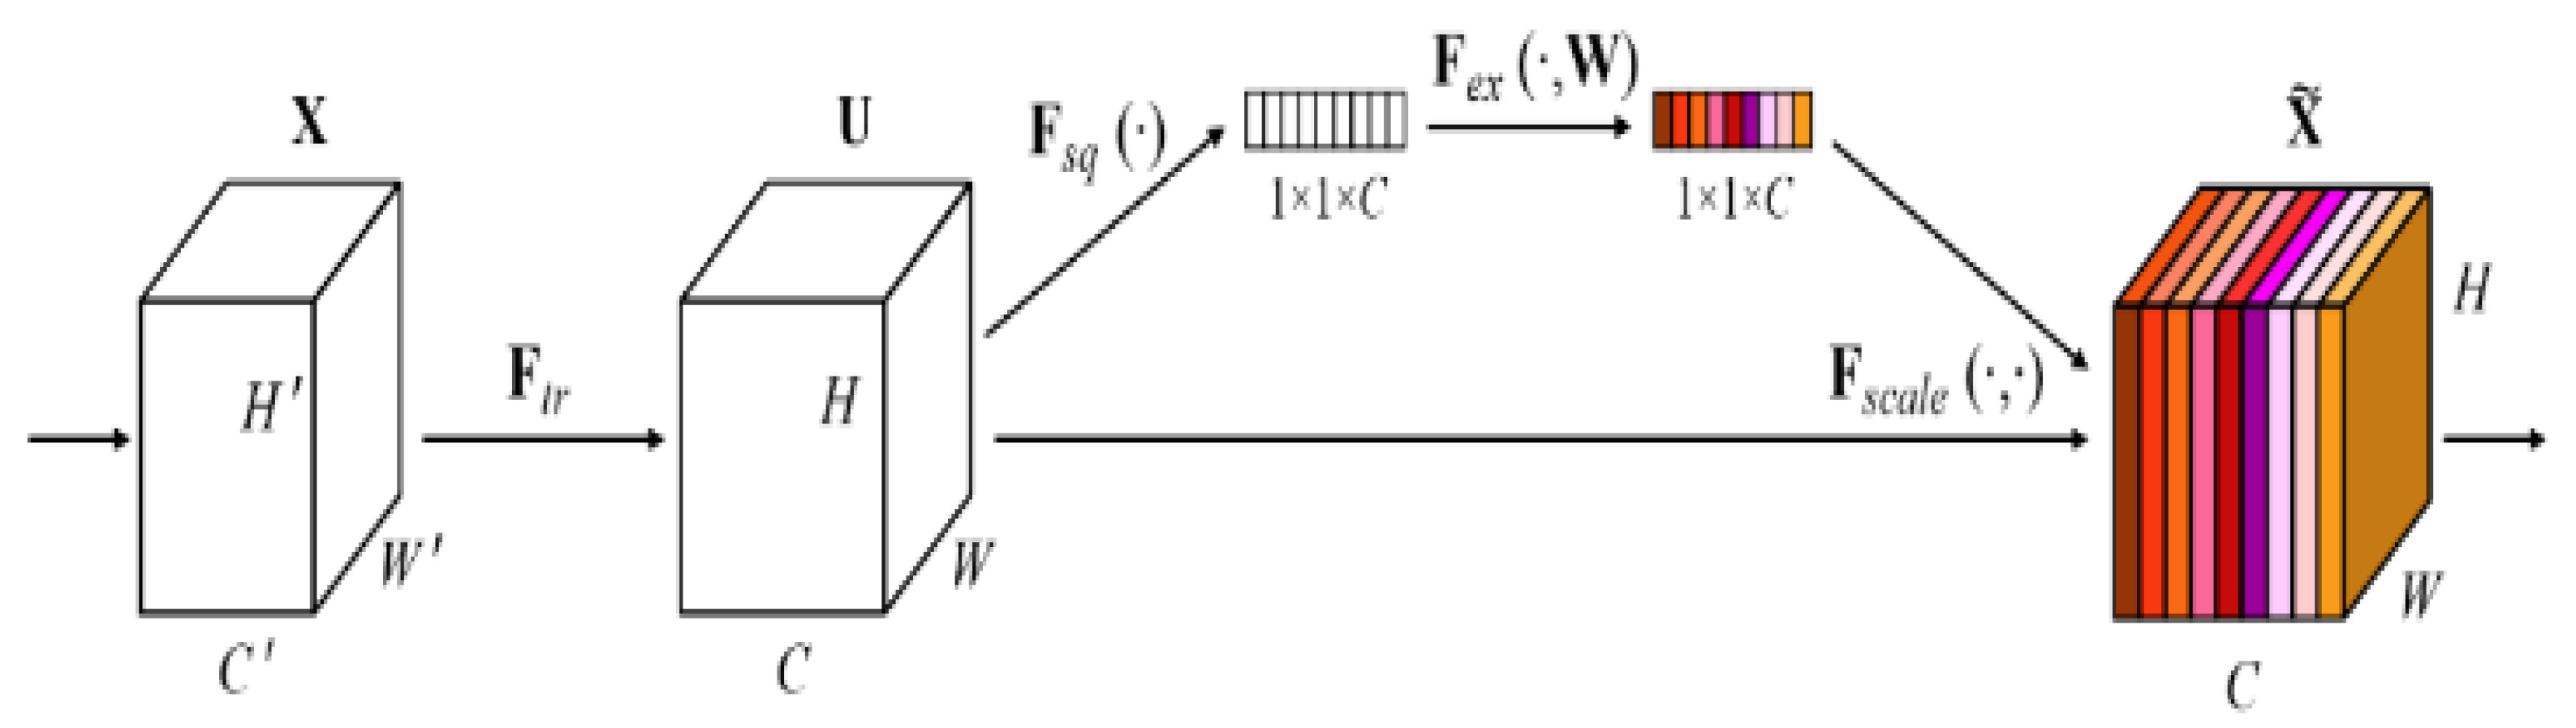
Figure 3.
This is a workflow diagram representing the SENet model. By introducing SE module to enhance the perception of features, the performance of the model is improved, which is mainly used in image classification tasks.
Figure 3.
This is a workflow diagram representing the SENet model. By introducing SE module to enhance the perception of features, the performance of the model is improved, which is mainly used in image classification tasks.
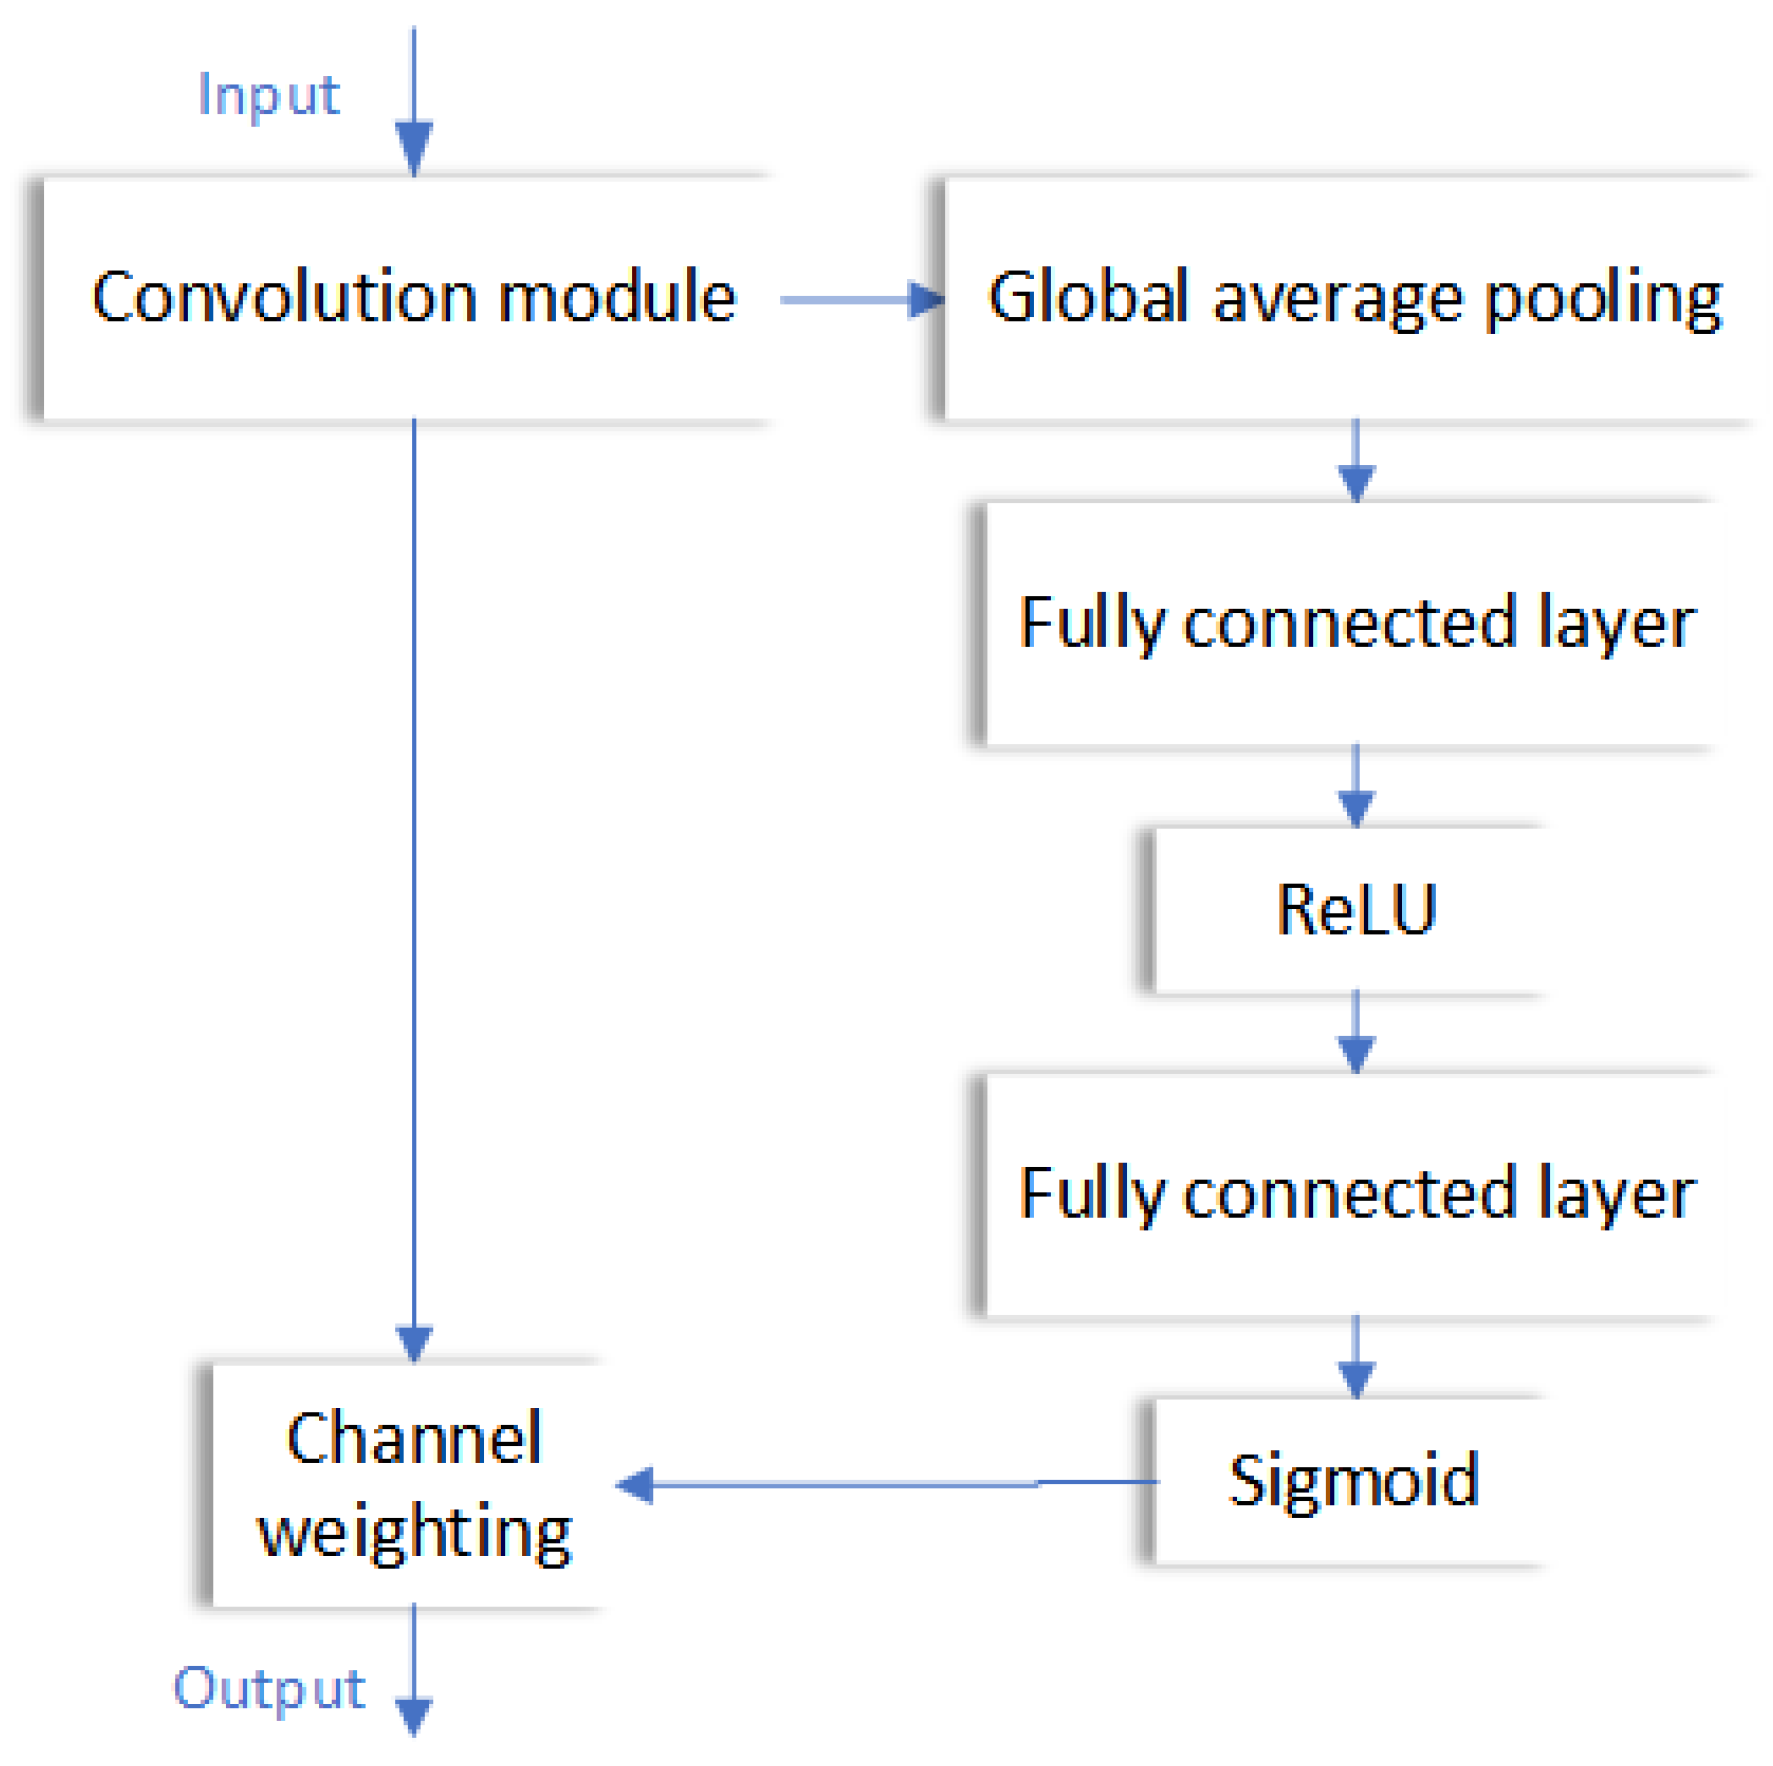
Figure 4.
This is a representation of the improved SE-YOLOv5s model workflow and schematic diagram. By introducing SE-Layer module improves the performance of target detection and recognition. It can increase the attention of the model and make the model pay more attention to the key areas of the image.
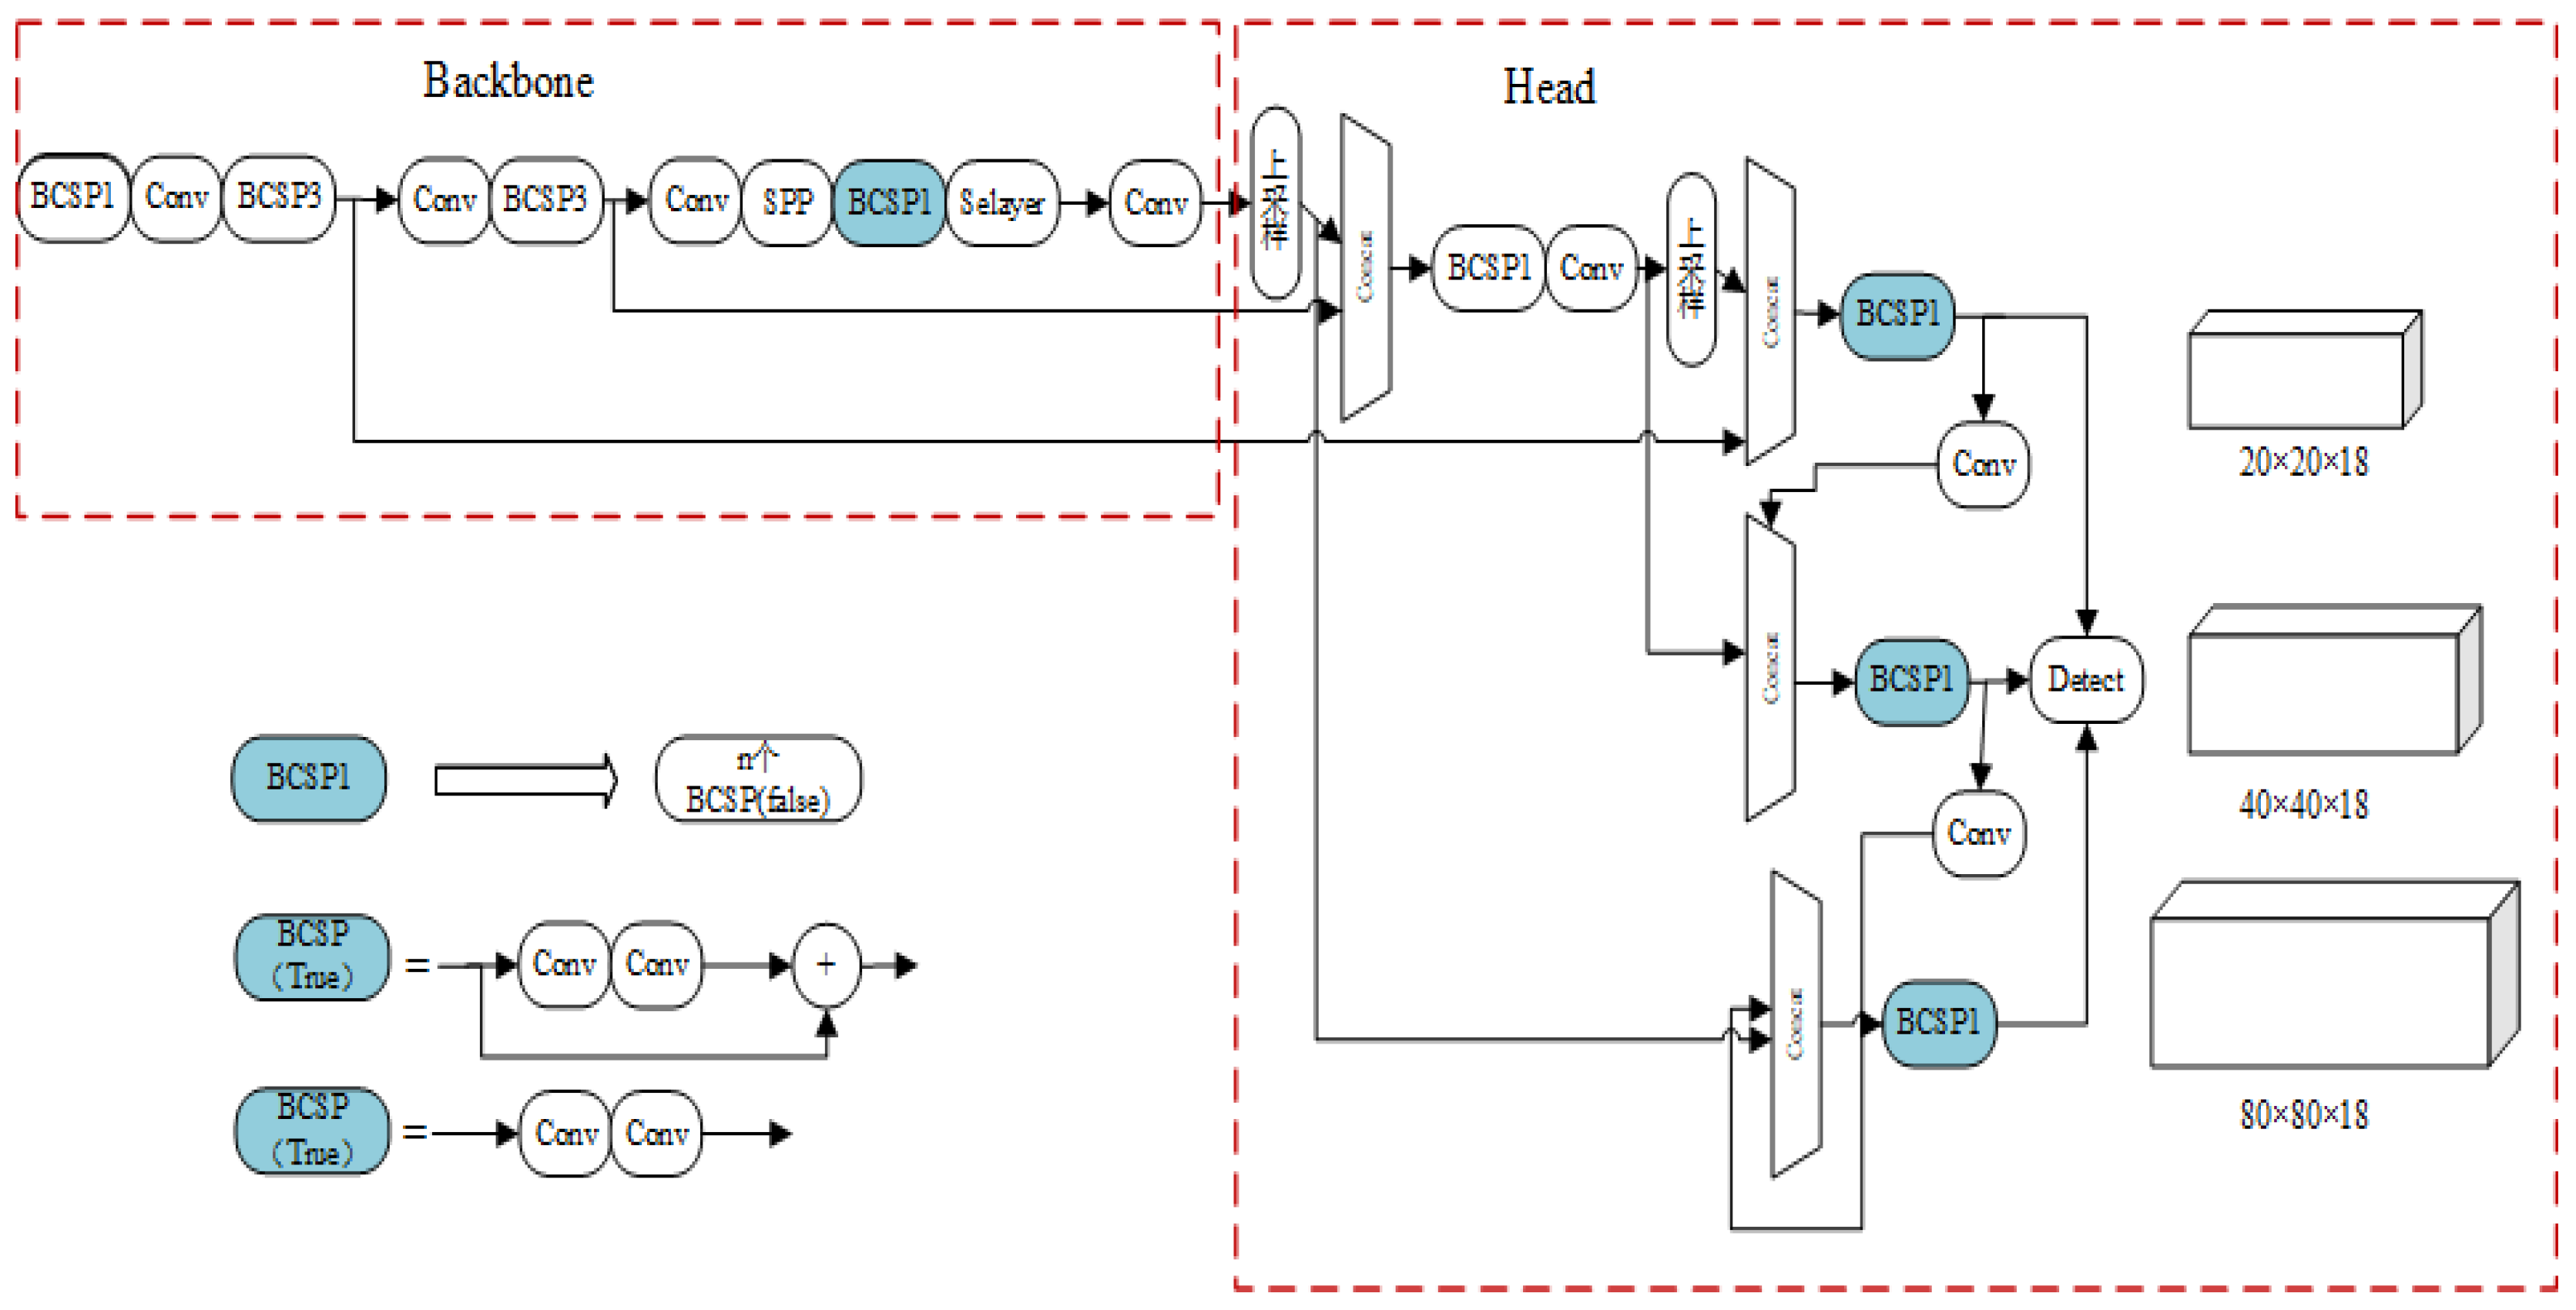
Figure 5.
This is a schematic representation of the structure and workflow of Swin Transformer Tiny. Through multiple Transformer modules and multi-level feature extraction and transformation mechanism, the deep-level feature extraction of the input image is realized.
Figure 5.
This is a schematic representation of the structure and workflow of Swin Transformer Tiny. Through multiple Transformer modules and multi-level feature extraction and transformation mechanism, the deep-level feature extraction of the input image is realized.
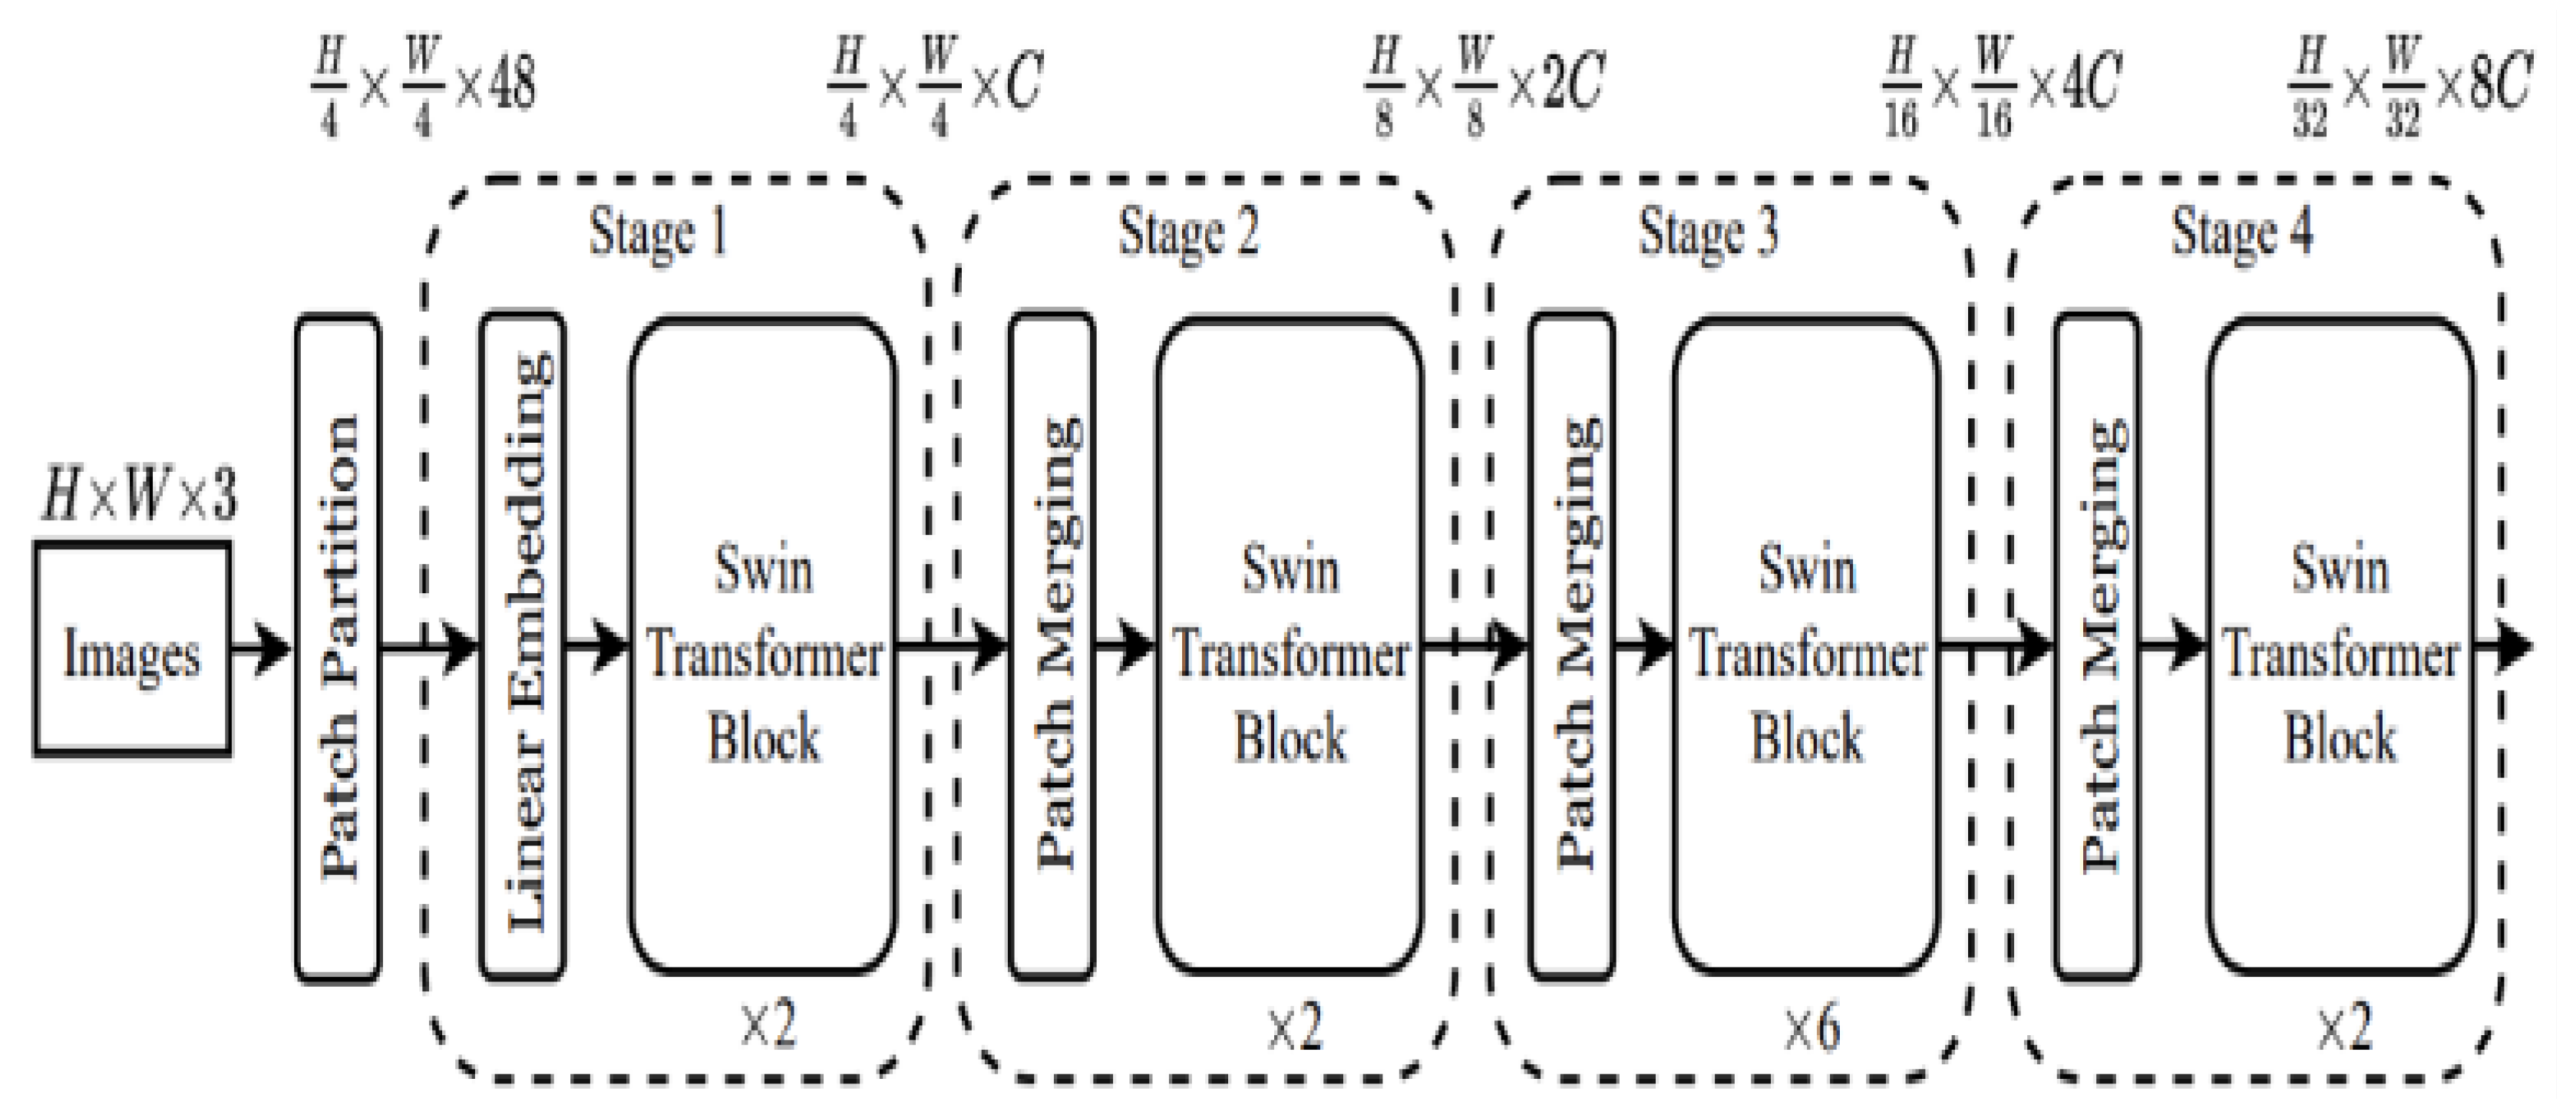
Figure 6.
This is a schematic representation of the structure and workflow of Swin Transformer Tiny. Through multiple Transformer modules and multi-level feature extraction and transformation mechanism, the deep-level feature extraction of the input image is realized.
Figure 6.
This is a schematic representation of the structure and workflow of Swin Transformer Tiny. Through multiple Transformer modules and multi-level feature extraction and transformation mechanism, the deep-level feature extraction of the input image is realized.
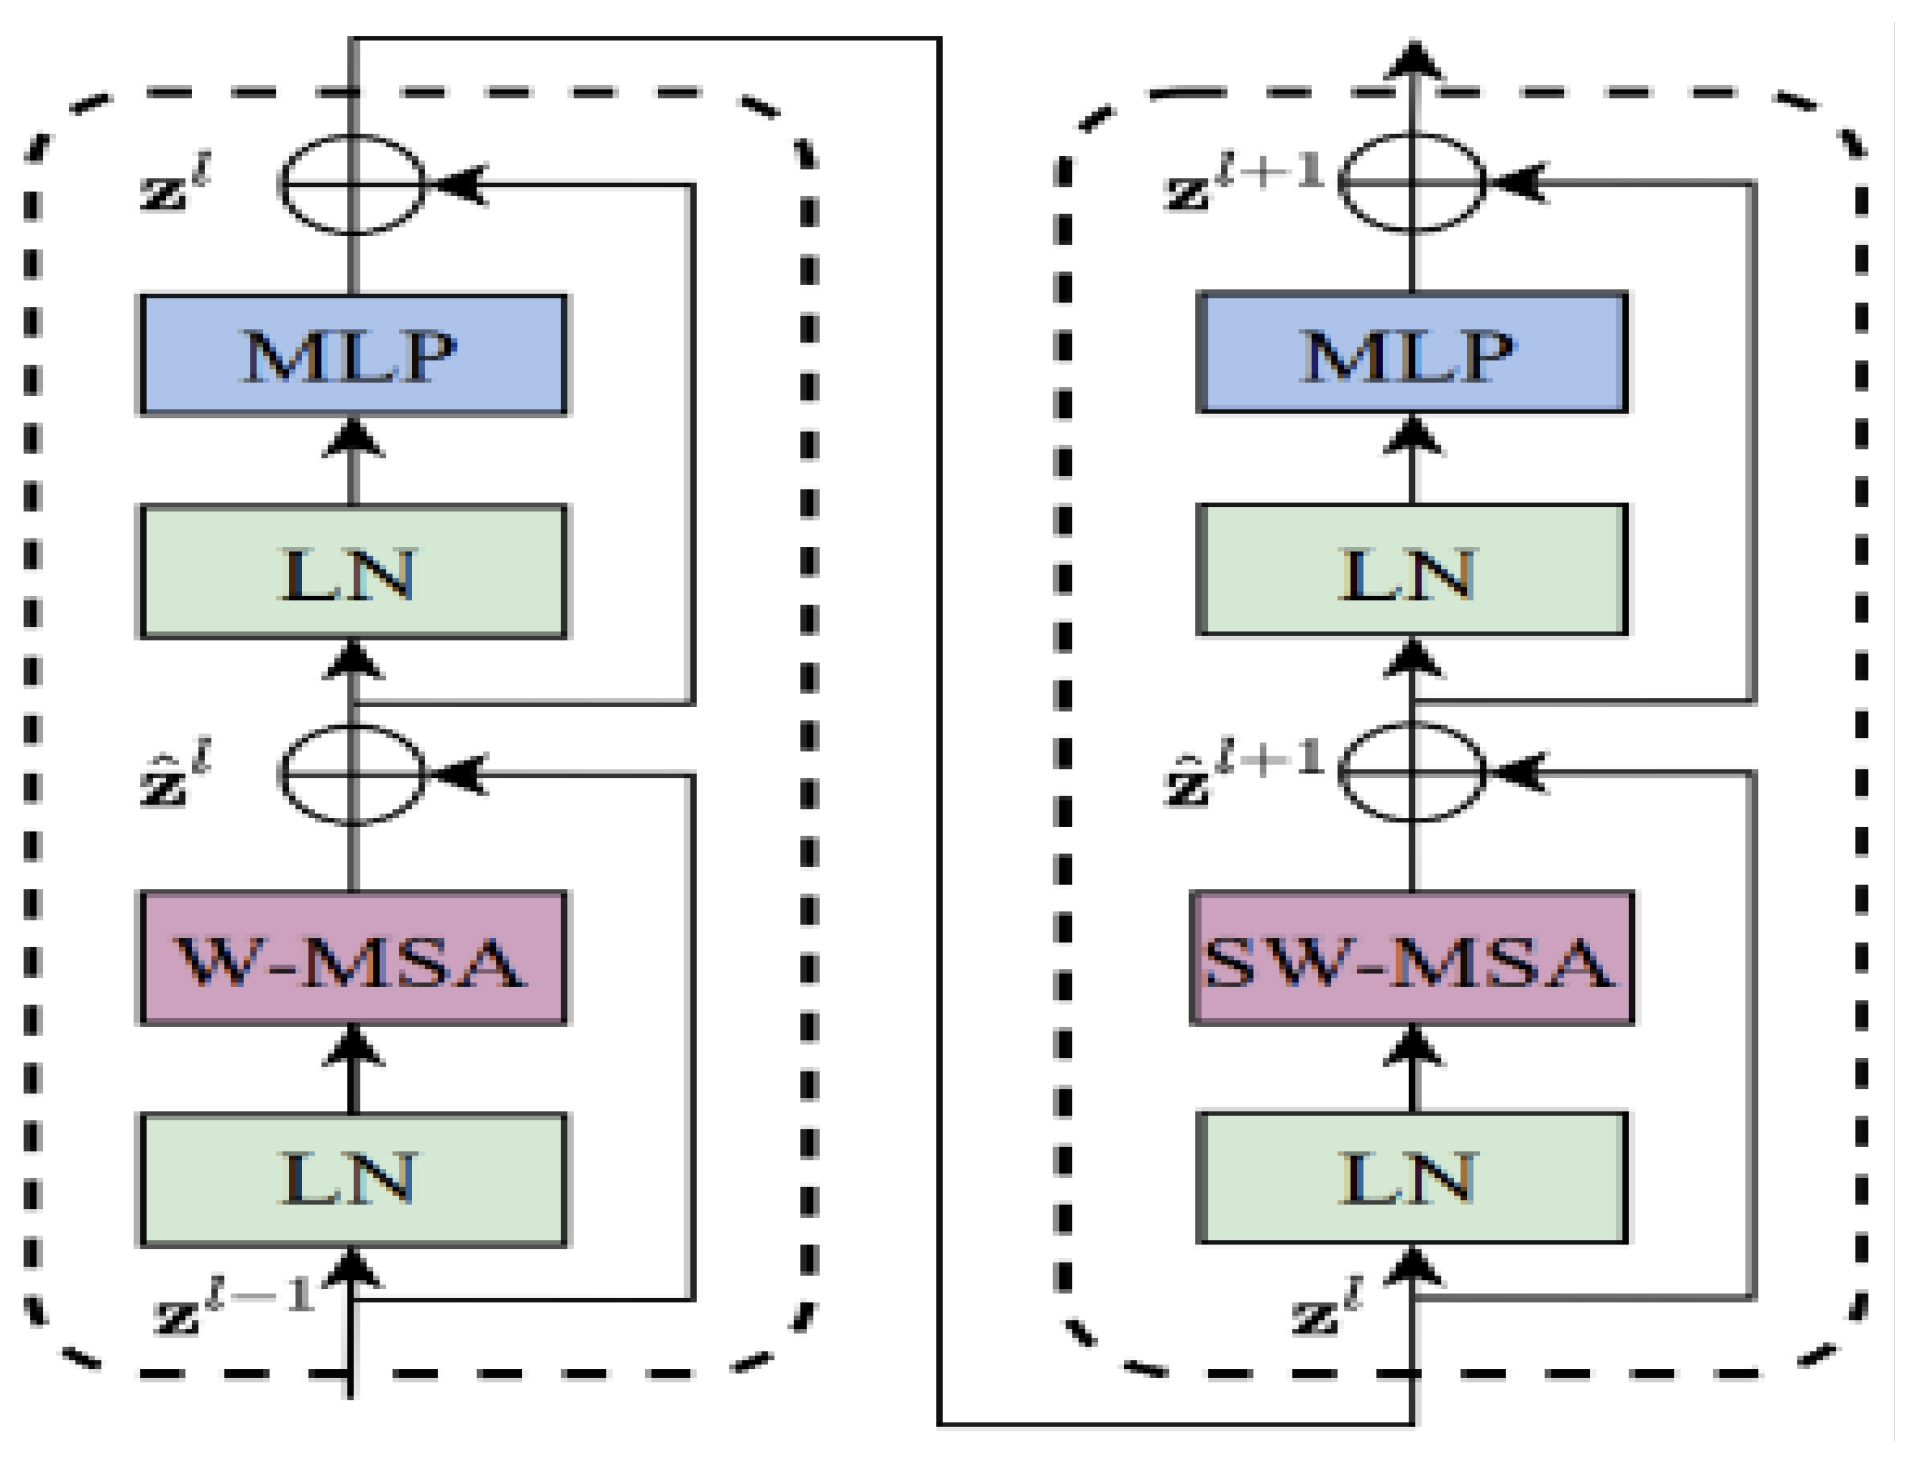
Figure 7.
This is a representation of the improved ST-YOLOv5s structure and workflow diagram. The structure of ST-YOLOv5s includes a Swin-T model, which uses a hierarchical Transformer module to extract features at different scales. Its sliding window strategy is helpful to capture the global context information in the image, while the multi-head attention mechanism allows learning task-related information in their respective presentation subspaces.
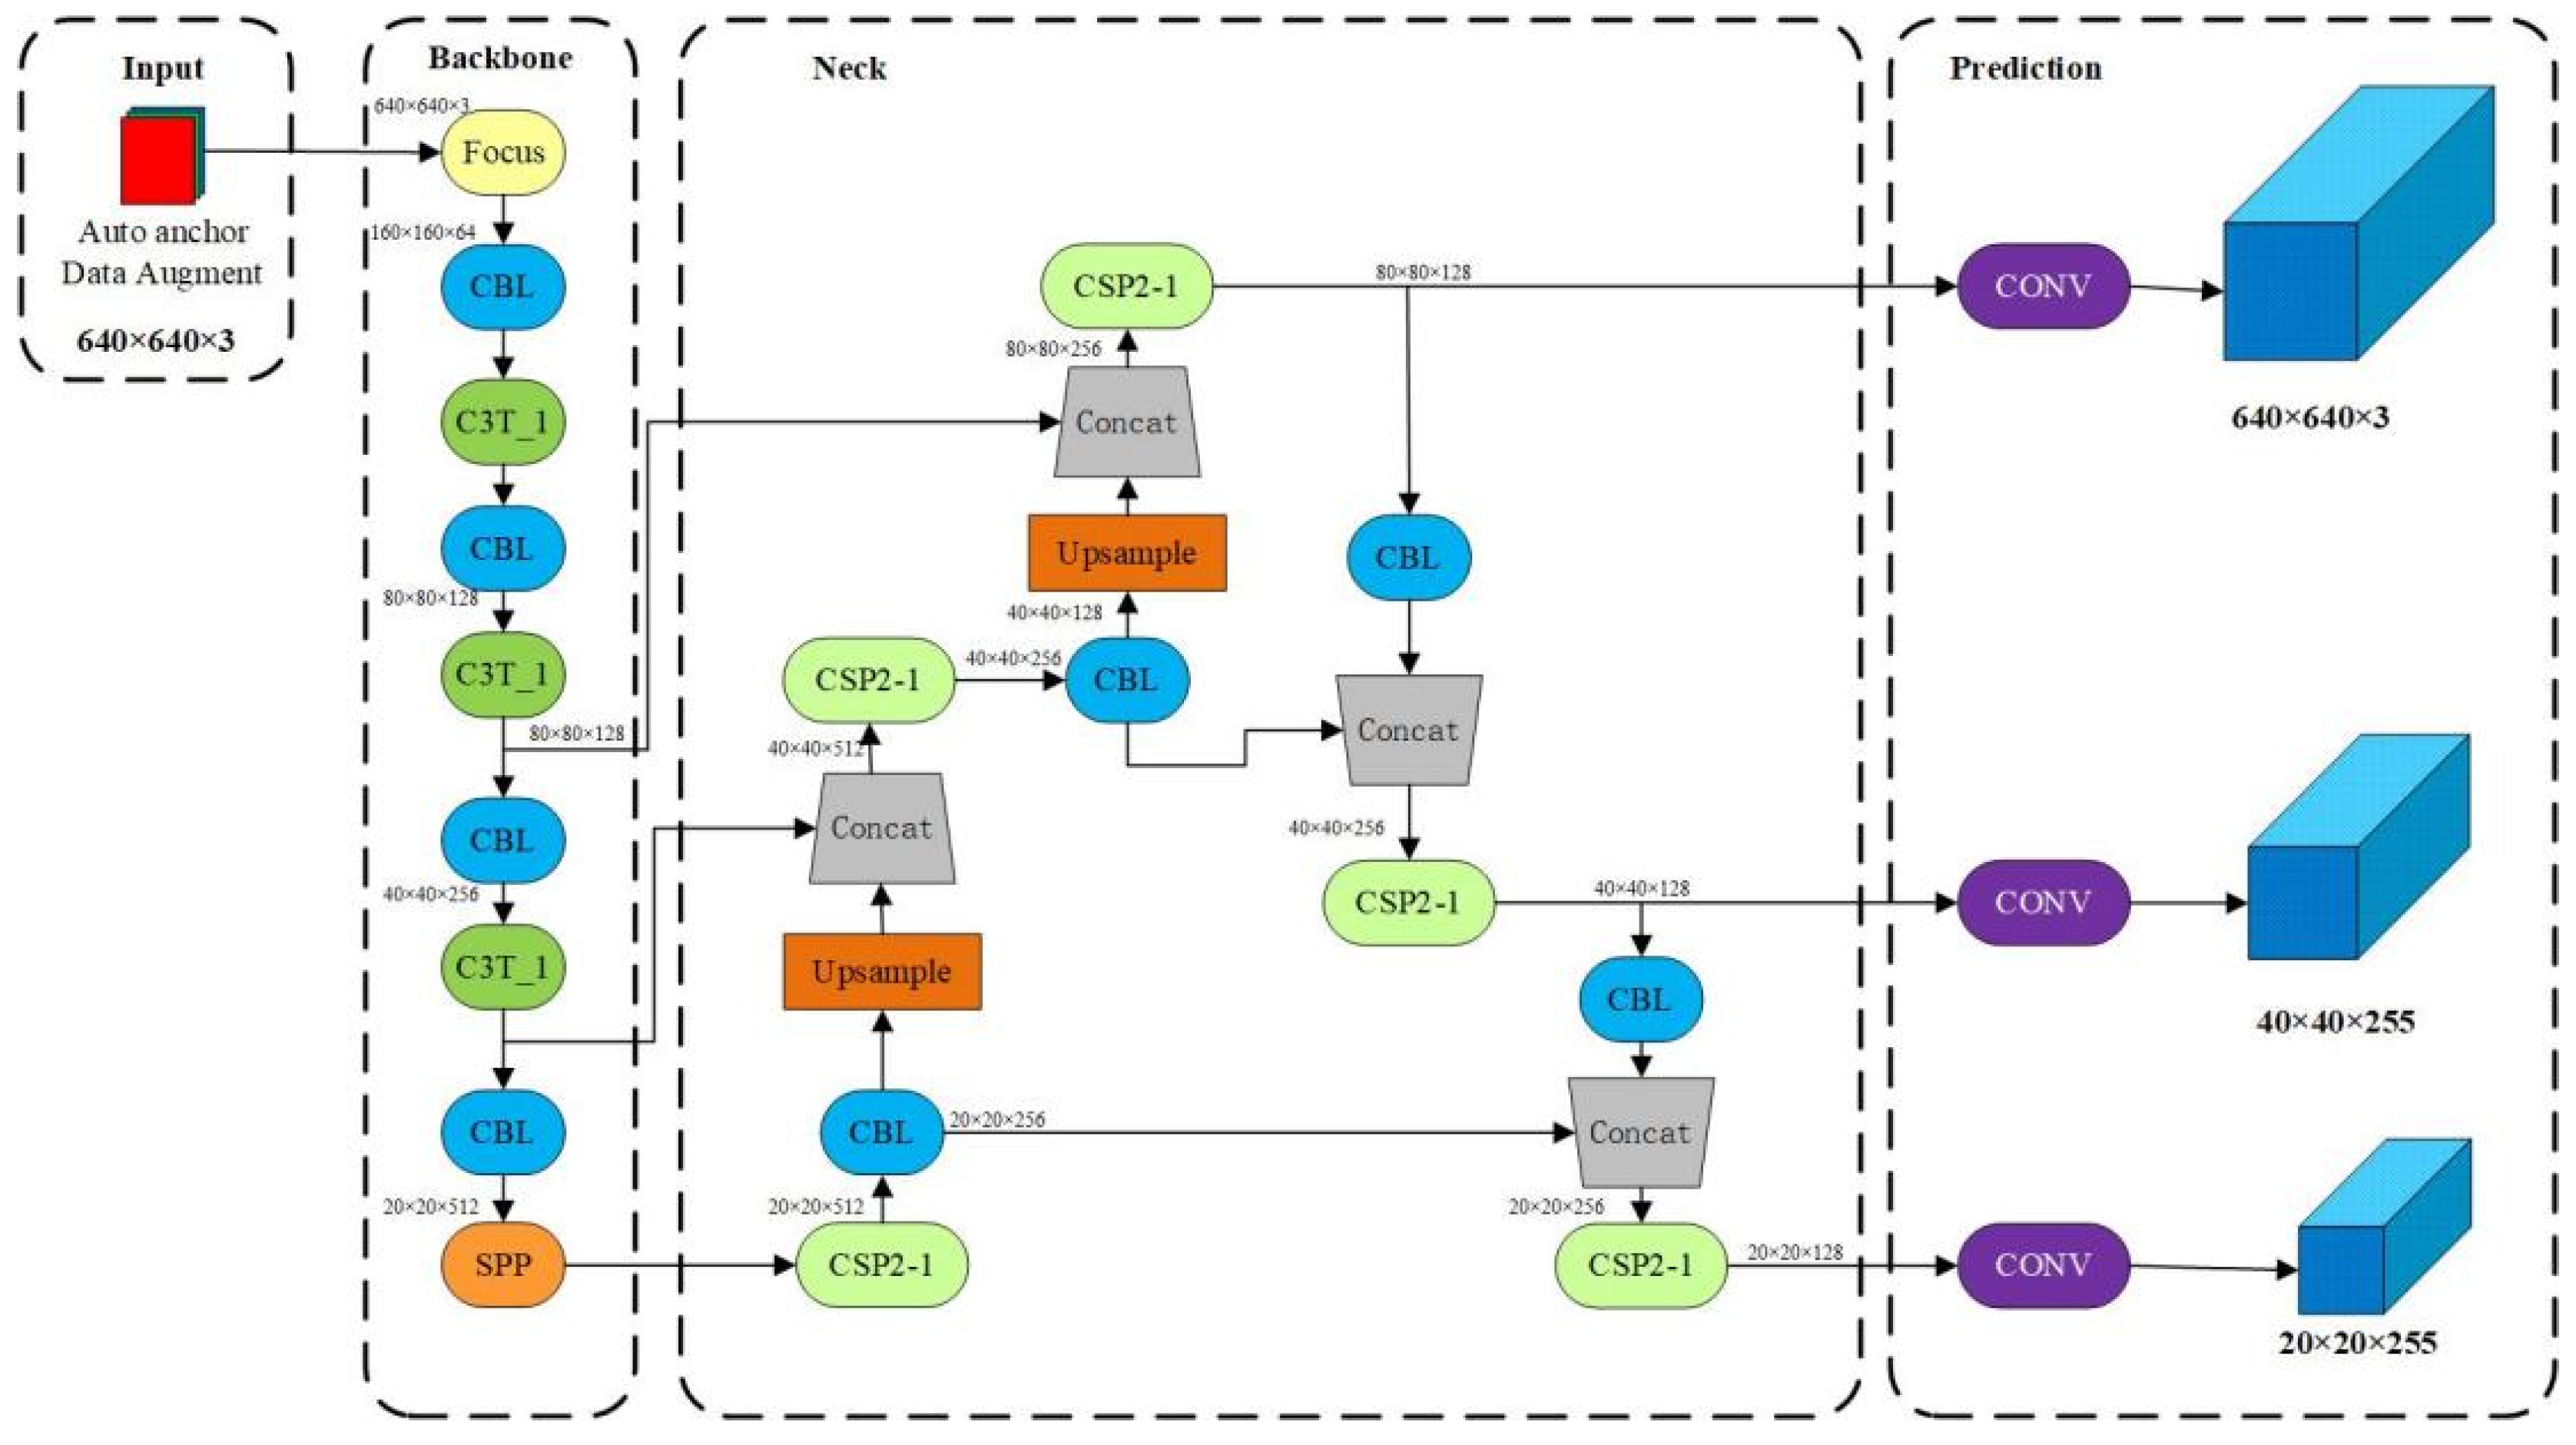
Figure 8.
YOLOv5s, SE-YOLOv5s and ST-YOLOv5s. Recall, mAP and Precision are used to evaluate the performance of the model. The results show that the improved SE-YOLOv5s and ST-YOLOv5s models have better performance than the unimproved YOLOv5s models.
Figure 8.
YOLOv5s, SE-YOLOv5s and ST-YOLOv5s. Recall, mAP and Precision are used to evaluate the performance of the model. The results show that the improved SE-YOLOv5s and ST-YOLOv5s models have better performance than the unimproved YOLOv5s models.
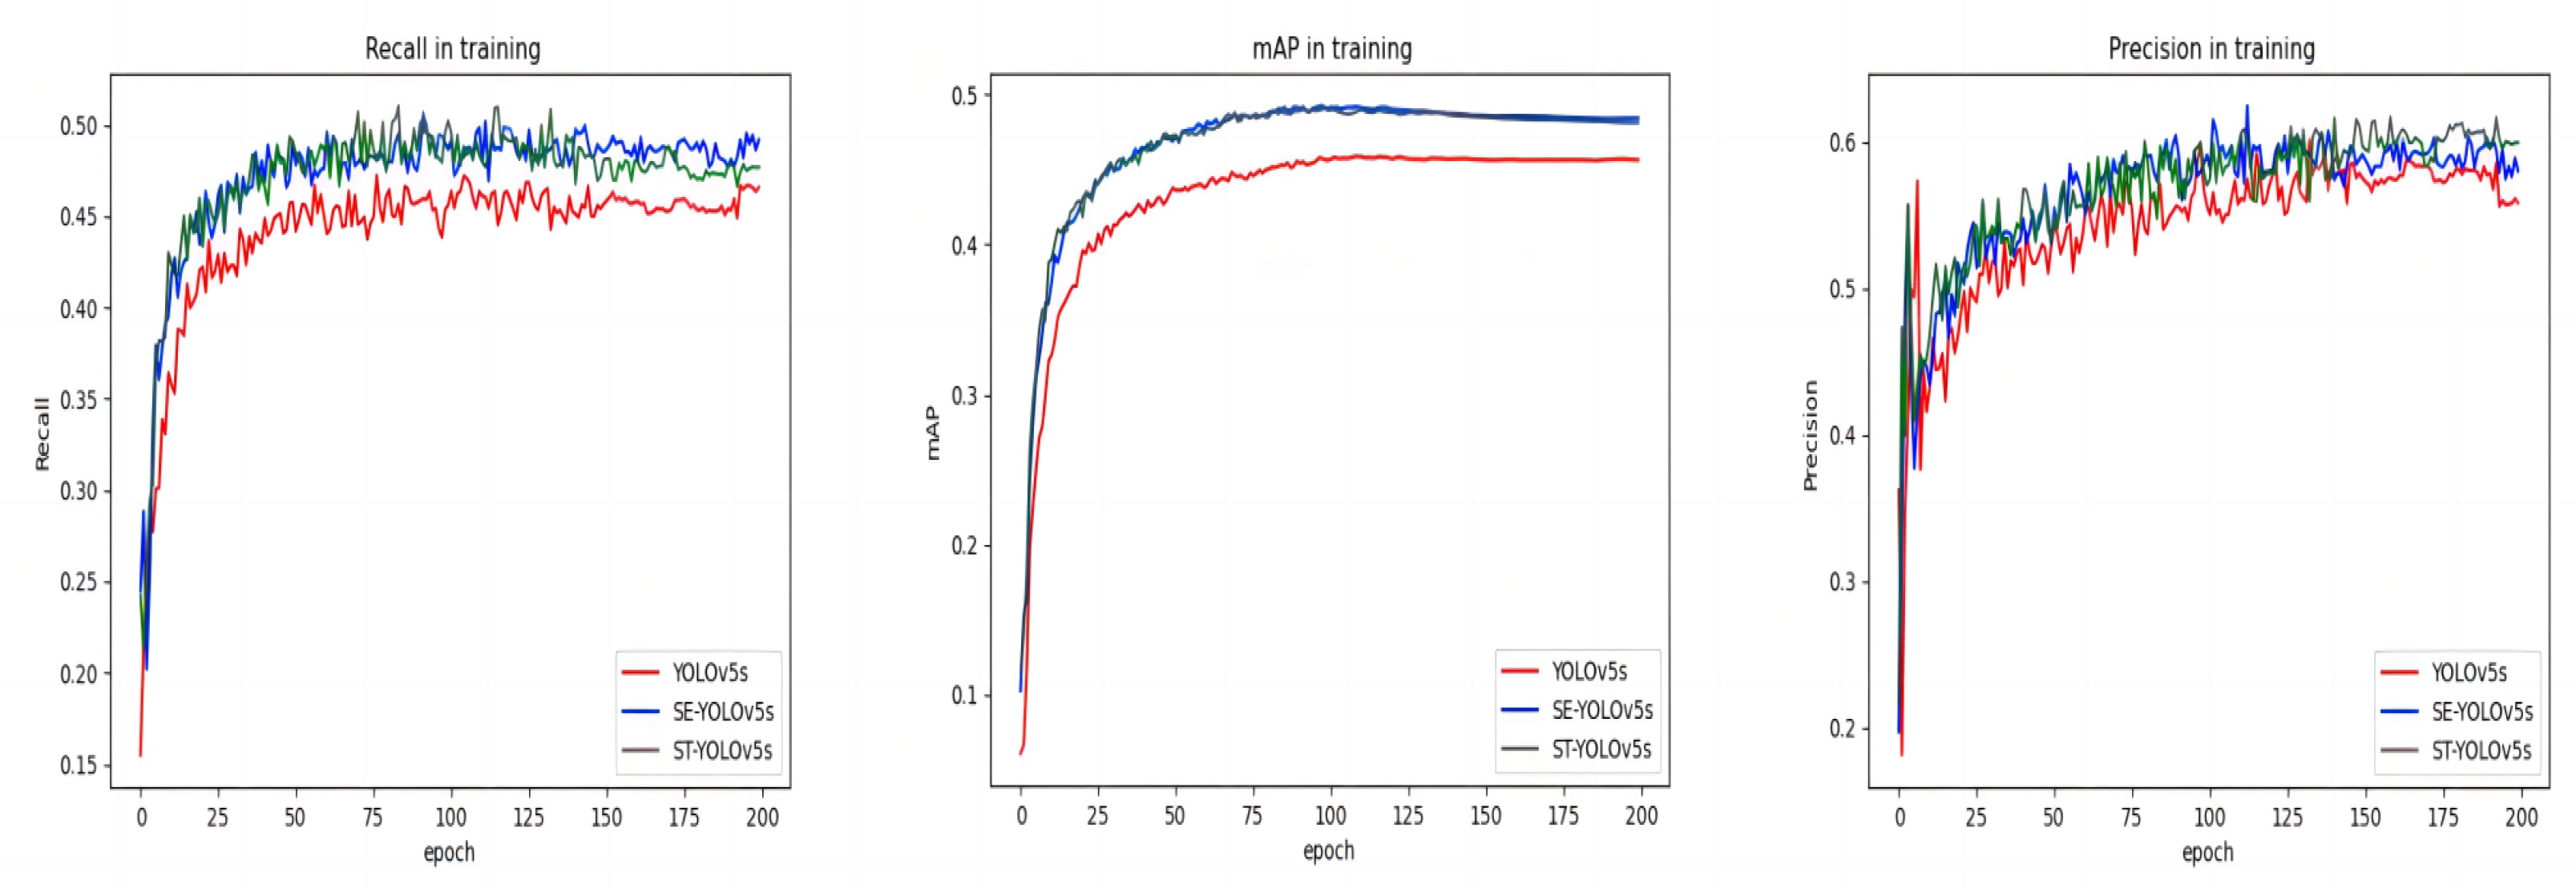
Figure 9.
The experimental results of YOLOv5s, SE-YOLOv5s and ST-YOLOv5s on VisDrone. In the picture, we can see the target classification and the corresponding probability obtained from target detection and recognition.
Figure 9.
The experimental results of YOLOv5s, SE-YOLOv5s and ST-YOLOv5s on VisDrone. In the picture, we can see the target classification and the corresponding probability obtained from target detection and recognition.
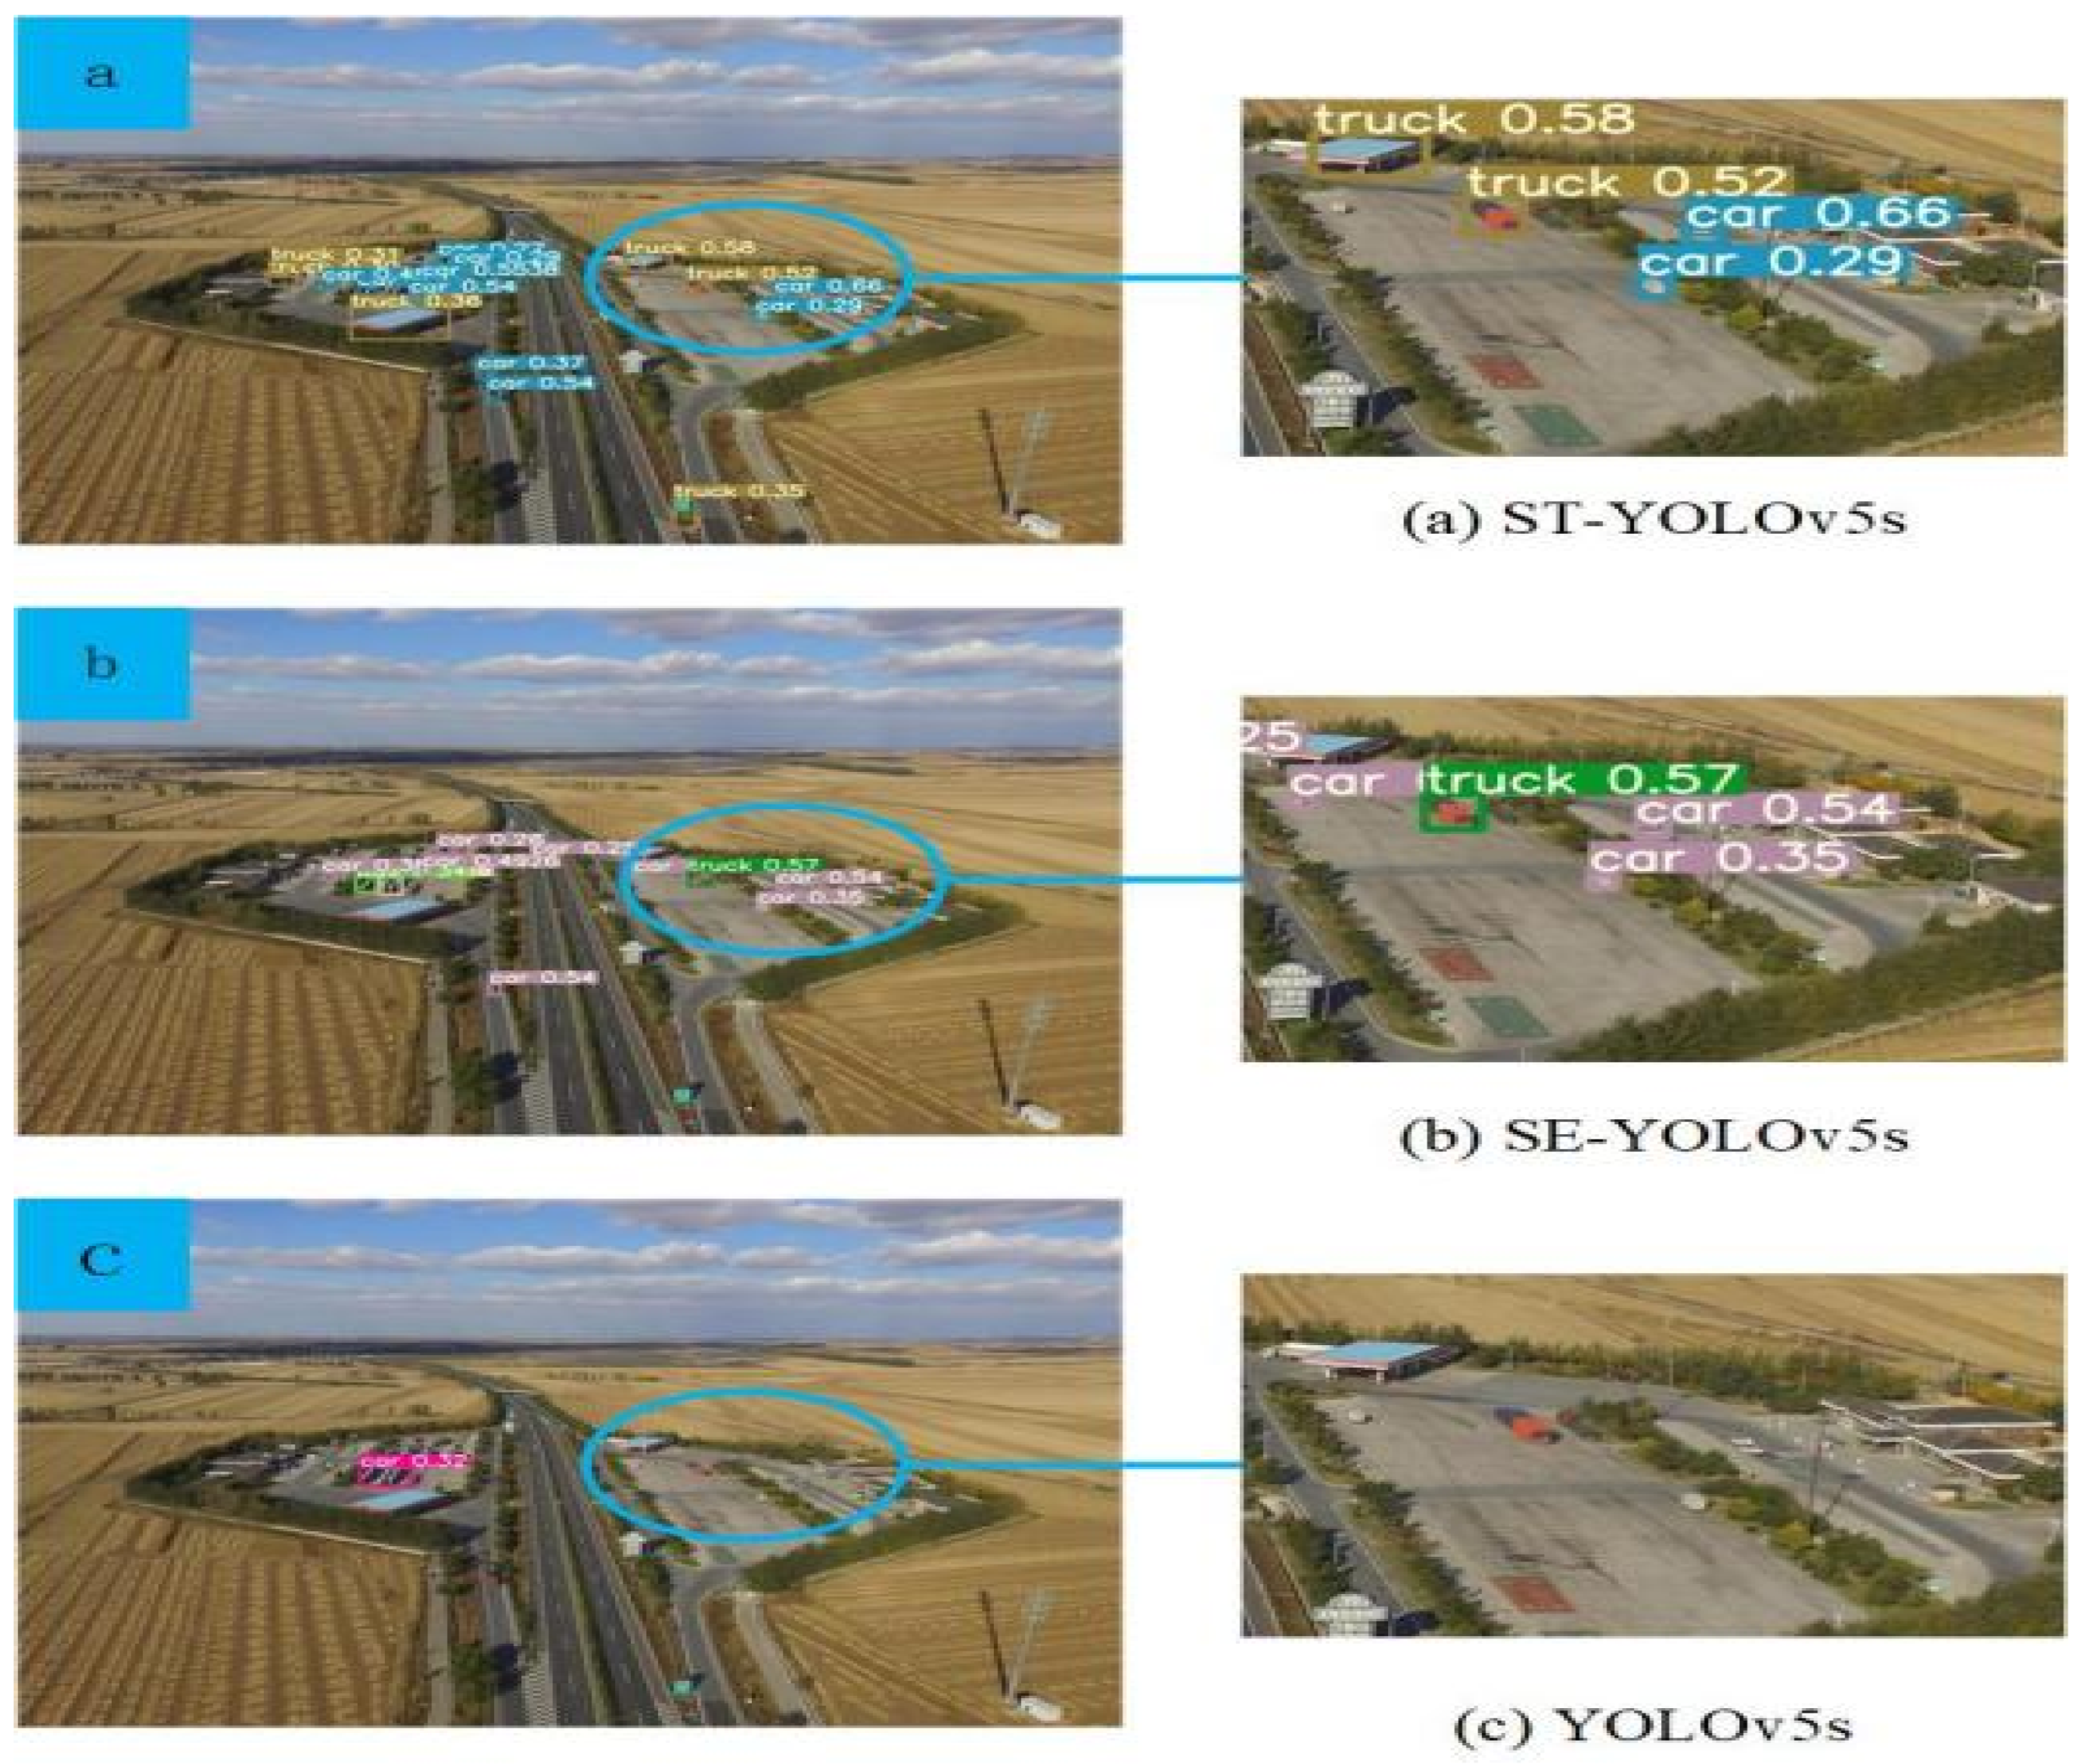
Figure 10.
The experimental results of YOLOv5s, SE-YOLOv5s and ST-YOLOv5s on VisDrone. In the picture, we can see the target classification and the corresponding probability obtained from target detection and recognition.
Figure 10.
The experimental results of YOLOv5s, SE-YOLOv5s and ST-YOLOv5s on VisDrone. In the picture, we can see the target classification and the corresponding probability obtained from target detection and recognition.
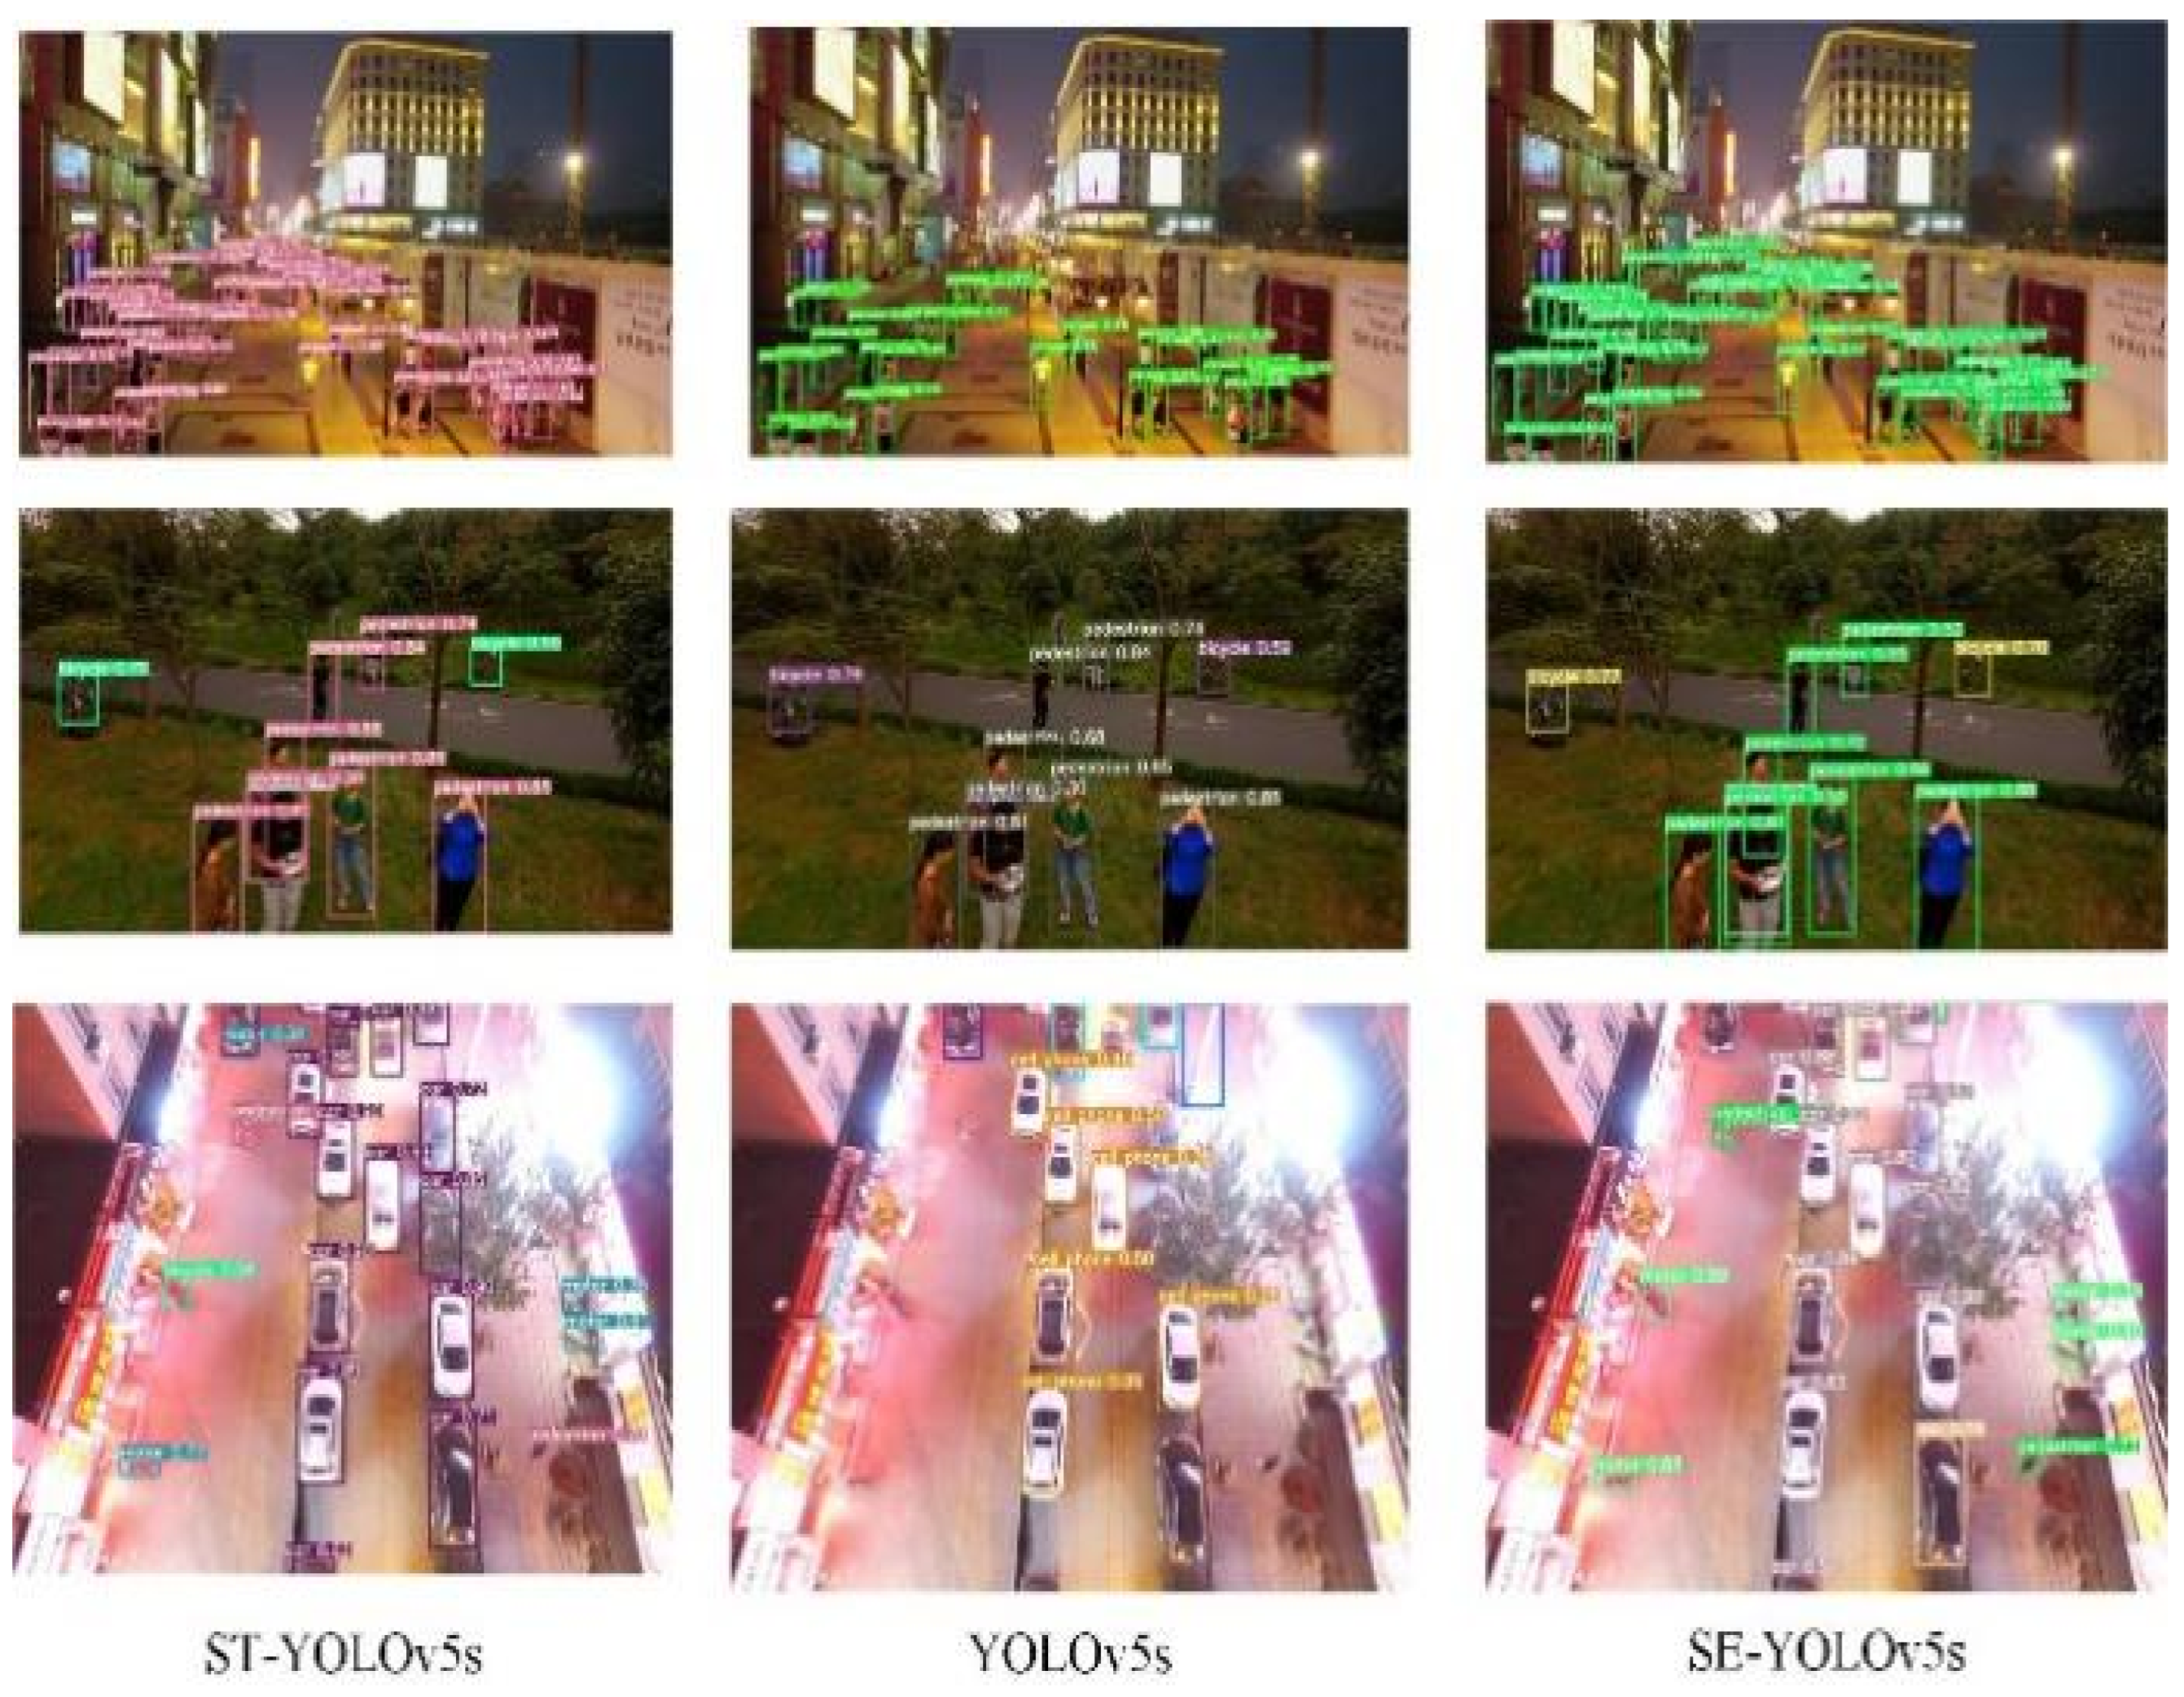

Table 1.
This is a performance comparison of YOLOv5 models representing different dimensions. Among them, YOLOv5x model has better performance on positive indicators mAP, GFOLPs and Params. On the negative index FPS, YOLOv5x model consumes the least. Overall, YOLOv5x has the best performance.
Table 1.
This is a performance comparison of YOLOv5 models representing different dimensions. Among them, YOLOv5x model has better performance on positive indicators mAP, GFOLPs and Params. On the negative index FPS, YOLOv5x model consumes the least. Overall, YOLOv5x has the best performance.
| Model | mAP(%) | GFOLPs(Billion) | FPS | Params(MB) |
|---|---|---|---|---|
| YOLOv5s | 44.3 | 16.4 | 113 | 7.07 |
| YOLOv5m | 48.2 | 50.4 | 65 | 21.07 |
| YOLOv5l | 50.4 | 114.3 | 28 | 46.68 |
| YOLOv5x | 51.3 | 140.2 | 25 | 89.0 |
Table 2.
This is a table that describes the VisDrone 19 dataset [18]. VisDrone19 is an aerial data set of unmanned aerial vehicles, which was collected by AISKYEYE team of Machine Learning and Data Mining Laboratory of Tianjin University.
Table 2.
This is a table that describes the VisDrone 19 dataset [18]. VisDrone19 is an aerial data set of unmanned aerial vehicles, which was collected by AISKYEYE team of Machine Learning and Data Mining Laboratory of Tianjin University.
| Data Information | Basic Situation |
|---|---|
| Partition of data | 6471 training sets, 1580 test sets, 548 verification sets. |
| Data scene | Cities, villages, highways |
| Target type | 23 categories of vehicles, pedestrians and bicycles. |
| Resolution ratio | 1024pixel×1024pixel |
| Data source | Drone shooting |
Table 3.
Various equipment models in training experimental environment.
| Parameter | Deploy |
|---|---|
| GPU model | NVIDIA GeForce RTX 3090. |
| CPU model | Intel(R) Xeon(R) Gold 6330 |
| Internal storage | 30GB |
| Memory | 24GB |
| Deep learning framework | Pytorch 1.9.0 |
| CUDA | CUDA 11.1 |
| Programming environment | Python 3.8 |
Table 4.
Various equipment models in Off-line experimental environment.
| Parameter | Deploy |
|---|---|
| GPU model | NVIDIA GeForce RTX 3060. |
| CPU model | Intel(R) Core(TM) i9-12900H |
| Internal storage | 16GB |
| Memory | 6GB |
| Deep learning framework | Pytorch 1.12.0 |
| CUDA | CUDA 11.6 |
| Programming environment | Python 3.8 |
Table 5.
YOLOv5s, SE-YOLOv5s and ST-YOLOv5s. Recall, mAP and Precision are used to evaluate the performance of the model. The results show that the improved SE-YOLOv5s and ST-YOLOv5s models have better performance than the unimproved YOLOv5s models.
Table 5.
YOLOv5s, SE-YOLOv5s and ST-YOLOv5s. Recall, mAP and Precision are used to evaluate the performance of the model. The results show that the improved SE-YOLOv5s and ST-YOLOv5s models have better performance than the unimproved YOLOv5s models.
| Algorithms | mAP(%) | Precision(%) | Recall(%) |
|---|---|---|---|
| YOLOv5s | 45.7 | 55.8 | 46.6 |
| SE-YOLOv5s | 47.8 | 60.1 | 46.6 |
| ST-YOLOv5s | 47.6 | 57.1 | 46.0 |
Table 6.
YOLOv5s, SE-YOLOv5s and ST-YOLOv5s. Six negative indicators, Time, FPS, Params, GFLOPs and Scale, were used to evaluate the performance of the model.
Table 6.
YOLOv5s, SE-YOLOv5s and ST-YOLOv5s. Six negative indicators, Time, FPS, Params, GFLOPs and Scale, were used to evaluate the performance of the model.
| Algorithms | Time(ms) | FPS | Params | GFLOPs | Scale (MB) |
|---|---|---|---|---|---|
| YOLOv5s | 12 | 83.3 | 7396135 | 16.8 | 15.2 |
| SE-YOLOv5s | 16 | 62.5 | 7078183 | 16.4 | 14.5 |
| ST-YOLOv5s | 17 | 58.8 | 7122891 | 17.0 | 14.6 |
Disclaimer/Publisher’s Note: The statements, opinions and data contained in all publications are solely those of the individual author(s) and contributor(s) and not of MDPI and/or the editor(s). MDPI and/or the editor(s) disclaim responsibility for any injury to people or property resulting from any ideas, methods, instructions or products referred to in the content. |
© 2023 by the authors. Licensee MDPI, Basel, Switzerland. This article is an open access article distributed under the terms and conditions of the Creative Commons Attribution (CC BY) license (http://creativecommons.org/licenses/by/4.0/).
Copyright: This open access article is published under a Creative Commons CC BY 4.0 license, which permit the free download, distribution, and reuse, provided that the author and preprint are cited in any reuse.


