Submitted:
08 November 2023
Posted:
09 November 2023
You are already at the latest version
Abstract
Chemical substances such us CS-gas used in military operations are chemical compounds that present a series of peculiarities that affect the ecosystem by disrupting the ecological balance. This study evaluated the toxicological character of O-chlorobenzylidenemalonitrile (CBM), (substance present in CS-gas) on the algae Cholrella sp. and analyzed the toxicity limit and the response of the microorganism to the oxidative stress caused by this substance. In order to under-stand the toxicological mechanisms of CBM on algal culture, a series of parameters were analyzed such as: the cell growth curve, the average specific growth rate (µ), percent inhibition in yield(I%), dry cell weight (DCW), percent viability and productivity of algal biomass flocculation activity(FA), change in oxygen production. The content of chlorophyll pigments, was characterized by Fourier transform infrared spectroscopy (FTIR) fluorescence spectroscopy and analysis of the surface structure of algal cells by SEM spectroscopy. This study aims to provide fundamental data for understanding the toxicity of CBM to aquatic organisms and provides a basis for assessing the potential for impact on aquatic ecosystems. The results obtained could be taken into account in the management of the decontamination of the affected areas.
Keywords:
CS gas
; O-Chlorobenzylidene malononitrile
; ecotoxicity
; chlorophyll
; FTIR
; SEM spectroscopy
1. Introduction
CS gas is known as one of the tear gases which are commonly used for riot control in law enforcement and military operations as well as during military personnel training exercises [1,2,3,4]. Identification of exposure to chemical warfare agents (CWAs) is important in the context of supporting investigations of alleged use of CWAs under the Chemical Weapons Convention (CWC) [5,6,7,8].
CS gas is the name of the chemical compound that contains the irritating substance O-Chloro benzylidene Malononitrile. In our tests we will call it CBM. O-Chlorobenzylidene Malononitrile is also known by other names such as 2-chlorophenyl-methylene propanedinitrile, β, β-dicyano-o-chlorostyrene, 2- chlorobenzal malonitrile. As with other xenobiotics, the long-term effects of chronically toxic chemicals of riot control agents disrupt the ecological balance of biocenoses. Due to the fact that this substance is used in crowd control operations, it is necessary to know the toxicological effects it generates on human health and the impact on the environment [9].
CS gas is usually mixed with a pyrotechnic compound for dispersion in grenades or canisters in the form of fine particles that form a characteristic smoke and are available either in individual containers or large bombs or can be dispersed by a portable aerosolizer [10].
After dispersing the product, O-Chlorobenzylidene Malononitrile is released in concentrations of 10 - 20 mg*min/m3 which can harm the health of 50% of exposed people. The irritant potential of O-Chlorobenzylidene Malononitrile varies from individual to individual and increased ambient temperature and humidity may also intensify the irritant effects [11]. Also, in addition to the medical aspect of the influence on the human body, there is the problem of environmental contamination in the area of exposure to O-Chlorobenzylidene Malononitrile, being disturbed the balance of biofauna in contaminated waters or in the areas affected by the explosion of CS gas containers. In order to observe the effects generated by this product [11], tests were carried out on batches with experimental animals through which the aerosolized substance was introduced into a building with a known cubage. Pressure containers (Model 5 Protectojet) containing 1070 g of methylene chloride as a dissolution solvent and 30 g of O-Chlorobenzylidene Malononitrile were used in the tests, using CO2 as a propellant for dispersing the liquid aerosol. Due to the fact that the solvent evaporated very quickly, solid CS particles remained and contaminated the targeted area. The purpose of the experiments were to determine the toxic effects of CBM on experimental organisms to establish the impact of substances contained in CS gas used in military and law enforcement operations. The tests concluded that in animals, after exposure to 300 mg/m3 of O-Chlorobenzylidene Malononitrile for up to 30 minutes, serious respiratory symptoms appear, mortality occurring at a concentration of 11,246 mg*min/m3 in monkeys and in dogs at a concentration of 12,975 mg*min/m3 [11].
According to the European Community directive 2000/60/EC [Directive 2000/60/EC of the European Parliament and of the Council of 23 October 2000 establishing a framework for Community action in the field of water policy and subsequent updating, 2006/11/EC and 2008/32/EC [12] all water bodies must be protected and preserved. In order to improve the water quality and guarantee the survival of all the species of aquatic organisms the biodiversity of ecosystems should be protected, and therefore quality concerning ecotoxicological characteristics is also demanded [13]. Having these perspectives, a detailed knowledge of the mechanism of action of this substance is necessary in order to be able to develop enzymatic biodegradation methods using microorganisms that naturally live in aquatic environments and that do not require special procedures for their preservation / protection. O-chlorobenzylidene malononitrile is a substance that could be easily removed from contaminated environments using certain microorganisms that are capable of enzymatically biodegrading this substance or its metabolic products. Despite continued recommendations against the use of CS gas over the past 20 years, it continues to be the most commonly used agent worldwide [14,15].
Metabolically, CS undergoes conversion to 2-chlorobenzyl malononitrile (CSH2), 2-chlorobenzaldehyde (o-CB), 2-chlorohippuric acid and thiocyanate. CS and its metabolites can be detected in blood after inhalation exposure [16]. Following the exposure of rodent and non-rodent animal species to inhalation of CS, two of its metabolites, 2-chlorobenzaldehyde and 2-chlorobenzyl malononitrile, were detected in their blood [17]. Folliwing the research conducted by the The National Institutes of Occupational Safety and Health (NIOSH) and Occupational Safety and Health Administration (OSHA) it was established that the safety limit for exposure to O-Chlorobenzylidene Malononitrile at 0.4 mg/m3 and the value of immediate danger to life and health (IDLH) at 2 mg/m3. The lethal levels of cyanide in the blood are 1 mg/L and a concentration between 0.2- 0.25 mg/L is considered toxic that generates serious health conditions [18].
Knowing the limits of tolerance of exposure to the toxic substance O-Chlorobenzylidene Malononitrile (CBM) in the aquatic environment, its toxicity could be controlled by supplementing the aquatic flora with specific microorganisms that have a high tolerance to this toxic agent [19].
During military operations that use large amounts of o-chlorobenzylidene malononitrile, the handling of this substance also involves environmental pollution. In this study we do not focus on the medical problems of people involved in conflicts. The purpose of our research is to find methods to guide the management of the pollutant in the case of exceeding certain concentration thresholds that could degrade the aquatic ecosystem. Through the research undertaken, results were obtained that can help the management of contaminated sites by supplementing the aquatic biofauna with microalgae or with microorganisms which are able to biodegrade toxic compounds [20].
This research is useful for establishing the ecotoxicity of special toxicants and assessing the ecotoxicological risk for contaminated sites, measures that will be able to be introduced in biomonitoring programs, such those introduced through the Romanian Law no. 74/2019 regarding the management of potentially contaminated sites and contaminated sites which was published in the Romanian Official Gazette, Part I, no. 342 of May 3, 2019.
Through the performed tests, we aimed to study the toxicity of o-chlorobenzylidene malononitrile, a substance that is used as a weapon to counter riots and in military operations. In our previous studies we evaluated the ability of some microorganisms to biodegrade O-Chlorobenzylidene Malononitrile and also established the toxicity values of acute lethal concentration LC50 results which can be used to further determine the maximum allowable concentration that inhibits the development of normal fish fauna in contaminated waters. LC50 estimated at 24 h with 95% confidence interval is 1.46 for an average concentration of o-chlorobenzylidene malononitrile of 2.9 mg /L, and LC50 estimated at 72 h with 95% confidence interval is 1,079 for a mean concentration of o-chlorobenzylidene malononitrile of 1.2 mg /L [21].
Microalgae are sensitive indicators of environmental changes and due to the fact that they can survive and develop in freshwater and marine ecosystems, they can be used for environmental risk assessment because they have the ability to transform substances containing the elements nitrogen and phosphorus from contaminated waters into biomass and bioproducts [22,23]. The pH is an important parameter that influences the biodegradability of toxic substances by microorganisms. Toxic substances act as inhibitors of cellular enzymes or react with groups of proteins denaturing enzymes [24,25]. The transformations through which the microorganisms degrade the toxic substances in the final degradation products are aerobic or anaerobic decomposition (in the presence of oxygen or without oxygen)and anoxic decomposition (in the presence of nitrate ion) [26,27,28].
In our previous tests, we did toxicological studies of the substance O-Chlorobenzylidene malononitrile on certain microorganisms and it was concluded that Saccharomyces sp. culture had EC50 around 0.25 mg/ml and for Chlorella sp. culture ECb50 corresponds to 0.44 mg/ml. Lactobacillus sp. culture had ECb50 around 0.3 mg/l. In terms of Paramecium sp. culture, ECb50 had a value of 50 μg /ml, this culture being the most sensitive to the action of CBM [19,29,30].
Enzymatic mechanisms occurring in the cells of microorganisms can lead to the elimination of chemical toxic substances from the petroleum industry [31,32,37,38]., such as naphthenic acids and surfactants [32,39]. The toxic effects of certain chemicals generate enzymatic changes in algae cells, making it necessary to study certain enzymes influenced by chemical stress: peroxidases (Px), superoxide dismutase (SOD), catalase (CAT), glutathione reductase (GR) [33,34,35,36]. Considering this principle, in our previous tests we studied the removal of metabolites after the hydrolysis of the substance O-Chlorobenzylidene Malononitrile by using the algal suspension and the results indicated that the suspension of Chlorella sp. consumed the entire amount of CBM from the samples [19,40,41].
2. The toxicity analysis
O-chlorobenzyliden malononitrile (CBM) has the chemical formula C10H5ClN2, molecular weight 188.6 g/mol, water solubility 2.0 x 10⁻⁴ M. CBM is an aromatic alkyl nitrile, monosubstituted in the nucleus, the Cl atom being in the ortho position. It is a derivative of o-chlorostyrene [25].
In the aqueous neutral environment CBM is relatively stable to hydrolysis. For this reason, the amount of CS in water has a different half-life depending on the pH of the environment. Thus CS is reduced by 50% in 14 minutes at pH 7.4 and 25 ° C or within 0.17 minutes at pH 11.4 and 25 °C. In contrast, in an acidic pH environment (1-4) CS becomes stable [11]. Some studies have concluded that in aqueous environments, at a temperature of 30° C CBM hydrolysis occurs after 635 minutes, while in the alcoholic environment, the hydrolysis reaction accelerates. For example, in an alcoholic environment with 95% ethanol and 5% water, at 30° C hydrolysis occurs after 95 min. and at 40 ° C hydrolysis occurs after 40 min. Hydrolysis breaks the double ethylene bond with the formation of 2-chlorobenzaldehyde and malonic nitrile [25].
3. MATERIALS AND METHODS
3.1. Experimental design
In order to understand the toxicological mechanisms of CBM on the culture, a series of parameters were analyzed such as flocculation activity (FA), change in oxygen production (DX) and analysis of the chlorophyll pigment content.
The studies were carried out in two stages: the first stage of adaptation of the algae culture to the working conditions in the laboratory and the promotion of cell growth up to an optimal concentration of cell development. The second stage of the tests consisted of a series of experiments to observe the evolution of the algal culture under chemical stress conditions by adding different concentrations of CBM to the reaction medium comparing the resulting values with a blank culture treated under the same conditions of work but without the toxic substance.
In our previous tests, we analyzed the cell growth of the microorganism Chlorella sp. by determining the rate of growth of microorganisms as an expression of the rate of increase in cell concentration over time and the microorganisms ability to respond to toxic stimuli [25]. In continuation of these studies, we evaluated the chlorophyll content of Chlorella sp. developed in chemical stress generated by different concentrations of CBM (o-chlorobenzylidene malonitrile) and we followed the absorption spectra and the evaluation of the chlorophyll fluorescence contained in Chlorella sp. developed in bioreactors.
Following the treatment with the toxic substance, the content of chlorophyll pigments was analyzed by Fourier transform infrared spectroscopy (FTIR), fluorescence spectroscopy and the analysis of the surface structure of algal cells under chemical stress was carried out by SEM spectroscopy.
3.2. Biological medium and algae cells
Microalgae Chlorella pyrenoidosa was cultivated in Erlenmeyer flasks containing specific algae growth medium (SAGM):250 cm3 of distilled water, MgSO4•7H2O (0.3g), KNO3 (0.4g), CaCl2 (0.4g), NaH2PO4•2H2O (0.3g), FeSO4•7H2O (0.02g), NaNO3 (0.3g), NH4Cl (0.2g); pH was adjusted at 6.5. The algal concentration used for start cellular grow was 5g/l dry cells dissolve in SAGM medium. Microalgae Chlorella pyrenoidosa was obtained from the Culture Collection of Algae of Petroleum-Gas University of Ploiesti [16,25].
Erlenmeyer flasks (3 replications) were placed in a laboratory shaker (ORBITAL Multi-Shaker) at 100 rpm, with fluorescent ligth (range 60-120 µE∙m–2∙s–1) temperature 35°C ± 1°C. The strains were kept at a temperature of 30 °C with a photoperiodism of 12h day/night. Chemical reagents were weighed by using an analytical balance OHAUS model AX224M. A high-performance multi-parameter WTW Inolab MULTI 9630 IDS with three galvanically isolated measuring channels Ph, conductivity and oxygen measurement, was used for the laboratory tests. The bioreactors were inscribed and equipped throughout the testing period with blind stoppers. Culture growth was assessed by a spectrophotometric method, by determining OD600 at intervals over 30 days and aliquots volumes were taken periodically for culture growth assessment by spectrophotometric measurements of optical density to determine cell viability, Dry cell weight, (DCW) Biomass productivity, Flocculation activity (FA) [27].
To determine these parameters, three replications performed simultaneously were analyzed, and the results obtained were processed as the arithmetic mean of the determinations. Growth was measurement at 600 nm (optical density) and then converted into unit of biomass (cells/mL) [28]. To analyze the purity of the algal culture and the appearance of the cells, a Celestron Microscope, model 4434 equipped with a Thoma Marienfeld was used.
3.2.1. Measurement of cell viability, the average specific growth rate (µ) was calculated as an expression referring to the logarithmic increase in biomass during the exposure period and calculated by Equation (1):
µ = (lnNn − lnN0)/( t1− tn), day-1
3.2.2. Dry cell weigh DCW, (mg/L) represent the optical density of microalgal culture at 600 nm and was calculated from Equation (2)
DCW= 446.51*OD 600 + 6.0183 (R2=0.995), mg/L
3.2.3. Biomass productivity, was calculated from Equation (3) considering the dry cell weight
BP=(DCW2-DCW1)/(t2-t1), mg/L
3.2.4. The flocculation activity (FA) was calculated from Equation (4).
FA = (A − B) A × 100%
3.3. Preparation of CBM concentrations
In a doua etapa a testarii, to be able to evaluate the toxicity of CBM on the culture of Chlorella sp. were prepared solutions of different concentrations of o-chlorobenzyliden malonitril: C1 (20 µg/mL), C2 (40 µg/mL), C3 (60 µg/mL), C4 (80 µg/mL), C5 (100 µg/mL), C6 (120 µg/mL, C7 (150 µg/mL) which were obtained by dissolution in water. The CBM concentrations were prepared by ultrasonic dispersion by using an equipment Ultrasonic SONICA S3 - Soltec model.
3.4. Preparation of the bioreactors with biological samples contaminated with CBM
3.4.1. Preparation of containers for testing the dissolved oxygen
In the tests, 12 replicate series were used, the containers (bioreactors) had a capacity of 150 cm3. the dilution water was distilled water. The analyzed series were labeled series ABCBM and series ACBM. Each series contains 7 test CONTAINERS (bioreactors) coded ABCBM01- ABCBM07, respectively ACBM01- ACBM07. In the first series (CONTAINER) labeled ABCBM, 2 ml each (104 cells/ml) of the Chlorella sp algae suspension were added in the exponential growth phase and CBM in different concentrations, so that each container contains a specific concentration of CBM, labeled as follows: ABCBM01 (20 µg/mL), ABCBM02 (40 µg/mL), ABCBM03 (60 µg/mL), ABCBM04 (80 µg /ml), ABCBM05 (100 µg/mL), ABCBM06 (120 µg/mL), ABCBM07 (150 µg/mL). In the second series of containers labeled ACBM, no algal suspension was added, only CBM in different concentrations, so that each container containing a specific concentration of CBM and was noted as such: ACBM01 (20 µg/mL), ACBM02 (40 µg/mL), ACBM03 (60 µg/mL), ACBM04 (80 µg /ml), ACBM05 (100 µg/mL), ACBM06 (120 µg/mL), ACBM07 (150 µg/mL).
For the determination of dissolved oxygen, two containers were additionally prepared containing the control with algal suspension 2 ml (104 cells /ml), marked MCHL and the control without algal suspension, marked M. The control contained distilled water. All the containers were incubated for 24h, by mechanical stirring in an Orbital shaker (100 rpm) and were kept at a temperature of 30 °C under white light (intensity was in the range 60-120 µE∙m–2∙s–1).
3.5. Determination of oxygen production of algal culture in chemical stress generated by CBM
The determination of the oxygen concentration [29]. was measured using a high-performance multi-parameter WTW Inolab MULTI 9630 IDS with three galvanically isolated measuring channels Ph, conductivity and oxygen measurement. The results obtained regarding oxygen production were processed and compared according to the mathematical relationship Equation no. 5. The difference between the environments that contained Chlorella and toxic algae was marked (OX) (ABCBM series) and compared with the corresponding sample with toxic but without algal suspension (ACBM series) which was marked (Ox). The obtained value was decreased from the difference in the oxygen concentration obtained from the value of the control with algal suspension MCHL, denoted (OB) and the control without algal suspension, M, marked (Ob).
3.5.1. The percentage of cell growth inhibition
According with the OECD GUIDELINES FOR THE TESTING OF CHEMICALS of the Organisation for Economic Cooperation and Development (OECD), Inhibition ratio(IR) was analysed by enumeration of cell number every 24 h, under an optical microscope (x400). The percentage of cell growth inhibition (% IR) at each concentration of the tested substance was calculated according to the following Equation (6):
IR= Cc-Ct/Ct x100, (%)
Cc, cell number density of control culture, cells/mL, Ct, cell number density of samples with specific concentrations, (20-150 mg/mL CBM), cells/mL.
3.5.2. The percent inhibition in yield (%I) be calculated uith Equation: (7)
I=(YC-YR)/YC X100, %
Where: YC=value for yield in the control group, YR= value for yield for the treatment replicate. For each concentration of CBM tested, the yield was calculated as the difference between the biomass at the end of the test and the initial biomass for each series analyzed relative to the initial biomass.
3.6. Contents of photosynthetic pigments
3.6.1. Preparation of bioreactors for chlorophyll “a” and chlorophyll “b” analysis
In order to analyze chlorophyll, test tubes with caps were prepared in 4 series of replicates. Each test tube contained 10 ml of liquid and was inoculated with 2 ml (104 cells/ml of Chlorella sp. algae suspension in the exponential growth phase). Four test tubes were used as a control and were diluted with distilled water and four series that each contained 7 test tubes in which a quantity of CBM was placed, so that each container contained a specific concentration (20 µg/mL, 40 µg/mL, 60 µg/mL, 80 µg/mL, 100 µg/mL, 120 µg/mL, 150 µg/mL)
In two series of replicates the chlorophyll content was analyzed without being incubated and the other two series of replicates were incubated for 24 hours by mechanical shaking in an Orbital shaker at a temperature of 35 °C with a photoperiodism of 12 hours day/night.
3.6.2. Chlorophyll fluorescence
The chlorophyll extract was obtained by centrifugation of test tubes using a centrifuge UNIVERSAL 320R Tip 1406-01 at 5000rpm, 10 min The supernatant was removed and used for optical density reading. To extract chlorophyll pigments, the cell pellets were re-suspended in 2 mL methyl alcohol 90%, followed by heating on the electric stove at 60 0C for 30 minutes. After this period, the suspension was centrifuged at 10,000 rpm for 10 min and the supernatant was colected and was measured at 652 nm and 665 nm using UV-VIS. The concentrations of chlorophyll “a” and “b” (Chl-a and Chl-b) were calculated and reported in µg/mL. For the accuracy of the results, the average values of the results obtained for each concentration were determined. The concentration of chlorophyll “a” and chlorophyll “b” were calculated using the following Equations no. 8 and 9 [31,32,33,34]:
Chl-a =16.29A665- 8.54 A652 , (µg/mL)
Chl-b =30.66.A652- 13.58A665, (µg/mL)
3.6.3. FTIR and fluorescence analysis of the chlorophyll extract
After extracting the chlorophyll pigment, the samples were scanned by FTIR using the TRACER IR spectrophotometer, Fourier Transform Infrared Spectrophometer and examined with the fluorescence spectrophotometer RF 6000 Spectro fluorophotometer Shimadzu.
4. Results and Discution
Throughout the testing, the microorganisms were kept in suspension by mechanical stirring to improve gas exchange and reduce pH variation in test solutions. Until day 9, cell growth was ascending, relatively small, after which a lag period followed until 13 days from the beginning of the experiment. The exponential phase began from day 12 to day 23. Until the day 27, the growth cellular was maximum, after this period it entered the period of decline. (Figure 1) and (Figure 2). The pH had a decreasing evolution, reaching around the value of 6 approximately in the middle of the test period, after which it oscillated around the value of 6.8-6.5, and as for Conductivity, it had values that oscillated between 165-210, µS /cm (Figure 3)
The microscopic examination during the tests indicated a good cellular development with the appearance of solitary cells in the first stage and then cell agglomerations appeared, due to the flocculation of the cells, this being favorable to the protection of the cellular membrane. (Figure 4) This would be useful for detoxification mechanisms in case of chemical stress through the synergistic enzymatic action of enzymes involved in cell synthesis [36,37,38,39,42,43].
The morphological aspect of the cells indicates that flocculation is a complex process influenced by cell-surface properties, cell concentration, pH, ionic strength, and cell development conditions depending on the chemical environment generated by the analyzed toxic substance [44]. The growth of microalgae developed differently in the presence of different concentrations of CBM. During the tests, BP had a value of 11.31% after 15 days from the beginning of the tests and a value of of 67% at the end of the test, after 30 days of cell growth while the flocculation activity is approximately 80% [45].
Algal draw weight (Figure 5) was measured using Macherey-Nagel filtersno.MN 640m dried at 95 °C for 24 h. The values obtained were from 10 mg/L after the first day of incubation, then increased to 25 mg/l after 15 days of incubation and reached 30 mg/l at the end of the tests.)
The experimental results concerning the change in oxygen production regarding the concentration of algal suspension in different concentrations of CBM are presented in Figure 6. The aspect of the experimental curve obtained from the studies indicates that the substance CBM has a toxic action on Chlorella algae, the descending curve of the representation Dx %, underlines the fact that the percentage production of oxygen presents negative values and draws attention to the fact that the toxicity in the algal cell increases with increasing the concentration of CBM. Analyzing the obtained results, it is found that all the concentrations of CBM analyzed have an inhibitory action on the production of oxygen through the photosynthesis of the algae Chlorella sp.
The percentage of inhibition having a negative value, the shape of the obtained curve indicates that the toxic influences the development of the algal suspension, implicitly photosynthesis. In the first phase, the curve is positioned vertically until the consumption of oxygen in the sample, the toxic having an algistatic action, after which, starting from the concentration of 40 µg/mL, the appearance of the curve is downward, the CBM action on the algal culture being algicidal. Chlorella has a high tolerance to the pollutant, the inhibition measured by oxygen production is low, the obtained curve indicates a moderate toxic action, a concentration of 20 µg/mL induces a 10% cellular inhibition, while a concentration of 100 µg/mL induces an inhibition of cell growth of approximately 14%. Higher concentrations do not dramatically inhibit algal cell development, having a 16% inhibition at a concentration of 150 µg/mL. (Figure 7)
Analyzing the obtained results, we notice that the higher the concentration of the toxic substance, the lower the amount of dissolved oxygen, the inhibition of cell growth increasing with CBM concentration. Chlorella possesses chloroplasts of different shapes, with a granular appearance, green, ovoid shape, slightly flattened and they have the role of allowing the passage of light to the chlorophyll molecule, triggering the photosynthesis process. Chloroplasts contain chlorophyll pigments that represent enzyme systems that participate in photosynthesis and that contain chlorophyll "a" and ‘b’. The chlorophyll "a" molecule has polarity: a hydrophilic end, which attracts water and a hydrophobic end, which repels water; In the center of the four pyrrolic nuclei is a Mg atom with Van der Waals bonds. The structure of chlorophyll molecules differs according to the nature of the groups they contain. For example, Chlorophyll “b” possesses an aldehyde group (-HC=O) instead of the methyl group (-C- CH3) that Chlorophyll “a” possesses [41,42,43].
In the presence of chlorophyll “a” and under light conditions, chloroplasts absorb light energy and transform it through catalytic systems into chemical energy. A role in photosynthesis is also played by carotenoids that transmit part of the light energy that they absorb to chlorophyll “a” and protect chlorophyll from photooxidation.
Chlorophyll "a" has the ability to receive light and initiate a chain of chemical reactions. During photosynthesis, chlorophyll pigments are not consumed, but intervene only through a catalytic action. The absorption spectrum of pigment molecules shows that they absorb red light at 660 nm. Chlorophyll "a" is the biochemical parameter that is an indicator of the biomass that gives information about the content of nutritional elements, the concentration of chlorophyll giving information about the stock of nutrients [42,43,46,47,48,49].
Chemical substances are degraded through different metabolic pathways, through the oxidation of carbon and hydrogen from organic substances, through the oxidation of nitrogen from nitrites, or from chemical substances that contain nitrogen in the molecule, hydrolysis or the removal of water at C = C atoms by addition to the double bond, splitting and forming C - C bonds by decarboxylating or carboxylating ketones, adding or removing the N atom in the form of NH3. In addition to the metabolic reactions of the cells, there are also reactions by which the toxic organic substances are inactivated and eliminated from the reaction medium through methylation, acetylation [44].
The fluorescence of living systems can be used for the determination of the potential damage to the photosystem. In these methods, chlorophyll (CHL) represents an internal probe of an organism’s photosynthetic capacity.
Following the tests performed, the values obtained (Figure 8) regarding the determination of the chlorophyll “a” content were between 0.27 µg/mL in the unincubated blank sample and 1.6 µg/mL in the blank sample incubated for 24 h respective had a chlorophyll “b”content between 3.5 µg /ml and 8.5 µg/mL in the incubated blank sample. The unincubated series had a content of chlorophyll "a" 0.19 µg/mL and chlorophyll "b" 6.9 µg/mL. for a concentration of 20 µg/mL CBM, chlorophyll "a" content 0.012 µg/mL respectively chlorophyll "b" content 1.96 µg/mL for a concentration 150 µg/mL CBM. The series of incubated samples had a chlorophyll "a" content of 1.2 µg/mL, respectively a chlorophyll "b" content of 8.5 µg/mL for a concentration of 20 µg/mL CBM and a chlorophyll "a" content of 0.05 µg/mL respectively chlorophyll "b" 2.09 µg/mL for a concentration of 150 µg/mL CBM.
The obtained results indicate that Chlorella sp. algae was inhibited by the presence of the toxic CBM. Therefore, considering the chlorophyll content as 100% in the blank samples, we conclude that yield of Chlorella sp. in the bioreactor that had the C1 (20 µg/mL) CBM concentration, the chlorophyll “a” extraction yield was 70.3% for the non-incubated series and 75% for the 24 h incubated series, respective the chlorophyll “b” extraction yield was 81.1% for the non-incubated series and 88.5% for the 24 h incubated series. (Figure 9). In the bioreactor that had the C3 (60 µg/mL) CBM concentration, the chlorophyll “a” extraction yield was 21.8% for the non-incubated series and 22.5% for the 24 h incubated series, respective the chlorophyll “b” extraction yield was 59.1% for the non-incubated series and 58.65% for the 24 h incubated series.
In the bioreactor that had the (150 µg/mL) CBM concentration, the chlorophyll “a” extraction yield was 4.4% for the non-incubated series and 2.1% for the 24 h incubated series, respective the chlorophyll “b” extraction yield was 23.1% for the non-incubated series and 21.7% for the 24 h incubated series. In the non-incubated series, the presence of the toxicant inhibited the development of Chlorella sp. with a higher yield than the incubated series. We assume that incubation under conditions conducive to cell development favors cell regeneration, which is why the yield of cell inhibition in the presence of the toxicant is lower in the incubated series compared to the non-incubated series [11].
Attenuated Total Reflectance Fourier Transform Infrared spectroscopy (ATR-FTIR) was used (Figure 10) to characterize the samples and has the potential to become applicable for the determination of cell biomass and composition from bioreactors. Each peak was assigned a functional group [45,46,47,48]. The surface chemistry of the samples was studied using an FTIR Spectrophotometer (Shimadzu IR TRACER-100, Kyoto, Japan) in the region of 4000–400 cm-1.
Cell walls are composed of peptidoglycan, energy is stored as glycogen and macromolecular composition are including : Nucleic acids and phosphoryl groups, silicate , lipids bands at 2930-2850 cm−1, protein amide I band mainly (C=O) stretching 1583-1700 cm−1, protein as (-CH2) and as (-CH3) bending of methyl, 1425-1477 cm−1, Nucleic Acid (other phosphate-containing compounds) (>P=O) stretching of phosphodiesters 1191-1356 cm−1, Carbohydrate (C-O-C) of Polysaccharides 1134-1174 cm−1, Carbohydrate (C-O-C) of polysaccharides Nucleic Acid (and other phosphate-containing compounds) (>P=O) stretching of phosphodiesters 1072-1099 cm−1 [49,50,51].
Proteins (amide I and II), lipids (methyl and methylene groups, esters), carbohydrates (starch, cellulose from 1100 cm−1 to 900 cm−1), cellulose (bands at 1162 cm−1, 1060 cm−1, 1030 cm−1) and pectin (bands at 1610 cm−1, 1424 cm−1, 960 cm−1). Carboxilic group of esters (bands 1720-1700 cm−1), positions belong to protein (amides I and II), seen at 1050 cm−1 and 1012 cm−1) [25,45].
In Figure 11 is presented the graph obtained after the FTIR scan of CBM, 100 ppm aqueous solution. In the alcoholic environment, the hydrolysis reaction accelerates. Hydrolysis breaks the double ethylene bond with the formation of 2-chlorobenzaldehyde and malonic nitrile [25,43,44].
The metabolism of CBM proceeding through an initial hydrolysis to 2-chlorobenzaldehyde and through reduction to 2-chlorobenzylmalononitrile (dihydro-CS), the carbon atoms of CS are lost as malononitrile, which is partially metabolised to cyanide and thiocyanate, hydrolysis to the carboxylic acid [47].
Following the metabolic reactions in the cell of the Chlorella sp microorganism and following the chemical reactions in the reaction medium, functional groups can result, which contain compounds C=NH-, -CH, -NH2, methyl and methylene groups, esters), from 1100 to 900 cm−1, carboxylic group of esters (bands 1720-1700 cm−1), (C=O) stretching 1583-1700 cm−1, (-CH2) and as (-CH3) bending of methyl 1425-1477 cm−1 [48,49,50,51,52,53].
In Figure 12, the FTIR graph is presented, in which section (A) shows a suspension of Chlorella sp. before extracting the chlorophyll pigment, in section (B) Chlorella sp suspension the blank, after the chlorophyll was extracted, presented a Transmittance of 58%. In the section (C), suspension Chlorella sp. in the presence of the toxic CBM (20 µg/mL), a Transmittance of 59% was recorded and in section (D) the analyzed sample was Chlorella sp suspension in the presence of the toxic CBM (60 µg/mL) and indicated a Transmittance of 64.%. In section (E) suspension Chlorella sp. in the presence of the toxic CBM (100 µg/mL) and indicated a Transmittance of 68.%. and in section (F) suspension Chlorella sp. in the presence of the toxic CBM (150 µg/mL) indicated a Transmittance of 72.%.
Following the determination of chlorophyll content the FTIR scanning of the samples, we noticed that as the concentration of chlorophyll in the sample decreases due to the cellular inhibition generated by the presence of the toxic CBM, the band at 1045 cm-1 increases, indicating an increasingly high transmittance (Figure 12) The interpretation we give is associated with the fact that the presence of the toxicant in the samples creates a chemical stress and the photosynthesizing apparatus of Chlorella sp. is destroyed, the chlorophyll pigment is found in a gradually lower concentration and the fact that the peak increases around the corresponding value of carbohydrates (starch, cellulose from 1100 to 900 cm−1), we attribute this to the fact that the cell wall of the alga Chlorella is destroyed due to the concentration gradient by the gradual addition of CBM. Thus, by centrifuging the sample in order to extract chlorophyll, components of the cell wall are also found in the analyzed suspension. The Chlorella sp. cell in the reaction medium metabolizes part of the toxic CBM and following this process in the sample could be found metabolic products that come from the conversion of CBM into 2-chlorobenzyl malonononitrile and 2-chlorobenzaldehyde. As the concentration of chlorophyll decreases due to the presence of the toxic CBM, the transmittance (T%) is increasing. The interpretation of this modification could be associated with the fact that it accumulates toxic agent in the analyzed sample, Chlorella destroy toxic CBM and it accumulates metabolic products resulting from the metabolism of CBM [54,55,56,57,58,59]. Images regarding the appearance of the surface structure by SEM spectroscopy of Chlorella sp. in the presence of different concentrations of CBM are shown in Figure 13. The membrane remains intact, which means that enzyme activity in the reaction center is possible.
The addition of CBM in the reaction medium generates chemical stress in the bioreactors and affects the permeability of the cell by the fact that photosynthetic electron transport is blocked [56]. The chemical stress generated by CBM prevents the cellular development of the algae, destroys its enzymatic system, which generates cell death. Chlorella has the highest survival rate in the environment contaminated with CBM and has a rapid response ability to toxic stimuli [16,25].. The cell viability percentage (Figure 14) was above 97.4% for the 20 µg/mL CBM concentration and 74% for the 150 µg/mL CBM concentration.
It is known that the amount of chlorophyll is proportional to the intensity of photosynthesis. In the case of our tests, it was found that the chemical stress generated a gradual fluorescence, inducing in the chlorophyll molecule an inhibition of the photosynthesizing apparatus [57,58].
This was observed by analyzing the fluorescence of chlorophyll the results indicated that gradual concentrations of CBM gradually inhibit photosynthesis in the chlorophyll molecule [59]. By inhibiting photosynthesis, the mechanism involved in cellular development processes is destroyed. The chemical stress in which the analyzed suspensions were situated generated a gradual fluorescence, proportional to the amount of toxic introduced into the bioreactor.
The cyanogenic properties of CBM were investigated and demonstrated the hydrolysis of o-chlorobenzylidene malononitrile to malononitrile, the latter being converted to cyanide. The cyanogenic properties of o-chlorobenzylidene malononitrile are due to the fact that the cyanide produced as a metabolite of this substance is extremely toxic [59,60].
We assume that this disturbs the operation of the photosynthesizing apparatus of the Chlorella sp. microorganism, leading to a reduction in cell growth due to oxidative stress [18]. We assume that for this reason the amount of chlorophyll in the sample decreases and the fluorescence emission of chlorophyll changes directly proportional to cell inhibition because chlorophyll “a” is the pigment that participates in the energy transfer to the enzymatic reaction centers in the algal cell [60,61,62,63].
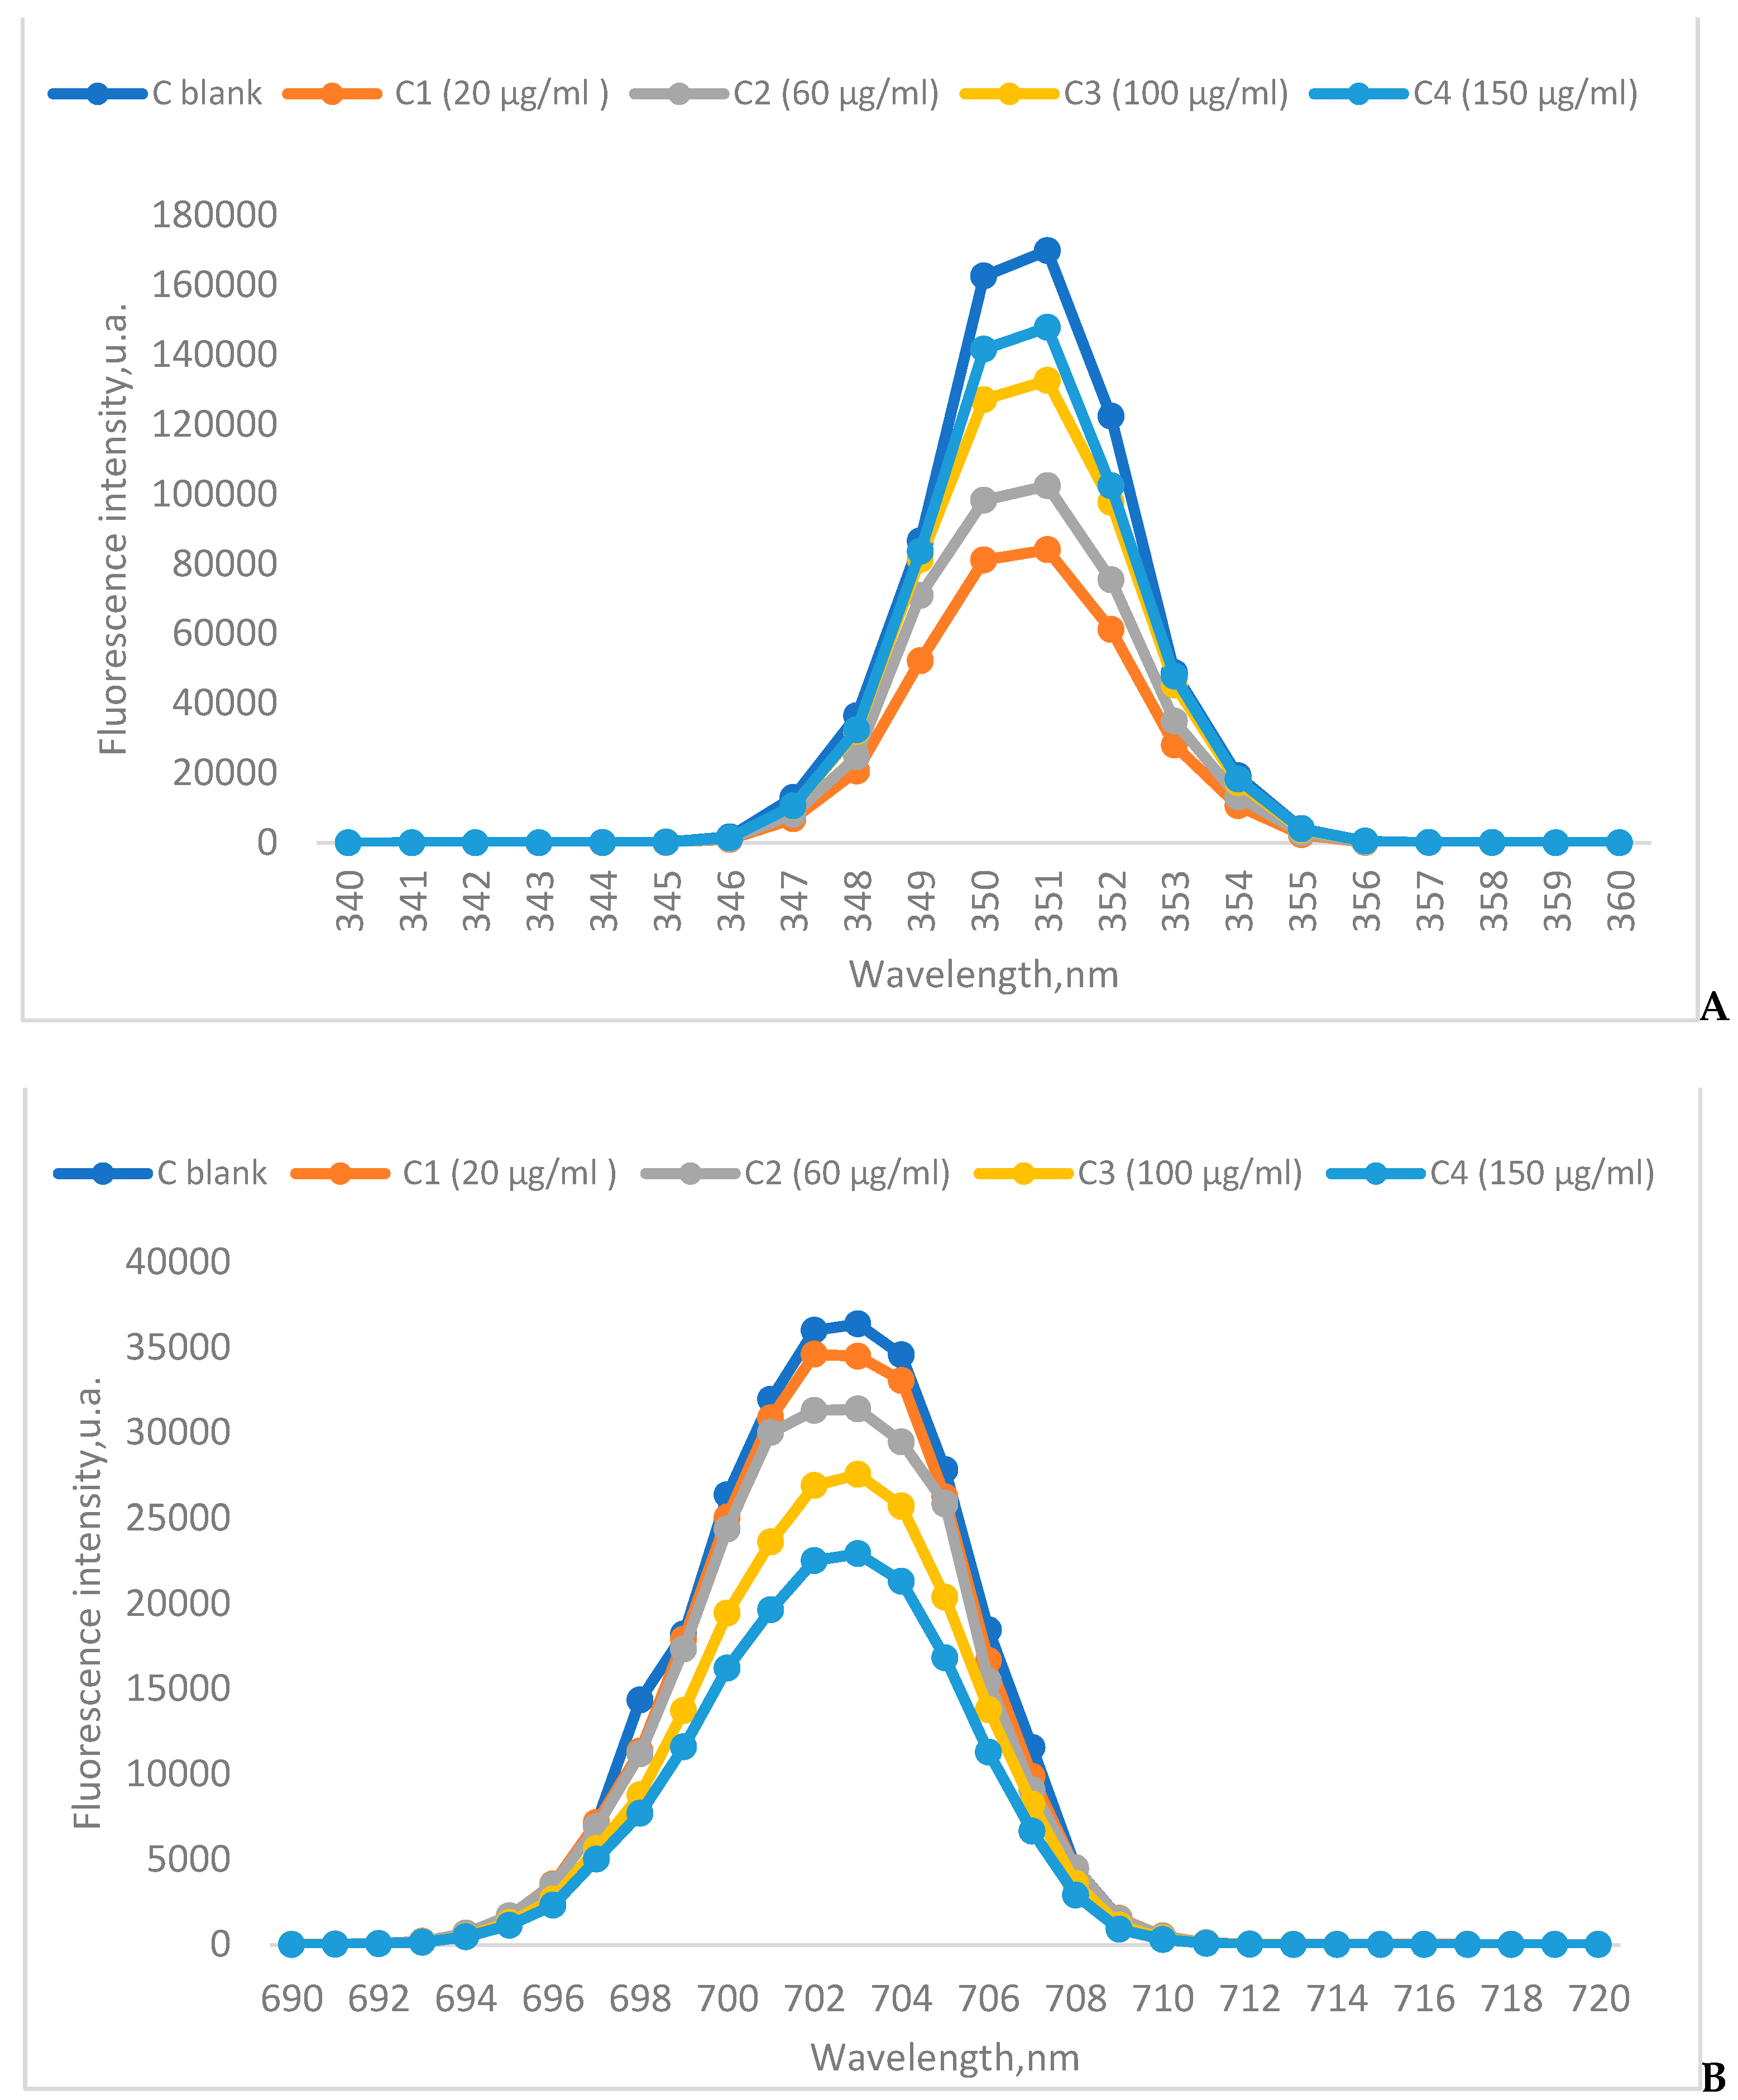
Fluorescence measurements were made after 24 h of sample incubation (Figure 15) [63,64,65]. After analyzing the results obtained regarding the fluorescence emission presented graphically, we obtained values of the gradual fluorescence intensity, directly proportional to the concentration of chlorophyll in the samples. The interpretation of the fluorescence spectrum is based on the principle according to which the chlorophyll molecule was hit by an electromagnetic radiation and was excited, which generated the jump of an electron from a close orbital to a more distant one. This transition is unstable and the electron returns to its original position or is given to another molecule. The emission of radiation by the chlorophyll molecule is based on this principle [60,61,62]. This radiation differs from the radiation that hit the molecule with a lower energy and a longer wavelength, this de-excitation process generates the fluorescence of the chlorophyll molecule contained in the algal suspensions.
The fluorescence curves we obtained show that after excitation at a wavelength of 350 nm we obtained a peak intensity of approximately 175 000 u.a. in the blank sample, approximately equal to the intensity obtained after the excitation of the sample containing 20 µg/mL CBM (160000u.a.). The sample containing 150 µg/mL CBM had a fluorescence intensity of 80 000 u.a. For the pulse obtained when the sample was excited at 700 nm, we obtained for the sample containing 20 µg/mL CBM a fluorescence intensity of 35 000 u.a. and the sample containing 150 µg/mL CBM had a fluorescence intensity of 22 000 u.a. If we consider the peak fluorescence emission for the blank as 100%, we can consider that the fluorescence emission for the sample of 150 µg/mL CBM was 53.5% of the intensity of the blank at the wavelength of 350 nm and 55% from the intensity of the blank at the wavelength of 700 nm.
To observe the fluorescence in more detail, 3D measurements of the fluorescence spectrum were made using the RF-6000 3D spectrofluorophotometer after 24h of incubation. In the graphic representation, the fluorescence of blank samples is highlighted compared to the fluorescence of sample F (150 µg/mL CBM). The fluorescence wavelength (Em) was set for scanning between 200-900 nm as it is displayed on the horizontal axis, the fluorescence intensity is represented by different colors (Figure 16) an intense fluorescence can be observed with two absorption peaks of maximum intensity at a wavelength of 350 nm and 700 nm.
5. Conclusions
Following the experiments carried out, it was observed that the algae Chlorella sp. high tolerance to the toxic cbm, the inhibition of cell development generated by different concentrations of CBM measured by oxygen production is small, the curve obtained after measuring the process of algal assimilation and oxygen consumption indicates a moderate toxic action.The values obtained for pH during the adaptation period of the Chlorella sp. culture were between 6.0 and 6.8, O2 had values between 6.5 and 7.0 mg/l and the conductivity 165-210 µS/cm. The amount of chlorophyll decreases as the CBM concentration in the samples increases. When the chemical stress yield increases, the fluorescence yield decreases. Algae biocoagulation is useful information that could have applicability in the bioremediation of the CBM toxic environment because Chlorella sp. showed cellular stability in the presence of chemical stress with the formation of conglomerates that protect the cellular structure.
After considering the experimental results, it was concluded that microbiological cultures of Chlorella sp. are responsiv bioindicators of stress conditions and are sensitive to CBM. The sensitivity of agae cells has made them as alternative models to microorganisms for biomonitoring studies and assessment of chemical toxicity. Chemicals in contact with microorganisms are used by them in the biochemical processes in which they are involved, in metabolic reactions, organic substances are the source of carbon and energy for the biochemical processes through which they obtain the necessary energy for vital activities. Even a concentration of 20 µg/mL CBM produces observable effects on algal biomass generating toxicity on cells, inhibiting photosynthesis and implicitly cell development. Therefore, ecotoxicity tests could be considered a useful tool not only in laboratory tests but also in hazardous wastewaters management. By supplementing the biofauna in the contaminated areas with suspensions of Chlorella sp. positive results are expected in order to improve the quality of environmental factors affected by the presence of pollutants at concentration levels that represent a significant risk for the environment and human health. Our research indicated that using bioremediation for the degradation of toxic organic compound is safe and economical as compared to physico-chemical treatment. In our future tests, we aim to analyze the cell regeneration capacity of Chlorella sp. in optimal conditions of temperature and light correlated with their evolution in chemical stress, the permeability of the cytoplasmic membrane, the production or fixation of CO2 and the absorption processes for a certain chemical compound, we aim to observe the aggregate stability of the cell wall, the factors that condition the presence of colloidal structures (temperature, pH, zeta potential, conductivity). We also to study the enzymatic action of the hydrolytic enzymes involved in the detoxification mechanisms peroxidase (Px), superoxide dismutase (SOD), catalase (CAT) and glutathione reductase (GR). In additon to that, we will try to establish chemical-biological intervention protocols by researching and quantifying a dose-response relationship between the intensity of chemical indicators and the response of target microorganisms.
References
- D. Kaszeta Restrict use of riot-control chemicals, Nature, 2019, Vol. 573, No 27,.
- A.M.B. Zekri et all Acute mass burns caused by o-chlorobenzylidene malononitrile (CS) tear gas Burns, Volume 21, Issue 8, 1995, Pages 586-589 . [CrossRef]
- P. J. Anderson et all., Acute effects of the potent lacrimator o-chlorobenzylidene malononitrile (CS) tear gas Human end experimental toxicology,1996, doi: 10.1177/096032719601500601. [CrossRef]
- 4. Anderson CO Tsang, et all., Health risks of exposure to CS gas (tear gas): an update for healthcare practitioners in Hong Kong, Hong Kong Med J , Volume 26 No. 2 , 2020. [CrossRef]
- J R. Riches et all. ,The development of an analytical method for urinary metabolites of the riot control agent 2-chlorobenzylidene malononitrile (CS), Journal of Chromatography B, No. 928, 2013, Pages 125-130. [CrossRef]
- 6. Y. Dimitroglou et all., Exposure to the Riot Control Agent CS and Potential Health Effects: A Systematic Review of the Evidence, J. Environ. Res. Public Health 2015, 12, 1397-1411. [CrossRef]
- Kluchinsky TA, et all. Liberation of hydrogen cyanide and hydrogen chloride during high-temperature dispersion of CS riot control agent. AIHA J (Fairfax, V) 2002; 63: 493–496. [CrossRef]
- Peter G. Blain , Tear Gases and Irritant Incapacitants 1-Chloroacetophenone, 2-Chlorobenzylidene Malononitrile and Dibenz [B,F].-1,4-Oxazepine Toxicological Reviews volume 22, pages103–110 (2003). [CrossRef]
- E. J. Olajos, H.Salem Riot control agents: pharmacology, toxicology, biochemistry and chemistry Journal of applied toxicology Volume21, Issue5, 2001, Pages 355-391.
- K. Blaho-Owens Chemical crowd control agents Encyclopedia of Forensic and Legal Medicine, 2005, Pages 319-325. [CrossRef]
- Possible lethal effects of CS tear gas on Possible lethal effects of CS tear gas on Branch Davidians during the Branch Davidians during the FBI raid on the Mount Carmel compound FBI raid on the Mount Carmel compound near Waco, Texas near Waco, Texas April 19, 1993.
- Directive 2008/32/EC of the European Parliament and of the Council of 11 March 2008 amending Directive 2000/60/EC establishing a framework for Community action in the field of water policy, as regards the implementing powers conferred on the Commission.
- Rice, D. Jones, and D. Stanton, A literature review of the solvents suitable for the police CS spray device, Chemical & Biological Defence Establishment, Salisbury, 1997.
- Y. Agrawal, Daniel Thornton, Alan Phipps, CS gas—Completely safe? A burn case report and literature review, Burns, Volume 35, Issue 6, 2009, Pages 895-897. [CrossRef]
- Evaluation Report Enzymatic Decontamination of Chemical Warfare Agents UNITED STATES ENVIRONMENTAL PROTECTION AGENCY RESEARCH TRIANGLE PARK, NORTH CAROLINA 2771 EPA 600/R-12/033 | 2013.
- M. Salem, et all., Riot Control Agents, Encyclopedia of Toxicology (Third Edition) 2014, Pages 137-154. [CrossRef]
- R. Borusiewicz Chromatographic analysis of the traces of 2-chlorobenzalmalononitrile with passive adsorption from the headspace on Tenax TA and Carbotrap 300 Forensic Science International Volume 303, October 2019, 109933. [CrossRef]
- Analysis of the Toxicity Hazards of Methylene Chloride Associated with the Use of Tear Gas at the Branch Davidian Compound at Waco, Texas, on April 19, 1993.
- Gheorghe, V.; Gheorghe, C.G.; Bondarev, A.; Somoghi, R. Ecotoxicity of o-Chlorobenzylidene Malononitrile (CBM) and Toxicological Risk Assessment for SCLP Biological Cultures (Saccharomyces sp., Chlorella sp., Lactobacillus sp., Paramecium sp.). Toxics 2023, 11, 285. [CrossRef]
- 20. Yu-Chen Chang et all, The effect of different in situ chemical oxidation (ISCO) technologies on the survival of indigenous microbes and the remediation of petroleum hydrocarbon-contaminated soil Process Safety and Environmental Protection, Volume 163, July 2022, Pages 105-115. [CrossRef]
- V Gheorghe, CG Gheorghe, A Bondarev, CN Toader, The contamination effects and toxicological characterization of o-Chlorobenzylidene Manolonitrile Revista de chimie 71 (12), 67-75. [CrossRef]
- S R. Subashchandrabose et all., Bioremediation of soil long-term contaminated with PAHs by algal–bacterial synergy of Chlorella sp. MM3 and Rhodococcus wratislaviensis strain 9 in slurry phase, Science of The Total Environment, Volume 659, 1 April 2019, Pages 724-731. [CrossRef]
- M Chenet all., Study on soil physical structure after the bioremediation of Pb pollution using microbial-induced carbonate precipitation methodology, Journal of Hazardous Materials, Volume 411, 5 June 2021, 125103. [CrossRef]
- N Mohd Nasir et all., Utilization of microalgae, Chlorella sp. UMT LF2 for bioremediation of Litopenaeus vannamei culture system and harvesting using bio-flocculant, Aspergillus niger, Biocatalysis and Agricultural Biotechnology, Volume 47, January 2023, 102596. [CrossRef]
- V. Gheorghe, C.G. Gheorghe et all., Synthesis, Purity Check, Hydrolysis and Removal of o-Chlorobenzyliden Malononitrile (CBM) by Biological Selective Media, Toxics, 2023, 11(8):672., doi: 10.3390/toxics11080672.
- Zhang Y et all., Photosynthesis Responses of Tibetan Freshwater Algae Chlorella vulgaris to Herbicide Glyphosate Int. J. Environ Res Public Health. 2022 Dec 26;20(1):386. [CrossRef]
- E. Posadas et. all., Influence of pH and CO2 source on the performance of microalgae-based secondary domestic wastewater treatment in outdoors pilot raceways Chemical Engineering Journal 265 (2015) 239–2.
- Slovacey, R.E. and Hanna, P.J. In vivo fluorescence determinations of phytoplancton chlorophyll, Limnology & Oceanography 22,5 (1977), p. 919-925. [CrossRef]
- SR 13328, 1996, R30, Wather quality. Aquatic organisms tests. Pollutants toxicity determinations compared to green algae ICS 1306040.
- OECD GUIDELINES FOR THE TESTING OF CHEMICALS of the Organisation for Economic Cooperation and Development (OECD),.
- R. Sirohi et. all., Design and applications of photobioreactors- a review Bioresource Technology 349 (2022) 126858. [CrossRef]
- C. G. Gheorghe, et all., Testing of Bacterial and Fungal Resistance in the Water Pollution with Cationic Detergents Chemistry Journal, 62 (7), 707-711.
- H Yu et. All., Weighted gene Co-expression network analysis (WGCNA) reveals a set of hub genes related to chlorophyll metabolism process in chlorella (Chlorella vulgaris) response androstenedione, Environmental Pollution Volume 306, 2022, 119360. [CrossRef]
- R.J. Porra, W.A. Thompson, P.E. Kriedemann Determination of accurate extinction coefficients and simultaneous equations for assaying chlorophylls a and b extracted with four different solvents: verification of the concentration of chlorophyll standards by atomic absorption spectroscopy Biochimica et Biophysica Acta, 975 (1989) 384-394 Elsevier BBABIO 43036 , Elsevier Science Publishers B.V. (Biomedical Division).
- 35. S. Wei et. all., Biomass production of Chlorella pyrenoidosa by filled sphere carrier reactor: Performance and mechanism, Bioresour Technol., 2023 Sep:383:129195 Epub 2023. [CrossRef]
- 36. Yuanyuan Su et all., Biodegradable and conventional microplastics posed similar toxicity to marine algae Chlorella vulgarisAquatic Toxicology, Volume 244, March 2022, 106097. [CrossRef]
- Gheorghe, C.G.; Dusescu, C.; Carbureanu, M. Asphaltenes biodegradation in biosystems adapted on selective media. Rev. Chim. 2016, 67, 2106–2110.
- Gheorghe, C.G.; Pantea, O.; Matei, V.; Bombos, D.; Borcea, A.-F. Testing the behavior of pure bacterial suspension (Bacillus subtilis, Pseudomonas aeruginosa and Micrococcus luteus) în case of hydrocarbons contaminators. Rev. Chim. 2011, 62, 926–929.
- 39. CG Gheorghe, AFBorcea, Pantea, O, V. Matei, D. Bombos The Efficiency of Flocculants in Biological Treatment with Activated Sludge Revista de chimie 62 (10), 1023-1026.
- David WetzelJustin Murdock FT-IR Microspectroscopy Enhances Biological and Ecological Analysis of Algae Applied Spectroscopy Reviews 44(4):335-361 June 2009.
- D Surendhiran, MVijay Influence of bioflocculation parameters on harvesting Chlorella salina and its optimization using response surface methodology Journal of Environmental Chemical Engineering, Volume 1, Issue 4, December 2013, Pages 1051-1056. [CrossRef]
- R.J. Porra, W.A. Thompson, P.E. Kriedemann Determination of accurate extinction coefficients and simultaneous equations for assaying chlorophylls a and b extracted with four different solvents: verification of the concentration of chlorophyll standards by atomic absorption spectroscopy Biochimica et biophysica Acta, 975 (1989) 384-394 Elsevier BBABIO 43036.
- 43. R. B. Flück Cellular toxicity pathways of inorganic and methyl mercury in the green microalga Chlamydomonas reinhardtii Scientific reports, 2017, 7: 8034. [CrossRef]
- L. Leadbeater, G.L. Sainsbury, D. Utley ortho-Chlorobenzylmalononitrile: A metabolite formed from ortho-chloro-benzylidenemalononitrile (CS) Toxicol. Appl. Pharmacol., 25 (1973), p. 111.
- Justin N. Murdock, David L. Wetzel, FT-IR Microspectroscopy Enhances Biological and Ecological Analysis of Algae, Applied Spectroscopy Reviews , Volume 44, Issue 4, 2009. [CrossRef]
- Eugene J. Olajos, Harry Salem Riot control agents: pharmacology, toxicology, biochemistry and chemistryJournal of Applied ToxicologyVolume 21, Issue 5Sep 2001, Pages 353-434. [CrossRef]
- J R. Riches et all., The development of an analytical method for urinary metabolites of the riot control agent 2-chlorobenzylidene malononitrile (CS), Journal of Chromatography B, Volume 928, 1 June 2013, Pages 125-130. [CrossRef]
- Ying Liang , John Beardall and Philip Heraud, Changes in growth, chlorophyll fluorescence and fatty acid composition with culture age in batch cultures of Phaeodactylum tricornutum and Chaetoceros muelleri (Bacillariophyceae), Botanica Marina, Volume 49 Issue 2 . [CrossRef]
- Li et. all., Toxicity of Tetracycline and Metronidazole in Chlorella pyrenoidosa Int J Environ Res Public Health , 2023 (4):3623. [CrossRef]
- 50. S. Sravan Kumar et all., Fourier transform infrared spectroscopy (FTIR) analysis, chlorophyll content and antioxidant properties of native and defatted foliage of green leafy vegetables, Journal of Food Science and Technology volume 52, pages8131–8139 (2015). [CrossRef]
- 51. L. J. Hazeem et all., Investigation of the toxic effects of different polystyrene micro-and nanoplastics on microalgae Chlorella vulgaris by analysis of cell viability, pigment content, oxidative stress and ultrastructural changes Mar Pollut Bull , 2020, 156:111278. [CrossRef]
- Bastert J, Korting HC, Traenkle P, Schmalreck AF Identificationof Dermatophytes by Fourier Transform Infrared Spectroscopy.Mycoses , 1999, ISSN 09333. 42: 525-528.
- Hirschmugl, C.J., Bayarri, Z.E., Bunta, M., Holt, J.B., and Giordano, M. (2006) Analysis of the nutritional status of algae by Fourier transform infrared chemical imaging. Infrared Phys. Tech., 49: 57–63. 22.
- Rudolf E. Slovacek, Patrick J. Hannan, In vivo fluorescence determinations of phytoplankton chlorophyll “a” Lumnology and oceanography, Volume22, Issue5, September 1977, Pages 919-925, doi/10.4319/lo.1977.22.5.0919.
- R.J. Porra, W.A. Thompson, P.E. Kriedemann, Determination of accurate extinction coefficients and simultaneous equations for assaying chlorophylls a and b extracted with four different solvents: verification of the concentration of chlorophyll standards by atomic absorption spectroscopy, Biochimica et Biophysica Acta (BBA) - Bioenergetics, Volume 975, Issue 3, August 1989, Pages 384-394. [CrossRef]
- A. Volgusheva et. all., Acclimation Response of Green Microalgae Chlorella Sorokiniana to 2,3',4,4',6-Pentachlorobiphenyl Photochem Photobiol. 2023, 99(4):1106-1114. [CrossRef]
- R. S. Dhivare1, S. S. Rajput Malononitrile: A Versatile Active Methylene Group , International Letters of Chemistry, Physics and Astronomy Online: 2015-08-04 ISSN: 2299-3843, Vol. 57, pp 126-144. [CrossRef]
- S.Hyun Park et all., A Study for Health Hazard Evaluation of Methylene Chloride Evaporated from the Tear Gas Mixture, Safety and Health at Work, Volume 1, Issue 1, September 2010, Pages 98-101. [CrossRef]
- Xiaoli Li et. All., Rapid Determination of Chlorophyll “a”and Pheophytin in Green Tea Using Fourier Transform Infrared Spectroscopy, Molecules 2018, 23(5), 1010. [CrossRef]
- Yu Gao et all., Colorimetric and turn-on fluorescent chemosensor with large stokes shift for sensitively probing cyanide anion in real samples and living systems, Spectrochimica Acta Part A: Molecular and Biomolecular Spectroscopy, Volume 271, 15 April 2022, 120882. [CrossRef]
- A Marcek Chorvatova et all., Time-resolved endogenous chlorophyll fluorescence sensitivity to pH: study on Chlorella sp. algae Methods Appl Fluoresc, 2020, Mar 2;8(2):024007. [CrossRef]
- Yuna Jung et all.,Latent turn-on fluorescent probe for the detection of toxic malononitrile in water and its practical applications, Analytica Chimica Acta, Volume 1095, 25 January 2020, Pages 154-161. [CrossRef]
- M Valicaa, M Pipíškaa,, S. Hostina Effectiveness of Chlorella vulgaris inactivation during electrochemical water treatment Desalination and Water Treatment 138 (2019) 190–199.
- G. M. Vingiani Microalgal Enzymes with Biotechnological Applications, Mar. Drugs 2019, 17 (8), 459. [CrossRef]
- Qiang Xiong et all. Ecotoxicological effects of enrofloxacin and its removal by monoculture of microalgal species and their consortium Environmental PollutionVolume 226, July 2017, Pages 486-493. [CrossRef]
Figure 1.
Evolution of cell growth and viability of algal cells during the testing period.
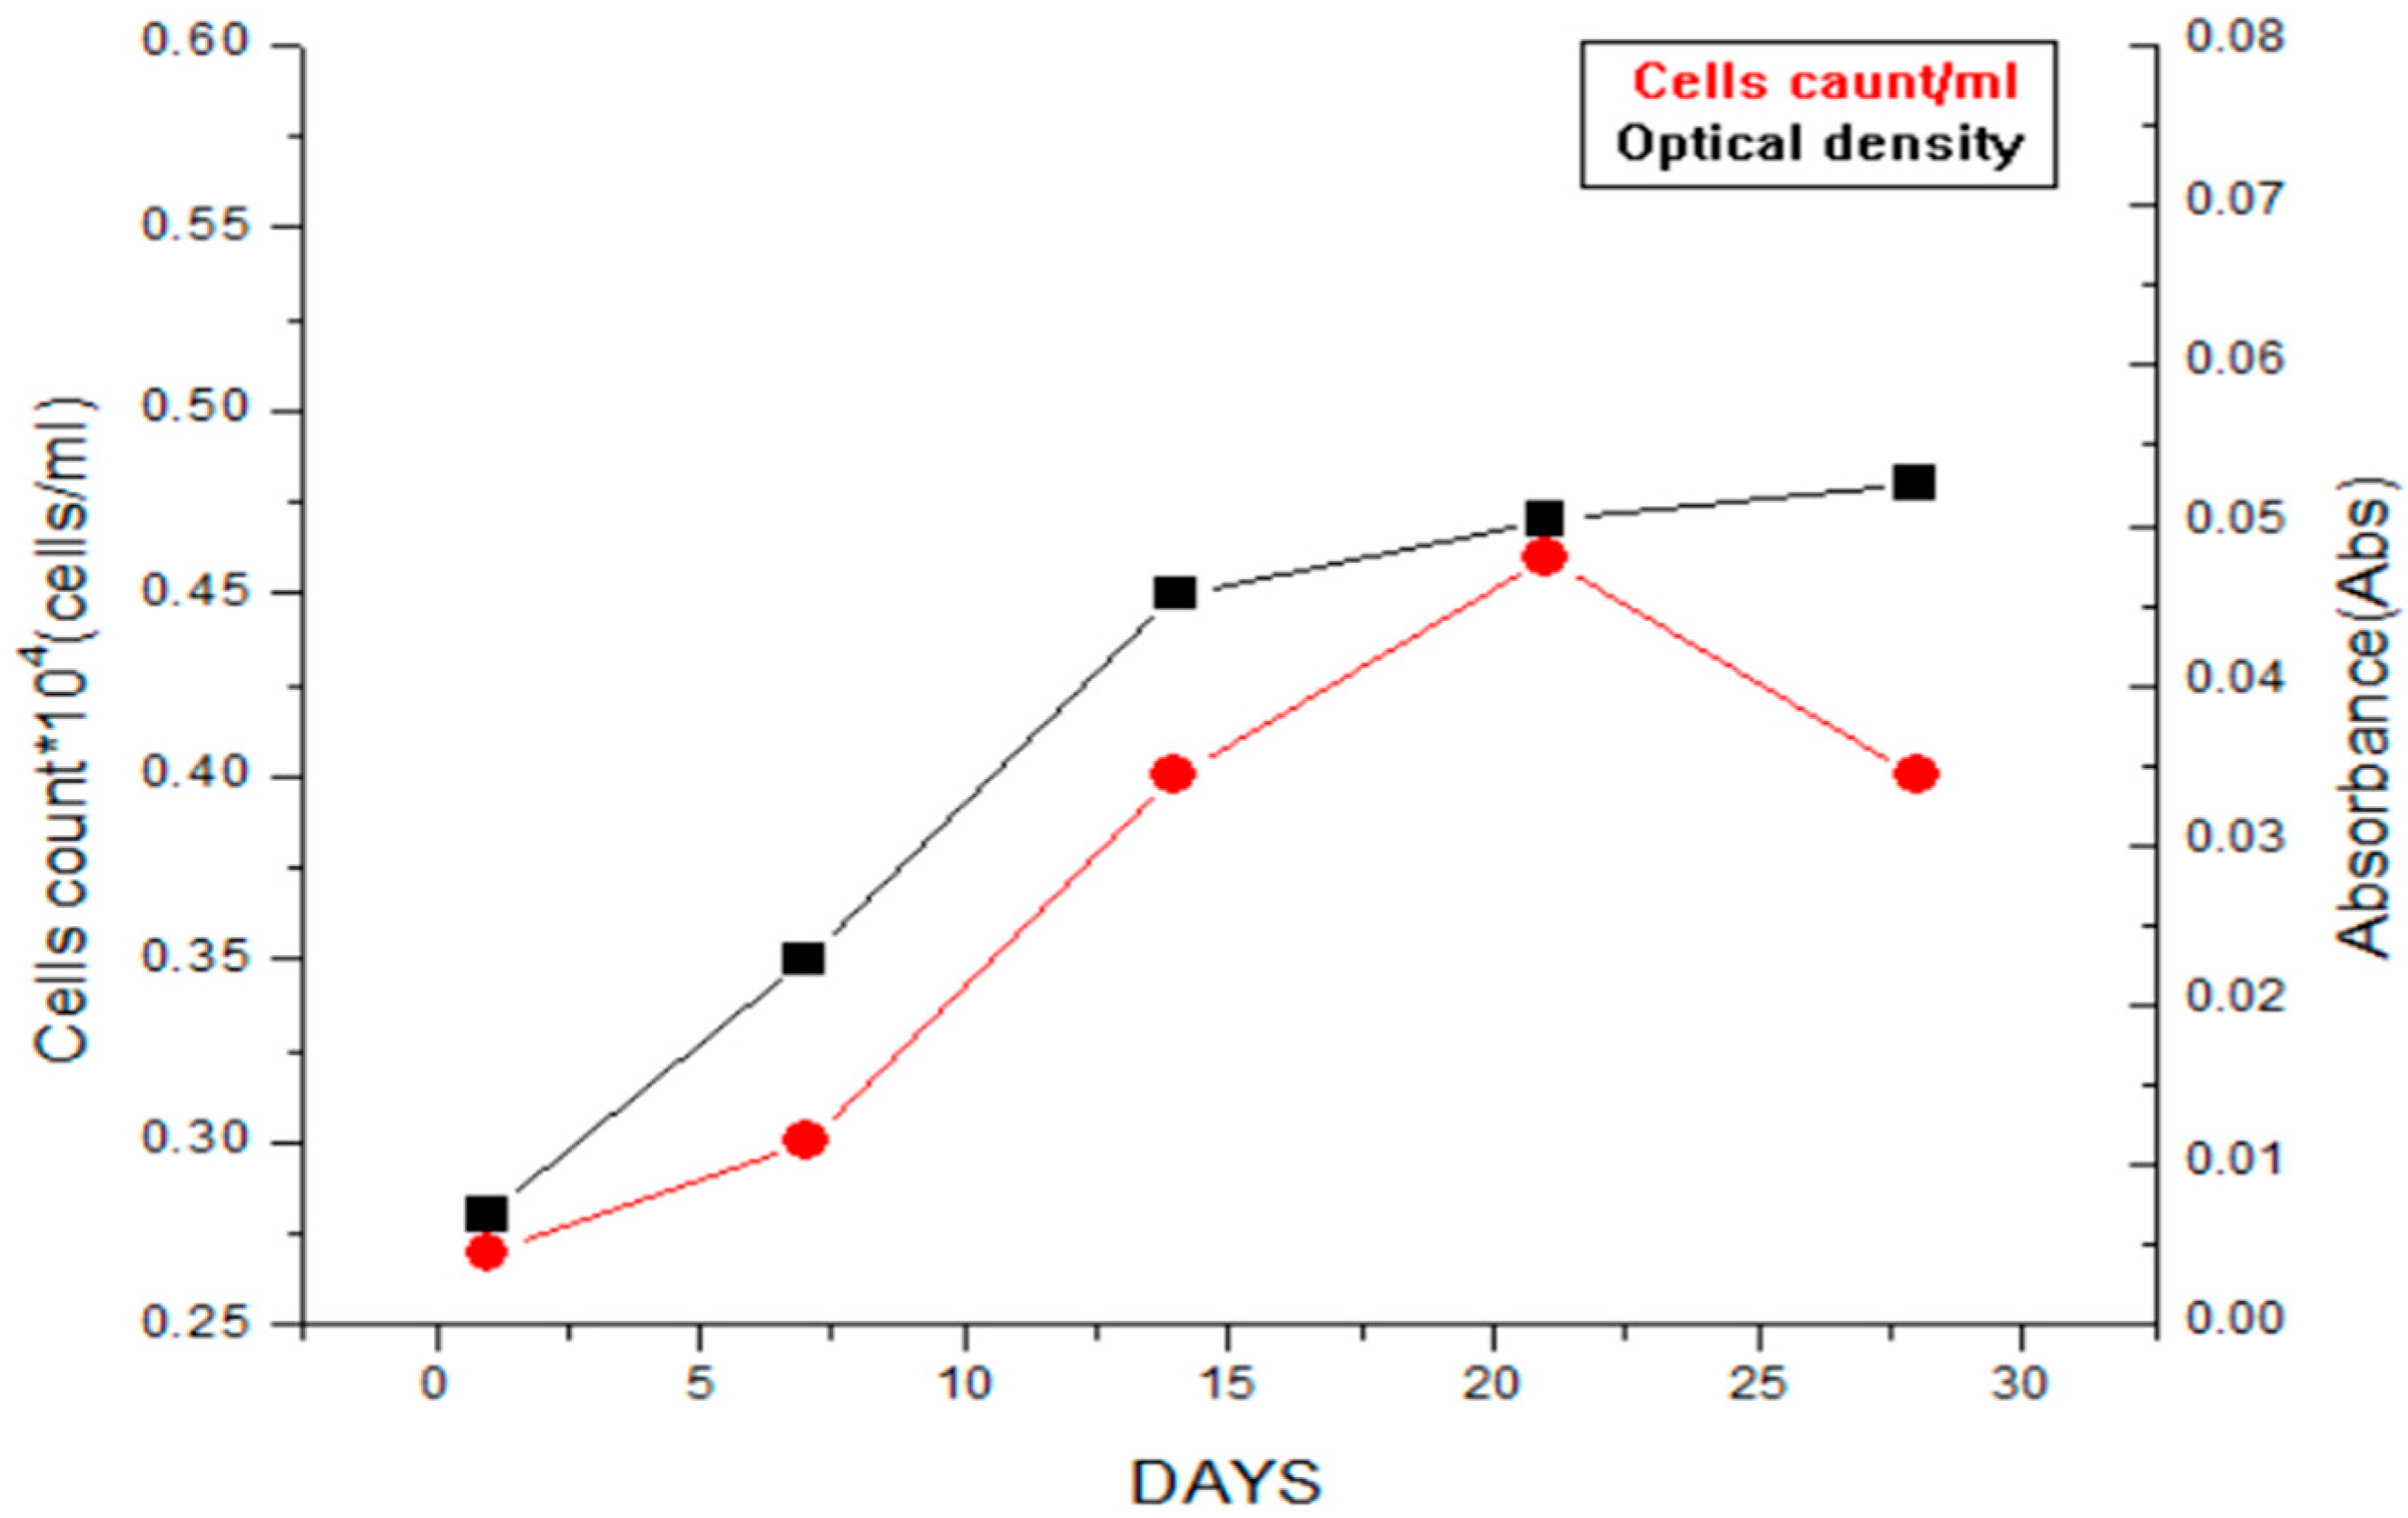
Figure 2.
Grow curve of Chlorella sp.
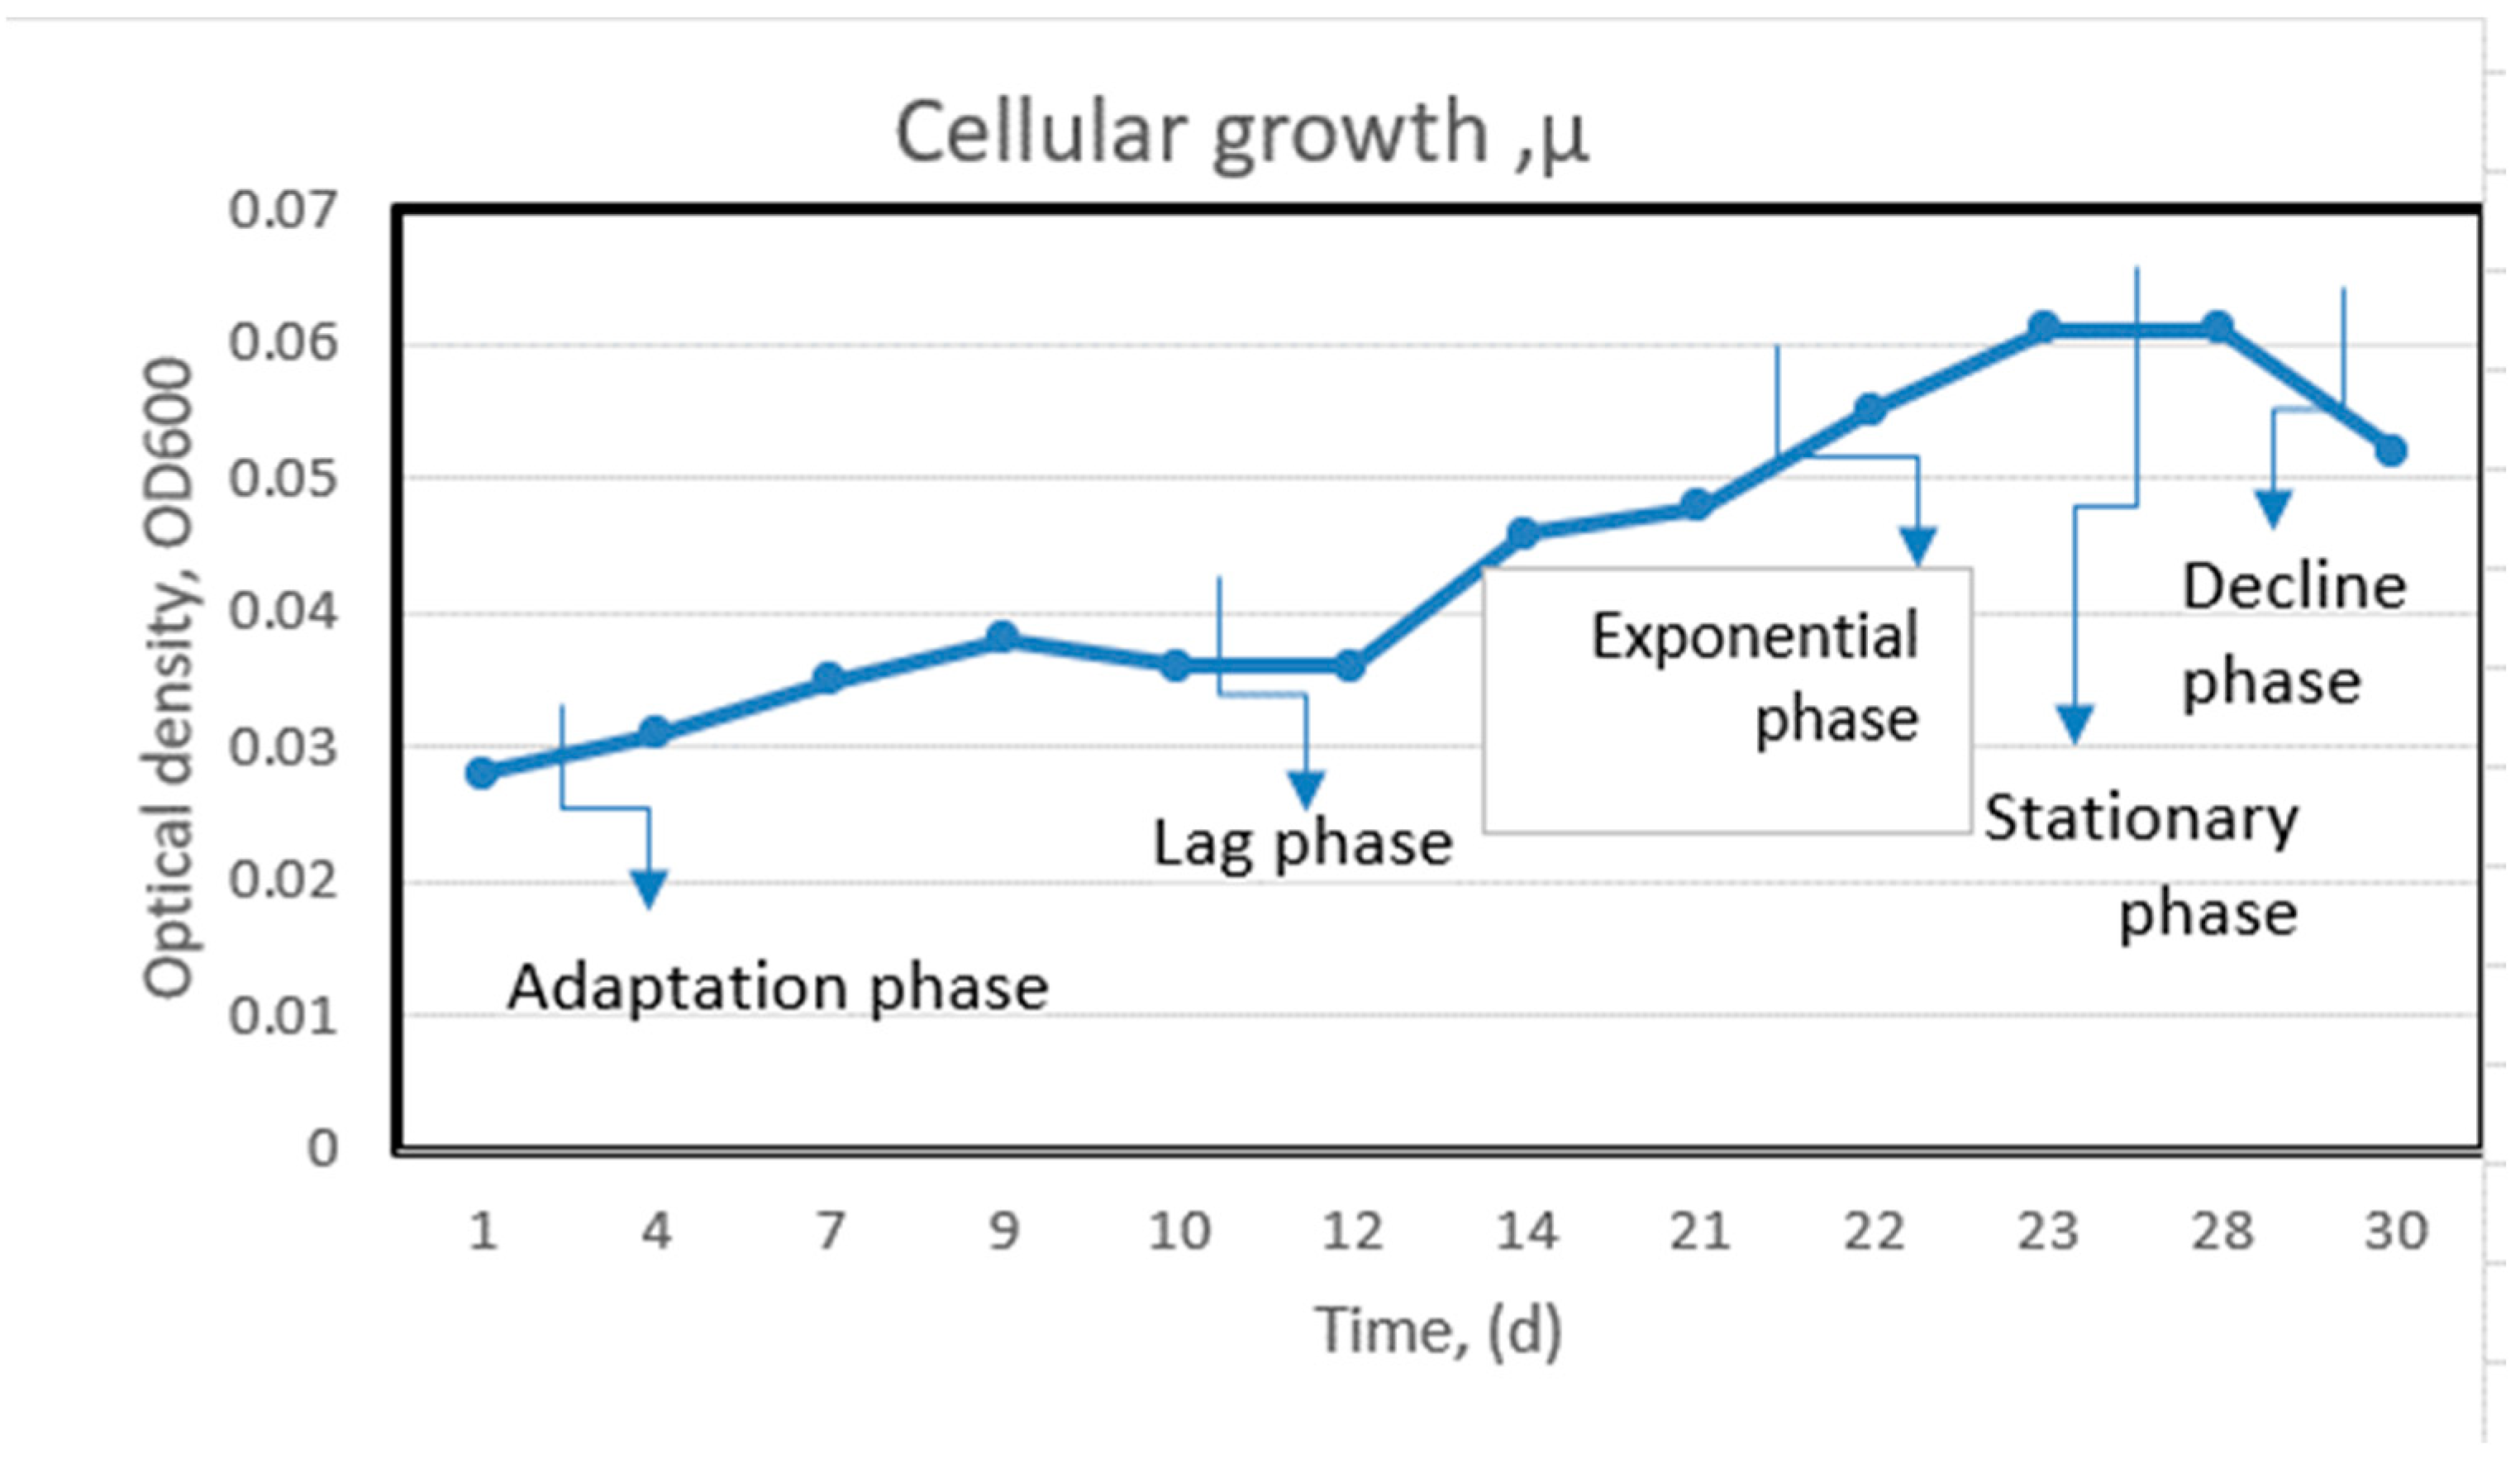
Figure 3.
Evolution of pH (A) and conductivity (B) during the cell development period.
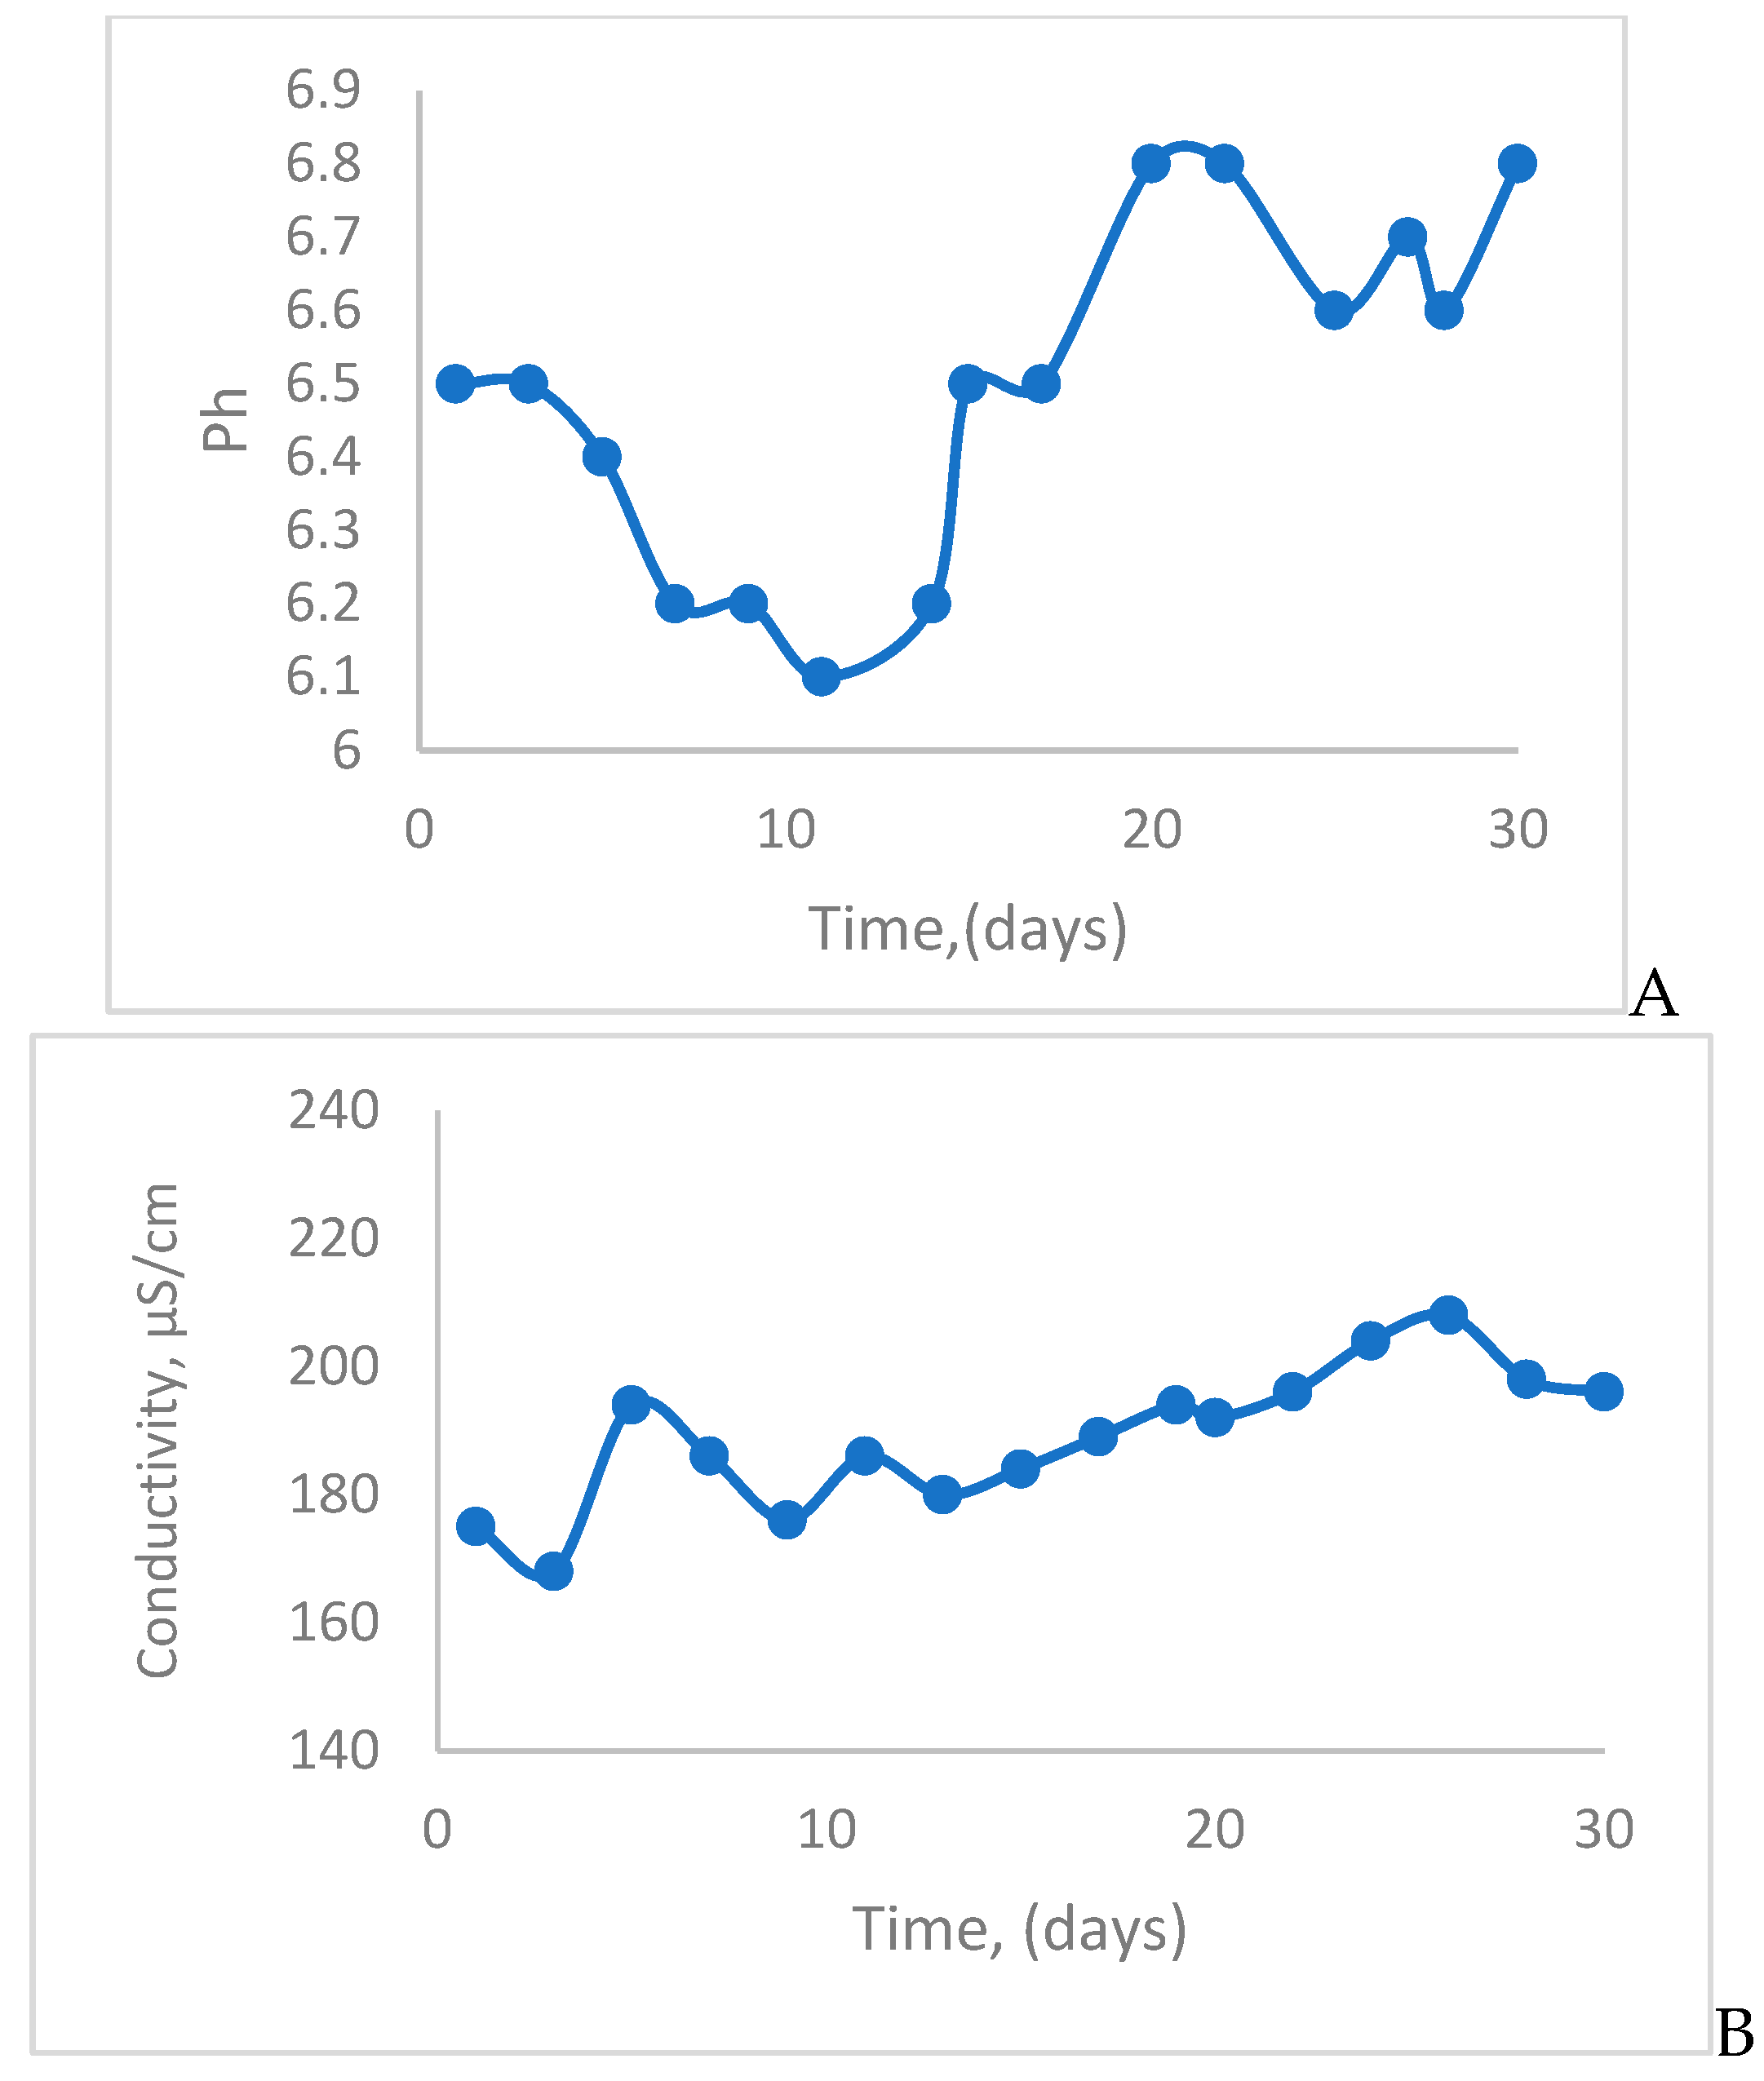
Figure 4.
Microscopic image x40 of Chlorella strain in the period of cellular growth, Visual results of biocoagulation. Chlorella sp in lag phase (A), (B) cells of the algae Chlorella sp., in stationary phase (C), (D).
Figure 4.
Microscopic image x40 of Chlorella strain in the period of cellular growth, Visual results of biocoagulation. Chlorella sp in lag phase (A), (B) cells of the algae Chlorella sp., in stationary phase (C), (D).
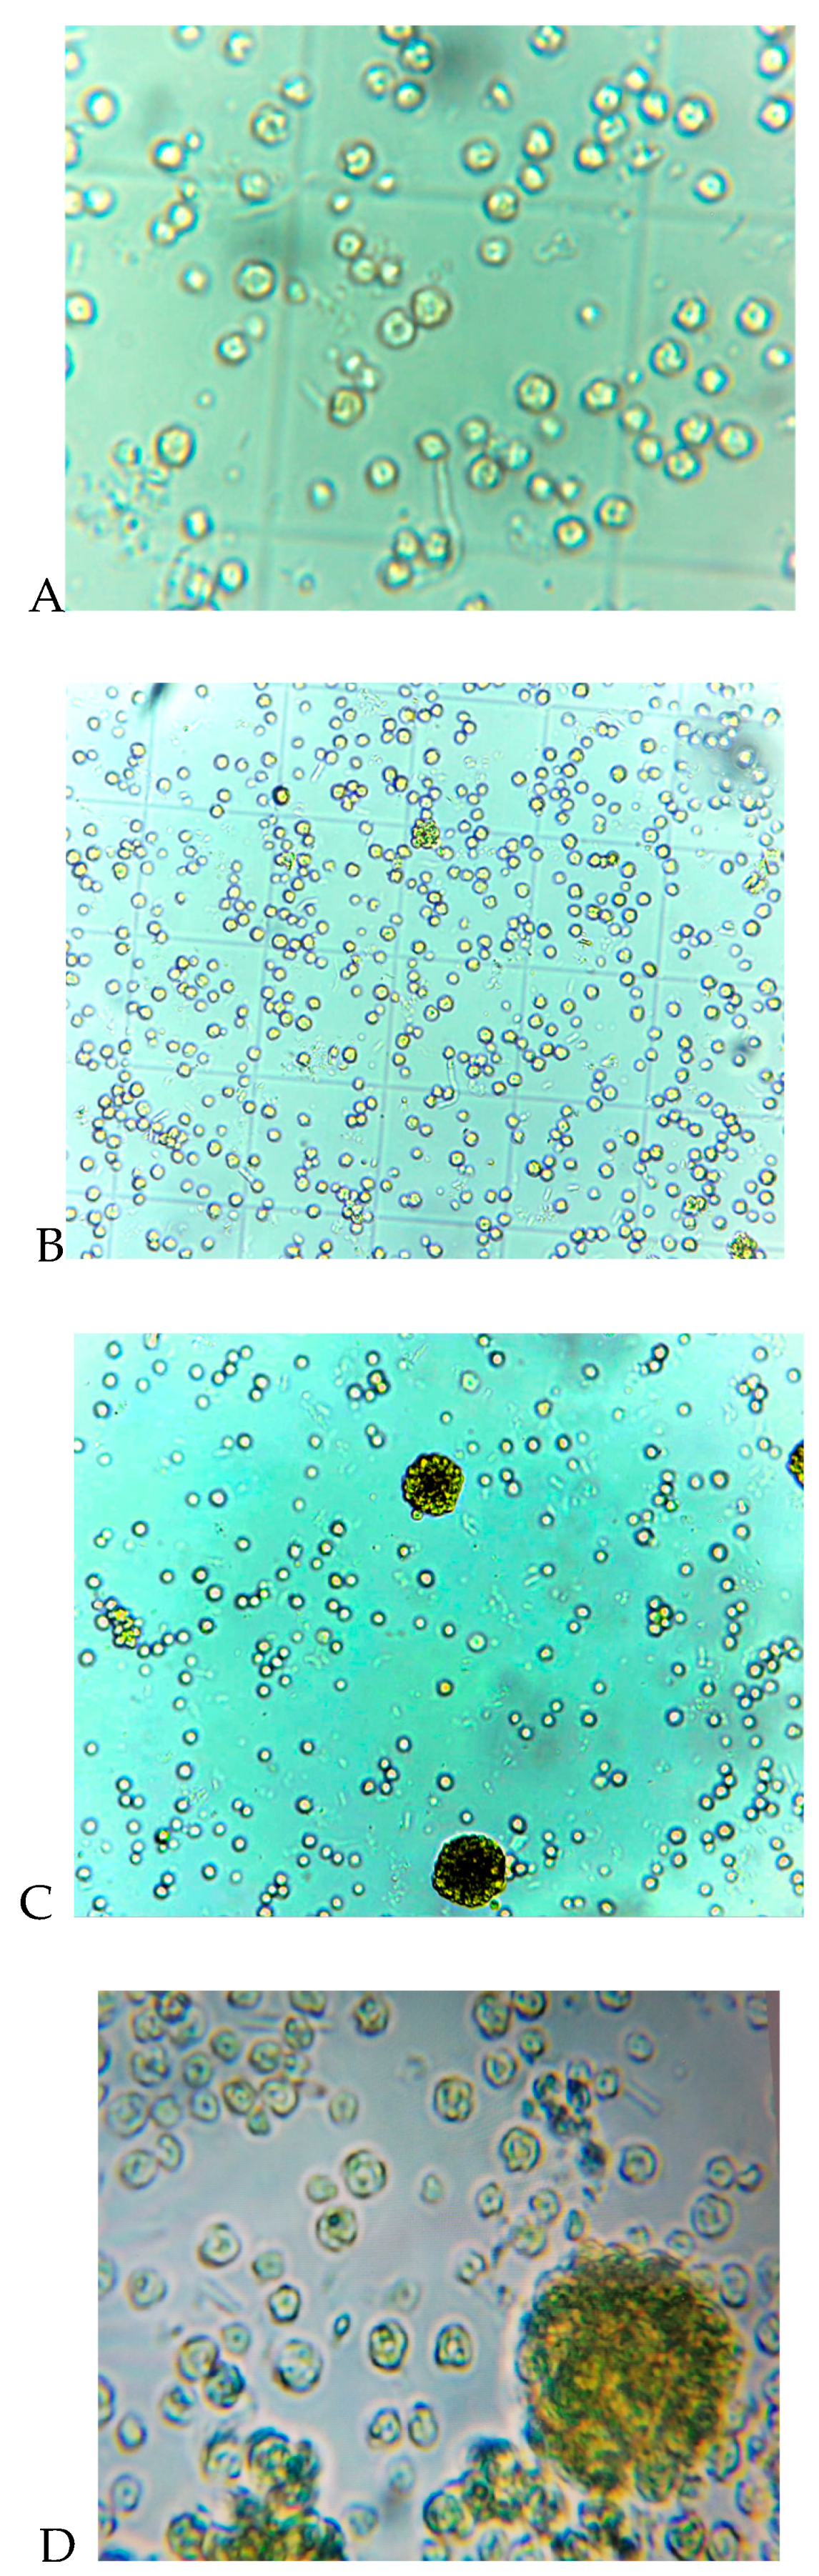
Figure 5.
Time variation of DCW.
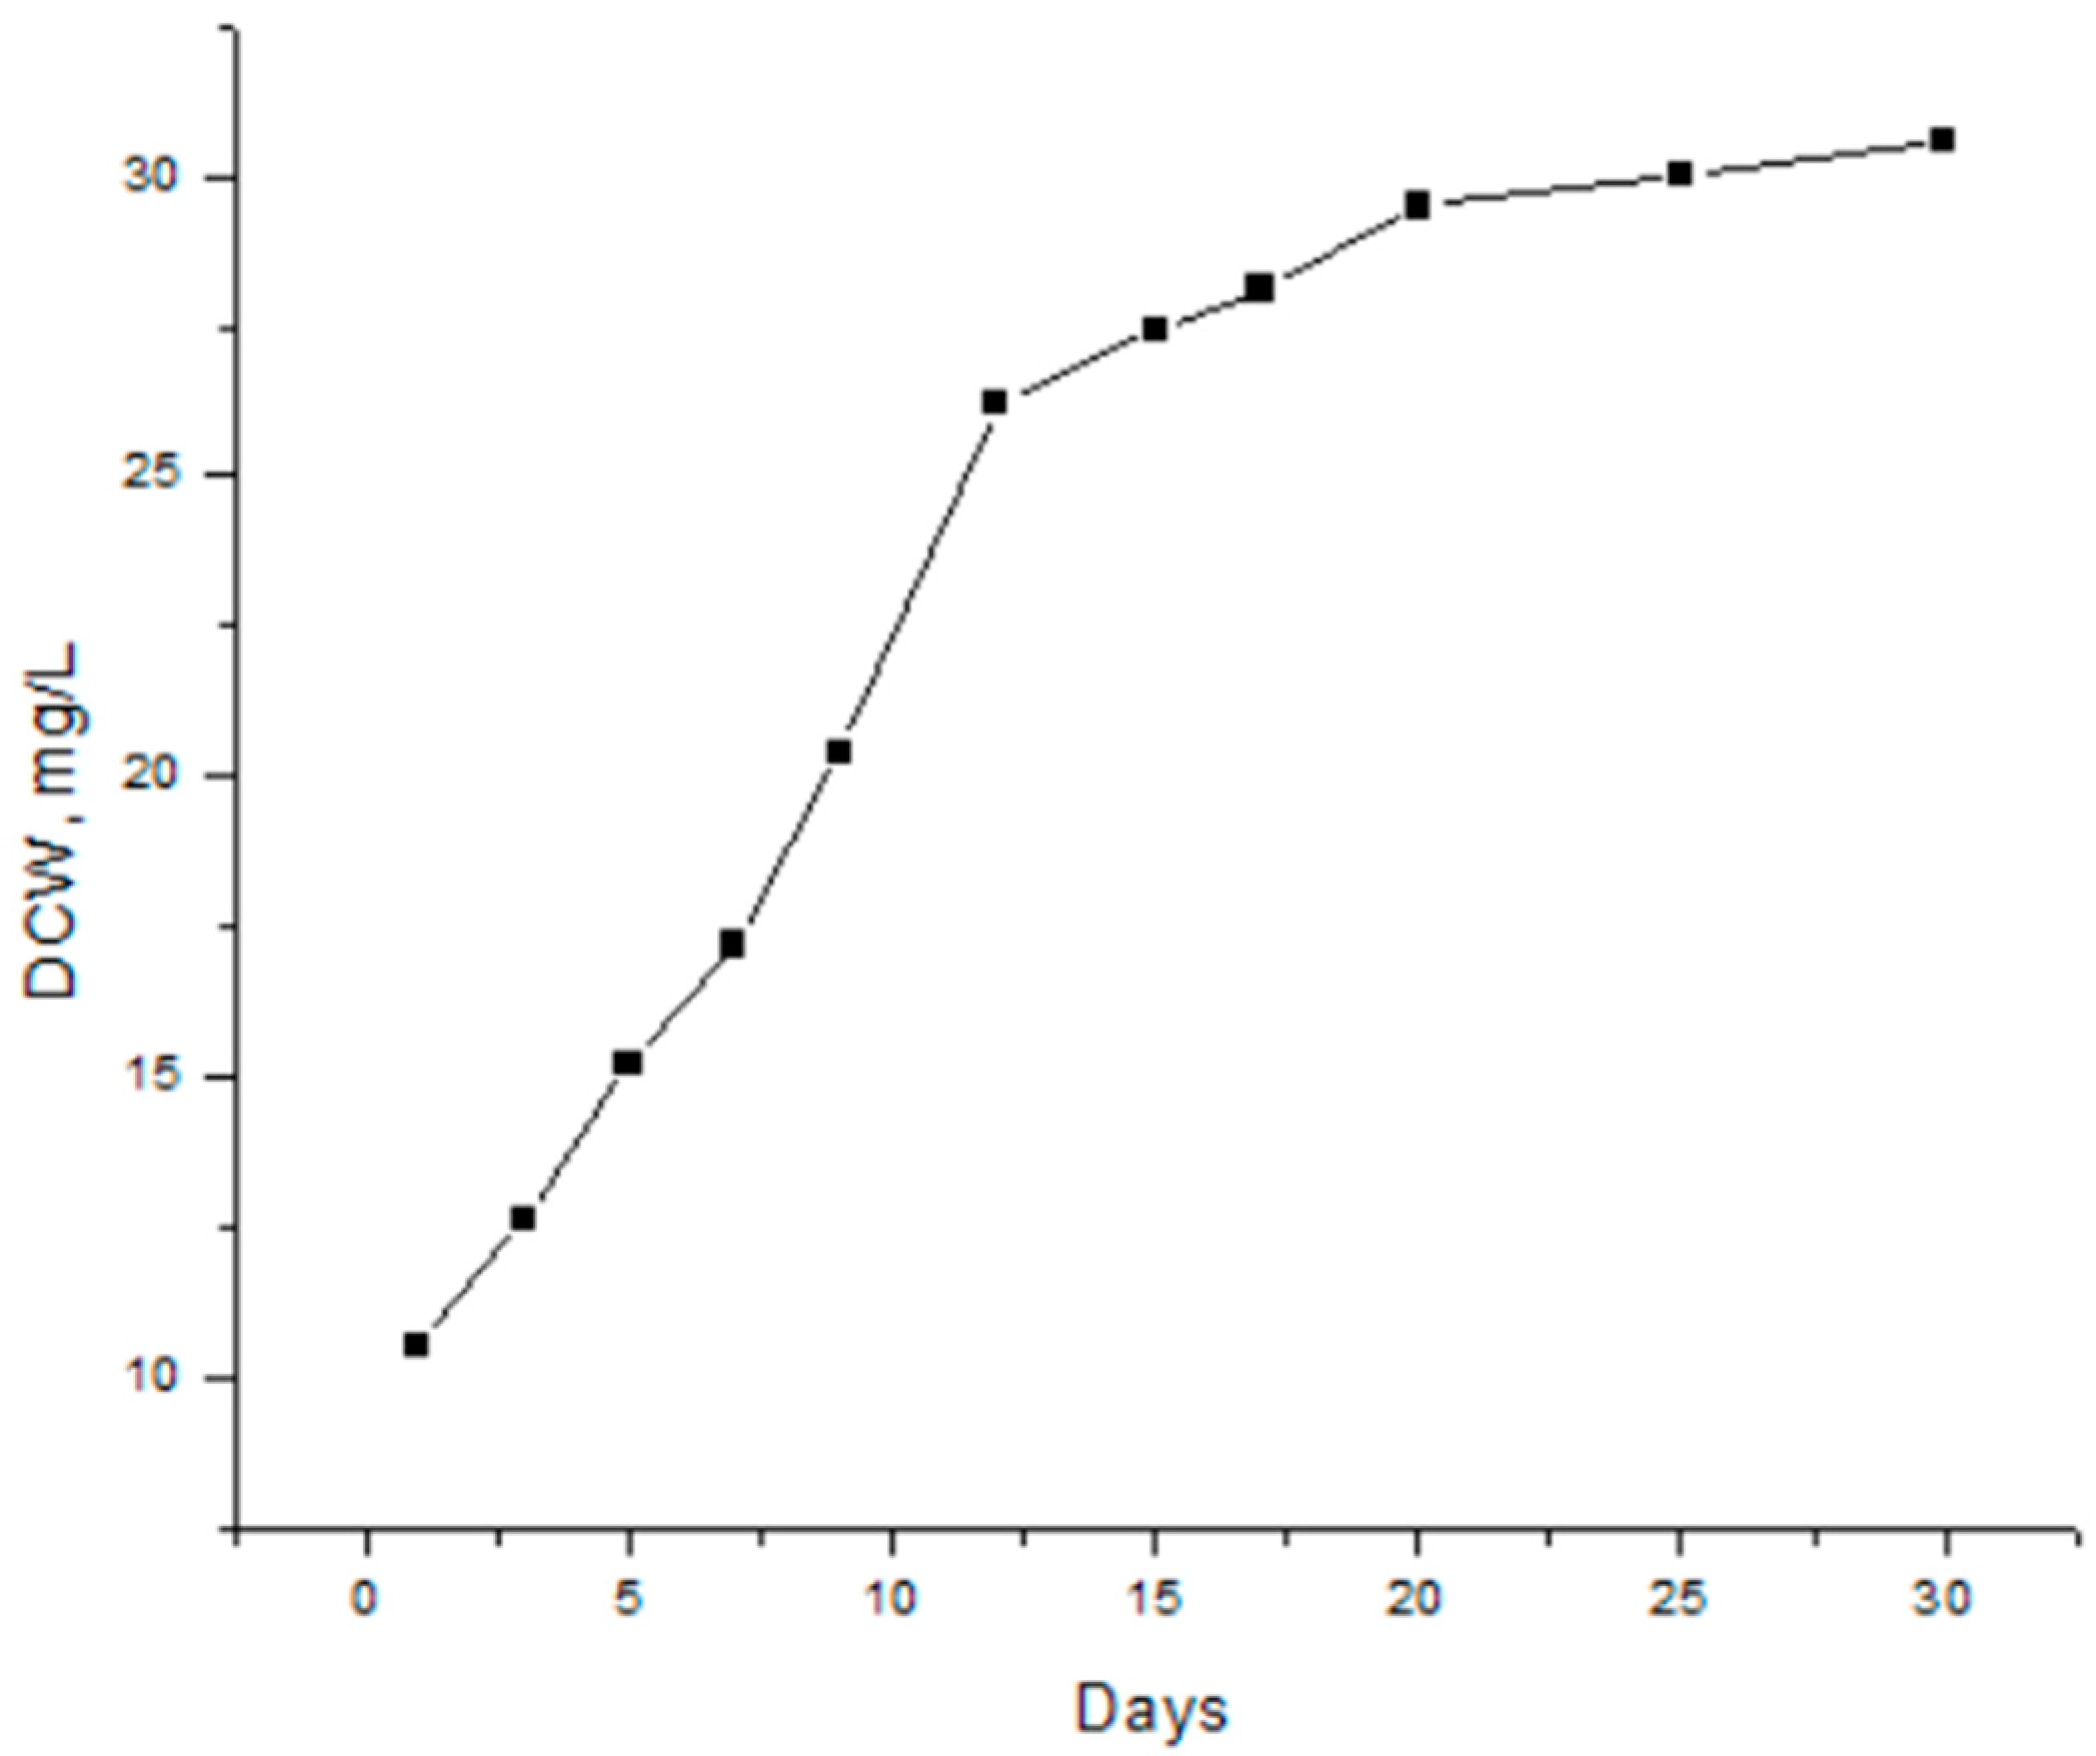
Figure 6.
Oxygen production of the algal culture Chlorella sp.
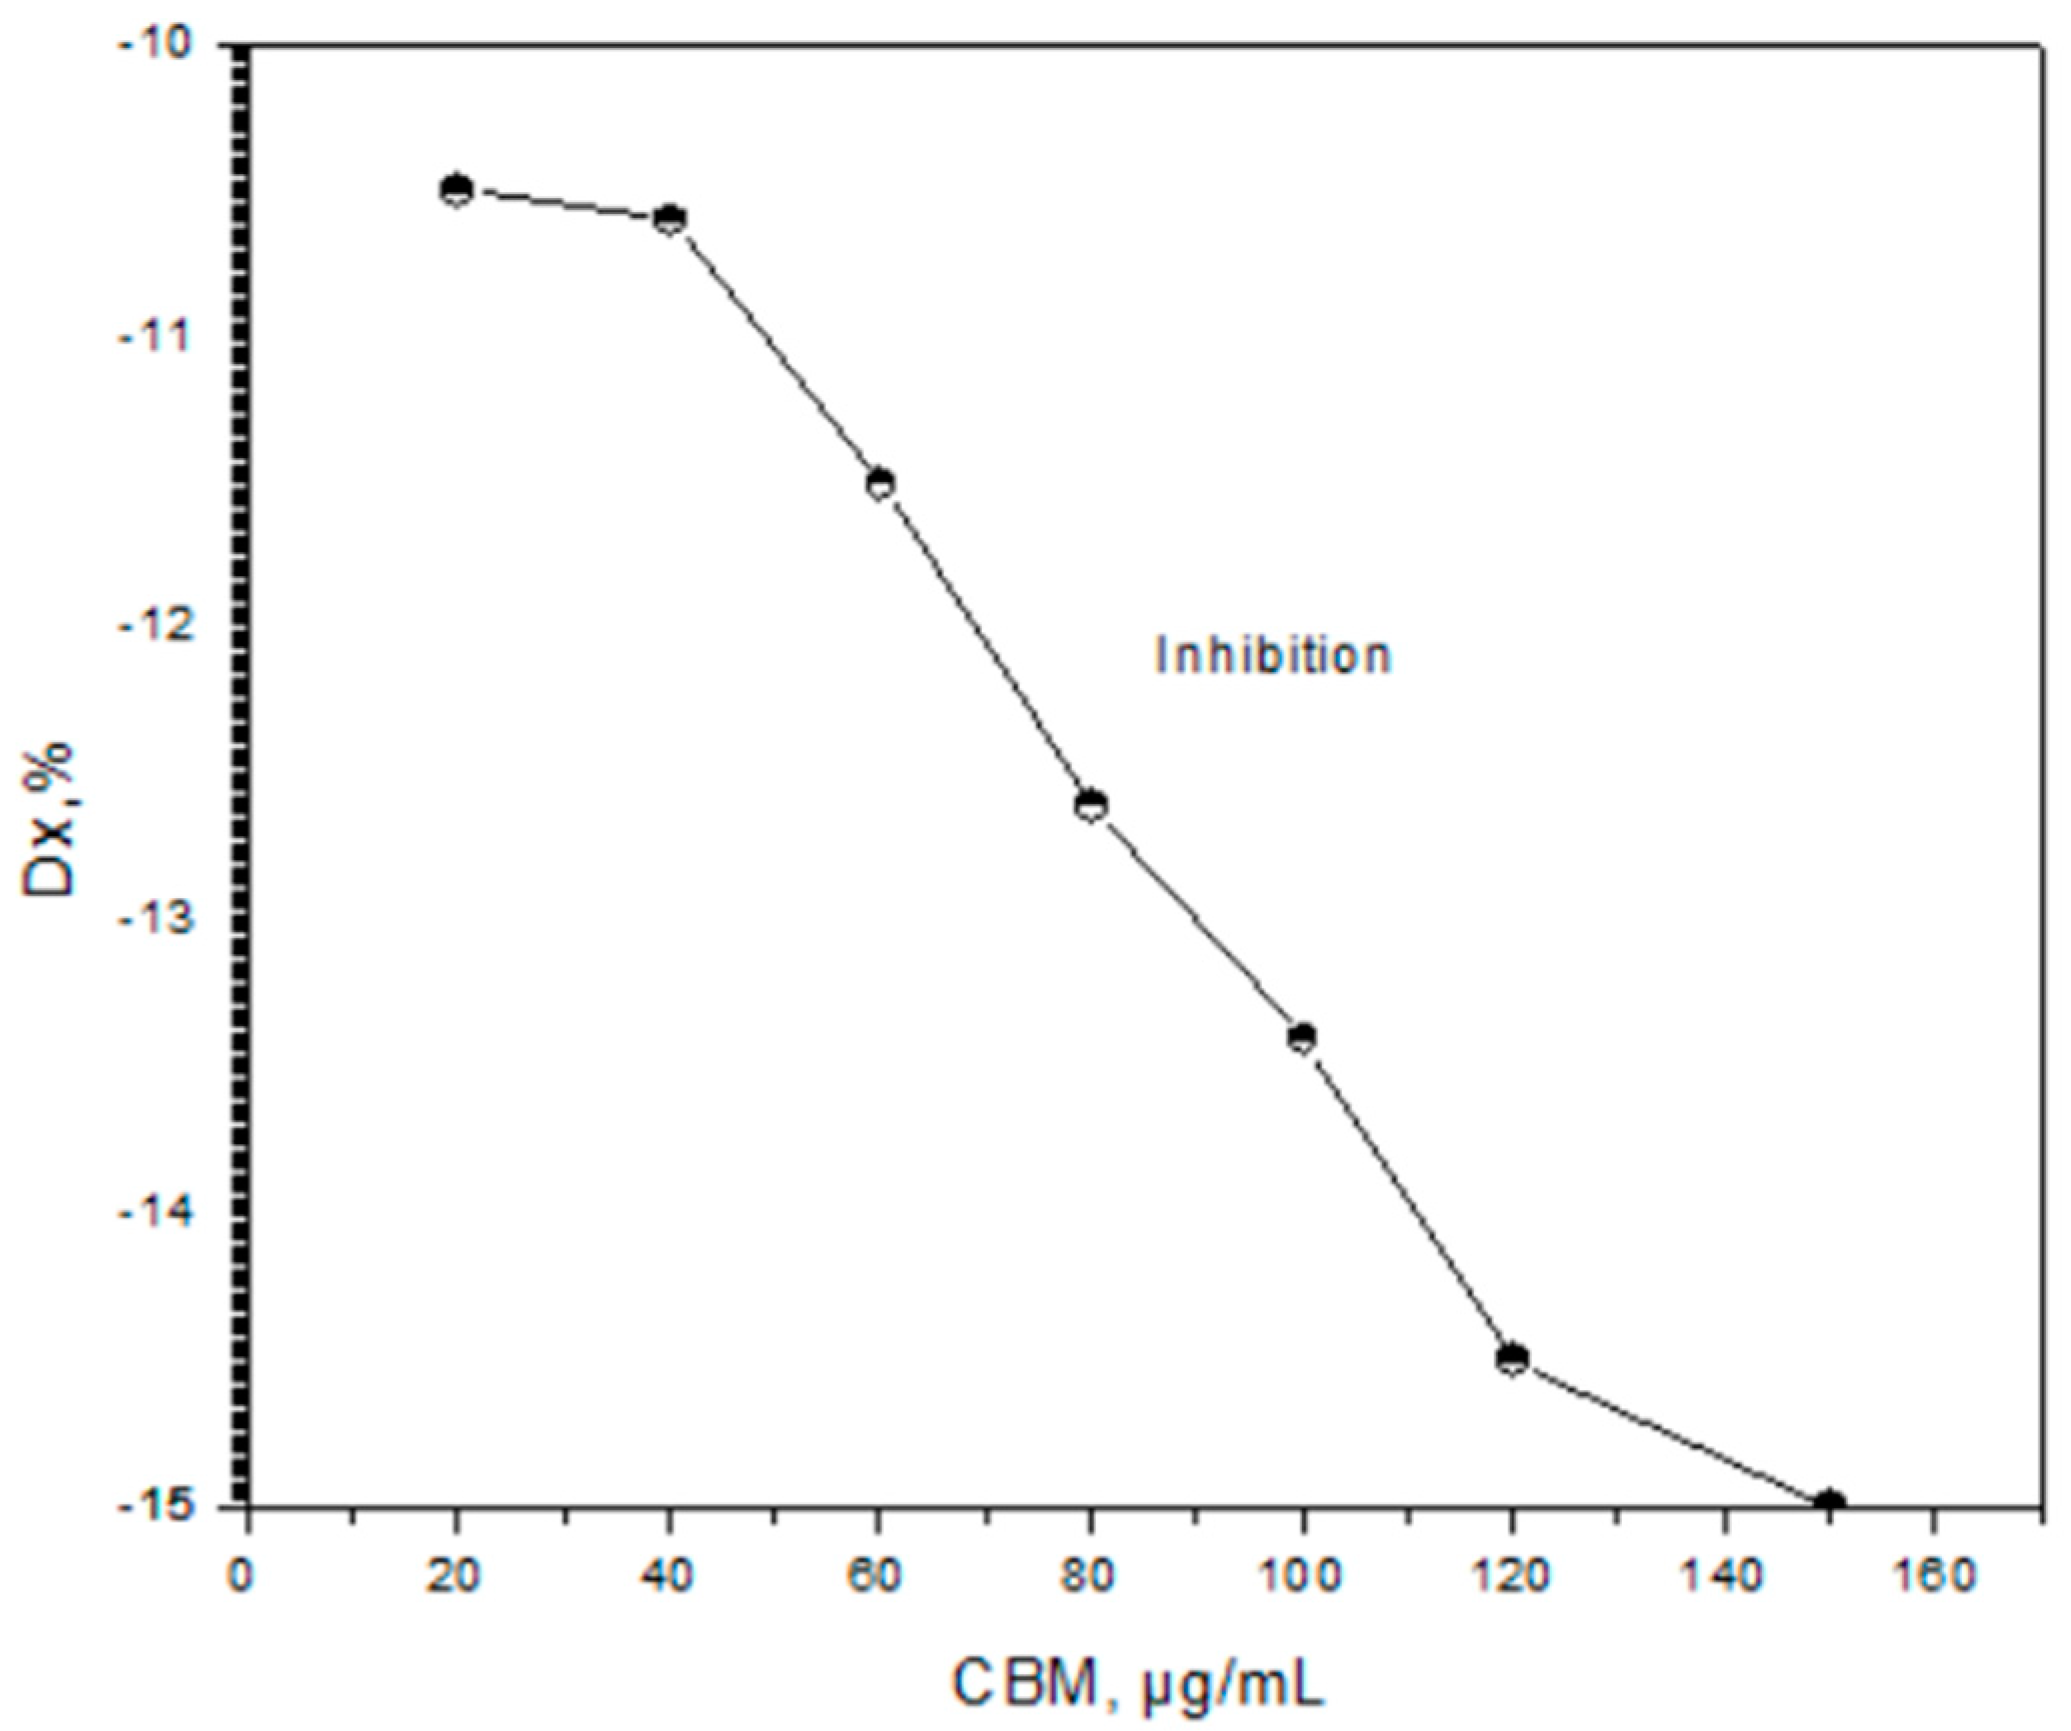
Figure 7.
Cell inhibition on the algal suspension Chlorella sp.
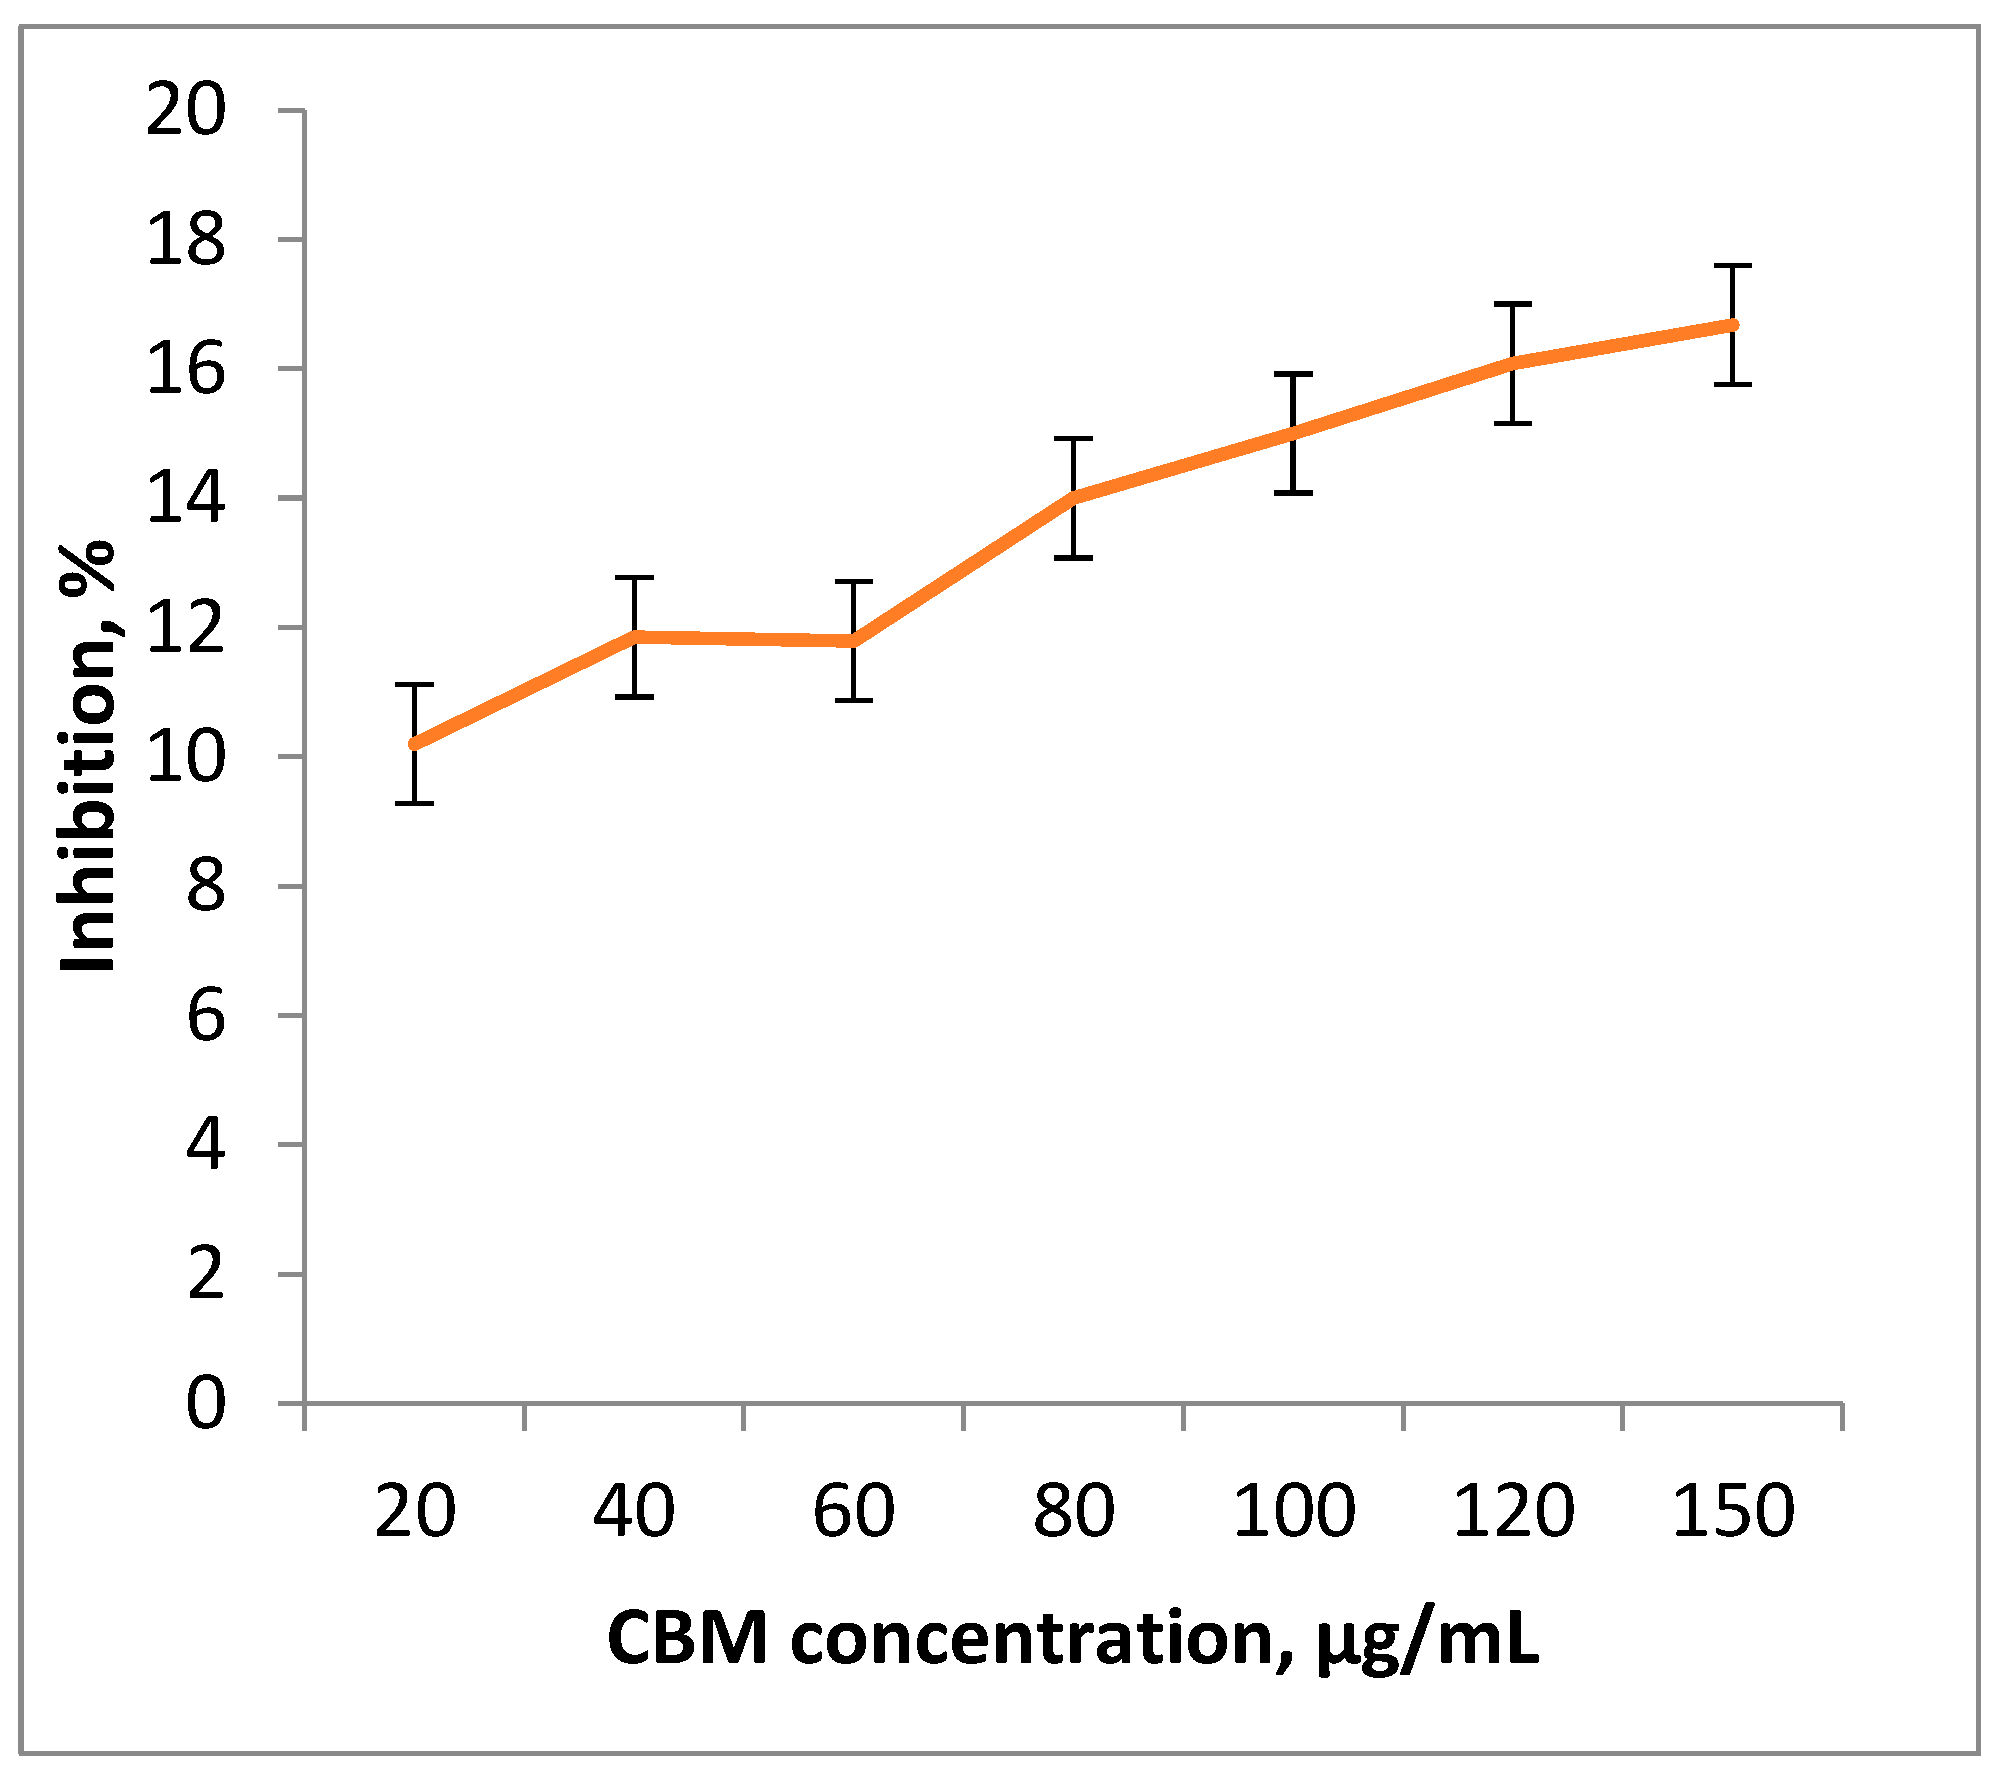
Figure 8.
Graphic representation of the chlorophyll content of algal suspensions under chemical stress.
Figure 8.
Graphic representation of the chlorophyll content of algal suspensions under chemical stress.
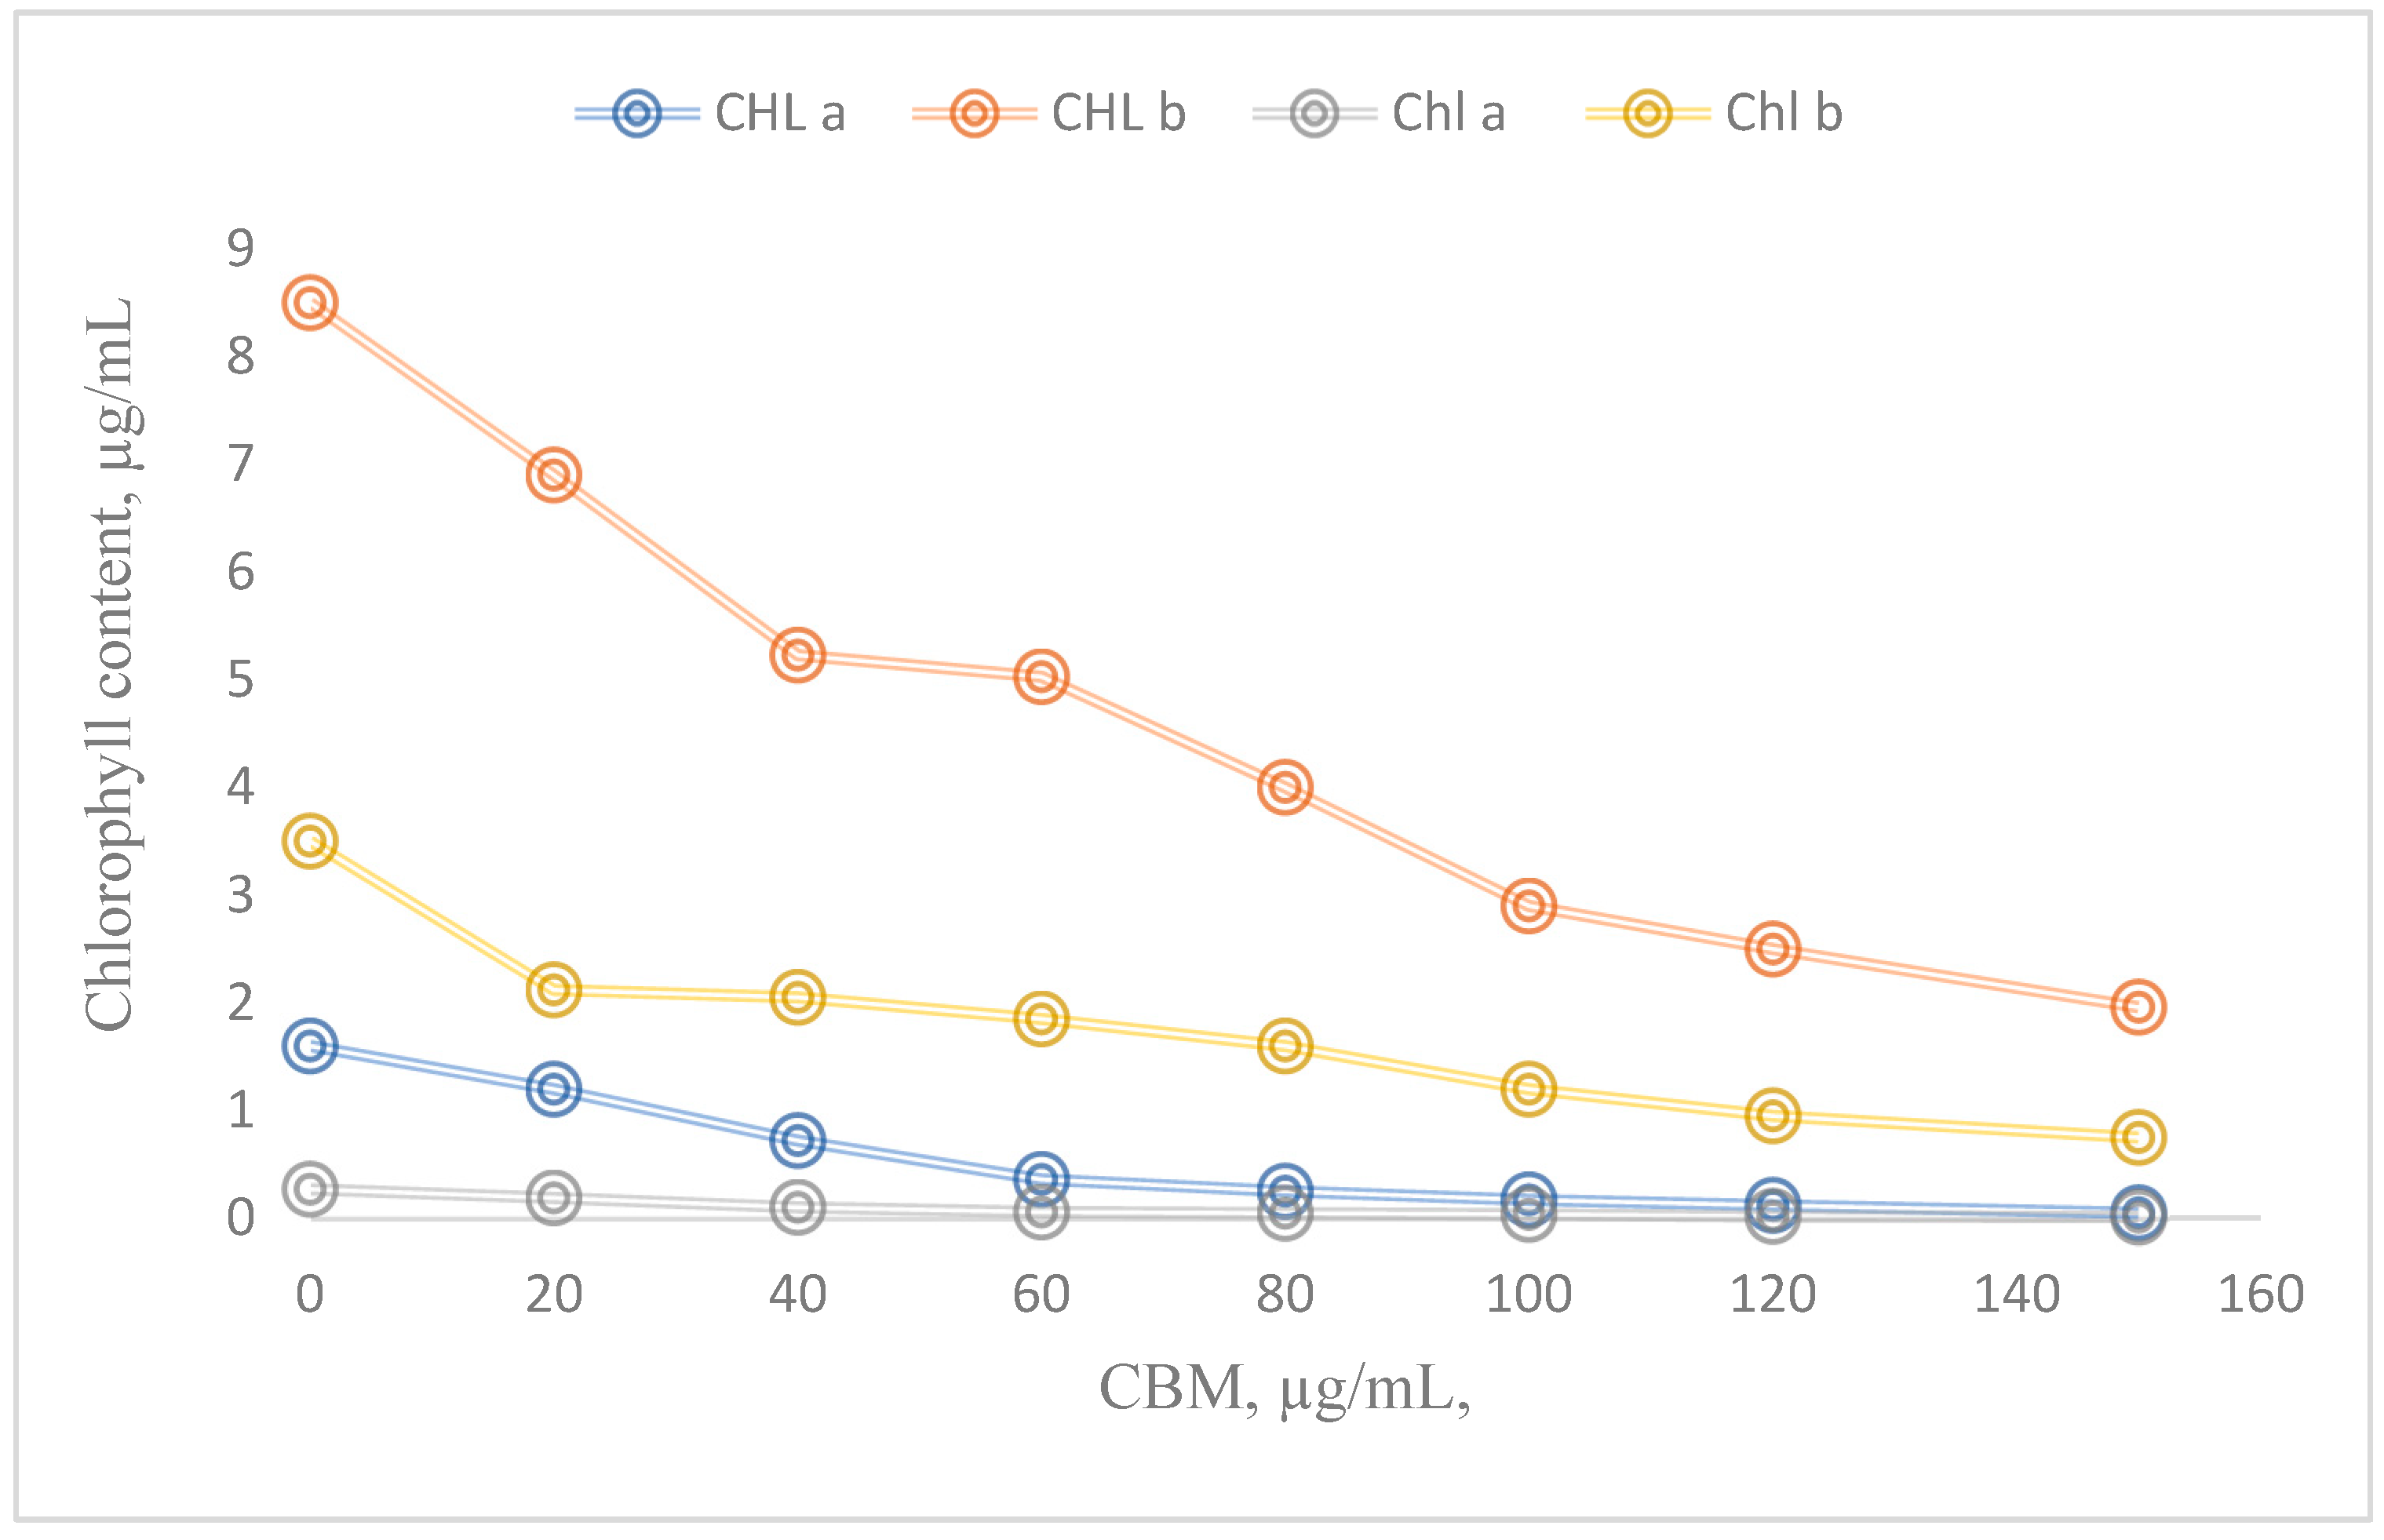
Figure 9.
Chlorophyll yield (A-chlorophyll “a”, B- chlorophyll “b”).
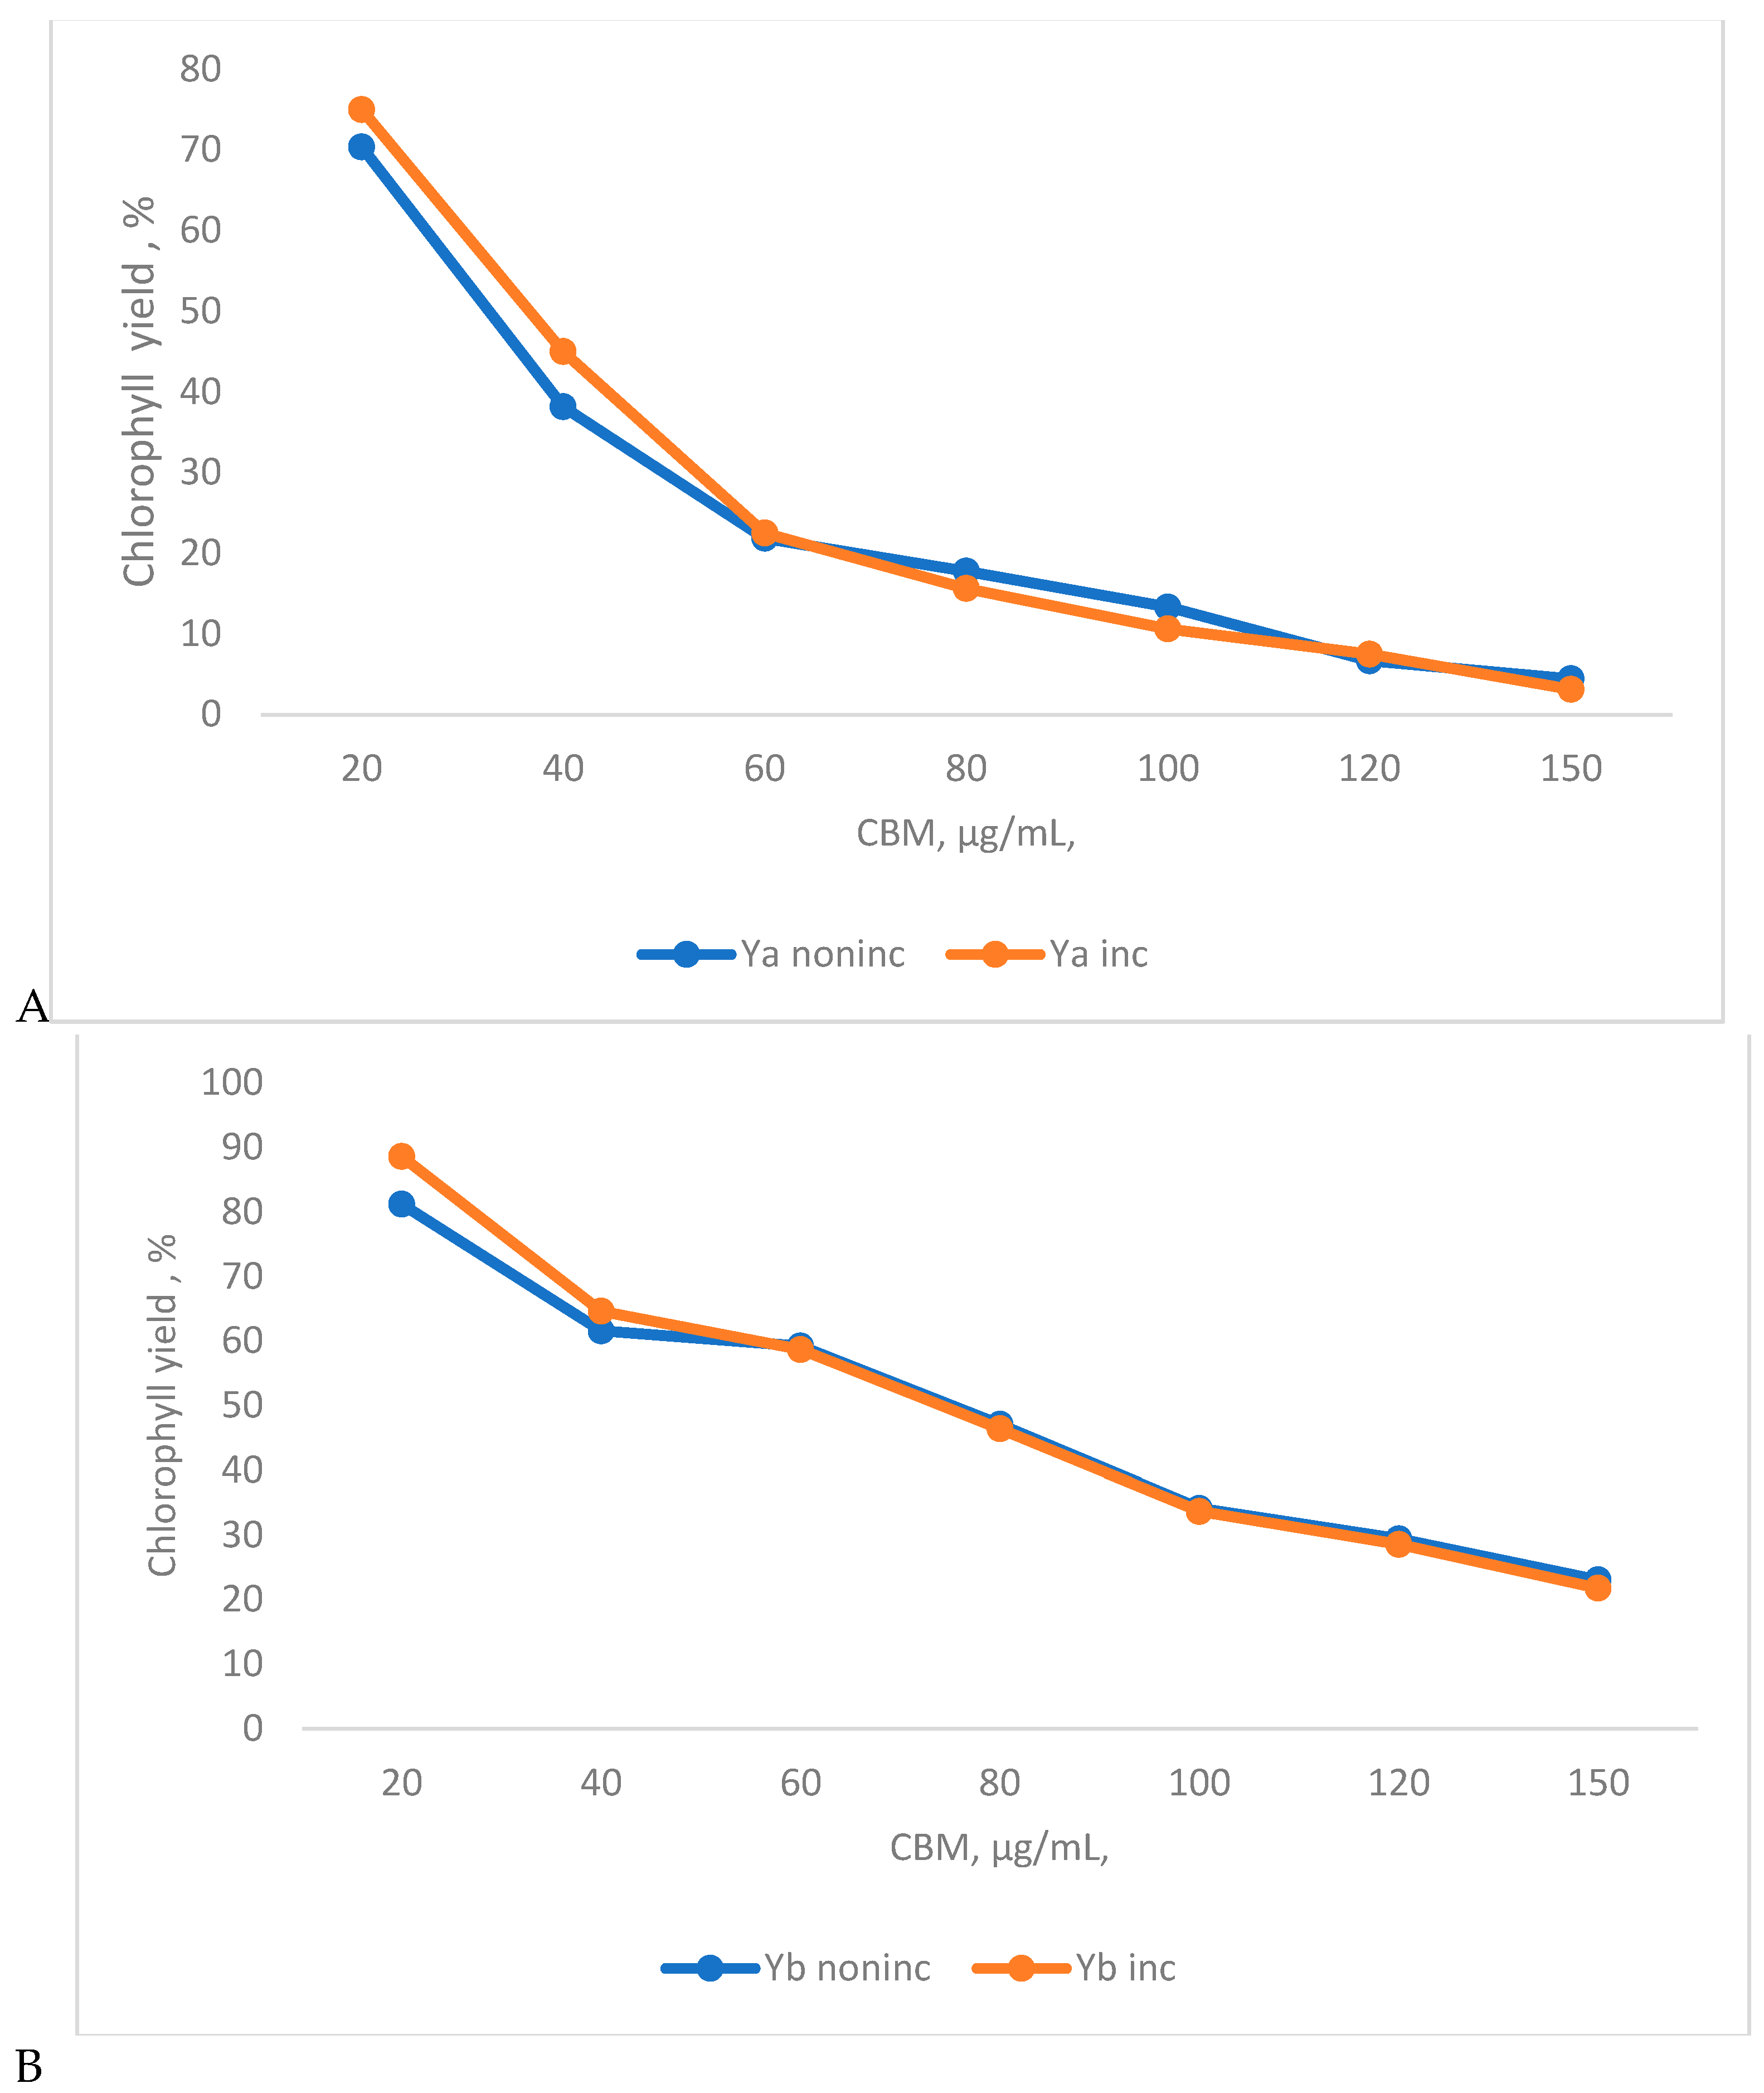
Figure 10.
FTIR spectra of Chlorella sp.
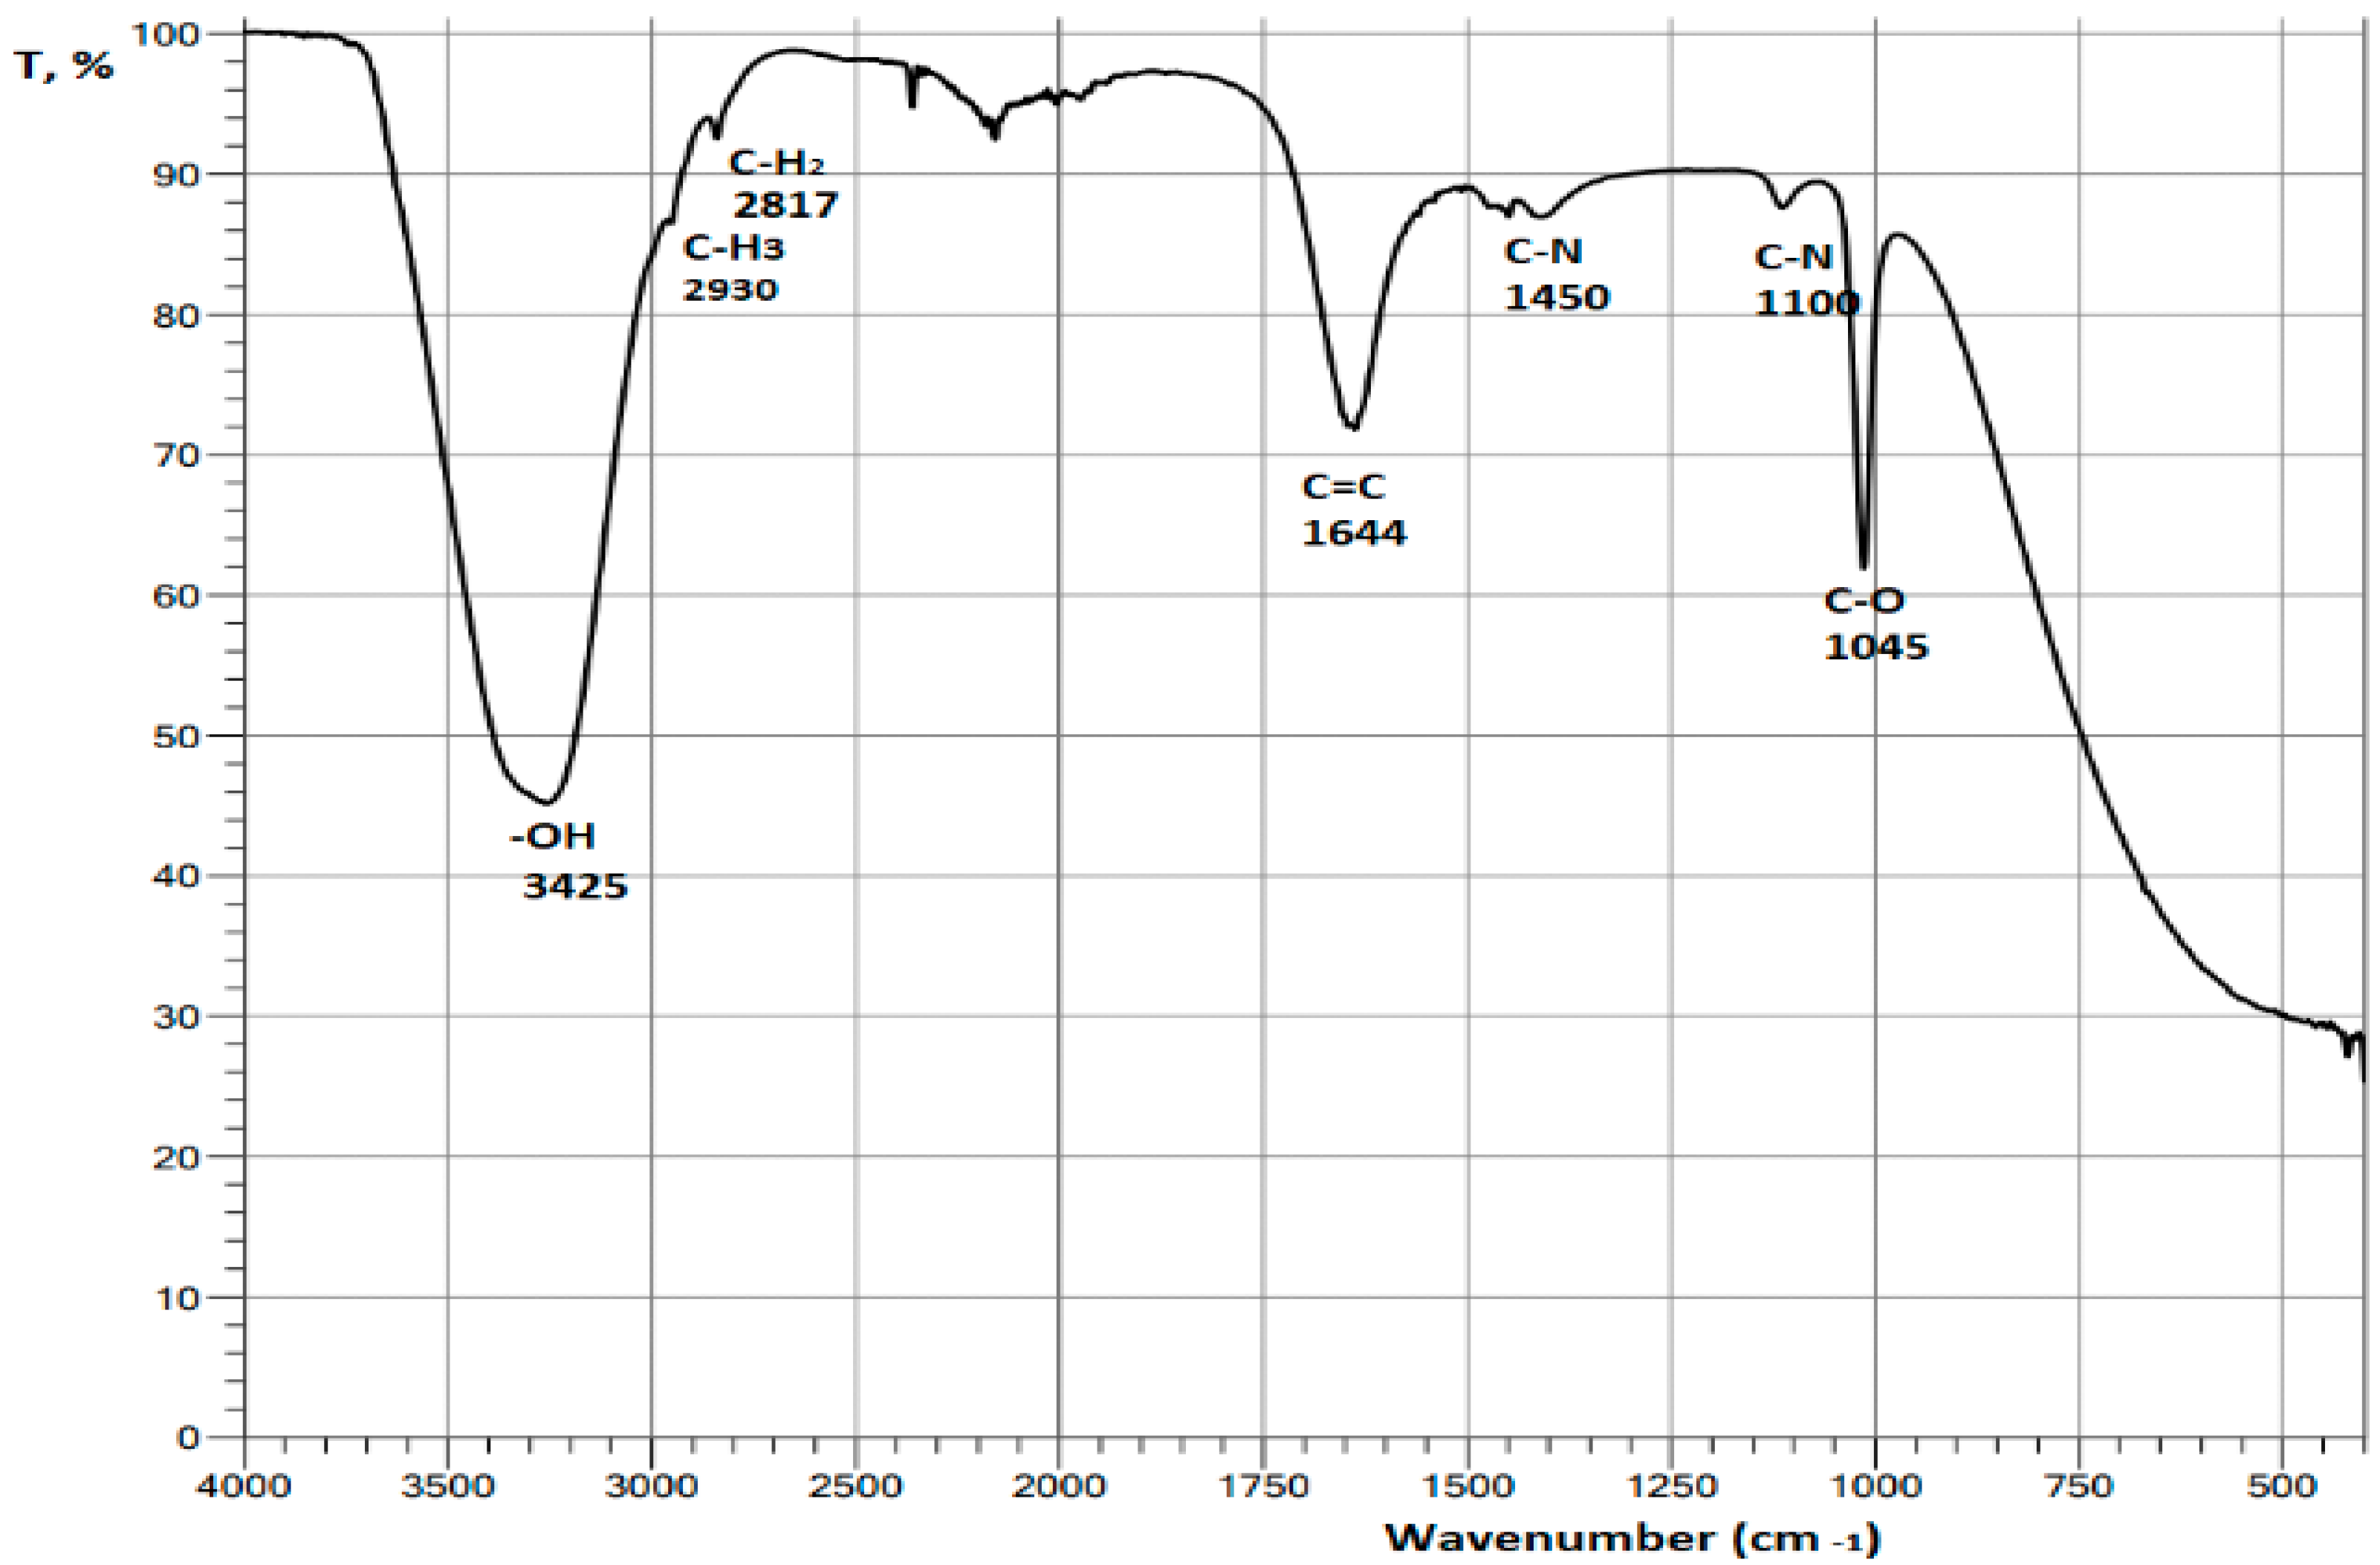
Figure 11.
FTIR spectra of CBM 100 ppm.
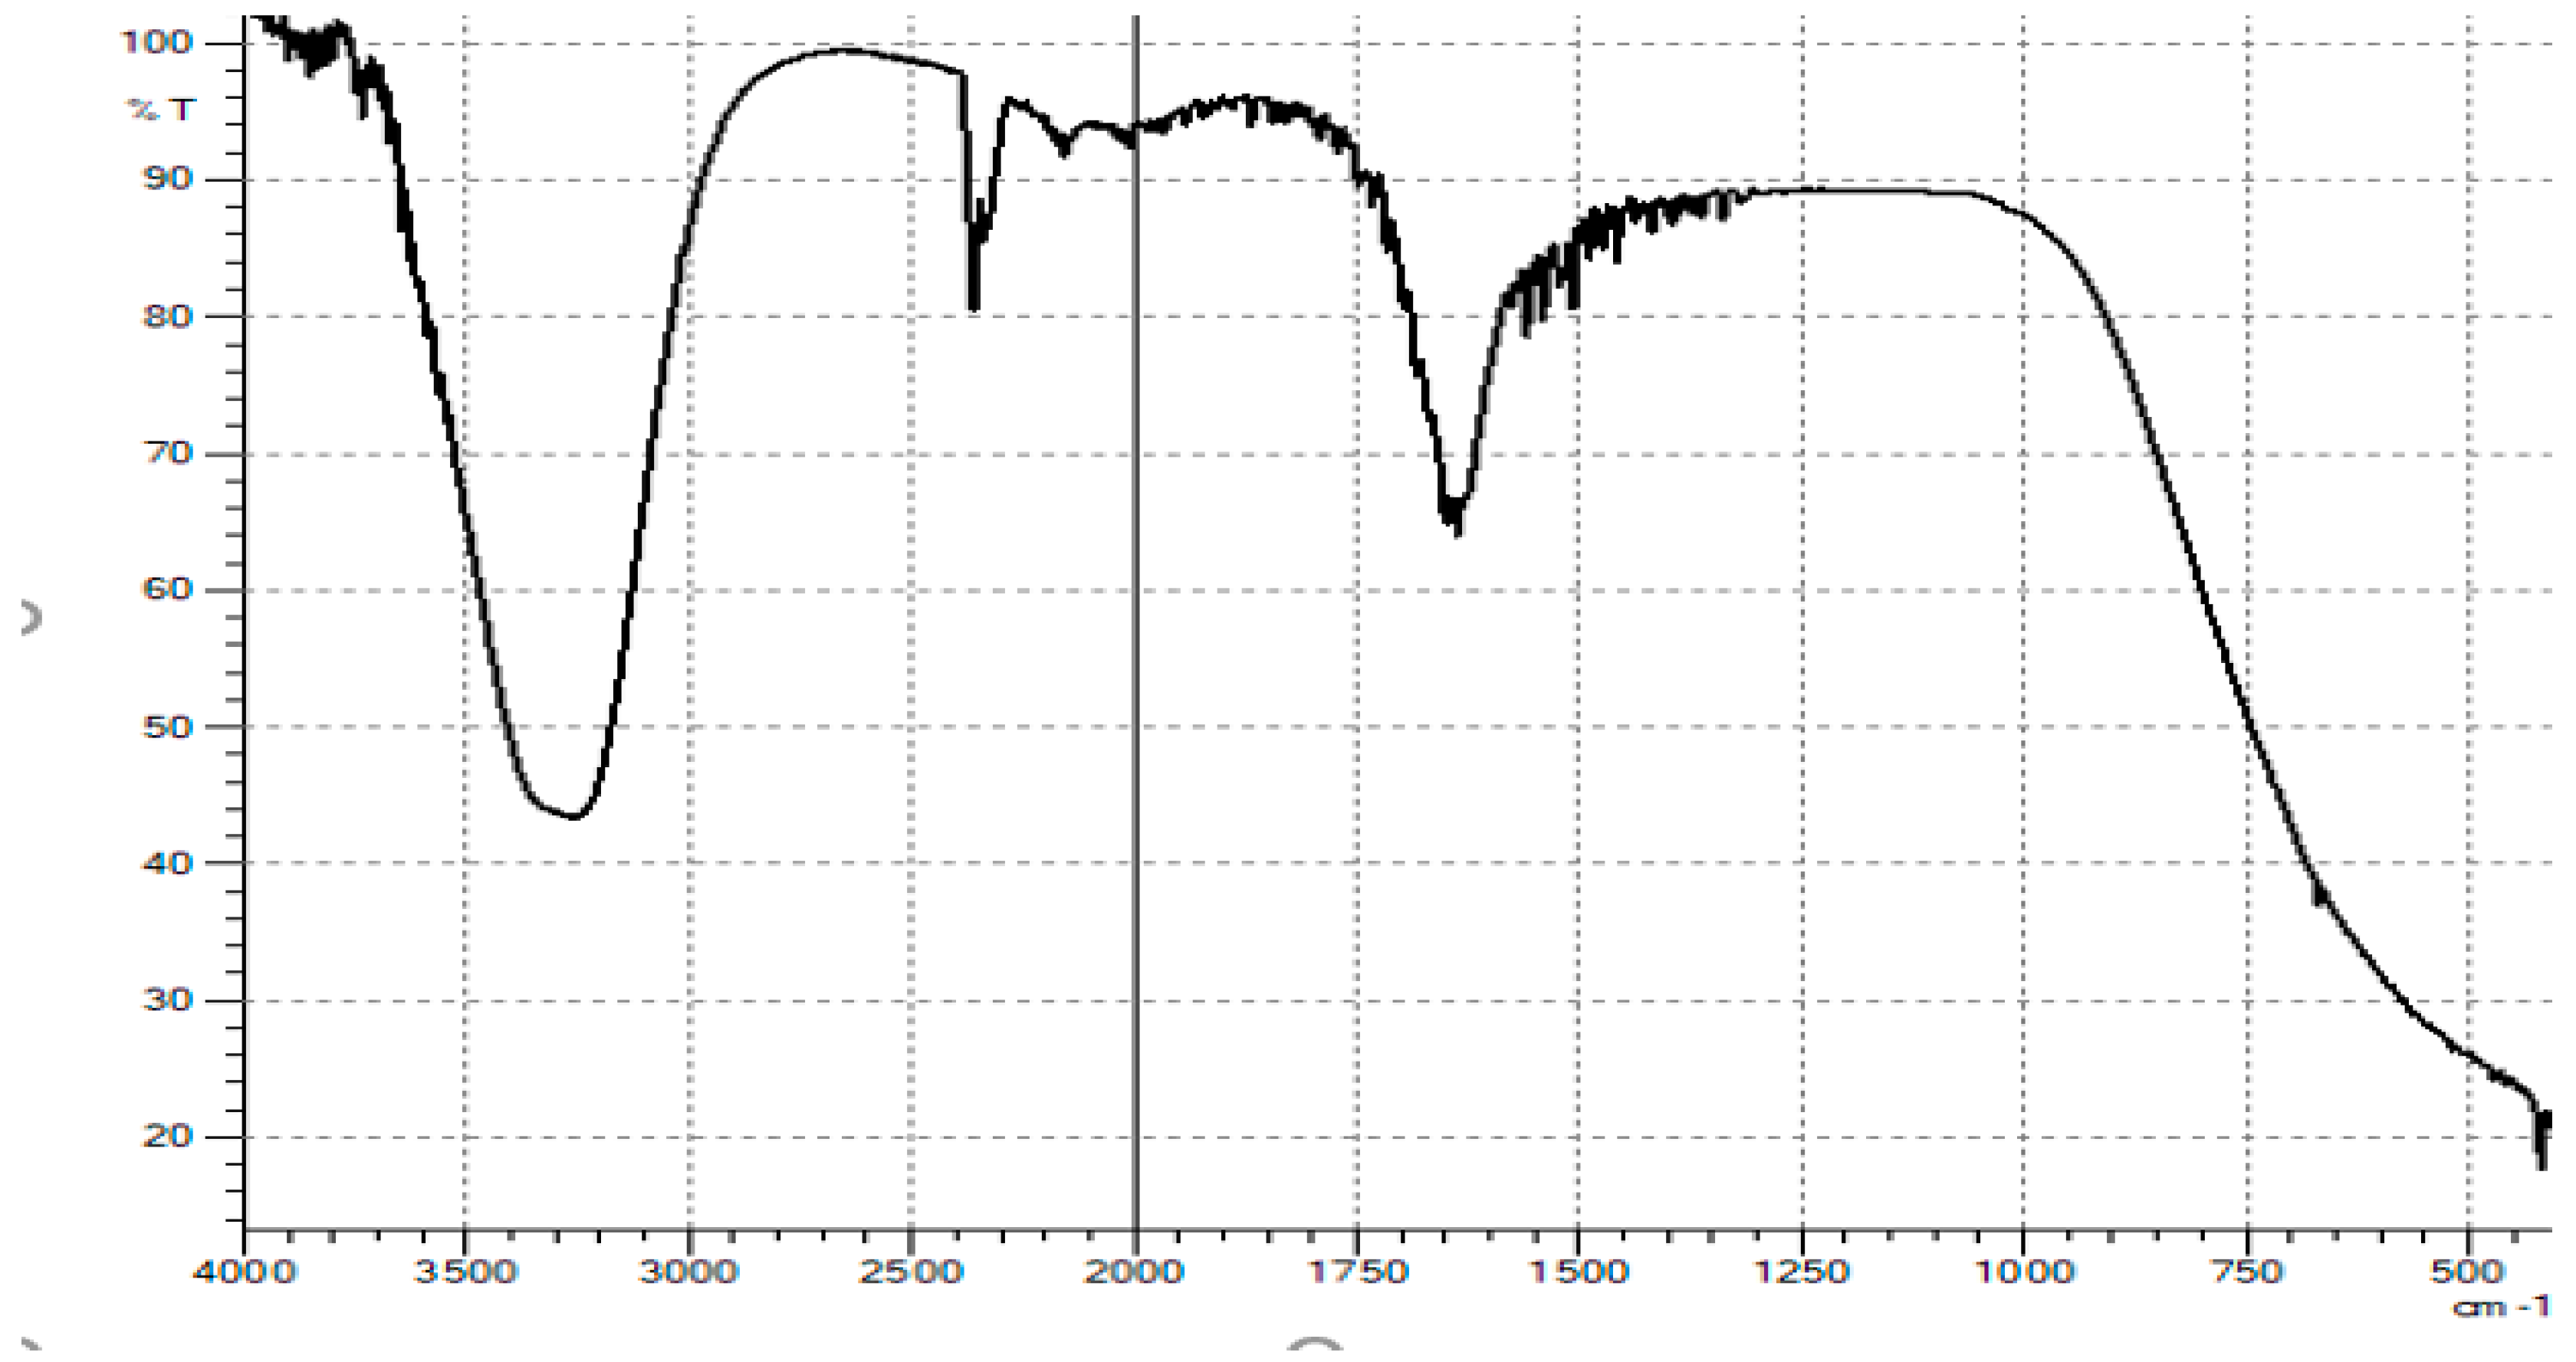
Figure 12.
FTIR spectra of chlorophyll (Chl); (A)- Chlorrella sp. incubated 24 h, before chlorophyll extraction, (B)- Chlorrella sp. blank after analysis of Chl , (C) (20 µg/mL), (D) (60 µg/mL), (E) (100 µg/mL), (F) (150 µg/mL).
Figure 12.
FTIR spectra of chlorophyll (Chl); (A)- Chlorrella sp. incubated 24 h, before chlorophyll extraction, (B)- Chlorrella sp. blank after analysis of Chl , (C) (20 µg/mL), (D) (60 µg/mL), (E) (100 µg/mL), (F) (150 µg/mL).
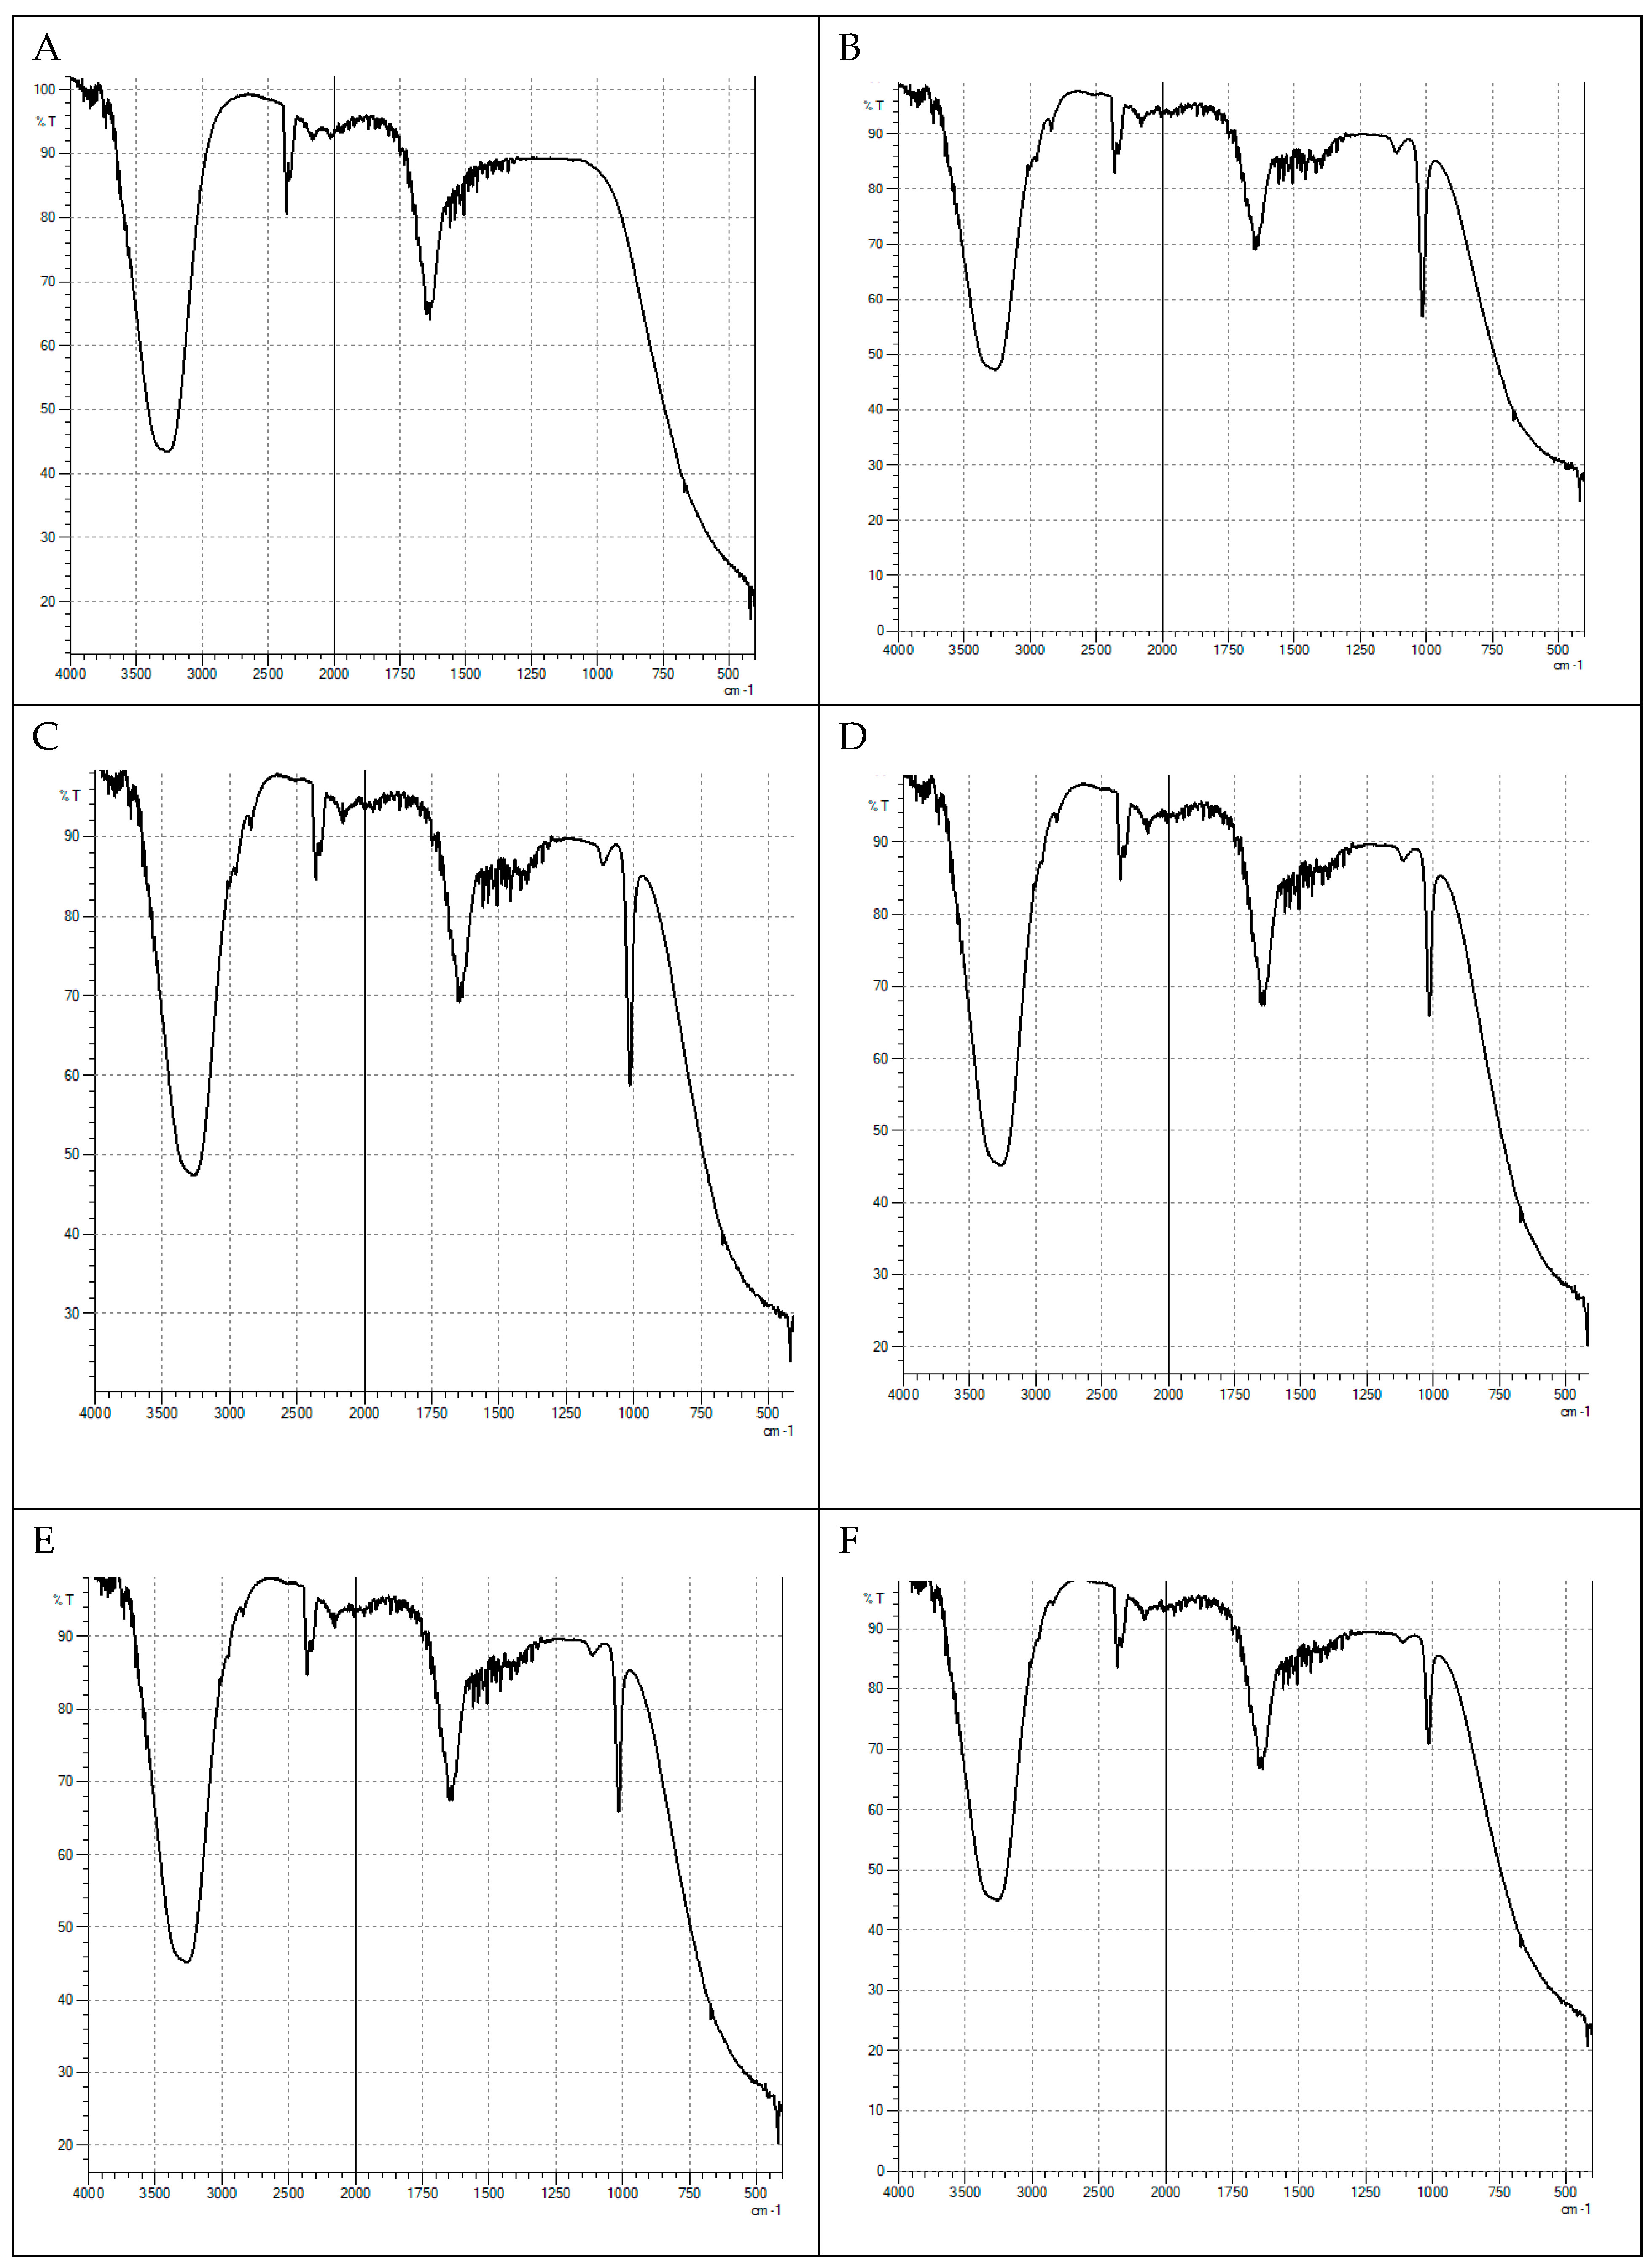
Figure 13.
Record of a dry culture of the algae Chlorella sp. from a scanning electron microscope - Surface structure in blank (algal grow (A) mag 250x ,(B) mag 5000x) , Strain culture with CBM ) (150 µg/mL) after 24h contact (C) 2400x (60 µg/mL), (D) 1200 x and surface detail (E) and (F).
Figure 13.
Record of a dry culture of the algae Chlorella sp. from a scanning electron microscope - Surface structure in blank (algal grow (A) mag 250x ,(B) mag 5000x) , Strain culture with CBM ) (150 µg/mL) after 24h contact (C) 2400x (60 µg/mL), (D) 1200 x and surface detail (E) and (F).
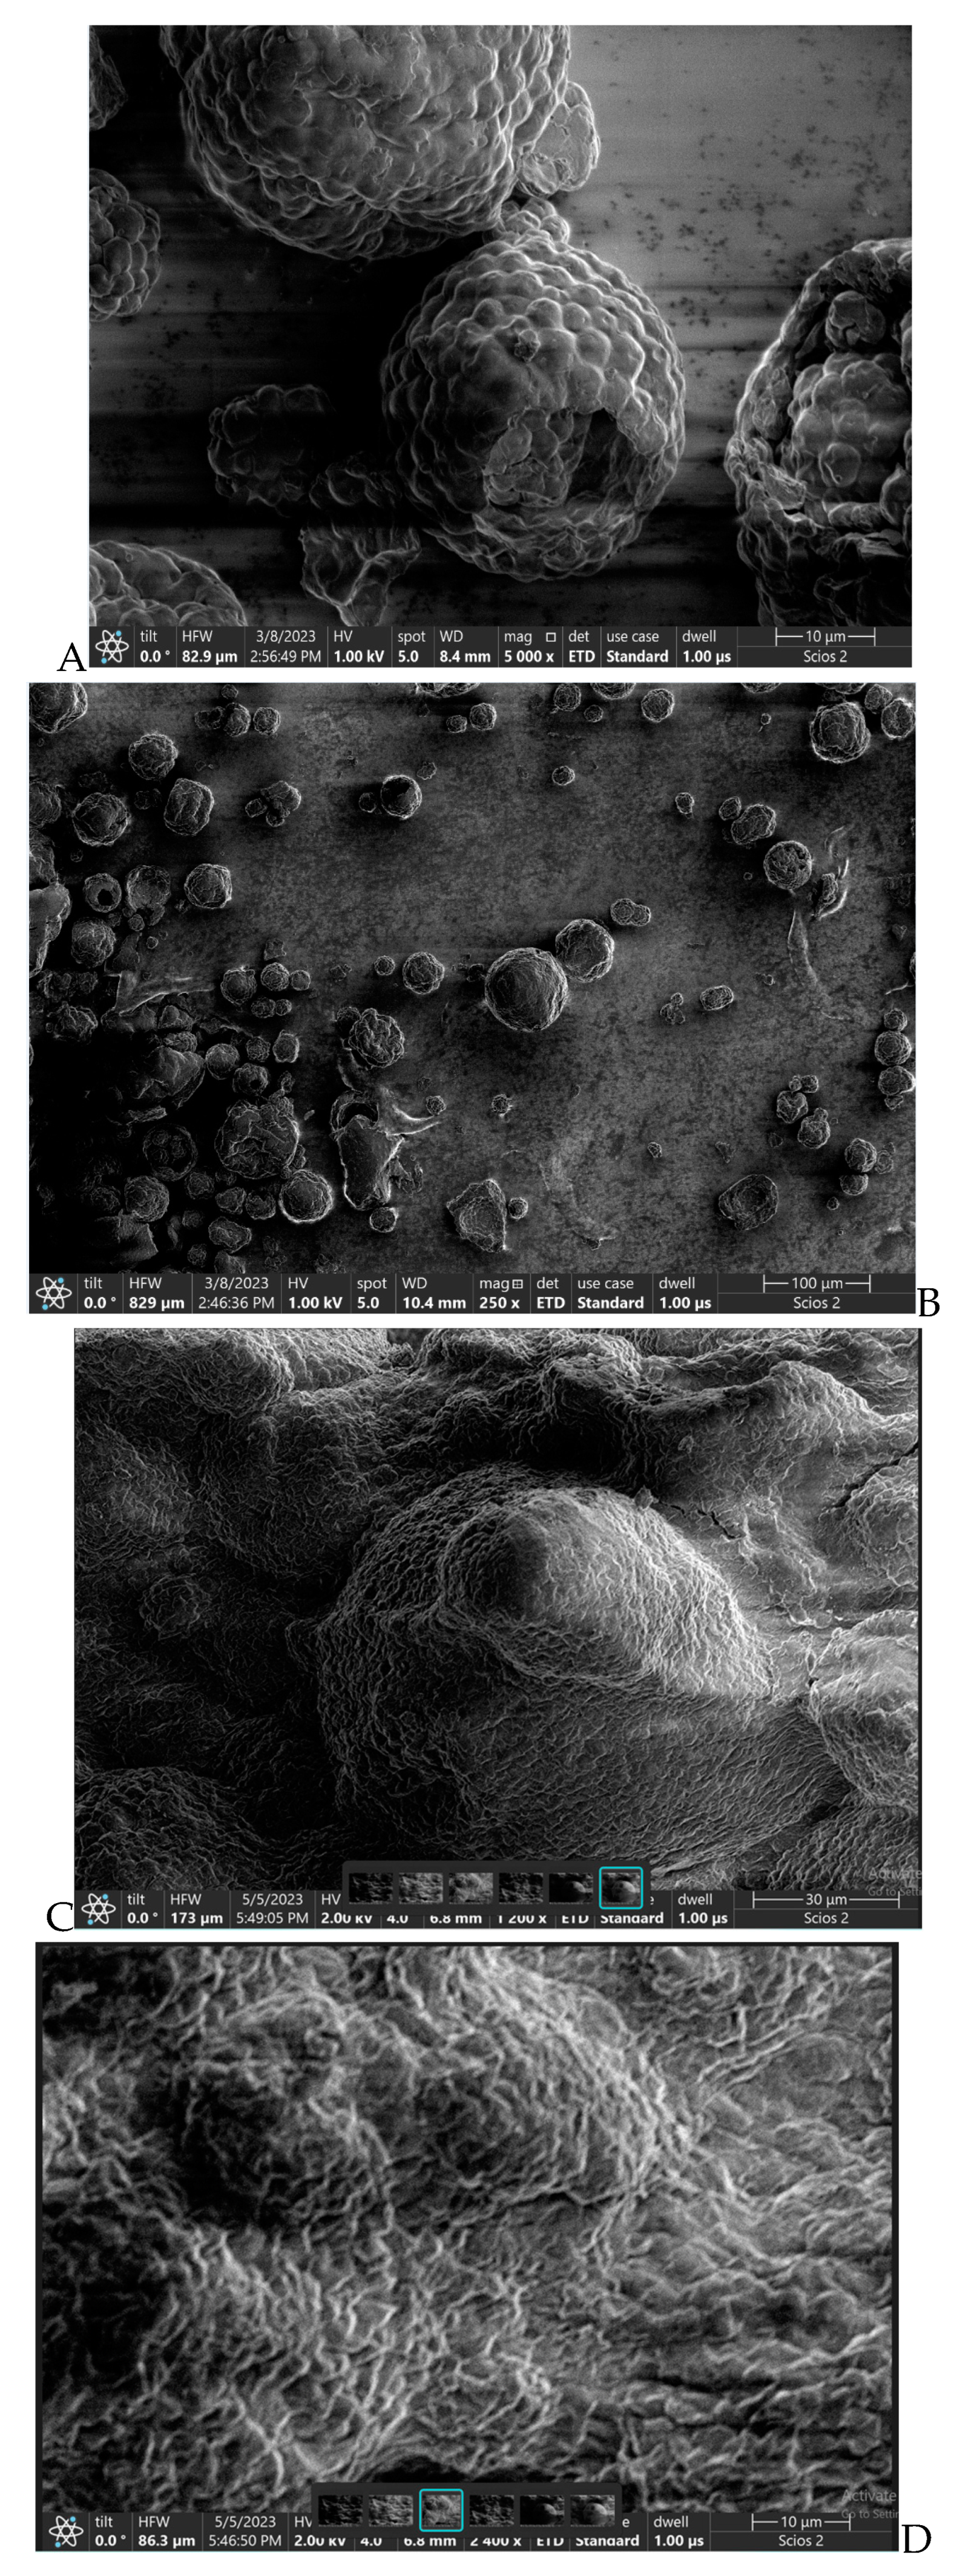
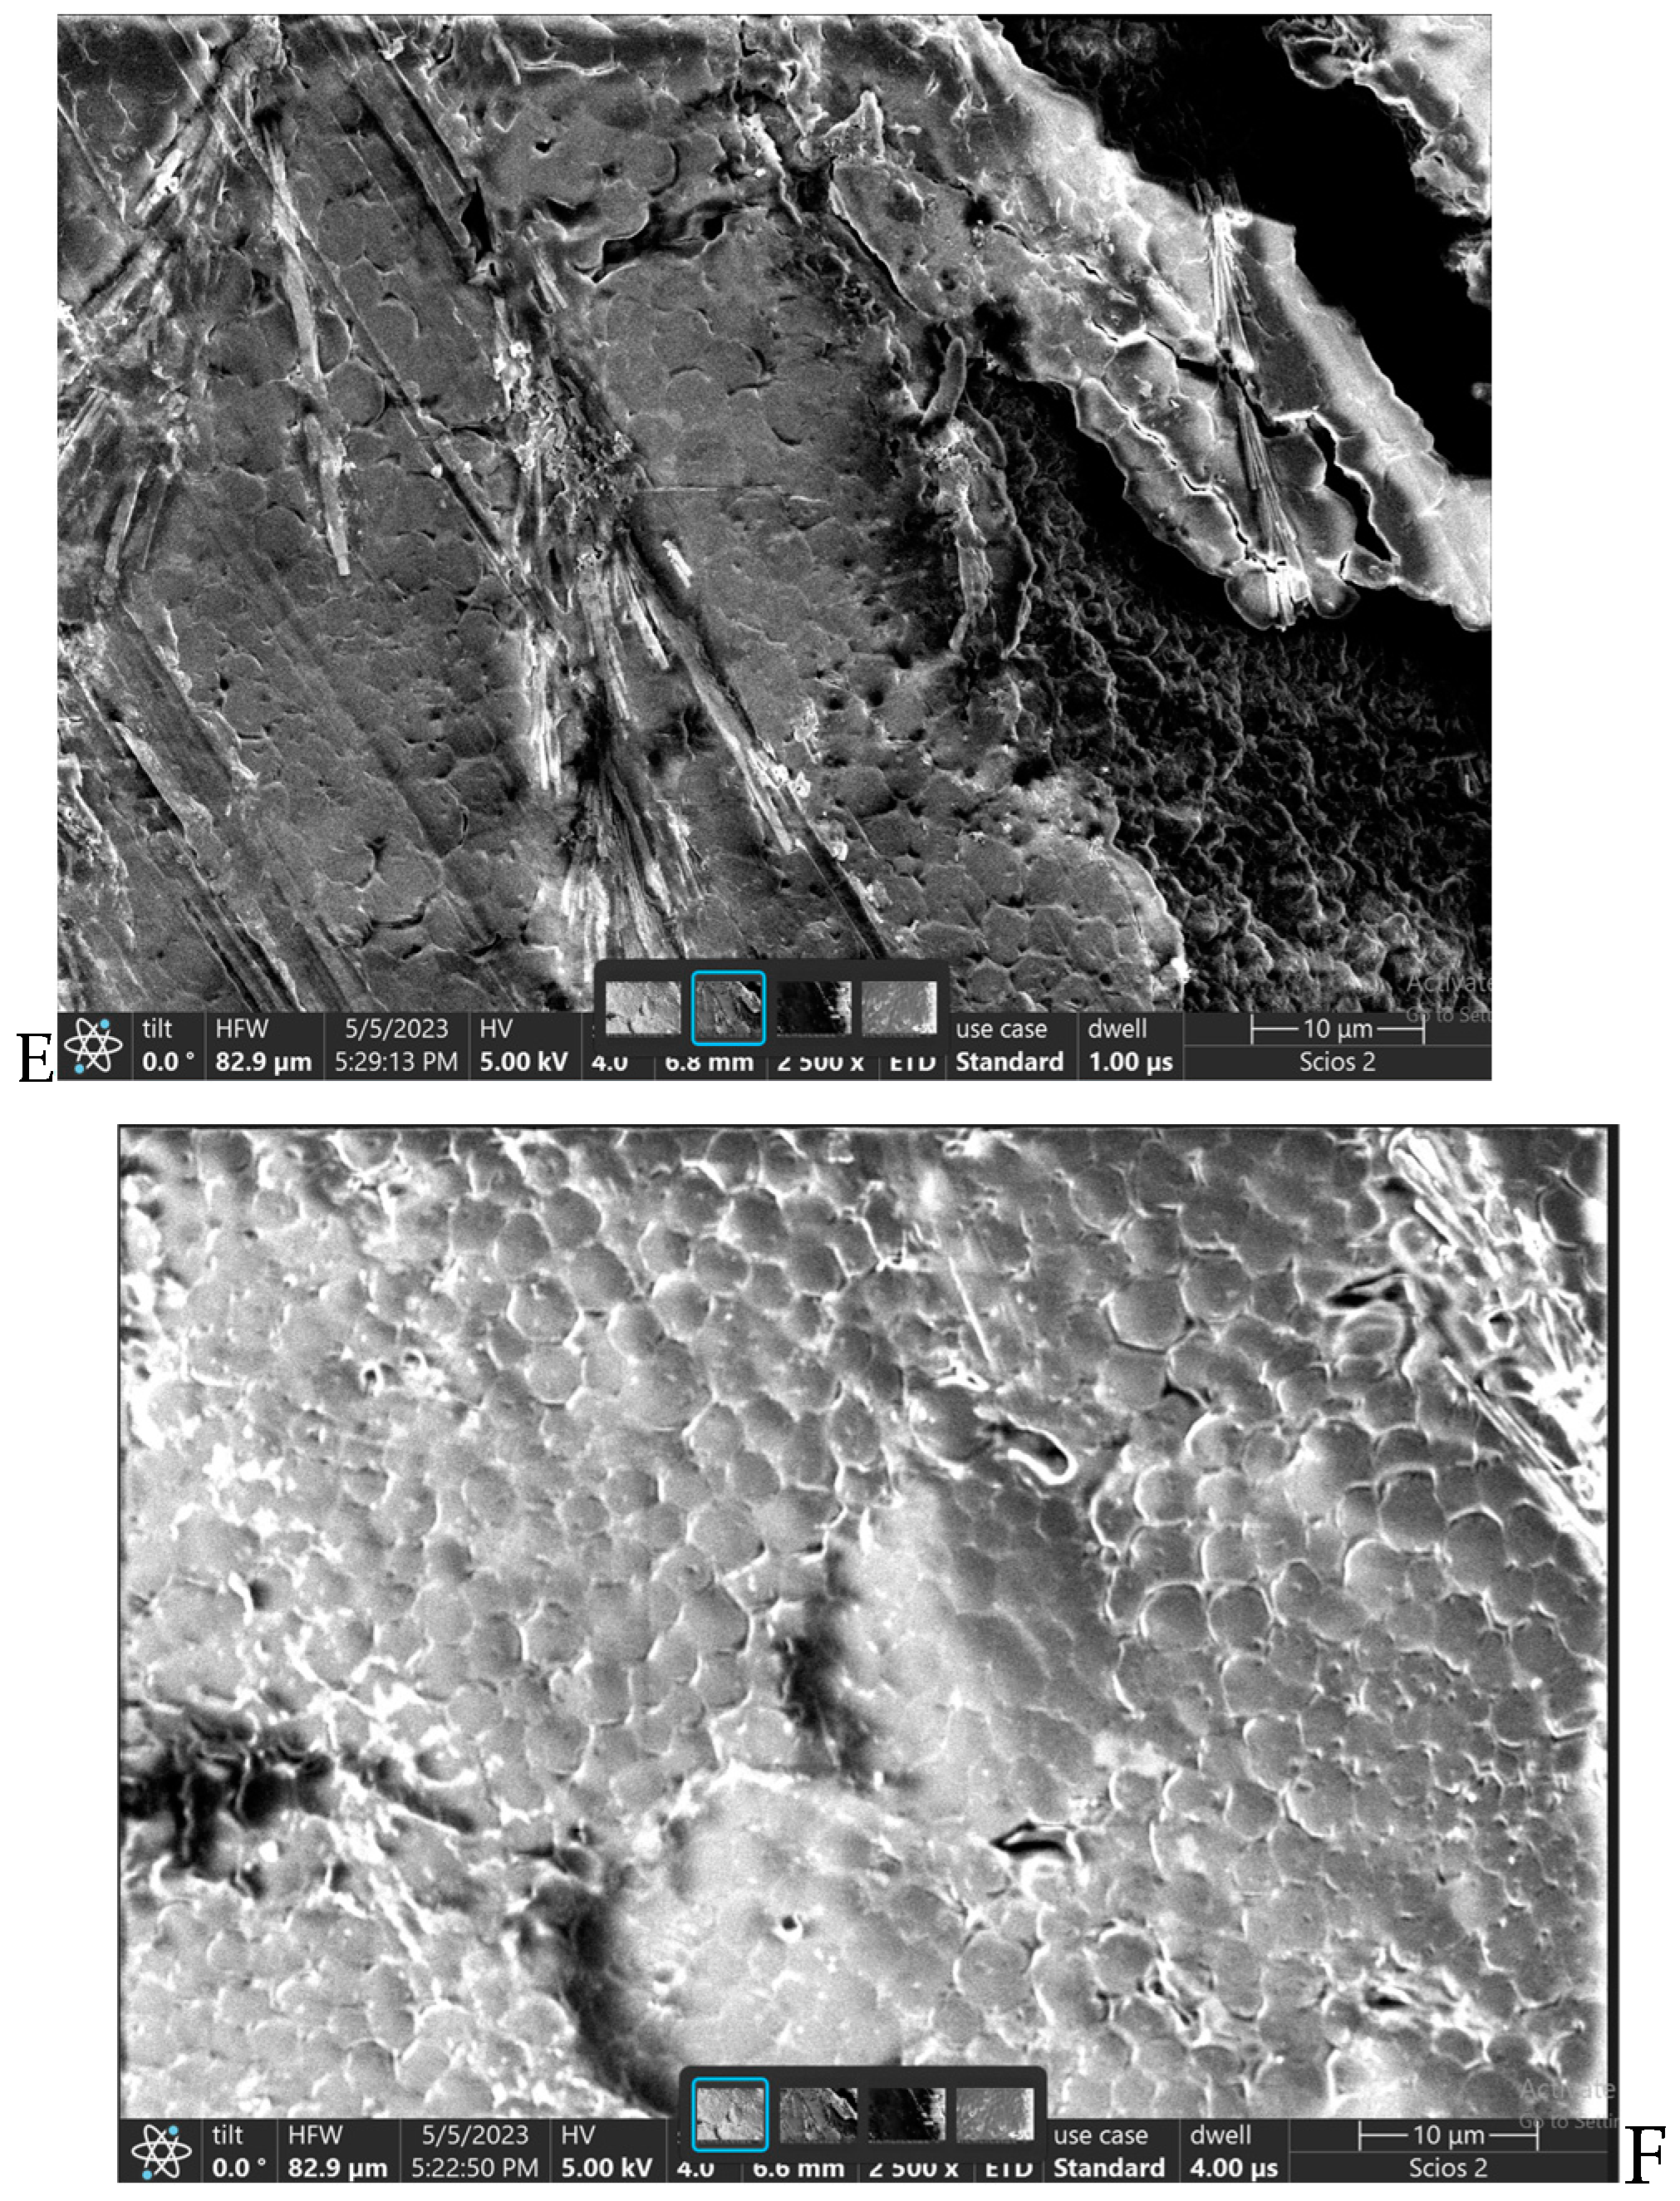
Figure 14.
The cell viability percentage after 24 h of incubation.
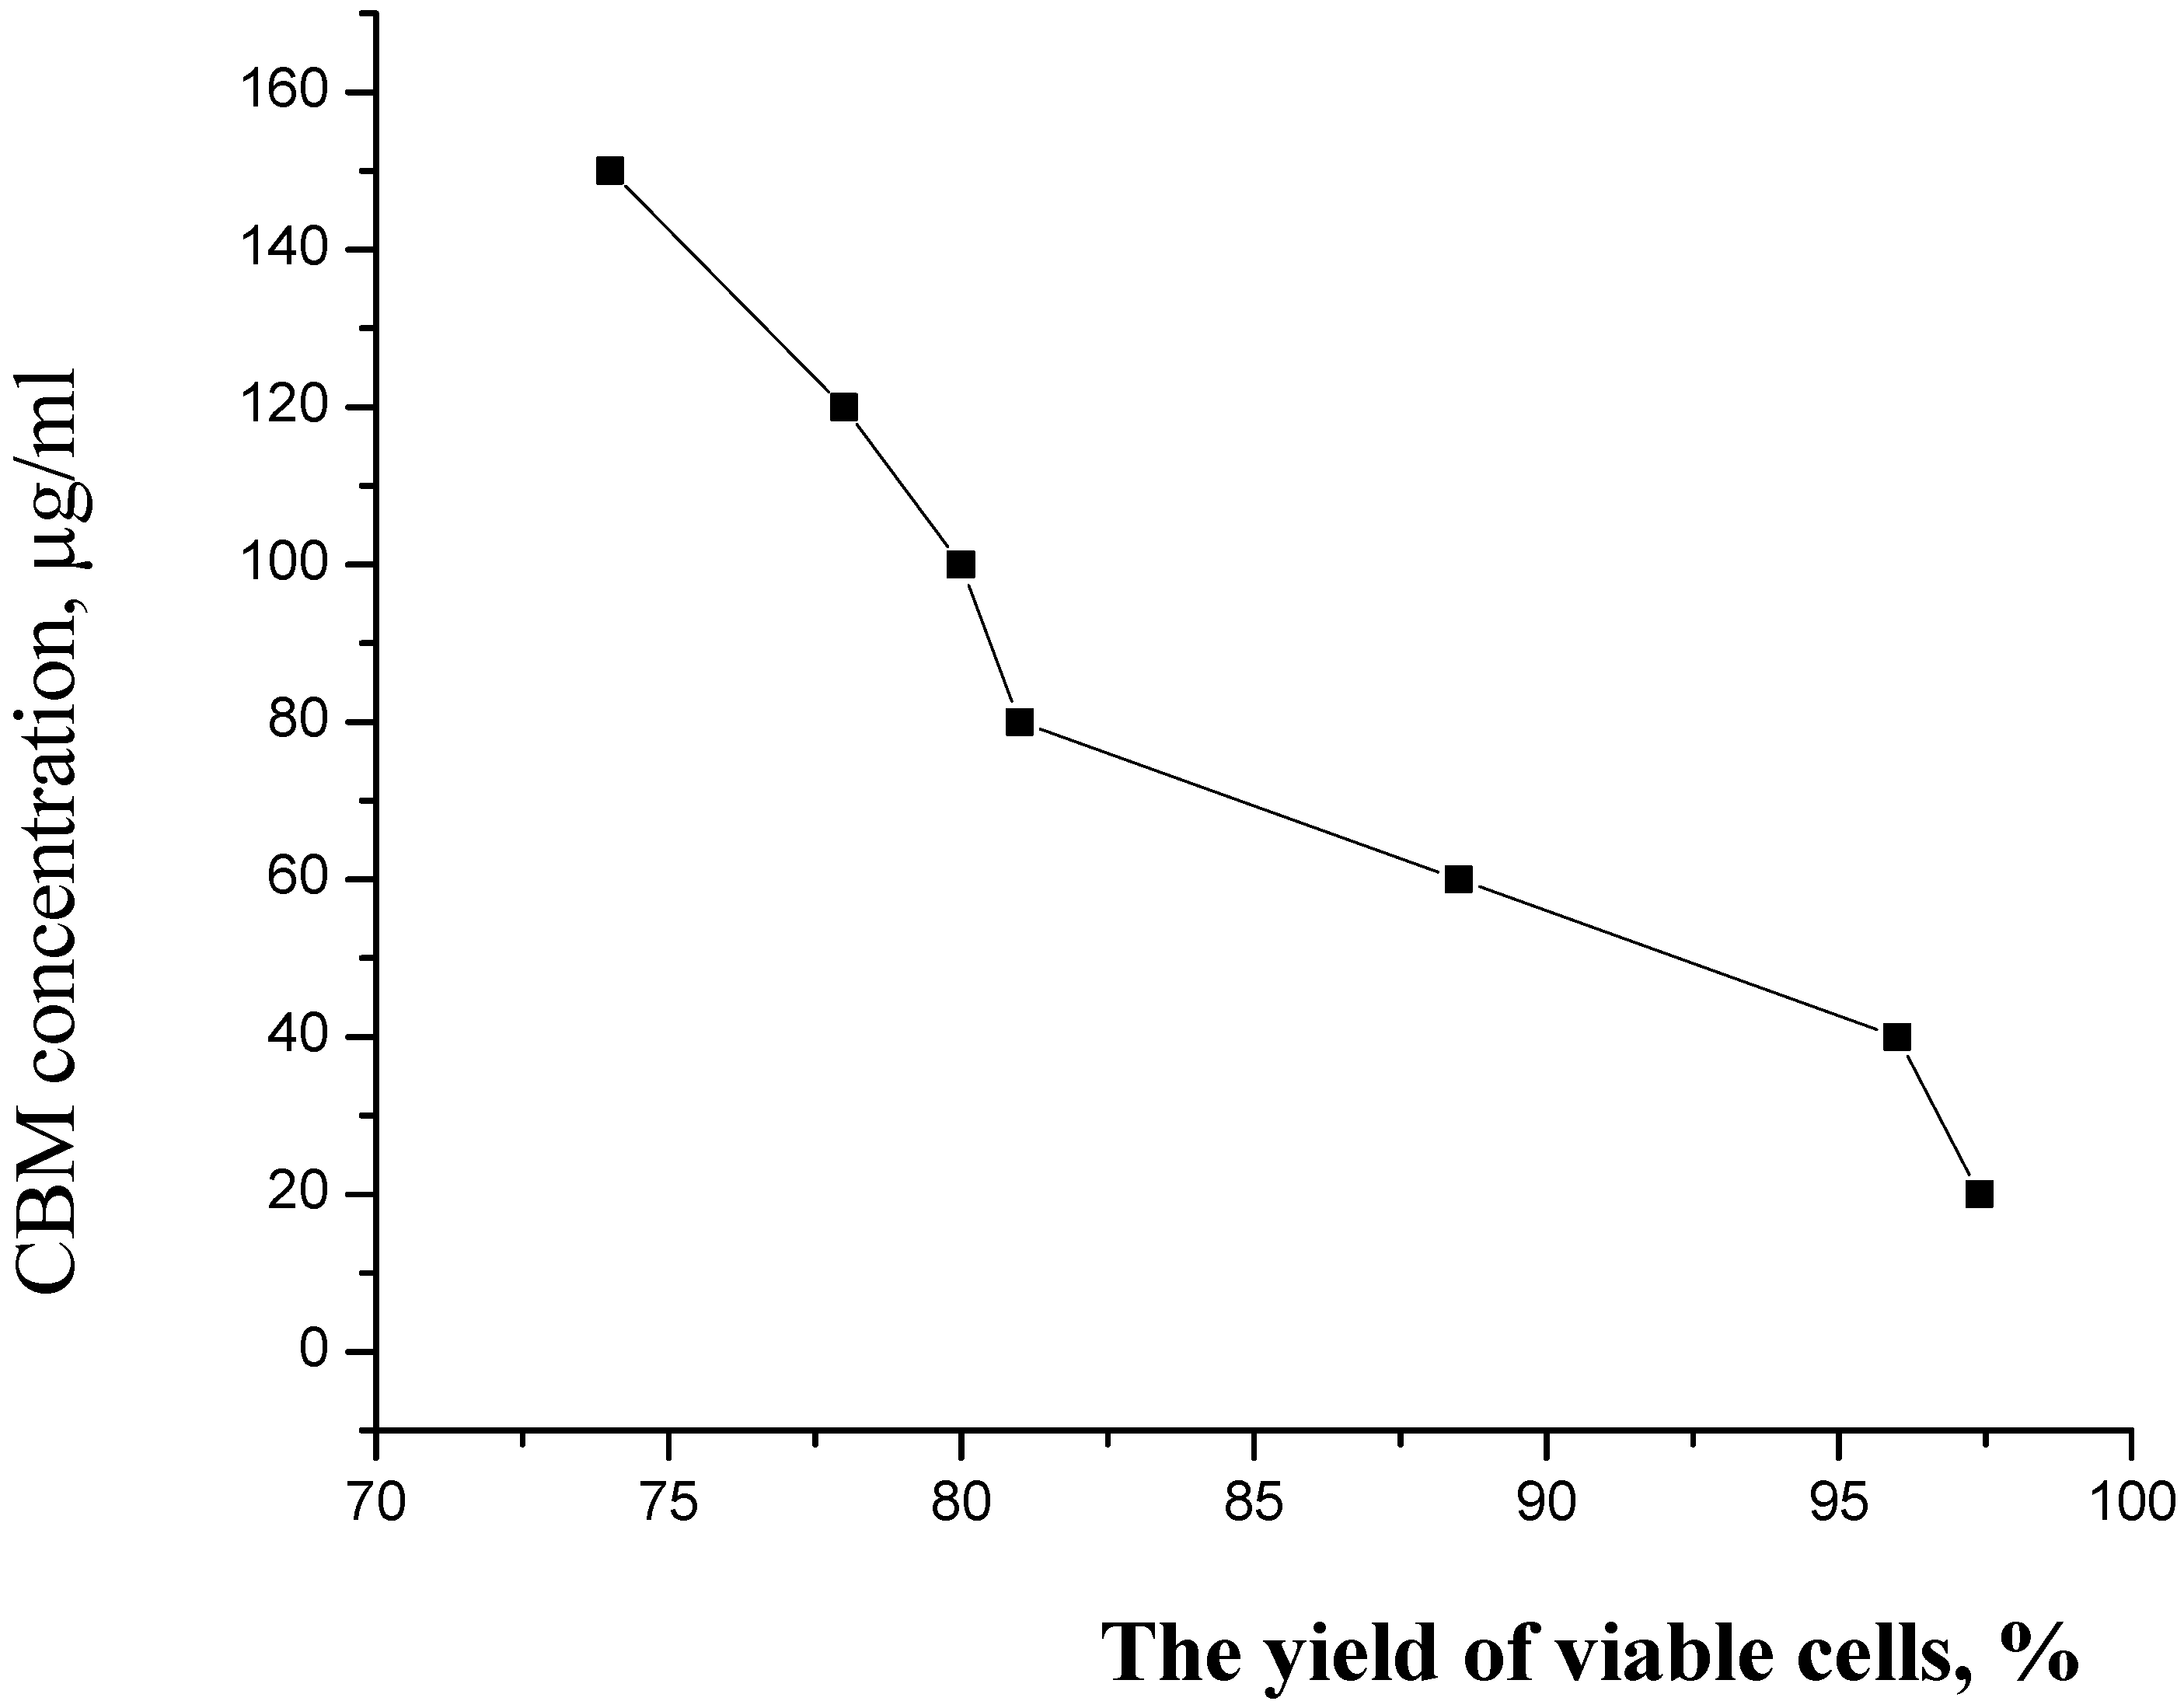
Figure 15.
Fluorescence emission in samples incubated for 24 h. Emission A-350nm, B-700nm.
Disclaimer/Publisher’s Note: The statements, opinions and data contained in all publications are solely those of the individual author(s) and contributor(s) and not of MDPI and/or the editor(s). MDPI and/or the editor(s) disclaim responsibility for any injury to people or property resulting from any ideas, methods, instructions or products referred to in the content. |
© 2023 by the authors. Licensee MDPI, Basel, Switzerland. This article is an open access article distributed under the terms and conditions of the Creative Commons Attribution (CC BY) license (http://creativecommons.org/licenses/by/4.0/).
Copyright: This open access article is published under a Creative Commons CC BY 4.0 license, which permit the free download, distribution, and reuse, provided that the author and preprint are cited in any reuse.


