
Submitted:
08 November 2023
Posted:
09 November 2023
You are already at the latest version
Abstract
Increased volume of untreated and inadequately treated municipal wastewater undermines the circular economy potential of wastewater resources, particularly in low-income region. This present study focused on and evaluated the performance of native microalgae-activated sludge (MAS) growth for tertiary treatment of anaerobically digested wastewater from an upflow anaerobic sludge blanket (UASB) in an outdoor lab-scale photobioreactors (2 L). Seven conditions with distinct inoculum concentrations were operated in batch mode in triplicate for 5-days hydraulic retention time (HRT) at 11.5:12.5 Photo-hours. MAS inoculum concentration influenced treatment outcome. The best performance was observed in MAS concentration 0.10/0.20 g L-1, with cell density count (2.03 x 10⁷ cells mL-1), biomass productivity 0.125 g TSS L-1 d-1 and total phosphorus uptake (85.07%), total nitrogen uptake (66.14%). Logarithmic removal (Log-Re) of bacterial pathogens (water quality indicators) showed Log-Re ((3.4 for total coliforms (1.37E+02 CFU 100 mL-1) and 4.7 for Escherichia coli (0.00E+00 CFU 100 mL-1)). Results revealed optimum remediation performance and nutrients’ recovery potential with appropriate inoculum concentration, in admiration to advancing the science of circular economy.
Keywords:
Microalgae-Activated Sludge
; Nutrients recovery
; Pollutant removal
; Total Coliform and Escherichia coli removal
1. Introduction
Currently, approximately 80% of wastewater is released into the environment globally without adequate treatment (Oviedo et al., 2022), which poses a major challenge confronting the whole world. The volumetric increase of untreated wastewater released into the environment from municipal, industrial and agricultural activities, may have become exacerbated due to the unmatched capacities of extant treatment facilities, mediated by human population explosion and increased consumption from continuously changing lifestyles (Routley, 2022). This constitutes a significant threat to the quality of water resources and as well public health (Aradhana and Kumar, 2015; Zhu et al., 2019; Pompei et al., 2022; Bankole et al., 2023), and by implication may affect the attainment of the United Nations’ Sustainable Development Goals (SDGs).
The use of microalgae and activated sludge (MAS) bacteria co-culture has shown to be a promising alternative wastewater treatment system. In particular, the bio-flocculation of microalgae and subsequent self-settling recovery, among other benefits derivable from the synergistic interaction, has attracted serious attention (Zhu et al., 2019; Yan et al., 2022; Zhang et al., 2021; Wang et al., 2022). From previous studies, best experimental outcomes regarding removal potential have been reported largely for MAS inoculum ratios 1:3 (Farias et al., 2023; Serejo et al., 2020; Qiao et al., 2020), 3:1 (Nguyen et al., 2020), 1:5 and 1:2 (Su et al., 2012; Lima et al., 2022), using both high-rate algae pond (HRAP) and photobioreactors (PBRs). MAS inoculum ratio has been shown to significantly influence pollution removal efficiency in co-culture systems (Huang et al., 2023). However, when it comes to concentrations of inoculum ratio, there is limited information about the implication of varying concentrations of MAS with respect to a particular inoculum ratio (e.g. 0.10:0.20 g L-1, 0.30:0.60 g L-1, 0.50:1.00 g L-1 for microalgae and activated sludge, respectively, at a fixed ratio of 1:2) on treatment efficacy and biomass production. Therefore, examining the influence of different MAS inoculum concentrations of adjudged best performing inoculum ratio on biomass growth and overall pollutants removal may aid the improvement of treatment efficiency and further understanding of the treatment process.
In most instances, the exploration of the potential of the synergistic interaction of microalgae and activated sludge bacteria co-culture has been carried out under laboratory condition, with constant supply of light and manipulation of other growth factors such as temperature and pH, using synthetic wastewater and real wastewater (Li et al., 2023; Zhang et al., 2022; Soroosh et al., 2022; Ji et al., 2021). The few instances that explored outdoor solar radiation for the treatment of municipal wastewater with microalgae and activated sludge in PBRs, focused on influences of seasonal variation on treatment efficacy (Xu et al., 2021), inoculum ratio on microbial community (Liyun 2023) and photo-oxygenation nitrogen-N removal from biosolids dewatered centrate (Marazzi et al., 2019). Also, for Vassalle et al. 2020 that examined HRAP removal efficiency of micropollutants in pilot operation under a tropical condition, instead using only microalgae consortia for the HRAP treatment process, the initial microalgae inoculum proportion of the system was not defined. All of these point to the fact that the exploration of tropical weather condition for the cultivation of microalgae for the treatment of municipal wastewater and recovery of nutrients is scarcely documented (Prado et al., 2023). Considering that adequate provision of light intensity and temperature constitute significant parts of the conditions necessary for the stability of co-culture systems (Huang et al., 2023), natural outdoor exploration under tropical condition could possibly be an environmentally sustainable means (Prado et al., 2023).
For a more realistic simulation of wastewater treatment with respect to gaining insights into outdoor performance and treatment efficiency of MAS, it becomes imperative to examine the biotreatment potential of MAS at different inoculum concentrations utilizing real municipal wastewater under natural outdoor condition, with solar energy as source of light. This would mean non-dependence on artificial lighting, and thus lead to a reduction in operational capital cost. Besides the benefits of cost-saving from cost externality linked to treatment in a controlled environment, which would enhance the sustainability of the process, since solar energy is cheap and easily available and contains the spectral quality of light (400 – 700 nm) needed for microalgae growth (Huang et al., 2017), it will provide insights into the appropriate MAS concentration that can promote the achievement of optimum treatment result. It is noteworthy to mention the plausible implication of environmental weather variability on outdoor treatment efficiency (Von Sperling, 2007; Vassalle et al., 2020), although this was partially demonstrated in the lab-scale study that was conducted by Xu et al., 2021 in China under the influence of externally supplied aeration, hence necessitates the need for a more comprehensive study of weather seasonality effect on outdoor treatment process, particularly in a tropical environment.
Therefore, this current study presented a novel idea that evaluated the performance of varying concentrations of microalgae-activated sludge (MAS) at a constant inoculum ratio 1:2 in laboratory scale photobioreactors (n = 18). A real anaerobically digested effluent, with ideal physicochemical and microbiological properties, was used as substrate for the experiment under a natural outdoor condition with solar energy as a source of light. This would present a more realistic insight and enhance the implementation of MAS process for treating municipal wastewater, and also promote the adoption of circular economy practices. The treatment performance was determined based on (a) biomass growth, (b) nutrient removal, (c) removal of total coliforms and Escherichia coli, and (d) suitability of the treated effluent for discharge to the environment.
2. Materials and Methods
2.1. Anaerobically digested municipal wastewater
Anaerobically digested municipal wastewater obtained from an upflow anaerobic sludge blanket (UASB) reactor of a municipal Wastewater Treatment Plant (WWTP) was used as substrate for culturing microalgae-activated sludge (MAS). The WWTP is located in Bauru City, São Paulo, Brazil, and sits on 6,683.14 square meters space (22°16’01.0” S, 49°05’12.05” W), which serves a population of between 30,000 and 50,000 inhabitants, at an average flow rate of 78 L s-1. The operating temperature ranged between 17 - 25 °C, at 8-hour hydraulic retention time (HRT), which is in agreement with Chernicharo (2007). The wastewater was stored for 1 hour under room condition to allow sedimentation of particles, the laboratory at the São Paulo State University (Unesp), School of Engineering, Bauru, before it could be transferred to the photobioreactors (PBRs). This was done to reduce interference with light admissibility in the PBRs. The characteristics of the anaerobically digested municipal wastewater are presented in Table 1.
2.2. Microorganisms and culture condition
Native microalgae grown in UASB anaerobically digested municipal wastewater, with 1.69 g L-1 of total suspended solids (TSS), was used as culture inoculum. Microalgae inoculum was a mixed community of Chlorella sp. (65.4%), Cyanobium (13.6%), Desmosdesmus (8.1%), Chlamydomonas (7.4%) and Tetradesmus (5.4%). The microalgae were morphologically identified at the genus level based on specialized studies, using microalgae databases (Guiry and Guiry, 2023) and identification keys (Bicudo and Menenzes, 2006). Samples of 2 mL were collected and fixed with formalin at a concentration of 5% (Bicudo and Menenzes, 2006).
The activated sludge was obtained from a WWTP located at Botucatu City, São Paulo, Brazil, and the TSS was found to be 25.76 g L-1. Prior to use, the activated sludge was incubated in a 10 L polyethylene reactor at a temperature range of 24 to 30 °C under light: dark photoperiod of 12:12 hour at 154±8 mmol m–2 s–1 for 14 days, with daily wastewater (WW) replacement (gradually increased the operational municipal anaerobic WW in mixture with the WW from Botucatu WWTP), for acclimatization. Then, the respective concentrations of the varying proportions of inoculum ratio 1:2 were determined according to Table 2, and operated in batch mode, under a natural outdoor condition. A Minjiang pump PS 950 with flow rate 0.5 L min-1 with sparging stones was used for continuous stirring and oxygen supply. MAS and microalgae inoculum concentrations for experimental conditions and controls were cultured in 1.465 L anaerobically digested wastewater, to keep within 2 L operational capacity mark.
2.3. Experimental setup
The experimental setup consists of 18 laboratory scale Duran® bottle photobioreactors (three conditions each for experimental and three control, considering the triplicate), with 2.2 L capacity each (27 cm - length and 13 cm -diameter), and was operated within 2 L capacity.
Conditions 1 to 3 (Table 2) were inoculated with different concentrations of microalgae-activated sludge (MAS) at inoculum ratio 1:2 and conditions 4, 5, 6 (control) were inoculated with the corresponding microalgae concentrations of conditions 1, 2, 3, respectively (Figure 1). The experiment was conducted for 5 days, determined by 90% removal of dissolved phosphorus, which is considered a growth limiting nutrient level for microalgae (Mathew et al., 2022). Equal exposure of cultures to solar energy was achieved using sparging induced agitation (Alcántara et al., 2015).
2.4. Ambient temperature and light intensity for MAS cultivation
The experiment was conducted during the winter weather season in Brazil (27th June to 2nd July, 2022). The ambient temperature and light intensity readings were obtained from the automatic weather forecast located at latitude 22°21’27.6” and longitude 49°01’40.8”, through the Meteorology center at UNESP in Bauru (IPMet). Obtained data were recorded at 5 minutes intervals, and the solar radiation data were converted from Rs (W m-2) to the photosynthetically active radiation (PAR) (μmol m-2 s -1) using the conversion factor of 2.02, according to Reis & Ribeiro (2020). Therefore, the daily average light intensity ranged from 694.29 to 841.31 μmol m-2 s-1, and the temperature ranged from 18.0 to 20.0 °C, implying that MAS culture was grown in a moderate temperature range. Hence, the light: dark photoperiod averaged at 11.5 :12.5 hours per day during the period of the experiment.
2.5. Analytical methods
Total biomass growth pattern in cultures were evaluated daily with TSS (2540 D, APHA, 2017), optical density 680 nm wavelength (OD680nm), (NANOCOLOR UV/VIS II Spectrophotometer), and microalgae cell count (cell mL-1) was determined with Optical microscope, Leica microsystems, D. 35578, Wetzlar, Germany. Daily monitoring of nutrients removal (total dissolved phosphorus-TDP and total dissolved nitrogen-TDN) was determined by Spectrophotometer NANOCOLOR UV/VIS II (4500-P-E for TDP, 4500-NO3-B, 4500-NO2-B, 4500-NH3-B and C for TDN; APHA, 2017) (n = 18). Total Alkalinity determined by Titration potentiometric with sulfuric acid (2320-B; APHA, 2017), was evaluated on day 0 (D0), day 3 (D3) and day 5 (D5) of the experiment. Total coliforms and E. coli were determined at D0 and D5 of the experiment using Chromocult Coliform Agar (Pour Plate 9215B, Merck KGaA, Germany, APHA, 2017) in triplicate. The pH (4500-HB, APHA, 2017) was monitored daily (n = 18).
The nutrients analyzed were the dissolved nutrients (nitrate, nitrite, ammonium and phosphate), which were determined according to APHA, (2017). The samples were first filtered through 1.2 µm glass fiber pore size membrane filter and then through 0.45 µm pore size cellulose acetate membrane, to determine the dissolved nutrients. Additionally, total suspended solids (TSS) gravimetric analysis for productivity (dry weight) represented the biomass in culture medium.
2.6. Statistical analysis
The results were entered into Excel Spreadsheet, and SPSS Version 22.0 was employed for the statistical analysis. Data were analysed for mean, analysis of variance (ANOVA) and least significant difference (LSD) post hoc. T-test was used to determine variations in the concentrations of parameters analyzed between D0 and D5, with 5% level of significance. The relationship between microalgal-activated sludge (MAS) bacteria inoculum and nutrients recovery were performed using Pearson’s correlation analysis. Geometric mean was used to calculate the average total coliform and E. coli bacteria population to avoid probable distortion from the varying triplicate values (Sperling, 2005).
3. Results and Discussion
3.1. Outdoor temperature and light intensity: potential for biomass growth
The experiment was conducted at a moderate temperature range (18.0 to 20.0 °C), based on the optimum temperatures reported in the literature for microalgal growth, but within the interval considered suitable for photosynthetic efficiency and growth for most microalgae species (Masojídek et al., 2022; Dolganyuk et al., 2020; Carneiro et al., 2020). For light intensity (694.29 to 841.31 μmol m-2 s-1), the range of values recorded is considered adequate (Kliphuis et al., 2010; Carneiro et al., 2020).
Although, the potential for increased growth with higher light intensity was demonstrated after a gradual increase from 600 to 1500 μmol m -2 s -1 significantly yielded a percentage growth difference (~92%, dry weight) in Kliphuis et al. (2010). The positive growth response was possibly due to the penetrative strength of the new light intensity, which restrained biomass shadowiness that may have limited the photosynthetic response of microalgae at 600 μmol m-2 s-1. This suggests the possibility of increased biomass productivity in the summer weather season in an outdoor treatment situation.
This evaluation becomes essential as temperature and light intensity values play crucial roles in the growth and productivity of microalgae culture for an outdoor photobioreactor treatment, in addition to nutrient adequacy and appropriate mixing (Coronado-reyes et al., 2022; Chowdury et al., 2020).
3.2. Operational and environmental conditions
The differences in pH values between the experimental conditions are not statistically significant (p > 0.05; Table 3). Although, increase in pH from near neutral to alkaline was observed on the second day of the experiment, and remained in the alkaline zone till the end of the batch experiment. Yu et al. (2022) reported similar findings in reactors without pH control during the evaluation of different pH levels on microalgae cultivation and biomass recovery that was operated in batch mode. The pH values differed in this order 1>2>3 (Table 3), which shows different levels of CO2 fixations through photosynthesis in the PBRs, although not significantly (p > 0.5) different. Also, pH values for controls differed in this order 4 < 5 < 6, with no significant difference.
The co-culture of microalgae and activated sludge have been shown to affect the level of pH in the reactor with respect to conversion of nitrogenous compounds (Nagabalaji et al., 2023). Removal of nitrogen in UASB reactor is negligible but becomes mineralized (NH4+-N) through hydrolysis of protein and urea (Metcalf et al., 2003; Vassalle et al., 2020). Resultantly, NH4+-N was the predominant form of nitrogen in the substrate wastewater. Considering ammonium (NH4+-N) is easily assimilated as the preferred form of nitrogen by microalgae with less energy dissipation (Kumar and Bera, 2020), nitrogen removal was considerably largely by assimilation and followed by nitrification, and as such may have contributed less to increasing pH values from slightly acidic to alkaline. According to Huang et al. 2023, the co-culture systems synchronously achieve the removal of nitrogen and chemical oxygen demand (COD) by microalgae and activated sludge, respectively.
From previous studies, pH increase was attributed to reduction in bicarbonates in the form of CO2 fixation in the cultures, enabled by photosynthesis (Li et al., 2015; Ronda et al., 2012). This invariably leads to a reduction in total alkalinity concentration, (Li et al., 2015; Ronda et al., 2012; Paquette et al., 2022; Rodero et al., 2018), same which served as a source of inorganic carbon for growth and a similar occurrence was also observed in this experiment. From Table 3, deviation reflects alkalinity reduction across the conditions (not statistically significant, p = 1. 43), which is an indication of consumption of inorganic carbon in form of carbonate and bicarbonate present in the effluent (Slompo et al., 2020).

Table 3.
Mean and standard deviation of pH, total alkalinity, biomass productivity and cell density at optical density 680nm, and nutrients removal efficiencies found in the conditions.
Table 3.
Mean and standard deviation of pH, total alkalinity, biomass productivity and cell density at optical density 680nm, and nutrients removal efficiencies found in the conditions.
| Condition | pH | Total Alkalinity (mg CaCO3 L-1) |
^Total biomass productivity (g TSS L-1 d-1) |
^Cell density (OD680nm) | TDP removal (%) |
TDN removal (%) |
|---|---|---|---|---|---|---|
| 1 | 9.40±1.30a | 163.70±73.70 | 0.10±0.01a | 0.84±0.10a | 85.1±1.04 | 66.1±6.40 |
| 2 | 9.40±1.20a | 211.40±63.30 | 0.05±0.02b | 0.31±0.03b | 40.7±10.30 | 16.4±5.80 |
| 3 | 8.90±0.90a | 235.30±87.00 | 0.04±0.03b | 0.17±0.10b | -43.7±15.70 | -62.90±10.04 |
| Control | ||||||
| 4 | 9.40±1.30a | 194.80±49.00 | 0.09±0.01a | 0.75±0.30a | 83.9±10.40 | 43.20±13.60 |
| 5 | 9.50±1.20a | 211.80±53.80 | 0.11±0.03a | 0.97±0.01a | 85.5±8.80 | 58.3±7.00 |
| 6 | 9.60±1.20a | 205.30±68.70 | 0.13±0.02a | 1.10±0.02a | 92.3±1.20 | 60.6±5.10 |
n = 18; ^Mean difference (D0-D5); a-bMeans without a common superscript letter in a column differ (p < 0.05) as analyzed by one-way ANOVA and LSD. TDP and TDN indicate the dissolved proportion of Phosphorus-P and Nitrogen-N, respectively, in the solution as samples were filtered through 0.45 µm membrane pore size prior to determination.
3.3. Effect of inoculum concentrations on total biomass productivity
Total biomass productivity (Microalgae cell and sludge bacteria) was evaluated with respect to different MAS inoculum concentrations on photosynthetic responses and subsequent microalgae cell growth, and bacteria cells replication. Cell productivity varied significantly (p = 0.001) among the experimental cultures. LSD post hoc revealed condition 1 was significantly higher than conditions 2 and 3, and fairly within the same range for the controls (conditions 4 – 6; p > 0.05, Table 3 and supplementary tables). The proportions of activated sludge inoculated in conditions 2 and 3 appeared to be in excess of the capacity of the systems and thus compromised the performance by interfering with photosynthesis and subsequent productivity rate in the reactors.
Therefore, MAS inoculum concentration for wastewater treatment with respect to the treatment capacity of the system is critical to the translucence of cultures in PBRs and consequent light energy receivable from solar radiation, which is required for replication and growth of microalgae, thus probably limiting oxygen supply within the systems to sludge bacteria due to altered gaseous exchange between MAS (Tricolici et al., 2013; Khan et al., 2018; Lage et al., 2021). This shows that while light intensity is essential for microalgae productivity (Metsoviti et al., 2019; Nzayisenga et al., 2020), the MAS concentration of cultures seems to play an essential role in the amount of irradiance (light received), energy available for photosynthesis and subsequent gaseous exchange for optimum synergistic performance of the systems to achieve effective treatment.
Notably, the results of productivity for condition 1, and the control experiment (4, 5 and 6) were similar to the values in the existing literatures for microalgae cultivations conducted outdoor (Fuentes et al., 2020; Mazzelli et al., 2020). Fuentes et al. (2020) reported 0.140 g TSS L-1 d-1 productivity in a large-scale cultivation of Coccomyxa onubensis with a synthetic commercial NPK fertilizer solution that was operated for 30 days outdoor. Also, Mazzelli et al. (2020) reported a productivity range of 0.09 to 0.19 g TSS L-1 d-1 in the pilot study that cultivated Tetradesmus obliquus and Graesiella emersonii in local tap water for 9 months. In our study, native microalgae and activated sludge (MAS) in different concentrations (three conditions) were cultivated in real anaerobically digested municipal wastewater in laboratory scale PBRs outdoor, and evaluated the best MAS concentration, and biomass productivity 0.100 g TSS L-1 d-1, 0.090 g TSS L-1 d-1, 0.110 g TSS L-1 d-1, and 0.130 g TSS L-1 d-1 were obtained for conditions 1, 4, 5 and 6, respectively.
Considering that not always the total of the TSS refereed to biomass, since there may be a significant percentage of inorganic solids, the estimation of microalgae cell growth and density was also determined in terms of OD680nm. The results of measurements followed the same trend that was noted for productivity (Table 3). The strong positive correction that was established between a model predicted cell growth and estimated cultured growth at OD680nm for a mixed culture (microalgae and bacteria) evidently demonstrated cell growth measurement potential for MAS at OD680nm (Casagli et al., 2021).
As previously noted, conditions 2 and 3 (high MAS inoculum concentrations) (Table 2) had limited cell growth, as evidenced by low cell growth estimates at OD680nm. A potential explanation for this is the die-off of microalgae and subsequent cell ruptures due to photoinhibition from shadowiness (Lage et al., 2021). Likewise, secretion of chemical substances (algicidal) by bacteria, decimating microalgae and shading effect on microalgae from bacteria could result in mass death and interfere with productivity (Amaro et al., 2023), hence why it is important to determine the appropriate MAS inoculum concentrations for a treatment system to achieve optimum treatment outcome.
The fragments of intracellular pigments released into the cultures from ruptured cells were considered minute and undetected at OD440nm and OD680nm, as established in the sonication monitoring study of three microalgae species (M. aeruginosa, C. pyrenoidosa, and C. reinhardtii) using optical density estimate of microalgal suspension, intracellular pigments and protein, and cell counting (Tan et al., 2018). Moreover, Slompo et al. (2020) has shown that biomass measurement at OD682nm is commonly indicative of biomass growth and not cell rupture.
Additionally, the photoautotrophic growth of microalgae cells in the cultures was shown in Figure 2. No lag phase was observed except for condition 3 (culture with highest MAS inoculum concentration: 0.40 g L-1 of microalgae + 0.80 g L-1 of activated sludge, with slight decline on the second day of the experiment, suggesting die-off of some microalgae cells. Microalgae cell density varied significantly across the conditions (p = 0.000) and ranged between 1.99 x 10⁶ and 1.60 x 10⁷ cells mL-1, 5.30 x 10⁶ and 1.30 x 10⁷ cells mL-1, 1.07 x 10⁷ and 1.83 x 10⁷ cells mL-1 for conditions 1 to 3, respectively. Among the cultures, conditions 2 and 3 decreased in cell density on day 4 of the experiment as evidenced on the growth trend (Figure 2), suggesting growth of microalgae cells are limited by irradiance from shading effect (Amaro et al., 2023), which could mean that the inoculum concentrations were beyond what the systems are capable of accepting to achieve effective treatment. This could be attributed to poor translucence caused by bacteria shading and linked to the proportions of MAS inoculum concentrations which are probably in excess of what the systems can accommodate to initiate optimum cell growth and adequate treatment (Lage et al., 2021; Amaro et al., 2023).
As indicated above, condition 1 among the experimental scenarios, and similarly for the controls 4, 5 and 6, microalgae cell growths were similar to the findings of Pacheco et al. (2019) that cultivated native microalgae (predominantly Scenedesmus) in municipal wastewater using pilot-scale photobioreactor outdoor, and achieved maximum mixotrophic (1.887 × 10⁷ cells mL−1) and heterotrophic (1.473 × 10⁷ cells mL−1) cell production. Similarly, in the study conducted by Vella et al. (2019), where T. weissflogii was cultivated outdoor all year round in batches, using seawater enriched medium (f/2 medium) substrate in transparent poly-methyl methacrylate photobioreactor, the obtained cell growth results (June - August) aligned with the results obtained for conditions 1, 4, 5 and 6 of this present study. It is expedient to mention that inoculum concentrations affected the growth of microalgae cells, with the lowest inoculum proportions yielding higher cell growth (1 > 2 > 3), except for condition 5 among the controls that yielded higher microalgae cell growth than (6 > 4). Ater attaining a certain level during the experiment, particularly the controls, cell growth tends towards decrease and actually decreased in the case of conditions 2 and 3. Optical limitation or photoinhibition induced by too high or too low inoculum concentrations could affect cell growth (Cheng et al., 2018). Also, the amount of initial inoculum has a significant influence on cell productivity and growth rate, with lowest initial inoculum producing higher biomass density (Bohutskyi et al., 2016; Cheng et al., 2018). Nonetheless, a definitive comparison is challenging because of limited information and varying cultivation techniques employed.
3.4. Effect of inoculum concentrations on nutrients removal
The end of the experiment was premised on the attainment of ≥ 90% TDP removal (mg P-PO4 L-1), beyond which further significant growth level for microalgae cells may not be achieved (Mathew et al., 2022). Therefore, 92.3% of TDP uptake was attained in condition 6 (control group) at D5 and 85.1% of TDP uptake was attained in condition 1, among the experiment group, with no significant difference (p > 0.05).
The percentage removal of total dissolved phosphorus (TDP) and total dissolved nitrogen (TDN), varied significantly among the three conditions (p < 0.05). The TDP (85.1%) and TDN (66.1%) removal were highest in condition 1. Considering the control conditions (4 to 6), the condition 6 had the highest TDP removal (92.3%) (Table 3). Based on the results obtained in nutrients removal, there were observable increases in the uptake of TDP and TDN in conditions 1 and 2, and the controls (4, 5 and 6), under different MAS and microalgae inoculum concentrations, while the concentrations of TDP and TDN increased by 43.7% and 62.9%, respectively, in condition 3. This is a reflection of the decrease of cell count observed on the second day of the experiment for condition 3 (Figure 2). The fraction of activated sludge that make up the MAS concentration for this condition could have interfered with light penetration, and consequent microalgae cell rupture, thus releasing nutrients within the solution (Nguyen et al., 2020). For experimental conditions, uptake of TDP and TDN in condition 1 on D5, last day of the experiment, was significantly higher than conditions 2 and 3 (p < 0.05), while it was statically similar to the controls (4, 5 and 6), which contained the proportionate concentrations of microalgae in conditions 1, 2 and 3, respectively. This suggests that the MAS inoculum concentration, particularly for activated sludge, can significantly affect the pollution abatement potential in relation to biomass growth of co-culture systems. Information on nutrient loads of MAS and microalgae and the probable add-on to nutrients level in the reactors from the different inoculum proportions was not provided as this was not evaluated in the study. It has been shown that optimum biomass productivity produces the best nutrients removal performance during cultivation (Dębowski et al., 2018; Yu et al., 2019; Murray et al., 2010; Yadav et al., 2019). This explains the strong negative relationship between optical density (OD680nm) and TDP uptake, with obvious increased biomass production leading to reduced concentration of TDP (r = -0.7 for condition 1, r= -0.8 each for control conditions 4, 5 and 6), and conversely for conditions 2 and 3, (r = 0.5, 0.7, respectively) (Table 4).
These results suggest that the concentration of MAS inoculum to be used for microalgae cultivation and bioremediation of wastewater constitutes an essential condition that should be factored into experimental set-up, which is in agreement with previously reported findings by Soroosh et al. (2022). Therefore, beyond defining the inoculum ratio for a mix-culture of MAS, it is essential to determine the appropriate MAS concentration with respect to the operational size of PBRs, to avoid any form of interference of the photosynthetic process that can consequently limits microalgae cell growth and replication.
Table 4.
Correlation between TDP removal and OD680 of the conditions.
| Condition/ | ||||||
| Control | TDP1 | TDP2 | TDP3 | TDP 4 | TDP5 | TDP6 |
| OD1 | -0.7 | 0.0 | 0.7 | -0.7 | -0.7 | -0.8 |
| OD2 | -0.2 | 0.5 | 0.8 | -0.4 | -0.4 | -0.4 |
| OD3 | 0.0 | 0.6 | 0.7 | -0.2 | -0.1 | -0.2 |
| Control | ||||||
| OD4 | -0.8 | -0.1 | 0.7 | -0.8 | -0.8 | -0.8 |
| OD5 | -0.8 | -0.2 | 0.6 | -0.8 | -0.8 | -0.8 |
| OD6 | -0.8 | -0.2 | 0.6 | -0.8 | -0.8 | -0.8 |
TDP = Total dissolved phosphorus, OD = Optical density; Negative  ; Neutral
  ; Positive
  .
.
; Neutral ; Positive .The obtained results clearly showed the feasibility of nutrients assimilation by microalgae-based systems in an outdoor environment, when the appropriate inoculum concentration is used. This is without prejudice to other growth influencing factors such as temperature, light intensity, pH. Overall, this presents potential benefits for nutrients cycling in an efficient manner, usable as bio-fertilizers for the production of food and cash crops (Cakirsoy et al., 2022; Dineshkumar et al., 2017; Dineshkumar et al., 2018; Suleiman et al., 2020).
3.5. Assessment of Total coliforms and Escherichia coli removal
The potential of MAS to remove total coliforms and E. coli from municipal wastewater was evaluated on D0 and D5 (Table 5) and log removal (Log-Re) performance is shown in Figure 3. Complete Log-Re was achieved for E. coli in all the experiments tested (conditions 1 to 3 and controls 4 to 6).
The control experiments had better total coliforms results, with Log-Re 5.2 in conditions 4 and 5, and 5.1 in condition 6. Moreover, total coliforms in condition 1 system were reduced by 3.4 log unit, while conditions 2 and 3 had 2.5 and 2.3 Log-Re for total coliforms, respectively.
Table 5.
Geometric mean of total coliforms and E. coli at D0 and D5 in the conditions.
| Conditions/ Controls |
Day 0 (D0) | Day 5 (D5) | ||
|---|---|---|---|---|
| Total coliform (CFU 100 mL-1) |
Escherichia coli (CFU 100 mL-1) | Total coliform (CFU 100 mL-1) |
Escherichia coli (CFU 100 mL-1) | |
| 1 | 2.79E+05 | 3.59E+04 | 1.07E+02 | 0.00E+00 |
| 2 | 1.48E+05 | 3.55E+04 | 5.23E+02 | 0.00E+00 |
| 3 | 1.83E+05 | 4.33E+04 | 8.81E+02 | 0.00E+00 |
| Controls | ||||
| 4 | 1.64E+05 | 3.79E+04 | 0.00E+00 | 0.00E+00 |
| 5 | 1.77E+05 | 3.46E+04 | 0.00E+00 | 0.00E+00 |
| 6 | 1.15E+05 | 2.914E+04 | 0.00E+00 | 0.00E+00 |
Figure 3.
Log removal (Log-Re) for total coliforms and E. coli.
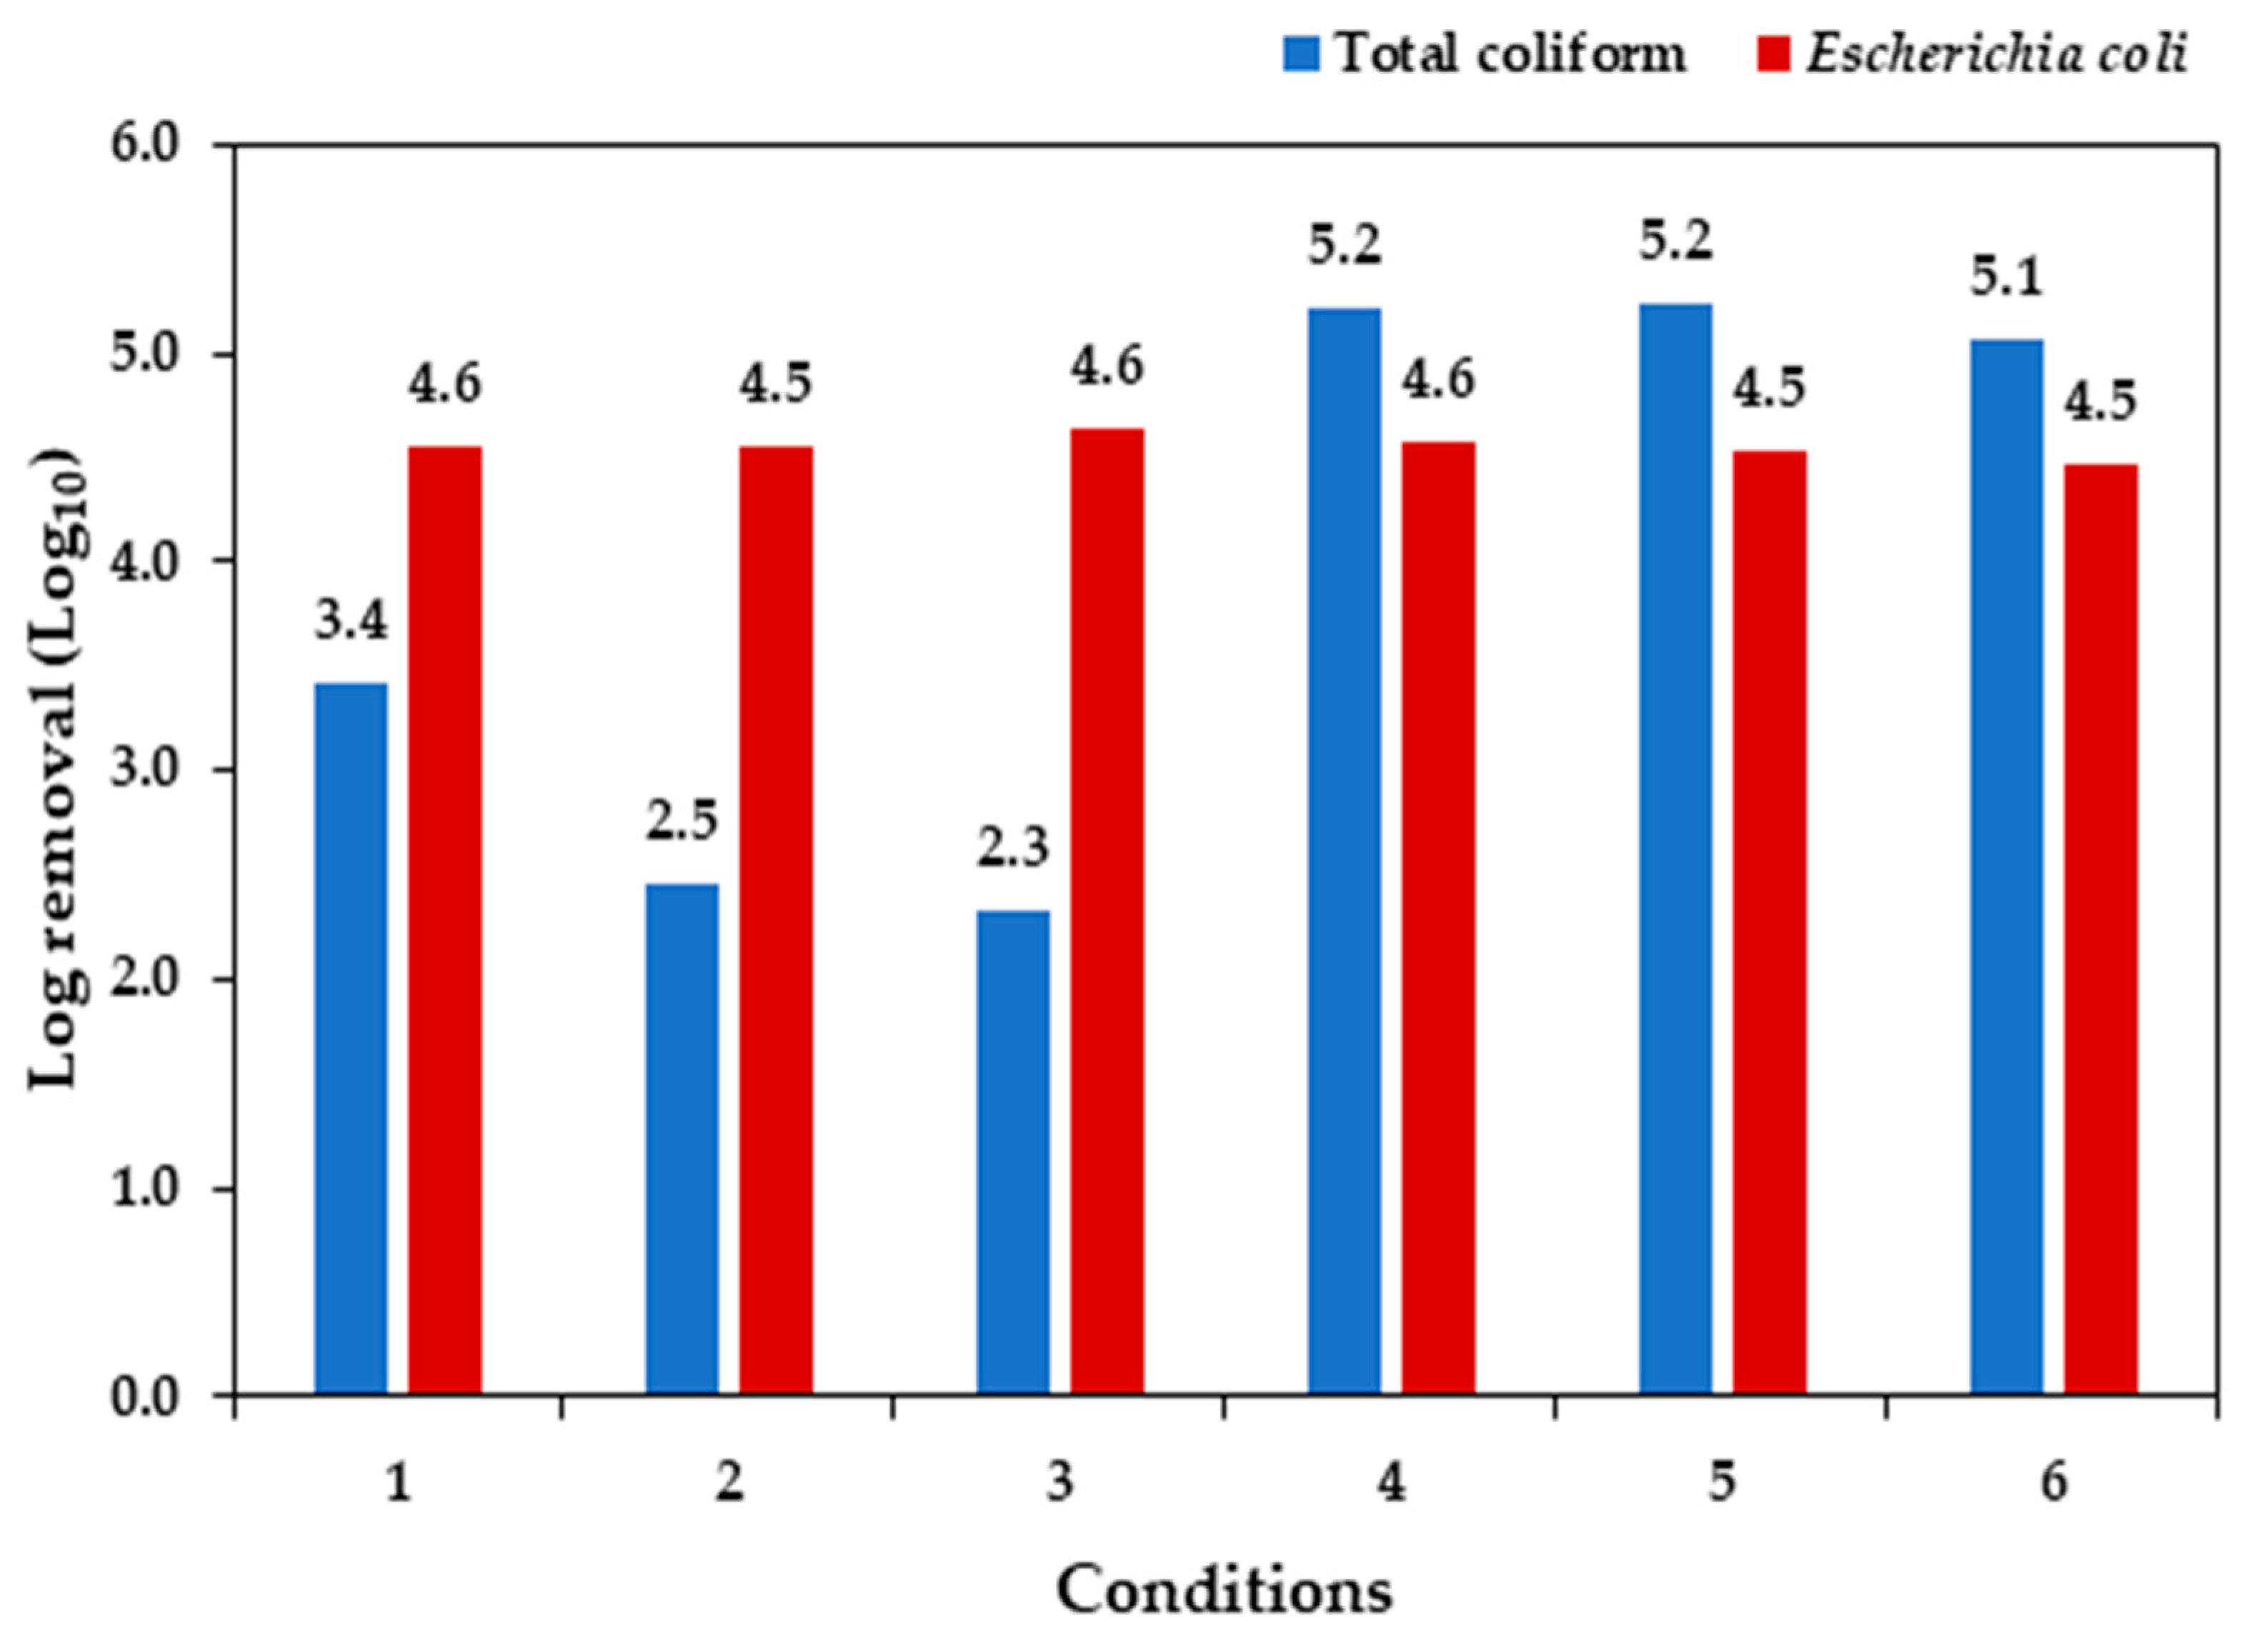
While the complete Log-Re for E. coli cut across the three conditions, the lowest Log-Re for total coliforms was observed in conditions 2 and 3, and varied significantly from condition 1. This is probably as a result of the low microalgae biomass growth in these systems, with consequent nutrients availability and reduced secretion of antibacterial compounds (Rani et al., 2021; Delanka-Pedige et al., 2019; Ansa et al., 2012). Additionally, the operational conditions of cultures, such as increased pH and competition with bacteria, may have contributed to inactivation of pathogenic microorganism indicators (E. coli).
For E. coli, high die-off rate was reported in alkaline medium (Liu et al., 2020; Fallowfield et al., 1996). This probably was responsible for the outright Log-Re in the E. coli population in all the cultures at D5, the last day of the experiment. The results obtained were comparable with findings from Liu et al. (2020) and Fallowfield et al. (1996). Importantly, the result showed potential of resultant wastewater to be deployed for non-potable purposes like irrigation and lawn wetting without posing a risk of contamination by pathogenic organisms, and complies with the World Health Organization standard of 103 MPN 100 ml− 1 for E. coli for non-potable purpose (WHO, 2006).
3.6. MAS inoculum concentration for wastewater treatment
Mean difference between D0 and D5 was calculated for selected parameters, using 95% confidence interval. From Table 6, the obtained significant variation (p < 0.05) further confirmed the previously mentioned inoculum concentration that fostered biomass productivity, nutrient removal efficiency and high recovery potential.
Among the experimental conditions, condition 1 (0.10/0.20 g L-1) demonstrated the potential for use in an outdoor treatment system for wastewater, and recovery of high-value products, drawing from the high performance of the MAS inoculum in the treatment systems, as against others which seem undermine the treatment capacity of the systems. This removal depicts a promising alternative means to providing economically viable resources in an environmentally friendly manner, and as well support the resilience of overburdening natural systems (World Bank, 2020; Chrispim et al., 2020).
The overriding importance of this optimum inoculum concentration, besides enabling treatment efficacy and nutrients uptake, stems from the potential for high biomass recovery through self-settling. The synergistic interaction of MAS aids the formation of bio-flocculation, and recovery of high quality and nutrient-rich biomass by sedimentation under gravity (Zhu et al., 2019). The bio-flocs are made of extracellular polymeric substances (EPS) separately produced by microalgae and bacteria, which are subsequently bonded together and thus mediate the formation of aggregates of efficient settling characteristics by gravity (Quijano et al., 2017), and yielding excellent outcome of biomass harvest.
Table 6.
P-value of mean difference for D0 and D5 of selected parameters at 95% confidence interval.
Table 6.
P-value of mean difference for D0 and D5 of selected parameters at 95% confidence interval.
| Parameter | Condition | ||||||
|---|---|---|---|---|---|---|---|
| 1 | 2 | 3 | 4 | 5 | 6 | ||
| Total Alkalinity | 0.0177 | 0.0322 | 0.0191 | 0.0320 | 0.0119 | 0.0054 | |
| Productivity | 0.0033 | 0.1475* | 0.1711 | 0.0015 | 0.0260 | 0.0067 | |
| OD680 | 0.0041 | 0.0041 | 0.5139 | 0.0384 | 0.0001 | 0.0001 | |
| TDP | 0.0010 | 0.0217 | 0.2012 | 0.0166 | 0.0077 | 0.0002 | |
| T. coliform | 0.006 | 0.1240 | 0.0522 | 0.0041 | 0.0002 | 0.0003 | |
*Values in red font colour are not statistically significant. Productivity = Total biomass productivity OD680 = Optical Density at 680 nm, TDP = Total Dissolved Phosphorus, T. coliform = Total coliforms.
5. Conclusion
Evaluating the performance of microalgae and activated sludge (MAS) using different inoculum concentrations for treating anaerobically digested municipal wastewater, it can be stated that inoculum concentration influenced the performance of MAS in terms of total biomass growth and nutrients uptake.
It was shown that MAS inoculum concentration 0.10/0.20 g L-1 (total biomass productivity: 0.10 g TSS L-1 d-1, TDP: 85.1%, TDN:66.1%) significantly out-performed 0.20/0.40 and 0.40/0.80 g L-1, possibly due to photosynthetic interference by the proportions of activated sludge in the latter and optical limitation from excess initial inoculum concentration than the capability of the treatment reactors.
For the removal of total coliforms and E. coli, while outright log-Re was recorded for E. coli, influenced by high pH value in the PBRs, across the conditions, lowest log-Re was recorded in 0.20/0.40 and 0.40/0.80 g L-1 MAS inoculum concentration for total coliforms, suggesting that increased inoculum concentration of MAS may have a negative effect on treatment efficacy.
In general, to derive optimum benefit from the synergy of MAS inoculum for wastewater treatment and recovery of biomolecules, the deployment of appropriate inoculum proportion is germane. However, conducting this experiment in a pilot scale will alleviate concerns around the feasibility for deployment in a real-life scenario.
Author Contributions
Conceptualization, Methodology, A.O.J., G.R., G.H.R.S.; Laboratory analysis, data curation, statistical analysis, A.O.J., A.O.B., C.M.E.P. G.A.S.D.; manuscript draft preparation, A.J.; manuscript review and editing, A.O.B., C.M.E.P., G.H.R.S., G.R.; supervision, G.H.R.S, G.R.; funding acquisition and project administration, G.H.R.S. All authors have read and agreed to the published version of the manuscript.
Funding
This paper was possible thanks to the scholarship granted from the Brazilian Federal Agency for Support and Evaluation of Graduate Education (CAPES), in the scope of the Program CAPES-PrInt, process number 88887.310463/2018-00, and CAPES – Finance code 001; National Council for Scientific and Technological Development (CNPq) processes 309064/2018-0, 308663/2021-7 and 427936/2018-7, and the Sao Paulo Research Foundation (FAPESP) processes and 2018/18367-1 and 2022/07475-3 for supporting the development of this study; Tertiary Education Trust Fund (TETFund) and the Forum for Agricultural Research in Africa (FARA) to undertake master degree program in Sao Paulo State University (UNESP), Brazil.
Institutional Review Board Statement
Not applicable
Informed Consent Statement
Not applicable
Data Availability Statement
The data presented in this study are available on request from the corresponding author.
Acknowledgments
We appreciate the support received from Glauco Perpetuo, Thalita Lacerda, Eduardo Miguel during the laboratory analyses of this study. We also appreciate the UNESP IPMet for the gracious supply of weather data promptly.
Conflicts of Interest
The authors declare no conflict of interest.
Appendix A
Least significant post hoc test for pH and microalgae cell productivity estimates
| Dependent Variable: Total biomass productivity | ||||||
| LSD | Mean Difference (I-J) | Std. Error | Sig. | 95% Confidence Interval | ||
| Conditions | Lower Bound | Upper Bound | ||||
| con_1 | con_2 | -.09517* | .02806 | .001 | -.1508 | -.0395 |
| con_3 | -.13906* | .02806 | .000 | -.1947 | -.0834 | |
| con_4 | .05206 | .02806 | .066 | -.0036 | .1077 | |
| con_5 | .01828 | .02806 | .516 | -.0374 | .0739 | |
| con_6 | -.02783 | .02806 | .324 | -.0835 | .0278 | |
| con_2 | con_1 | .09517* | .02806 | .001 | .0395 | .1508 |
| con_3 | -.04389 | .02806 | .121 | -.0995 | .0118 | |
| con_4 | .14722* | .02806 | .000 | .0916 | .2029 | |
| con_5 | .11344* | .02806 | .000 | .0578 | .1691 | |
| con_6 | .06733* | .02806 | .018 | .0117 | .1230 | |
| con_3 | con_1 | .13906* | .02806 | .000 | .0834 | .1947 |
| con_2 | .04389 | .02806 | .121 | -.0118 | .0995 | |
| con_4 | .19111* | .02806 | .000 | .1355 | .2468 | |
| con_5 | .15733* | .02806 | .000 | .1017 | .2130 | |
| con_6 | .11122* | .02806 | .000 | .0556 | .1669 | |
| con_4 | con_1 | -.05206 | .02806 | .066 | -.1077 | .0036 |
| con_2 | -.14722* | .02806 | .000 | -.2029 | -.0916 | |
| con_3 | -.19111* | .02806 | .000 | -.2468 | -.1355 | |
| con_5 | -.03378 | .02806 | .231 | -.0894 | .0219 | |
| con_6 | -.07989* | .02806 | .005 | -.1355 | -.0242 | |
| con_5 | con_1 | -.01828 | .02806 | .516 | -.0739 | .0374 |
| con_2 | -.11344* | .02806 | .000 | -.1691 | -.0578 | |
| con_3 | -.15733* | .02806 | .000 | -.2130 | -.1017 | |
| con_4 | .03378 | .02806 | .231 | -.0219 | .0894 | |
| con_6 | -.04611 | .02806 | .103 | -.1018 | .0095 | |
| con_6 | con_1 | .02783 | .02806 | .324 | -.0278 | .0835 |
| con_2 | -.06733* | .02806 | .018 | -.1230 | -.0117 | |
| con_3 | -.11122* | .02806 | .000 | -.1669 | -.0556 | |
| con_4 | .07989* | .02806 | .005 | .0242 | .1355 | |
| con_5 | .04611 | .02806 | .103 | -.0095 | .1018 | |
| *. The mean difference is significant at the 0.05 level. | ||||||
| Dependent Variable: OD680 | ||||||
| LSD | Mean Difference (I-J) | Std. Error | Sig. | 95% Confidence Interval | ||
| Conditions | Lower Bound | Upper Bound | ||||
| con_1 | con_2 | .53267* | .10011 | .000 | .3145 | .7508 |
| con_3 | .67200* | .10011 | .000 | .4539 | .8901 | |
| con_4 | .09300 | .10011 | .371 | -.1251 | .3111 | |
| con_5 | -.12733 | .10011 | .227 | -.3455 | .0908 | |
| con_6 | -.21867* | .10011 | .050 | -.4368 | -.0005 | |
| con_2 | con_1 | -.53267* | .10011 | .000 | -.7508 | -.3145 |
| con_3 | .13933 | .10011 | .189 | -.0788 | .3575 | |
| con_4 | -.43967* | .10011 | .001 | -.6578 | -.2215 | |
| con_5 | -.66000* | .10011 | .000 | -.8781 | -.4419 | |
| con_6 | -.75133* | .10011 | .000 | -.9695 | -.5332 | |
| con_3 | con_1 | -.67200* | .10011 | .000 | -.8901 | -.4539 |
| con_2 | -.13933 | .10011 | .189 | -.3575 | .0788 | |
| con_4 | -.57900* | .10011 | .000 | -.7971 | -.3609 | |
| con_5 | -.79933* | .10011 | .000 | -1.0175 | -.5812 | |
| con_6 | -.89067* | .10011 | .000 | -1.1088 | -.6725 | |
| con_4 | con_1 | -.09300 | .10011 | .371 | -.3111 | .1251 |
| con_2 | .43967* | .10011 | .001 | .2215 | .6578 | |
| con_3 | .57900* | .10011 | .000 | .3609 | .7971 | |
| con_5 | -.22033* | .10011 | .048 | -.4385 | -.0022 | |
| con_6 | -.31167* | .10011 | .009 | -.5298 | -.0935 | |
| con_5 | con_1 | .12733 | .10011 | .227 | -.0908 | .3455 |
| con_2 | .66000* | .10011 | .000 | .4419 | .8781 | |
| con_3 | .79933* | .10011 | .000 | .5812 | 1.0175 | |
| con_4 | .22033* | .10011 | .048 | .0022 | .4385 | |
| con_6 | -.09133 | .10011 | .380 | -.3095 | .1268 | |
| con_6 | con_1 | .21867* | .10011 | .050 | .0005 | .4368 |
| con_2 | .75133* | .10011 | .000 | .5332 | .9695 | |
| con_3 | .89067* | .10011 | .000 | .6725 | 1.1088 | |
| con_4 | .31167* | .10011 | .009 | .0935 | .5298 | |
| con_5 | .09133 | .10011 | .380 | -.1268 | .3095 | |
| *. The mean difference is significant at the 0.05 level. | ||||||
| Dependent Variable: Total dissolve Phosphorus uptake (%) | ||||||
| LSD | Mean Difference (I-J) | Std. Error | Sig. | 95% Confidence Interval | ||
| Conditions | Lower Bound | Upper Bound | ||||
| con_1 | con_2 | 44.42500* | 7.76082 | .000 | 27.5156 | 61.3344 |
| con_3 | 128.58200* | 7.76082 | .000 | 111.6726 | 145.4914 | |
| con_4 | 1.13100 | 7.76082 | .887 | -15.7784 | 18.0404 | |
| con_5 | -.41200 | 7.76082 | .959 | -17.3214 | 16.4974 | |
| con_6 | -7.20667 | 7.76082 | .371 | -24.1160 | 9.7027 | |
| con_2 | con_1 | -44.42500* | 7.76082 | .000 | -61.3344 | -27.5156 |
| con_3 | 84.15700* | 7.76082 | .000 | 67.2476 | 101.0664 | |
| con_4 | -43.29400* | 7.76082 | .000 | -60.2034 | -26.3846 | |
| con_5 | -44.83700* | 7.76082 | .000 | -61.7464 | -27.9276 | |
| con_6 | -51.63167* | 7.76082 | .000 | -68.5410 | -34.7223 | |
| con_3 | con_1 | - 128.58200* |
7.76082 | .000 | - 145.4914 |
- 111.6726 |
| con_2 | -84.15700* | 7.76082 | .000 | - 101.0664 |
-67.2476 | |
| con_4 | - 127.45100* |
7.76082 | .000 | - 144.3604 |
- 110.5416 |
|
| con_5 | - 128.99400* |
7.76082 | .000 | - 145.9034 |
- 112.0846 |
|
| con_6 | - 135.78867* |
7.76082 | .000 | - 152.6980 |
- 118.8793 |
|
| con_4 | con_1 | -1.13100 | 7.76082 | .887 | -18.0404 | 15.7784 |
| con_2 | 43.29400* | 7.76082 | .000 | 26.3846 | 60.2034 | |
| con_3 | 127.45100* | 7.76082 | .000 | 110.5416 | 144.3604 | |
| con_5 | -1.54300 | 7.76082 | .846 | -18.4524 | 15.3664 | |
| con_6 | -8.33767 | 7.76082 | .304 | -25.2470 | 8.5717 | |
| con_5 | con_1 | .41200 | 7.76082 | .959 | -16.4974 | 17.3214 |
| con_2 | 44.83700* | 7.76082 | .000 | 27.9276 | 61.7464 | |
| con_3 | 128.99400* | 7.76082 | .000 | 112.0846 | 145.9034 | |
| con_4 | 1.54300 | 7.76082 | .846 | -15.3664 | 18.4524 | |
| con_6 | -6.79467 | 7.76082 | .398 | -23.7040 | 10.1147 | |
| con_6 | con_1 | 7.20667 | 7.76082 | .371 | -9.7027 | 24.1160 |
| con_2 | 51.63167* | 7.76082 | .000 | 34.7223 | 68.5410 | |
| con_3 | 135.78867* | 7.76082 | .000 | 118.8793 | 152.6980 | |
| con_4 | 8.33767 | 7.76082 | .304 | -8.5717 | 25.2470 | |
| con_5 | 6.79467 | 7.76082 | .398 | -10.1147 | 23.7040 | |
| *. The mean difference is significant at the 0.05 level. | ||||||
| Dependent Variable: Total dissolved Nitrogen uptake (%) | ||||||
| LSD | Mean Difference (I-J) | Std. Error | Sig. | 95% Confidence Interval | ||
| Conditions | Lower Bound | Upper Bound | ||||
| con_1 | con_2 | 49.71667* | 6.95668 | .000 | 34.5594 | 64.8740 |
| con_3 | 129.06000* | 6.95668 | .000 | 113.9027 | 144.2173 | |
| con_4 | 22.91333* | 6.95668 | .006 | 7.7560 | 38.0706 | |
| con_5 | 7.83333 | 6.95668 | .282 | -7.3240 | 22.9906 | |
| con_6 | 5.57000 | 6.95668 | .439 | -9.5873 | 20.7273 | |
| con_2 | con_1 | -49.71667* | 6.95668 | .000 | -64.8740 | -34.5594 |
| con_3 | 79.34333* | 6.95668 | .000 | 64.1860 | 94.5006 | |
| con_4 | -26.80333* | 6.95668 | .002 | -41.9606 | -11.6460 | |
| con_5 | -41.88333* | 6.95668 | .000 | -57.0406 | -26.7260 | |
| con_6 | -44.14667* | 6.95668 | .000 | -59.3040 | -28.9894 | |
| con_3 | con_1 | - 129.06000* |
6.95668 | .000 | - 144.2173 |
- 113.9027 |
| con_2 | -79.34333* | 6.95668 | .000 | -94.5006 | -64.1860 | |
| con_4 | -106.14667* | 6.95668 | .000 | - 121.3040 |
-90.9894 | |
| con_5 | - 121.22667* |
6.95668 | .000 | - 136.3840 |
- 106.0694 |
|
| con_6 | - 123.49000* |
6.95668 | .000 | - 138.6473 |
- 108.3327 |
|
| con_4 | con_1 | -22.91333* | 6.95668 | .006 | -38.0706 | -7.7560 |
| con_2 | 26.80333* | 6.95668 | .002 | 11.6460 | 41.9606 | |
| con_3 | 106.14667* | 6.95668 | .000 | 90.9894 | 121.3040 | |
| con_5 | -15.08000 | 6.95668 | .051 | -30.2373 | .0773 | |
| con_6 | -17.34333* | 6.95668 | .028 | -32.5006 | -2.1860 | |
| con_5 | con_1 | -7.83333 | 6.95668 | .282 | -22.9906 | 7.3240 |
| con_2 | 41.88333* | 6.95668 | .000 | 26.7260 | 57.0406 | |
| con_3 | 121.22667* | 6.95668 | .000 | 106.0694 | 136.3840 | |
| con_4 | 15.08000 | 6.95668 | .051 | -.0773 | 30.2373 | |
| con_6 | -2.26333 | 6.95668 | .751 | -17.4206 | 12.8940 | |
| con_6 | con_1 | -5.57000 | 6.95668 | .439 | -20.7273 | 9.5873 |
| con_2 | 44.14667* | 6.95668 | .000 | 28.9894 | 59.3040 | |
| con_3 | 123.49000* | 6.95668 | .000 | 108.3327 | 138.6473 | |
| con_4 | 17.34333* | 6.95668 | .028 | 2.1860 | 32.5006 | |
| con_5 | 2.26333 | 6.95668 | .751 | -12.8940 | 17.4206 | |
| *. The mean difference is significant at the 0.05 level. | ||||||
References
- Oviedo, J.A.; Muñoz, R.; Donoso-Bravo, A.; Bernard, O.; Casagli, F.; Jeison, D. A half-century of research on microalgae-bacteria for wastewater treatment. Algal Res. 2022, 67. [Google Scholar] [CrossRef]
- Routley, N., 2022 Visualized: The World’s Population at 8 Billion. Available online: https://www.visualcapitalist.com/visualized-the-worlds-population-at-8-billion/ (accessed on 30 September 2022).
- Aradhana, K. M. and Kumar, M. 2015 Microalgal Green and Clean Approach to Mitigate Water Pollution. In Barwant, M. M. and Manam, V, K. (Ed.), Environment Conservation Challenges, Threats I Conservation of Biodiversity, Vol 1, 96 – 104. Tamilnadu-India: Scieng Publications.
- Zhu, S., Huo, S. and Feng, P. 2019 Developing Designer Microalgal Consortia: A Suitable Approach to Sustainable Wastewater Treatment. In Alam, M. A. and Wang, Z (Ed.), Microalgae Biotechnology for Development of Biofuel and Wastewater Treatment, pp. 569 - 598. [CrossRef] [PubMed]
- Pompei, C.M.E.; Campos, L.C.; Vieira, E.M.; Tucci, A. The impact of micropollutants on native algae and cyanobacteria communities in ecological filters during drinking water treatment. Sci. Total. Environ. 2022, 822, 153401. [Google Scholar] [CrossRef]
- Bankole, A.O.; James, A.O.; Odjegba, E.E.; Bankole, F.R.; Emmanuel, B.; Fiore, F.A.; Pu, J.H.; Moruzzi, R.B. Factors affecting sanitation coverage in three income levels and potential toward achieving SDG 6.2. Water Policy 2023, 25, 146–176. [Google Scholar] [CrossRef]
- Yan, H.; Lu, R.; Liu, Y.; Cui, X.; Wang, Y.; Yu, Z.; Ruan, R.; Zhang, Q. Development of microalgae-bacteria symbiosis system for enhanced treatment of biogas slurry. Bioresour. Technol. 2022, 354, 127187. [Google Scholar] [CrossRef]
- Zhang, C.; Li, S.; Ho, S.-H. Converting nitrogen and phosphorus wastewater into bioenergy using microalgae-bacteria consortia: A critical review. Bioresour. Technol. 2021, 342, 126056. [Google Scholar] [CrossRef] [PubMed]
- Wang, Y.; Li, J.; Lei, Y.; Li, X.; Nagarajan, D.; Lee, D.-J.; Chang, J.-S. Bioremediation of sulfonamides by a microalgae-bacteria consortium – Analysis of pollutants removal efficiency, cellular composition, and bacterial community. Bioresour. Technol. 2022, 351, 126964. [Google Scholar] [CrossRef]
- Farias, S.L.; Ruas, G.; Serejo, M.L.; Boncz, M. . Evaluation of the effect of the feeding regime on the removal of metals and pathogens in microalgae–bacterial systems. Water Sci. Technol. 2023, 88, 11–22. [Google Scholar] [CrossRef] [PubMed]
- Serejo, M.L.; Farias, S.L.; Ruas, G.; Paulo, P.L.; Boncz, M.A. Surfactant removal and biomass production in a microalgal-bacterial process: effect of feeding regime. Water Sci. Technol. 2020, 82, 1176–1183. [Google Scholar] [CrossRef]
- Qiao, S.; Hou, C.; Wang, X.; Zhou, J. Minimizing greenhouse gas emission from wastewater treatment process by integrating activated sludge and microalgae processes. Sci. Total. Environ. 2020, 732, 139032. [Google Scholar] [CrossRef]
- Nguyen, T.-T.; Nguyen, T.-T.; Binh, Q.A.; Bui, X.-T.; Ngo, H.H.; Vo, H.N.P.; Lin, K.-Y.A.; Vo, T.-D.; Guo, W.; Lin, C.; et al. Co-culture of microalgae-activated sludge for wastewater treatment and biomass production: Exploring their role under different inoculation ratios. Bioresour. Technol. 2020, 314, 123754. [Google Scholar] [CrossRef] [PubMed]
- Lima, S.; Brucato, A.; Caputo, G.; Grisafi, F.; Scargiali, F. Inoculum of indigenous microalgae/activated sludge for optimal treatment of municipal wastewaters and biochemical composition of residual biomass for potential applications. J. Water Process. Eng. 2022, 49. [Google Scholar] [CrossRef]
- Huang, K.-X.; Vadiveloo, A.; Zhou, J.-L.; Yang, L.; Chen, D.-Z.; Gao, F. Integrated culture and harvest systems for improved microalgal biomass production and wastewater treatment. Bioresour. Technol. 2023, 376, 128941. [Google Scholar] [CrossRef]
- Su, Y.; Mennerich, A.; Urban, B. Synergistic cooperation between wastewater-born algae and activated sludge for wastewater treatment: Influence of algae and sludge inoculation ratios. Bioresour. Technol. 2012, 105, 67–73. [Google Scholar] [CrossRef] [PubMed]
- Li, X.; Liu, J.; Tian, J.; Pan, Z.; Chen, Y.; Ming, F.; Wang, R.; Wang, L.; Zhou, H.; Li, J.; et al. Co-cultivation of microalgae-activated sludge for municipal wastewater treatment: Exploring the performance, microbial co-occurrence patterns, microbiota dynamics and function during the startup stage. Bioresour. Technol. 2023, 374, 128733. [Google Scholar] [CrossRef] [PubMed]
- Zhang, X.; Lei, Z.; Liu, Y. Microalgal-bacterial granular sludge for municipal wastewater treatment: From concept to practice. Bioresour. Technol. 2022, 354, 127201. [Google Scholar] [CrossRef]
- Soroosh, H.; Otterpohl, R.; Hanelt, D. Influence of hydraulic retention time on municipal wastewater treatment using microalgae-bacteria flocs in sequencing batch reactors. Bioresour. Technol. Rep. 2021, 17, 100884. [Google Scholar] [CrossRef]
- Ji, B.; Wang, S.; Silva, M.R.U.; Zhang, M.; Liu, Y. Microalgal-bacterial granular sludge for municipal wastewater treatment under simulated natural diel cycles: Performances-metabolic pathways-microbial community nexus. Algal Res. 2021, 54, 102198. [Google Scholar] [CrossRef]
- Xu, K.; Zou, X.; Xue, Y.; Qu, Y.; Li, Y. The impact of seasonal variations about temperature and photoperiod on the treatment of municipal wastewater by algae-bacteria system in lab-scale. Algal Res. 2021, 54, 102175. [Google Scholar] [CrossRef]
- Liyun, C. Influence of inoculation ratio on the performance and microbial community of bacterial-algal symbiotic system for rural wastewater treatment. Water Environ. Res. 2023, 95, e10838. [Google Scholar] [CrossRef]
- Marazzi, F.; Bellucci, M.; Rossi, S.; Fornaroli, R.; Ficara, E.; Mezzanotte, V. Outdoor pilot trial integrating a sidestream microalgae process for the treatment of centrate under non optimal climate conditions. Algal Res. 2019, 39, 101430. [Google Scholar] [CrossRef]
- Vassalle, L.; García-Galán, M.J.; Aquino, S.F.; Afonso, R.J.d.C.F.; Ferrer, I.; Passos, F.; Mota, C.R. Can high rate algal ponds be used as post-treatment of UASB reactors to remove micropollutants? Chemosphere 2020, 248, 125969. [Google Scholar] [CrossRef] [PubMed]
- Prado, L.d.O.; Bolzani, H.R.; Souza, H.H.d.S.; Ruas, G.; da Silva, G.H.R. Microalgal cultivation in open and closed systems under a tropical climate: A life cycle comparison. J. Clean. Prod. 2023, 422. [Google Scholar] [CrossRef]
- Von Sperling, M. Von Sperling, M. 2007 Wastewater characteristics, treatment and disposal (first ed.). IWA publishing, London. [CrossRef]
- Huang, Q.; Jiang, F.; Wang, L.; Yang, C. Design of Photobioreactors for Mass Cultivation of Photosynthetic Organisms. Engineering 2017, 3, 318–329. [Google Scholar] [CrossRef]
- Chernicharo, C. A. 2007 Biological Wastewater Treatment Series, Anaerobic Reactors, Volume 4. IWA Publishing. Available online: http://iwaponline.com/ebooks/book-pdf/1100/wio9781780402116.pdf.
- Guiry, M. D. and Guiry, G. M. 2023 AlgaeBase. World-wide electronic publication, National University of Ireland, Galway. Available online: https://www.algaebase.org.
- Bicudo, C. and Meneses, M. 2006. Algae genera from brazilian inland waters: key to identification and description. (2nd Ed.). São Carlos, Brazil: Editora Rima.
- Mathew, M.M.; Khatana, K.; Vats, V.; Dhanker, R.; Kumar, R.; Dahms, H.-U.; Hwang, J.-S. Biological Approaches Integrating Algae and Bacteria for the Degradation of Wastewater Contaminants-A Review. Front. Microbiol. 2022, 12, 801051. [Google Scholar] [CrossRef]
- Alcántara, C.; Domínguez, J.M.; García, D.; Blanco, S.; Pérez, R.; García-Encina, P.A.; Muñoz, R. Evaluation of wastewater treatment in a novel anoxic–aerobic algal–bacterial photobioreactor with biomass recycling through carbon and nitrogen mass balances. Bioresour. Technol. 2015, 191, 173–186. [Google Scholar] [CrossRef] [PubMed]
- Reis, M. and RIbeiro, A. 2020 Conversion factors and general equations applied in agricultural and forest meteorology. [s. l.], 27, 227–258.
- APHA (American Public Health Association), AWWA (American Water Works Association) and WEF (Water Environment Federation) 2017 Standard Methods for the Examination of Water and Wastewater, 22nd edition, edited by E. W. Rice, R. B. Baird, A. D. Eaton and L. S. Clesceri. Washington DC, USA. ISBN 08-7553-047-8.
- Sperling, M 2005 Introduction to water quality and sewage treatment, 3rd edn, volume 1, Belo Horizonte, Brazil, pp. 407 – 408. ISBN: 85-7041-114-6.
- Masojídek, J.; Gómez-Serrano, C.; Ranglová, K.; Cicchi, B.; Bogeat, .E.; Manoel, J.A.C.; Zurano, A.S.; Benavides, A.M.S.; Barceló-Villalobos, M.; Carnero, V.A.R.; et al. Photosynthesis Monitoring in Microalgae Cultures Grown on Municipal Wastewater as a Nutrient Source in Large-Scale Outdoor Bioreactors. Biology 2022, 11, 1380. [CrossRef] [PubMed]
- Dolganyuk, V.; Belova, D.; Babich, O.; Prosekov, A.; Ivanova, S.; Katserov, D.; Patyukov, N.; Sukhikh, S. Microalgae: A Promising Source of Valuable Bioproducts. Biomolecules 2020, 10, 1153. [Google Scholar] [CrossRef]
- Carneiro, M.; Cicchi, B.; Maia, I.B.; Pereira, H.; Zittelli, G.C.; Varela, J.; Malcata, F.X.; Torzillo, G. Effect of temperature on growth, photosynthesis and biochemical composition of Nannochloropsis oceanica, grown outdoors in tubular photobioreactors. Algal Res. 2020, 49, 101923. [Google Scholar] [CrossRef]
- Kliphuis, A.M.J.; de Winter, L.; Vejrazka, C.; Martens, D.E.; Janssen, M.; Wijffels, R.H. Photosynthetic efficiency of Chlorella sorokiniana in a turbulently mixed short light-path photobioreactor. Biotechnol. Prog. 2010, 26, 687–696. [Google Scholar] [CrossRef] [PubMed]
- Coronado-Reyes, J.A.; Salazar-Torres, J.A.; Juárez-Campos, B.; González-Hernández, J.C. Chlorella vulgaris, a microalgae important to be used in Biotechnology: a review. Food Sci. Technol. 2022, 42. [Google Scholar] [CrossRef]
- Chowdury, K.H.; Nahar, N.; Deb, U.K. The Growth Factors Involved in Microalgae Cultivation for Biofuel Production: A Review. Comput. Water, Energy, Environ. Eng. 2020, 09, 185–215. [Google Scholar] [CrossRef]
- Yu, H.; Kim, J.; Rhee, C.; Shin, J.; Shin, S.G.; Lee, C. Effects of Different pH Control Strategies on Microalgae Cultivation and Nutrient Removal from Anaerobic Digestion Effluent. Microorganisms 2022, 10, 357. [Google Scholar] [CrossRef] [PubMed]
- Nagabalaji, V.; Maharaja, P.; Nishanthi, R.; Sathish, G.; Suthanthararajan, R.; Srinivasan, S.V. Effect of co-culturing bacteria and microalgae and influence of inoculum ratio during the biological treatment of tannery wastewater. J. Environ. Manag. 2023, 341, 118008. [Google Scholar] [CrossRef] [PubMed]
- Metcalf, E., Eddy, H. and Tchobanoglous, G. 2003 Wastewater Engineering: Treatment and Reuse. 4th ed. McGraw-Hill Higher Education, Columbus, USA.
- Kumar, A.; Bera, S. Revisiting nitrogen utilization in algae: A review on the process of regulation and assimilation. Bioresour. Technol. Rep. 2020, 12, 100584. [Google Scholar] [CrossRef]
- Li, D.; Wang, L.; Zhao, Q.; Wei, W.; Sun, Y. Improving high carbon dioxide tolerance and carbon dioxide fixation capability of Chlorella sp. by adaptive laboratory evolution. Bioresour. Technol. 2015, 185, 269–275. [Google Scholar] [CrossRef] [PubMed]
- Ronda, S.R.; Bokka, C.S.; Ketineni, C.; Rijal, B.; Allu, P.R. Aeration effect on Spirulina platensis growth and γ-Linolenic acid production. Braz. J. Microbiol. 2012, 43, 12–20. [Google Scholar] [CrossRef] [PubMed]
- Paquette, A.J.; Vadlamani, A.; Demirkaya, C.; Strous, M.; Siegler, H.D.l.H. Nutrient management and medium reuse for cultivation of a cyanobacterial consortium at high pH and alkalinity. Front. Bioeng. Biotechnol. 2022, 10, 942771. [Google Scholar] [CrossRef]
- Rodero, M.d.R.; Posadas, E.; Toledo-Cervantes, A.; Lebrero, R.; Muñoz, R. Influence of alkalinity and temperature on photosynthetic biogas upgrading efficiency in high rate algal ponds. Algal Res. 2018, 33, 284–290. [Google Scholar] [CrossRef]
- Slompo, N.D.M.; Quartaroli, L.; Fernandes, T.V.; da Silva, G.H.R.; Daniel, L.A. Nutrient and pathogen removal from anaerobically treated black water by microalgae. J. Environ. Manag. 2020, 268, 110693. [Google Scholar] [CrossRef] [PubMed]
- Tricolici, O.; Bumbac, C.; Patroescu, V.; Postolache, C. Dairy wastewater treatment using an activated sludge–microalgae system at different light intensities. Water Sci. Technol. 2013, 69, 1598–1605. [Google Scholar] [CrossRef] [PubMed]
- Khan, M.I.; Shin, J.H.; Kim, J.D.; Khan, M.I.; Shin, J.H.; Kim, J.D. The promising future of microalgae: current status, challenges, and optimization of a sustainable and renewable industry for biofuels, feed, and other products. Microb. Cell Fact. 2018, 17, 36. [Google Scholar] [CrossRef] [PubMed]
- Lage, S.; Toffolo, A.; Gentili, F.G. Microalgal growth, nitrogen uptake and storage, and dissolved oxygen production in a polyculture based-open pond fed with municipal wastewater in northern Sweden. Chemosphere 2021, 276, 130122. [Google Scholar] [CrossRef]
- Metsoviti, M.N.; Papapolymerou, G.; Karapanagiotidis, I.T.; Katsoulas, N. Effect of Light Intensity and Quality on Growth Rate and Composition of Chlorella vulgaris. Plants 2019, 9, 31. [Google Scholar] [CrossRef] [PubMed]
- Nzayisenga, J.C.; Farge, X.; Groll, S.L.; Sellstedt, A. Effects of light intensity on growth and lipid production in microalgae grown in wastewater. Biotechnol. Biofuels 2020, 13, 1–8. [Google Scholar] [CrossRef] [PubMed]
- Fuentes, J.-L.; Montero, Z.; Cuaresma, M.; Ruiz-Domínguez, M.-C.; Mogedas, B.; Nores, I.G.; del Valle, M.G.; Vílchez, C. Outdoor Large-Scale Cultivation of the Acidophilic Microalga Coccomyxa onubensis in a Vertical Close Photobioreactor for Lutein Production. Processes 2020, 8, 324. [Google Scholar] [CrossRef]
- Mazzelli, A.; Cicci, A.; Di Caprio, F.; Altimari, P.; Toro, L.; Iaquaniello, G.; Pagnanelli, F. Multivariate modeling for microalgae growth in outdoor photobioreactors. Algal Res. 2020, 45, 101663. [Google Scholar] [CrossRef]
- Casagli, F.; Rossi, S.; Steyer, J.P.; Bernard, O.; Ficara, E. Balancing Microalgae and Nitrifiers for Wastewater Treatment: Can Inorganic Carbon Limitation Cause an Environmental Threat? Environ. Sci. Technol. 2021, 55, 3940–3955. [Google Scholar] [CrossRef]
- Amaro, H.M.; Salgado, E.M.; Nunes, O.C.; Pires, J.C.; Esteves, A.F. Microalgae systems - environmental agents for wastewater treatment and further potential biomass valorisation. J. Environ. Manag. 2023, 337, 117678. [Google Scholar] [CrossRef]
- Tan, X.; Zhang, D.; Parajuli, K.; Upadhyay, S.; Jiang, Y.; Duan, Z. Comparison of Four Quantitative Techniques for Monitoring Microalgae Disruption by Low-Frequency Ultrasound and Acoustic Energy Efficiency. Environ. Sci. Technol. 2018, 52, 3295–3303. [Google Scholar] [CrossRef] [PubMed]
- Pacheco, M.M.; Hoeltz, M.; Bjerk, T.R.; Souza, M.P.; da Silva, L.F.; Gressler, P.D.; Moraes, M.S.; A Lobo, E.; Schneider, R.C. Evaluation of microalgae growth in a mixed-type photobioreactor system for the phycoremediation of wastewater. J. Chem. Technol. Biotechnol. 2019, 94, 3102–3110. [Google Scholar] [CrossRef]
- Vella, F.M.; Sardo, A.; Gallo, C.; Landi, S.; Fontana, A.; D'Ippolito, G. Annual outdoor cultivation of the diatom Thalassiosira weissflogii: productivity, limits and perspectives. Algal Res. 2019, 42, 101553. [Google Scholar] [CrossRef]
- Bohutskyi, P.; Kligerman, D.C.; Byers, N.; Nasr, L.K.; Cua, C.; Chow, S.; Su, C.; Tang, Y.; Betenbaugh, M.J.; Bouwer, E.J. Effects of inoculum size, light intensity, and dose of anaerobic digestion centrate on growth and productivity of Chlorella and Scenedesmus microalgae and their poly-culture in primary and secondary wastewater. Algal Res. 2016, 19, 278–290. [Google Scholar] [CrossRef]
- Cheng, P.; Wang, Y.; Osei-Wusu, D.; Liu, T.; Liu, D. Effects of seed age, inoculum density, and culture conditions on growth and hydrocarbon accumulation of Botryococcus braunii SAG807-1 with attached culture. Bioresour. Bioprocess. 2018, 5, 15. [Google Scholar] [CrossRef]
- Dębowski, M.; Rusanowska, P.; Zieliński, M.; Dudek, M.; Romanowska-Duda, Z. Biomass Production and Nutrient Removal by Chlorella vulgaris from Anaerobic Digestion Effluents. Energies 2018, 11, 1654. [Google Scholar] [CrossRef]
- Yu, H.; Kim, J.; Lee, C. Nutrient removal and microalgal biomass production from different anaerobic digestion effluents with Chlorella species. Sci. Rep. 2019, 9, 1–13. [Google Scholar] [CrossRef]
- Murray, K.E.; Healy, F.G.; McCord, R.S.; Shields, J.A. Biomass production and nutrient uptake by Neochloris oleoabundans in an open trough system. Appl. Microbiol. Biotechnol. 2010, 90, 89–95. [Google Scholar] [CrossRef] [PubMed]
- Yadav, G.; Dash, S.K.; Sen, R. A biorefinery for valorization of industrial waste-water and flue gas by microalgae for waste mitigation, carbon-dioxide sequestration and algal biomass production. Sci. Total. Environ. 2019, 688, 129–135. [Google Scholar] [CrossRef]
- Çakirsoy, I.; Miyamoto, T.; Ohtake, N. Physiology of microalgae and their application to sustainable agriculture: A mini-review. Front. Plant Sci. 2022, 13, 1005991. [Google Scholar] [CrossRef]
- Dineshkumar, R.; Subramanian, J.; Gopalsamy, J.; Jayasingam, P.; Arumugam, A.; Kannadasan, S.; Sampathkumar, P. The Impact of Using Microalgae as Biofertilizer in Maize (Zea mays L.). Waste Biomass- Valorization 2017, 10, 1101–1110. [Google Scholar] [CrossRef]
- Dineshkumar, R.; Kumaravel, R.; Gopalsamy, J.; Sikder, M.N.A.; Sampathkumar, P. Microalgae as Bio-fertilizers for Rice Growth and Seed Yield Productivity. Waste Biomass- Valorization 2018, 9, 793–800. [Google Scholar] [CrossRef]
- Suleiman, A.K.A.; Lourenço, K.S.; Clark, C.; Luz, R.L.; da Silva, G.H.R.; Vet, L.E.; Cantarella, H.; Fernandes, T.V.; Kuramae, E.E. From toilet to agriculture: Fertilization with microalgal biomass from wastewater impacts the soil and rhizosphere active microbiomes, greenhouse gas emissions and plant growth. Resour. Conserv. Recycl. 2020, 161. [Google Scholar] [CrossRef]
- Rani, S.; Chowdhury, R.; Tao, W.; Nedbalová, L. Microalga-Mediated Tertiary Treatment of Municipal Wastewater: Removal of Nutrients and Pathogens. Sustainability 2021, 13, 9554. [Google Scholar] [CrossRef]
- Delanka-Pedige, H.M.; Munasinghe-Arachchige, S.P.; Cornelius, J.; Henkanatte-Gedera, S.M.; Tchinda, D.; Zhang, Y.; Nirmalakhandan, N. Pathogen reduction in an algal-based wastewater treatment system employing Galdieria sulphuraria. Algal Res. 2019, 39, 101423. [Google Scholar] [CrossRef]
- Ansa, E.D.O.; Lubberding, H.J.; Gijzen, H.J. The effect of algal biomass on the removal of faecal coliform from domestic wastewater. Appl. Water Sci. 2012, 2, 87–94. [Google Scholar] [CrossRef]
- Liu, L.; Hall, G.; Champagne, P. The role of algae in the removal and inactivation of pathogenic indicator organisms in wastewater stabilization pond systems. Algal Res. 2020, 46, 101777. [Google Scholar] [CrossRef]
- Fallowfield, H.J.; Cromar, N.J.; Evison, L.M. Coliform die-off rate constants in a high rate algal pond and the effect of operational and environmental variables. Water Sci. Technol. 1996, 34, 141–147. [Google Scholar] [CrossRef]
- World Health Organization (WHO). 2006 WHO Guidelines for the Safe Use of Wastewater Excreta and Greywater, vol. 1. World Health Organization.
- World Bank 2020 Wastewater? From waste to resource. Available online: https://www.worldbank.org/en/topic/water/publication/wastewater-initiative.
- Chrispim, M.C.; Souza, F.d.M.d.; Scholz, M.; Nolasco, M.A. A Framework for Sustainable Planning and Decision-Making on Resource Recovery from Wastewater: Showcase for São Paulo Megacity. Water 2020, 12, 3466. [Google Scholar] [CrossRef]
- Quijano, G.; Arcila, J.S.; Buitrón, G. Microalgal-bacterial aggregates: Applications and perspectives for wastewater treatment. Biotechnol. Adv. 2017, 35, 772–781. [Google Scholar] [CrossRef]
Figure 1.
(a) Schematic diagram of Duran® bottle photobioreactor set-up (b) Composition of inoculum ratio for each condition evaluated.
Figure 1.
(a) Schematic diagram of Duran® bottle photobioreactor set-up (b) Composition of inoculum ratio for each condition evaluated.
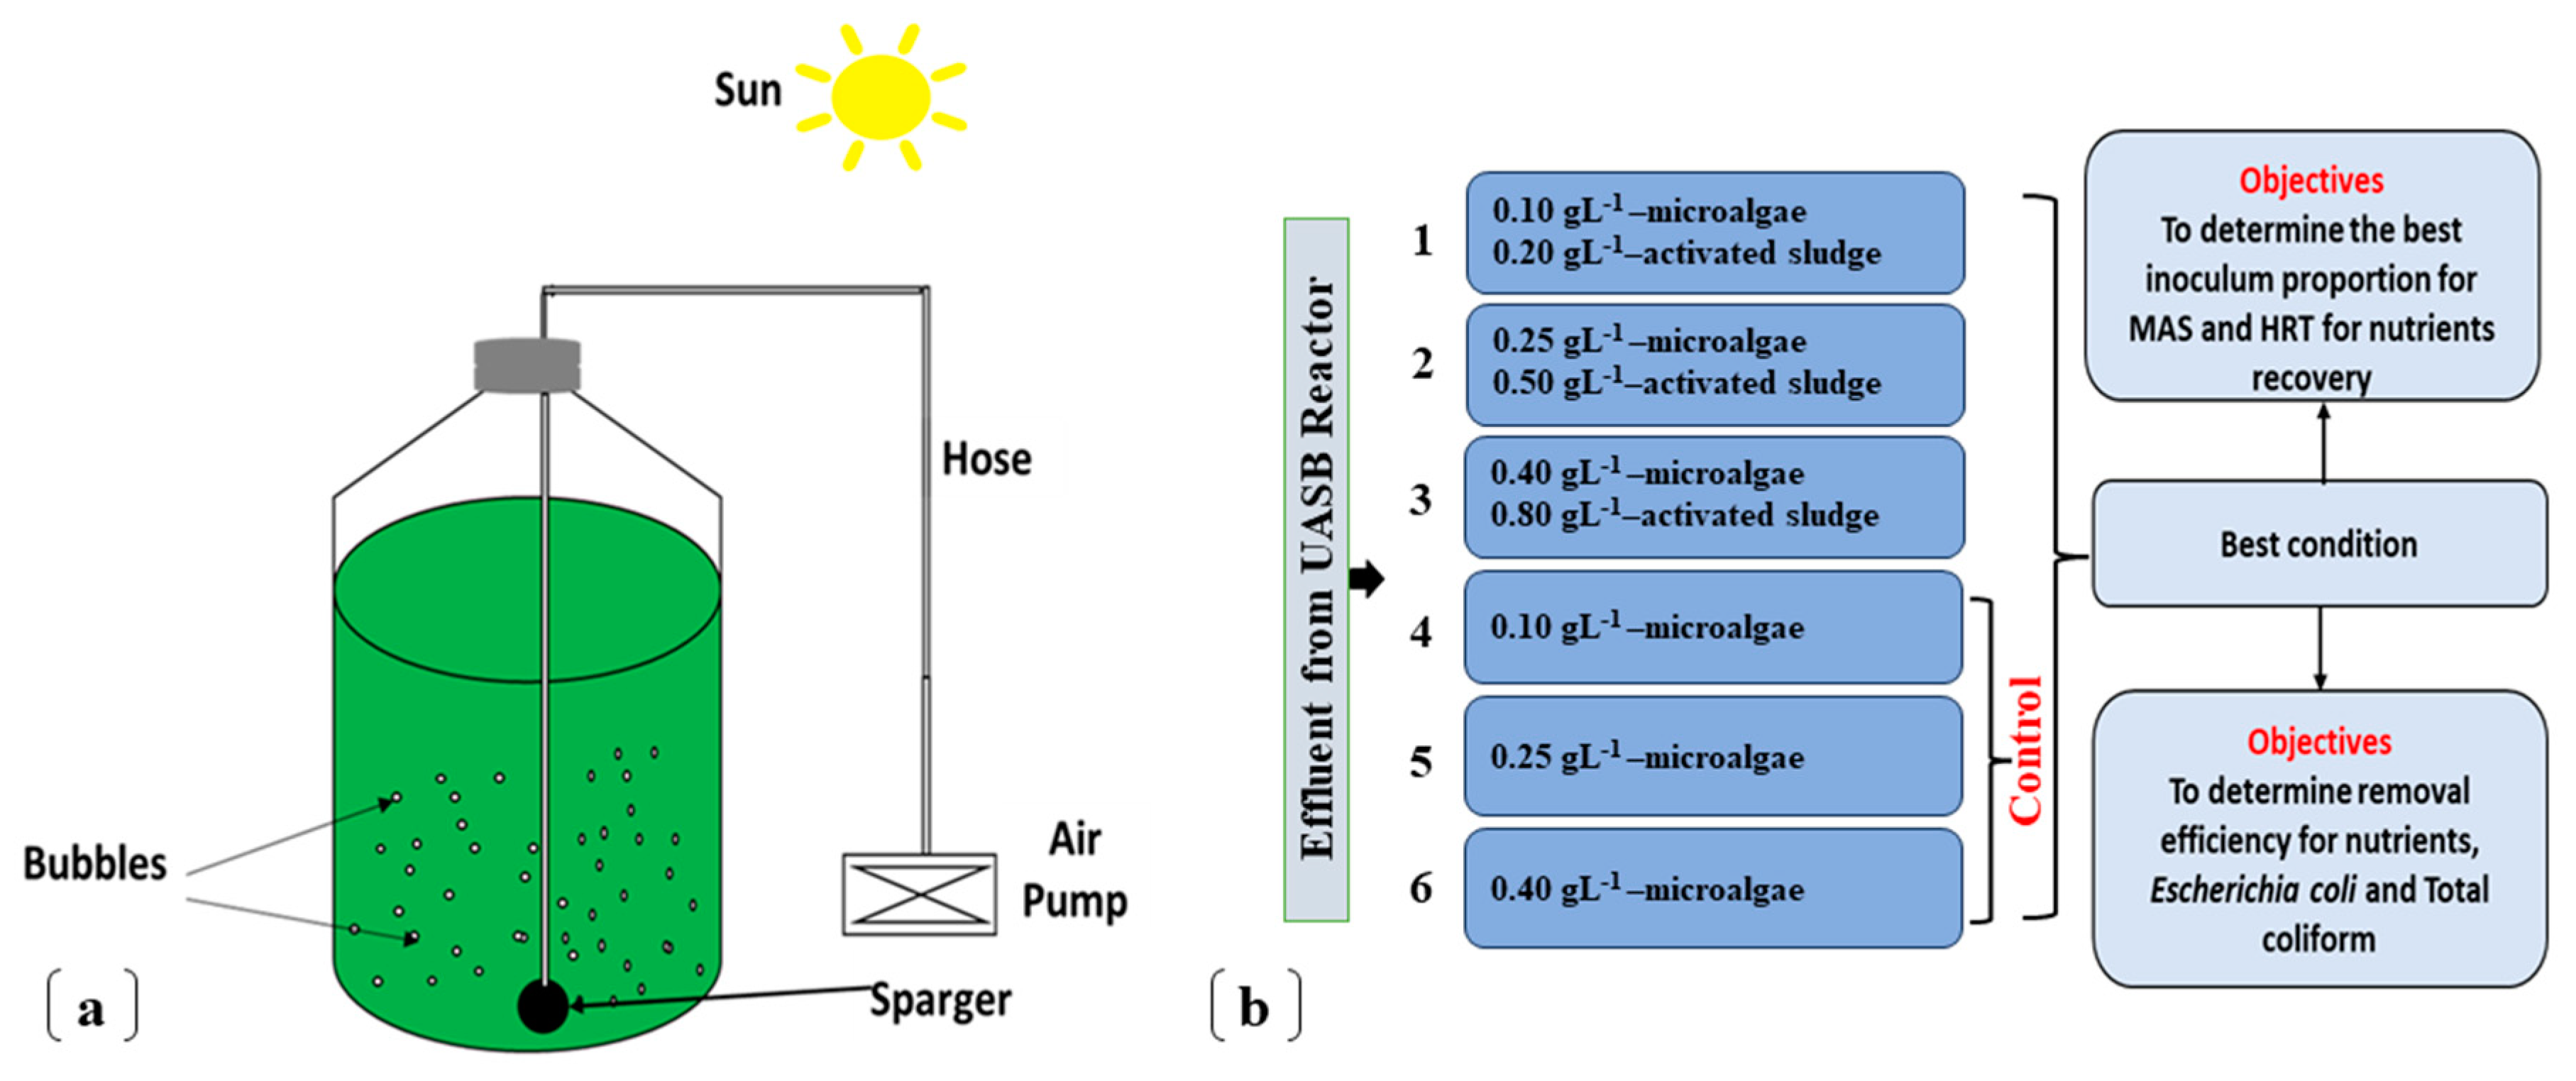
Figure 2.
Average cell count expressed in cell mL-1 for the conditions.
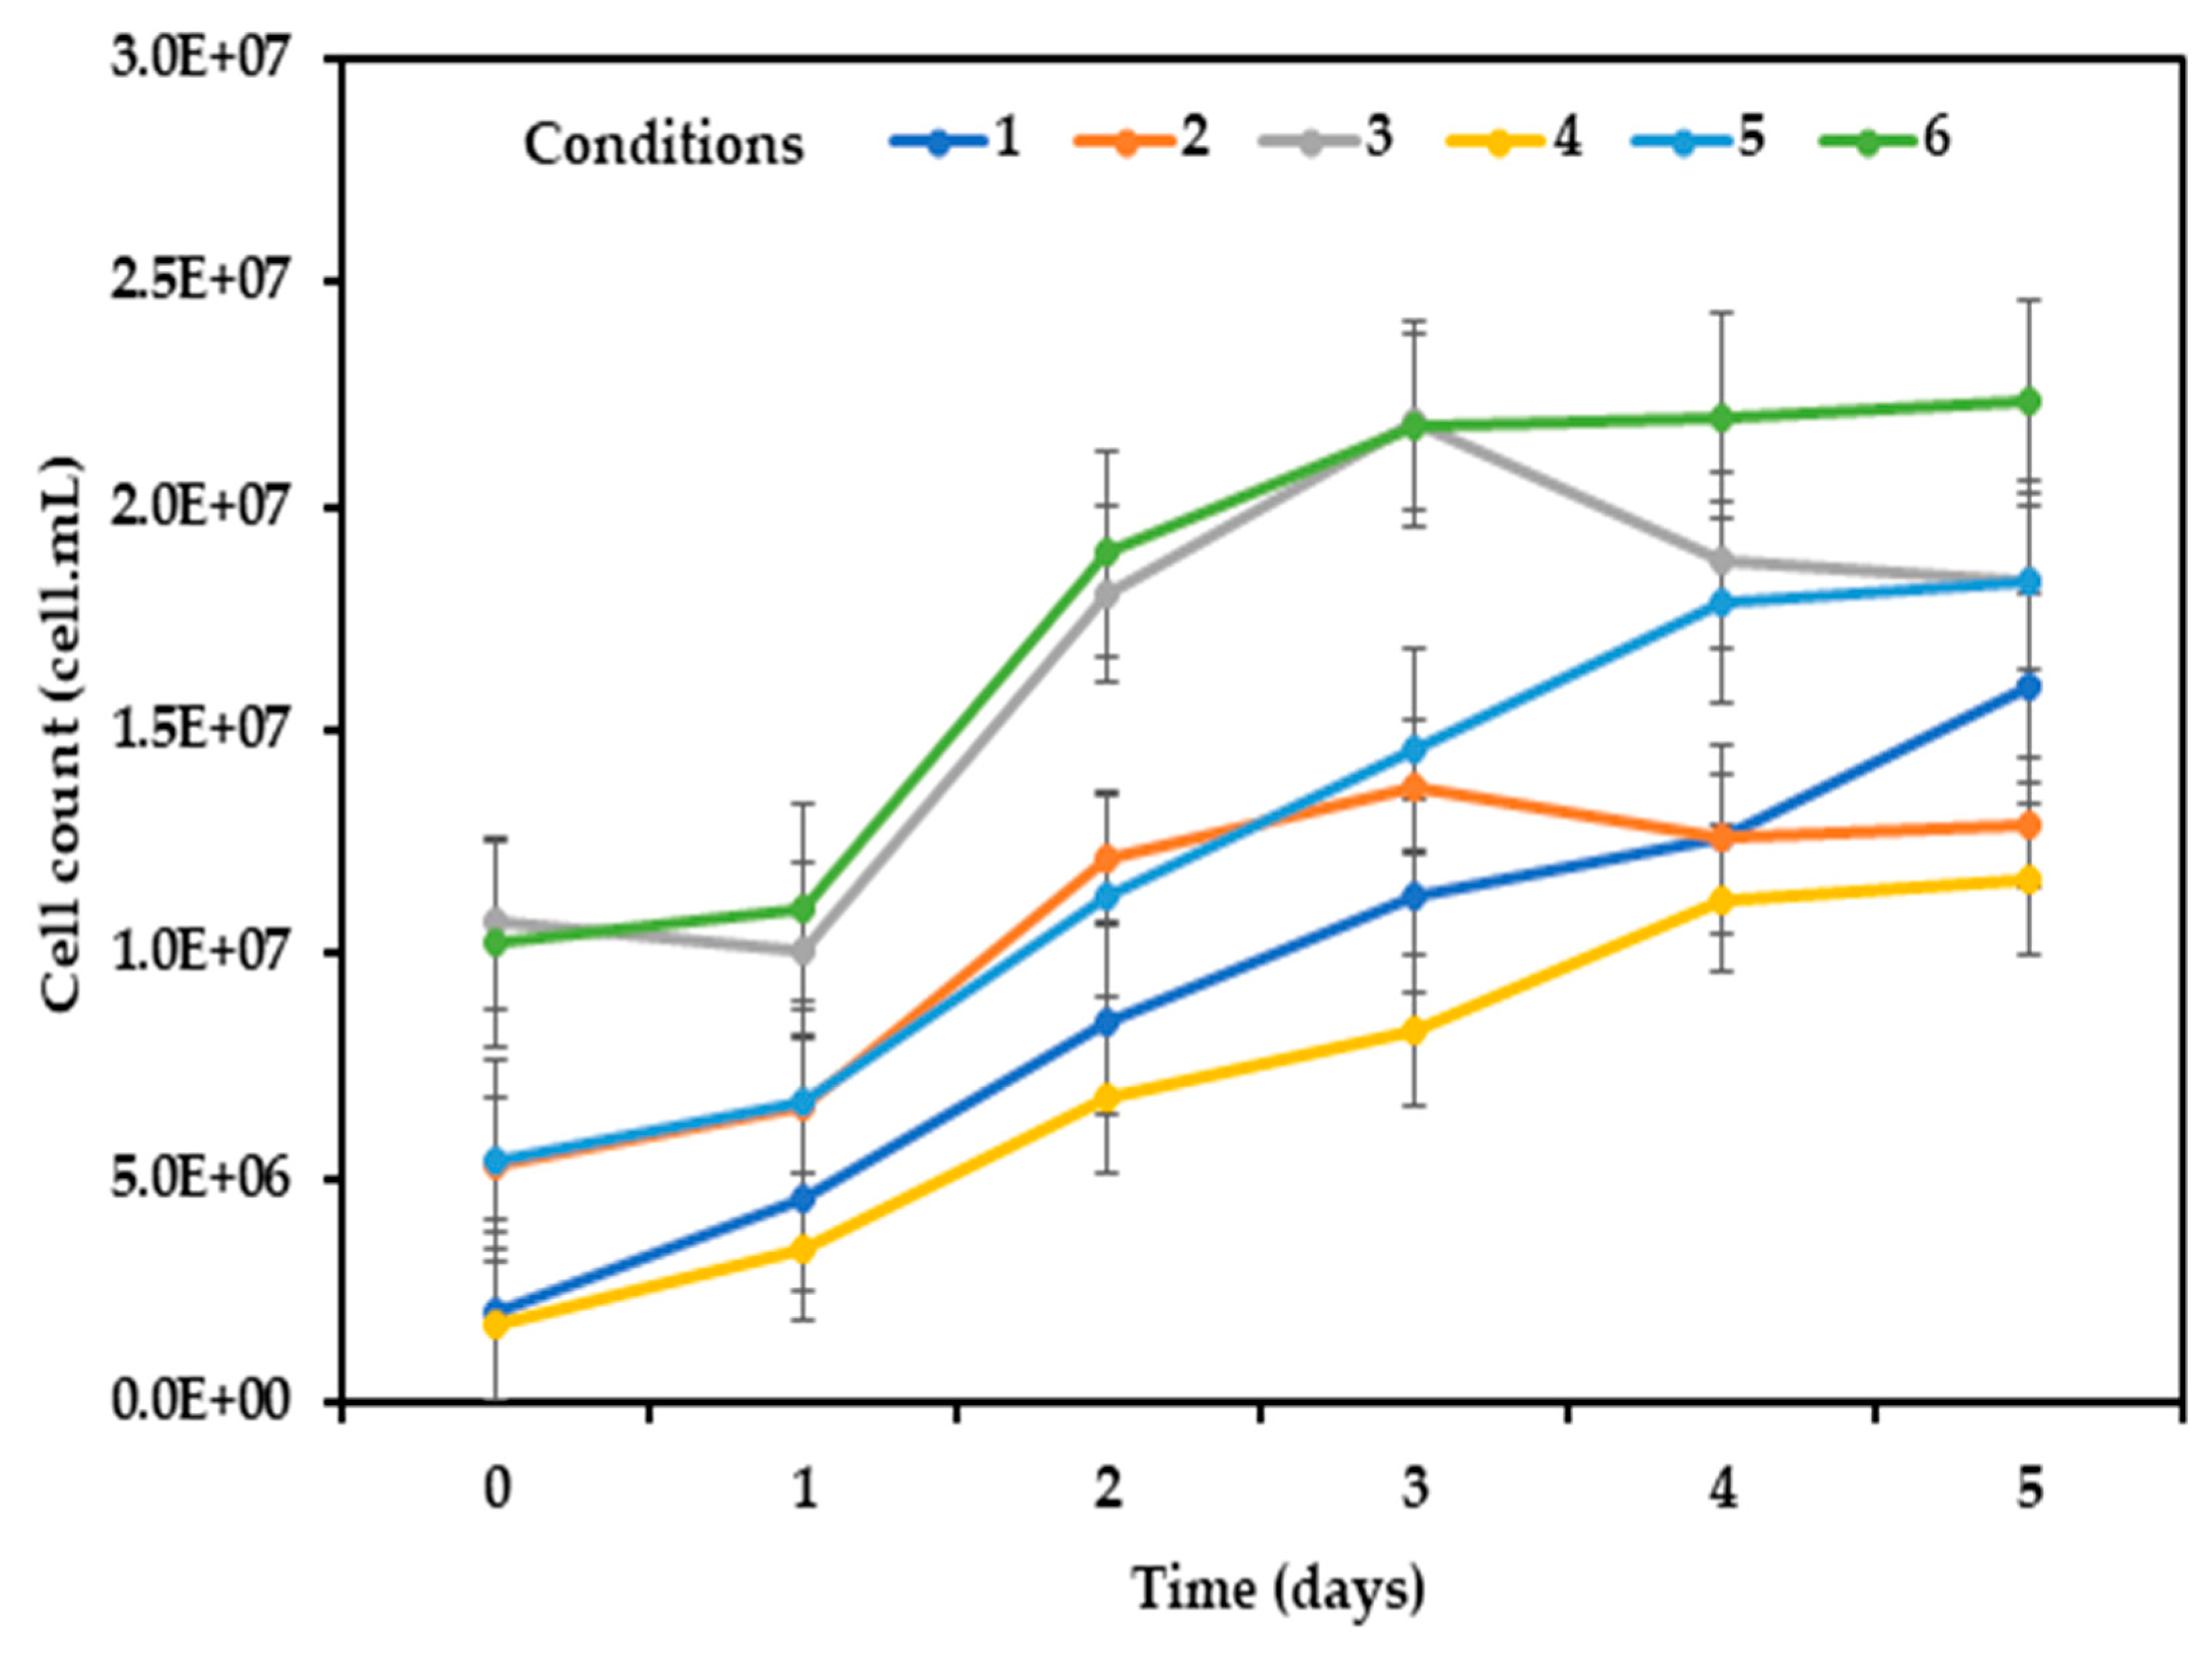
Table 1.
Mean concentration and standard deviation of substrate wastewater characteristics, being that: COD = chemical oxygen demand; TDN = total dissolved nitrogen; TDP = total dissolved phosphorus; DO = dissolved oxygen; TSS = total suspended solids.
Table 1.
Mean concentration and standard deviation of substrate wastewater characteristics, being that: COD = chemical oxygen demand; TDN = total dissolved nitrogen; TDP = total dissolved phosphorus; DO = dissolved oxygen; TSS = total suspended solids.
| Parameter | Unit | Average value |
|---|---|---|
| pH COD |
- mg L-1 |
7.00±0.04 119.0±4.70 |
| TDN | mg N L-1 | 58.2±0.60 |
| TDP | mg PO43- L-1 | 6.00±0.20 |
| DO | mg O2 L-1 | 0.59±0.25 |
| TSS | g TSS L-1 | 0.07±0.05 |
| Total Alkalinity | mg CaCO3 L-1 | 339.30±19.50 |
| Volatile Fatty Acid | mg L-1 | 61.30±8.50 |
n=3.
Table 2.
Composition of operational volume of microalgae and activated sludge per condition and control.
Table 2.
Composition of operational volume of microalgae and activated sludge per condition and control.
| Conditions | Volume of microalgae inoculated | Volume of activated sludge inoculated | |
|---|---|---|---|
| 1 | Microalgae (0.10 g L-1) + Activated sludge (0.20 g L-1) |
0.118 L |
0.016 L |
| 2 | Microalgae (0.25 g L-1) + Activated sludge (0.50 g L-1) |
0.296 L |
0.039 L |
| 3 | Microalgae (0.40 g L-1) + Activated sludge (0.80 g L-1) |
0.473 L |
0.062 L |
| Controls | |||
| 4 | Microalgae (0.10 g L-1) | 0.118 L | --- |
| 5 | Microalgae (0.25 g L-1) | 0.296 L | --- |
| 6 | Microalgae (0.40 g L-1) | 0.473 L | --- |
Concentrations of microalgae (1.69 g L-1) and activated sludge (25.76 g L-1) inoculum.
Disclaimer/Publisher’s Note: The statements, opinions and data contained in all publications are solely those of the individual author(s) and contributor(s) and not of MDPI and/or the editor(s). MDPI and/or the editor(s) disclaim responsibility for any injury to people or property resulting from any ideas, methods, instructions or products referred to in the content. |
© 2023 by the authors. Licensee MDPI, Basel, Switzerland. This article is an open access article distributed under the terms and conditions of the Creative Commons Attribution (CC BY) license (http://creativecommons.org/licenses/by/4.0/).
Copyright: This open access article is published under a Creative Commons CC BY 4.0 license, which permit the free download, distribution, and reuse, provided that the author and preprint are cited in any reuse.


