Submitted:
07 November 2023
Posted:
08 November 2023
You are already at the latest version
Abstract
The purpose of this study is to identify the different effects exerted by planting density and nitrogen fertilization on high-salinity Reclaimed Paddy Fields(RPF) and General Paddy Fields(GPF), and to find the amount of fertilization and the planting density suitable for the growth of forage rice in each paddy field. In both experimental locations, there was no significant change in the soil due to N treatment, but in the case of RPF, electrical conductivity(EC) decreased significantly from more than 5dS/m to up to 2.87dS/m during the yellow ripe stage due to the influence of floods and concentrated precipitation on the fields. In all soils, as both the amount of N treatment and the planting density increased, there was a proportional relationship in which the number of tillers and the dry weight also increased, with the occurrence of lodging also being increased. The dry weight, as expected, was 1.5 times higher at a planting distance of 10 cm, rather than 16 cm. In addition, in both locations N treatment led to an increase in the dry weight, but when N treatment reached 400kg/ha (2.0), the dry weight decreased instead. Moreover, although there was no clear difference in feed value according to N treatment, in RPF, neutral detergent fiber(NDF) was higher than 60%, RFV was less than 98, and TDN was also low, confirming that the quality of rice was higher in GPF.
Keywords:
salinity
; planting density
; nitrogen fertilization
; feed values
; forage rice
; soil condition
1. Introduction
A balanced fertilizer management of N, P, and K maintains or improves the N, P, and K balance, while the addition of residues further strengthens the nutrient balance [1]. The increase in the use of N fertilizers has caused excessive use of nitrogen and pollution in some areas of the agricultural ecosystem since the 1950s, and N surplus has since caused many problems for human and ecological health as it accumulates in the soil or disperses in the air, groundwater, and surface water through various pathways [2]. In addition, agricultural problems caused by a long-term use of substances such as pesticides and fertilizers were prominent, leading to not only contaminated agricultural products, but also problems in the soil, such as an imbalance in various nutrient ratios and the destruction of organic matter in the soil [3]. A long-term use of chemical fertilizers can impair the soil's ability to sustain optimal crop growth and yield [4].
Furthermore, salinity is caused by the osmosis of salt in the soil solution, which produces the same effect as water stress caused by drought and may exert additional effects on crop growth; when an excessive amount of salt enters the plant, it rises to toxic levels in older transpiring leaves, causing premature senescence [5]. In general, sodium is not an essential factor in plant growth because plants do not have a special transport system for Na; if the plant is exposed to high Na concentrations, Na can move to plant cells through various channels [6]. Droughts, floods, heat waves, and salinization of soils around the world are frequently occurring, affecting the production and cultivation of crops [7]. High salinity occurs for a variety of reasons, like dry soils, climate factors such as low precipitation and evaporation, coastal areas affected by tides, inadequate human irrigation, and the use of fertilizers and pesticides [8].
In the case of Korea, the Korean plain accounts for less than 30-40% of the total area, most of it is covered with forests, and the proportion of land fit to cultivate agricultural products is low [9]. Therefore, the tidal mudflats in the West Sea were reclaimed to create arable land [10]; these areas were converted and utilized for various purposes such as industrial and urban development, power plants, and agriculture through the conversion of coastal wetlands with techniques such as reclamation and levees [11]. After the tidal mudflats are reclaimed, the soil salinity and vegetation in the area change rapidly, so land use planning is important because the soil in the reclaimed area is characterized by highly salinity [12]. Therefore, after 1950, the government focused on expanding farmland and cultivating highly productive rice varieties, effectively revitalizing the rural economy [13].
However, in high-salinity soils, the form and functions of plant organs undergo significant changes in the process of plant growth and development, and the ability of plants to react to salinity stress depends on the genes expressed during the developmental stage when the stress occurs [14]. Therefore, in Korea, many experiments are being conducted on salt resistant crops such as forage rice, beans, corn, and barley, etc. grown in rice paddies or field soils with a high salt content [15,16,17]. In line with this, since 1998 Korea has implemented a base-forage expansion program to encourage domestic forage production as a policy solution to reduce feed costs, which has led to the expansion of domestic forage production [18]. Furthermore, research has been actively conducted on aspects such as the productivity of forage crops according to the use of anaerobic liquid fertilizer [19], and the appropriate amount of fertilizer to be employed when cultivating Barnyard millet for forage [20].
However, due to the nature of Korea's climate, the rainy season in July and August can cause a significant amount of nutrient loss due to the outflow from the surface of rice paddies [21], so it can be is necessary to find an appropriate level of chemical fertilizers because an excessive use of fertilizers lowers water quality and leads to soil acidification [22,23]. Also, it has been confirmed that there are not many studies on the appropriate amount of fertilizer to be used in the cultivation of forage rice. Therefore, in this study, forage rice was grown in high-salt and low-salt paddy field soils, the objective of the present study being confirming changes in growth characteristics, yields, and feed value according to different planting density and fertilizer treatments.
2. Results
2.1. Growth and Development Characteristics
A two-way ANOVA statistical analysis was conducted to find out whether there was a significance between the location, the planting density, and the amount of fertilization in data collected during the yellow ripe stage in the reclaimed and general paddy fields (Table 1). Although the tiller number showed no significant difference depending on the location, but there was a significant difference within p<0.001 in the planting density and fertilizer amount. Also, there was no interaction between the location, the planting density, and the amount of fertilizer. Tiller number and productive tiller in RPF were in the range of 193.6-488.4 and 127.6-468.6, respectively, while they were higher in GPF, in the range of 238.3-506.0 and 223.7-500.5, respectively. Moreover, both locations were found to be about 1.5-2 times more when the planting density was 10cm compared to 16cm. In addition, in both locations, when the amount of fertilizer was generally 1.5-2.0, there were higher tiller number and productive tiller, but it was confirmed that the degree of occurrence of lodging increased to 90% in RPF and 70% in GPF, when the planting density was 10cm and the amount of fertilizer was 2.0.
It was confirmed that the plant height showed a significant difference (within p<0.001) in between the location, the planting density, and the amount of fertilizer, but there was no interaction. In the case of culm length, there was a significant difference within p<0.01 depending on the planting density and fertilization amount, but similarly, it was shown that there was no interaction. Data shows that the plant height was 159.8cm-181.1cm in RPF, while 139.5cm-171.1cm in GPF, with the RPF value being higher than expected. Although there were no consistent results depending on the treatment, the growth of crops untreated with fertilizers was not good when compared to other treatments. Culm length was the highest at 129.8cm when the planting density was 10cm and the fertilizer amount was 2.0 in RPF, but except for this, the highest culm length was 120.5cm in RPF and 123.6cm in GPF, when the fertilizer amount was set at 1.0 in both locations.
The chlorophyll content in the flag leaf interacted within p<0.001 depending on the location, the planting density, and the amount of fertilizer, but in the third leaf there was only a significant difference within p<0.001 depending on the location, whilst there was no significance in the other groups. In general, it was confirmed that the chlorophyll content was greater when the planting density was 10cm rather than 16cm, with values in the range of 43.6-46.8 in RPF and 33.2-48.9 in GPF, and its content was higher in the flag leaf than in the third leaf. The flag leaf had the highest chlorophyll contents of 44.9 in RPF, when no fertilizer was applied and the planting density was 16cm, and of 46.8, when the fertilizer amount was 1.0 and the planting density was 10cm. Interestingly, the third leaf showed a common characteristic: both locations had the highest chlorophyll content of 46.8 and 43.4, in RPF and GPF, respectively, when the planting density was 16cm and the fertilizer amount was 1.5, and of 46.6 and 42.2, in RPF and GPF, respectively, when the planting density was 10cm and the fertilizer amount was 2.0. The leaf area index showed a significant difference within p<0.001, respectively, depending on the location, the planting density, and the amount of fertilizer, and an interaction also appeared within p<0.001. The leaf area index was higher in GPF than in RPF, and both regions showed the highest value were 4.8, 4.9 in RPF and 5.2 in GPF, respectively, when the fertilizer amount was 1.5 regardless of the planting density, but exceptionally, in GPF the highest leaf area index (9.6) was detected when planting density was 10cm and the amount of fertilizer was 2.0.
2.2. Chemical Analysis
Table 2 presents the data collected during the yellow ripe stage to find out the forage rice growth difference in reclaimed and general paddy field according to the planting density and the amount of fertilizer. CP interacted within p<0.001 depending on the location, the planting density, and the amount of fertilizer. The CP content was higher in GPF than in RPF; in GPF the CP content was the highest at 11.7 when the planting density was 16cm and the fertilization amount was 2.0, and it was found to be the highest with a 2.0 fertilization amount in all treatment plots. NDF also showed an interaction within p<0.01 depending on the location, the planting density, and the amount of fertilizer, but there was no significant difference in ADF depending on the location; additionally, there was a significant difference within p<0.05 in the planting density and fertilization amount, but there was no interaction. Both NDF and ADF were lower in GPF than in RPF, and in RPF the amount of fertilizer was found to be the lowest in the untreated control plot. In addition, in GPF, at 16cm planting density, NDF was the lowest at 53.9% in untreated control plot, while ADF was the lowest at 31.8% when the fertilization amount was 2.0. Also, at 10cm planting density, both NDF and ADF were found to be the lowest at 43.4% and 28.2%, respectively, when the fertilization amount was 1.5.
TDN had no interaction based on location, planting density, and the amount of fertilizer, and no common phenomenon was observed according to the planting density and the amount of fertilization, but it was found to be the highest at 66.6% in GPF when the amount of fertilization was 1.5 in GPF. Hemicellulose showed no interaction depending on the location, the planting density, and the amount of fertilizer, but there were significant differences depending on the location, and it was confirmed that the content of hemicellulose was higher in RPF than in GPF. In RPF, at 16cm planting density hemicellulose was the highest at 27 when the amount of fertilizer was 2.0; at 10cm planting density hemicellulose was the highest at 25 when the amount of fertilizer was 1.5. In GPF, at 16cm planting density hemicellulose was the highest at 23.7 when the amount of fertilizer was 1.5; at 10cm planting density hemicellulose was the highest at 20.3 when the amount of fertilizer was 2.0. RFV interacted within p<0.001 depending on the location, the planting density, and the amount of fertilizer, and in both locations it was higher in GPF than RPF, also showing a higher content when the planting density was 10cm rather than 16cm. In addition, in RPF, RFV was the highest at 94 and 98, respectively, when the amount of fertilizer was untreated control plot in all planting density. However, in GPF, at 16cm planting density, RFV was 108 when the fertilizer amount was 2.0, but at 10cm planting density, it was confirmed that RFV was the highest at 144 when the fertilizer amount was 1.5, but no consistent tendency was found according to the fertilizer amount.
2.3. Yield
Figure 1 shows the data related to dry weight and percentage of dry matter in reclaimed and general paddy field. In both areas the fertilizer amount was the lowest in the untreated control plot, and in particular, the dry weight was the lowest at 922g at 16cm planting density with no fertilizer treatment. There was a clear difference between RPF and GPF: dry weight was higher in GPF than in RPF, while in GPF the percentage of dry matter was lower than in RPF. In RPF, with a 1.5 fertilizer amount and at 10cm and 16cm planting density, the dry weight was the highest at 1981g/m2 and 2939g/m2, respectively.
In GPF, when the planting density was 16cm and the fertilizer amount was 1.5, the dry weight was 2650g, and when the planting density was 10cm and the fertilizer amount was 2.0, the dry weight was the highest at 4055g. However, when the fertilizer amount was 2.0, lodging occurred at the highest degree (Table 1); additionally, in GPF, except when the planting density was 10cm, in all treatment plots the dry weight was lower or not significantly different when the fertilizer amount was 2.0 rather than 1.0.
3. Discussion
If the application rate of the existing N fertilizer exceeds the capacity of vegetable uptake, the yield of the crop is significantly reduced, and a large amount of dissolved salt accumulates in the soil, which can affect secondary soil salinization and changes in soil salinity [24]. Also, it affects the germination, growth, and reproductive development of plants under salt stress conditions from the soil, and ion toxicity and high osmotic stress cause nutrient deficiencies in plants that break the nutritional balance or interfere with nutrient (N, Ca, K, P, Fe, Zn) absorption, leading to a decrease in the agricultural productivity of crops. [7]. Therefore, through this experiment, nitrogen was applied to soil that suffered from salt stress and soil that did not, then the results were compared and analyzed, and the physiological response of forage rice was evaluated to find out the appropriate amount of nitrogen fertilizer for each type of soil, as this whole process is necessary to ensure a stable production of grains.
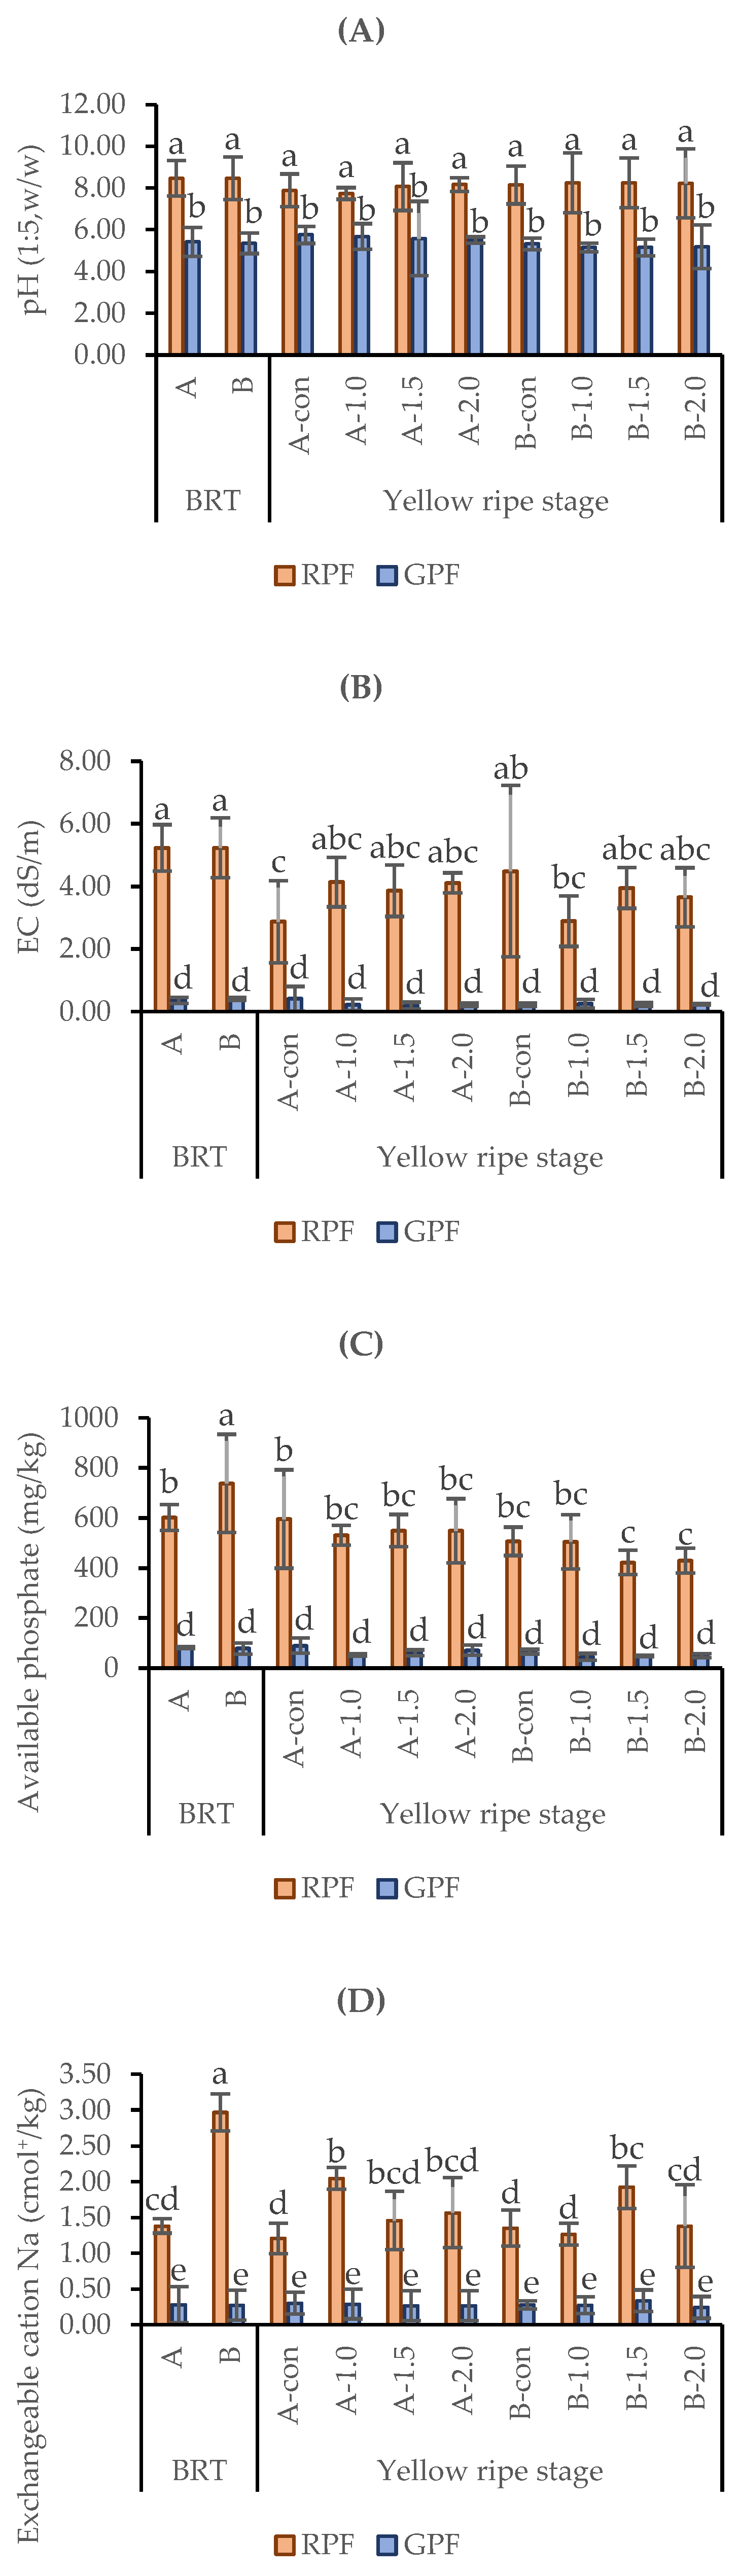
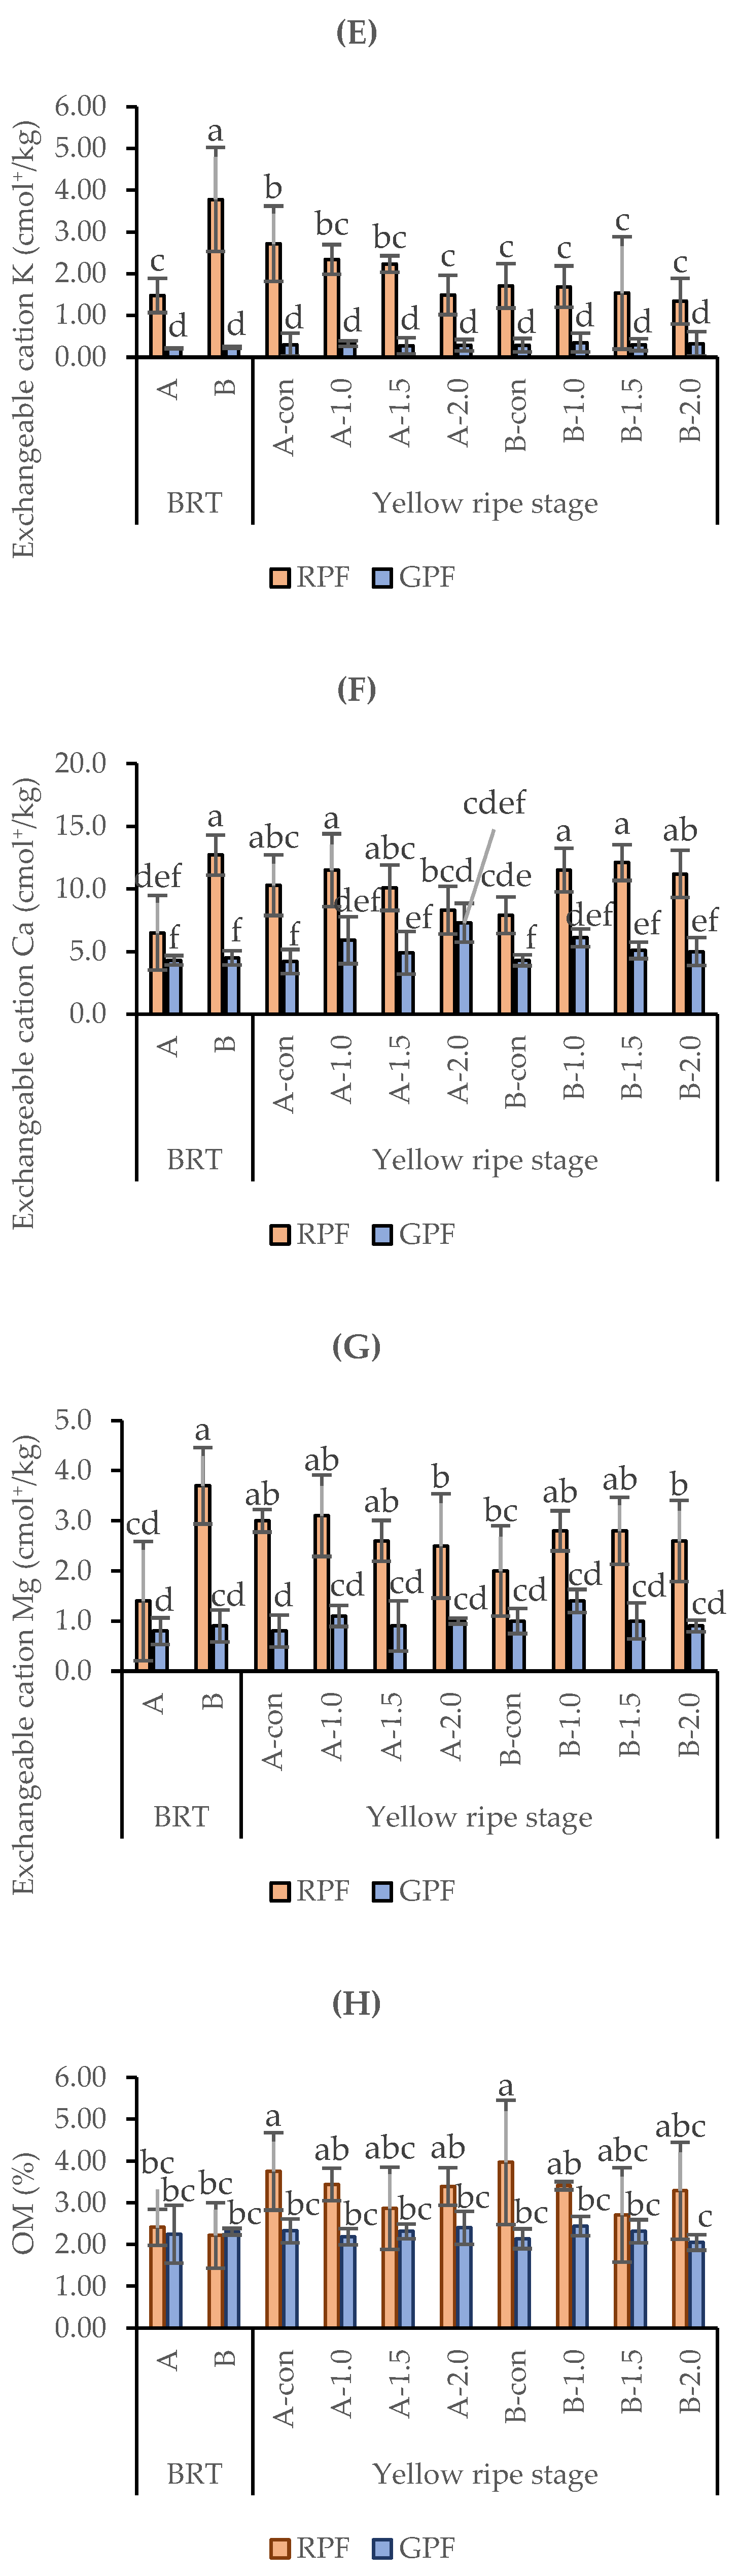
When comparing GPF and RPF, a clear difference was observed between the two locations, as the soil pH, EC, AP (available phosphate), and the exchangeable cation Ca were all much higher in RPF (Figure 3). According to a study by [25], EC in soil is closely correlated with the exchangeable cation Na concentration, and the increase in Na concentration after waterlogging is caused by an increase in EC and soluble cation concentration, due to the dissolution of clay minerals including Na and insoluble salts. Also, it was found that the loss of exchangeable cation Ca and Mg from the soil exchange complex leads to soil acidification [26], and interestingly, our experimental results partly agree with this. In RPF, the contents of exchangeable cation Ca and Mg increased during the yellow ripe stage compared to the data measured before rice transplanting, and it was also confirmed that the pH in the soil was further alkalized to 7.74-8.25.
AP in soil can be absorbed and used by plants, and in this experiment it was observed in both RPF and GPF that regardless of the planting density, the AP content was the highest in the untreated control plot. On the other hand, the yield was the lowest, and in the rest of the treatment plots except for the untreated control plot, the lower the available phosphate, the higher the yield. A study by [27] also reported that high crop yields can be obtained by cultivation with an efficient P absorption, even in soils with a relatively low P content.
Looking at the changes in pH and EC in the soil, in the case of RPF with high salt, the pH was 8.47 before the rice transplanting, but decreased slightly to 7.74-8.25 during the yellow ripe stage, while the EC was 5.23 before the rice transplanting and decreased to 2.87-4.49 during the yellow ripe stage. According to [28], regardless of N application, the grain yield also decreases as EC increases at the same pH value or pH 8-9, but in this experiment, there was no effect on the untreated control plot, while in the remaining treatment plots it was observed that a lower EC at a pH 8 in the soil generally leads to increased yields. Both pH and EC decreased after transplantation, although no consistent changes were detected according to the planting density or the fertilizer amount. Generally, studies have shown that although waterlogging cultivation can reduce salt in the root area, the effect of natural precipitation may be short [29]. Considering that another study showed that the ecosystem function of salt marshes has not been significantly affected by changes in precipitation for a year [30], likewise in this experiment it is estimated that the decrease in salt is a temporary effect due to waterlogging or concentrated precipitation.
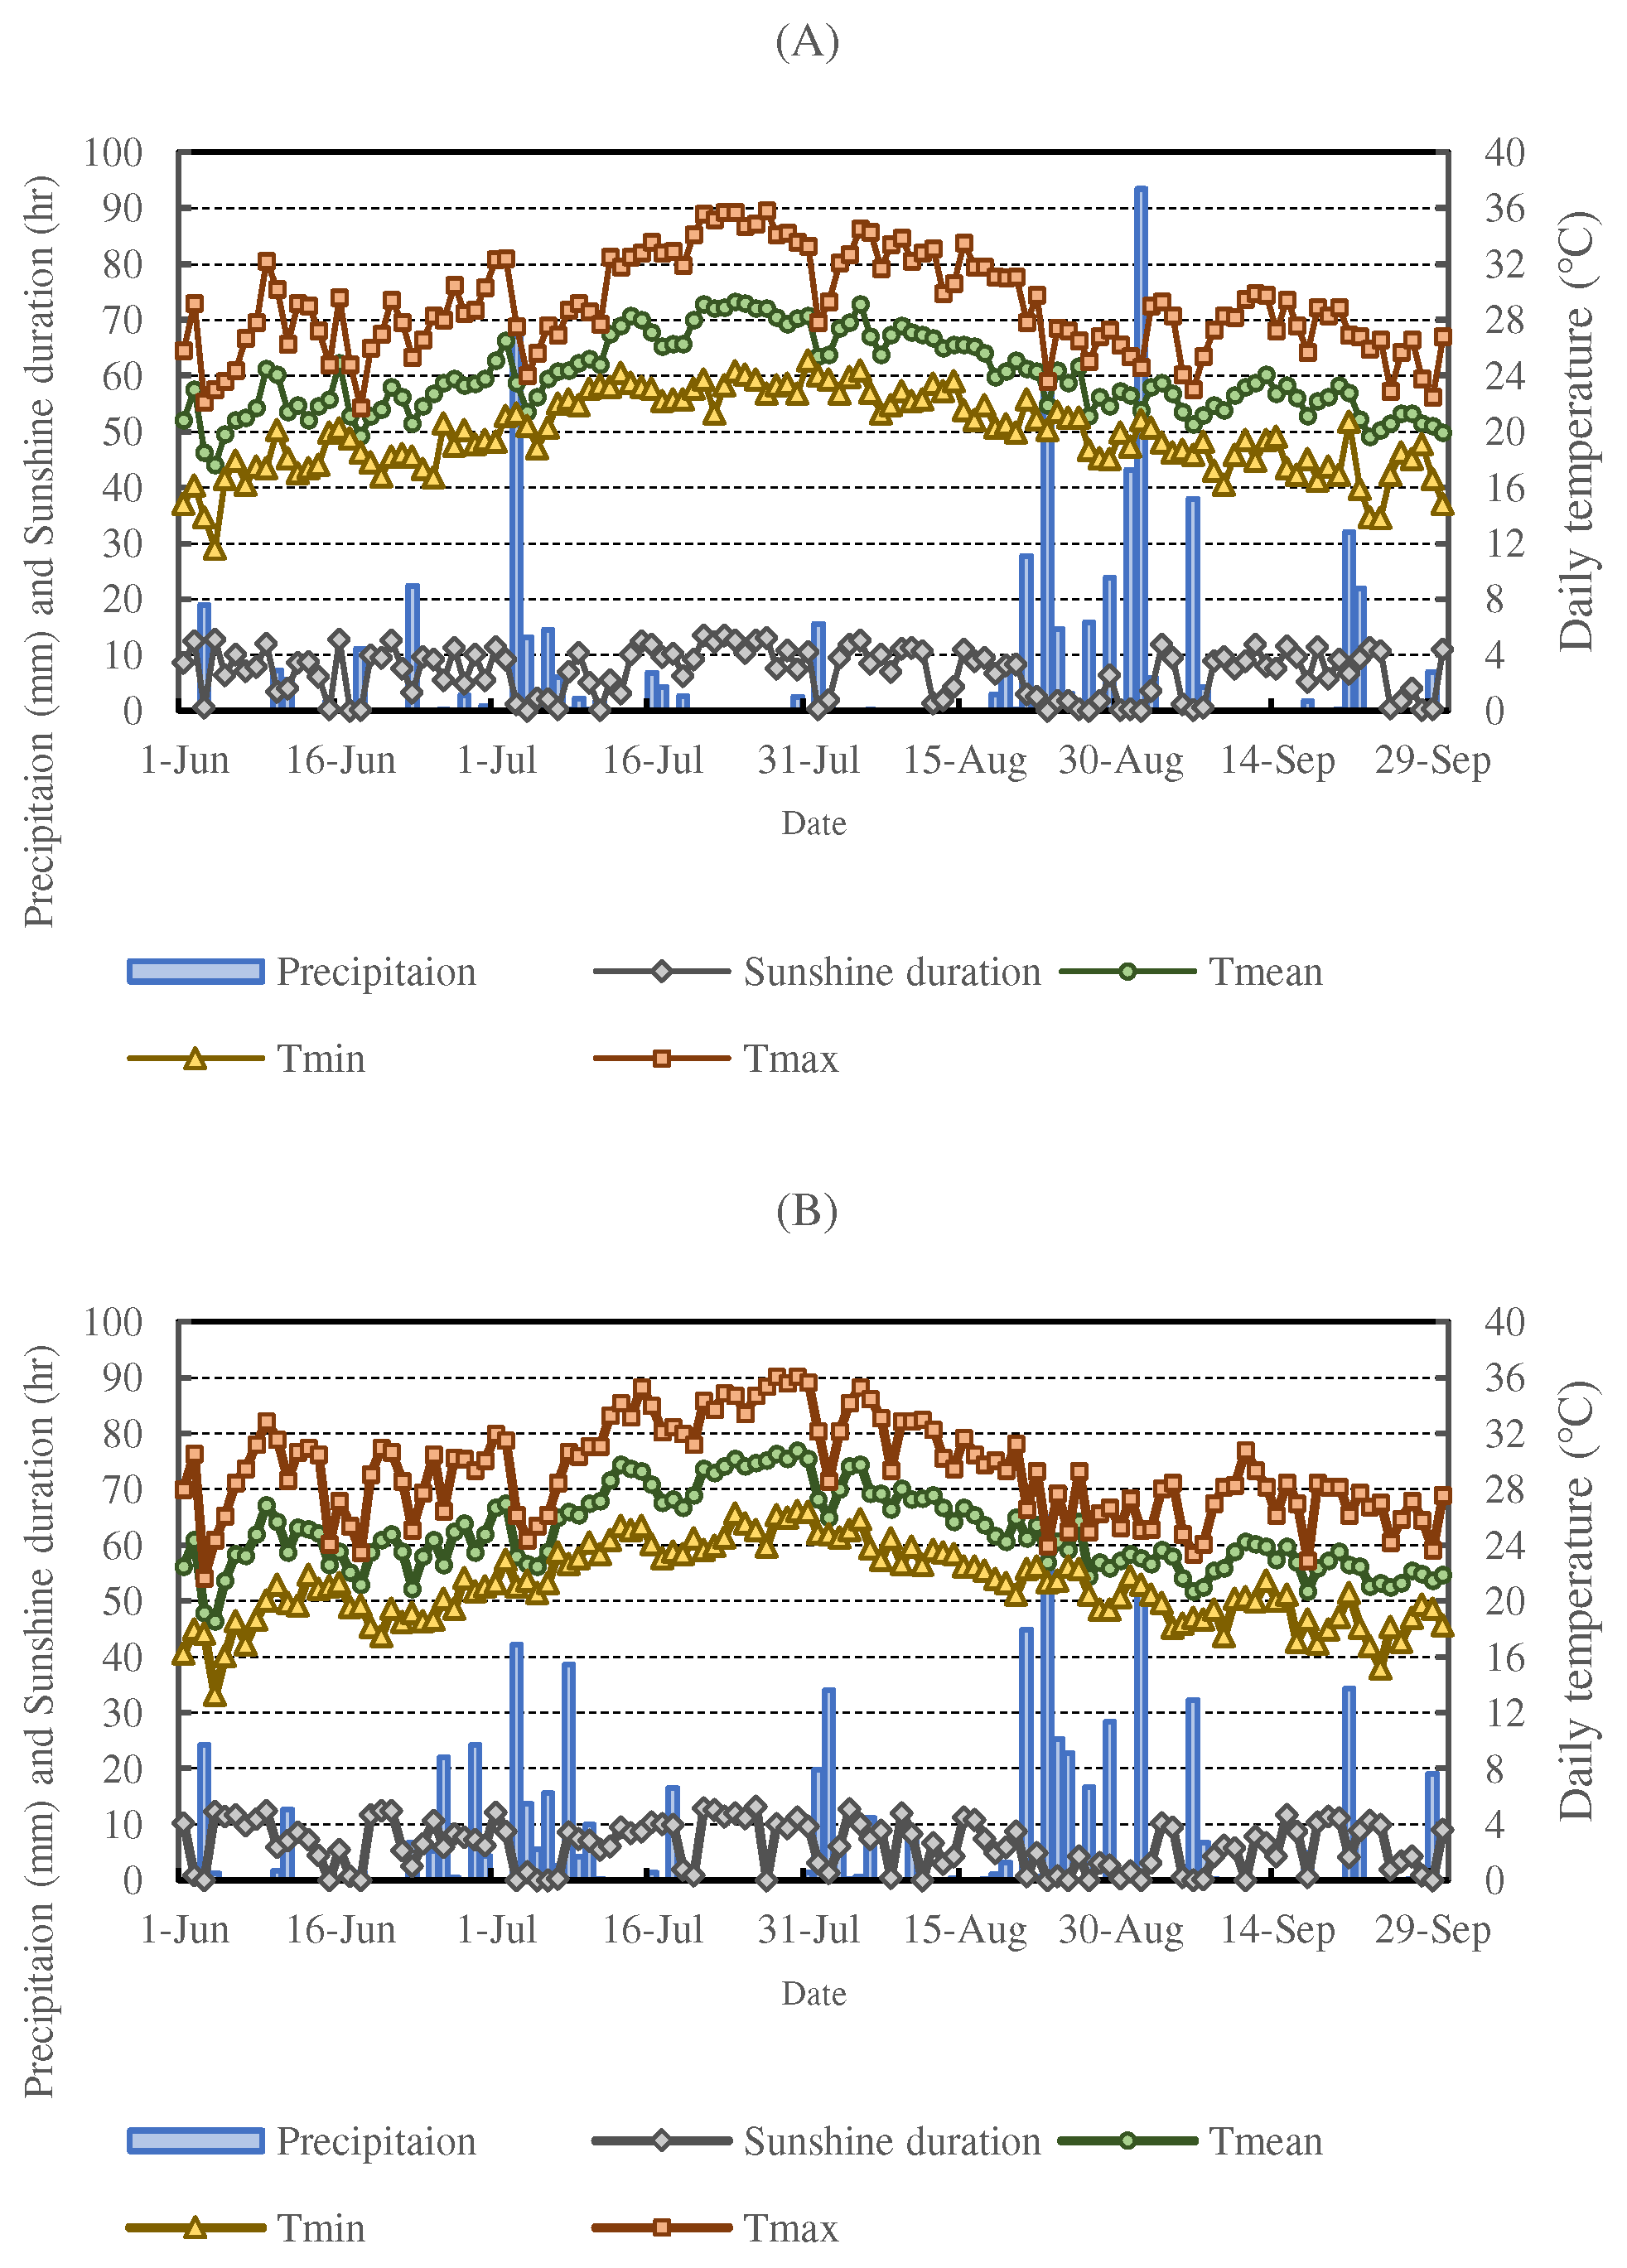
Usually, the growth of plants is greatly affected by different water contents in the root area soil layer and the chemical components of the soil solutions under field conditions [31]. Therefore, even when the cultivar, planting density, and amount of fertilizer used are the same, differences in growth characteristics may appear. In GPF, the average temperature was 1℃ higher than in RPF, and the precipitation was also 91.8mm higher in GPF than in RPF, but the sunshine duration was 0.6hr longer in RPF (Figure 2). A common feature of this experiment is that the culm length height was generally similar regardless of the planting density in GPF and RPF, and it was observed that the plant height was about 10cm higher in RPF (Table 1). In general, most cultivated varieties of crops show significantly decreased heights when exposed to salinity [32]. In addition, salt stress reduces the uptake of nutrients such as N, P, K, Ca, etc., and it causes nutritional deficiencies in plants due to impaired transport efficiency [33]. However, in this experiment, the results were contrary to the expectations that the plant height is higher in high-salt soil than in low-salt soil, and there may be two causes for this. First, the height of the stem may have increased due to reduced salinity in the soil caused by additional precipitation, warming and drought [29]. Secondly, it is presumed to be an overgrowth phenomenon in which the stems or leaves of plants grow long and tender. The reason for assuming that it was overgrowth is that if the plant height increased in RPF, then a yield increase should have been noticeable, but instead the yield was higher in GPF. Likewise, the LAI was also higher in GPF, and in terms of feed value, TDN was also lower in RPF than in GPF. Usually, the causes for this phenomenon are excessive application of fertilizer or excessive moisture, lack of sunshine and abnormal temperatures. This was mostly the case during the course of this experiment, and it is thought these factors influenced RPF more strongly than GPF.
Since the effect of N on the grain yields of early-emerging tillers was limited, thus, the further increase in yields resulted mainly from the contribution of late-emerging tillers [34]. Also, in the study of [35], growth parameters, plant height, LAI, number of leaves, and DW etc. were positively influenced by N treatment. In this experiment, it is confirmed that in both locations N treatment affected the values of both the tiller number and LAI. The higher the planting density, the higher the number of tillers per unit area, and if N fertilizers are sufficiently applied, the number of rice tillers and panicles could increase [34]. In addition, the DM weight per square meter increases at the full heading stage with increasing planting density [36]. In this experiment, in both locations the higher the planting density and the application of N, the higher the yield. However, lower yields were obtained in N treatment 2.0, which is judged to be due to the occurrence of lodging. When N treatment was 2.0, the occurrence of lodging was 30-70% in GPF, but it was quite high at 80-90% in RPF (Table 1). In RPF, not only the N treatment but also the plant height was long, so it is believed that the occurrence of lodging increased due to complex causes. Lodging results in the primary effect of reducing canopy photosynthesis, rather than the potential of single leaf photosynthesis, which could lower the yields of grain [37].
According to a study by [38], at low salinity levels in soil, increasing the application rate of N fertilizers significantly improves N uptake, thus alleviating the adverse effects caused by salinity; it is also said that high soil salinity acts as the dominating factor governing crop growth and N uptake. In addition, although the subsurface drainage of highly saline soil results in a loss of approximately 3-20% of the total applied nitrogen through the subsurface drainage effluent [39], another study has shown that supplying an adequately amount of fertilizer depending on the size of the plant can produce high yields [40]. In this experiment, the yield in RPF was lower than that of GPF, but in RPF the yield reached a level similar to that of an untreated control plot in GPF, due to the application of N. This had a positive effect by contributing to the increase in growth and yield by N treatment (Figure 1). In general, it was consistent with several studies reporting that crop yields are greatly suppressed at high levels of salinity, but that applying an appropriate amount of N alleviates the negative effects of salinity on the yields [28,41]. Moreover, in RPF the yield peaked with the application of N 1.5 for both the 10cm and 16 cm planting density, while the linearly increased yield was not obtained with the application of N 2.0. Namely, Mitscherlich's law of diminishing returns applies to this case, as it states that marginal productivity decreases as the level of marginal factors is increased [42]. Rice grain yield peaked at 300kg/ha nitrogen application rate, and the supply of nitrogen above 300kg/ha was highly consistent with the results of studies showing that it failed to ensure a linearly increased rice yield [43]. Usually, as the seeding rate increases, the availability of resources increases, and the forage yield increases. However, at the highest planting density, competition between plants intensifies, and similarly to the findings that forage yields did not respond to N application, this experiment also showed how N treatment above 2.0 did not lead to increased yields.
In this experiment, N treatment and planting density did not notably affect the feed value, but when comparing the value of forage in RPF and GPF, it was found to be better in GPF (Table 2). The results in this experiment are in agreement with the study by [44], that states that the forage quality indexes, including CP and ADF, were not affected by the interaction between N and seeding rate. Nevertheless, in this study CP was the highest at N 2.0 treatment in all treatments, regardless of the planting density, but no other remarkable differences were observed. TDN and RFV, the most important factors in feed value assessment, did not show a consistent difference in different N treatments and planting densities, and both were confirmed to be higher in GPF than in RPF. In GPF, TDN and RFV showed similar trends, being the best when the planting density was 10cm, N treatment was 2.0, and the planting density was 16cm, N treatment was 1.5. However, they were observed to be somewhat higher in untreated control plot than in other treatment plots in RPF.
4. Materials and Methods
4.1. Experimental design
A joint experiment was conducted in two locations: a high salinity paddy soil in the reclaimed land in Seokmun District, Gagok-ri, Songsan-myeon, Dangjin-si, Chungcheongnam-do (36°59’20.7 N, 126°40’10.6 E), and a low-salinity paddy soil in the farm belonging to Chungnam National University, 99, Daehak-ro, Yuseong-gu, Daejeon Metropolitan City (36°22’05.4 N, 127°21’13.3 E). Mogwoo, a type of forage rice used in this study, was provided by the National Institute of Crop Science; it is a late variety which can be cultivated even in high-salinity soil [45]. The rice seeds were disinfected by hot water soaking method, then sowed on a seedbed on May 10, 2021, and grown for 30 days; then, rice transplanting was conducted in Daejeon(GPF) on June 3 and Dangjin(RPF) on June 4, respectively. In both Dangjin and Daejeon, the experimental area was divided into 12 sections for a total of 24 sections, with each section measuring 5m×3.3m. The experiment was conducted with three replicates for each of the four treatments. Nitrogen fertilization with "Luxury NK" fertilizer was performed on four different treatment plots based on the experiment of [43]: an untreated control plot, treatments with 200kg/ha (1.0), with 300kg/ha (1.5) and with 400kg/ha (2.0) fertilization. Furthermore, basal fertilization was 100% on June 11, while top dressing was 80% on both July 16 and August 11. In both areas, the planting density was 30cm×10cm and 30cm×16cm, respectively, and 5-8 individuals were transplanted per hill. No pesticides, including herbicides, or weed removal methods were applied, and rice and soil samples were collected during the yellow ripe stage, four weeks after the heading stage: sample collection was carried on in Dangjin on September 30th and Daejeon on October 1.
4.2. Weather and Respective Field Conditions
Meteorological data measurement was carried on with the data provided by the Korea Meteorological Administration: the collected data only span the cultivation period in the reclaimed paddy field (Dangjin) and the general paddy field (Daejeon) (Figure 2). The total precipitation was 616.3mm in RPF and 708.1mm in GPF, so higher in GPF. Since GPF frequently had rainy days, the average duration of sunshine was 6.3hr, which was lower than that of RPF. In addition, the average temperature in RPF was 23.9℃, while in GPF it was 24.9℃, about 1℃ higher than in RPF.
Figure 2.
The average daily temperature (Tmean), minimum temperarure (Tmin), maximum temperature (Tmax), and total precipitation and sunshine duration during rice cultivation period of 2021. (A) Reclaimed paddy field (Dangjin); (B) General paddy field (Daejeon)
Figure 2.
The average daily temperature (Tmean), minimum temperarure (Tmin), maximum temperature (Tmax), and total precipitation and sunshine duration during rice cultivation period of 2021. (A) Reclaimed paddy field (Dangjin); (B) General paddy field (Daejeon)
The soil samples were analyzed by collecting topsoil (about 0-10cm from the surface) from each soil in three replicates. They were then let to dry naturally for a week and passed through a 2mm sieve. The soil analysis was conducted in accordance with the Rural Development Administration soil and plant analysis method (NIAST, 2000). pH and EC values were measured with a pH meter (CP-500L, iSTEK, Seoul, Korea) and an EC meter (Beckman) using soil and distilled water at a ratio of 1:5. The available phosphate(AP) was analyzed with the Lancaster method and the organic matter(OM) with the Tyurin method. Exchangeable cations Ca, K, Mg, and Na were extracted with 1N-NH4OAC (pH 7.0) and analyzed with an ICP (Varian Vista-MPX, Varian, Palo Alto, CA, USA).
Figure 3 shows that the soils in the high-salinity reclaimed paddy field (RPF) and the low-salinity general paddy field (GPF) had different characteristics. Electrical conductivity (EC) is used as an indirect indicator of various physical and chemical properties of a soil [46]. In the two areas where the experiment was conducted, it was confirmed that the EC was lowered by constant floods: in particular, the high-salinity reclaimed paddy soil had an EC higher than 5dS/m during the rice transplanting, but it decreased significantly to 2.87-4.49dS/m during the yellow ripe stage. Available phosphate was between 45-90mg/kg in GPF, and it was substantially higher at over 422mg/kg in RPF; additionally, in both locations levels decreased slightly compared to before rice transplanting, but there was no consistent trend according to the treatment plots. The organic matter was slightly higher within 2.05-3.97% in the reclaimed paddy soil, and increased in comparison to before rice transplanting, and similarly to available phosphate, there was no consistent trend according to fertilizer treatment in both areas. The amount of exchangeable cation K in the reclaimed paddy soil was 1.34-2.72cmol+/kg in all treatment plots, and the amount of exchangeable cation Ca was 7.9-12.1cmol+/kg; both cations’ values increased after rice transplanting. The content of exchangeable cation Mg was 0.8-1.4cmol+/kg in general paddy soils, but in reclaimed paddy soils a 2.0-3.1cmol+/kg Mg content was detected. The exchangeable cation Na amounted to 0.24-0.34cmol+/kg in general paddy soils, while in reclaimed paddy soils it amounted to a higher value of 1.21-2.97cmol+/kg.
Figure 3.
Analysis of soil before rice transplanting and at yellow ripe stage in reclaimed and general paddy fields. *Abbreviations: RPF (reclaimed paddy field-Dangjin); GPF (general paddy field-Daejeon); BRT (before rice transplanting); Planting density: A: 16cm interval; B: 10cm interval; Fertilizer: control (0%); 1.0 (200kg/ha); 1.5 (300kg/ha); 2.0 (400kg/ha); EC (electrical conductivity); OM (organic matter)
4.3. Measurement of Growth Characteristics of Rice
Samples used to investigate growth characteristics were collected in three replicates in the center of each plot: five plants were collected in each of the three 1m2 central areas of all four plots. When the average planting distance was 10cm, the density was 33 hills/m2, while when the average planting distance was 16cm, the density resulted to be 22 hills/m2; values calculated for 22 hills and 33 hills were used to obtain the total tiller number and the productive tiller data, respectively. Tiller number and productive tiller data were collected manually while plant height and culm length were measured with a 100cm ruler. The Portable chlorophyll meter (SPAD-502Plus, Konica Minolta Sensing Americas, Inc, Ramsey, NJ, USA) is a device that was used in this study to measure the chlorophyll content in flag leaf and third leaf of rice in a non-destructive manner. The chlorophyll content was directly measured in rice paddies, then the samples were collected and a growth survey was conducted. Leaf area index (LAI) was measured using LI-3100 Area Meter (Lincoln, NE, USA). In the case of lodging, 0 means that there are no fallen over plants, while the degree of fallen plants increases as the number approaches 100 (Table 1).
4.4. Chemical analysis for forage quality
The samples were dried at 80°C for 72 hours with a forced connection oven (LDO-150F), then the dry weight was measured: subsequently, samples pulverized by combining all the leaves, stems, and grain samples were used for analysis. Crude protein (CP) was analyzed using the Kjeldahl method according to the standard analysis method of AOAC (1995). Neutral detergent fiber (NDF) and Acid detergent fiber (ADF) were evaluated with the method of Goering & Van Soest (1970). Total digestible nutrient (TDN) was obtained with Holland and Kezar's (1992) feed value evaluation formula and was calculated using formula of (1). Relative feed value (RFV) was calculated by the calculation formula of (2), and the percentage of dry matter was calculated by (3).
TDN (%) = 88.9- (0.79 × ADF (%))
RFV = DDM (%) × DMI (%)/1.29
[DDM (%) = 88.9-(ADF(%) × 0.779, DMI(%) = 120/NDF(%)]
[DDM (%) = 88.9-(ADF(%) × 0.779, DMI(%) = 120/NDF(%)]
Percentage of dry matter (%) = (dry weight/fresh weight) *100
4.5. Statistical analysis
R ver.4.1.2 (R Core Team, 2021) was used for statistical analysis of all data, and a two-way ANOVA analysis was conducted to confirm the interaction according to location and planting density and fertilizer amount. The Duncan test (Duncan’s multiple range test) was performed as a post-hoc test. It was tested within the significance level P<0.05, and all data were collected in at least three replicates.
5. Conclusions
In this study, the decrease in Ca and Mg in the soil was associated with an increase in pH, and the lower the AP and EC, the higher the yield, and this phenomenon was especially prominent in RPF. The higher the N treatment, the higher the occurrence of lodging, which was associated with a decrease in yields; such effect was more serious in RPF than in GPF. In addition, it was confirmed that increasing the planting density along with the N treatment led to an increase in tiller number and crop yield, while there was no noticeable change in feed value. In RPF, the highest dry weights of 1981g/m2 and 2939g/m2 were obtained with a planting density of 10cm and 16cm, respectively, when N treatment was 1.5. In GPF, the highest dry weight was 2650g/m2 at N 1.5 treatment and 16cm planting density, and it also was the highest at 4055g/m2 at N 2.0 treatment and 10cm planting density, but it was judged to be inappropriate because of the high degree of lodging. For this reason, it is considered most appropriate to apply N 1.0 treatment, so that a dry weight as high as 3666g/m2 can be ensured and the lodging can be minimized. Therefore, through this experiment, we highlighted the need for further research to find the cause of low correlation between N treatment, soil, and feed value and to explore ways to increase feed value in RPF.
Author Contributions
Conceptualization, Y.M.J. and J.W.C.; validation, J.W.C.; formal analysis, Y.G.A.; investigation, Y.M.J. and K.S.; resources, J.W.C. and Y.G.A.; data curation, Y.M.J. and Y.G.A.; writing—original draft preparation, Y.M.J.; writing—review and editing, J.W.C.; supervision, J.W.C.; project administration, J.W.C.; funding acquisition, J.W.C. All authors have read and agreed to the published version of the manuscript.
Funding
This research was conducted with the support of the research fund (2023) of the Chungnam National University in Korea.
Acknowledgments
This work completed with the support of the Chungnam National University and person in charge of Seokmun reclaimed land and University Farm Manager, all the staff. First of all, I would like to thank the reviewers for their valuable time and opinion on our manuscript, and Professor Jinwoong Cho and Youngjik Ahn for guiding us complete the experiment safely.
Conflicts of Interest
The authors declare no conflict of interest.
References
- Linquist, B.A.; Phengsouvanna, V.; Sengxue, P. Benefits of organic residues and chemical fertilizer to productivity of rain-fed lowland rice and to soil nutrient balances. Nutr. Cycl. Agroecosystems 2007, 79, 59–72. [Google Scholar] [CrossRef]
- Eickhout, B.; Bouwman, A.F.; van Zeijts, H. The role of nitrogen in world food production and environmental sustainability. Agric. Ecosyst. Environ. 2006, 116, 4–14. [Google Scholar] [CrossRef]
- Wang, J.; Li, R.; Zhang, H.; Wei, G.; Li, Z. Beneficial bacteria activate nutrients and promote wheat growth under conditions of reduced fertilizer application. BMC Microbiol. 2020, 20, 1–12. [Google Scholar] [CrossRef]
- Xing, Y.; Wang, C.; Li, Z.; Chen, J.; Li, Y. Effect and Mechanism of Rice-Pasture Rotation Systems on Yield Increase and Runoff Reduction under Different Fertilizer Treatments. Agronomy 2023, 13. [Google Scholar] [CrossRef]
- Munns, R. Comparative physiology of salt and water stress. Plant. Cell Environ. 2002, 25, 239–250. [Google Scholar] [CrossRef]
- Shahid, M.A.; Sarkhosh, A.; Khan, N.; Balal, R.M.; Ali, S.; Rossi, L.; Gómez, C.; Mattson, N.; Nasim, W.; Garcia-Sanchez, F. Insights into the physiological and biochemical impacts of salt stress on plant growth and development. Agronomy 2020, 10. [Google Scholar] [CrossRef]
- Shrivastava, P.; Kumar, R. Soil salinity: A serious environmental issue and plant growth promoting bacteria as one of the tools for its alleviation. Saudi J. Biol. Sci. 2015, 22, 123–131. [Google Scholar] [CrossRef]
- Yadav, S.; Irfan, M.D.; Ahmad, A.; Hayat, S. Causes of salinity and plant manifestations to salt stress: A review. J. Environ. Biol. 2011, 32, 667–685. [Google Scholar]
- Lee, C.H.; Lee, B.Y.; Chang, W.K.; Hong, S.; Song, S.J.; Park, J.; Kwon, B.O.; Khim, J.S. Environmental and ecological effects of Lake Shihwa reclamation project in South Korea: A review. Ocean Coast. Manag. 2014, 102, 545–558. [Google Scholar] [CrossRef]
- Kim, S.H.; Kim, K.; Lee, M.; Jeong, H.J.; Kim, W.J.; Park, J.G.; Yang, J. sam Enhanced benthic nutrient flux during monsoon periods in a coastal lake formed by tideland reclamation. Estuaries and Coasts 2009, 32, 1165–1175. [Google Scholar] [CrossRef]
- Kim, S.G. The evolution of coastal wetland policy in developed countries and Korea. Ocean Coast. Manag. 2010, 53, 562–569. [Google Scholar] [CrossRef]
- Cho, K.H.; Beon, M.S.; Jeong, J.C. Dynamics of soil salinity and vegetation in a reclaimed area in Saemangeum, Republic of Korea. Geoderma 2018, 321, 42–51. [Google Scholar] [CrossRef]
- Choi, Y.R. Modernization, Development and Underdevelopment: Reclamation of Korean tidal flats, 1950s-2000s. Ocean Coast. Manag. 2014, 102, 426–436. [Google Scholar] [CrossRef]
- Ashraf, M.; Harris, P.J.C. Potential biochemical indicators of salinity tolerance in plants. Plant Sci. 2004, 166, 3–16. [Google Scholar] [CrossRef]
- Jang, Y.; Sharavdorj, K.; Nadalin, P.; Lee, S.; Cho, J. Growth and Forage Value of Two Forage Rice Cultivars According to Harvest Time in Reclaimed Land of South Korea. Agronomy 2022, 12, 1–13. [Google Scholar] [CrossRef]
- Sohn, Y.-M.; Jeon, G.-Y.; Song, J.-D.; Lee, J.-H.; Park, M.-E. Effect of soil salinity variation on the growth of barley, rye and oat seeded at the newly reclaimed tidal lands in Korea. Korean J. Soil Sci. Fertil. 2009, 42, 415–422. [Google Scholar]
- Lee, S.; Bae, H.-S.; Lee, S.-H.; Kang, J.-G.; Kim, H.-K.; Lee, K.-B.; Park, K.-H. Effect of Soil Salinity Levels on Silage Barley Growth at Saemangeum Reclaimed Tidal Land. Korean J. Soil Sci. Fertil. 2013, 46, 365–372. [Google Scholar] [CrossRef]
- Chang, J.B. The effects of forage policy on feed costs in Korea. Agric. 2018, 8. [Google Scholar] [CrossRef]
- Yoon, Y.-M.; Shin, K.-S.; Hwang, W.-J.; Lee, S.-H.; Kim, C.-H. Nutrient Value and Yield Response of Forage Crop Cultivated in Reclaimed Tidal Land Soil Using Anaerobic Liquid Fertilizer. Korean J. Org. Agric. 2012, 20, 669–685. [Google Scholar] [CrossRef]
- Hwang, J.-B.; Park, T.-S.; Park, H.-K.; Kim, H.-S.; Choi, I.-B.; Bae, H.-S. Effect of Seeding and Nitrogen rates on the Growth characters, Forage yield, and Feed value of Barnyard millet in the Reclaimed tidal land. Weed Turfgrass Sci. 2017, 6, 124–129. [Google Scholar] [CrossRef]
- Cho, J.Y.; Son, J.G.; Choi, J.K.; Song, C.H.; Chung, B.Y. Surface and subsurface losses of N and P from salt-affected rice paddy fields of Saemangeum reclaimed land in South Korea. Paddy Water Environ. 2008, 6, 211–219. [Google Scholar] [CrossRef]
- Conant, R.T.; Berdanier, A.B.; Grace, P.R. Patterns and trends in nitrogen use and nitrogen recovery efficiency in world agriculture. Global Biogeochem. Cycles 2013, 27, 558–566. [Google Scholar] [CrossRef]
- Zeng, M.; De Vries, W.; Bonten, L.T.C.; Zhu, Q.; Hao, T.; Liu, X.; Xu, M.; Shi, X.; Zhang, F.; Shen, J. Model-Based Analysis of the Long-Term Effects of Fertilization Management on Cropland Soil Acidification. Environ. Sci. Technol. 2017, 51, 3843–3851. [Google Scholar] [CrossRef] [PubMed]
- Han, J.; Shi, J.; Zeng, L.; Xu, J.; Wu, L. Effects of nitrogen fertilization on the acidity and salinity of greenhouse soils. Environ. Sci. Pollut. Res. 2015, 22, 2976–2986. [Google Scholar] [CrossRef] [PubMed]
- Hemati Matin, N.; Jalali, M. The effect of waterlogging on electrochemical properties and soluble nutrients in paddy soils. Paddy Water Environ. 2017, 15, 443–455. [Google Scholar] [CrossRef]
- Brinkman, R. Ferrolysis, a hydromorphic soil forming process. Geoderma 1970, 3, 199–206. [Google Scholar] [CrossRef]
- Balemi, T.; Negisho, K. Management of soil phosphorus and plant adaptation mechanisms to phosphorus stress for sustainable crop production: A review. J. Soil Sci. Plant Nutr. 2012, 12, 547–561. [Google Scholar] [CrossRef]
- Huang, L.; Liu, X.; Wang, Z.; Liang, Z.; Wang, M.; Liu, M.; Suarez, D.L. Interactive effects of pH, EC and nitrogen on yields and nutrient absorption of rice (Oryza sativa L.). Agric. Water Manag. 2017, 194, 48–57. [Google Scholar] [CrossRef]
- Charles, H.; Dukes, J.S. Effects of warming and altered precipitation on plant and nutrient dynamics of a New England salt marsh. Ecol. Appl. 2009, 19, 1758–1773. [Google Scholar] [CrossRef]
- Emery, H.E.; Angell, J.H.; Fulweiler, R.W. Salt Marsh Greenhouse Gas Fluxes and Microbial Communities Are Not Sensitive to the First Year of Precipitation Change. J. Geophys. Res. Biogeosciences 2019, 124, 1071–1087. [Google Scholar] [CrossRef]
- Rengasamy, P.; De Lacerda, C.F.; Gheyi, H.R. Salinity, Sodicity and Alkalinity. Subsoil Constraints Crop Prod. 2022, 83–108. [Google Scholar] [CrossRef]
- Puvanitha, S.; Mahendran, S. Effect of salinity on plant height, shoot and root dry weight of selected rice cultivars. Sch. J. Agric. Vet. Sci. 2017, 4, 126–131. [Google Scholar]
- Razzaq, A.; Ali, A.; Safdar, L. Bin; Zafar, M.M.; Rui, Y.; Shakeel, A.; Shaukat, A.; Ashraf, M.; Gong, W.; Yuan, Y. Salt stress induces physiochemical alterations in rice grain composition and quality. J. Food Sci. 2020, 85, 14–20. [Google Scholar] [CrossRef] [PubMed]
- Wang, Y.; Ren, T.; Lu, J.; Ming, R.; Li, P.; Hussain, S.; Cong, R.; Li, X. Heterogeneity in rice tillers yield associated with tillers formation and nitrogen fertilizer. Agron. J. 2016, 108, 1717–1725. [Google Scholar] [CrossRef]
- Elsiddig, A.M.I.; Zhou, G.; Zhu, G.; Nimir, N.E.A.; Suliman, M.S.E.; Ibrahim, M.E.H.; Ali, A.Y.A. Nitrogen fertilizer promoting salt tolerance of two sorghum varieties under different salt compositions. Chil. J. Agric. Res. 2023, 83, 3–13. [Google Scholar] [CrossRef]
- Nakano, H.; Morita, S.; Kitagawa, H.; Wada, H.; Takahashi, M. Grain Yield Response to Planting Density in Forage Rice with a Large Number of Spikelets. Crop Sci. 2012, 52, 345–350. [Google Scholar] [CrossRef]
- Setter, T.L.; Laureles, E. V.; Mazaredo, A.M. Lodging reduces yield of rice by self-shading and reductions in canopy photosynthesis. F. Crop. Res. 1997, 49, 95–106. [Google Scholar] [CrossRef]
- Chen, W.; Hou, Z.; Wu, L.; Liang, Y.; Wei, C. Effects of salinity and nitrogen on cotton growth in arid environment. Plant Soil 2010, 326, 61–73. [Google Scholar] [CrossRef]
- Singh, M.; Bhattacharya, A.K.; Nair, T.V.R.; Singh, A.K. Nitrogen loss through subsurface drainage effluent in coastal rice field from India. Agric. Water Manag. 2002, 52, 249–260. [Google Scholar] [CrossRef]
- Villa-Castorena, M.; Ulery, A.L.; Catalán-Valencia, E.A.; Remmenga, M.D. Salinity and Nitrogen Rate Effects on the Growth and Yield of Chile Pepper Plants. Soil Sci. Soc. Am. J. 2003, 67, 1781–1789. [Google Scholar] [CrossRef]
- Ibrahim, M.E.H.; Zhu, X.; Zhou, G.; Ali, A.Y.A.; Ahmad, I.; Elsiddig, A.M.I. Nitrogen fertilizer reduces the impact of sodium chloride on wheat yield. Agron. J. 2018, 110, 1731–1737. [Google Scholar] [CrossRef]
- Ferreira, I.E.P.; Zocchi, S.S.; Baron, D. Reconciling the Mitscherlich’s law of diminishing returns with Liebig’s law of the minimum. Some results on crop modeling. Math. Biosci. 2017, 293, 29–37. [Google Scholar] [CrossRef]
- Chen, Y.; Liu, Y.; Ge, J.; Li, R.; Zhang, R.; Zhang, Y.; Huo, Z.; Xu, K.; Wei, H.; Dai, Q. Improved physiological and morphological traits of root synergistically enhanced salinity tolerance in rice under appropriate nitrogen application rate. Front. Plant Sci. 2022, 13, 1–13. [Google Scholar] [CrossRef]
- Hajighasemi, S.; Keshavarz-Afshar, R.; Chaichi, M.R. Nitrogen fertilizer and seeding rate influence on grain and forage yield of dual-purpose barley. Agron. J. 2016, 108, 1486–1494. [Google Scholar] [CrossRef]
- Lee, S.-B.; Yang, C.-I.; Lee, J.-H.; Kim, M.-K.; Shin, Y.-S.; Lee, K.-S.; Choi, Y.-H.; Jeong, O.-Y.; Jeon, Y.-H.; Hong, H.-C.; et al. A Late-Maturing and Whole Crop Silage Rice Cultivar “Mogwoo. ” J. Korean Soc. Grassl. Forage Sci. 2013, 33, 81–86. [Google Scholar] [CrossRef]
- Sudduth, K.A.; Kitchen, N.R.; Wiebold, W.J.; Batchelor, W.D.; Bollero, G.A.; Bullock, D.G.; Clay, D.E.; Palm, H.L.; Pierce, F.J.; Schuler, R.T.; et al. Relating apparent electrical conductivity to soil properties across the north-central USA. Comput. Electron. Agric. 2005, 46, 263–283. [Google Scholar] [CrossRef]
Figure 1.
The dry weight and percentage of dry matter according to nitrogen fertilization and planting density in reclaimed and general paddy fields. *Abbreviations: RPF (reclaimed paddy field-Dangjin); GPF (general paddy field-Daejeon); Planting density: A: 16cm interval; B: 10cm interval; Fertilizer: control (0%); 1.0 (200kg/ha); 1.5 (300kg/ha); 2.0 (400kg/ha)


Table 1.
The growth and development characteristics of rice in reclaimed and general paddy fields during the yellow ripe stage.
Table 1.
The growth and development characteristics of rice in reclaimed and general paddy fields during the yellow ripe stage.
| Location | Planting density | Fertilizer | Tiller number | Productive tiller | Plant height | Culm length | SPAD | LAI(m2) | Lodging | ||
|---|---|---|---|---|---|---|---|---|---|---|---|
| Flag leaf | Third leaf | ||||||||||
| (No./m2) | (cm) | 0-100% | |||||||||
| RPF | 16 | ||||||||||
| Control | 193.6f | 127.6f | 160.0cd | 106.6c | 44.9abc | 44.2ab | 2.7e | 0 | |||
| 1.0 | 255.2ef | 233.2ef | 180.7a | 120.9abc | 44.4abc | 43.4ab | 3.2cde | 0 | |||
| 1.5 | 321.2cdef | 167.2cdef | 172.2abc | 115.5abc | 44.8abc | 46.8a | 4.8bcd | 10 | |||
| 2.0 | 294.8def | 286.0def | 168.5abc | 116.3abc | 40.6c | 43.5ab | 2.3e | 80 | |||
| 10 | |||||||||||
| control | 310.2cdef | 303.6cdef | 159.8cd | 112.6bc | 45.6abc | 44.1ab | 2.5e | 0 | |||
| 1.0 | 455.4ab | 415.8ab | 177.0ab | 120.5abc | 46.8abc | 43.3ab | 4.7bcd | 10 | |||
| 1.5 | 488.4a | 468.6a | 171.0abc | 119.3abc | 43.6abc | 43.5ab | 4.9bcd | 20 | |||
| 2.0 | 429.0abc | 409.2abc | 181.1a | 129.8a | 43.8abc | 46.6a | 3.8cde | 90 | |||
| GPF | 16 | ||||||||||
| Control | 238.3ef | 231.0ef | 148.0de | 112.2bc | 31.3d | 27.3d | 2.9de | 0 | |||
| 1.0 | 245.7ef | 238.3ef | 164.9bc | 123.0ab | 41.7bc | 38.0bc | 3.5cde | 0 | |||
| 1.5 | 348.3bcde | 341.0bcde | 167.0abc | 118.7abc | 47.3ab | 43.4ab | 5.2bc | 10 | |||
| 2.0 | 264.0ef | 223.7ef | 171.1abc | 114.0bc | 46.5abc | 41.1abc | 4.2cde | 30 | |||
| 10 | |||||||||||
| Control | 401.5abcd | 401.5abcd | 139.5e | 107.0c | 33.2d | 33.9cd | 4.9bcd | 0 | |||
| 1.0 | 500.5a | 489.5a | 166.4abc | 123.6ab | 44.7abc | 38.0bc | 6.5b | 0 | |||
| 1.5 | 495.0a | 484.0a | 168.3abc | 117.4abc | 48.9a | 40.6abc | 9.3a | 20 | |||
| 2.0 | 506.0a | 500.5a | 158.7cd | 111.5bc | 44.5abc | 42.2ab | 9.6a | 70 | |||
| CV (%) | 21.5 | 23.8 | 5.5 | 7.2 | 8.3 | 11.4 | 26.6 | - | |||
| Lovation (L) | NS | ** | *** | NS | * | *** | *** | - | |||
| Planting density and Fertilizer (P) | *** | *** | *** | ** | ** | NS | *** | - | |||
| LⅹP | NS | NS | NS | NS | *** | NS | *** | - | |||
* Abbreviations: RPF (reclaimed paddy field-Dangjin); GPF (general paddy field-Daejeon); Planting density: 16cm interval; 10cm interval; Fertilizer: control (0%); 1.0 (200kg/ha); 1.5 (300kg/ha); 2.0 (400kg/ha); LAI (leaf area index). † ‘***’p value<0.001, ‘**’p value<0.01, ‘*’p value<0.05, ‘ns’ non-significant.
Table 2.
Rice feed values in reclaimed and general paddy fields during the yellow ripe stage.
| Location | Planting density | Fertilizer | CP | NDF | ADF | TDN | Hemicellulose | RFV |
|---|---|---|---|---|---|---|---|---|
| (%) | ||||||||
| RPF | 16 | |||||||
| control | 9.7bcd | 59.7d | 37.0abcd | 59.7abcde | 22.7abc | 94bc | ||
| 1.0 | 8.3cde | 61.2d | 36.1abcd | 60.4abcde | 25.1ab | 92bc | ||
| 1.5 | 9.7bcd | 62.1d | 37.8bcd | 59.0bcde | 24.2abc | 89bc | ||
| 2.0 | 9.9bc | 63.1d | 36.1abcd | 60.4abcde | 27.0a | 90bc | ||
| 10 | ||||||||
| Control | 7.3ef | 57.4d | 36.2abcd | 60.3abcde | 21.2abc | 98bc | ||
| 1.0 | 10.0b | 60.5d | 36.4abcd | 60.1abcde | 24.0abc | 93bc | ||
| 1.5 | 8.1de | 62.5d | 37.5bcd | 59.3bcde | 25.0ab | 89bc | ||
| 2.0 | 10.6ab | 61.9d | 41.0d | 56.5de | 20.9abc | 86bc | ||
| GPF | 16 | |||||||
| Control | 4.9g | 53.9bcd | 36.4abcd | 60.2abcde | 17.6abc | 104a | ||
| 1.0 | 6.2fg | 59.1d | 35.5abcd | 60.8abcde | 23.6abc | 96bc | ||
| 1.5 | 10.6ab | 63.4d | 39.7cd | 57.6cde | 23.7abc | 85bc | ||
| 2.0 | 11.7a | 55.2cd | 31.8abc | 63.8abc | 23.4abc | 108a | ||
| 10 | ||||||||
| control | 5.6g | 46.6abc | 30.4ab | 64.9ab | 16.2bc | 130a | ||
| 1.0 | 9.3bcd | 45.9ab | 32.0abc | 63.6abcd | 13.9c | 130a | ||
| 1.5 | 8.3cde | 43.4a | 28.2a | 66.6a | 15.2bc | 144a | ||
| 2.0 | 10.9ab | 63.6 | 43.2d | 54.7e | 20.3abc | 81c | ||
| CV (%) | 10.0 | 8.7 | 12.6 | 5.9 | 25.3 | 11.7 | ||
| Lovation (L) | ** | *** | NS | NS | ** | *** | ||
| Planting density and Fertilizer (P) | *** | ** | * | * | NS | *** | ||
| LⅹP | *** | ** | NS | NS | NS | *** | ||
* Abbreviations: RPF (reclaimed paddy field-Dangjin); GPF (general paddy field-Daejeon); Planting density: 16cm interval; 10cm interval; Fertilizer: control (0%); 1.0 (200kg/ha); 1.5 (300kg/ha); 2.0 (400kg/ha); CP (crude protein); NDF (neutral detergent fiber); ADF (acid detergent fiber); TDN (total digestible nutrient); RFV (relative feed value). † ‘***’p value<0.001, ‘**’p value<0.01, ‘*’p value<0.05, ‘ns’ non-significant.
Disclaimer/Publisher’s Note: The statements, opinions and data contained in all publications are solely those of the individual author(s) and contributor(s) and not of MDPI and/or the editor(s). MDPI and/or the editor(s) disclaim responsibility for any injury to people or property resulting from any ideas, methods, instructions or products referred to in the content. |
© 2023 by the authors. Licensee MDPI, Basel, Switzerland. This article is an open access article distributed under the terms and conditions of the Creative Commons Attribution (CC BY) license (http://creativecommons.org/licenses/by/4.0/).
Copyright: This open access article is published under a Creative Commons CC BY 4.0 license, which permit the free download, distribution, and reuse, provided that the author and preprint are cited in any reuse.


