Submitted:
03 November 2023
Posted:
06 November 2023
You are already at the latest version
Abstract
The Developing Countries Vaccine Manufacturing Network coordinated a multi-laboratory study funded by the US National Institute for Innovation in Manufacturing Biopharmaceuticals to assess the performance of the Pertussis Serological Potency Test (PSPT) in the laboratories of seven whole-cell pertussis vaccine (wP) manufacturers and three National Control Laboratories based in Southeast Asian countries. To this end, common protocols for the immunization of mice and serological testing by ELISA were shared with all laboratories. Each laboratory used their own wP vaccines and the reference vaccine routinely used in the regulatory required mouse protection test (MPT) and assayed the products both in the MPT and PSPT. Whereas in all laboratories the PSPT showed decreased serum IgG levels after immunization with sub-potent compared to potent final batches, some issues were encountered during execution of the assay, which prevented drawing of definitive conclusions on assay performance. Nevertheless, the study provided the participants with the opportunity to familiarize themselves with the PSPT protocols and revealed the next steps to be addressed for implementation of the method.
Keywords:
whole-cell pertussis vaccines
; combined vaccines
; ELISA
; potency testing by serology
; Animal testing alternatives
; 3Rs principle
1. Introduction
Since 1959, when Russel and Burch published their recommendation introducing the 3Rs Principle (Replacement, Reduction and Refinement) for the use of animals for scientific purposes, animal welfare has drawn the attention of legislators in European countries. In 1986 the European Convention on the Protection of Vertebrate Animals used for Experimental and other Scientific Purposes (CoE ETS 123) was signed. The principle of the Convention was included in the Directive 86/609/EEC on the protection of animals used for scientific purposes and regulated by the Directive 2010/63/EU 2 [1].
Since then, several organizations, such the Biological Standardization Programme (BSP) of the European Directorate for the Quality of Medicines and Healthcare (EDQM), the European Centre for Validation of Alternative Methods (ECVAM) and the World Health Organization (WHO) have been funding studies to develop in vitro alternatives for animal based batch potency and safety tests of vaccines, and whenever in vitro assays could not be used, reduction and refinement of in vivo tests have been proposed. The efforts to move away from in vivo assays were further reinforced by the institutionalization of new paradigms of production and quality assurance, like reliance on Good Manufacturing Practices (GMP) and the application of the Consistency Approach [2,3,4]. For legacy vaccines, been in the market for many years and shown to be safe, potent and efficacious, the use of alternative tests is foreseen once consistency in production and quality control has been further confirmed on a continuous basis.
The potency assay, a critical quality attribute used for assuring the biological properties of vaccines, is associated with its efficacy. By replacing an in vivo potency assay with an in vitro test, good results have so far been obtained for different viral vaccines consisting of purified antigens (Hepatitis, Inactivated Poliomyelitis, etc.), that are quantified in the vaccine by immunoassays [5,6]. These new in vitro assays have been accepted for batch consistency control and were included in the international or national Pharmacopoeias (e.g., European Pharmacopoeia - Ph. Eur.) and in the Technical Report Series of WHO.
For some bacterial legacy vaccines, such as Diphtheria and Tetanus vaccines, in vitro potency tests are not yet available. Promising in vitro tests have been developed by the VAC2VAC consortium, but these methods need further evaluation in the future [7]. Thus, so far, the only potency alternative test recognized for Diphtheria and Tetanus vaccines by the Ph. Eur. and by WHO is a refinement of the existing in vivo challenge assay by a serological assay [8,9,10]. While the original potency test uses animal death as a read-out, the serological method measures the capacity of the vaccine to induce specific protective antibodies in mice or guinea-pigs, that are determined in vitro using a suitable immunochemical method, such as the enzyme-linked immunosorbent assay (ELISA). Diphtheria and Tetanus vaccines are usually combined with Pertussis vaccines. Acellular Pertussis vaccines (aP) have been adopted by western countries, while whole-cell Pertussis (wP) vaccines are still widely used for routine vaccination in low and middle income countries [11]. Because of an increase in Pertussis incidence in countries where aP is used in the vaccination programs [12] and the fact that wP vaccines provide better and longer-lasting immunity [13,14] than aP, the World Health Organization recommends that a switch from whole-cell to acellular Pertussis vaccines for primary immunization in infants should only be considered if additional periodic boosters or maternal immunization are ensured and sustained in the national immunization schedules [15]. Thus, it is expected that wP vaccines will remain the vaccine of choice in large parts of the world.
wP vaccines consist of inactivated Bordetella pertussis bacteria, usually 2 or more strains in appropriate proportions. The potency of a wP vaccine is determined using the Mouse Protection Test (MPT; also known as Kendrick test) by comparing the vaccine dose necessary to protect mice against a lethal, intracerebral administered challenge dose of B. pertussis strain 18323, with the quantity of a reference preparation, calibrated in International Units [16].
Although, the MPT has been used for a long time, its use has been disputed for various reasons. The MPT generally suffers from high variability and consequently often fails to meet the statistical validity criteria of the test acceptance. Whenever the statistical validity criteria are not met, vaccine batches must be re-tested, at the cost of time and at least 100 mice per test.
Since death is the read-out, mice experience severe pain and distress during and after the intracerebral injection procedure. Additionally, the intracerebral challenge is a technically difficult procedure to perform, so both from an animal welfare and assay reproducibility perspective the need for an alternative to the MPT is widely recognized. Several attempts have been made to develop an alternative potency test for wP vaccines to be applied for routine quality control by manufacturers and NCLs. In comparison to the respiratory challenge assay and nitric oxide induction assays, which are quite difficult and complicated methods to be used as routine test, the mouse Pertussis Serological Potency Test (PSPT) seems the most promising test for this purpose [17,18,19]. This serological method was developed as a refinement of the potency test for wP vaccines by Van der Ark et al. [19]. It was observed that the survival of young mice, immunized with wP vaccine as part of the MPT, could be predicted by the antibody concentration present on the challenge day with B. pertussis strain 18323. Many of the antibodies were found to be raised against the surface antigens of the challenge strain and for this reason inactivated bacteria of B. pertussis, strain 18323, was chosen as coating antigen in the whole-cell ELISA that forms a crucial part of the PSPT. Thus, the PSPT, based on the in vivo IgG antibody response, mimics a specific element of the complex immune response that occurs in the MPT and can be used as surrogate of protection to show the biological activity of wP vaccine products already proven to have a well-established safety and efficacy profile.
PSPT suitability has already been demonstrated in earlier small-scale collaborative studies funded by different sponsors [20,21,22]. However, evaluation of the PSPT by large-scale multi-center validation collaborative studies was never started as this kind of vaccine is no longer produced by multinational European based-companies. Today, wP vaccines are mostly produced by companies belonging to the Developing Countries Vaccine Manufacturing Network (DCVMN), and these vaccines – many of whom are WHO prequalified and supplied to UNICEF, PAHO etc. for the vaccination campaigns these agencies support globally – are considered key for pediatric immunization in the developing countries.
In light of the challenges posed by the MPT, the will to apply the 3Rs Principle for their routine batch release testing of wP vaccines, and the promising results obtained in the previous studies on PSPT, DCVMN’s manufacturers expressed their interest in assessing its applicability to the batch testing of their wP vaccines. These vaccines are of the multivalent kind, with wP combined with Diphtheria and Tetanus (trivalent vaccine, DTwP), and other types of antigens like Hepatitis B (tetravalent vaccine, DTwP-HepB), the glycoconjugate of Haemophilus influenzae type b (pentavalent vaccine, DTwP-HepB-Hib), or HepB, Hib and Inactivated Polio vaccine (Hexavalent vaccine, DTwP-HepB-Hib-IPV) in the presence of aluminium hydroxide/phosphate as adjuvant [23].
To explore PSPT’s feasibility, a multi-laboratory study was designed by the wP vaccine manufacturers and National Control Laboratories (NCLs) with the facilitation of DCVMN and the scientific and technical support of a dedicated Steering Group, with the objective to evaluate the PSPT in mice following a protocol that previous studies had developed but not validated [19,20]. The project – named “International assessment of the PSPT in mice to replace the intracerebral-challenge Mouse Protection Test (MPT) for whole-cell Pertussis (wP)” – was submitted to the National Institute for Innovation in Manufacturing Biopharmaceuticals (NIIMBL) and funded through its Global Health Fund [24].
Its main goal was assessing the performance of the PSPT in the laboratories of the participating manufacturers and NCLs, where each would use their own multivalent vaccines.
2. Materials and Methods
2.1. Project Participants
Seven vaccine manufacturers and three NCLs participated in the PSPT study on a voluntary and non-remunerated basis. The participants are listed by organization and country in Appendix A. They are referred herein by a randomly allocated code number.
2.2. Project Design
The project was carried out under the supervision of the appointed Steering Group. The project study included the testing by MPT and PSPT of a wP reference vaccine and three different wP vaccine batches produced by the manufacturers, or designated by the NCLs, indicated throughout the manuscript in the following way: FL1, FL2 tested twice in the PSPT (FL2A and FL2B), FL3 tested unaltered and FL3-Alt tested after heat treatment (see §2.3). The FL1 vaccine was used not only as a test vaccine, but also as a proposed internal (in-house) reference standard vaccine (see §2.3). The intracerebral MPT was performed to check that the vaccines used in the PSPT were compliant and that the altered FL3 vaccine was of reduced wP potency. The MPT was carried out as described in §2.5.
The PSPT was performed in each laboratory as indicated in pre-prepared protocols (see § 2.6.1 and 2.6.2). Each laboratory was requested to select one of two study design options (Figure 1) which could be used for evaluations of assay (within-run) variability, batch-to-batch variability as well as suitability of the PSPT to detect a decrease in potency of a deliberately altered lot in each laboratory.
The replicate testing of FL2 (FL2A and FL2B) in Design Option 1 and 2 was used to obtain a preliminary assessment of within-run variability. Three batches produced and tested by participating manufacturers contributed to a preliminary assessment of batch variability (consistency in batch production). Variability of batches tested by NCLs was not considered in the inter-batch variability assessment. Comparisons of results for the unaltered and altered batch (FL3 and FL3-Alt) were used to assess the ability to detect decrease in potency measured using the PSPT in each laboratory.
2.3. Test and Reference Vaccines
Each participant used their own licensed wP containing vaccine as well as the reference standard vaccine in use in the MPT (Table 1). NCLs used vaccine batches received for batch release with consent of the respective manufacturer.
Eight participants used batches of a pentavalent vaccine, i.e., DTwP-HepB-Hib, one-participant used batches of a hexavalent vaccine (DtwP-HepB-IPV-Hib), and one participant used batches of a trivalent vaccine (DTwP). The content of wP in terms of opacity units (OU) per mL of vaccine is indicated for each laboratory in Table 1.
Each manufacturer’s laboratory tested three batches of their wP containing vaccine. NCL 1310 has tested three batches from the same manufacturer; NCL 7132 and 7452 have tested vaccines of the same combination, but from three and two different manufacturers, respectively.
Batch designated as FL3 was altered by each participant according to a common protocol through incubation at 43-45°C for 21 days under slight agitation. These conditions were selected to reduce MPT potency by about 60% [25,26].
Each participant was required to use the wP reference vaccine currently in use in the MPT (Table 1): (i) the WHO 4th International Standard (IS4) for pertussis vaccine (lyophilized inactivated, Bordetella pertussis, 40 IU/ampoule, 150 OU/ampoule, NIBSC code 94/532); (ii) the pertussis Regional Working Reference Standard (RWRS 01/11, 63 IU/vial, 300 OU/vial); (iii) the Pertussis National Reference Standard (IPRS/20/PERT, potency of 75 IU/vial, 300 OU/vial) recognized by the Indian Pharmacopeia; (iv) an in-house reference vaccine (STBF 2015-1, 62 IU/vial). RWRS, IPRS and in-house reference (all indicated as external reference standard (ERS) or reference vaccine throughout the paper) were calibrated against the WHO 4th International Standard in the MPT. RWRS and IPRS unitage was assigned based on collaborative studies by the Indian Pharmacopeia.
2.4. Mice and Their Evaluation for Absence of Bordetella spp.
Participants were recommended to use the mouse strain currently in use for the MPT also in the PSPT (Table 2).
All mice were bred under SPF conditions, which was certified by the respective commercial breeder or by the manufacturer’s breeding facility. The health status of the animals was recorded at arrival and monitored during the experiments by comparison with sentinel animals (data not shown). Sentinel mice (n = 9) were of the same cohort of animals used for MPT and PSPT testing, housed in the same animal room but were not immunized. Prior to the start of the study, three of the nine sentinel animals were screened individually for pre-existing antibodies versus the ELISA coating antigen (see §2.6.2) and /or presence of infection against Bordetella spp (B. pertussis, B. parapertussis, B. bronchiseptica) by an appropriate method (PCR for Bordetella spp. on mouse serum, liver/lung/heart tissue or by commercial kits). If none of the mice was found positive, the batch of animals was considered suitable for the study. On the post-study bleeding day (day 28; see § 2.6.1), serum samples obtained from the remaining six sentinel mice/room were all tested in the PSPT-ELISA to determine the absence of wP-specific antibodies. Animal studies were reviewed and approved by the respective institutional animal ethics committees.
2.5. Intracerebral Mouse Protection Test (MPT)
Vaccine batches were tested for pertussis potency by the intracerebral MPT. Each study participant performed the test according to routine wP batch potency determination in mice by challenge as per the relevant WHO Manual [16]. Briefly, mice were randomly distributed across the dilution groups of the reference vaccine and test batches. After an acclimatization period, groups of animals, weighing 12-16 g, were immunized (16 mice/dilution group) intraperitoneally (i.p.) with 0.5 mL of a three to five-fold dilution series of the wP vaccine under study and of a reference vaccine, respectively. Fourteen days after immunization, animals were challenged with a lethal dose of B. pertussis, strain 18323, by intracerebral route and monitored for clinical signs of pertussis and death up to day 28. Negative control (injected intracerebrally with casamino acids) and positive control (naive mice, injected with the challenge culture as a virulence check of challenge culture) animal groups were used to monitor the challenge procedure. The relative potency was expressed in International Units (IU) calculated by comparing the effective dose of the test vaccine to the reference vaccine using parallel probit analysis. A batch passed the test if it had a potency of not less than 4.0 International Units (IU) per single human dose (SHD) and the lower fiducial limit (P = 0.95) of the estimated potency was not less than 2.0 IU per SHD [16]. A schematic overview of the MPT is shown in Figure 2.
2.6. Pertussis Serological Potency Test (PSPT)
2.6.1. Immunization of Mice and Preparation of Serum Samples
The mouse PSPT was performed as previously described [19]. Briefly, groups of 12 mice (equal number of female and male animals, or animals of the same gender, and target weight 20-24 g), were randomly subdivided into four dose groups. Each group of animals was immunized at day 0 with one of the 4 doses of an ERS or test vaccine. Animals were immunized i.p. using a 2.5 mL syringe fitted with a “ Gx1” needle with a dose of 0.5 ml dilution/mouse. The ERS was administered at a dose of 5.0, 2.5, 1.25 and 0.625 IU/mouse in a total volume of 0.5 mL. Test vaccines (16 – 32 Opacity Units (OU)/mL) were injected as 10-fold (50 µL of vaccine + 450 µl diluent), 20-fold (25 µL of vaccine + 475 µl diluent), 40-fold (12.5 µL of vaccine + 487.5 µl diluent), 80-fold (6.25 µL of vaccine + 493.8 µl diluent) dilutions in a total volume of 0.5 mL. Twenty-eight days after immunization, all animals were bled under anesthesia (cardiac or retro-orbital puncture) and individual blood samples were collected, processed, divided in aliquots (200 µL) and stored at -20°C. A schematic overview of the PSPT is shown in Figure 3. The detailed protocol is available here: https://dcvmn.org/pspt-consortium/
2.6.2. PSPT Whole-Cell ELISA (WCE)
The PSPT WCE to detect B. pertussis specific IgG antibodies was performed on individual mouse sera obtained at 28-days post immunization [19]. Briefly, flat-bottomed polysorb microtitre plates were coated with 100 μL/well of a 0.25 OU/mL suspension of inactivated whole-cell B. pertussis strain 18323 in PBS (prepared ad hoc for this study, see §2.7), and incubated at 37°C overnight without lid to allow the liquid to evaporate. Non-specific binding sites of the plates were blocked with a 1% solution of BSA in PBS (150 μL/well) at 37 °C for 1 h and washed three times with a solution of 0.05 % Tween 80 in distilled water. Sera diluted in PBS with 0.5 % w/v BSA and 0.05 % Tween 80 were added (100 μL/well) and incubated at 37 °C for 1 h. After washing, 100 μL of goat anti-mouse HRP IgG conjugate were added and plates were again incubated at 37°C for 1 h. After washing, 100 μL of substrate (TMB) was added. The plates were incubated at room temperature for 10 min. The detection reaction was stopped by addition of 100 μL of 0.2M H2SO4. Absorbance at 450 nm was measured with an automated microtiter plate reader. All plates included a blank which absorbance was subtracted from the absorbance of positive and negative control sera (see § 2.8), sera of mice injected with the ERS and the test samples. Reagents, other than the WCE coating antigen, were from different brands and therefore not indicated in this section.
A defined plate layout was provided to all participants as the absorbance values (OD450 nm values) had to be imported into an EXCEL® spreadsheet designed during the project for calculating the serum IgG concentrations (Ab, EU/mL; here also indicated as titer). Titers for individual mouse sera were determined by interpolation off of a four parameter logistic fit to the concentration response data of the positive control. It is noteworthy that the concentration of the first positive control level was arbitrarily set to 100 IU/mL without loss of interpretability. Dilutions of test sera which fell within the dynamic range of the positive control fit (20% to 80%, where 0% corresponds to the lower asymptote of the curve and 100% the upper asymptote) were interpolated (calibrated) off the curve, dilution corrected, and the serum titer reported as the geometric mean of the resolved dilutions. The protocol is available here: https://dcvmn.org/pspt-consortium/
2.7. WCE Coating Antigen
DCVMN donated to all participating laboratories, for its use in the PSPT study, a standardized, thoroughly characterized batch of coating antigen of inactivated B. pertussis strain 18323. The company, BioLyo Technologies (Gent, Belgium) was contracted by DCVMN for the production of a large-scale coating antigen batch. A total of 2080 lyophilized vials with inactivated B. pertussis strain 18323 (ATCC, code 9797), 25 OU/vial, were generated. Intravacc (Bilthoven, The Netherlands) was appointed by DCVMN for the characterization of this newly produced coating antigen batch. Characterization showed that the overall protein content of the newly produced batch was comparable to a previously produced reference batch (produced using a different process) and used in the earlier collaborative studies [20,21] and included a wide range of virulence factors. The newly produced coating antigen batch proved to have similar IgG-binding properties as the previously tested batch which was able to distinguish sera induced by potent and sub-potent vaccines generated in an earlier collaborative study (data not shown).
The coating antigen is now available in the product catalogue of MHRA/NIBSC: Bordetella pertussis 18323 coating antigen, NIBSC code 23/150 (https://nibsc.org/products/brm_product_catalogue/detail_page.aspx?catid=23/150).
2.8. Preparation of Pertussis Positive and Negative Control Sera for the WCE
The wP positive control serum (wP-ms-Pos, or PC) was generated in each laboratory and consisted of a homologous pooled serum obtained by immunization (i.p.) of 15 mice with the highest dose of the particular ERS used by each laboratory. At 28 days after immunization, mice were bled and the serum of each animal was assayed in the WCE (see §2.6.2). Individual mouse sera with similar high antibody concentrations were pooled and this positive control serum was stored in aliquots at -20°C. In the PSPT WCE, the positive control serum was pre-diluted 1/400 and then further diluted 2-fold through 8 dilutions to obtain a standard curve. To the dilution in the first well of the dilution series, a value of 100 EU/mL was assigned.
The wP negative control serum (wP-ms-Neg, or NC) was obtained from non-immunized mice of the same cohort for the study, after confirmation of absence of Bordetella spp. and/or coating antigen-specific antibodies in WCE (see §2.6.2). The NC serum was aliquoted and stored at -20°C. The NC was diluted at 1/400 in each run of the assay.
2.9. Statistical Methods
Determination of mouse serum Ab content was carried out according to §2.6.2 in a data collection and Ab determination EXCEL® spreadsheet utilizing the SOLVER function to fit the PC data. Mouse sera below the lower limit of the dynamic range of 20% were judged to be “negative” and assigned an Ab concentration equal to 2.5 EU/mL.
Individual mouse titers across doses of the reference and test vaccines were used to perform parallel line analysis (PLA) using Combistats© [https://www.edqm.eu/en/combistats-tm]. Analyses were performed using both the ERS (NRS/RWRS, in-house reference or the WHO IS) and an internal reference standard (IRS) vaccine (FL1) as reference vaccines. Data were manually screened and mouse responses (OD) below the value of the first dilution of the negative control were eliminated from the analyses and treated as non-responding mice (i.e., negative). Doses showing non-monotonic behavior relative to other doses in a concentration series, and low doses with a high proportion of negative responses (more than 6/12 mice) were likewise eliminated before performance of the PLA. The model that was selected for PLA was:
where and are the natural logs of the mouse titers and vaccine doses, “i” indexes Standard or Test vaccine, “j” indexes dose, and “k” indexes mouse, is the intercept for the ith vaccine (standard or test), and is the common slope of the regression for the two vaccines. From this the estimated relative potency () is calculated as:
Tests of assumptions (parallelism and linearity) were performed according to methods described in Ph. Eur. Chapter 5.3 Statistical Analysis of Results of Biological Assays and Tests [27]. A failure of an assumption is earmarked when the p-value is less than or equal to 0.05. A confidence interval scaled to the estimated relative potency was calculated per Ph. Eur., which was held to a provisional acceptance criterion of being within 50% to 200% (per requirement in the MPT).
Assay (within-run) and batch-to-batch variabilities were assessed using variance component analysis on natural log (ln) potencies obtained from samples tested using the design selected in each laboratory. The factor associated with vaccine batch was treated as a random effect in the analyses. Assay (, from replicate testing of FL2) and batch (, from the 3 batches in the manufacturing laboratories) variance component estimates were used to report assay and total () variabilities for each laboratory. Results are reported as percent geometric coefficient of variation (%GCV) per United States Pharmacopeia (USP), General Chapter <1033> Biological Assay Validation [28]:
The ability to detect decreases in potency was measured from FL3-Alt versus FL3 as percent reduction (%Red) in their relative potencies:
3. Results
3.1. Determination of wP Vaccine Induced IgG Responses by WCE
No sentinel mouse sera were found positive for Bordetella spp. in all laboratories. Therefore, each lab carried out the WCE as specified in the study protocol and used the data collection and the Ab calculation EXCEL® spreadsheet. Initial testing of mouse sera resulted in a variety of PC curve features. A sampling of 4PL curves and parameter estimates, obtained early in this study are presented in Figure 4: panel (a) with a PC curve with acceptable features; panel (b) with an incomplete lower asymptote and a hook effect; panel (c) with incomplete lower and upper asymptotes and a shallow slope. Panels (b) and (c) exhibit low maximum responses (≤ 2.0 OD450 versus panel (a) near 3.0 OD450). Many labs exhibited lab features which were not acceptable as compared to the curve in panel (a). While this may not have impacted interpolation, it did yield inaccurate assessment of the dynamic range of the curve, and thus the reliability of interpolated values.
Subsequent to these observations interviews were conducted with each laboratory providing recommendations to optimize WCE performance, including studies to identify an optimal conjugate dilution by titration and changes to the dilution series of the WCE PC and of test samples. A number of features of an acceptable PC curve were given: (i) at least two points on or near the lower and upper asymptotes; (ii) monotonically increasing dose response across the range of the curve (e.g., no “hook” or prozone effects on the upper asymptote); (iii) at least 4 points in the dynamic range.
3.4. Determination of Relative Potencies of wP Vaccine Batches by PLA
PLA was performed on dose response of test batches of vaccines versus an ERS and an IRS (see §2.3). Interpretation of results reflects, in part, the mechanism by which PLA is used to determine relative potency (RP) of a test batch to a reference vaccine. Linear regression was performed on log titer versus log dose for both the test and reference vaccines. The natural log (ln) of dose is used in the calculations. An idealized depiction of the calculation of relative potency is shown in Figure 5.
The ln(RP) represents the horizontal shift of the test vaccine dose response relationship from the reference vaccine dose response relationship. The principle of RP is that a test batch acts as a dilution (shifted to the right) or a concentration (shifted to the left) of the standard. The RP is obtained by using the antilog of the log base used in the analysis, in this case the Napierian base, e. The assumptions for a valid RP are that the dose response relationships are linear, i.e., these can be fit with a simple linear equation, and that the dose response profiles are parallel, i.e., the profiles have equal slope coefficients. It is worth noting that the underlying vaccine dose kinetics model is 4PL, the same as used in the WCE. This understanding and the fact that PLA is sensitive to the location on the full (4PL) dose response curves of the reference vaccine and test batches, form the basis for interpretation of the PSPT Project PLA results.
In general, test batches seemed to be “under-dosed” in relationship to the particular ERS used. Under-dosing was determined to be about 5-fold to 12.5-fold lower than the target doses. This resulted in excessive numbers of negative sera at lower doses. A plot of the sum of the proportions of negative mice across laboratories (cumulative proportions in percent; mostly based on 12 mice per dose when mice were not eliminated due to probable laboratory errors) is shown in Figure 6.
This tendency for higher numbers of negative mice at lower doses resulted in frequent violations of the assumptions for PLA (linearity and parallelism) and excessively wide confidence intervals (CI) expressed around the estimated relative potency of test batches. Illustrations of the consequences of high proportions of negative mice on these assumptions and the variability, thereby the width of the confidence interval, are shown in Figure 7.
Statistical curvature (nonlinear) is observed for a sub-potent batch due to the negative boundary and abundance of points at lower doses. Non-parallelism is primarily due to a sub-optimal (linear) fit where a slope is heavily influenced downward towards the clusters of negatives at lower doses. A poor fit results when the lines are forced to be parallel, resulting in large deviations between individual mouse responses and the fitted lines (arrows) and resultant wider confidence intervals. A summary of conformance to assumptions and conditions across laboratories when test batches were analyzed together with an ERS is presented in Table 4.
Conformance to the assumptions (linearity and parallelism) was achieved in seven of the ten laboratories. All, except one laboratory, failed to meet the 95% confidence limits (50%-200%) of the estimated potency. Noteworthy is that the width of the confidence interval signifies excess intra-run variability (high proportions of negatives), which can result in false negative conclusions for parallelism and linearity. Hence, the variability is “masking” the underlying nonlinearity and lack of parallelism between the test batches and the ERS, i.e., the low failure rates for linearity and parallelism may be due to false negatives. This was acknowledged during the publication of the USP General Chapters related to Bioassay [28] and will be elaborated on further in the Discussion (§4). Because of the under-dosing (and resulting high proportion of negatives at lower doses) a conclusion about the use of the ERS as a reference vaccine cannot be reached at this time.
A summary of conformance to assumptions and conditions across laboratories when test batches were analyzed versus an internal homologous vaccine (IRS) used as reference vaccine is presented in Table 5.
Conformance to the assumptions when using an IRS was achieved in six of the ten laboratories. There were, in addition, fewer instances of a failure to meet the condition on the range of the confidence interval (4 out of 10 laboratories). This is likely due to homology among IRS (different batch of the same vaccine type) and test vaccines (except in two of the three NCLs that tested vaccines versus a vaccine with similar composition, but not homologous).
3.5. PSPT Project Results
The PSPT project goals were to assess i) assay variability (within-run variability), ii) batch variability, and iii) the ability to detect decreases in potency across a panel of 10 laboratories. Evaluations were performed in correspondence to the validity rules elaborated in the Statistical Methods (§2.9). The additional condition that the confidence interval should lie within 50% to 200% of the estimated relative potency was evaluated as a preliminary assessment of the quality of the PSPT results.
3.5.1. Assay and Batch Variabilities
Assay variability from FL2A and FL2B and batch based on variability among manufactured batches FL1, FL2 and FL3 were assessed in each laboratory. Calculations were performed per § 2.9, yielding estimated variance components for assay and batch, their total (), and their respective % GCV’s for each laboratory (Table 6).
Whitin-run variability was similar among laboratories, especially when comparing to IRS FL1. For laboratories 2673 and 5544, the high results achieved when testing against the ERS are due to the use of non-optimal doses of test lots in the two laboratories.
The pattern of total variability is similar to that of within-run assay variability due to its large influence on total variability.
3.5.2. Detection of the Altered Batches by MPT and PSPT
All heat-treated vaccines (FL3-Alt) had a reduced potency in the MPT and, except those of laboratory 2673 and 4900, were non-compliant as the lower confidence limit was less than 2 IU/SHD. The percentage in potency reduction is reported in the Table 7, both for vaccines tested in MPT and in PSPT. The potency decrease is evident also in PSPT. The percentage reduction in potency is not always in line between MPT and PSPT. This can be related to the use of under dosing of the test vaccines. This is demonstrated by the in line results of participant 2673 that repeated the PSPT using optimal test vaccine doses. The potency value, in contrast, is not expected to be the same as that of the MPT, as the two assays are based on different measurements criteria, i.e. protection (functional antibodies activity) versus antibody response (binding activity).
4. Discussion
Compared to the previously performed smaller PSPT studies [20,21], where participants were supplied with sets of anonymized vaccines (reference and test samples) as well as the essential reagents, participants to this multi-laboratory study received from DCVMN secretariat only the protocols for the immunization of mice and for testing the sera in an ELISA (which were developed in the previous PSPT studies), the coating antigen, and tools for data collection and processing. Each participant used their own licensed wP containing vaccine as well as the reference standard vaccine in use in the MPT, while NCLs used vaccine batches received for batch release with consent of the respective manufacturer.
In the expected 18 months of the project duration, later extended to 24 months, manufacturers and NCLs tested the products within the framework of their quality assurance system (internal protocols for animal housing, validation of instruments, use of raw materials and reagents, etc.) with the understanding that the PSPT protocols would require product specific optimization and validation and that the PSPT might be used as an assay for consistency testing of vaccines already present on the market since a number of years (three laboratories, after their participation to the PSPT project, have started to optimize the new method for the batch release testing of their products - personal communication).
As a first step of the project, the need of a large batch of WCE coating was identified. The WCE coating antigen is a critical reagent and, as often occurs when new 3R-based methods are proposed, assay specific reagents are commercially unavailable. Thus, the DCVMN secretariat contracted the service provider, BioLyo Technologies, to produce a large lyophilized batch of vials with coating antigen to be used only for research purposes. The overall protein profile and antigenic characteristics of the batch produced was characterized by Intravacc to show that the new batch was comparable to the coating material previously produced at laboratory-scale and used in the studies funded by the Dutch Platform on Alternatives to Animal testing [20] and by ECVAM [21].
Material procurement challenges were encountered since some of the reagents indicated in the protocols were not available or not distributed in countries of some of the participating laboratories. These procurements related challenges were further exacerbated by the logistic and supply complexities related to the COVID-19 pandemic. These and various other difficulties were addressed by the Steering Group by organizing workshops dedicated to the clarification of protocols and serving as forums where laboratories could share their questions and experiences. With this support, all laboratories were able to execute the PSPT. The PSPT's applicability for testing the potency of the different manufacturer’s products was assessed by evaluating assay variability (within laboratory variability), wP potency variability among batches and the ability to discriminate between potent, MPT compliant, and sub-potent MPT non-compliant batches.
Initial analyses performed, produced an unexpectedly high proportion of negative responses in the WCE at low doses of the test vaccines, which resulted in statistical failures during PLA data processing and excessive uncertainty in the estimation of relative potency (as measured by a confidence interval).
Although non- and low-responding mice were also found in a previous small collaborative study where procedures, vaccines and essential materials were all supplied to standardize the test [20], a high number of negative responses at low test vaccine doses was observed for all of the participating labs of this study. This points towards sub-optimal dose ranging of the test vaccines, an unexpected issue since the dose range used did not cause any problems in previous PSPT studies.
In the present study, the PSPT was used to test multivalent vaccines from seven different manufacturers in which the wP component was combined differently with antigens not always present in the wP vaccines tested in the previous studies, such as HepB, IPV or Hib [20,21]. In addition, van der Ark et al. did not rely on an External Reference Standard – in the case of this project, the WHO wP International Standard as well as the Indian Regional/National wP vaccine standard, all used also in the MPT – but used instead as reference vaccine an in-house plain whole cell B. pertussis vaccine [19,20] that contained the same strains present in the DTwP-IPV vaccine produced also in-house. These differences with earlier studies may be the reason why the dose range of test vaccines used in the previous and present study turned out to be sub-optimal. Importantly, the change in dose-ranging by one participating laboratory performing a 2nd experiment during this project, confirmed the need for laboratories to perform dose-ranging experiments with their vaccines prior to future validation and routine use of the PSPT in their laboratories.
As the full-dose response of the vaccines follows a “sigmoid” relationship of log dose versus response (here log response due to the statistical properties of WCE responses), doses of the ERS and test batches must be selected so that linear and parallel series of responses (mouse sera antibody concentration) are generated for both reference and test vaccines.
The linear series shall be selected from an appropriate portion of the total curve. This can be the middle of the sigmoid or the lower exponential portion (called log-log, as designed and analyzed in this study). In this setting, the test vaccines should be approximately equipotent to the reference vaccine in order to ensure that dose response relationships are linear and parallel.
The WCE method also posed challenges, especially in those laboratories that had more limited experience in optimization and performance evaluation of ELISA-based methods. To address them, remote training, technical support through 15 monthly workshops, and email communications between the participants and the Steering Group were put in place early on in the project. Nevertheless, as a number of laboratories still encountered technical issues, one-on-one interviews between the Steering Group and each of the laboratories were organized to help solve the identified problems. Following these interviews, additional actions were communicated to the laboratories, which included titration of the conjugate (to a level that yielded symmetric positive control curves), using a 2.5- versus a 2-fold dilution series of the positive control, and selection of a different initial dilution of the positive control and test samples. Improvements in ELISA results were obtained after implementation of the recommended actions by some of the laboratories that could perform additional testing of sera (data not shown). In light of the time constraints and ethical concerns, repeat testing of the immunization portion of the assay was performed only by one laboratory.
Other issues included a high response of the negative control serum and low responses at lower dilutions of the positive control in some of the laboratories. These and other observations should be addressed through further optimization of the ELISA within each laboratory in the future. The optimization could take the form of a multi-factor study design of experiments (DoE). Such a study would simultaneously examine the effects of factors, which might be impactful on the negative control response, and attributes of the positive control curve. Factors might include conjugate dilution, time or temperature of incubation, plate washing strength, pH, coating antigen concentration as well as others. Curve attributes requiring optimization include negative control or lower asymptote response (minimize), upper asymptote response (maximize, within the limits of the plate reader), and slope of the curve.
These additional optimization steps, combined with selection of an initial dilution and of dilution increments of the positive control, should yield data amenable to optimal four-parameter logistic curve modeling. It is recommended that at least two points sit on or near the upper and lower asymptotes and at least four points sit in the middle of the dynamic range of the positive control curve [29].
Small numbers of batches and use of sub-optimal dosing of vaccines made assessment of assay and inter-batch variability inconclusive. It was noted, however, that the excess variability of batches over intra assay within run variability was negligible for all manufacturers, leading to the qualitative conclusion of consistency of batch potencies for all manufacturers.
The use of vaccine batches of sub-standard quality, i.e. decreased potency, is a must in assessing the suitability of a new method [30]. In this specific case, the level of decrease in MPT potency, after a mild heat treatment [26] was not expected to be consistent among the various vaccines, due to intrinsic differences in heat-lability among manufacturer’s products and potential laboratory specific differences in the execution of the intra-laboratory alteration procedure. Still, the use of the PSPT was capable to ascertain a decrease in potency, even though not always in line with the MPT, as the assessment of potency against ERS was likewise compromised by the sub-optimal test sample dosing. It would be necessary for the laboratories to revisit this after optimizing both the dosing of their products and the whole-cell ELISA.
However, it must be considered that the wP vaccines might not be composed of the same wP strains present in the ERS reference vaccines. This would imply that the serological responses versus the surface antigens measured by serology might be different causing parallelism, linearity and narrow confidence intervals to be difficult to achieve. These criteria can be satisfied more easily when using an in-house homologous vaccine as reference as it is analogous in the antigen composition (FL1 in this study). This is already acknowledged by WHO, which in the case of potency by serology for Diphtheria, Tetanus and aP, allows the use of a product-specific reference or control vaccine analogous in composition to the test vaccine [10,31].
While the main objective, i.e. verifying the capacity of the PSPT to discriminate between MPT compliant and non-compliant batches was not “formally” achieved due to the presented issues and the necessity to perform final analyses on sub-standard results for some participants, the success in registering the decreased potencies of MPT non-compliant vs compliant batches in all laboratories reinforces the expectation that the PSPT has the potential to be used to discriminate batches of wP after laboratory-specific optimization of the method in the future.
The willingness of NCLs to participate in the PSPT assessment project was evaluated by the sponsor an added value for the study. In fact, interaction between manufacturers and NCLs is crucial to exchange experiences and discuss criteria that have to be met for regulatory acceptance. On the other hand, the experiences gained by the NCLs will facilitate their collaborations with other members of the WHO National Control Laboratories Network for Biologicals (WHO-NNB) [32] interested in implementing the PSPT for batch release control of wP vaccines for which consistency in production has already been demonstrated by the challenge method.
5. Conclusions
While efforts to reduce animal testing and suffering is a global initiative with both ethical and product quality objectives, the success of such programs is never guaranteed. Perhaps more studies fail or are unsuited to draw definitive conclusions than those that succeed. In the spirit of knowledge sharing within the scientific community, this article describes the work performed during the project, the complexities encountered and the considerations made, as this information is crucial for any QC laboratory, whether from a private company or an NCL, that wishes to further develop and finally implement the PSPT as an alternative method to the currently used MPT.
Funding
This study was financially supported by the National Institute for Innovation in Manufacturing Biopharmaceuticals (NIIMBL, Project PC3.1-302).
Disclaimer
This manuscript and the views expressed herein are those of the authors, and do not reflect the policy of any organization.
Declaration of interest
TS, CVH, VS, AS received funds from the Developing Countries Vaccine Manufacturers Network (DCVMN) as part of the grant awarded to DCVMN by the National Institute for Innovation in Manufacturing Biopharmaceutical (Project Call 3.1. Global Health - https://niimbl.force.com/s/current-projects).
Acknowledgements
The authors wish to acknowledge BioLyo Technologies for the production of the inactivated and lyophilized B. pertussis material used as coating antigen in the ELISA. Special thanks to Johan van der Gun, former Bilthoven Biologicals (The Netherlands), for expert advice; to Ute Rosskopf (Lead WHO-National Control Laboratory Network for Biologicals, a. i. Laboratory Networks and Services (LNS) – Team Regulation and Safety (REG)- Unit Regulation and Prequalification (RPQ)- Department Access to Medicines and Health Products (MHP)- Division World Health Organization, Geneva, Switzerland) for expert advice and critical review of the study.
Appendix A

Table A1.
List of participants, in alphabetical name order.
| Participant | Type of organization | Country | Names |
|---|---|---|---|
| Bharat Biotech | Manufacturer | India | Gopal Singh; Brunda Ganneru; Ganesh Dubey; Tarun Neha |
| Biological E | Manufacturer | India | Venugopal Bandameedi; Venkatarakesh Deevi |
| BB-NCIPD | Manufacturer | Bulgaria | Viktor Denev; Elena Nikolova; Valentina Borisova |
| Central Drugs Standard Control Organization. Central Drugs Laboratory, Kasauli |
National Control Laboratory | India | Sushil Sahu |
| Institute of Biological Products (IBP), Department of Medical Sciences | National Control Laboratory | Thailand | Apichai Supasansatorn; Wereyarmarst Jaroenkunathum |
| National Quality Control Laboratory of Drug and Food (NQCLDF) | National Control Laboratory | Indonesia | Anissa Wari Murti; Zulfa Noerhidayati; Ratih Pujilestari; Keti Yuliani |
| Panacea Biotec | Manufacturer | India | Rashi Saini; Yashpal Kaushik; Deepak Mahajan; Bonny Sharma; Maya Ramdas |
| PT Bio Farma (Persero) | Manufacturer | Indonesia | Dewi Dahlia Yuliarsih; Aini Qolbiyah Afgani; Chairunnisaa Jabal Rahmah |
| Sanofi Healthcare India Private Limited | Manufacturer | India | Surender Reddy Battula; Sunil Reddy Dadhireddy |
| Serum Institute of India | Manufacturer | India | Ghule Arvindkumar; Karegaonkar Ritesh; M. Anadkumar |
References
- Directive 2010/63/EU of the European Parliament and of the Council of 22 September 2010 on the protection of animals used for scientific purposes. http://data.europa.eu/eli/dir/2010/63/oj.
- Good manufacturing practice | European Medicines Agency (europa.eu).
- Hendriksen, C.; Arciniega, J.L; Bruckner, L.; Chevalier, M.; Coppens, E.; Descamps, J.; Duchene, M.; Dusek, D.M.; Halder, M.; Kreeftenberg, H.; Maes, A.; Redhead, K.; Ravetkar, S.D., Spieser, J.M.; Swam, H. The consistency approach for the quality control of vaccines. Biologicals 2008, 36, 73-77.
- Dierick, J.F.; Halder, M.; Jungbäck, C.; Lorenz J.; Préaud, J.M.; Riou, P.; Tesolin, L.; Uhlrich, S.; van der Molle, W.; Vandeputte, J. The consistency approach for the substitution of in vivo testing for the quality control of established vaccines: practical considerations and progressive vision. Open Research Europe 2022, 2:116. [CrossRef]
- Kumar, S.; Singh, M.P.; Bharti V.K.; Pandey R.P. Quality control of vaccines- A journey from classical approach to 3Rs. Microbiol Curr. Res. 2018, 2, 45-71.
- Zhang, X.; Wu, X.; He, Q.; Wang, J.; Mao, Q.; Liang, Z.; Xu, M. Research progress on substitution of in vivo method(s) by in vitro method(s) for human vaccine potency assays. Expert Rev Vaccines 2023, 22(1), 270-277. [CrossRef]
- Home | Vac2Vac (europevaccine.wixsite.com).
- Assay of diphtheria vaccine, Monograph 20707. European Pharmacopoeia, 11 Edition, 2023, Council of Europe, Strasbourg, France.
- Assay of tetanus vaccine, Monograph 20708. European Pharmacopoeia, 11 Edition, 2023, Council of Europe, Strasbourg, France.
- Testing for diphtheria/tetanus vaccine. World Health Organization Manual for Quality Control of Diphtheria, Tetanus and Pertussis Vaccines, Chapter II and III. 2013. WHO/IVB/11.11. Manual for quality control of diphtheria, tetanus, pertussis and combined vaccines (who.int) .
- The Periscope Consortium. Periscope: road towards effective control of pertussis 2018. Lancet Infect. Dis. 2018. [CrossRef]
- Esposito, S.; Stefanelli, P.; Fry, NK; Fedele, G.; He, Q.; Paterson, P.;Tan, T.; Knuf, M.; Rodrigo, C.; Weil Olivier,C; Flanagan, KL.; Hung, I.; Lutsar, I.; Edwards, K.; O’Ryan, M.; Principi, N. Pertussis prevention: reasons for resurgence, and differences in the current acellular pertussis vaccines. Front Immunol 2019, 10:1344. [CrossRef]
- Zerbo, O.; Bartlett, J.; Goddard, K.; Fireman, B.; Lewis, E.; Klein, NP. Acellular pertussis vaccine effectiveness over time. Pediatrics 2019, 144 (1) e20183466. [CrossRef]
- Guiso, N.; Meade, B.D.; Wirsing von König, K.H.; Pertussis vaccines: The first hundred years. Vaccine 2020, 38, 1271-1276. [CrossRef]
- World Health Organization: Pertussis Vaccines: WHO position paper – August 2015Pertussis vaccines : WHO position paper — August 2015 = Note de synthèse : Position de l’OMS concernant les vaccins anticoquelucheux — août 2015 (accessed October 2023).
- Testing for whole cell pertussis vaccine. In Manual for Quality Control of Diphtheria, Tetanus and Pertussis Vaccines, Chapter IV. 2013. WHO/IVB/11.11. Manual for quality control of diphtheria, tetanus, pertussis and combined vaccines (who.int) .
- Canthaboo, C,; Xing, D.; Douglas, A.; Corbel, M. Investigation of an aerosol challenge model as alternative to the intracerebral mouse protection test for potency assay of whole cell pertussis vaccines. Biologicals 2000, 28, 241-6. [CrossRef] [PubMed]
- Canthaboo, C.; Xing, D.; Corbel, M. Development of a nitric oxide induction assay as a potential replacement for the intracerebral mouse protection test for potency assay of pertussis whole cell vaccines. Dev Biol Stand 1999, 101,95-103.
- van der Ark, A.; van Straaten-van de Kappelle, I.; Akkermans, A.; Hendriksen, C.; van de Donk, H. Development of Pertussis Serological Potency Test: serological assessment of response induced by whole cell vaccines as an alternative to mouse protection in an intracerebral challenge model. Biologicals 1994, 22, 233–242. [CrossRef]
- van der Ark, A.; Straaten-van de Kappelle, I.; Ölander, R.M.; Enssle, K.H.; Jadhav, S.; van de Donk, H.; Hendriksen, C. The Pertussis Serological Potency Test: Collaborative study to evaluate replacement of the mouse protection test. Biologicals 2000, 28,105-118. [CrossRef]
- von Hunolstein, C.; Gomez Miguel, M.J.; Pezzella, C.; Scopetti, F.; Behr-Gross, M.E.; Halder, M.; Hoffman, S.; Levels, L.; van der Gun, J.; Hendriksen, C. Evaluation of the serological methods for potency testing of whole cell pertussis vaccines. Pharmeuropa Bio 2008 (1),7-18.
- Hendriksen C, von Hunolstein C, van der Gun J, Gomez Miguel MJ, Daas A, Terao E. International collaborative study for the validation of an alternative serological assay for potency testing of whole cell pertussis vaccines – BSP104-Phase 1. PA/PH/BIO (13) 20, funded by EDQM, Biological Standardisation Programme (Unpublished work).
- Developing Countries Vaccine Manufacturers Network. List of Vaccines – DCVMN (accessed October 2023).
- NIIMBL, the National Institute for Innovation in Manufacturing Biopharmaceuticals NIIMBL Launches Global Health Fund (force.com) (accessed October 2023).
- Temperature sensitivity of vaccines. World Health Organization. 2006. WHO/IVB/06.10, https://apps.who.int/iris/handle/10665/69387.
- Heat stability of pertussis vaccine. Wkly Epidem rec 1985, 39,300 Expanded Programme on Immunization.
- Statistical analysis of results of biological assays and tests. European Pharmacopeia 11 edition, 2023, Council of Europe, Strasbourg, France.
- General Chapter 1033, Biological assay validation. United States Pharmacopeia 2020. [CrossRef]
- General Chapter 1032, Design and Development of Biological Assays. United States Pharmacopeia, 2022. [CrossRef]
- van der Biggelaar, R.G.A; Hoefnagel, M.H.N.; Vanderbriel, R.J; Sloot, A.;Hendriksen, C.F.M; van Eden, W.; Rutten, V.P.M.G.; Jansen, C.A. Overcoming scientific barriers in the transition from in vivo to non-animal batch testing of human and veterinary vaccines. Expert Review Vaccine, 2021, 20,1221-1223. [CrossRef]
- Recommendations to assure the quality, safety and efficacy of acellular pertussis vaccines. Annex 4 of WHO Technical Report Series, No. 979, 2013. Recommendations to assure the quality, safety and efficacy of acellular pertussis vaccines, Annex 4, TRS No 979 (who.int).
- National Control Laboratories National Control Laboratories | WHO - Prequalification of Medical Products (IVDs, Medicines, Vaccines and Immunization Devices, Vector Control) (accessed October 2023).
Figure 1.
PSPT design options: Design Option 1 includes a reference vaccine (IPRS/20/PERT, RWRS 01/11, WHO-IS or in-house reference), batch FL1, FL2 tested twice as FL2A and FL2B, and FL3 tested unaltered and altered (FL3-Alt); Design Option 2 includes the same batches tested over two separate experimental runs.
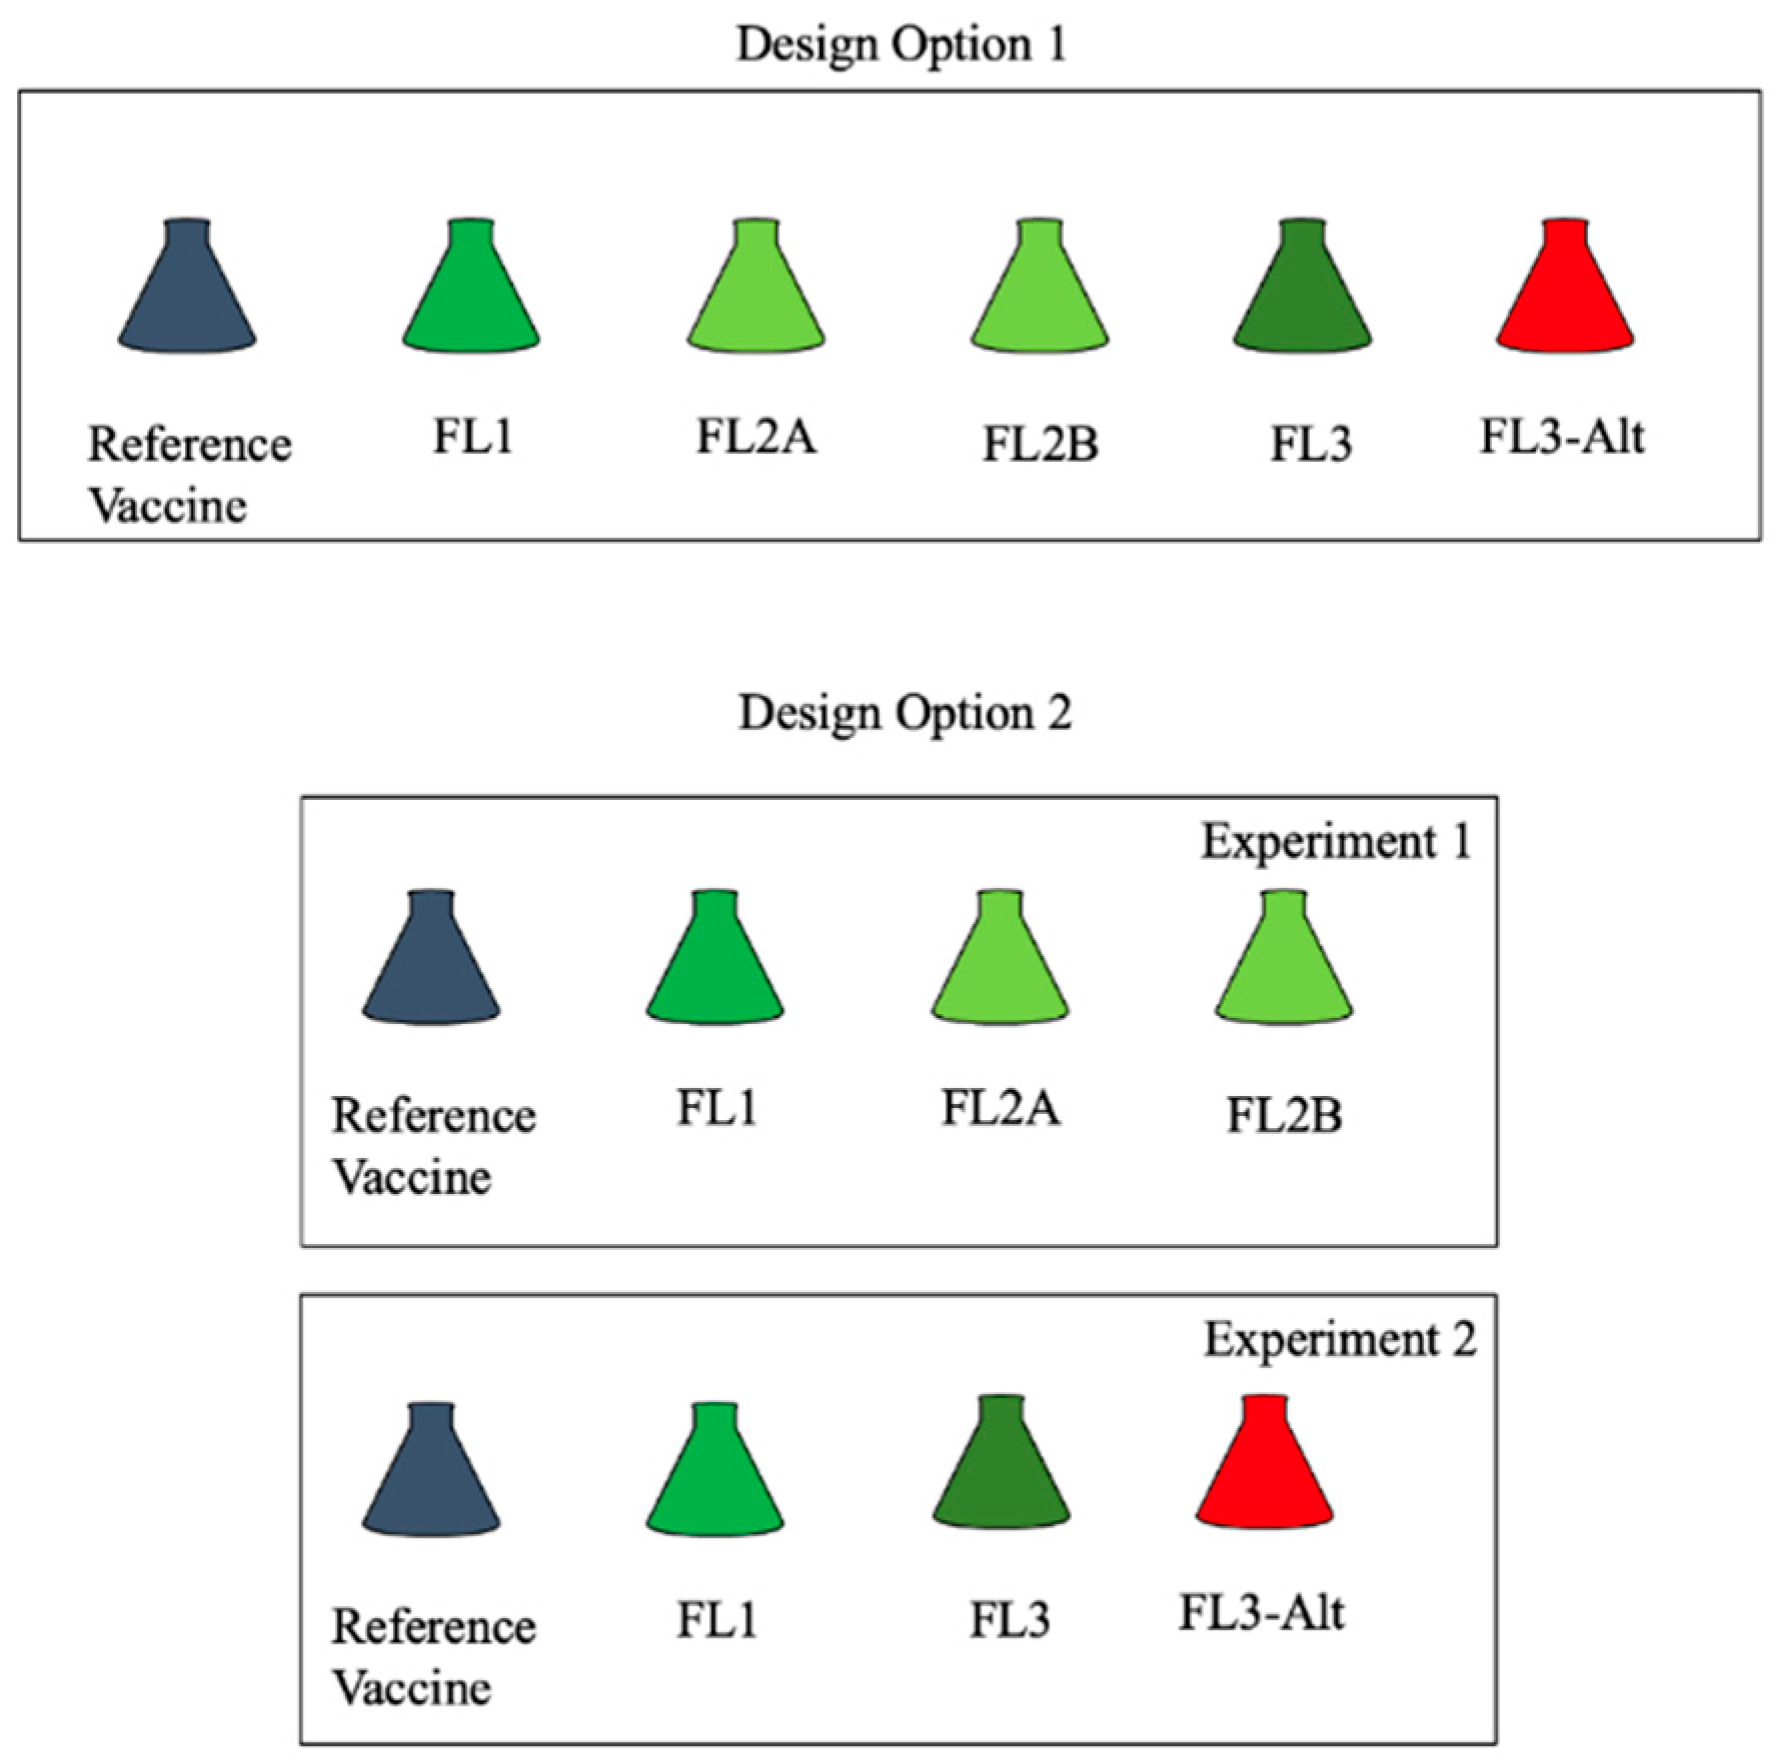
Figure 2.
Schematic overview of the MPT procedure over time.
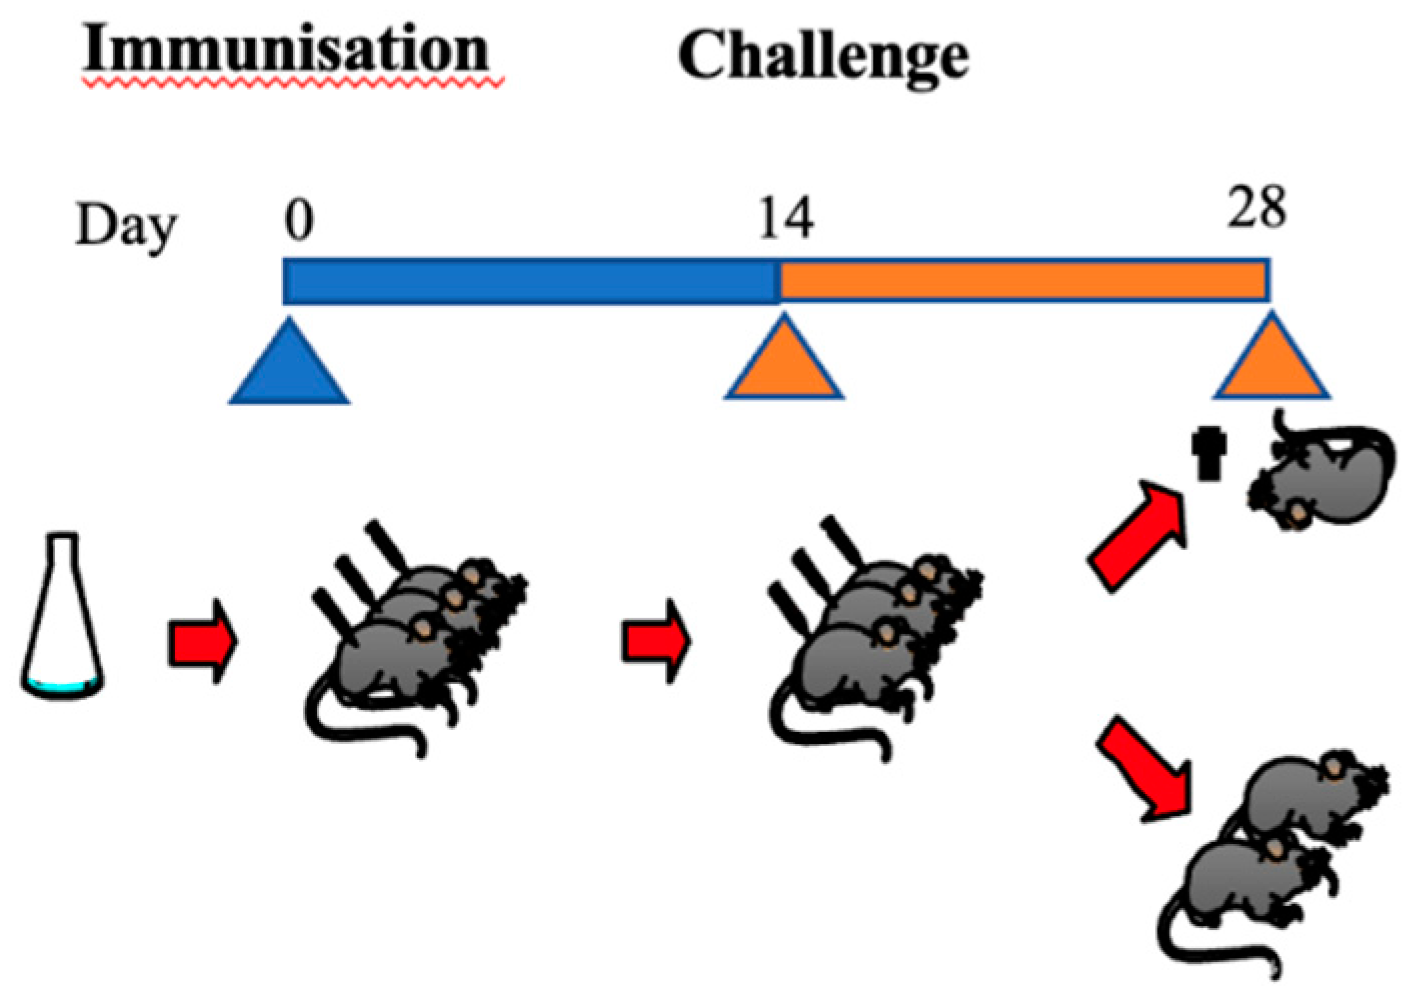
Figure 3.
Schematic overview of the PSPT procedure over time.
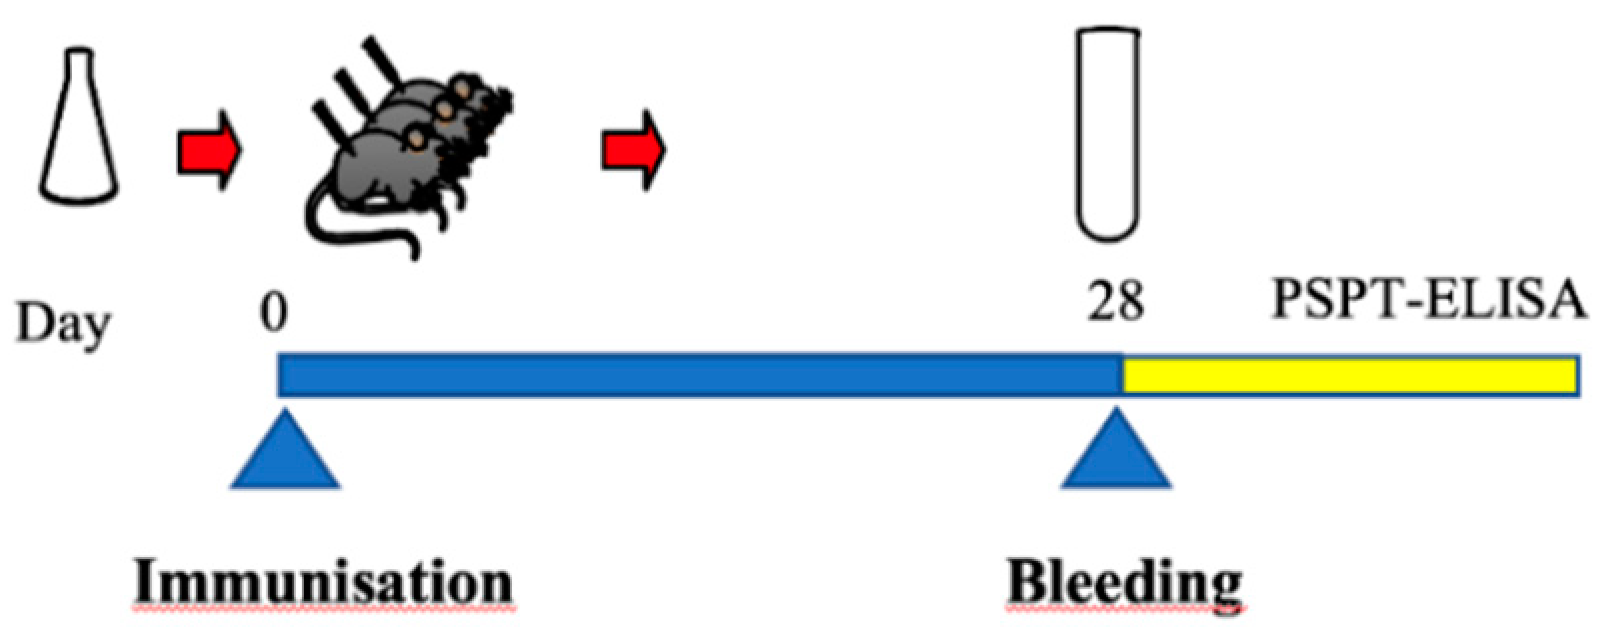
Figure 4.
4PL curves and parameter estimates illustrating: (a) acceptable properties; (b) incomplete lower asymptote and a hook effect; and (c) incomplete lower and upper asymptotes and a shallow slope.
Figure 4.
4PL curves and parameter estimates illustrating: (a) acceptable properties; (b) incomplete lower asymptote and a hook effect; and (c) incomplete lower and upper asymptotes and a shallow slope.
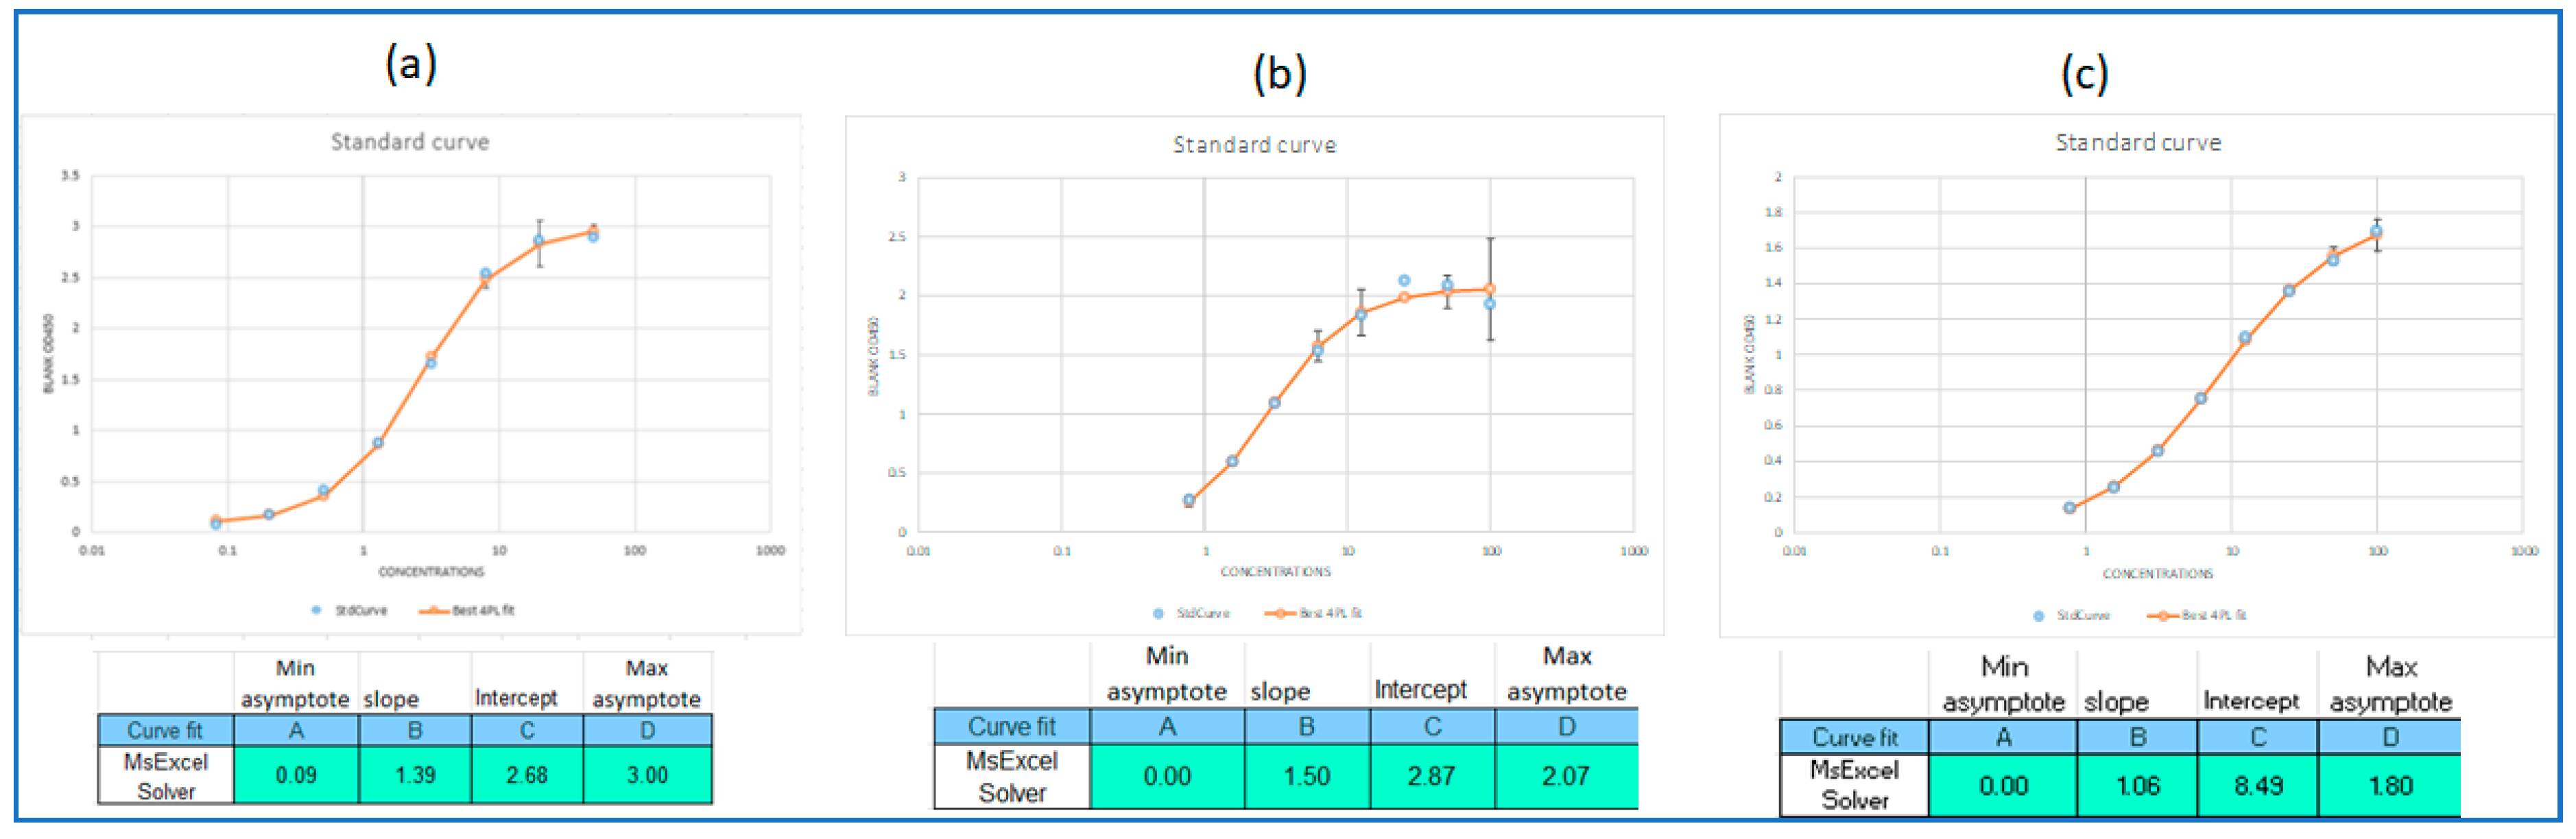
Figure 5.
Illustration of relative potency determination for a test vaccine relative to a reference vaccine. Each point shows the mean response at each dose.
Figure 5.
Illustration of relative potency determination for a test vaccine relative to a reference vaccine. Each point shows the mean response at each dose.
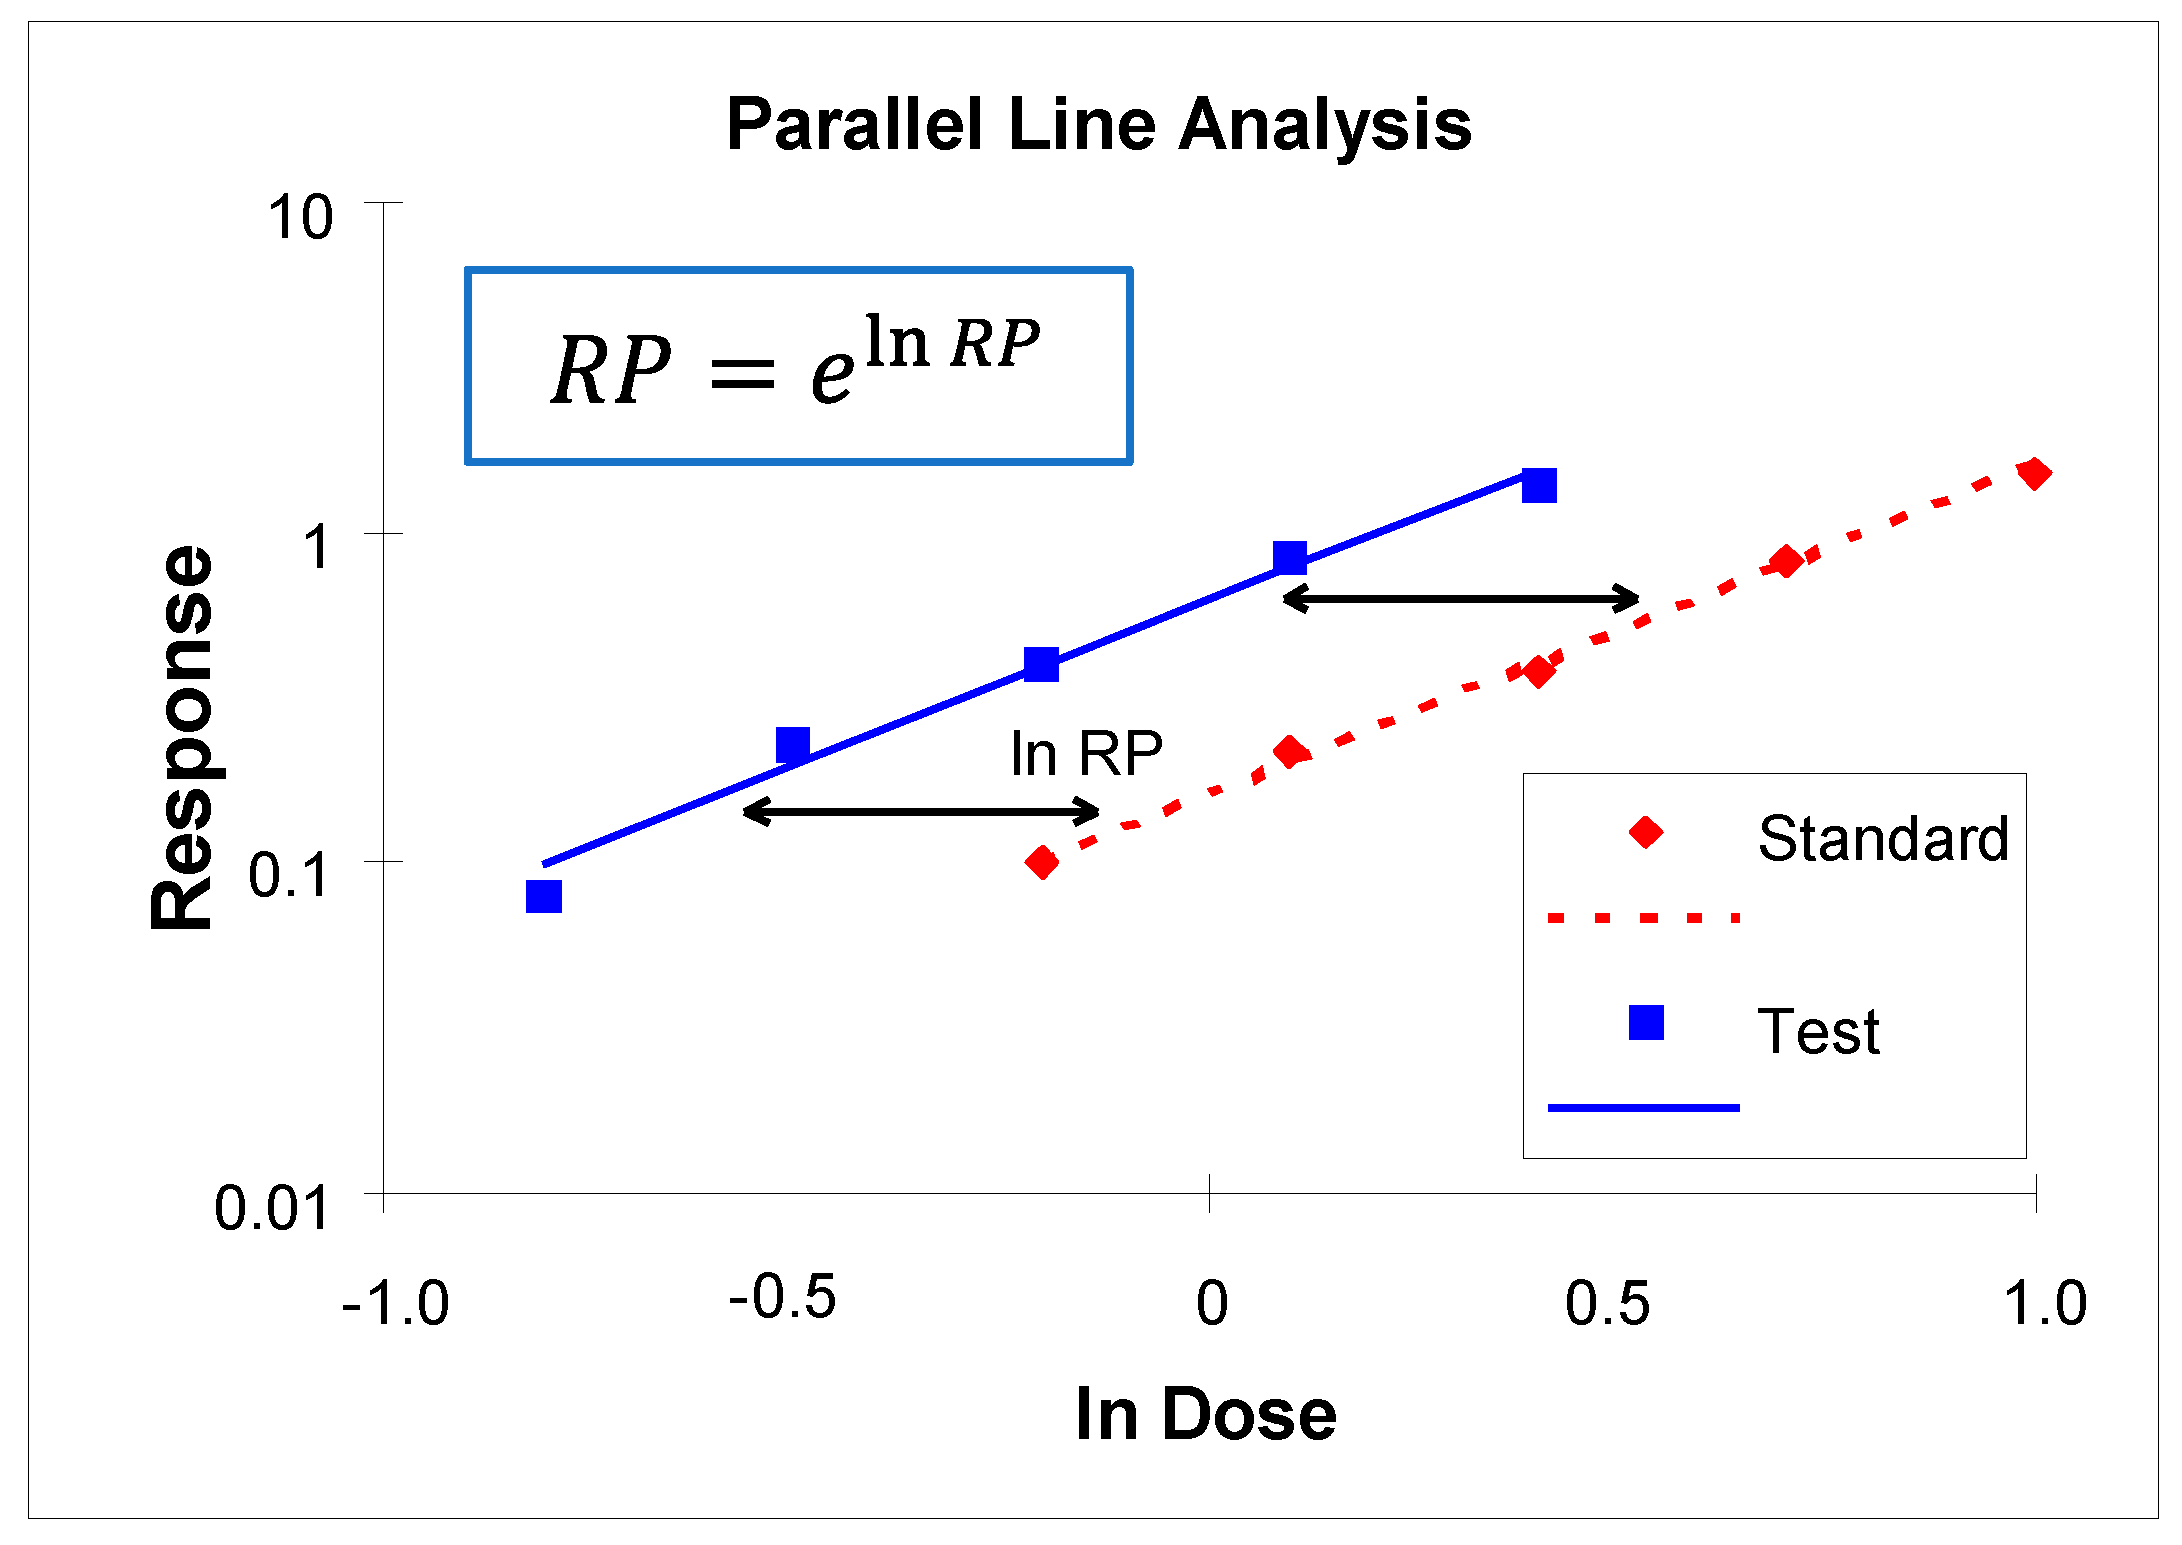
Figure 6.
Cumulative proportions of negatives by dose for batches tested in the PSPT project.
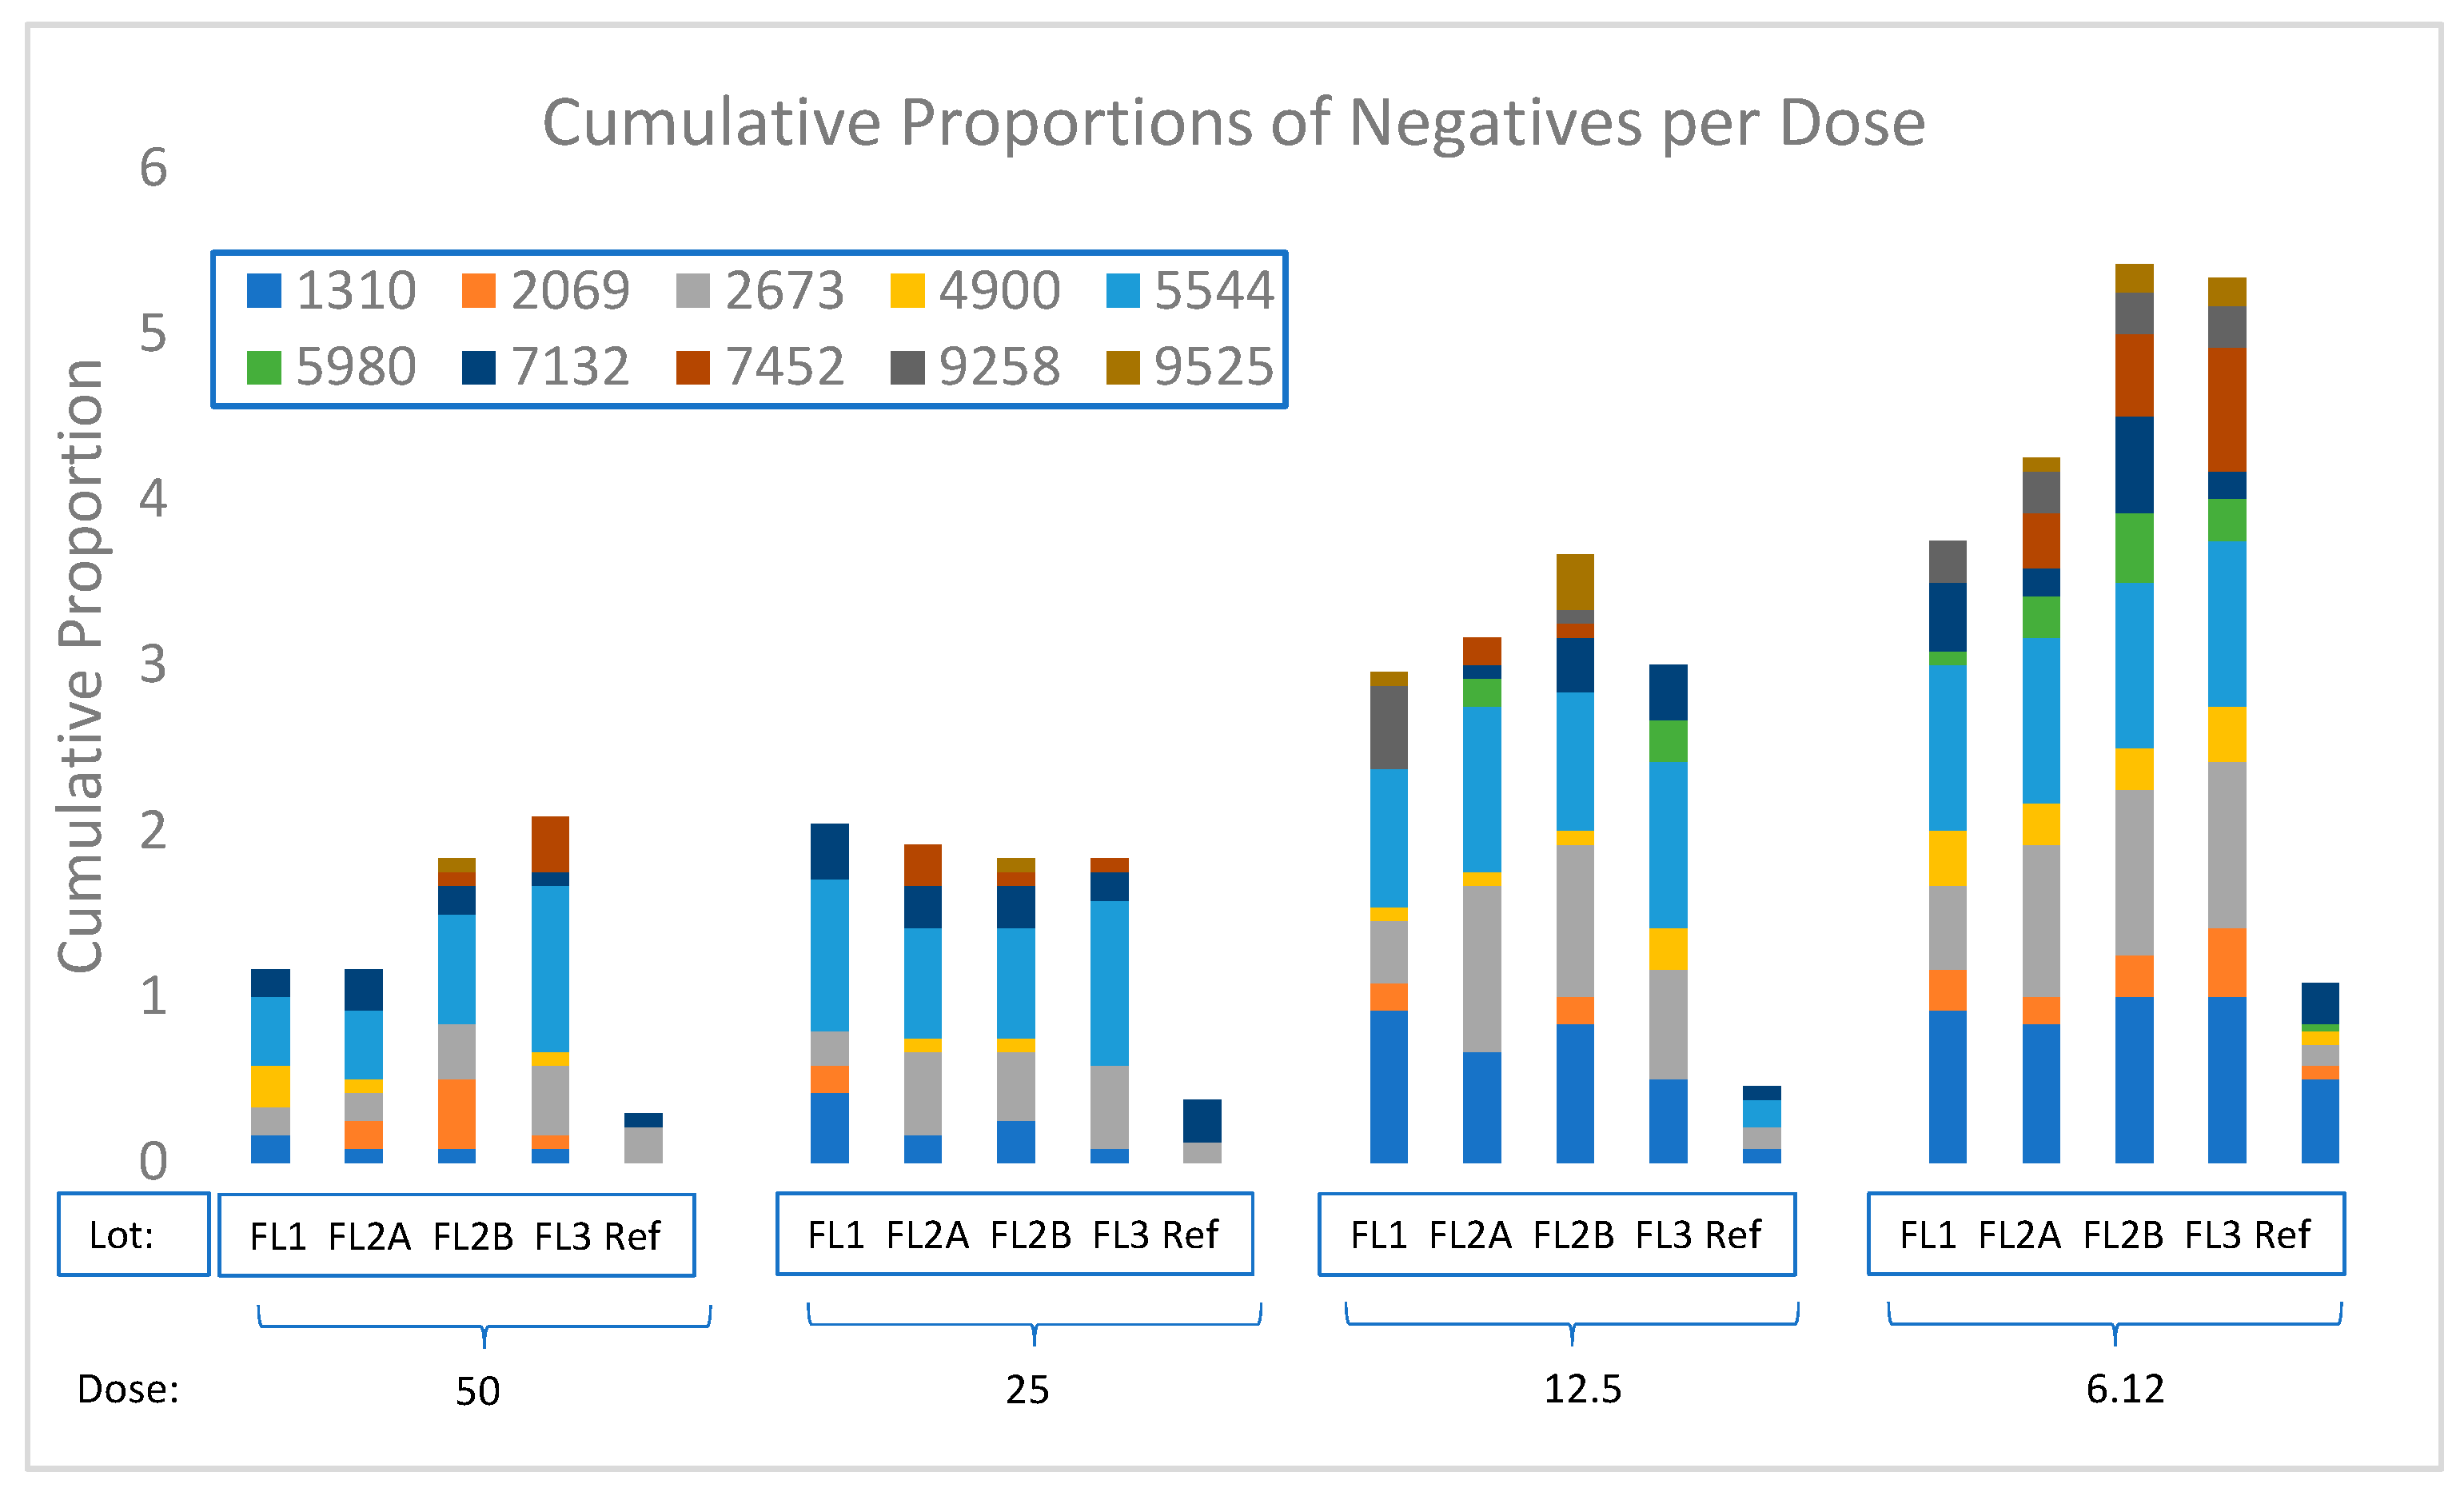
Figure 7.
Illustrative examples of consequences of high proportions of negatives (clusters of points at low doses): nonlinearity where clusters “bend” dose response; non-parallelism where slope of low potency batch is drawn towards clusters; high variability (resulting in wide confidence interval) where parallel lines are a poor fit to the data.
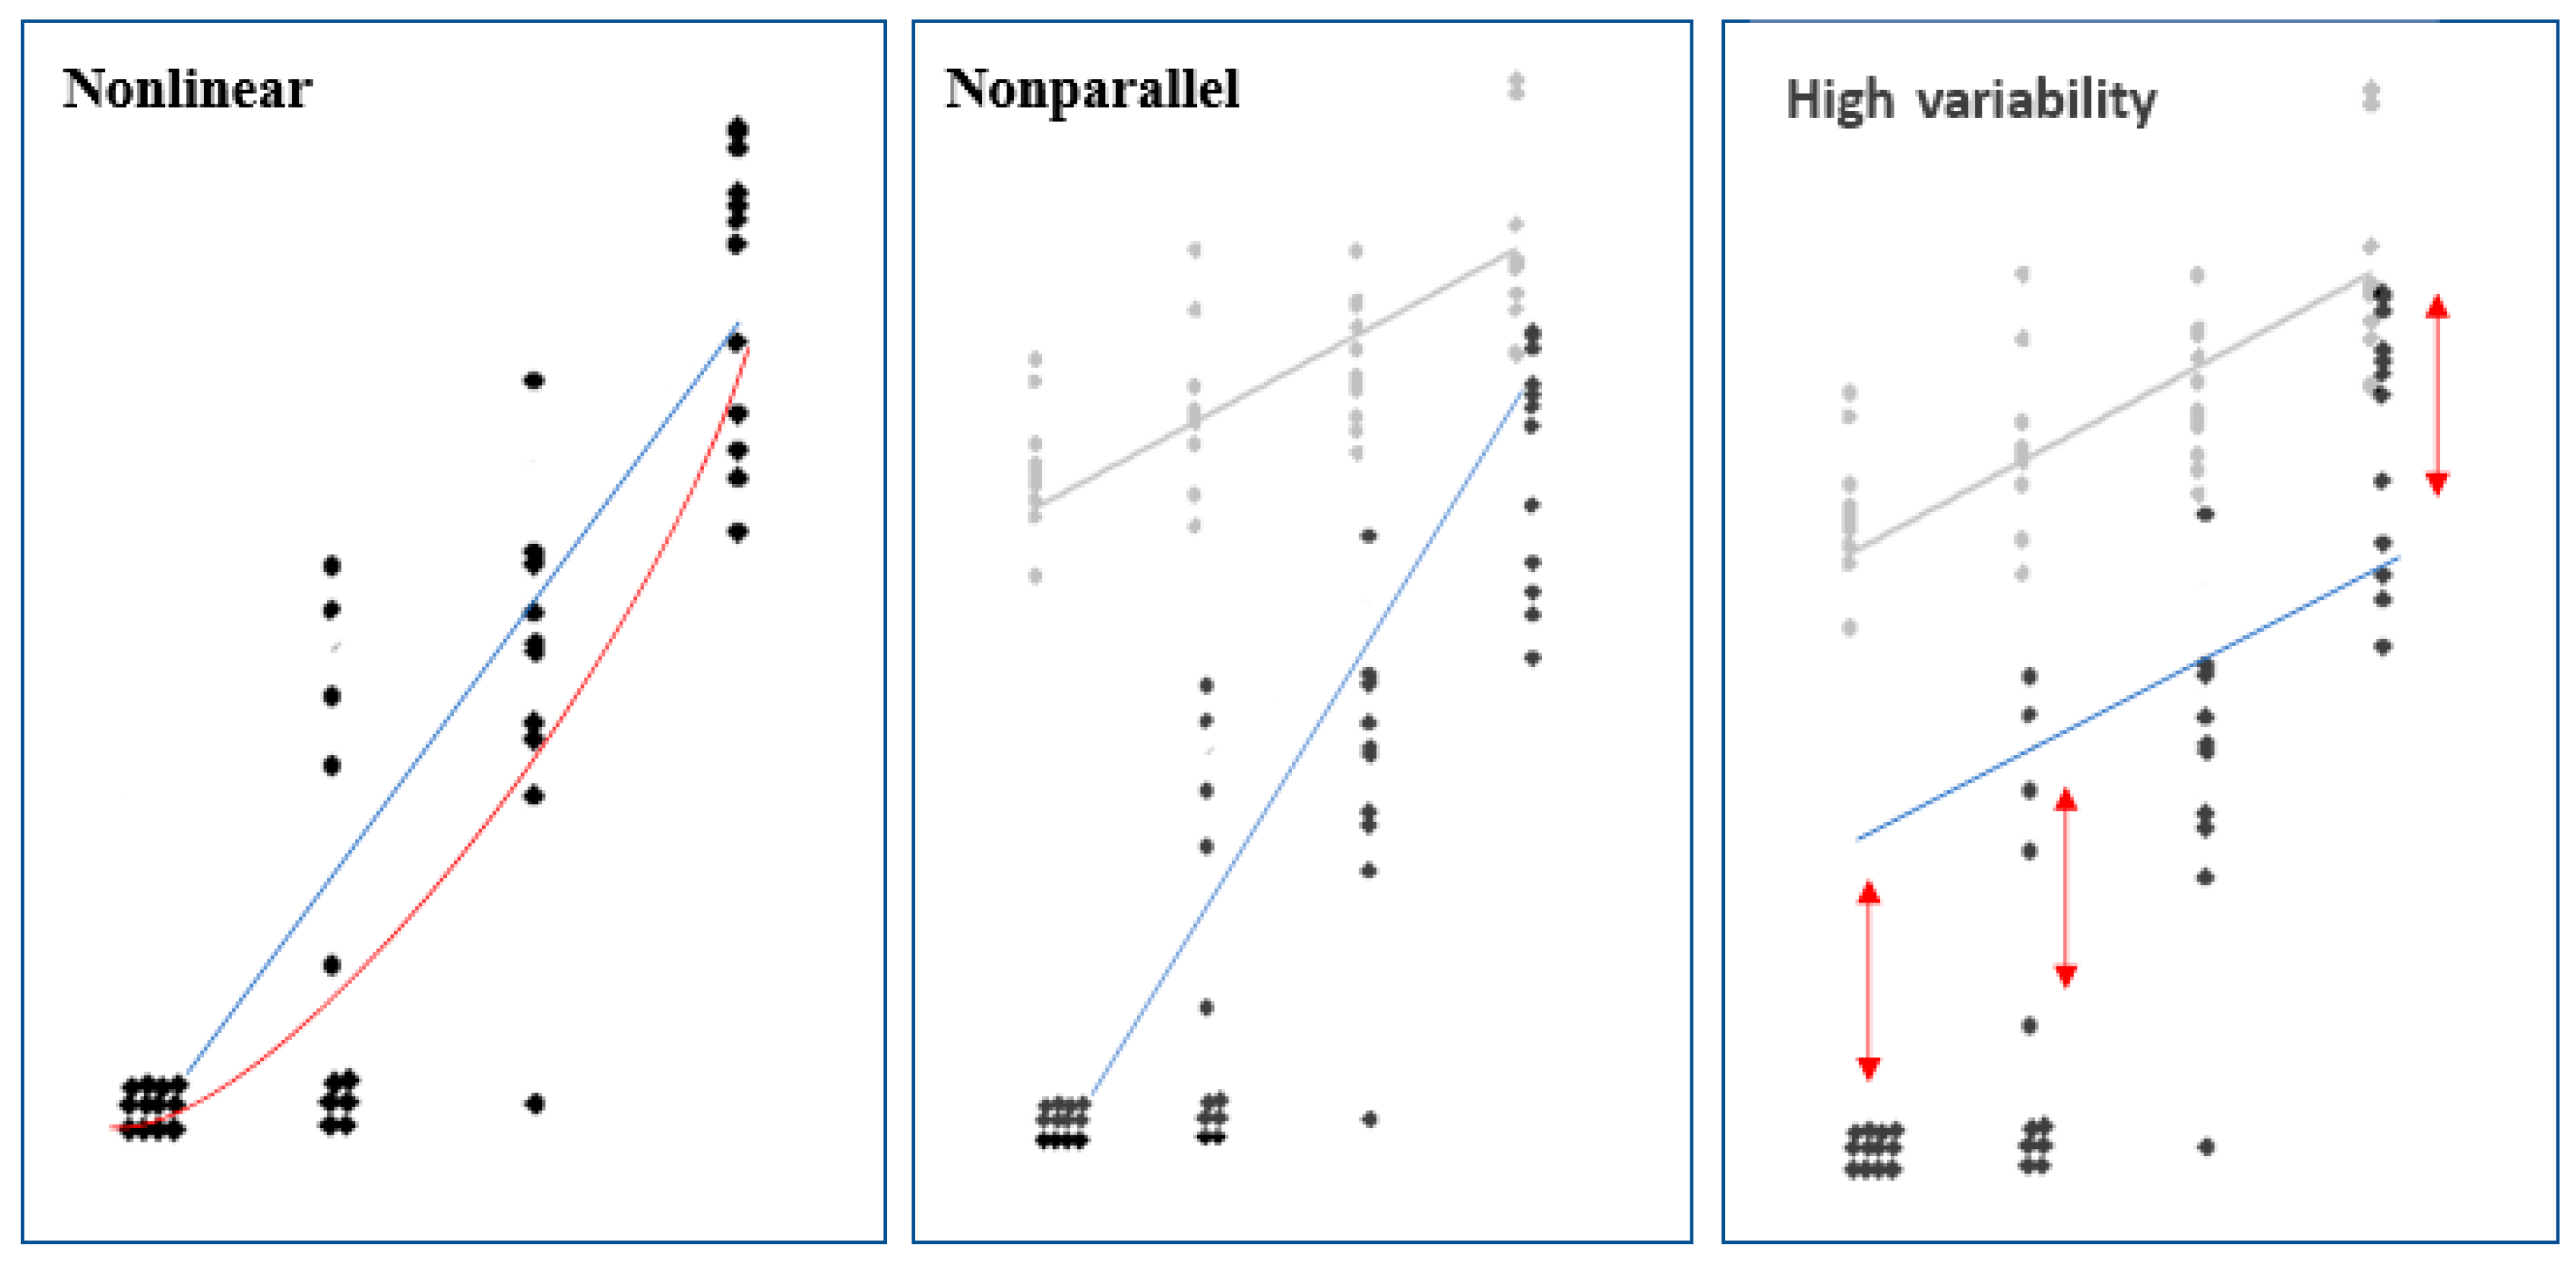
Table 1.
Composition and opacity units (OU) or international units (IU) per mL of whole-cell pertussis or reference vaccines used by each participating laboratory.
Table 1.
Composition and opacity units (OU) or international units (IU) per mL of whole-cell pertussis or reference vaccines used by each participating laboratory.
| Laboratory Code | Test Vaccine | ERS ** | ||||
|---|---|---|---|---|---|---|
| Components | OU*/mL | Origin | Batch n. /code | IU/vial § | ||
| 1310 | DTwP-HepB-Hib | 24 | National | RWRS 01/11 | 63 | |
| 2069 | DTwP-HepB-Hib | 24 | National | IPRS/20/PERT | 75 | |
| 2673 | DTwP-HepB-Hib | 24 | In-house | STBF 2015-1 | 62 | |
| 4990 | DTwP-HepB-Hib-IPV | 30 | National | IPRS/20/PERT | 75 | |
| 5544 | DTwP | 30 | WHO I.S. | NIBSC 94/532 | 40 | |
| 5980 | DTwP-HepB-Hib | 28 | National | IPRS/20/PERT | 75 | |
| 7132 | DTwP-HepB-Hib | 24,28,32 | National | IPRS/20/PERT | 75 | |
| 7452 | DTwP-HepB-Hib | 24,28,32 | National | RWRS 01/11 | 63 | |
| 9258 | DTwP-HepB-Hib | 32 | National | IPRS/20/PERT | 75 | |
| 9525 | DTwP-HepB-Hib | 16 | National | IPRS/20/PERT | 75 | |
*OU: Opacity Units; ** ERS: External Reference Standard. The ERS contains only B. pertussis plain whole-cells; § IU: International Units.
Table 2.
Characteristics of the mouse strains used in MPT and PSPT study.
| Laboratory Code | 1310 | 2069 | 2673 | 4900 | 5980 | 7132 | 7452 | 9258 | 5544 | 9525 |
|---|---|---|---|---|---|---|---|---|---|---|
| Strain of mouse, sex, and breeding | ddY (Male) | Swiss Albino (Male) | ddYbf (Male) | ICR (50/50) | NIH (Ola Hsd) (50/50) | Swiss Albino (Male) | ICR (Female) | Swiss Webster (50/50) | ICR (50/50) | Swiss Albino (Male) |
| Outbred | Outbred | Outbred | Outbred | Inbred | Outbred | Outbred | Outbred | Outbred | Outbred |
Table 4.
Summary of PLA assumption and condition failures when testing unaltered batches against an external reference standard (RWRS/ IPRS/20/PERT/WHO-IS/in-house reference STBF 2015-1).
Table 4.
Summary of PLA assumption and condition failures when testing unaltered batches against an external reference standard (RWRS/ IPRS/20/PERT/WHO-IS/in-house reference STBF 2015-1).
| Laboratory | Parallelism | Linearity | Confidence Interval of Relative Potency |
|---|---|---|---|
| 1310† | * | * | |
| 2069 | **** | ||
| 2673†† | ***** | ||
| 4900 | **** | ||
| 5544 | ** | **** | |
| 5980†† | * | **** | |
| 7132† | **** | ||
| 7452† | *** | ||
| 9258 | ** | ||
| 9525 | **** |
† National Control Laboratory; †† Laboratory using study design Option 2; * Number of failures across batches (except FL3-Alt).
Table 5.
Summary of PLA assumption and condition failures when testing unaltered batches against an internal reference vaccine.
Table 5.
Summary of PLA assumption and condition failures when testing unaltered batches against an internal reference vaccine.
| Laboratory | Parallelism | Linearity | Confidence Interval of Relative Potency |
|---|---|---|---|
| 1310† | * | ||
| 2069 | ** | ||
| 2673†† | * | * | |
| 4900 | |||
| 5544 | ** | ||
| 5980†† | |||
| 7132† | * | ||
| 7452† | * | * | |
| 9258 | |||
| 9525 |
† National Control Laboratory; IRS not homologous vaccine with other test batches, but of the same antigen composition; †† Laboratory using Option 2; * Number of failures across batches (except FL3-Alt).
Table 6.
Variance component estimates with measures (% GCV) of assay and total variabilities.
| Reference | Lab | GM† |
(Assay) |
(Total) |
|||
| External | 1310†† | 2.22 | 0.0025 | 0.0936 | 0.0962 | 5.2% | 36.4% |
| 2069 | 1.72 | 0.0005 | 0.0355 | 0.0360 | 2.3% | 20.9% | |
| 2673 | 0.06 | 1.3432 | 0.3595 | 1.7027 | 218.7% | 268.7% | |
| 4900 | 0.90 | 0.0000 | 0.0046 | 0.0046 | 0.3% | 7.0% | |
| 5544 | 0.14 | 1.5780 | 0.0000 | 1.5780 | 251.2% | 251.2% | |
| 5980 | 0.57 | 0.0834 | 0.0000 | 0.0834 | 33.5% | 33.5% | |
| 7132†† | 0.76 | 0.0013 | NA | NA | 3.7% | NA | |
| 7452†† | 1.12 | 0.0313 | NA | NA | 19.4% | NA | |
| 9258 | 1.38 | 0.0025 | 0.0129 | 0.0154 | 5.1% | 13.2% | |
| 9525 | 2.17 | 0.0245 | 0.0177 | 0.0422 | 16.9% | 22.8% | |
| Internal | 1310†† | 1.48 | 0.0600 | 0.0381 | 0.0981 | 27.8% | 36.8% |
| 2069 | 0.69 | 0.0007 | 0.0037 | 0.0044 | 2.7% | 6.9% | |
| 2673 | 0.62 | 0.0385 | 0.0598 | 0.0983 | 21.7% | 36.8% | |
| 4900 | 1.06 | 0.0001 | 0.0164 | 0.0165 | 0.8% | 13.7% | |
| 5544 | 1.11 | 0.2184 | 0.0000 | 0.2184 | 59.6% | 59.6% | |
| 5980 | 0.86 | 0.0004 | 0.0227 | 0.0231 | 2.1% | 16.4% | |
| 7132†† | 1.12 | 0.0127 | NA | NA | 11.9% | NA | |
| 7452†† | NA | NA | NA | NA | NA | NA | |
| 9258 | 1.37 | 0.0041 | 0.1080 | 0.1121 | 6.6% | 39.8% | |
| 9525 | 1.22 | 0.0057 | 0.0364 | 0.0421 | 7.9% | 22.8% |
Geometric mean (GM) of relative potency across batches FL1, FL2, FL3 in case of manufacturers (n = 4 for Option 1 and n = 5 for Option 2); FL2A and FL2B in case of NCLs (n=2); †† National Control Laboratory; batches were from different manufacturers; batch variability not calculated.
Table 7.
Potency (Confidence Limits, in brackets) and Reduction (%) in potency of the heat-treated versus the unaltered vaccines in MPT and PSPT. .
Table 7.
Potency (Confidence Limits, in brackets) and Reduction (%) in potency of the heat-treated versus the unaltered vaccines in MPT and PSPT. .
| MPT Potency |
PSPT potency vs ERS |
PSPT Potency vs IRS –FL1 |
|||||||
| Lab | FL3 | FL3-Alt | % Red. | FL3 | FL3-Alt | % Red. | FL3 | FL3-Alt | % Red. |
| 1310 | 6.29 (2.12 - 19.75) |
2.93 (1.03 - 8.31) |
53% | 3.0802 (1.804-4.589) |
1.8998 (1.1556-2.7563) |
38% | 1.9380 (1.1932-3.6533) |
0.9312 (0.6408-1.3150) |
52% |
| 2069 | 5.03 (2.34 - 10.96) |
4.06 (1.78 - 9.32) |
19% | 1.6492 (0.4429-3.3560) |
0.7195 (0.0502-2.0298) |
56% | 0.6456 (0.3918-0.9827) |
0.3738 (0.1540-0.6675) |
42% |
| 2673† | 7.07 (2.80 - 9.22) |
4.88 (2.20 –10.80) |
31% | 1.1070 (0.7561-1.6469) |
0.7897 (0.5541-1.1035) |
29% | 1.1703 (0.7384-1.8917) |
0.7890 (0.5071-1.1724) |
33% |
| 4900 | 7.60 (4.40 -13.6) |
5.18 (2.10-12.5) |
32% | 0.9246 (0.2047-1.944) |
0.6916 (0.0452-1.8851) |
25% | 0.9410 (0.6104-1.426) |
0.4774 (0.1395-1.1969) |
49% |
| 5544 | 7.41 (2.71-3.38) |
2.01 (0.46 - 6.72) |
73% | 0.0301 (0.000-0.3280) |
0.0196 (0.000-0.2507) |
35% | 0.8790 (0.1123-2.3366) |
0.4023 (0.0569-1.0258) |
54% |
| 5980 | 5.18 (2.94 -9.16) |
3.12 (1.71-5.65) |
40% | 0.5424 (0.1662-1.113) |
0.4938 (0.1503-1.0230) |
9% | 0.9900 (0.7308-1.3333) |
0.7535 (0.5476-1.0150) |
24% |
| 7132 | 8.10 (4.56-13.94) |
0.69 (0.18 - 1.71) |
91% | 0.9294 (0.1007-2.4381) |
0.5131 (0.0633-1.3739) |
45% | 1.4376 (0.7584-3.0630) |
0.6549 (0.3428-1.1190) |
54% |
|
7452 |
5.95 (2.59-14.12) |
2.04 (0.87 - 4.59) |
66% |
0.0533 (0.0025-0.2206) |
0.0053 (0.0000-0.0367) |
90% |
0.22 (0.1069-0.3585) |
0.071 (0.0239-0.1353) |
68% |
| 9258 | 7.41 (3.17 -16.15) |
3.13 (1.12 - 6.87) |
58% | 1.4932 (0.6621-2.5552) |
1.3631 (0.6518-2.2591) |
9% | 1.8775 (1.3169-2.8592) |
1.2291 (0.8874-1.7322) |
35% |
| 9525 | 5.90 (3.40 - 10.6) |
1.85 (0.80 - 3.70) |
69% | 1.8450 (0.0094-5.834) |
0.3086 (0.0000-2.1434) |
83% | 1.4753 (0.8719-2.6497) |
0.7025 (0.3099-1.2679) |
52% |
†:Based on vaccination of a new set of animals for PSPT using optimal dosing.
Disclaimer/Publisher’s Note: The statements, opinions and data contained in all publications are solely those of the individual author(s) and contributor(s) and not of MDPI and/or the editor(s). MDPI and/or the editor(s) disclaim responsibility for any injury to people or property resulting from any ideas, methods, instructions or products referred to in the content. |
© 2023 by the authors. Licensee MDPI, Basel, Switzerland. This article is an open access article distributed under the terms and conditions of the Creative Commons Attribution (CC BY) license (http://creativecommons.org/licenses/by/4.0/).
Copyright: This open access article is published under a Creative Commons CC BY 4.0 license, which permit the free download, distribution, and reuse, provided that the author and preprint are cited in any reuse.


