
Submitted:
03 November 2023
Posted:
06 November 2023
You are already at the latest version
Abstract
Studies suggest that chronic psychological stress can lead to oral health deterioration, alter the immune response, and possibly contribute to increased inflammation, which can impact the physiological healing of periodontal tissues. This cross-sectional study seeks to assess and improve clinical understanding regarding the relationship between perceived stress, mindfulness, and periodontal health. A total of 203 people were analysed from December 2022 to June 2023. The Periodontal Screening and Recording (PSR), score and Bleeding Index (GBI), and Plaque Control Record (PCR) of every patient were registered. Subsequently, participants completed the Sheldon Cohen Perceived Stress Scale (PSS) and the Mind-fulness Awareness Attention Scale (MAAS) questionnaires. The collected data was analysed statistically, and correlations and dependencies were evaluated. The p-value was 0.004265 in Welch's t-test to assess the relationship between MAAS and the variable's presence or absence of periodontitis, highlighting that patients with periodontitis have significantly different MAAS scores compared to patients unaffected by periodontitis. The Pearson correlations between GBI and perceived stress, PCR and perceived stress, and PCR and MAAS resulted in p-values of 2.2-16, 3.925-8, and 2.468-8, respectively, indicating a statistically significant correlation in this case. Despite the limitations, the findings of this study suggest a significant relationship between psychological stress, mindfulness and periodontal tissue health. Clinical trials are necessary to incorporate the assessment of a patient’s psychological status as a new valuable tool in the management of periodontal health.
Keywords:
Periodontal Health
; Perceived Stress
; Mindfulness
; Bleeding Index
; Periodontitis
1. Introduction
Periodontitis is a multifactorial chronic inflammatory disease characterised by the progressive destruction of the tooth-supporting apparatus. Its main characteristics include the loss of support of the tissue that supports the teeth, which manifests through:
- The clinical attachment loss (CAL).
- Radiographically evaluated loss of alveolar bone (bone surrounding the tooth's root).
- The presence of periodontal pockets (pathological deepening of the gingival sulcus).
- Gingival bleeding.
Periodontitis is closely linked to lifestyle factors caused by certain bacterial species, and numerous local and systemic factors influence its course. Poor oral hygiene, smoking, diabetes, systemic diseases that alter the immune response, certain genetic anomalies, and stress significantly affect clinical expression. It has been estimated that 60% of the population is affected by periodontitis, but 10-14% suffer from it severely (stage III and IV periodontitis). The latter is the leading cause of tooth loss in adulthood and systemic inflammation. It is, therefore, essential to diagnose and treat periodontitis early to avoid serious functional, aesthetic, and potential systemic consequences.[1]
The new classification of periodontal and gingival diseases and conditions updates the historical Armitage classification from 1999. The research documents and reports from the 2017 World Workshop of the European Federation of Periodontology (EFP) and the American Academy of Periodontology (AAP) were shared in the Journal of Periodontology and formally presented by both organisations at the EuroPerio9 congress in Amsterdam in June 2018. The EFP-AAP (2018) classification introduces five different categories, starting from the concept of dental health, then considering gingivitis, periodontitis and periimplantitis.[2]
Chronic gingivitis can progress to deeper tissues with evidence of loss of connective attachment, bone destruction, apical migration of the junctional epithelium, and ultimately, the formation of a periodontal pocket (pathologic deepening of the gingival sulcus) above or within the bone. The clinical signs of periodontal disease are similar to those of gingivitis but generally chronic: gingival recession, bleeding, attachment loss, root furcation lesions, pockets, extrusion or migration (collapse of the bite), with the formation of diastema (increased space between teeth) and ultimately loss of teeth.
Periodontal disease, generally asymptomatic or with sensations of itchy gums, sensitivity to cold or hot, and bad breath, does not affect all areas of the oral cavity simultaneously or with the same intensity. Still, each area constitutes a separate microenvironment with its specific microbiome, making this pathology site-specific. The bone resorption is mediated by prostaglandins PgE2, synthesised mainly by macrophages in inflamed tissues, as well as other cytokines (mediators of inflammation) and factors that act predominantly by activating osteoclasts (cells that destroy bone of hematopoietic origin) and by promoting their differentiation. Periodontitis should be considered an episodic phenomenon characterised by alternating acute phases of tissue destruction and quiescent phases in which tissues are not further damaged.[3]
During the quiescence phase, such alterations do not occur, but this does not mean that, in the absence of treatment, spontaneous healing occurs, as connective tissue inflammation persists. It is important to emphasise that the latency phase is not characterised by improvement but as a static phase. A subsequent acute phase means further worsening of an already compromised condition. This probably occurs due to the unstable equilibrium between the host's defence system and pathogenic microorganisms. Most tissue injuries arise indirectly due to the inflammation and immune processes activated by plaque microorganisms. Attachment loss is not uniform over time but occurs through different exacerbation episodes; it rarely co-occurs in the entire dentition but only in some sites. During these acute episodes, attachment loss can be extremely high, followed by even very long periods of quiescence. During the quiescence phase, the histological picture is similar to that of stabilised gingivitis; in the active phase, on the other hand, defence mechanisms are activated, which are the main cause of tissue damage.
The dentist can issue the definitive diagnosis of periodontal disease through a comprehensive documentation of clinical biometric parameters:
- Measuring and recording in a specific folder called a periodontal chart the values of pocket depth (in mm), recession, total attachment loss, furcation lesions, mobility, and keratinised gum.
- Radiological examination.
Distance monitoring with subsequent radiographic exams, performed solely by the dentist with exact justification, enables monitoring periodontal disease and its progression.[4]
It is proven that, although bacteria are indispensable, they are insufficient for periodontal disease to manifest. The aetiology of periodontal disease is multifactorial, and for it to display actively, the following are necessary:
- Susceptible host.
- Environmental factors.
- Presence of a microbiome (the totality of the genetic heritage expressed by the microbiota, i.e., the population of microorganisms that colonise the oral cavity) periodontal pathogenic, associated with the absence of beneficial species (which enter into competition with pathogenic species in obtaining nutrients or produce enzymes toxic to periodontal pathogens).
For example, the disease is partially hereditary due to inadequate or altered immune response.[5]
Heredity plays an important role, especially in patients with early-onset periodontitis. Possible host-related risk factors include diabetes, HIV infection, and the use of certain medications or smoking.
Environmental risk factors that aggravate the disease include smoking, poor oral hygiene, or conditions that promote plaque retention. Smoking significantly increases the host's susceptibility and alters healing mechanisms, producing vasoconstriction that decreases peripheral blood flow and appears responsible for a greater accumulation of certain bacterial species that are most pathogenic.
The conditio sine qua non for the clinical manifestation of the pathology is the presence of one or more specific clonal periodontal pathogens in sufficient quantity. In the case of periodontitis, opportunistic pathogens present in the oral microbiota do generally not cause damage. Still, in certain situations, selective reproduction leads to an inflammatory process with consequent tissue damage. The oral microbiota is in continuous evolution, influenced by the person's age, their habits of home hygiene (frequency and effectiveness of brushing, cleaning of interdental spaces), the type of diet (especially if they consume soft and sticky foods), pharmacological therapies, as well as the site where deposits form. The amount of plaque deposited is similar in both sexes, but literature reports that women can better remove it and present deposits of lesser extent.
The presence of a risk factor implies a direct increase in the likelihood of getting sick and the risk of progression of periodontal disease. Since pathogenic bacteria are necessary but insufficient for the disease to manifest, risk factors represent elements that must be carefully evaluated and towards which therapeutic attitudes should be directed. These factors determine qualitative-quantitative alterations of the subgingival microbiota. The treatment of periodontitis must consider the risk factors associated with a greater disease progression or a lower reactivity to bacterial reduction therapies to modify the estimation of the patient's future disease course.[6]
We can define staging as the snapshot of the patient at the time of the visit, which provides us with the severity index of the disease based on the loss of interproximal attachment, CAL/PAC, and RBL (Radiographic Bone Loss). It refers to the concepts of severity and extension of the disease based on the extent and distribution of dental compromise, introducing the complexity of managing and treating the individual patient. The staging includes the following four stages of the disease:
Stage I: Initial periodontitis.
Stage II: moderate periodontitis.
Stage III: severe periodontitis with potential tooth loss.
Stage IV: advanced periodontitis with extensive tooth loss and potential outcome of edentulism.
For grading, there are three grades: A, B, and C, corresponding to levels of disease progression speed:
- Grade A: low.
- Grade B: moderate.
- Grade C: high.
Grade A: The progression rate is slow, and the patient has no risk factors: they are not smokers or diabetic. There has been no loss of alveolar bone in the last 5 years; the percentage ratio of bone lost to age (bone/age) is less than 0.25; there are high plaque deposits with low levels of periodontal damage.
Grade B: There is a moderate risk of progression, and the patient has risk factors: they smoke fewer than 10 cigarettes per day, and in diabetic patients, glycated haemoglobin levels are <7%. The loss of alveolar bone is less than 2 mm in 5 years, the percentage ratio of bone lost to age (bone/age) is between 0.25 and 1 (inclusive), and the periodontal damage is proportional to the plaque deposits.
Grade C: There is a high risk of rapid progression as the patient has evident risk factors: they smoke 10 or more cigarettes daily, and in diabetic patients, glycated haemoglobin levels are ≥7%. The loss of alveolar bone is less than 2 mm in 5 years, the percentage ratio of bone lost to age (bone/age) is >1, and the periodontal damage is excessive relative to the present plaque deposits.
1.1. Psychological aspects in patients with periodontitis
The term stress was defined by Hans Selye in 1936 as the "General Adaptation Syndrome" [7]
which is the response that the body undergoes when subjected to the prolonged effects of multiple stressors, such as physical (e.g. fatigue), mental (e.g. work demands), and social or environmental stimuli (e.g. social obligations or demands).[8]
In reality, stress is a reaction that occurs when there is a perceived imbalance between the received stimuli and the available resources. It is specifically a general adaptation syndrome (GAS) to restore a new internal balance (homeostasis) following stressors. Altered inner balance can occur at the endocrine, humoral, organic, and biological levels.
The syndrome can be physiological but also have pathological and chronic repercussions within the psychosomatic field. There is a distinction between eustress and distress, which refer to "good" and "bad" stress.
In general, responses following exposure to stressors can be grouped into two ways:
- Instantaneous responses, due to the nature and physiology of the nervous system (e.g. the sympathetic nervous system that uses pre-synthesized and stored neurotransmitters);
- Delayed responses due to the nature and physiology of the endocrine and neuroendocrine systems (e.g. reception of the stressor, activation of protein transcription, synthesis of hormones, and release of these into the circulatory system).
Although responses vary according to different stressors, the response mechanism is stereotyped. First, it determines an instantaneous response through stimulation of the SSMS (sympathetic nervous system →, adrenal medulla)—subsequently, a delayed response through the action of the HPA axis (Hypothalamic-Pituitary-Adrenal axis).
The evolution of the syndrome occurs in three stages.
Stage 1: Alarm reaction divided into two phases:
- Shock phase: The body perceives the stressor and has yet to formulate a response to cope with it (e.g. deciding whether to modify the internal or external environment). Adaptation is not yet present. Thus, resistance to the stressor is minimal.
- Anti-shock phase: The body responds to stress by implementing physical and mental coping mechanisms. Examples include increased heart rate, blood pressure, muscle tone, and arousal (psychophysiological activation). In general, in the physical response, the Sympathetic System Adrenal Medulla is activated instantaneously, allowing for the release of catecholamines into the bloodstream (explaining tachycardia, muscle contraction, and other factors typical of the fight or flight response). After a few hours and partially, the hypothalamic-pituitary-adrenal axis allows for the release of glucocorticoids into the bloodstream.
Stage 2: Resistance The body attempts to fight and counteract the negative effects of prolonged fatigue by producing specific hormonal responses from various endocrine glands, such as the adrenal glands. The delayed response is prevalent, and its duration is correlated to the duration of exposure to the stressor and the organism's energy reserves.
Stage 3: Exhaustion or Recovery: Exhaustion, if stress factors continue to act, the individual may become overwhelmed, and permanent adverse effects may occur on the psychological and somatic structure.[9]
Recovery is if the body has been able to eliminate the effects of the stressor (modification of the internal environment or the homeostatic set-point) or the stressor itself (modification of the external environment). An example of a simple and stereotyped response is as follows:
- Exposure to stressors or prediction of a stressor in the future (feed-forward mechanism).
- Receipt of the stressor and possible processing of the message.
- Implement the adaptation syndrome and modification of different homeostatic systems' normal values ("set point").
Stress is a risk factor for periodontitis and oral diseases as it alters the immune response towards bacterial dysbiosis, increasing susceptibility to periodontitis. The stress linked to periodontitis is divided into three groups: micro-stress, which includes everyday discomfort and tension; stress due to significant life events, such as divorce; and emergencies, disasters, or crises. These forms of stress can be associated with compromised periodontal status and disease progression. Another consequence of stress on the oral cavity is the increased risk of developing conditions such as bruxism or teeth clenching.[9]
When we think of hormones produced by stress, the most common one is adrenaline. However, cortisol has direct and negative effects on periodontal health. Cortisol is a “glucocorticoid” produced by the cortex of the adrenal gland. In sporadic acute stress situations, it positively affects our body (such as reducing inflammation) and activates our immune system. On the other hand, chronic cortisol production impairs our immune competence and increases susceptibility to periodontal disease. Cortisol reduces the body's inflammatory response and increases glucose levels in the blood, making the body more susceptible to infectious diseases. People with periodontitis who report stress and tension have elevated cortisol levels measured in blood serum and saliva. The measurement of cortisol is not yet a common procedure in dental practice, but it could be used to assess stress in the future.[11]
In addition to prolonged cortisol production and its effects on periodontal tissues, psychological stress can indirectly affect periodontal health through changes in behaviour and lifestyle. Indeed, individuals who report being under stress are more likely to neglect their oral hygiene, smoke, drink more, sleep less, and adopt an unhealthy diet by consuming more fats and sugars. The main risk factors related to stress and periodontal disease are:
- Lack of sleep.
- Poor nutrition.
- Poor oral hygiene.
- Excessive smoking.
- little physical activity.
- Alcohol consumption.
- Recent illnesses.
Therefore, while poor oral hygiene leads to plaque buildup and directly affects periodontal health, smoking, nutrition, and sleep disturbances do so through altered body responses.[11]
1.2. Mindfulness
Mindfulness is an English word that means awareness. It is the English translation of the word 'sati', which means 'mindful attention' in the Pali language, or intentional awareness maintained with effort. It is an umbrella term that now refers to both a psychological technique and an approach of the new cognitive and behavioural psychology generation. It also focuses on the present experience and brings it back to the present every time one gets distracted. It is the act of the mind observing itself, remaining detached from its contents (sensations and thoughts) and not fused with them.
The mindfulness theory is based on the rediscovery of methods of psychological change based on intuitive self-knowledge, in integration with discursive and verbal problem-solving methods. In other words, before promoting the questioning of erroneous or irrational beliefs that generate suffering, the therapist acts first by helping the person change their relationship with their mental contents. It has been observed that much of the suffering depends on identification with thoughts (“I am my thoughts”, “thoughts are facts”). At the same time, the first step towards change occurs through cognitive distancing from experiences that impose themselves in the field of consciousness (“I have thoughts”, “thoughts are hypotheses”).[13]
This change generates the flexible ability to operate, when necessary, a detachment from mental contents, which allows them to be observed more clearly. This detachment (detached mindfulness) [14] reduces automatic reactivity, leading every human being to make rapid efforts to avoid suffering. Ironically, these efforts can be sources of further suffering since they are based on unrealistic ideals of emotional "transparency", emphasise the unacceptability of the present moment, and place happiness goals in the future. Mindfulness promotes experiences of acceptance of the present, a wider and gentler understanding of difficulties, and tolerance of negative emotions and perceptions.
Of particular interest is the presence of empirical studies that prove the effects of consistent meditative practice on certain key anatomical structures of the brain [14] responsible for regulating emotions and cellular and metabolic activity within entire body regions. These effects reflect a positive change in brain function and extended health benefits throughout the entire body, which can be measured through blood parameters that are not attainable with other relaxation techniques.
These effects include:
- Increase and remodulation of activity in the left prefrontal cortex, an area of the brain involved in processing positive emotions.[16]
- Increase and remodulation of activity in the deep nuclei of the right hemisphere (intuitive and digital part of the existential and perceptive experience) and in the amygdala (brain structure connected to the experience of fear).[17]
- Neuro-modulated intervention by cytokines, other neuromodulators, and glucocorticoids on the hypothalamic-pituitary axes and cortisol secretion.[18]
- Decrease in inflammatory markers such as interleukin-6; adaptive modulation of cell-mediated immunity.[19]
- Protective effects on DNA mediated by increased telomerase activity.[20]
- Decrease in signs of ageing at both the cellular and brain levels and improvement of some disabling pathologies.[21]
These effects are reflected in psychological effects such as increased stress management abilities, prevention of depressive relapses, anxiety management, tension and emotionality, increased creativity and feelings of happiness.[22]
The study and application of mindfulness intersect psychology, neuroscience, and medical fields such as behavioural medicine, rehabilitation, gynaecology, oncology, endocrinology, cardiology, immunology, algology, and psychosomatic medicine.
This study aims to evaluate the relationship between periodontal health, stress, and mindfulness through the assessment of clinical data collected from a periodontal analysis, as well as attitudinal test and assessment results that measure subjective perception of stress and mindfulness
2. Materials and Methods
The study was conducted between January and June 2023 with national and international guidelines. It was registered in the National Library of Medicine and National Center for Biotechnology Information with the identifier code NCT05849415.
Patients scheduled to receive other dental treatments were invited to participate in the study voluntarily. Before the commencement of the study, all participants were given an information letter outlining the study procedure, data evaluation, and data protection measures. To ensure anonymity, each participant was assigned an ID number.
The only inclusion criterion was being at least 18 years old. The exclusion criteria were:
- Pregnancy.
- Administration of antibiotics in the last 15 days before entry into the study or indications for antibiotic prophylaxis.
- Orthodontic Appliances.
- Immunological diseases or use of drugs that can affect oral tissues (phenytoin, cyclosporine), nifedipine, chronic use of nonsteroidal anti-inflammatory drugs.
- Refusal to participate in the study.
The participants' general condition and dental history were evaluated by medical interview (these data were self-reported by the subjects).
Clinical data of all teeth, excluding third molars, were obtained during oral examinations at initial visits. Accredited Oral Hygienists and Dentists performed whole-mouth oral examinations. The manual periodontal probe PCPUNC15 was used for oral examinations. Oral examinations included periodontal pocket depth (PPD; 6 sites per tooth) (Figure 1) and bleeding on probing (GBI; 4 sites per tooth).[23]
These data were collected in a periodontal charting, and the Periodontal Screening and Recording (PSR) score and Bleeding Index (GBI) were calculated.
The mouth has been divided into sextants or sections – right maxillary, left maxillary, anterior mandibular, and posterior mandibular. The highest score of the following has been recorded for each tooth in each sextant:
- 0 for healthy periodontium,
- 1 for bleeding upon probing or dental calculus,
- 2 for pocket depth less than or equal to 3.5 mm,
- 3 for pocket depth greater than 3.5 mm and less than or equal to 5.5 mm,
- 4 for pocket depth greater than 5.5 mm,
- X for tooth/teeth missing or excluded from recording.
The scores for each sextant have been added up and divided by the number of teeth in that sextant to obtain the sextant score. The overall PSR score has been calculated by taking the highest sextant score.[24]
The Gingival Bleeding Index (GBI) was performed to assess the presence or absence of gingival inflammation. Bleeding areas were determined by running the periodontal probe over four points per tooth (mesial, distal, buccal, and lingual). (Figure 2) The calculation to obtain the percentage value was as follows: number of bleeding sites/number of evaluated sites x 100.
After careful assessment, it was recorded on each patient whether they were affected by periodontal disease (1) or not (0).
Subsequently, each patient completed 2 attitudinal and evaluation tests in paper or digital format. The first attitudinal test completed was the "Perceived Stress Scale", or PSS, which evaluates the subjective perception of stress. The questionnaire consists of 10 questions regarding feelings and thoughts during the last month. Possible answers range from 0 to 4 based on the severity or frequency with which the person has thought in a certain way. For each question, the alternatives are as follows: 0 - never, 1 - rarely, 2 - sometimes, 3 - reasonably often, 4 - very often. Therefore, the total score can range from 0 to 40. The range between 0 and 13 represents a perceived stress value that is either nonexistent or mild and well-managed. The range between 14 and 26 represents a moderate stress value that can negatively affect physical and mental health. The range between 27 and 40 represents a severe perceived stress value that significantly compromises physical and mental health.
The second test administered to the patients was the Mindfulness Awareness Attention Scale, which measures an individual's tendency towards intentional awareness based on the frequency with which they are either mind-full or mind-less in their experiences. To measure the scale, one must calculate the average of the 15 responses. Higher scores reflect higher levels of disposition towards Mindfulness.
All files have been collected, and a statistical analysis has been performed. The following basic statistics have been calculated for the variables: Age, PCR, GBI, PSR, PSS, and MAAS. The occurrences for the variables "Gender" and "Periodontitis" were then calculated. The Poisson regression analysis was performed with the variable "Periodontitis" as the dependent variable, and you included the variables "GBI", "Age", "Perceived stress", and "PCR" as predictors in the model. A difference test between two groups (0 and 1) was then performed for the numeric variable MAAS, divided based on the variable periodontitis (presence or absence of periodontitis). A linear regression analysis was then performed using the lm model in R. The Chi-square test of Pearson was finally conducted to evaluate the association between the two categorical variables "Perceived Stress" and "MAAS" in the dataset
3. Results
3.1. Descriptive statistics
Data description:
The dataset contains 203 observations and 8 variables. The following basic statistics have been calculated for the variables. (Table 1)
The occurrences for the variables "Gender" and "Periodontitis" respectively show 96 females and 107 males, and for Periodontitis, 57 negative responses (0) and 146 positive responses (1).
The frequency of Periodontitis divided by gender is illustrated in Figure 3.
Correlations between numerical variables are present in Table 2.
3.2. Poisson regression analysis
The variable "Periodontitis" was considered the dependent variable, and the variables "GBI," "Age," "Perceived Stress," and "PCR" were included as predictors in the model.
- Coefficients: The intercept has an estimated coefficient of -2.821865. The estimated coefficients for the other variables were 0.003751 for GBI, 0.023832 for Age, 0.025005 for Perceived Stress, and 0.008672 for PCR.
- Significance: P-values was associated with the significance tests "Pr(>|z|)" for each coefficient. A p-value lower than 0.05 indicates that the coefficient was statistically significant. In this case, “Age”' and “Perceived Stress” have p-values lower than 0.05, indicating a significant association with Periodontitis.
- Residual deviance: The residual deviance measures the difference between the fitted model and the observed data. The residual deviance was 75.801. A lower value indicates a better fit of the model to the data.
- AIC: The AIC (Akaike Information Criterion) is a model selection criterion penalising more complex models. A lower AIC value indicates a better balance between model fit and complexity. In this case, the AIC was 377.8.
- Iterazioni di Fisher Scoring: The number of Fisher Scoring iterations shows how many times the estimation algorithm has iterated to converge to the final result. In this case, 5 iterations were performed
The model indicates that “Age” and “Perceived Stress” are significantly associated with the dependent variable Periodontitis. GBI and PCR, however, do not show a significant association with Periodontitis in the context of Poisson Regression.
The scatter plot between age and perceived stress is depicted in the chart below (Figure 4).
The average of numerical variables for each category of the categorical variable of gender is present in Table 3.
The distribution of MAAS by gender is represented in Figure 5.
3.3. Test t di Welch
The test used is Welch's t-test, a modified version of the t-test used to compare the means of two groups, assuming that the variances of the groups can be different.
- T-statistic: The t-statistic calculated was 2.9327
- Degrees of freedom: Degrees of freedom were calculated to be 89.695.
- Probability value p: The p-value was 0.004265. It represents the probability of observing a difference in means as extreme or more extreme between the two groups, assuming that there is no actual difference in means. In this case, the p-value was less than 0.05, indicating sufficient evidence to claim a significant difference in means between the two groups.
- Alternative hypothesis: The alternative hypothesis states that the actual difference between the means of group 0 and group 1 is not equal to zero.
- Confidence interval: The 95% confidence interval was calculated as 0.1689839 to 0.8788412. This interval indicates the range in which the true average difference between the two groups is estimated to lie, with a confidence level of 95%.
- Estimates of the means: The means estimates for the two groups are 3.940351 for group 0 (absence of periodontitis) and 3.416438 for group 1 (presence of periodontitis).
The test reveals a significant difference in the mean scores of MAAS between the two groups (0 and 1) divided based on the variable “periodontitis”, as the p-value is below 0.05.
3.4. Linear regression
A linear regression analysis was performed using the lm model in R. The linear regression allowed us to examine the relationship between a response variable (Gum Disease) and one or more predictor variables (GBI, Age, Perceived Stress, PCR). Here is an explanation of the main reported results:
Residuals: Residuals represent the difference between the observed values of the response variable (Periodontitis) and the values predicted by the regression model. The minimum values of the residuals were -1.04069, the 1st quartile was -0.24429, the median was 0.08324, the 3rd quartile was 0.28131, and the maximum value of the residuals was 0.91313.
Coefficients: The estimated coefficients for the predictor variables are as follows:
The intercept had an estimated value of -0.893105 with a standard error of 0.161196.
The coefficient for the GBI variable had an estimated value of 0.002318 with a standard error of 0.001601.
The coefficient for the ETA variable had an estimated value of 0.016056 with a standard error of 0.002217.
The coefficient for the STRESS variable had an estimated value of 0.015882 with a standard error of 0.003671.
The coefficient for the PCR variable had an estimated value of 0.006412 with a standard error of 0.002139.
T value: The t statistic measures the significance of the coefficients. The t values for the coefficients are as follows:
For Intercept: -5.540
For GBI: 1.448
For Age: 7.242
For Perceived Stress: 4.327
For PCR: 2.997
Pr (>t ): This value p represents the probability of obtaining a coefficient value equal to or more extreme than the one observed, assuming that the null hypothesis is true. The p-values for the coefficients were as follows:
For Intercept: 9.53e-08 (very small, indicating high statistical significance)
For GBI: 0.14933 (not significant at the 0.05 level)
For Age: 9.60e-12 (very small, indicating high statistical significance)
For Perceived Stress: 2.40-05 (very small, indicating high statistical significance)
For PCR: 0.00307 (significant at the 0.05 level)
Residual standard error: The residual standard error was 0.3692, representing an estimate of the standard deviation of the residuals in the model.
Multiple R-squared: The multiple R-squared coefficient was 0.3418, which means that the predictive variables in the model explain 34.18% of the variance in the response variable.
Adjusted R-squared: The adjusted R-squared for the number of predictors in the model is 0.3285.
F-statistic: The F-statistic was 25.71 with a p-value lower than 2.2-16, indicating that the overall regression model is statistically significant.
All described data has been represented in Figure 6 a, b.
3.5. Correlation test between periodontitis and PSS
The Pearson correlation test was conducted between the variables Periodontitis and PSS in the dataset.
- t-value: The value of t was 3.1873, representing the sample correlation's standard deviation compared to the hypothesised correlation (0). A larger t value indicates stronger evidence in favour of a significant correlation.
- df: The degree of freedom was 201, representing the sample size minus 2.
- p-value: The p-value was 0.001666, representing the probability of obtaining a sample correlation as extreme as the one measured, assuming no correlation exists in the population. A p-value lower than the common significance level (usually 0.05) indicates a statistically significant correlation.
- Alternative hypothesis: The alternative hypothesis indicates that the true correlation was not equal to 0.
- Confidence interval: The 95% confidence interval for the correlation ranges from 0.08417104 to 0.34657984. This interval provides a range of plausible values for the correlation in the population.
- Sample estimates: The sample estimate of the correlation between the two variables was 0.2193385.
- X-squared: The value of X-squared was 1706.9, which represents the Chi-square test statistic. This value indicates the discrepancy between the observed and expected frequencies under the null hypothesis of independence between variables. A higher value indicates stronger evidence against the null hypothesis of independence.
The correlation test shows a significant positive correlation (0.2193385) between Periodontitis and Perceived Stress.
3.6. Association test between PSS and MAAS
The Pearson chi-square test was performed to evaluate the association between the two categorical variables, Perceived stress and MAAS, in the dataset.
- X-squared: The value of X-squared was 1706.9, which represents the Chi-square test statistic. This value indicates the discrepancy between the observed and expected frequencies under the null hypothesis of independence between variables. A higher value indicates stronger evidence against the null hypothesis of independence.
- df: The degrees of freedom were 1287, representing the number of categories minus 1.
- p-value: The p-value was 2.543, representing the probability of obtaining such a large discrepancy between the observed and expected frequencies, assuming the variables are independent. A very small p-value indicates strong evidence to reject the null hypothesis of independence.
The Chi-square test shows a significant association between Perceived Stress and MAAS. The high X-squared value and low p-value indicate that the two variables are not independent and that there is an association between them.
3.7. Correlation test between GBI and PSS.
The Pearson correlation test was performed between GBI and Perceived Stress variables in the dataset. Here is the explanation of the results:
- t-value: The t-value is the t-test statistic associated with the correlation calculation. In this case, the t-value was 12.986.
- df: The degrees of freedom represent the degrees of freedom of the t-test. In this case, there are 201 degrees of freedom.
- p-value: The p-value is the probability value associated with the t-test. In this case, the p-value is very small (p-value < 2.2-16), which indicates that the correlation is statistically significant.
- Alternative hypothesis: The alternative hypothesis of the test, that is, the true correlation between the variables is not equal to zero.
- Confidence interval: The confidence interval was 95% for the correlation. In this case, the interval ranges from 0.5928944 to 0.7439638. This means we can be 95% certain that the true correlation between the variables lies within this interval.
- Sample estimates: It represents the sample estimator of the correlation. In this case, the estimator of the Pearson correlation was 0.6754551, which is the estimated value of the correlation between the variables in the dataset. This value suggests a moderately strong positive correlation between perceived GBI and Perceived Stress.
3.8. Correlation test between GBI and MAAS
The Pearson correlation test was conducted between the variables GBI and MAAS in the dataset. Here is an explanation of the results:
- t-value: The t-value results from the t-test associated with calculating the correlation. In this case, the t value was -16.014.
- Confidence interval: The 95% confidence interval for the correlation. In this case, the interval ranges from -0.8035839 to -0.6812629. This means we can be 95% confident that the true correlation between the variables falls within this interval.
- Sample estimates: It represents the sample estimator of the correlation. In this case, the estimator of Pearson's correlation was -0.7487295, which is the estimated value of the correlation between the variables in the data sample. This value suggests a moderately strong negative correlation between GBI and MAAS.
3.9. Correlation test between PCR and PSS
We performed the dataset's Pearson correlation test between PCR and Perceived Stress variables. Here is the explanation of the results:
- t-value: The t-value is the result of the t-test associated with the correlation calculation. In this case, the t-value was -5.7146.
- p-value: In this case, the p-value was very small (p-value = 3.925-08), which indicates that the correlation is statistically significant.
- Confidence interval: The 95% confidence interval for the correlation. In this case, the interval ranged from -0.4865131 to -0.2489576. This means we can be 95% confident that the true correlation between the variables lies within this interval.
- Sample estimates: In this case, the Pearson correlation estimator is -0.3738504, the estimated correlation value between the variables in the data sample. This value suggests a moderate negative correlation between PCR and perceived stress.
3.10. Correlation test between PCR and MAAS
The Pearson correlation test between the variables PCR and MAAS was conducted in the dataset.
- t-value: The value was 5.3428
- p-value: In this case, the p-value is very small (p-value = 2.468-07), which indicates that the correlation is statistically significant.
- Confidence interval: In this case, the interval is between 0.2259032 and 0.4676427. This means we can be 95% confident that the true correlation between the variables lies within this interval.
- Sample estimates: It represents the sample estimator of the correlation. In this case, the estimator of the Pearson correlation was 0.3526427, which is the estimated value of the correlation between the variables in the data sample. This value suggests a moderate positive correlation between PCR and MAAS.
4. Discussion
Periodontitis is a disease closely associated with systemic and inflammatory disorders. Studies show a direct relationship between oral health and several chronic conditions, such as diabetes, osteoporosis, and obesity. [25,26,27,28]
Enhancing our comprehension of the molecular mechanisms that unite systemic and localised bone loss can provide valuable insights into prospective therapeutic approaches, enabling more effective co-management of these conditions.
For instance, several therapies that the Food and Drug Administration has approved to treat osteoporosis have demonstrated encouraging outcomes in managing periodontitis.[29]
The correlation between emotional stress and periodontal health is known.2 Research has also corroborated that these individuals exhibit heightened levels of salivary cortisol and inflammatory cytokines, including IL-1beta and IL-6, in their serum and crevicular fluid, ultimately resulting in gingival inflammation.[30]
Recent studies have shown that when a person experiences stress, their body produces corticotropin-releasing hormone (CRH), which can stimulate gingival mast cells. This, in turn, can cause the mast cells to release pro-inflammatory molecules along with other neuropeptides and cytokines, ultimately leading to periodontal disease.[31,32]
Recent in vitro studies suggest that elevated cortisol levels may play a role in the accelerated growth of P. gingivalis, a leading contributor to the development of gum disease. Furthermore, reduced immune function has been identified as a potential factor in worsening gingivitis and periodontitis. Additionally, research suggests that neuronal cells can release pro-inflammatory cytokines and chemokines, exacerbating chronic inflammation in the periodontium and further compromising immune fitness.[33,34]
A recent study analysed the chemical components of saliva in 117 patients. The biomarkers that have the potential to be categorised based on the intensity of the disease are the levels of salivary cortisol and chromogranin A. In patients diagnosed with gingivitis and periodontitis, cortisol levels above the normal range and an imbalanced cortisol/DHEA ratio correlate with psychological stress. These biomarkers can be important predictors in detecting and monitoring stress levels in affected patients.[35]
It is challenging to clinically determine how stress contributes to the development of periodontitis and how it affects periodontal treatment outcomes.[36]
Other studies have tried to relate oral and periodontal health to emotional stress quantitatively.[37]
A study on 621 individuals concludes that the frequency of periodontal problems. Among those exposed to stress, it was 15-36% higher than those without anxiety. The PSS test was used as a scale for evaluating perceived stress.[38]
Regarding treating chronic periodontitis, the data analysed corroborates the thesis that periodontitis patients with inadequate stress behaviour strategies (defensive coping) are at greater risk for severe periodontal disease.[39]
A study of 66 patients evaluated the influence of stress and anxiety on the response to non-surgical periodontal treatment in patients with chronic periodontitis, concluding that the data suggest a result of the trait of anxiety and stress on the response to non-surgical periodontal treatment. This study's psychological measures to assess stress and anxiety included The Stress Symptoms Inventory (SSI) and the Spielberger State-Trait Anxiety Inventory (STAI).[40]
In the analysis described in the present article, the psychological evaluation was performed using two tests compared to the mentioned articles. The first one was the Perceived Stress Scale. PSS is a widely used measure designed to assess perceptions of recent stress. A questionnaire is used in various fields of medicine to evaluate the relationship between stressful, emotional states and other medical conditions. [41,42,43,44,45]
The second test used was the MAAS. Researchers consider the MAAS a reliable scale of awareness with high reliability and a strong correlation with other related constructs such as meditation, rumination, and self-awareness, as well as a genuine measurement of mindfulness.[46]
The MAAS is a 15-item scale designed to assess a fundamental characteristic of Mindfulness, which is open or receptive awareness in bringing attention to what is happening in the here and now. The MAAS scale shows strong psychometric properties and has been validated by the scientific community in the psychiatric and psychological field and in patients with oncological pathologies. [47,48,49] Clinical evaluations and laboratory studies have shown that MAAS detects a unique quality of consciousness associated with and predictive of a range of self-regulation and well-being constructs.[50]
The Periodontal Screening and Recording (PSR) score and Bleeding Index (GBI) have been recorded from a dental clinical perspective.
The statistical analysis of the recorded data has shown that Age and Perceived Stress are significantly associated with Periodontitis. This was the conclusion drawn from the evaluation of the Poisson regression analysis. Poisson regression analysis is a statistical technique used to model count data, where the dependent variable represents the number of occurrences or events within a given period or sample. It is suitable for variables following a Poisson distribution, commonly characterised by non-negative integer values and a mean that equals its variance. In Poisson regression, the independent variables are used to predict or explain the occurrence or count of the dependent variable. Using maximum likelihood estimation, the technique estimates the relationship between the independent variables and the expected number of occurrences, known as the rate parameter. The regression model assumes that the logarithm of the rate parameter is linearly related to the independent variables, using a natural logarithm link function. The estimated coefficients from the regression analysis provide insight into the impact of the independent variables on the expected count or rate of occurrence.[51]
In this case, the variable "Periodontitis" was used as the dependent variable, and you included the variables "GBI", "Age", "Perceived stress", and "PCR" as predictors in the model.
The Pearson correlation test was conducted between GBI and Perceived stress, GBI and MAAS, PCR and Perceived stress, PCR and MAAS.
The correlation between perceived stress and the GBI and PCR variables could suggest a relationship between these variables. However, correlation does not imply causality, so we cannot state with certainty that an increase in perceived stress causes an increase in GBI and PCR percentages or vice versa. Other factors may be involved in the relationship between these variables.
In the following study, the following parameters were not evaluated: education level, current smoking habit, lung disease, and body mass index. Considering these parameters fundamental for the alteration of gingival bleeding and alteration of periodontal health status, a more thorough evaluation in the analysis of the study group could have provided a more in-depth analysis of the result. Peaks of stress are also linked to increased unhealthy lifestyles, constituting specific risk factors for periodontitis, such as a greater smoking habit, less physical activity, alcohol and sugar abuse, and less care for oral hygiene at home.[52]
From the statistical analysis, it also emerges that there is a significant difference in the mean scores of MAAS between the two groups (0 and 1) divided according to the variable of periodontitis. The test used for this assessment was the Welch's t-test.
The t-test is a statistical test used to determine if there is a significant difference between the means of two groups. It is typically used when comparing means of groups with normally distributed data. The t-test assumes that the variances of the two groups are equal. However, if the assumption of equal variances is violated, Welch's t-test, also known as the unequal variances t-test, can be used. Welch's t-test is a modification of the original t-test that does not assume equal variances between the two groups. This makes it more robust and reliable when the variances are unequal. Welch's t-test calculates the t-value by dividing the difference between the group means by the standard error, which considers the sample sizes and the variances of the groups. The degrees of freedom for Welch's t-test are calculated using a more complex formula that accounts for the unequal variances. The hypothesis testing and interpretation of Welch's t-test are the same as the traditional t-test. The null hypothesis is that there is no significant difference between the means of the two groups, and the alternative hypothesis is that there is a significant difference. A p-value is calculated, and if it is below a pre-determined significance level (typically 0.05), the null hypothesis is rejected, indicating a significant difference between the means of the two groups.[53]
In this case, the value was lower than 0.05, confirming that patients diagnosed with periodontitis responded with different MAAS indices compared to patients who did not.
5. Conclusions
From the statistical analysis of this study, it emerged that the values of the Perceived Stress test and the MAAS test are correlated with periodontal health. Specifically, there appears to be a relationship between high levels of Perceived Stress, low levels of Mindfulness, and the presence of periodontal pathology and gingival bleeding index. This correlation does not imply causality, so we cannot confidently assert that an increase in Perceived Stress causes an increase in GBI percentages or vice versa. Other factors are involved in the relationship between these variables.
Considering the limitations of this study, it is possible to assume that quantitative and qualitative assessment of the psychological variables could serve as a new tool in the management of periodontal health. However, further studies are needed to incorporate the assessment of a patient’s psychological status in treating periodontitis.
Author Contributions
Conceptualization, G.D., V.D., A.A., F.F. and M.M..; methodology, G.D., V.D., A.A., F.F. and M.M.; validation M.M.; formal analysis, R.S., F.P. and M.M..; investigation, G.D., V.D., A.A, M.M.; resources, F.F,M.M.; data curation, R.S., F.P. and M.M.; writing—original draft preparation, F.F. and M.M.; writing—review and editing, M.M..; visualisation, G.D., V.D., A.A., F.F. and M.M..; supervision, M.M..; project administration, M.M..; funding acquisition, F.F. All authors have read and agreed to the published version of the manuscript.
Funding
This research received no external funding.
Institutional Review Board Statement
The study was conducted by the Declaration of Helsinki and approved by the Institutional Review Board of the U.S. National Library of Medicine (protocol code NCT05849415).
Informed Consent Statement
Informed consent was obtained from all subjects involved in the study.
Conflicts of Interest
The authors declare no conflict of interest.
References
- Caton JC, Chapple ILC, Armitage G et al. A new classification scheme for periodontal and peri-implant diseases and conditions - Introduction and key changes from the 1999 classification. J Clin Periodontol 2018;45(Suppl 20):S1-S8.
- Tonetti MS, Greenwell H, Kornman KS. Staging and grading of periodontitis: Framework and proposal of a new classification and case definition. J Clin Periodontol 2018;45(Suppl 20):S149-S161.
- Pilbeam, C. Prostaglandins and Bone. Handb Exp Pharmacol. 2020;262:157-175.
- Rasperini G, Tavelli L, Barootchi S, McGuire MK, Zucchelli G, Pagni G, Stefanini M, Wang HL, Giannobile WV. Interproximal attachment gain: The challenge of periodontal regeneration. J Periodontol. 2021 Jul;92(7):931-946.
- Divaris, K. The Era of the Genome and Dental Medicine. J Dent Res. 2019 Aug;98(9):949-955.
- Darby, M. Comprehensive review of dental hygiene. 6th ed. Mosby’s Elsevier, St. Louis (Missouri), 2006.Kinane DF. Causation and pathogenesis of periodontal disease. Perio 2000 2001;25:8-20.
- Selye, H. , The Stress of life. McGraw-Hill (Paperback), New York. 1956. [Google Scholar]
- Macrì M, Flores NVG, Stefanelli R, Pegreffi F, Festa F. Interpreting the prevalence of musculoskeletal pain impacting Italian and Peruvian dentists likewise: A cross-sectional study. Front Public Health. 2023 Feb 9;11:1090683.
- Selye, H. , Hormones and Resistance. Springer-Verlag, Berlin. 1971. [Google Scholar]
- Castro MML, Ferreira RO, Fagundes NCF, Almeida APCPSC, Maia LC, Lima RR. Association between Psychological Stress and Periodontitis: A Systematic Review. Eur J Dent. 2020 Feb;14(1):171-179.
- Ballieux R, E. Impact of mental stress on the immune response. J Clin Periodontol. 1991;18(06):427–430.
- Ayub L G, Júnior A B, Grisi M F. Stress as possible risk factor for periodontal disease - literature review. R Periodontia. 2010;20(03):28–36.
- Jenny Gu, Clara Strauss e Rod Bond, How do mindfulness-based cognitive therapy and stress reduction improve mental health and wellbeing? A systematic review and meta-analysis of mediation studies, in Clinical Psychology Review, vol. 37, pp. 1–12,.
- Y Wells, A. , Detached Mindfulness in Cognitive Therapy: A Metacognitive Analysis and Ten Techniques, in Journal of Rational-Emotive and Cognitive- Behavior Therapy, vol. 3, n. 337-355.
- Davidson, R. (2005), Meditation and Neuroplasticity: training your brain, in Explore, 1(5), n. 380-388. B. Rael Cahn e John Polich, Meditation states and traits: EEG, ERP, and neuroimaging studies, in Psychological Bulletin, vol. 132, n. 2, marzo 2006, pp. 180–211.
- Shimomura, T. , Fujiki M., Akiyoshi J., Yoshida T., Tabata M., Kabasawa H., Kobayashi H., Functional brain mapping during recitation of Buddhist scriptures and repetition of the Namu Amida Butsu: a study in experienced Japanese monks, in Turk. Neurosurg., 18(2), n. 134-141.
- Desbordes, G. , Negi L.T., Pace T.W., Wallace B.A., Raison C.L., Schwartz E.L. (2012), Effects of mindful-attention and compassion meditation training on amygdala response to emotional stimuli in an ordinary, non-meditative state, in Front. Hum. Neurosc., vol. 6, n. 292.
- Brand, S. , Holsboer-Trachsler E., Naranjo J.R., Schmidt S. (2012), Influence of mindfulness practice on cortisol and sleep in long-term and short-term meditators, in Neuropsychobiology, 65 (3), n. 109-18.
- Davidson, R.J. , Kabat-Zinn J., Schumacher J., Rosenkranz M., Muller D., Santorelli S.F., Urbanowski F., Harrington A., Bonus K., Sheridan J.F. (2003), Alterations in brain and immune function produced by mindfulness meditation, in Psychosom. Med, 65(4), n. 564-70.
- jacobs, T. e coll. (2011), Intensive Meditation Training, Immune Cell Telomerase and Psychological Mediator, in Psychoneuroendocrinology, 36(5), n. 664-681.
- Elissa Epel, Jennifer Daubenmier e Judith T. Moskowitz, Can meditation slow rate of cellular aging? Cognitive stress, mindfulness, and telomeres, in Annals of the New York Academy of Sciences, vol. 1172, 2009-8, pp. 34–53.
- Wataru Sato, Takanori Kochiyama e Shota Uono, The structural neural substrate of subjective happiness, in Scientific Reports, vol. 5, 20 novembre 2015.
- O’Leary TJ, Drake RB, Naylor JE. The plaque control record. J Periodontol. 1972;43(1):38–8.
- Landry RG, Jean M. Periodontal Screening and Recording (PSR) Index: precursors, utility and limitations in a clinical setting. Int Dent J. 2002 Feb;52(1):35-40.
- Martinez-Herrera M, Silvestre-Rangil J, Silvestre FJ. Association between obesity and periodontal disease. A systematic review of epidemiological studies and controlled clinical trials. Med Oral Patol Oral Cir Bucal. 2017 Nov 1;22(6):e708-e715.
- Polak D, Shapira L. An update on the evidence for pathogenic mechanisms that may link periodontitis and diabetes. J Clin Periodontol. 2018 Feb;45(2):150-166.
- Raindi, D. Nutrition and Periodontal Disease. Dent Update. 2016 Jan-Feb;43(1):66-8, 71-2.
- Badiger AB, Gowda TM, Chandra K, Mehta DS. Bilateral Interrelationship of Diabetes and Periodontium. Curr Diabetes Rev. 2019;15(5):357-362.
- Yu B, Wang CY. Osteoporosis and periodontal diseases - An update on their association and mechanistic links. Periodontol 2000. 2022 Jun;89(1):99-113.
- Doyle CJ, Bartold PM. How does stress influence periodontitis? J Int Acad Periodontol. 2012 Apr;14(2):42-9.
- Festa F, Medori S, Macrì M. Move Your Body, Boost Your Brain: The Positive Impact of Physical Activity on Cognition across All Age Groups. Biomedicines. 2023 Jun 20;11(6):1765.
- Papathanasiou E, Palaska I, Theoharides TC. Stress hormones regulate periodontal inflammation. J Biol Regul Homeost Agents. 2013 Jul-Sep;27(3):621-6.
- Macrì M, Rendina F, Feragalli B, Pegreffi F, Festa F. Prevalence of Ponticulus Posticus and Migraine in 220 Orthodontic Patients: A Cross-Sectional Study. Biology (Basel). 2023 Mar 20;12(3):471.
- vPitzurra L, Loos BG. Stress en parodontitis [Stress and periodontitis]. Ned Tijdschr Tandheelkd. 2020 Jun;127(6):358-364. Dutch. [CrossRef]
- Lee YH, Suk C, Shin SI, Hong JY. Salivary cortisol, dehydroepiandrosterone, and chromogranin A levels in patients with gingivitis and periodontitis and a novel biomarker for psychological stress. Front Endocrinol (Lausanne). 2023 Apr 11;14:1147739.
- Strooker H, de Geus E, van der Reijden WA, Laine ML, van Winkelhoff AJ. Stress en parodontale gezondheid [Stress and periodontal health]. Ned Tijdschr Tandheelkd. 2010 Jan;117(1):23-7.
- Nani BD, Lima PO, Marcondes FK, Groppo FC, Rolim GS, Moraes AB, Cogo-Müller K, Franz-Montan M. Changes in salivary microbiota increase volatile sulfur compounds production in healthy male subjects with academic-related chronic stress. PLoS One. 2017 Mar 20;12(3):e0173686.
- Coelho JMF, Miranda SS, da Cruz SS, Trindade SC, Passos-Soares JS, Cerqueira EMM, Costa MDCN, Figueiredo ACMG, Hintz AM, Barreto ML, Seymour GJ, Scannapieco F, Gomes-Filho IS. Is there association between stress and periodontitis? Clin Oral Investig. 2020 Jul;24(7):2285-2294.
- Wimmer G, Janda M, Wieselmann-Penkner K, Jakse N, Polansky R, Pertl C. Coping with stress: its influence on periodontal disease. J Periodontol. 2002 Nov;73(11):1343-51.
- Vettore M, Quintanilha RS, Monteiro da Silva AM, Lamarca GA, Leão AT. The influence of stress and anxiety on the response of non-surgical periodontal treatment. J Clin Periodontol. 2005 Dec;32(12):1226-35.
- Zhang JY, Li SS, Meng LN, Zhou YQ. Effectiveness of a nurse-led Mindfulness-based Tai Chi Chuan (MTCC) program on Posttraumatic Growth and perceived stress and anxiety of breast cancer survivors. Eur J Psychotraumatol. 2022 Feb 3;13(1):2023314.
- Esfandbod M, Abazaria Tehrani M, Haghshomar M, Arya P, Shateri Amiri B, Toogeh G, Keyhani M. Association between Perceived Stress and Neutropenia in Patients with Leukemia under Chemotherapy. Int J Hematol Oncol Stem Cell Res. 2022 Apr 1;16(2):103-109.
- Gao Y, Hu R, Zhang Y, Yuan M, Xu Y, Ma J. Perceived stress in Chinese patients with coronary heart disease: a cross-sectional study. BMJ Open. 2022 Mar 31;12(3):e051419.
- Khedr MA, El Sayed HG, El Wakil A. Perceived stress in multiple sclerosis patients: Relationship with mood states and pain experience. Mult Scler Relat Disord. 2022 Mar;59:103650.
- Simon, PD. The 10-item Perceived Stress Scale as a valid measure of stress perception. Asia Pac Psychiatry. 2021 Jun;13(2):e12420.
- Osman A, Lamis DA, Bagge CL, Freedenthal S, Barnes SM. The Mindful Attention Awareness Scale: Further Examination of Dimensionality, Reliability, and Concurrent Validity Estimates. J Pers Assess. 2016;98(2):189-99.
- Jermann F, Billieux J, Larøi F, d'Argembeau A, Bondolfi G, Zermatten A, Van der Linden M. Mindful Attention Awareness Scale (MAAS): Psychometric properties of the French translation and exploration of its relations with emotion regulation strategies. Psychol Assess. 2009 Dec;21(4):506-14.
- Rehman M, Ahmad U, Waseem M, Ali B, Tariq MI. Effects of Exercise Training in Patients with Lung Cancer during Chemotherapy Treatment. Malays J Med Sci. 2023 Apr;30(2):141-152.
- Nooripour R, Ghanbari N, Hassani-Abharian P, Radwin LE, Hosseinian S, Hasanvandi S. Validation of Persian Version of Mindful Attention Awareness Scale (MAAS) in Iranian Women with Breast Cancer. Arch Iran Med. 2022 May 1;25(5):300-307.
- Brown KW, Ryan RM. The benefits of being present: mindfulness and its role in psychological well-being. J Pers Soc Psychol. 2003 Apr;84(4):822-48.
- Zou, G. A modified poisson regression approach to prospective studies with binary data. Am J Epidemiol. 2004 Apr 1;159(7):702-6.
- Tariq S, Tariq S, Tariq S. Association of perceived stress with healthy and unhealthy food consumption among teenagers. J Pak Med Assoc. 2019 Dec;69(12):1817-1821.
- West, RM. Best practice in statistics: Use the Welch t-test when testing the difference between two groups. Ann Clin Biochem. 2021 Jul;58(4):267-269.
Disclaimer/Publisher’s Note: The statements, opinions and data contained in all publications are solely those of the individual author(s) and contributor(s) and not of MDPI and the editor(s). MDPI and the editor(s) disclaim responsibility for any injury to people or property resulting from any ideas, methods, instructions or products referred to in the content. |
Figure 1.
Periodontal probing.
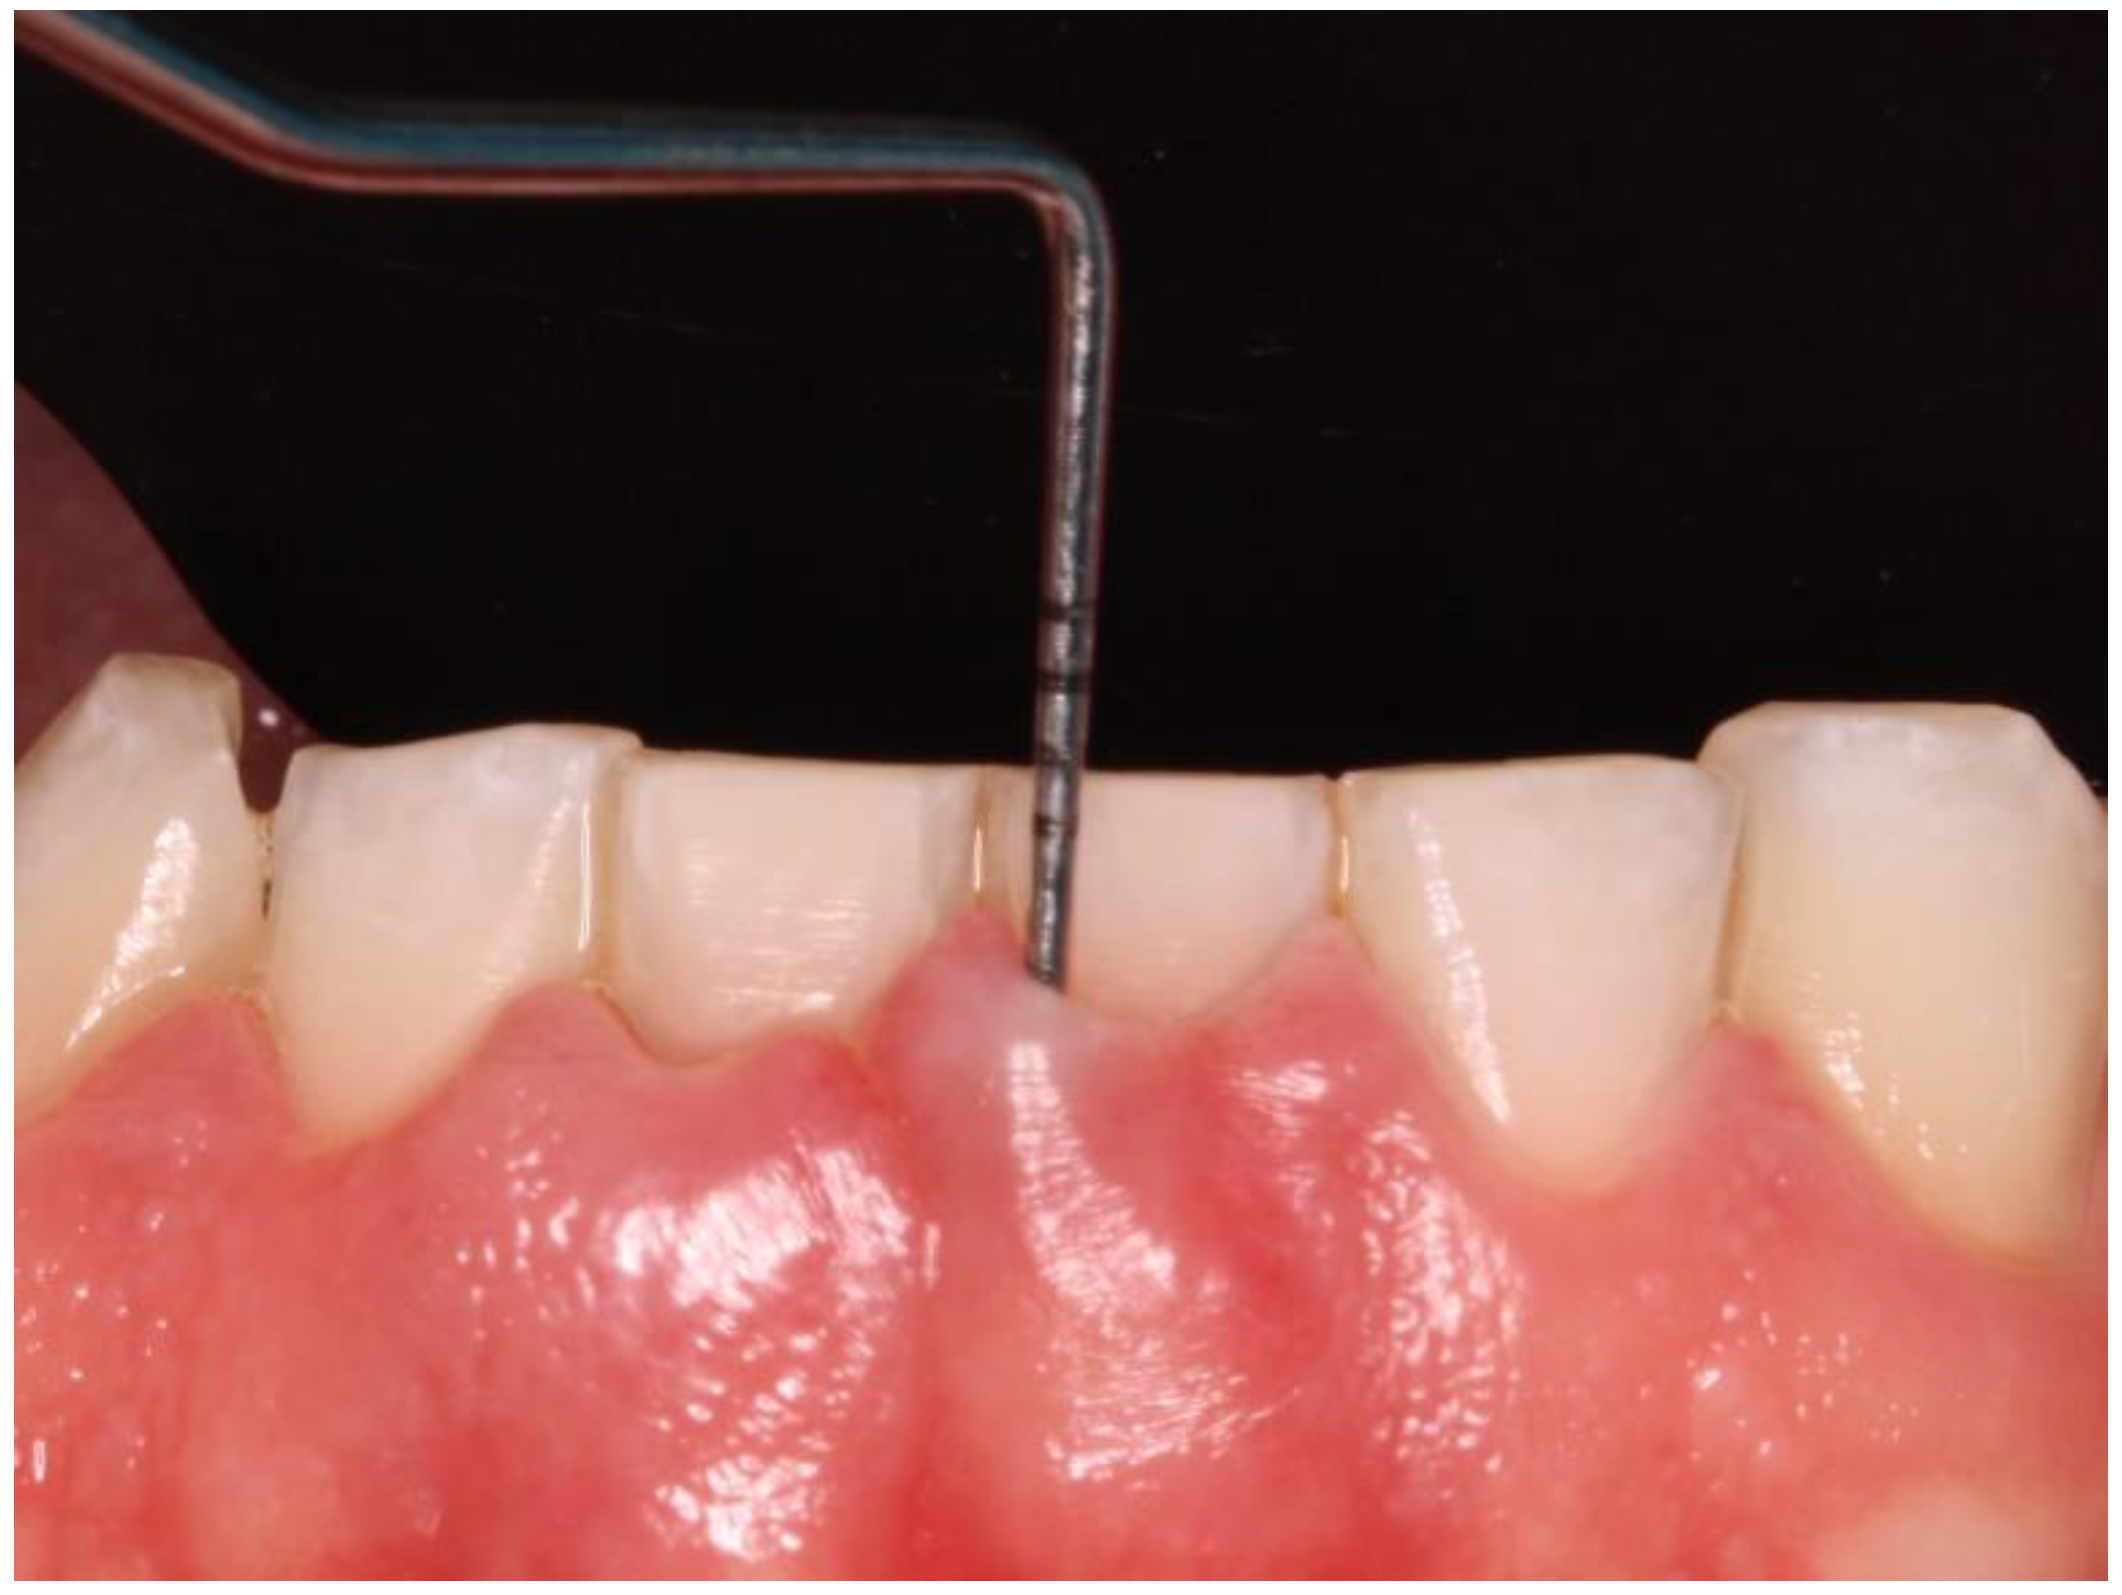
Figure 2.
Bleeding after periodontal probing.
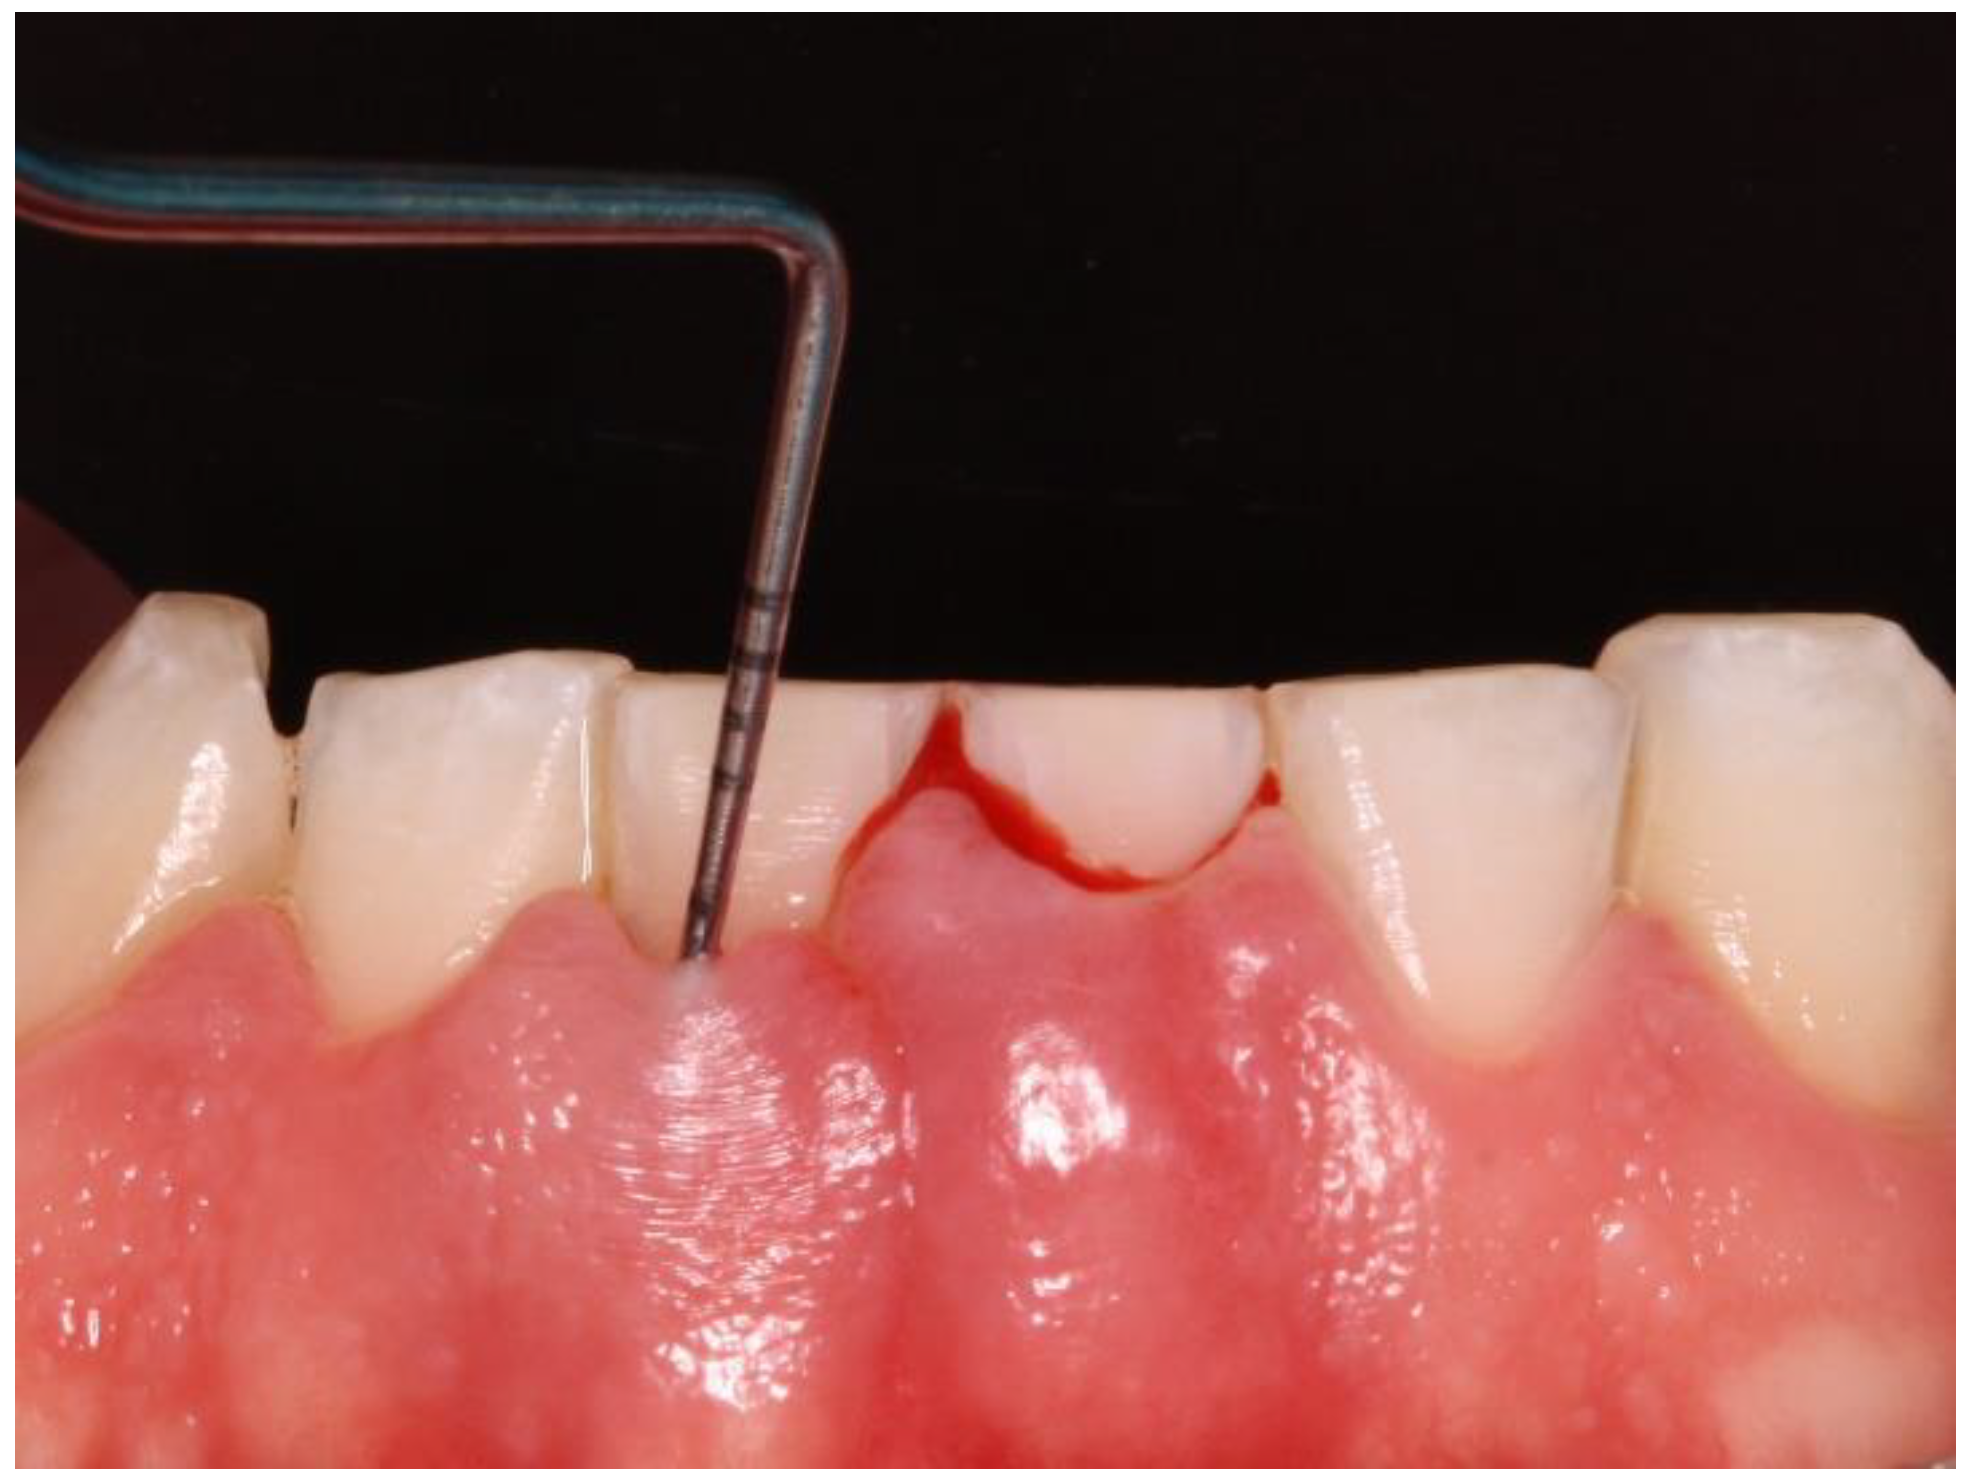
Figure 3.
Bar chart of the frequency of Periodontitis divided by gender.
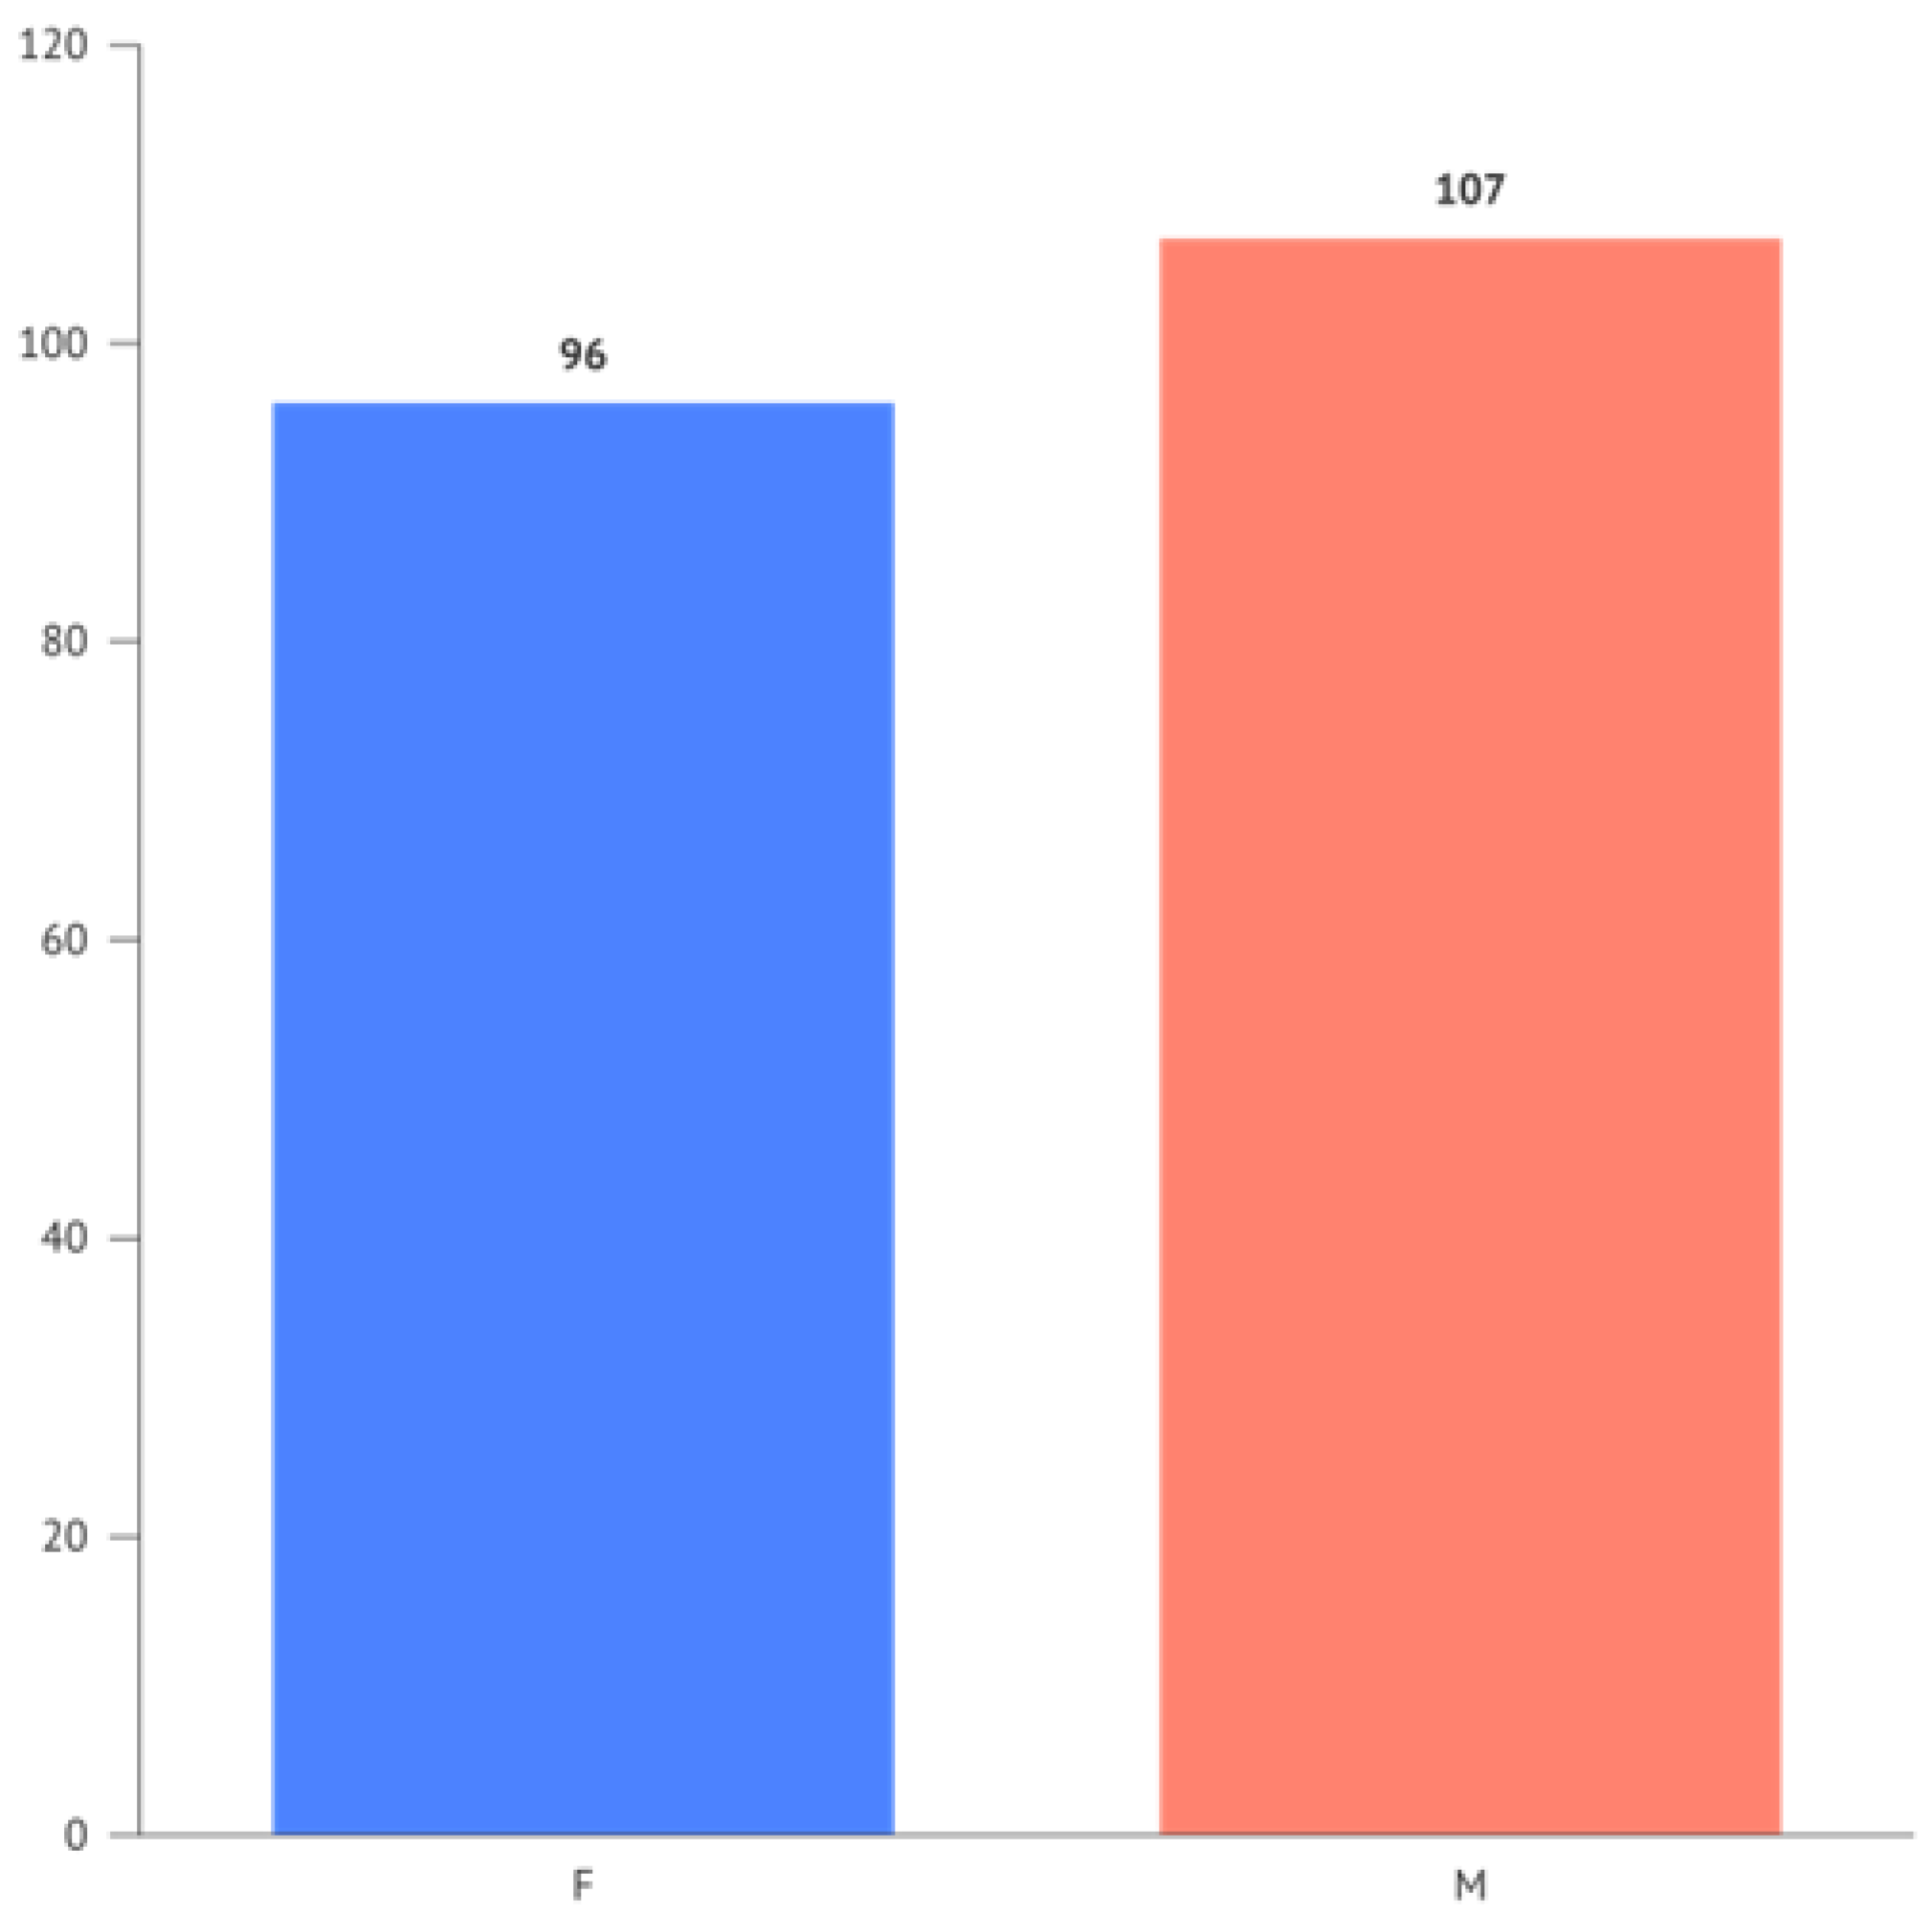
Figure 4.
Scatter plot between age and perceived stress.
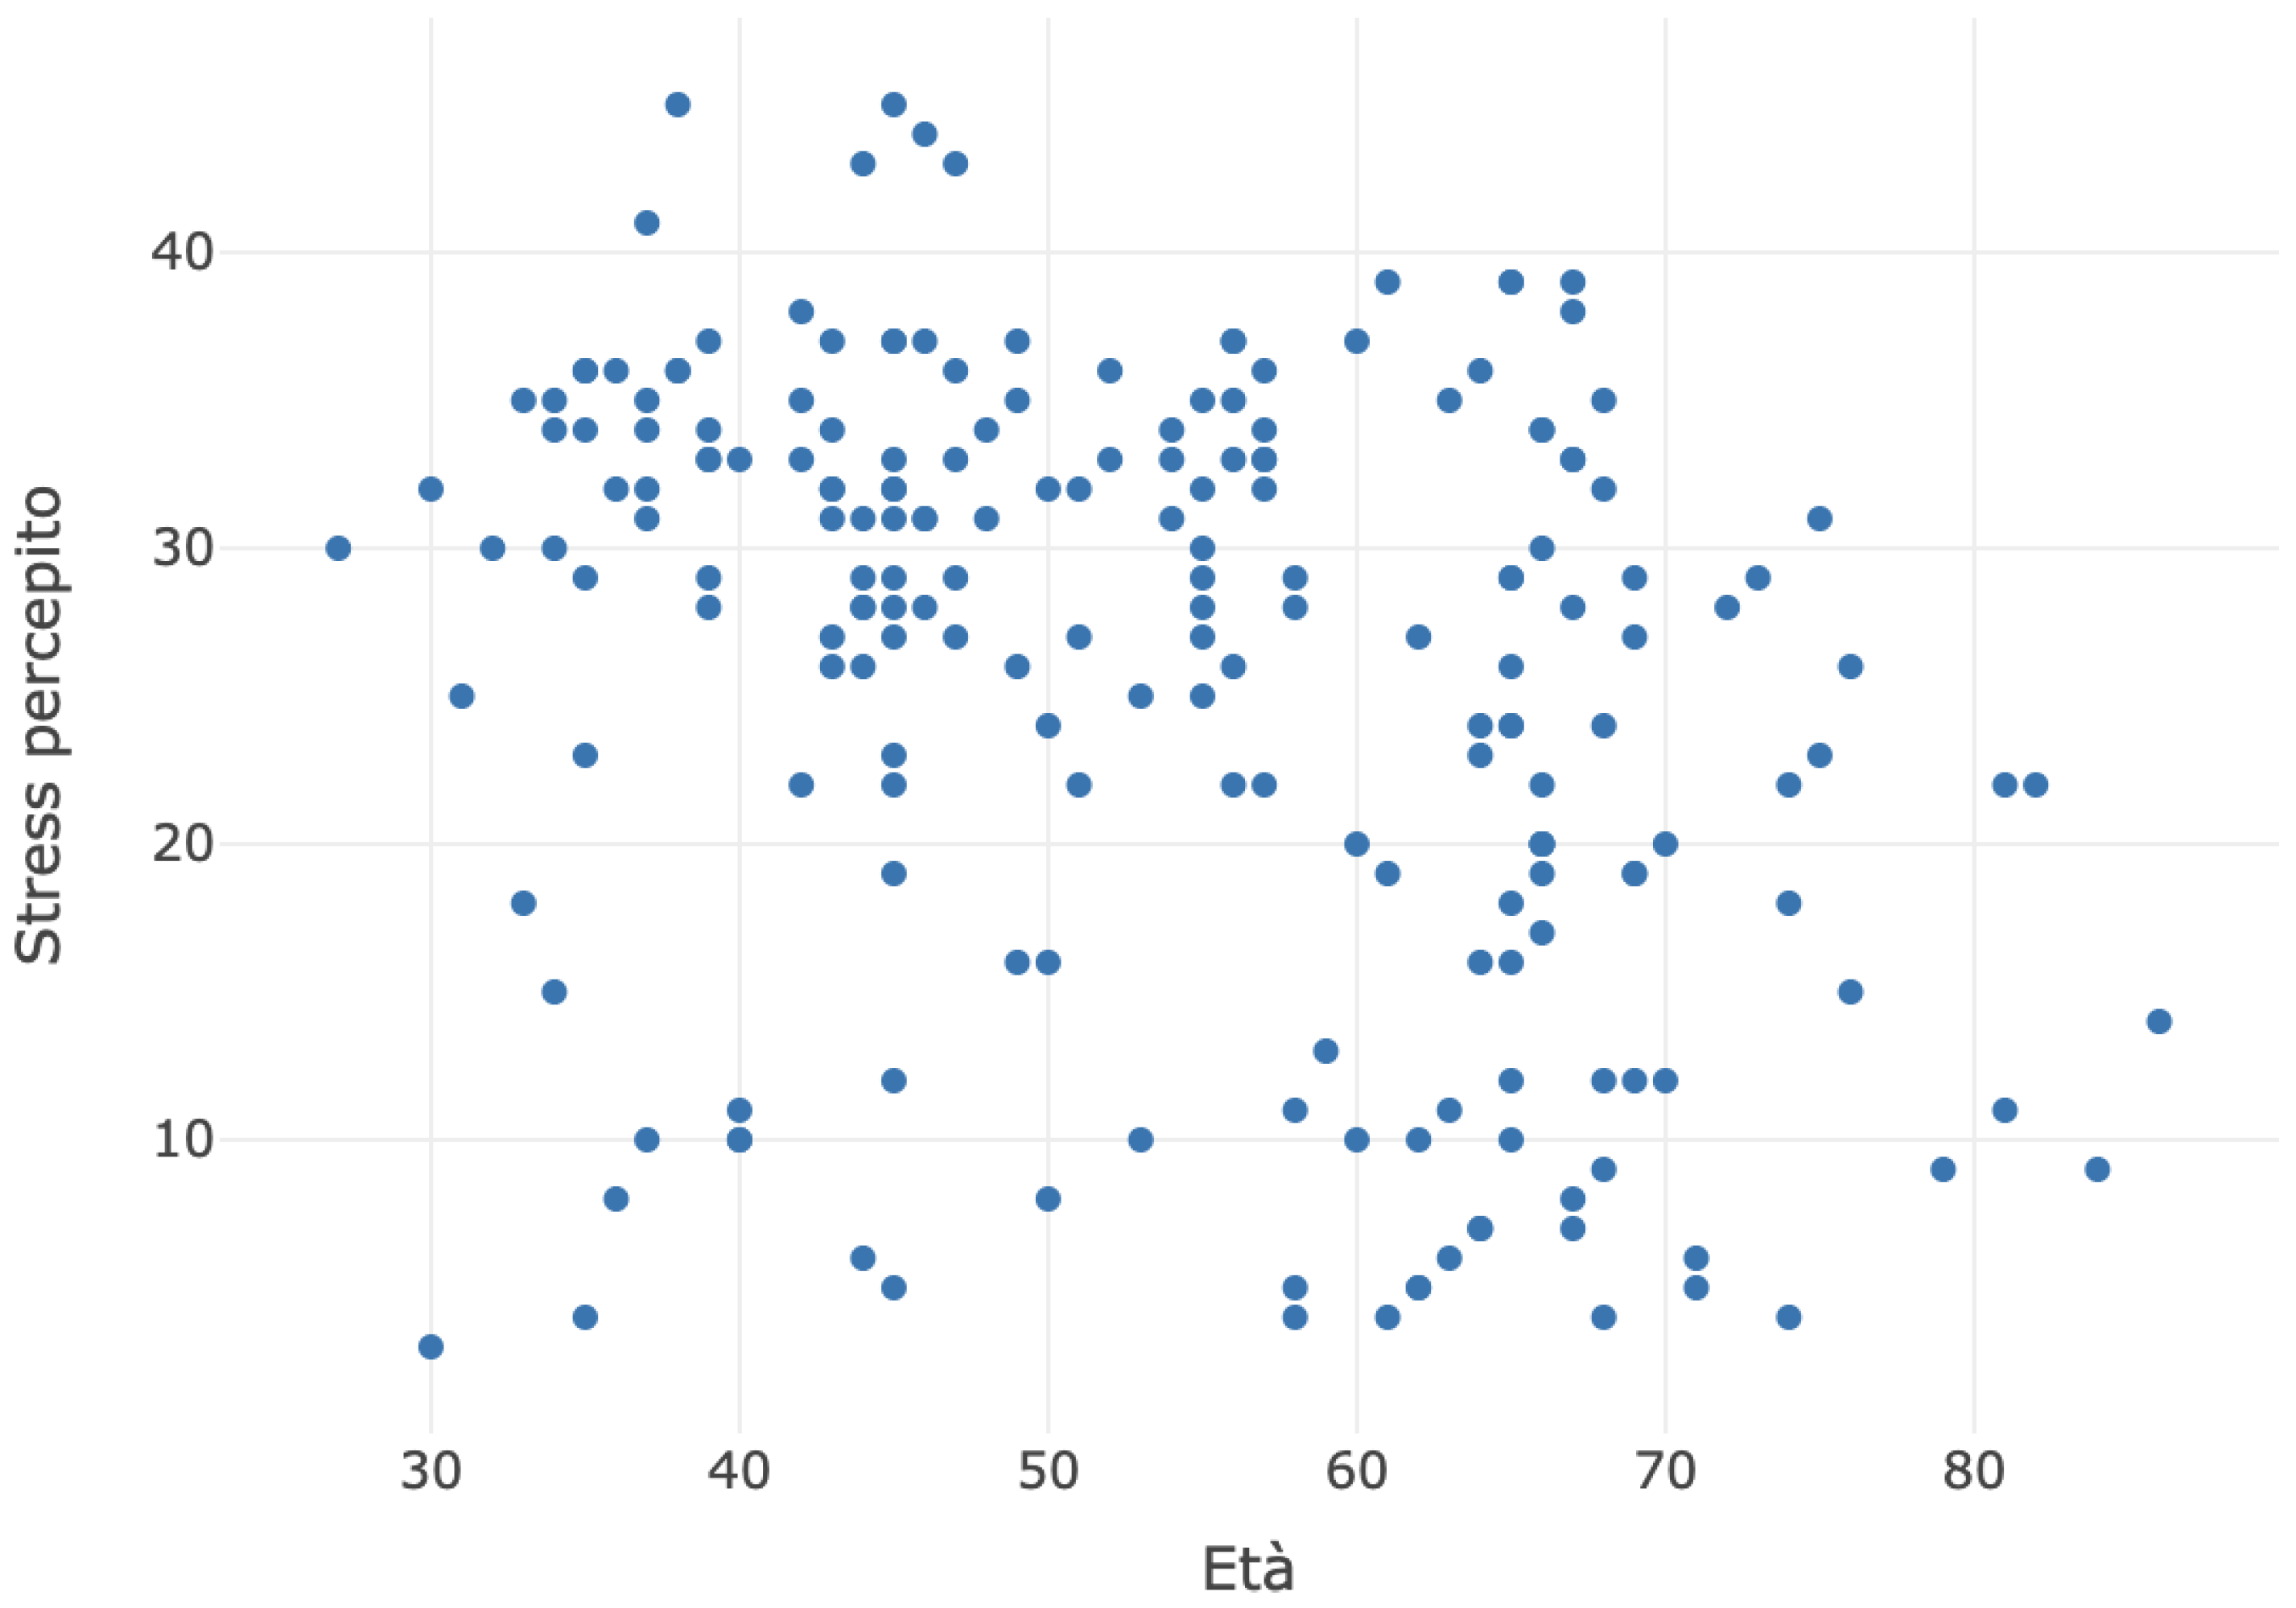
Figure 5.
Boxplot for the numeric variable MAAS divided by the categorical variable Gender.
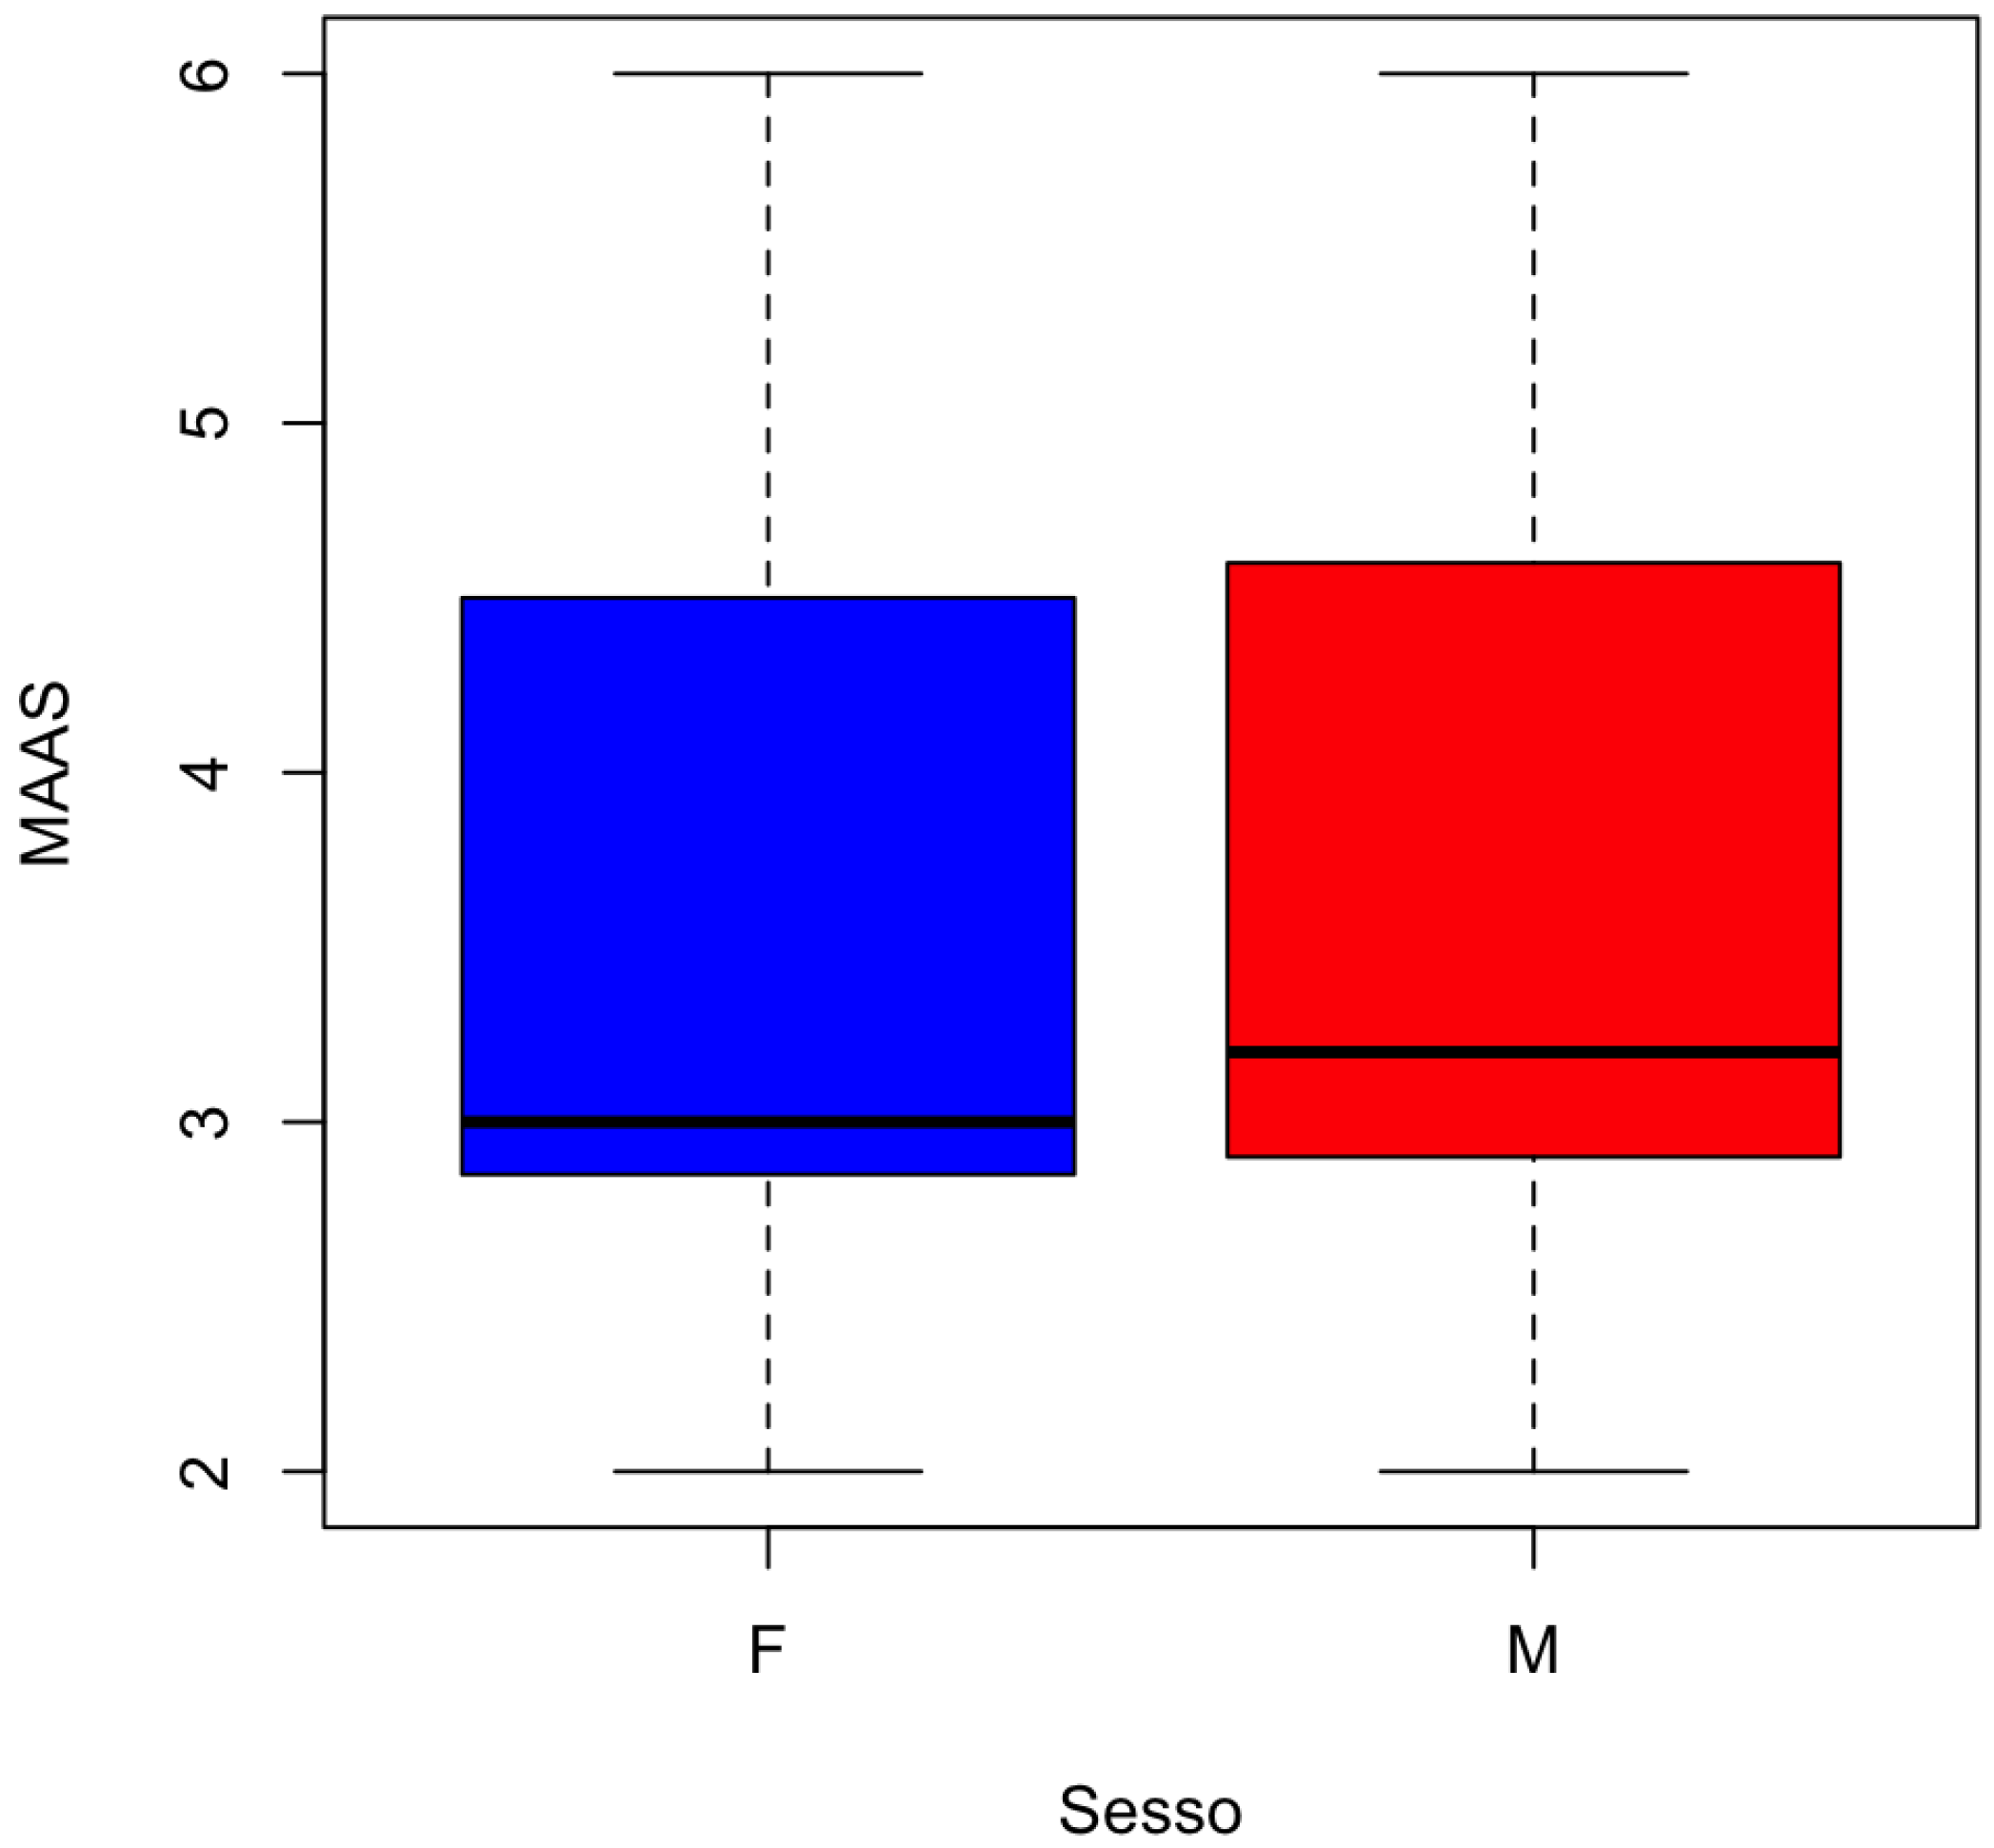
Figure 6.
a, b. Residual plots of linear regression. A: Residual plot. B: Normalized residuals plot.
Figure 6.
a, b. Residual plots of linear regression. A: Residual plot. B: Normalized residuals plot.
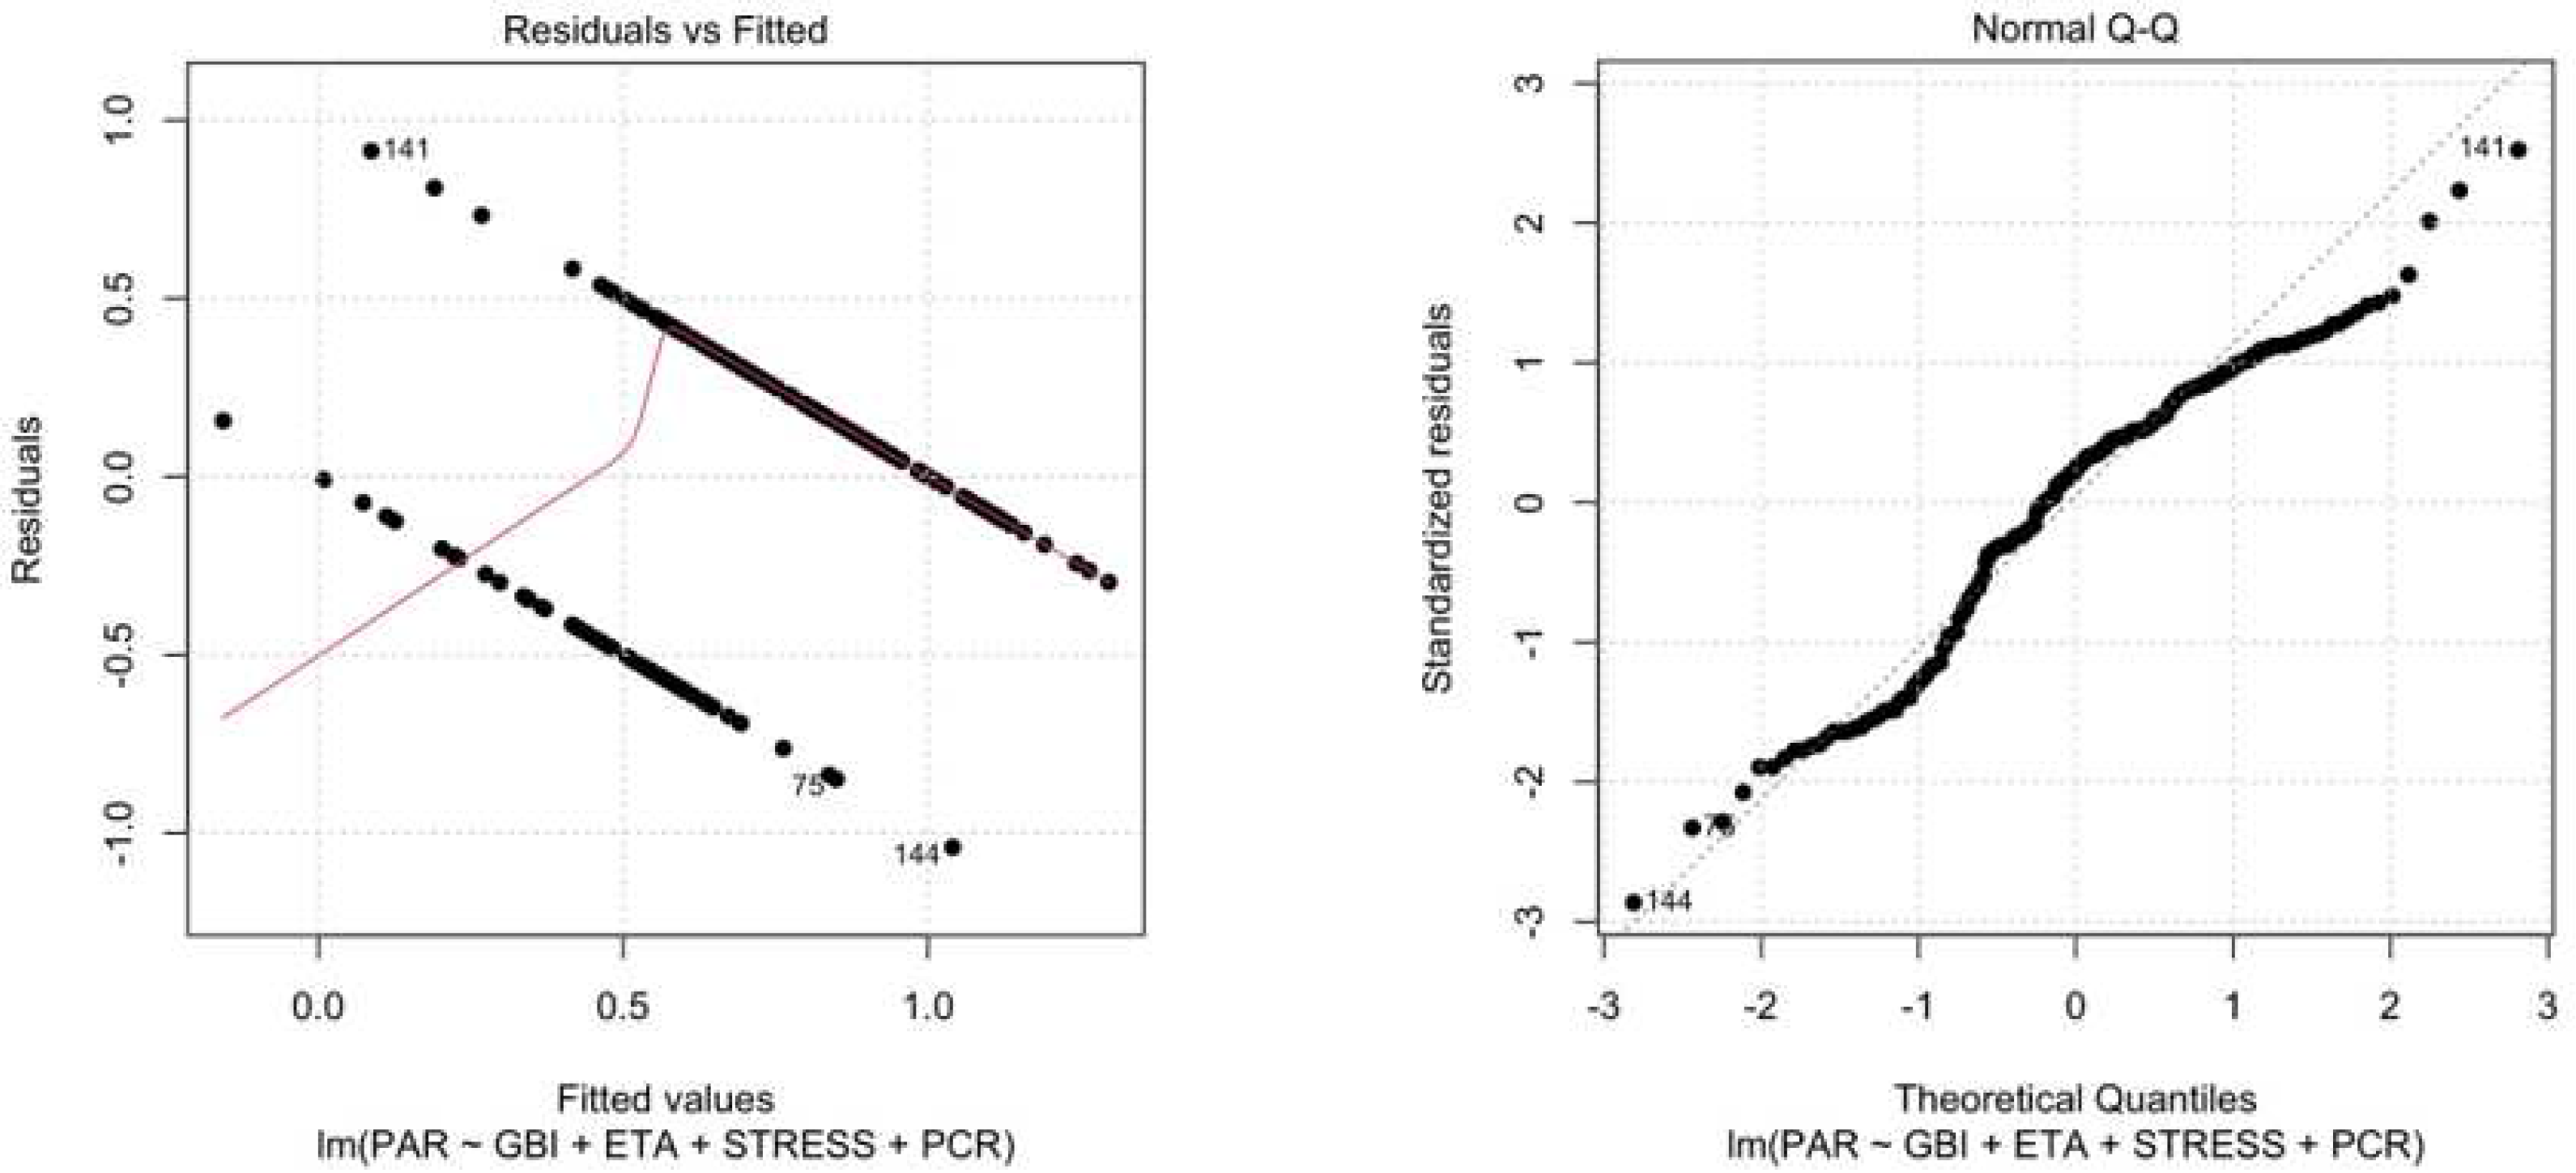

Table 1.
Basic descriptive statistics.
|
||||||
| Min | 1st Qu. | Median | Mean | 3rd Qu. | Max | |
| 27 | 44 | 54 | 53.72 | 65 | 86 | |
|
||||||
| Min | 1st Qu. | Median | Mean | 3rd Qu. | Max | |
| 12 | 25 | 30 | 33.73 | 36.50 | 89 | |
|
||||||
| Min | 1st Qu. | Median | Mean | 3rd Qu. | Max | |
| 6 | 34 | 58 | 56.43 | 74.50 | 95 | |
|
||||||
| Min | 1st Qu. | Median | Mean | 3rd Qu. | Max | |
| 1 | 2 | 3 | 3.079 | 4 | 4 | |
|
||||||
| Min | 1st Qu. | Median | Mean | 3rd Qu. | Max | |
| 3 | 18.50 | 28 | 25.35 | 33 | 45 | |
|
||||||
| Min | 1st Qu. | Median | Mean | 3rd Qu. | Max | |
| 2 | 2.9 | 3 | 3.564 | 4.5 | 6 |
Table 2.
Correlations between numerical variables.
| Variables | Age | PCR(%) | GBI(%) | PSR | PSS | MAAS |
|---|---|---|---|---|---|---|
| Age | 1 | 0.3982293 | -0.2019248 | 0.4480947 | -0.3327279 | 0.2956923 |
| PCR (%) | 0.3982293 | 1 | -0.1309450 | 0.2511429 | -0.3738504 | 0.3526427 |
| GBI (%) | -0.2019248 | -0.1309450 | 1 | 0.1642705 | 0.6754551 | -0.7487295 |
| PSR | 0.4480947 | 0.2511429 | 0.1642705 | 1 | 0.1434456 | -0.1646394 |
| PSS | -0.3327279 | -0.3738504 | 0.6754551 | 0.1434456 | 1 | -0.8450251 |
| MAAS | 0.2956923 | 0.3526427 | -0.7487295 | -0.1646394 | -0.8450251 | 1 |
Table 3.
Average of numerical variables for each category of the categorical variable of gender.
| Gender | Age | PCR(%) | GBI(%) | PSR | PSS | MAAS |
|---|---|---|---|---|---|---|
| F | 51.58333 | 32.09375 | 56.90625 | 3.010417 | 26.27083 | 3.496875 |
| M | 55.63551 | 35.19626 | 56.00935 | 3.140187 | 24.53271 | 3.623364 |
Disclaimer/Publisher’s Note: The statements, opinions and data contained in all publications are solely those of the individual author(s) and contributor(s) and not of MDPI and/or the editor(s). MDPI and/or the editor(s) disclaim responsibility for any injury to people or property resulting from any ideas, methods, instructions or products referred to in the content. |
© 2023 by the authors. Licensee MDPI, Basel, Switzerland. This article is an open access article distributed under the terms and conditions of the Creative Commons Attribution (CC BY) license (http://creativecommons.org/licenses/by/4.0/).
Copyright: This open access article is published under a Creative Commons CC BY 4.0 license, which permit the free download, distribution, and reuse, provided that the author and preprint are cited in any reuse.


