Submitted:
03 November 2023
Posted:
03 November 2023
You are already at the latest version
Abstract
This study delves into the atmospheric corrosion behavior of chromium-free complex-phase steel (CP), specifically investigating the influence of wet/dry frequency and ratio in cyclic corrosion tests (CCT). The study employs a modified ISO 14993 standard CCT method, which involves salt spray, dry, and wet stages. After 15 and 30 CCT cycles, mass loss, maximum corrosion depth, and corrosion products were analyzed to gain insights into corrosion mechanisms. In general, increasing the frequency and wet/dry stage ratio in CCT extends the time for autocatalytic reactions to occur, leading to accelerated localized CP corrosion and increased pitting factors. However, as the rust layer thickens, uniform corrosion may also intensify, so careful considerations are necessary. This study underscores the importance of controlling the frequency and ratio of wet/dry stages in CCT for effectively analyzing localized corrosion behavior in specimens.
Keywords:
advanced high-strength steel
; complex-phase
; atmospheric corrosion
; cyclic corrosion test
; iron oxide
1. Introduction
Advanced high-strength steels (AHSS) have garnered significant attention in the automotive industry due to their remarkable strength-to-weight ratio. The use of AHSS in automotive applications promises to reduce fuel consumption, lower greenhouse gas emissions, and enhance passenger safety [1,2,3]. However, the relatively thinner thickness of AHSS, which contributes to its weight-saving advantages, presents a significant vulnerability in the form of increased corrosion susceptibility. In particular, complex-phase steel (CP), a subtype of AHSS, is highly sensitive to corrosion. It is composed of various alloying elements and multiple phases with varying electrochemical potentials, such as ferrite, bainite, and martensite [4]. These variations can lead to micro-galvanic and localized corrosion issues in CP under atmospheric conditions. Notably, Recent studies have reported that chromium (Cr) can increase localized corrosion in low-alloy steels under atmospheric corrosion conditions [5,6,7]. To address this concern, CP variants without Cr have been developed. However, there hasn't been an evaluation of the atmospheric corrosion behavior of these Cr-free CP variants.
The cyclic corrosion test (CCT) stands as one of the most widely accepted and representative corrosion tests in the atmospheric corrosion studies. Its popularity stems from its ability to provide insights into material interactions with corrosion products under realistic environmental conditions [8,9,10,11]. CCT conditions subject materials to various corrosion parameters, including salt concentration, time of a cycle, humidity, and temperature, thereby enabling the assessment of atmospheric corrosion behavior within specific environmental contexts. However, this test comes with a significant drawback of being time-consuming. Notably, the dry stage in CCT is essential, yet it can significantly prolong the test duration, as once the solution is completely dry, corrosion no longer proceeds. Thus, effectively managing the frequency and duration of the dry stage offers a promising approach to shorten CCT testing periods.
Therefore, this study aims to analyze the corrosion behavior of CP without Cr elements using electrochemical methods and modified cycle periods within CCTs. The electrochemical methods provide insights into electrochemical properties in salt spray stages, encompassing potentiodynamic polarization tests and electrochemical impedance spectroscopy (EIS) conducted on the CP specimen. Simultaneously, the CCTs explore the impact of corrosion products interactions on the corrosion behavior of CP in atmospheric conditions, incorporating variations in frequency and ratio of wet/dry stages. Additionally, microscopic analysis, employing optical microscopy (OM), atomic force microscopy (AFM), scanning electron microscopy (SEM), X-ray diffraction analysis (XRD), and electron probe microanalysis (EPMA), will explore the effects of different wet/dry stage frequencies and ratios within CCT.
2. Materials and Methods
2.1. Specimens, solution, and microstructure analysis
The AHSS material used in this study was CP sheets with Cr-free as indicated in Table 1. This specimen was manufactured by POSCO in Pohang, South Korea, and exhibited an ultimate tensile strength of approximately 1200 MPa with a tensile elongation of about 15%. For the CCT tests, the specimens were machined into dimensions of 135 mm × 75 mm × 1.2 mm, and for investigating their electrochemical properties, 15 mm × 15 mm × 1.2 mm samples were prepared using wire cutting. Prior to testing, the specimen surfaces were meticulously polished using 600-grit silicon carbide paper and then rinsed with ethanol and distilled water. The test solution used in this study was a 5 wt.% NaCl solution, following the ISO 14993 standard. To examine the microstructure of the specimens, AFM (NX10, Park Systems, Korea) was utilized to analyze the surface topography and potential of each phase of the specimen using scanning Kelvin probe force microscopy (SKPFM) mode using the AFM tip (MagneticMulti75E-G). OM (LEICA 300, Leica Microsystems, Langen, Germany) was employed after etching the specimens with a Nital solution (5 mL 60% HNO3 solution + 95 mL ethanol) and LePera solution (50 mL 1% Na2S2O5 solution in distilled water + 25 mL 4% picric acid + 25 mL ethanol) to reveal each phase.
2.2. Electrochemical tests
All electrochemical tests in this study were conducted at room temperature using a three-electrode setup within a 1000 ml Pyrex glass corrosion cell. The specimens were connected to the working electrode, with a saturated calomel electrode (SCE) serving as the reference electrode, while two glassy carbon bars were utilized as the counter electrode. To ensure consistent condition, the area of specimen was maintained to 1 cm2 with silicone epoxy, and an open-circuit potential (OCP) was measured over an 8-hour period before the electrochemical tests commended. The electrochemical tests were performed using a VSP- 300 instrument (Bio-Logic SAS, Seyssinet-Pariset, France). Potentiodynamic polarization tests were carried out at a scan rate of 0.166 mV/s, covering a scan range from -300 mV vs. OCP to 1600 mVSCE. EIS were conducted across a frequency range spanning from 100 kHz to 10 mHz, with an amplitude of ±10 mV vs. OCP. The impedance data were subsequently analyzed and fitted using ZSimpWin software (ZsimpWin 3.21, EChem Software, Ann Arbor, MI, USA).
2.3. Cyclic corrosion tests and corrosion products analysis
In this study, we conducted CCT experiments to analyze how the frequency and ratio of wet/dry stages in a single cycle affect corrosion behavior. Figure 1 illustrates the single-cycle procedure for the 1st condition of CCT, which was adapted from the ISO 14993 standard. Each complete CCT cycle of this condition had a duration of 8 hours, consisting of a 2-hour salt spray phase at 35 °C, followed by a 3-hour dry stage at 60 °C with a relative humidity of 30%, and concluding with a 3-hour wet stage at 50 °C with a relative humidity of 95%. The ramp time between each stage was set to 30 minutes. In the 2nd through the 4th CCT conditions, the wet/dry stage of the cycle was further divided into two, and the ratio of wet/dry stages were adjusted to 1, 2, and 3 with the same temperature, relative humidity, and ramp time, as detailed in Table 2. The CCT specimens were placed in the CCT chamber at an inclination of 70 degrees from the floor. We analyzed the mass loss and maximum corrosion depth of specimens subjected to 15 and 30 cycles of CCT under each condition after removing the corrosion products through a process involving sandblasting and subsequent acid cleaning using a 15 wt.% HCl and 0.35 wt.% hexamethylenediamine solution. Following the CCT analysis, the corrosion products were examined using XRD (SmartLab, Rigaku, Japan) and SEM with EPMA mode (JXA-8530F, JEOL Ltd, Japan) after rinsed with distilled water and drying with nitrogen gas. XRD was conducted to identify corrosion products after CCTs, and SEM and EPMA were used to analyze the cross-section of the corrosion products to investigate the corrosion mechanisms between the corrosion products and the specimens.
3. Results and discussion
3.1. Microstructure analysis
In order to distinguish the phases of the specimen, microstructure analysis was performed through OM after etching with Nital and LePera solutions. Figures 2(a) presents OM image of the CP after Nital etching for 20 seconds. In the image, the white color representing the ferrite phase was clearly visible, but it was difficult to distinguish martensite and bainite [12]. To clarify the phases, LePera etching was performed to dye each phase with a more distinct color. As a result, it was confirmed that the microstructure of CP was clearly divided into blue ferrite, white martensite, and brown bainite, as shown in Figure 2(b) [13,14,15].
Figures 3(a) and (b) present the results of AFM analysis of CP specimen after Nital ethching, depicting surface topography and potential using AFM, respectively. In the topography after Nital etching, three distinct regions with noticeable height differences were identified. Additionally, as a result of surface potential measurement, a clear difference in surface potential was confirmed depending on the height difference. In previous research, martensite, ferrite, and bainite are known to have the noble potential in that order [16,17,18]. Therefore, it was confirmed that the green area was martensite, the yellow area was bainite, and the black area was ferrite. As shown in Figure 2 and Figure 3, the microstructure of CP has different phases with different potentials. Due to these characteristics, it has a negative effect on corrosion resistance because of micro-galvanic corrosion.
3.2. Electrochemical tests
Figures 4(a) and (b) are surface photographs after 15 and 30 cycles of CCT in each condition, and Figures 4(c) are an SEM cross-sectional images after 30 cycles of CCT. As shown in the surface images, the rust layers are very rough and porous, and cross-sectional images also show that there are many pores and cracks in the rust layers. Therefore, under salt spray stages, the sprayed solution would have reached the steel surface, creating an immersion state. Thus, the corrosion behavior in the salt immersion state of the specimen was analyzed through electrochemical methods [19].
Potentiodynamic polarization test in the 5 wt.% NaCl solution of CP depicted in Figure 5(a) summarized in Table 2. In the potentiodynamic polarization curve, we observed a low anodic polarization slope (βa) and a large cathodic polarization slope (βc), indicating a typical corrosion behavior controlled by the oxygen diffusion rate of carbon steel. Figure 5(b) display the impedance spectra in the form of Nyquist plots and the equivalent electrical circuit used for fitting the EIS data. The results of the EIS fitting parameters are summarized in Table 3. Rs represents the solution resistance, and the constant phase element (CPE) denotes a non-ideal capacitance. CPE1 corresponds to the oxide film capacitor, with Qflim indicating its magnitude. Rfilm represents the electrical resistance of the oxide film. CPE2 symbolizes the capacitor formed by the electric double layer between the solution and the surface interface, and Qdl represents the magnitude of CPE2. Rct stands for the charge transfer resistance for metal dissolution. The parameter 'n' is an experimental exponent characterizing ideal capacitive behavior (0 ≤ n ≤ 1), and Rp represents the polarization resistance, which combines Rfilm and Rct. The impedance of the CPE is described by Equation (1). Y0 is the coefficient of proportionality with units of F·s(n-1), ω is the angular frequency with units of rad·s-1, and i2 = -1 defines the imaginary number 'i' [20,21,22].
The results from the EIS indicate a low oxide film resistance and a high charge transfer resistance. This suggests that the oxide film is ineffective at suppressing corrosion, leading to uniform corrosion occurring throughout the specimen. Therefore, by combining the potentiodynamic polarization and EIS results, it can be confirmed that uniform corrosion of the specimen takes place in the salt spray stage of CCT.
3.3. Effect of frequency and ratio of wet/drt stage in the CCT
Figures 6(a)-(d) display the surface conditions of the specimens after 15 cycles of CCT with acid cleaning, and accompanying graphs illustrate the mass loss, the maximum corrosion depth, and pitting factor for each CCT condition. When comparing the surface photos, it is difficult to determine the effect of corrosion depending on the frequency and ratio of wet/dry stages. However, the effect can be clearly seen in the data shown in the graphs. The mass losses were found to be 65.4, 66.8, 74.5, and 75.57 mg/cm2, and maximum corrosion depth were 187, 242, 280, and 316 μm from 1st condition to 4th condition, respectively. To provide a better perspective, the mass loss values can be converted into a uniform corrosion thickness using Equation (2).
Considering that the density of iron at room temperature is 7874 mg/cm3, the uniform corrosion depths under each condition are calculated as 83.4, 84.8, 94.6, and 96.0 μm, respectively. Additionally, the pitting factors were calculated using Equation (3).
The pitting factors of each condition were calculated as 2.25, 2.85, 2.96, and 3.29, respectively. These calculations confirm that as the frequency and ratio of wet/dry stages increased in the CCT up to 15 cycles, the localized corrosion increased. In particular, the occurrence of localized corrosion increased more significantly with an increase in the frequency of the wet/dry stages.
Figures 7(a)-(d) depict the surface conditions of the specimens after 30 cycles of CCT, with accompaning graphs illustrate the mass loss, the maximum corrosion depth, and pitting factor for each CCT condition. In this article, CCT from 15 to 30 cylces is referred to as the ‘later stages’. Comparing the surface images for each CCT condition in later stages, it becomes evident that as the frequency and ratio of wet/dry stages increase, the localized corrosion becomes more pronounced. The mass losses were found to be 114.6, 120.7, 129.3, and 149.7 mg/cm2, and maximum corrosion depth were 386, 471, 567, and 616 μm from 1st condition to 4th condition, respectively. These results can be converted to a uniform corrosion depth and pitting factor through Equations (2) and (3). The uniform corrosion depth and pitting factor of each codition atfer 30 cycles were calculated as 145.5, 153.3, 164.2, and 190.1 μm, and, 2.65, 3.07, 3.45, and 3.24, respectively. What is noteworthy is that the pitting factor in the 4th condition decreased compared to the 3rd condition in 30 cycles. This suggests that the electrolyte film created in the salt spray and/or wet stages on the surface did not completely evaporate in the dry stages due to the thicker rust layer. Therefore, after 30 cycles in the 4th condition, the overall corrosion of the specimen became more active, resulting in a decrease in the pitting factor.
The mass loss and maximum corrosion depth for each CCT condition are presented as regression equations, as demonstrated in Figures 8(a) and (b), and summarized in Table 4. At this time, the slope of the mass loss regression equation for nth condition is called An, and the slope of the maximum corrosion depth regression equation for nth condition is called Bn. The uniform corrosion acceleration coefficient (α1) and localized corrosion acceleration coefficient (α2) are calculated using Equations (4) and (5).
These are important parameters that quantify the changes in corrosion rates under various conditions. When the wet/dry frequency increased from once to twice while keeping the ratio fixed (1st and 2nd), both uniform and localized corrosion coefficeients increased. α1 increased by approximately 5.4%, with α2 increasing about 22.0%. These results suggest that increasing the frequency of wet/dry stages accelerates uniform corrosion and even more sensitive localized corrosion. When the ratio of wet/dry stages was extended to 2 and 3 with the same the twice frequencies (3rd and 4th), the impact on uniform and localized corrosion coefficeients became more significant. α1 increased to 12.9% and 30.7%, and α2 increased to 46.9% and 59.5%. These findings highlight that extending the raio of wet/dry stage accelerates the uniform and localized corrosion rate, but when the ratio was 3, the uniform corrosion is more accelerated.
3.4. Analysis of corrosion products and cross-section after CCT
The composition of the corrosion products generated after 30 cycles of the 1st CCT and 4th condition were analyzed using XRD and EPMA, as shown in Figure 9 and Figure 10(a) and (b). As depicted Figure 9, the corrosion products resulting from different CCT conditions were nearly identical. These products consisted of various hydroxides and oxides, including α-FeOOH (goethite), β-FeOOH (akaganeite), γ-FeOOH (lepidocrocite), γ-Fe2O3 (maghemite), and Fe3O4 (magnetite) [23,24,25]. The difference between the two conditions was revealed through cross-sectional analysis with EPMA, as presented in Figures 10(a) and (b). In EPMA images of 4th condtion unlike 1st condition, it clearly shows the localized corrosion area on the specimen surface and the high concentration of chlorine there. The signal of chlorine (Cl) comes from akaganeite, a corrosion product that causes localized corrosion in wet/dry stages [26]. Details of localized corrosion mechanisms are discussed in the following section.
3.5. Mechansim of localized corrosion in CCT
3.5.1. Corrosion mechanism of salt spray and dry stages in the CCT
The mechanism of corrosion in CP under CCT conditions is illustrated in Figure 11. The salt spray stage is similar to immersion state as explained previously. The anode reaction of the corrosion is described by Equation (6), while the cathode reaction is represented by Equation (7) [27]. Then, the iron ion (Fe2+) diffused into the droplet and reacted with hydroxide ion (OH-) to produce Fe(OH)2, which is an unstable corrosion product, so it gradually dissolves in the droplet, transforming into ferric oxyhydroxide, as shown in Equations (8) and (9) [28,29].
During the dry stage, the salt spray solution evaporates and becomes concentrated in a specific area, and the corrosion rate continues to increase. Simultaneously, Fe(OH)2 coverts into porous goethite and lepidocrocite, while in the Cl-concentrated region, it transforms into akaganeite, a Cl- trapped corrosion product [30,31,32]. What is noteworthy about the dry stage is that when the solution is completely dried, no corrosion reaction occurs.
3.5.2. Corrosion mechanism of wet stage in the CCT
In the subsequent wet stage, a water film forms on the surface and trapped Cl in the akaganeite is released into the water film. At the same time, some of the lepidocrocite transforms into magnetite according to Equation (10) and these corrosion product act cathodic sites due to their high conductivity [33]. Additionally, Oh et al [34] reported that the magnetic maghemite also occurs as a corrosion product. Furthermore, in a confined space where Cl- is released, hydrolysis of FeCl2 occurs, resulting in an autocatalytic reaction as depicted in Equation (11) [35,36]. Due to the increasing in cathodic area and the decreasing of pH, corrosion of the specimen in the Cl-trapped region is accelerated, causing localized corrosion of CP in the wet stage. This effect keeps going until the solution dries up in the dry stage or the droplets are diluted on the surface by salt spray.
3.5.3. Effect of frequency and ratio of wet/dry stage in the CCT
The impact of the frequency of wet/dry stages is quite evident in reducing wasted time during dry stages. When the water film dries twice in one cycle, it effectively extends the duration for which the water film remains on the surface. Consequently, the time for the wet stage, as mentioned in the previous section, becomes longer, resulting in a deeper localized corrosion. For the same reason, the pitting factors also increase as the ratio of the wet/dry stages continues to rise, up to the 15th cycle. However, in the later stages, when the wet/dry ratio is set to 3 (4th CCT condition), uniform corrosion becomes more pronounced, leading to a decrease in the pitting factor. This suggests that the water film couldn't fully evaporate during the dry stages because the thickness of the corrosion product increased and the drying time was insufficient, as shown in Figure 12.
4. Conclusions
In this study, we analyzed the microstructure, electrochemical corrosion characteristics, and atmospheric corrosion behavior of Cr-free CP, a type of AHSS, with a varying frequencies and ratios of wet/dry stages. The investigation led to the following conclusions:
- The microstructure of CP consists of ferrite, bainite, and martensite with different surface potential.
- Electrochemical measurements demonstrated that uniform corrosion occurred during the salt spray stage of CCT.
- With increasing frequency and ratio of wet/dry stages up to 15 CCT cycles, localized corrosion was accelerated more than uniform corrosion, resulting in an increase in the pitting factor.
- However, starting from the 15th CCT cycle, when the ratio of wet/dry stages was set to 3, uniform corrosion accelerated more than localized corrosion, leading to a decrease in the pitting factor because of the remained water film.
- After conducting CCT for up to 30 cycles, we found that simulating localized corrosion was most effective when the frequency and ratio of wet/dry stages were both set to 2.
In conclusion, controlling the frequency and ratio of wet/dry stages during CCT is an effective method to accelerate localized corrosion in atmospheric conditions. However, it is important to select an appropriate dry stage duration as the number of CCT cycles increases. This study has provided insights into accelerating localized atmospheric corrosion by adjusting the frequency and ratio of wet/dry stages according to CCT conditions. As a result, we have confirmed a significant reduction in CCT time.
Author Contributions
Conceptualization, J.-S.Y. and J.-G.K.; methodology, J.-S.Y. and G.-I.K.; validation, J.-S.Y., G.-I.K. and J.-G.K. formal analysis, J.-S.Y.; investigation, J.-S.Y. and G.-I.K.; writing—original draft preparation, J.-S.Y.; writing—review and editing, J.-G.K.; visualization, J.-S. Y.; supervision, J.-G.K. All authors have read and agreed to the published version of the manuscript.”.
Funding
This research received no external funding.
Institutional Review Board Statement
Not applicable.
Informed Consent Statement
Not applicable.
Acknowledgments
This research was supported by the Sungkyunkwan University and the BK21 FOUR (Graduate School Innovation) funded by the Ministry of Education (MOE, Korea) and National Research Foundation of Korea (NRF).
Conflicts of Interest
The authors declare no conflict of interest.
References
- R. Kuziak, R. Kawalla, S. Waengler. Advanced high strength steels for automotive industry. Archives of civil mechanical engineering 2008, 8, 103–117. [Google Scholar] [CrossRef]
- L. Bracke, K. Verbeken, L. Kestens, J. Penning. Microstructure and texture evolution during cold rolling and annealing of a high Mn TWIP steel. Acta Materialia 2009, 57, 1512–1524. [Google Scholar] [CrossRef]
- Q. Liu, Q. Zhou, J. Venezuela, M. Zhang, J. Wang, A. Atrens. A review of the influence of hydrogen on the mechanical properties of DP, TRIP, and TWIP advanced high-strength steels for auto construction. Corrosion Reviews 2016, 34, 127–152. [Google Scholar] [CrossRef]
- C. Lesch, N. Kwiaton, F.B. Klose. Advanced high strength steels (AHSS) for automotive applications− tailored properties by smart microstructural adjustments. Steel research international 2017, 88, 1700210. [Google Scholar] [CrossRef]
- S. -w. Cho, S.-J. Ko, J.-S. Yoo, Y.-H. Yoo, Y.-K. Song, J.-G. Kim. Effect of Cr on aqueous and atmospheric corrosion of automotive carbon steel. Materials 2021, 14, 2444. [Google Scholar] [CrossRef] [PubMed]
- B. Dong, W. Liu, T. Zhang, L. Chen, Y. Fan, Y. Zhao, H. Li, W. Yang, Y. Sun. Clarifying the effect of a small amount of Cr content on the corrosion of Ni-Mo steel in tropical marine atmospheric environment. Corrosion Science 2023, 210, 110813. [Google Scholar] [CrossRef]
- X. Yang, Y. Yang, M. Sun, J. Jia, X. Cheng, Z. Pei, Q. Li, D. Xu, K. Xiao, X. Li. A new understanding of the effect of Cr on the corrosion resistance evolution of weathering steel based on big data technology. Journal of Materials Science & Technology 2022, 104, 67–80. [Google Scholar]
- L. Hao, S. Zhang, J. Dong, W. Ke. Atmospheric corrosion resistance of MnCuP weathering steel in simulated environments. Corrosion Science 2011, 53, 4187–4192. [Google Scholar] [CrossRef]
- K. M. Kim, G.-i. Kim, G.-H. Son, Y.-H. Yoo, S. Hong, J.-G. Kim. New Accelerated Corrosion Test Method Simulating Atmospheric Corrosion of Complex Phase Steel Combining Cyclic Corrosion Test and Electrochemically Accelerated Corrosion Test. Materials 2023, 16, 3132. [Google Scholar] [CrossRef] [PubMed]
- B. Liu, X. Mu, Y. Yang, L. Hao, X. Ding, J. Dong, Z. Zhang, H. Hou, W. Ke. Effect of tin addition on corrosion behavior of a low-alloy steel in simulated costal-industrial atmosphere. Journal of Materials Science & Technology 2019, 35, 1228–1239. [Google Scholar]
- L. Hao, S. Zhang, J. Dong, W. Ke. Evolution of atmospheric corrosion of MnCuP weathering steel in a simulated coastal-industrial atmosphere. Corrosion Science 2012, 59, 270–276. [Google Scholar] [CrossRef]
- A. Knaislová, D. Rudomilova, P. Novák, T. Prošek, A. Michalcová, P. Beran. Critical assessment of techniques for the description of the phase composition of advanced high-strength steels. Materials 2019, 12, pp–4033. [Google Scholar] [CrossRef]
- M. Guan, H. Yu. Fatigue crack growth behaviors in hot-rolled low carbon steels: A comparison between ferrite–pearlite and ferrite–bainite microstructures. Materials Science and Engineering: A 2013, 559, 875–881. [Google Scholar] [CrossRef]
- C. Hofer, H. Leitner, F. Winkelhofer, H. Clemens, S. Primig. Structural characterization of “carbide-free” bainite in a Fe–0.2 C–1.5 Si–2.5 Mn steel. Materials characterization 2015, 102, 85–91. [Google Scholar]
- M. Santofimia, L. Zhao, R. Petrov, J. Sietsma. Characterization of the microstructure obtained by the quenching and partitioning process in a low-carbon steel. Materials Characterization 2008, 59, 1758–1764. [Google Scholar] [CrossRef]
- D. Song, J. Hao, F. Yang, H. Chen, N. Liang, Y. Wu, J. Zhang, H. Ma, E.E. Klu, B. Gao. Corrosion behavior and mechanism of Cr–Mo alloyed steel: Role of ferrite/bainite duplex microstructure. Journal of Alloys and Compounds 2019, 809, 151787. [Google Scholar] [CrossRef]
- K. Fushimi, K. Yanagisawa, T. Nakanishi, Y. Hasegawa, T. Kawano, M. Kimura. Microelectrochemistry of dual-phase steel corroding in 0.1 M sulfuric acid. Electrochimica Acta 2013, 114, 83–87. [Google Scholar] [CrossRef]
- S. Kumar, A. Kumar, Vinaya, R. Madhusudhan, R. Sah, S. Manjini. Mechanical and electrochemical behavior of dual-phase steels having varying ferrite–martensite volume fractions. Journal of Materials Engineering and Performance 2019, 28, 3600–3613. [Google Scholar] [CrossRef]
- M. Ito, A. Ooi, E. Tada, A. Nishikata. In situ evaluation of carbon steel corrosion under salt spray test by electrochemical impedance spectroscopy. Journal of The Electrochemical Society 2020, 167, 101508. [Google Scholar] [CrossRef]
- M. Isakhani-Zakaria, S.R. Allahkaram, H.A. Ramezani-Varzaneh. Evaluation of corrosion behaviour of Pb-Co3O4 electrodeposited coating using EIS method. Corrosion Science 2019, 157, 472–480. [Google Scholar] [CrossRef]
- F. Bentiss, M. Lebrini, H. Vezin, F. Chai, M. Traisnel, M. Lagrené. Enhanced corrosion resistance of carbon steel in normal sulfuric acid medium by some macrocyclic polyether compounds containing a 1, 3, 4-thiadiazole moiety: AC impedance and computational studies. Corrosion Science 2009, 51, 2165–2173. [Google Scholar] [CrossRef]
- N. Ebrahimi, M. Momeni, A. Kosari, M. Zakeri, M.H. Moayed. A comparative study of critical pitting temperature (CPT) of stainless steels by electrochemical impedance spectroscopy (EIS), potentiodynamic and potentiostatic techniques. Corrosion science 2012, 59, 96–102. [Google Scholar] [CrossRef]
- Q. Li, Z. Wang, W. Han, E. Han. Characterization of the corrosion products formed on carbon steel in Qinghai salt lake atmosphere. Corrosion 2007, 63, 640–647. [Google Scholar] [CrossRef]
- Y. Liu, M. Liu, X. Lu, Z. Wang. Effect of temperature and ultraviolet radiation on corrosion behavior of carbon steel in high humidity tropical marine atmosphere. Materials Chemistry and Physics 2022, 277, 124962. [Google Scholar] [CrossRef]
- Y. Fan, W. Liu, S. Li, T. Chowwanonthapunya, B. Wongpat, Y. Zhao, B. Dong, T. Zhang, X. Li. Evolution of rust layers on carbon steel and weathering steel in high humidity and heat marine atmospheric corrosion. Journal of Materials Science & Technology 2020, 39, 190–199. [Google Scholar] [CrossRef]
- K. Asami, M. Kikuchi. In-depth distribution of rusts on a plain carbon steel and weathering steels exposed to coastal–industrial atmosphere for 17 years. Corrosion Science 2003, 45, 2671–2688. [Google Scholar] [CrossRef]
- Y. Wang, X. Mu, J. Dong, A.J. Umoh, W. Ke. Insight into atmospheric corrosion evolution of mild steel in a simulated coastal atmosphere. Journal of Materials Science & Technology 2021, 76, 41–50. [Google Scholar] [CrossRef]
- S. Li, L. Hihara. In situ Raman spectroscopic identification of rust formation in Evans' droplet experiments. Electrochemistry communications 2012, 18, 48–50. [Google Scholar] [CrossRef]
- Z. -l. Li, K. Xiao, C.-f. Dong, X.-q. Cheng, W. Xue, W. Yu. Atmospheric corrosion behavior of low-alloy steels in a tropical marine environment. Journal of Iron and Steel Research International 2019, 26, 1315–1328. [Google Scholar] [CrossRef]
- L. Hao, S. Zhang, J. Dong, W. Ke. Evolution of corrosion of MnCuP weathering steel submitted to wet/dry cyclic tests in a simulated coastal atmosphere. Corrosion science 2012, 58, 175–180. [Google Scholar] [CrossRef]
- J. Alcántara, D. de la Fuente, B. Chico, J. Simancas, I. Díaz, M. Morcillo. Marine atmospheric corrosion of carbon steel: A review. Materials 2017, 10, 406. [Google Scholar] [CrossRef]
- Y. Ma, Y. Li, F. Wang. Corrosion of low carbon steel in atmospheric environments of different chloride content. Corrosion science 2009, 51, 997–1006. [Google Scholar] [CrossRef]
- N. Dai, J. Zhang, Q. Chen, B. Yi, F. Cao, J. Zhang. Effect of the direct current electric field on the initial corrosion of steel in simulated industrial atmospheric environment. Corrosion Science 2015, 99, 295–303. [Google Scholar] [CrossRef]
- S. J. Oh, D. Cook, H. Townsend. Atmospheric corrosion of different steels in marine, rural and industrial environments. Corrosion Science 1999, 41, 1687–1702. [Google Scholar] [CrossRef]
- J. Alcántara, B. Chico, I. Díaz, D. De la Fuente, M. Morcillo. Airborne chloride deposit and its effect on marine atmospheric corrosion of mild steel. Corrosion Science 2015, 97, 74–88. [Google Scholar] [CrossRef]
- D.A. Jones. Principles and prevention of CORROSION, 2nd ed.; Upper Saddle River, NJ, USA, 1996; pp. 213–214. [Google Scholar]
Figure 1.
The schematic of a single cycle of the 1st condition CCT.

Figure 2.
Microstructure image of CP with OM (a) Nital etching and (b) LePera etching; F – ferrite, M – martensite, B – bainite.
Figure 2.
Microstructure image of CP with OM (a) Nital etching and (b) LePera etching; F – ferrite, M – martensite, B – bainite.
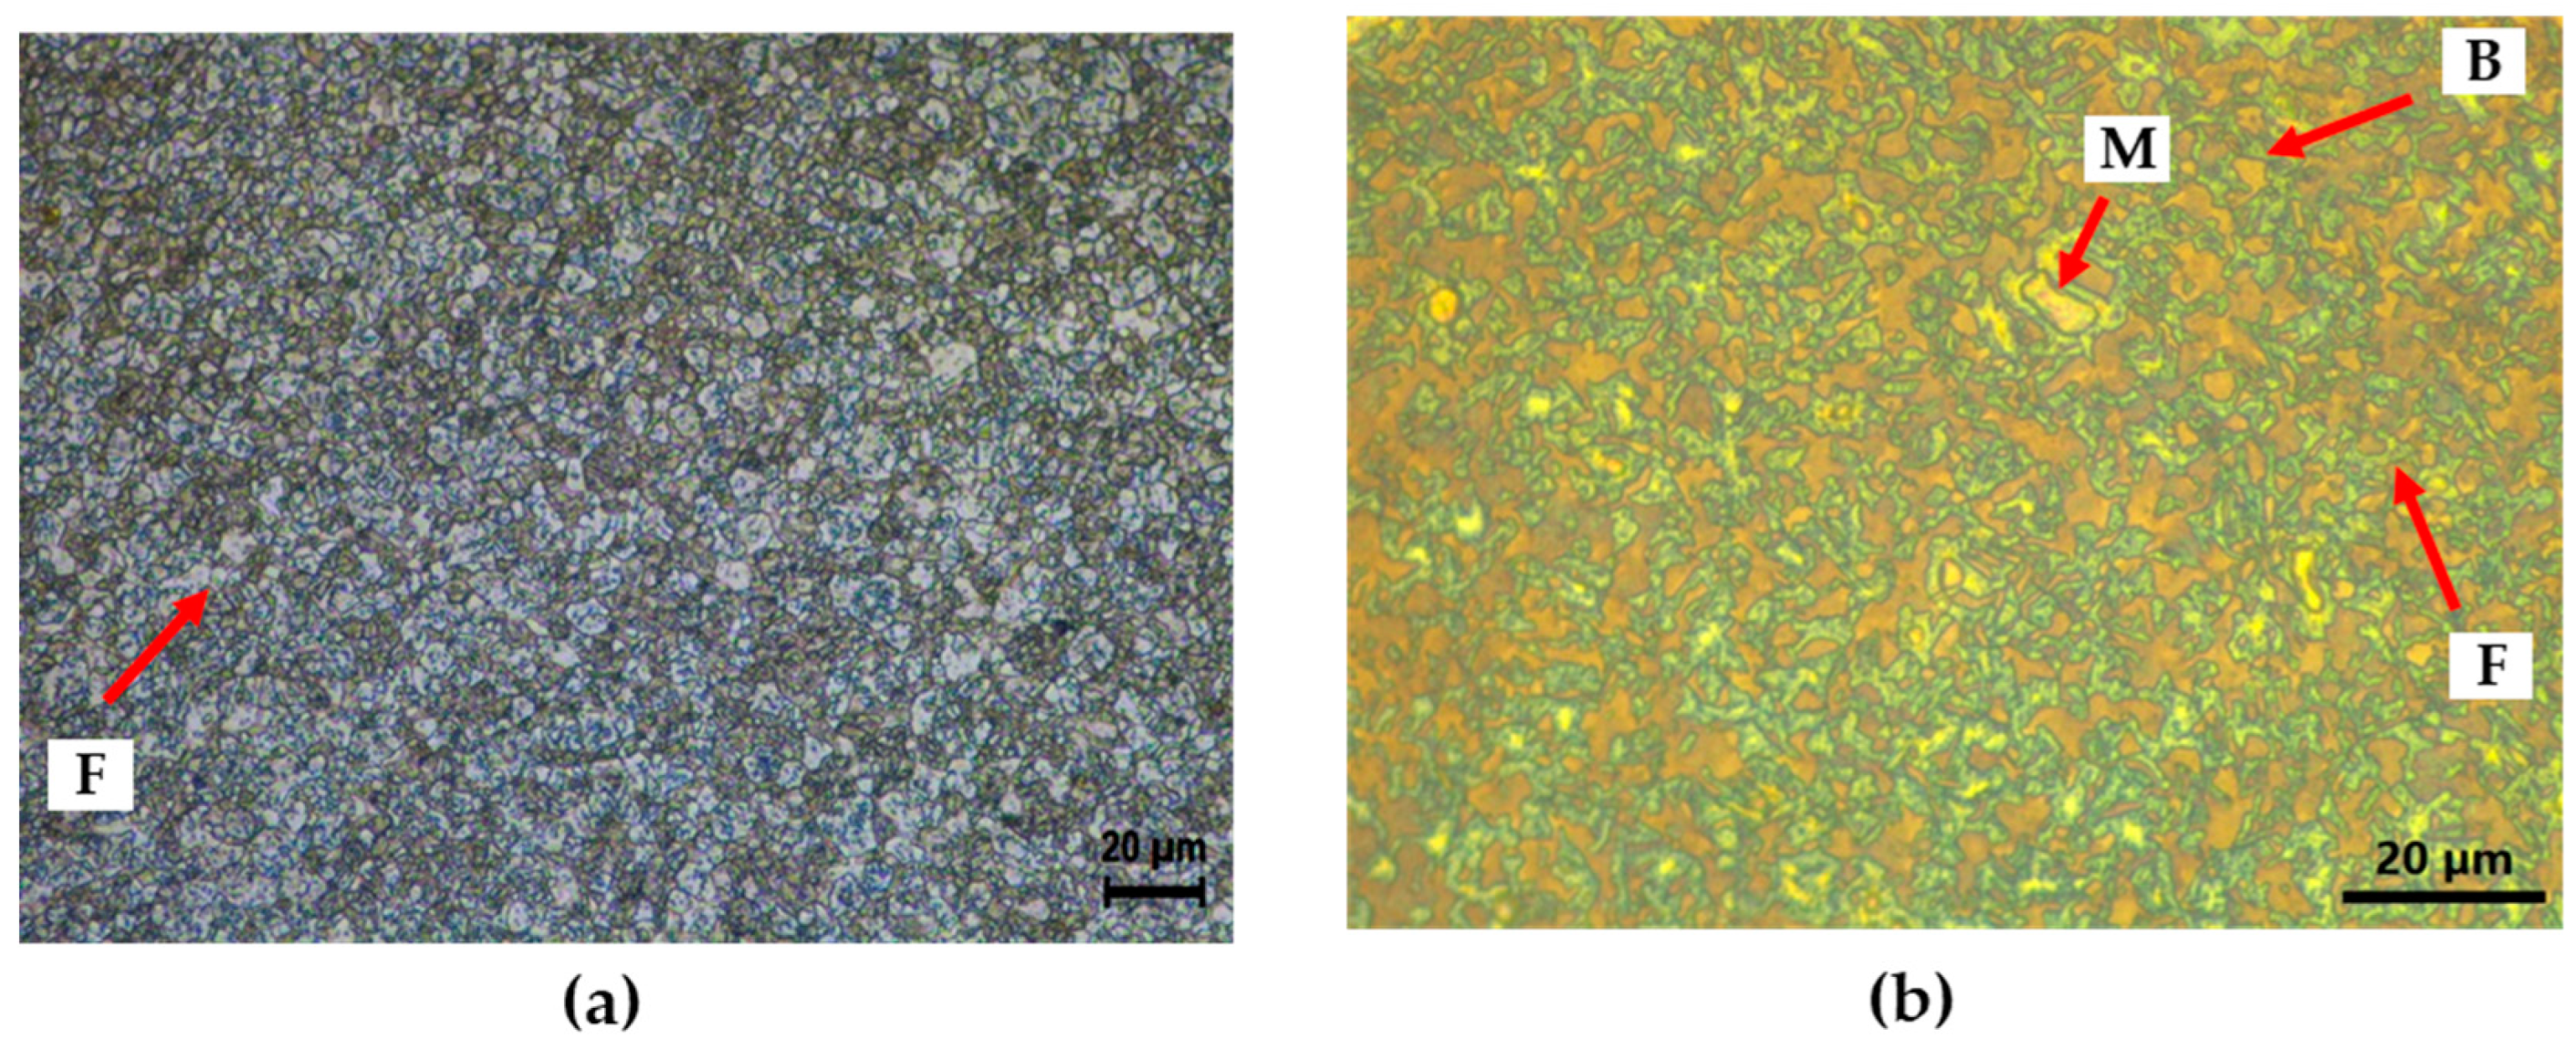
Figure 3.
Results of AFM after Nital etching of CP (a) topography and (b) surface potential.
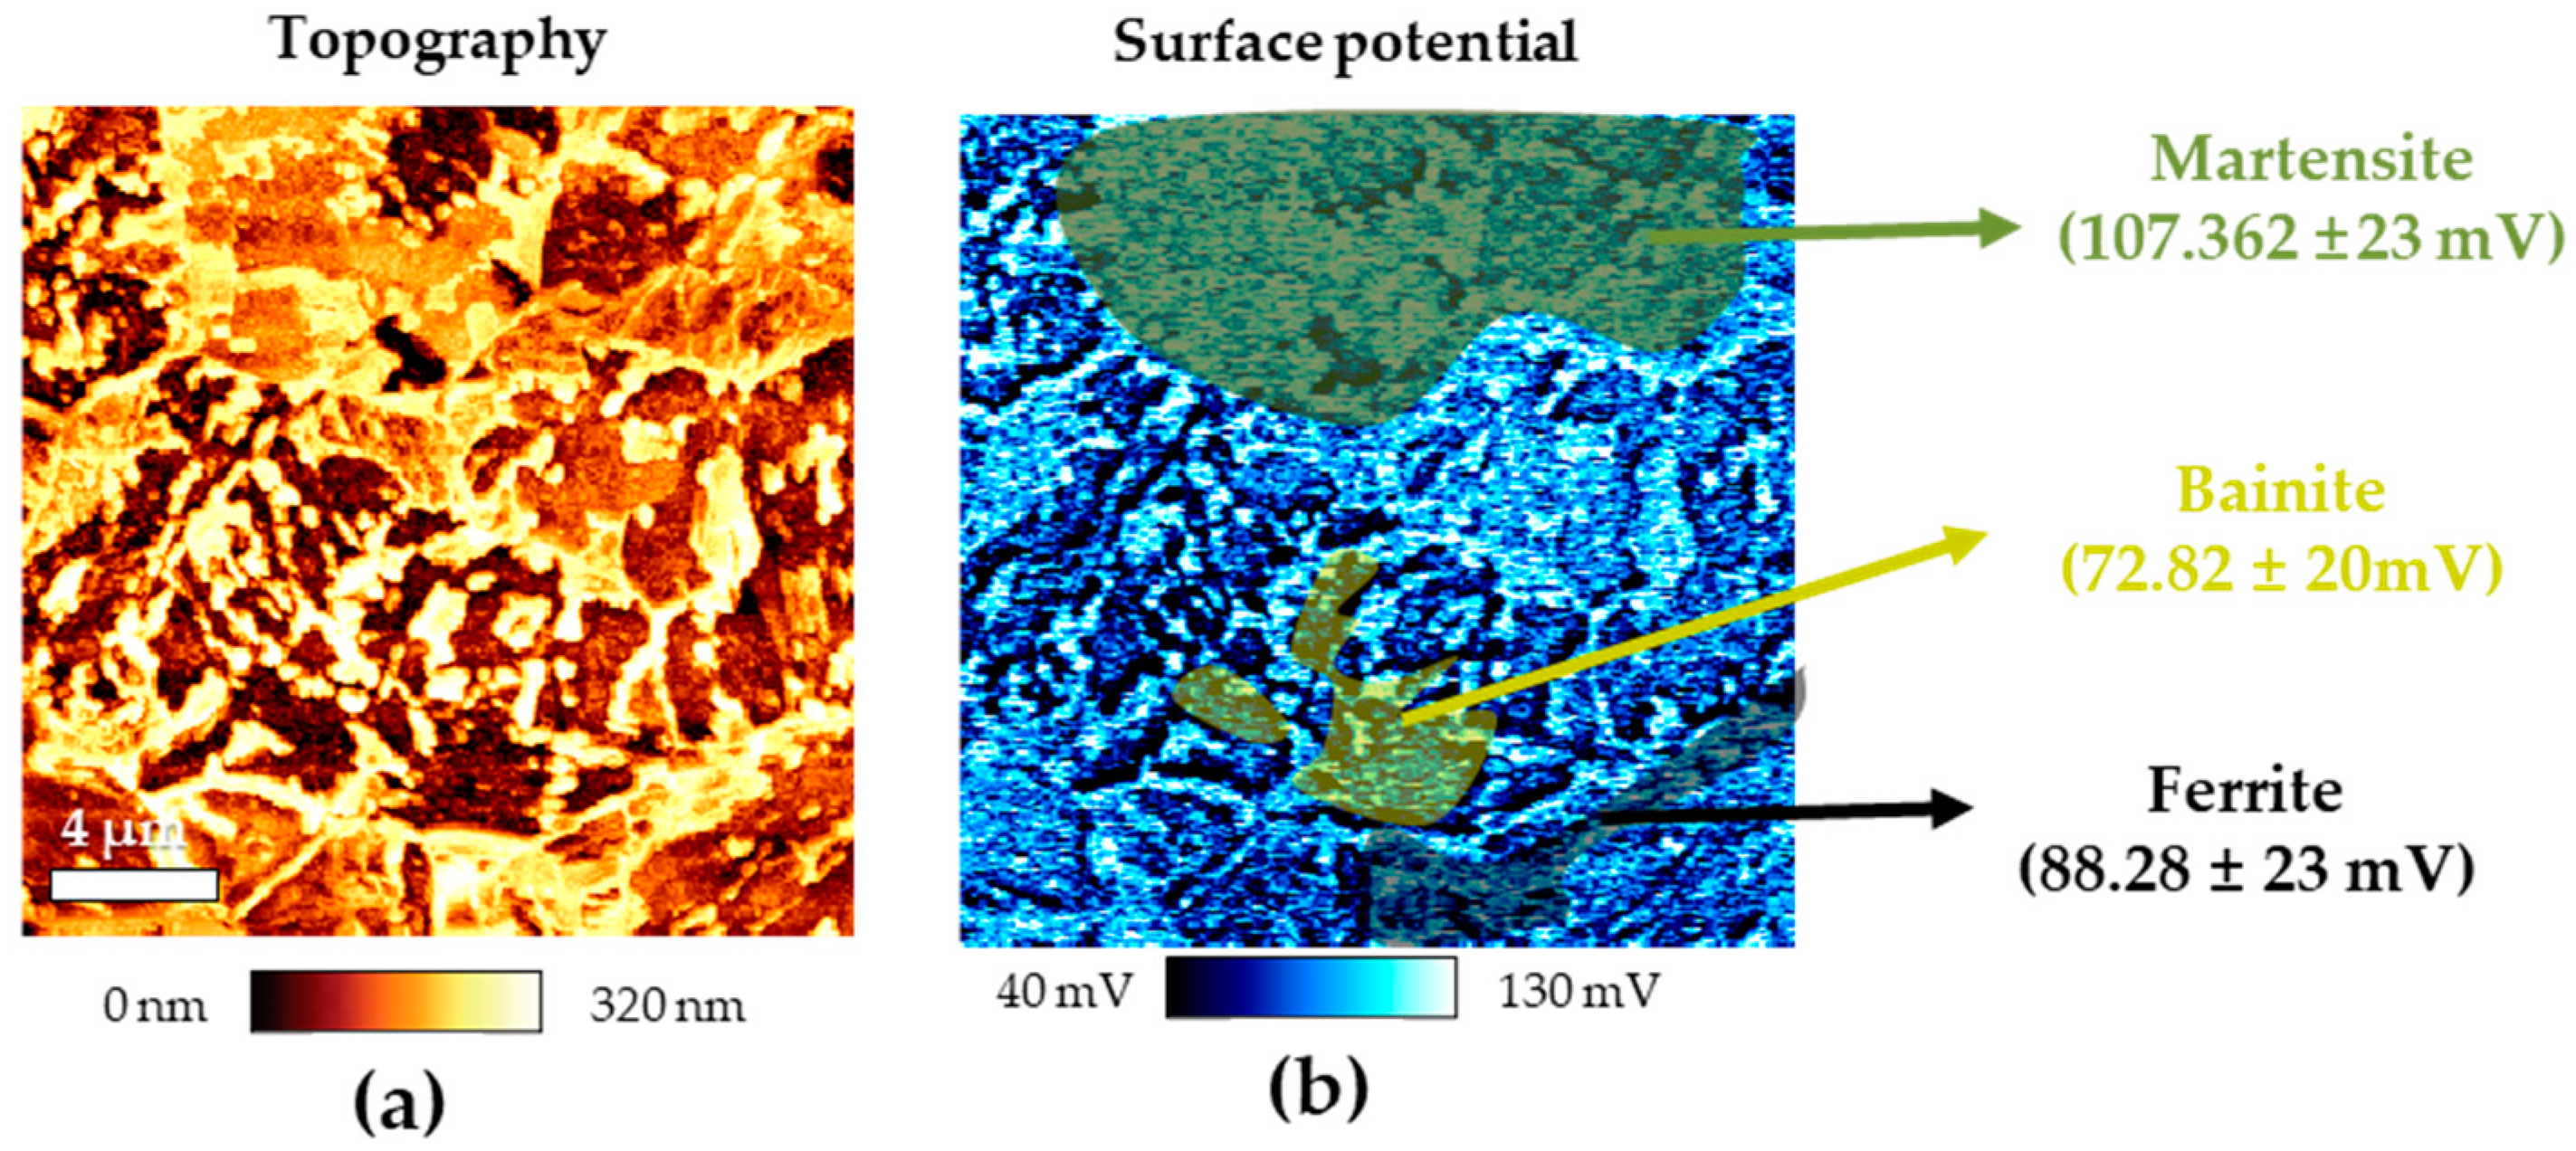
Figure 4.
The rust layers after CCT for four different conditions (a) surface images after 15 cycles, (b) surface images after 30 cycles, and (c) SEM images of cross-section after 30 cycles.
Figure 4.
The rust layers after CCT for four different conditions (a) surface images after 15 cycles, (b) surface images after 30 cycles, and (c) SEM images of cross-section after 30 cycles.
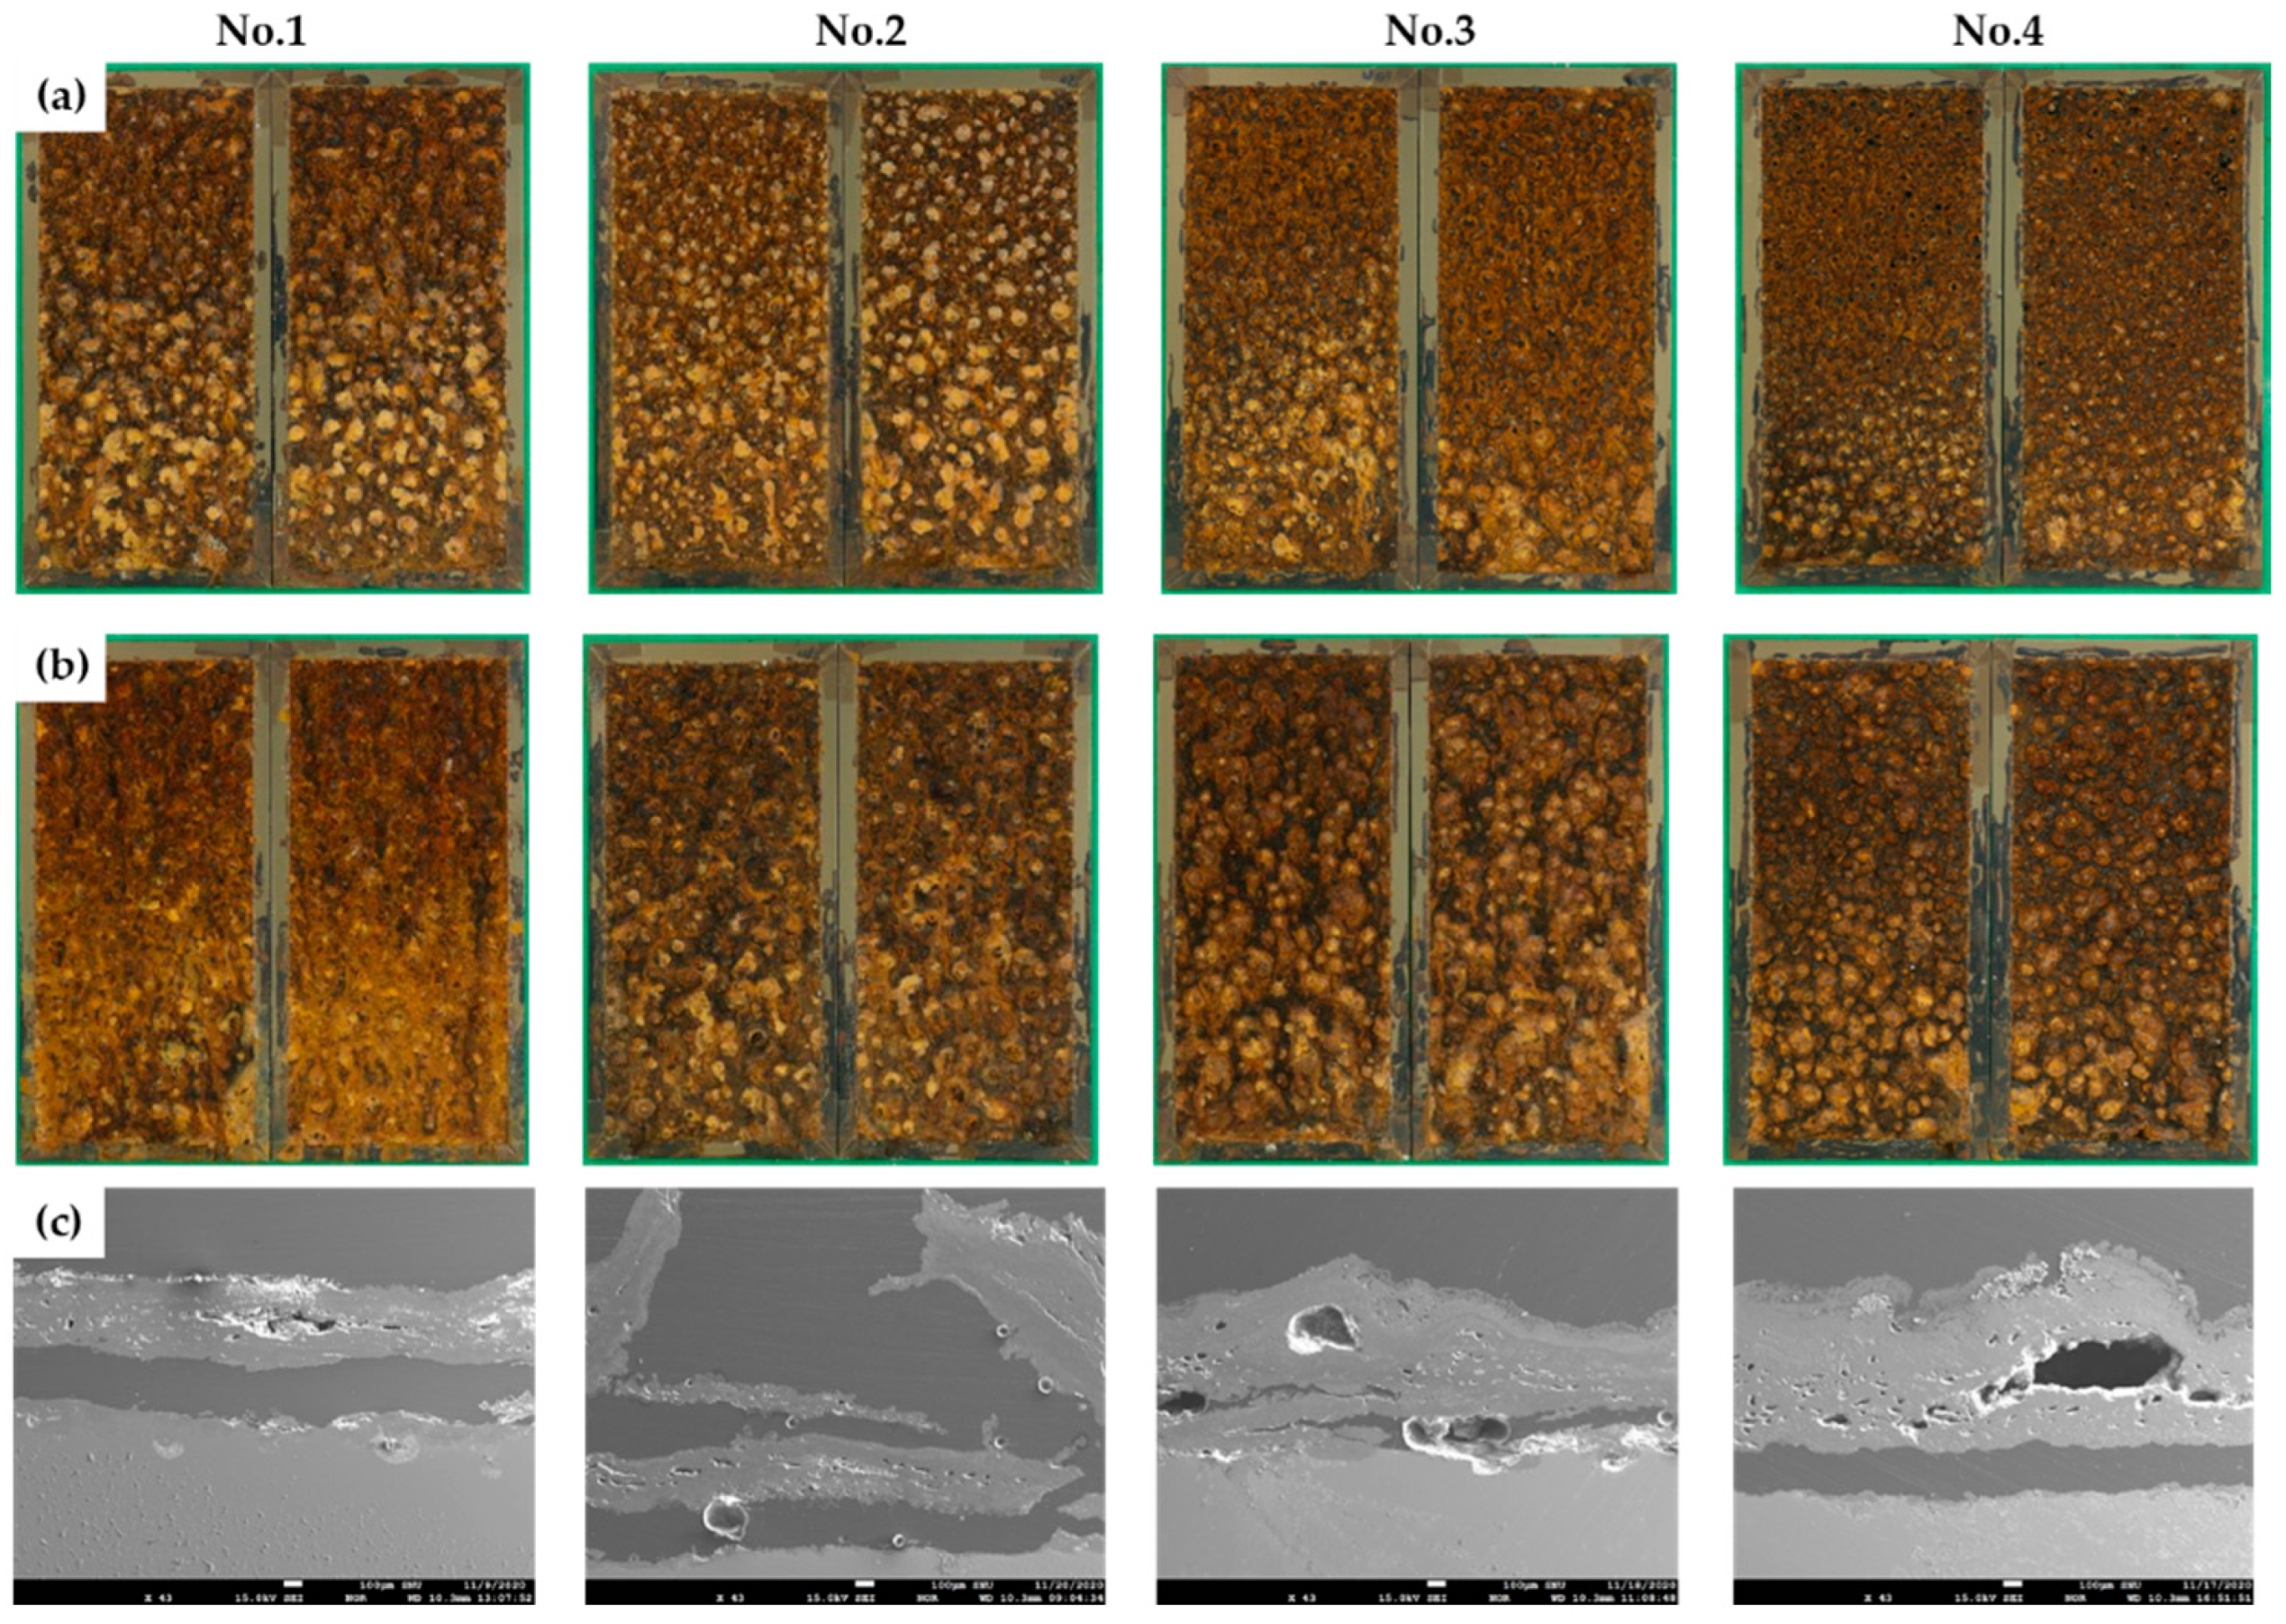
Figure 5.
Results of electrochemical analyses in 5 wt.% NaCl solution (a) potentiodynamic polarization curve and (b) EIS Nyquist plot and equivalent electrical circuit for fitting.
Figure 5.
Results of electrochemical analyses in 5 wt.% NaCl solution (a) potentiodynamic polarization curve and (b) EIS Nyquist plot and equivalent electrical circuit for fitting.
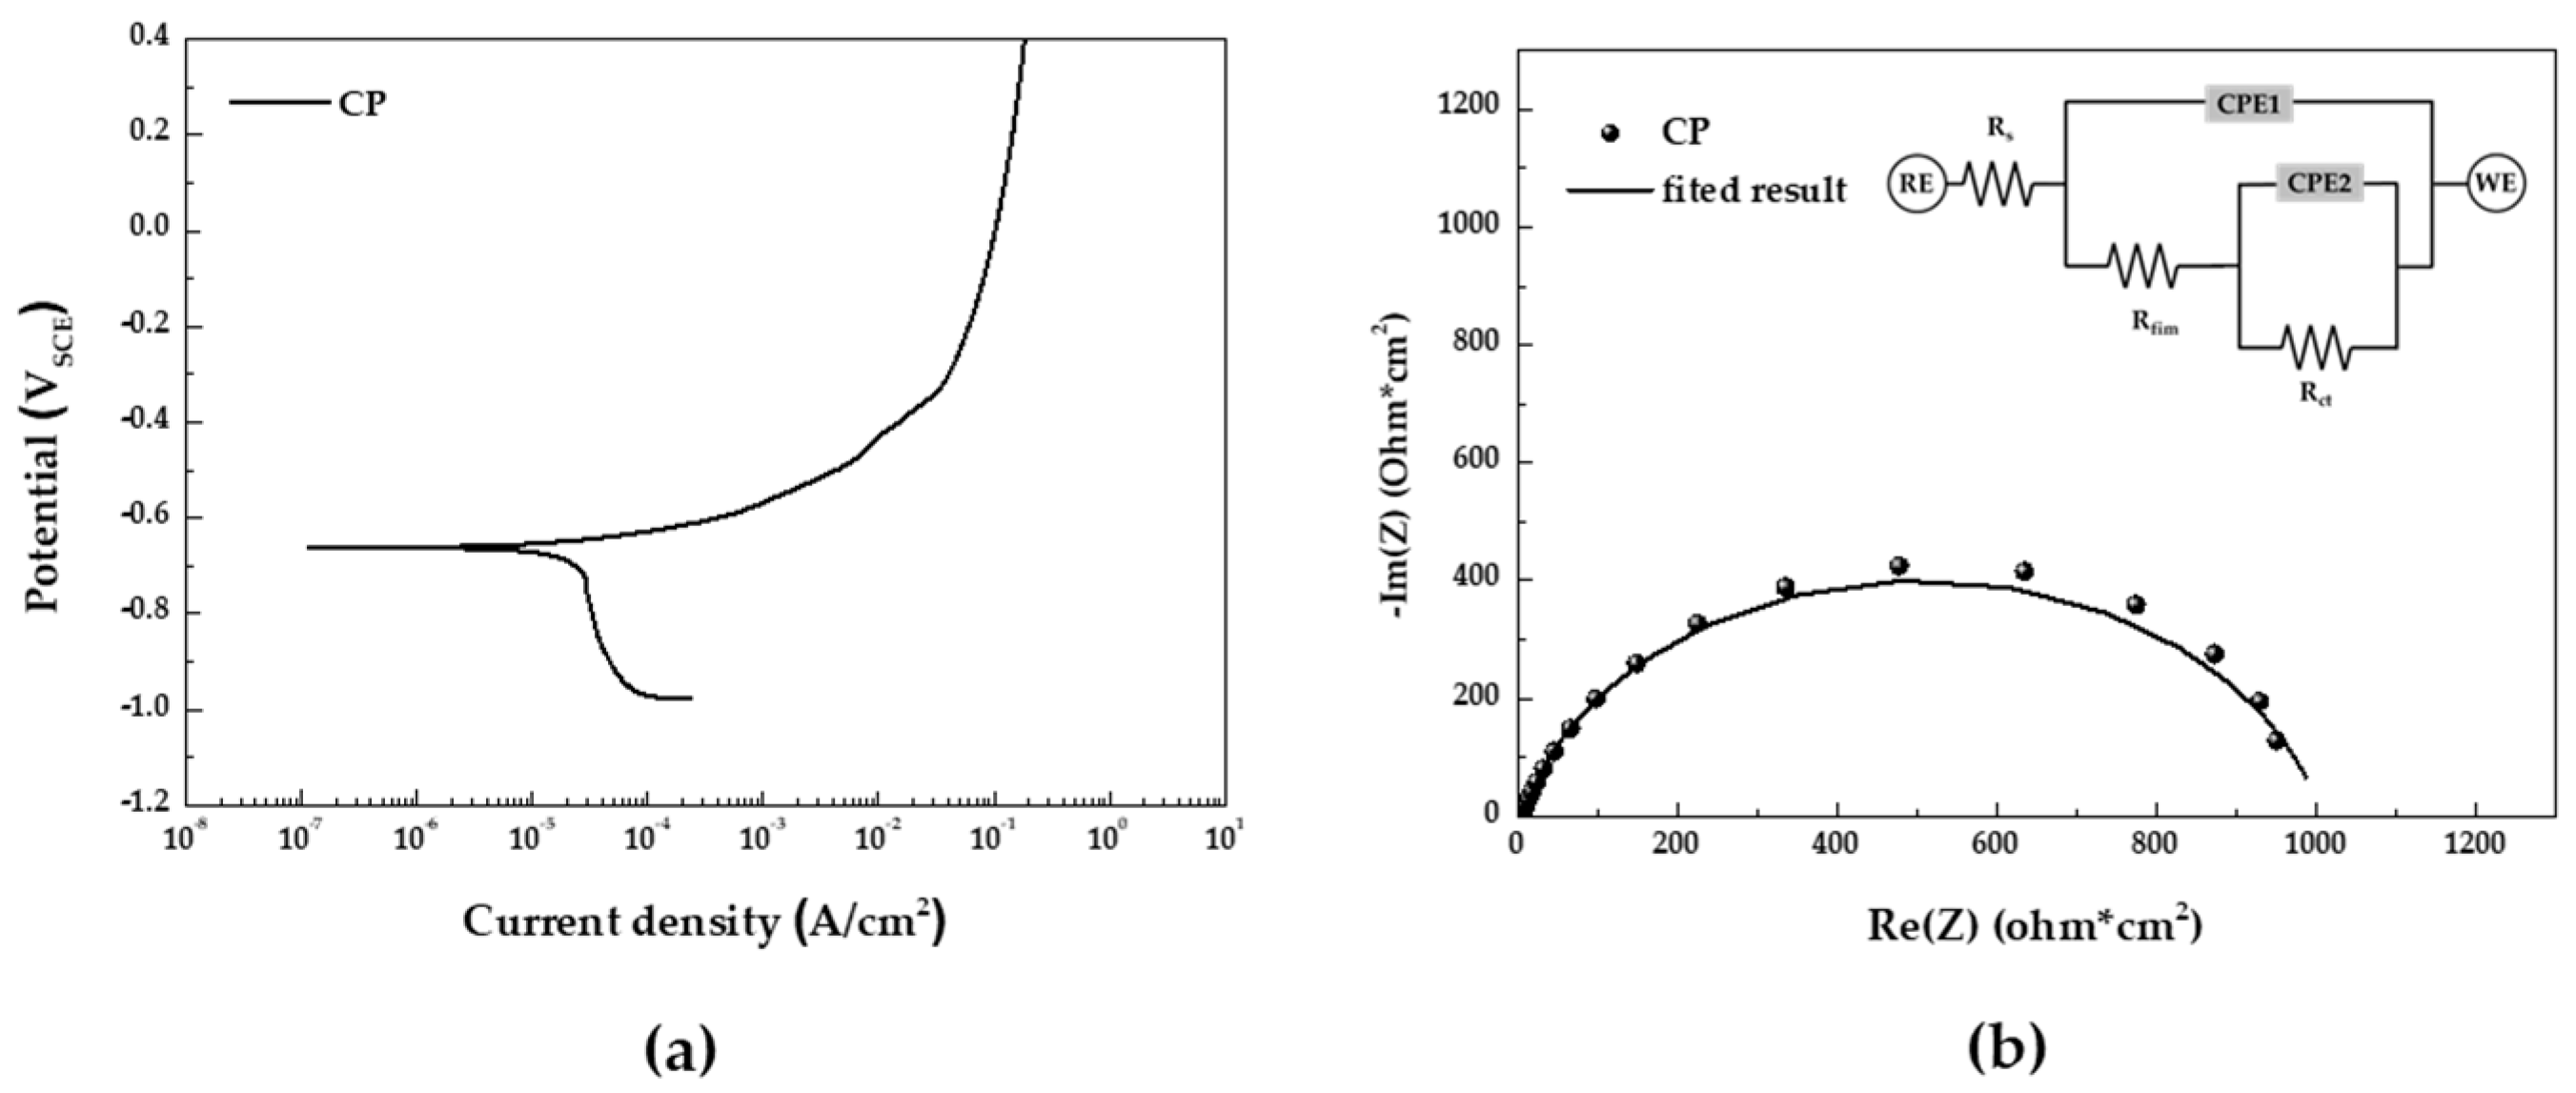
Figure 6.
Results of 15 cycles of CCT for four different conditions after acid cleaning (a) surface images, (b) mass loss, (c) maximum corrosion depth, (d) pitting factor.
Figure 6.
Results of 15 cycles of CCT for four different conditions after acid cleaning (a) surface images, (b) mass loss, (c) maximum corrosion depth, (d) pitting factor.
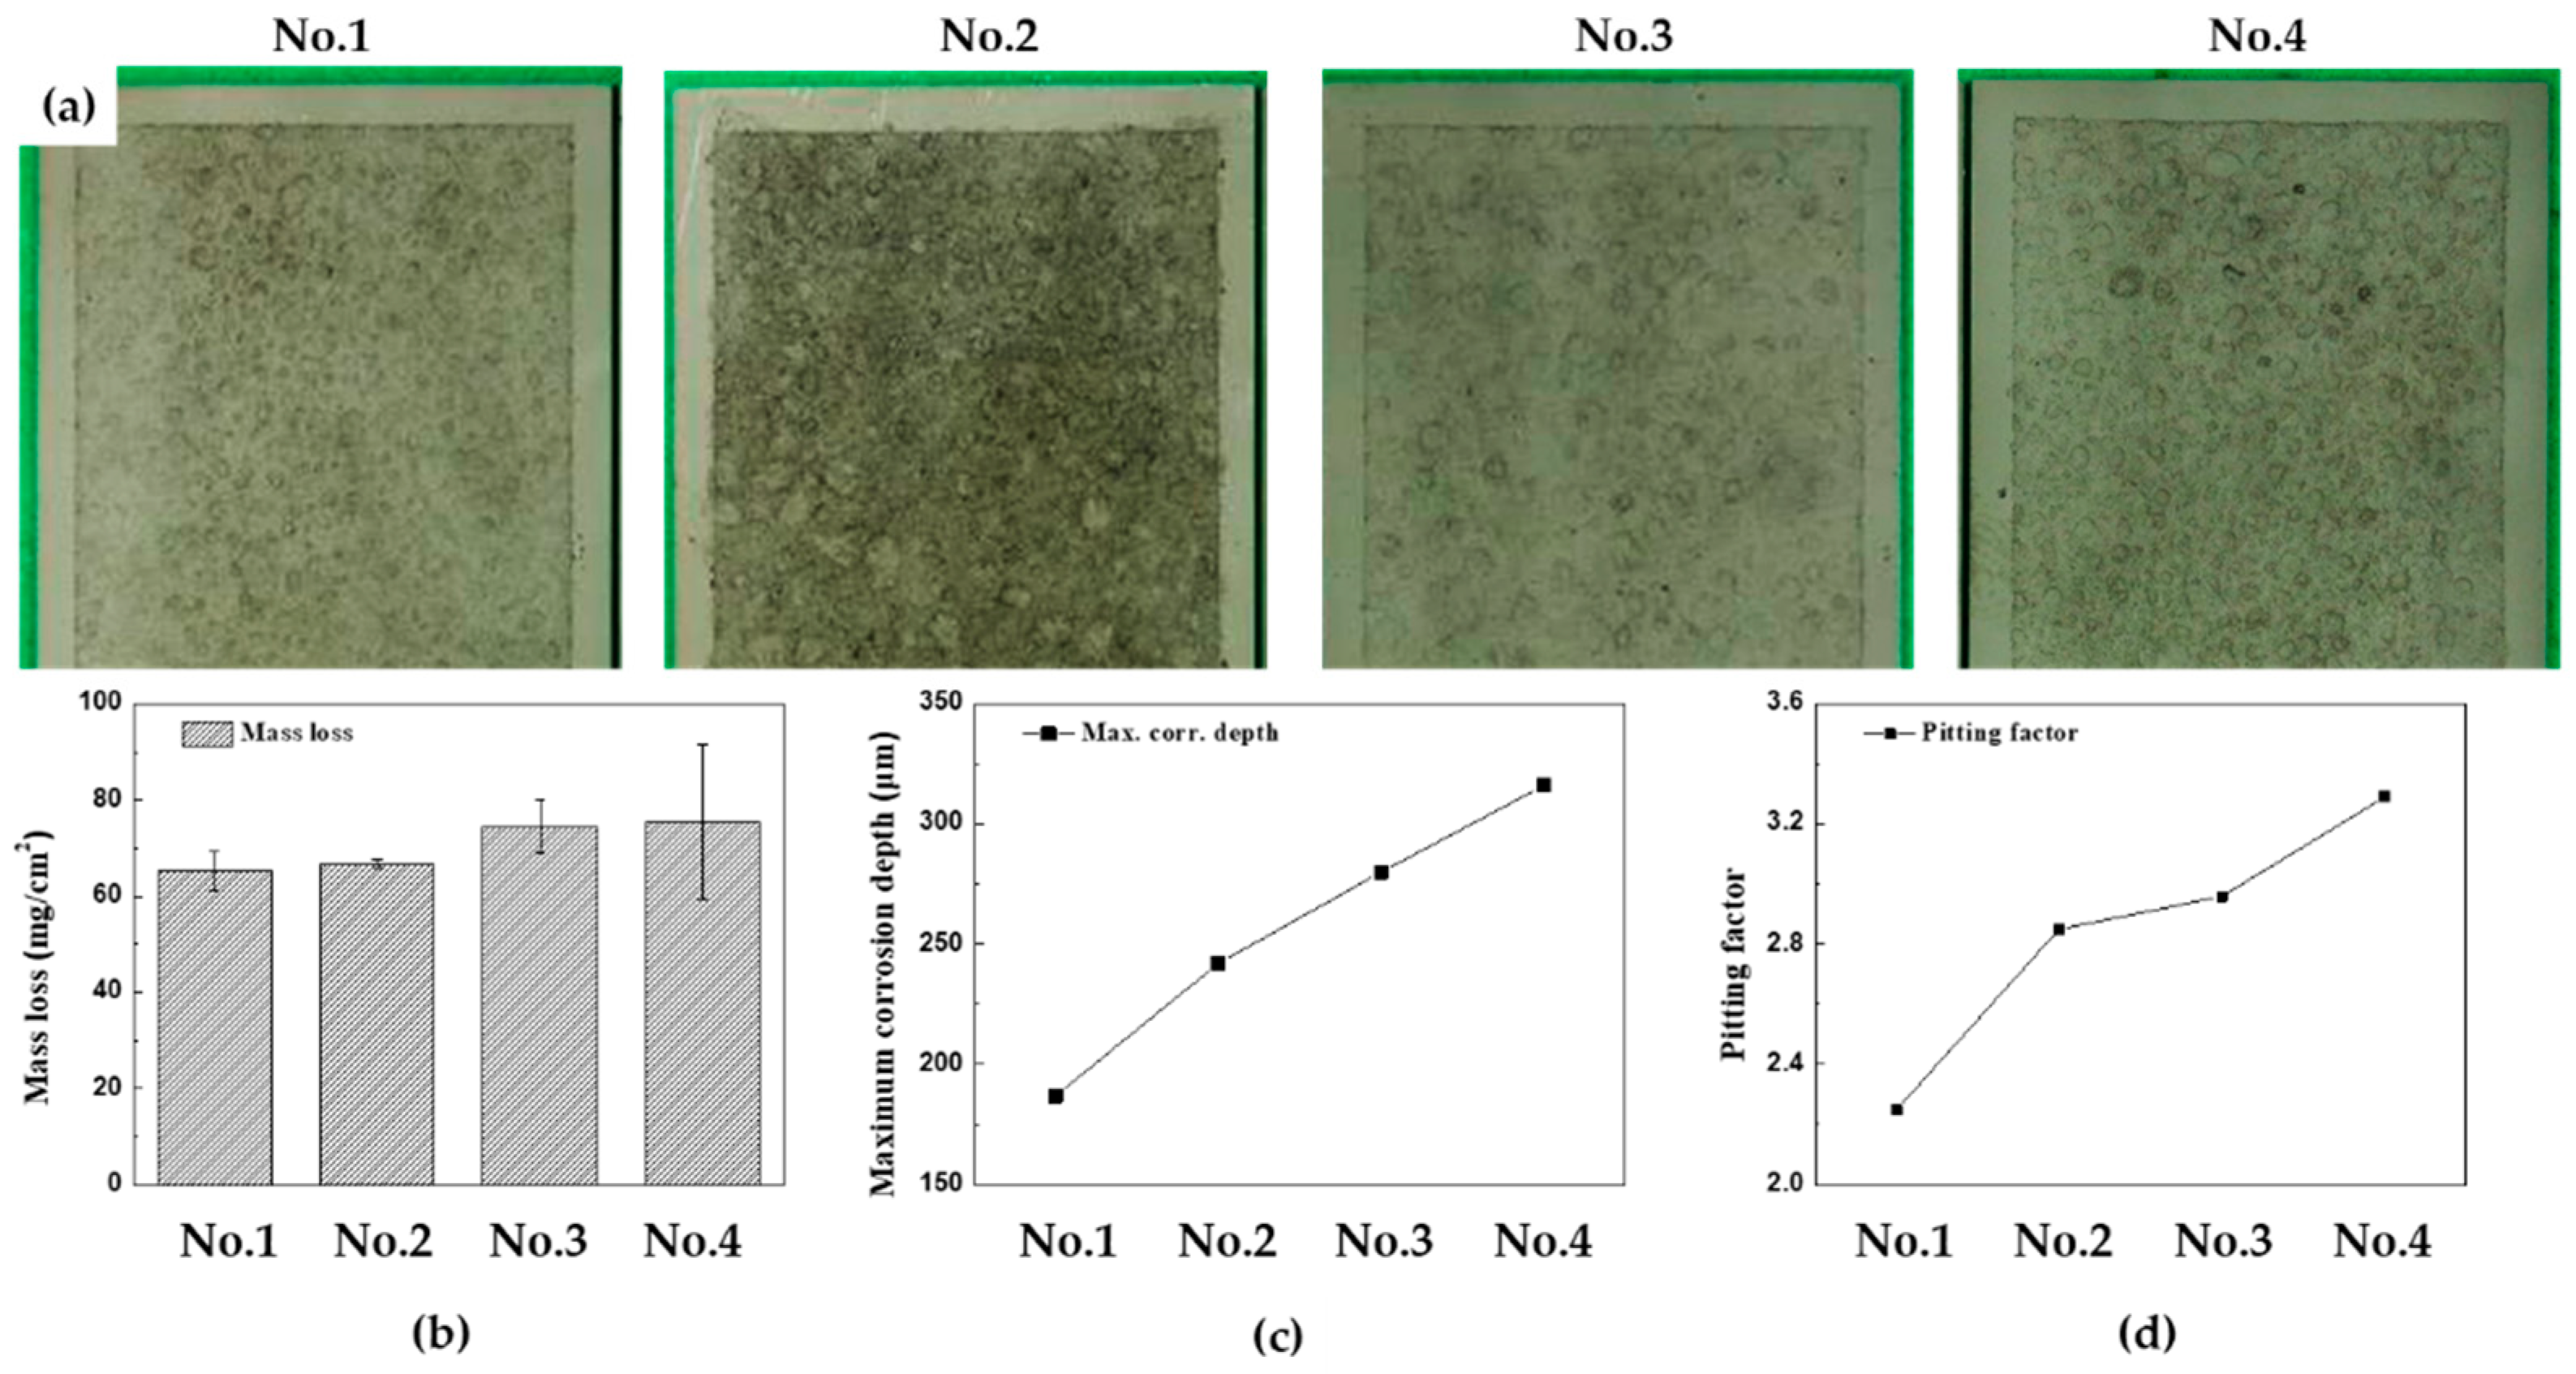
Figure 7.
Results of 30 cycles of CCT for four different conditions after acid cleaning (a) surface images, (b) mass loss, (c) maximum corrosion depth, (d) pitting factor.
Figure 7.
Results of 30 cycles of CCT for four different conditions after acid cleaning (a) surface images, (b) mass loss, (c) maximum corrosion depth, (d) pitting factor.
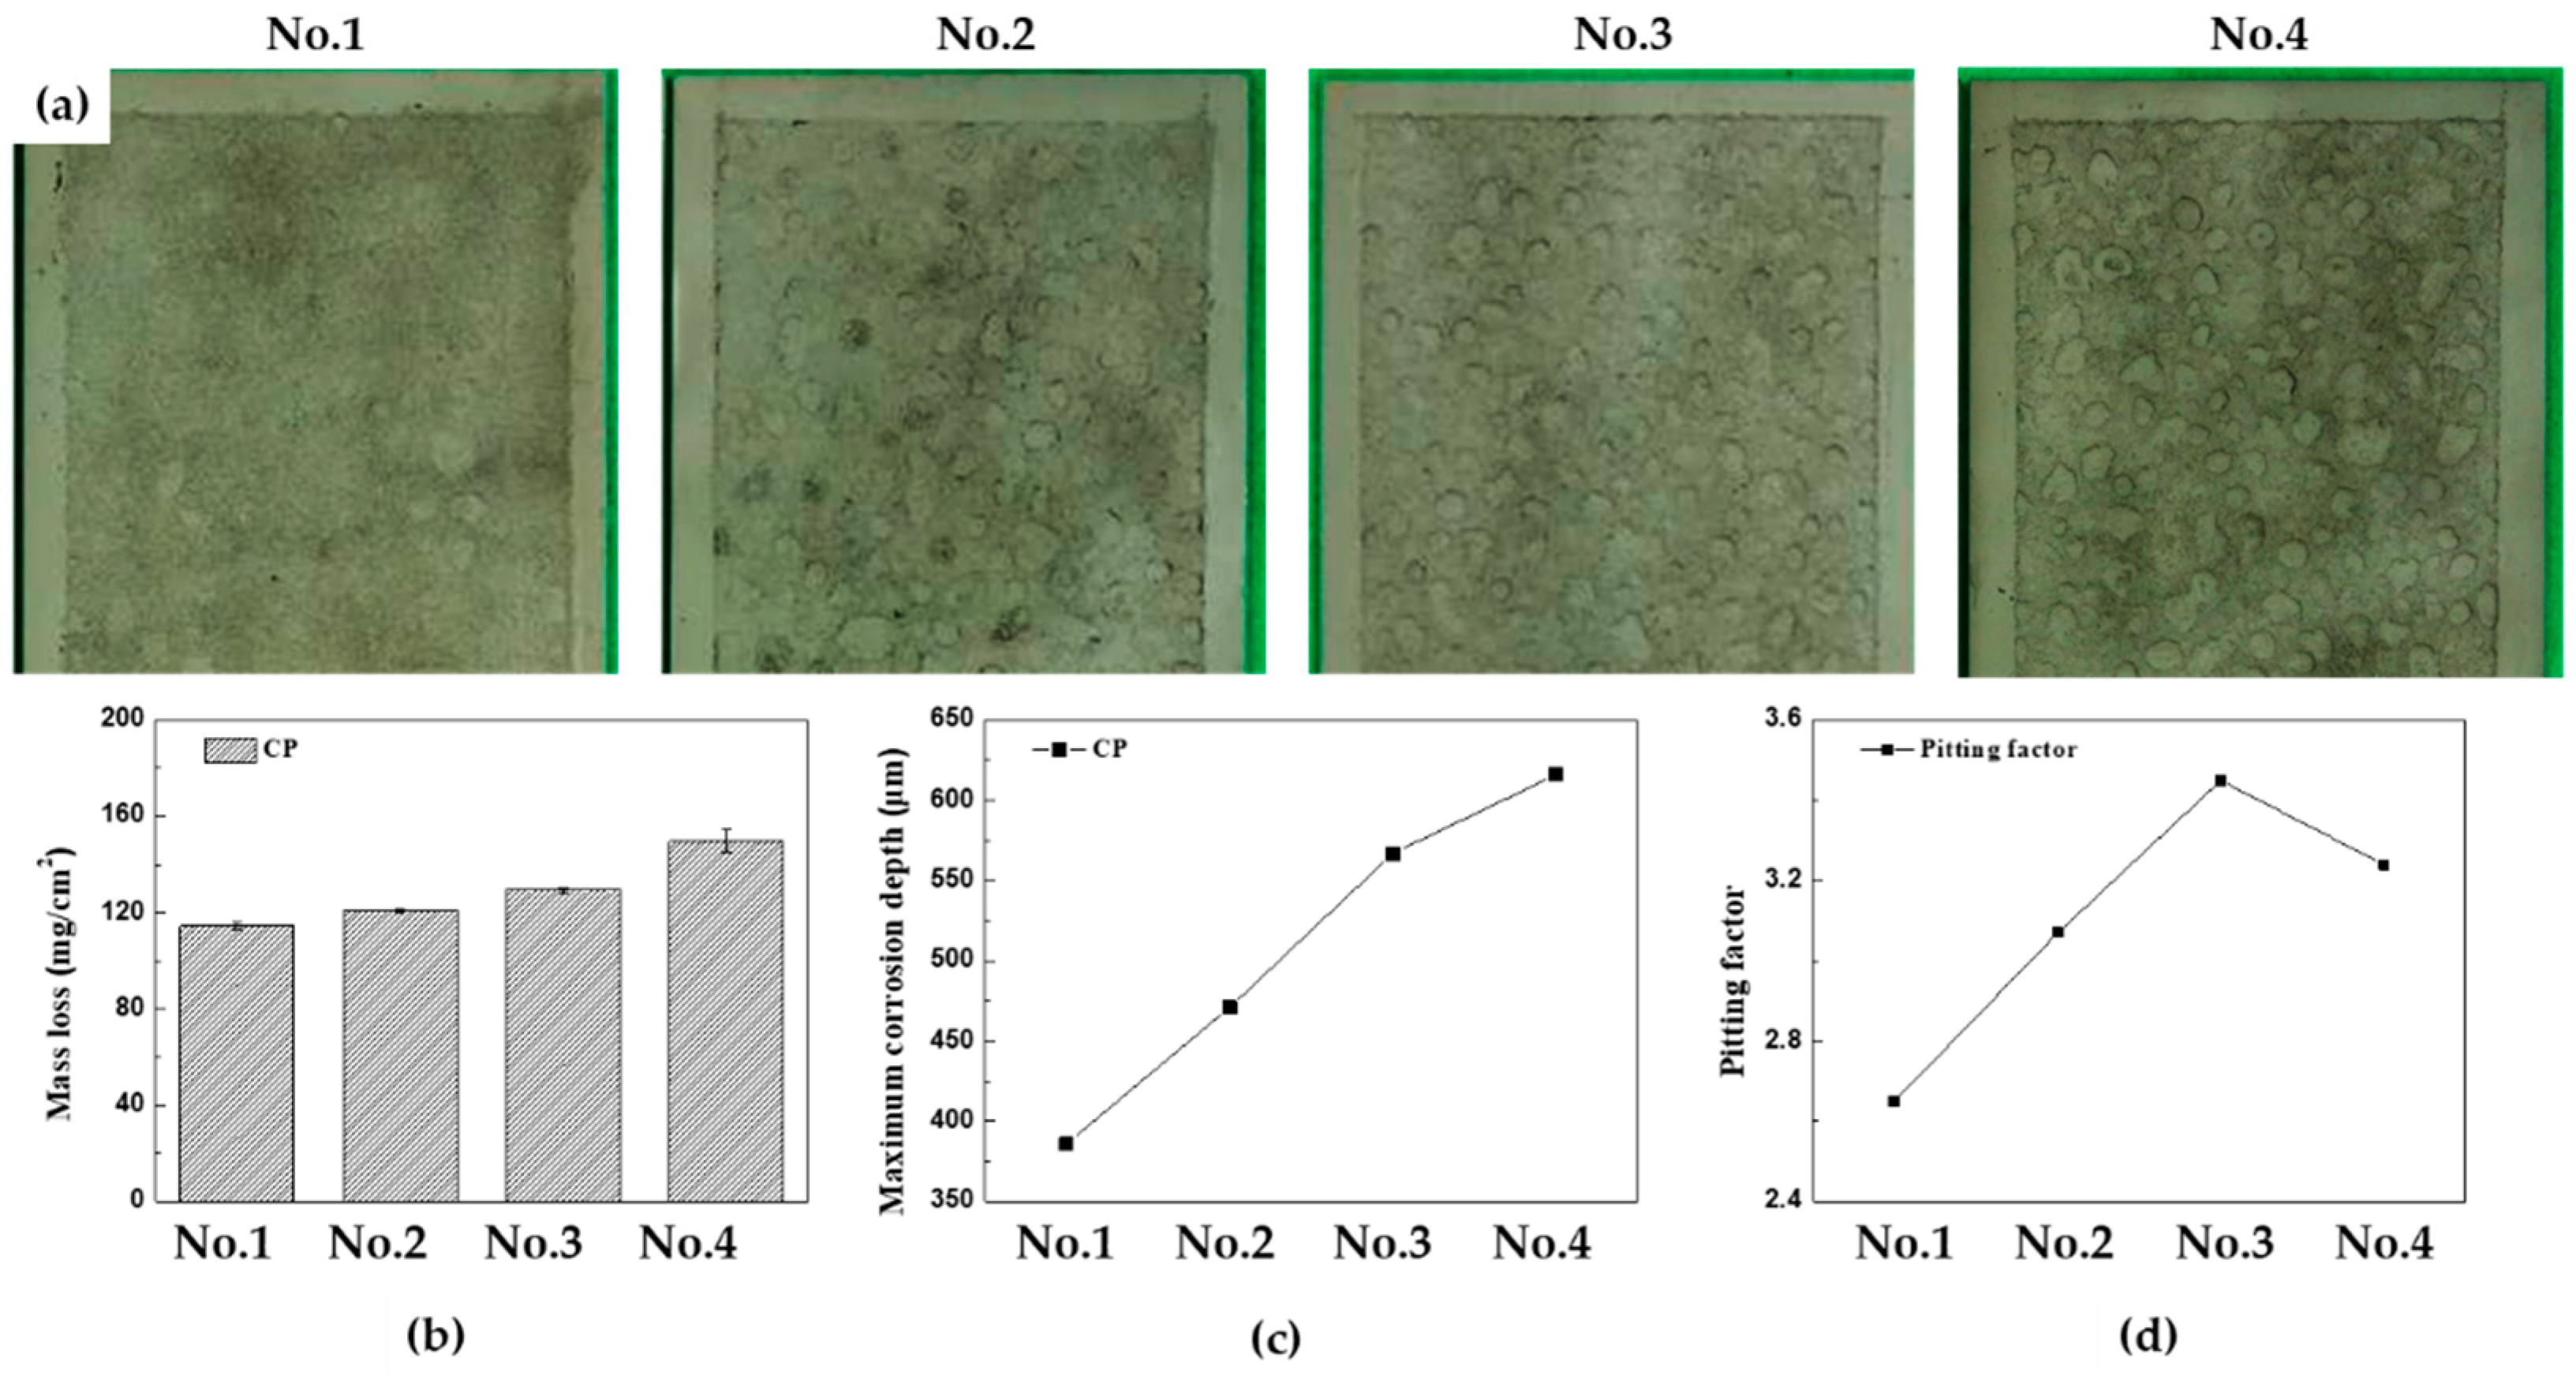
Figure 8.
Results of CCT and regression line (a) mass loss and (b) maximum corrosion depth of CP.
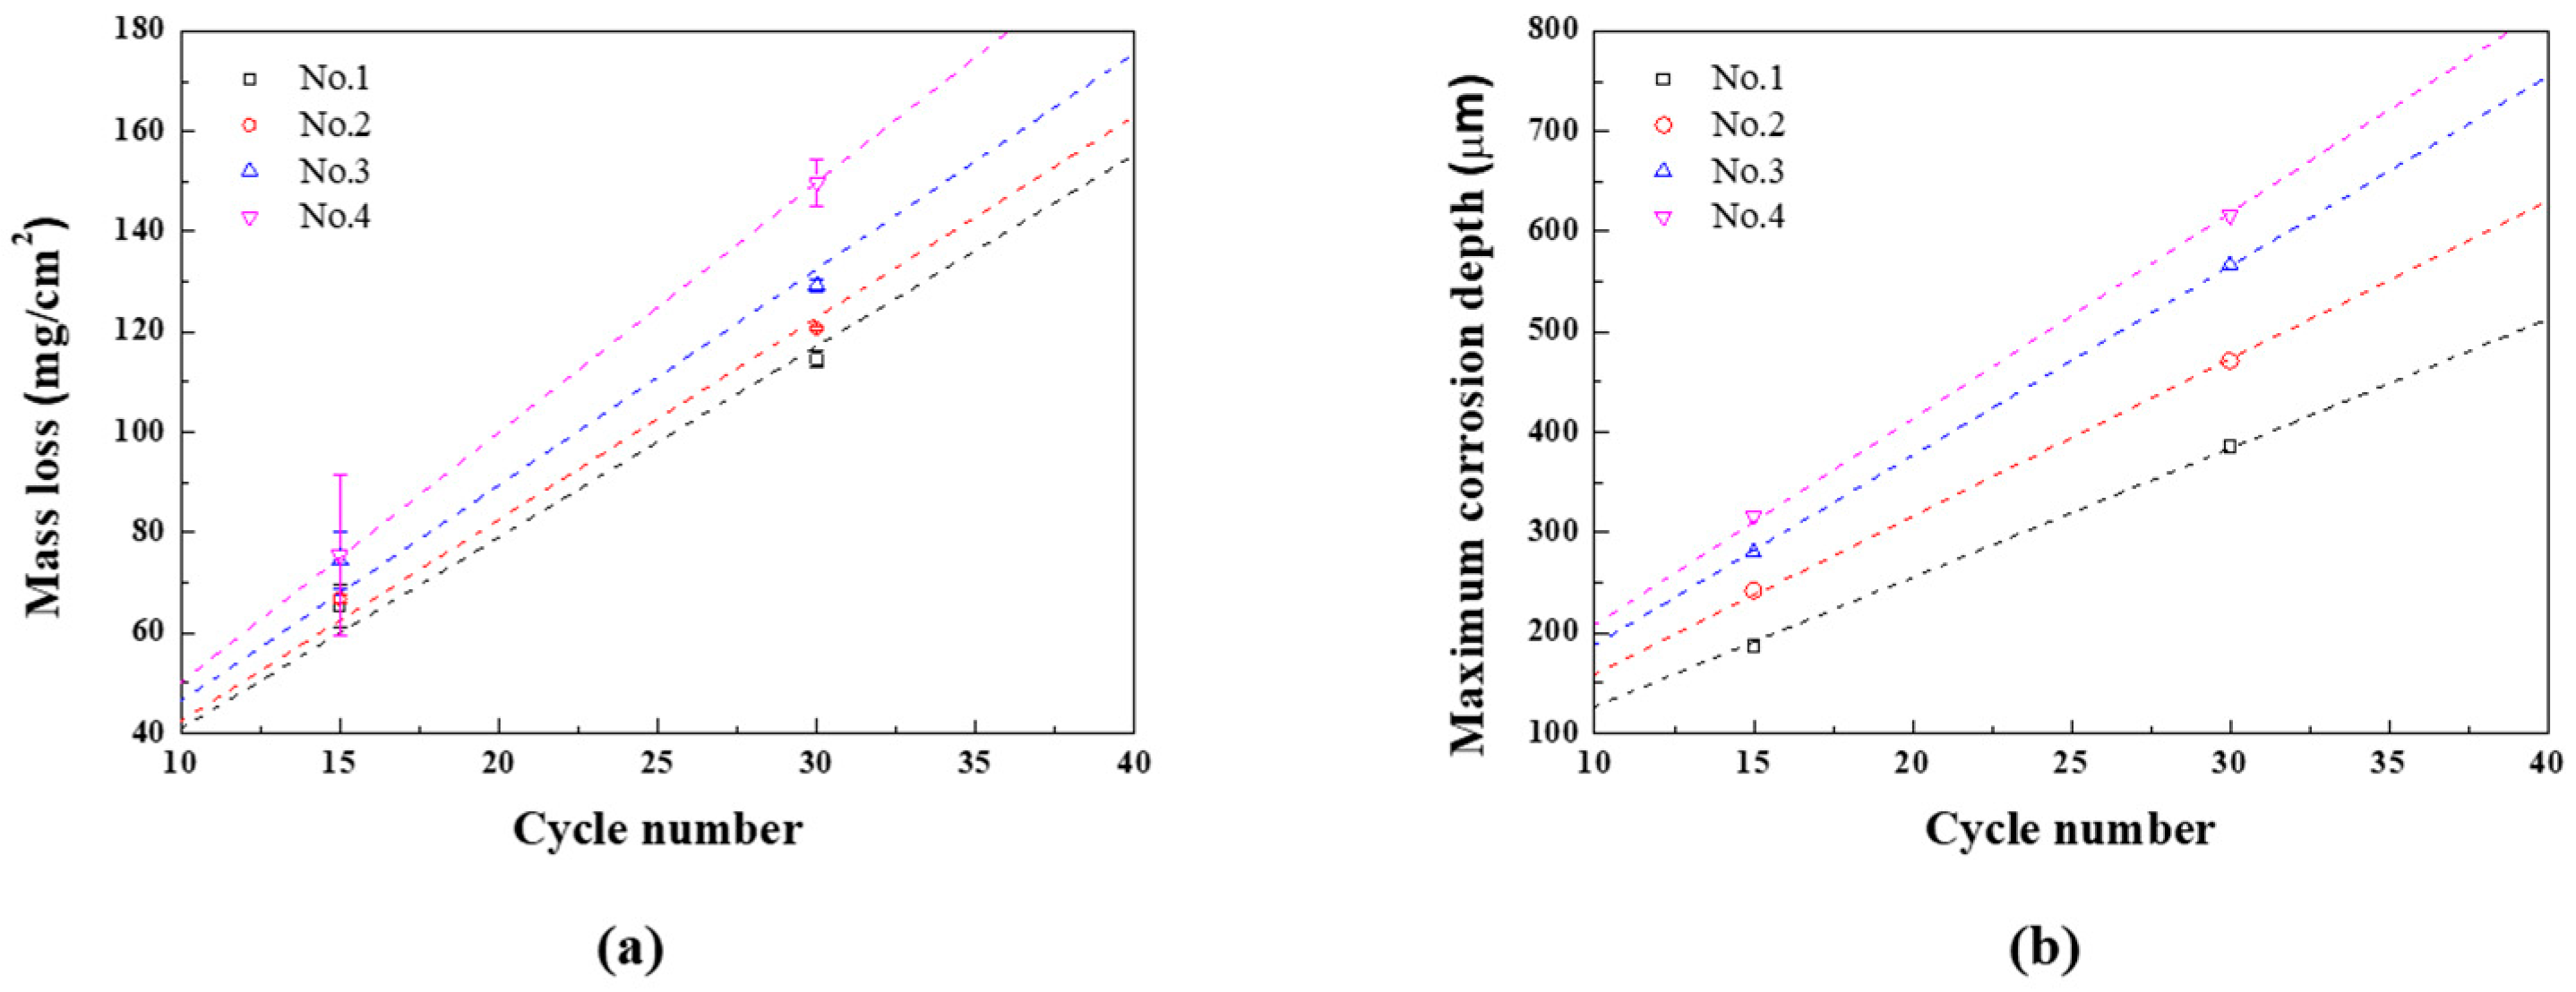
Figure 9.
XRD analysis of corrosion products after 30 cycles of 1st and 4th CCT conditions.
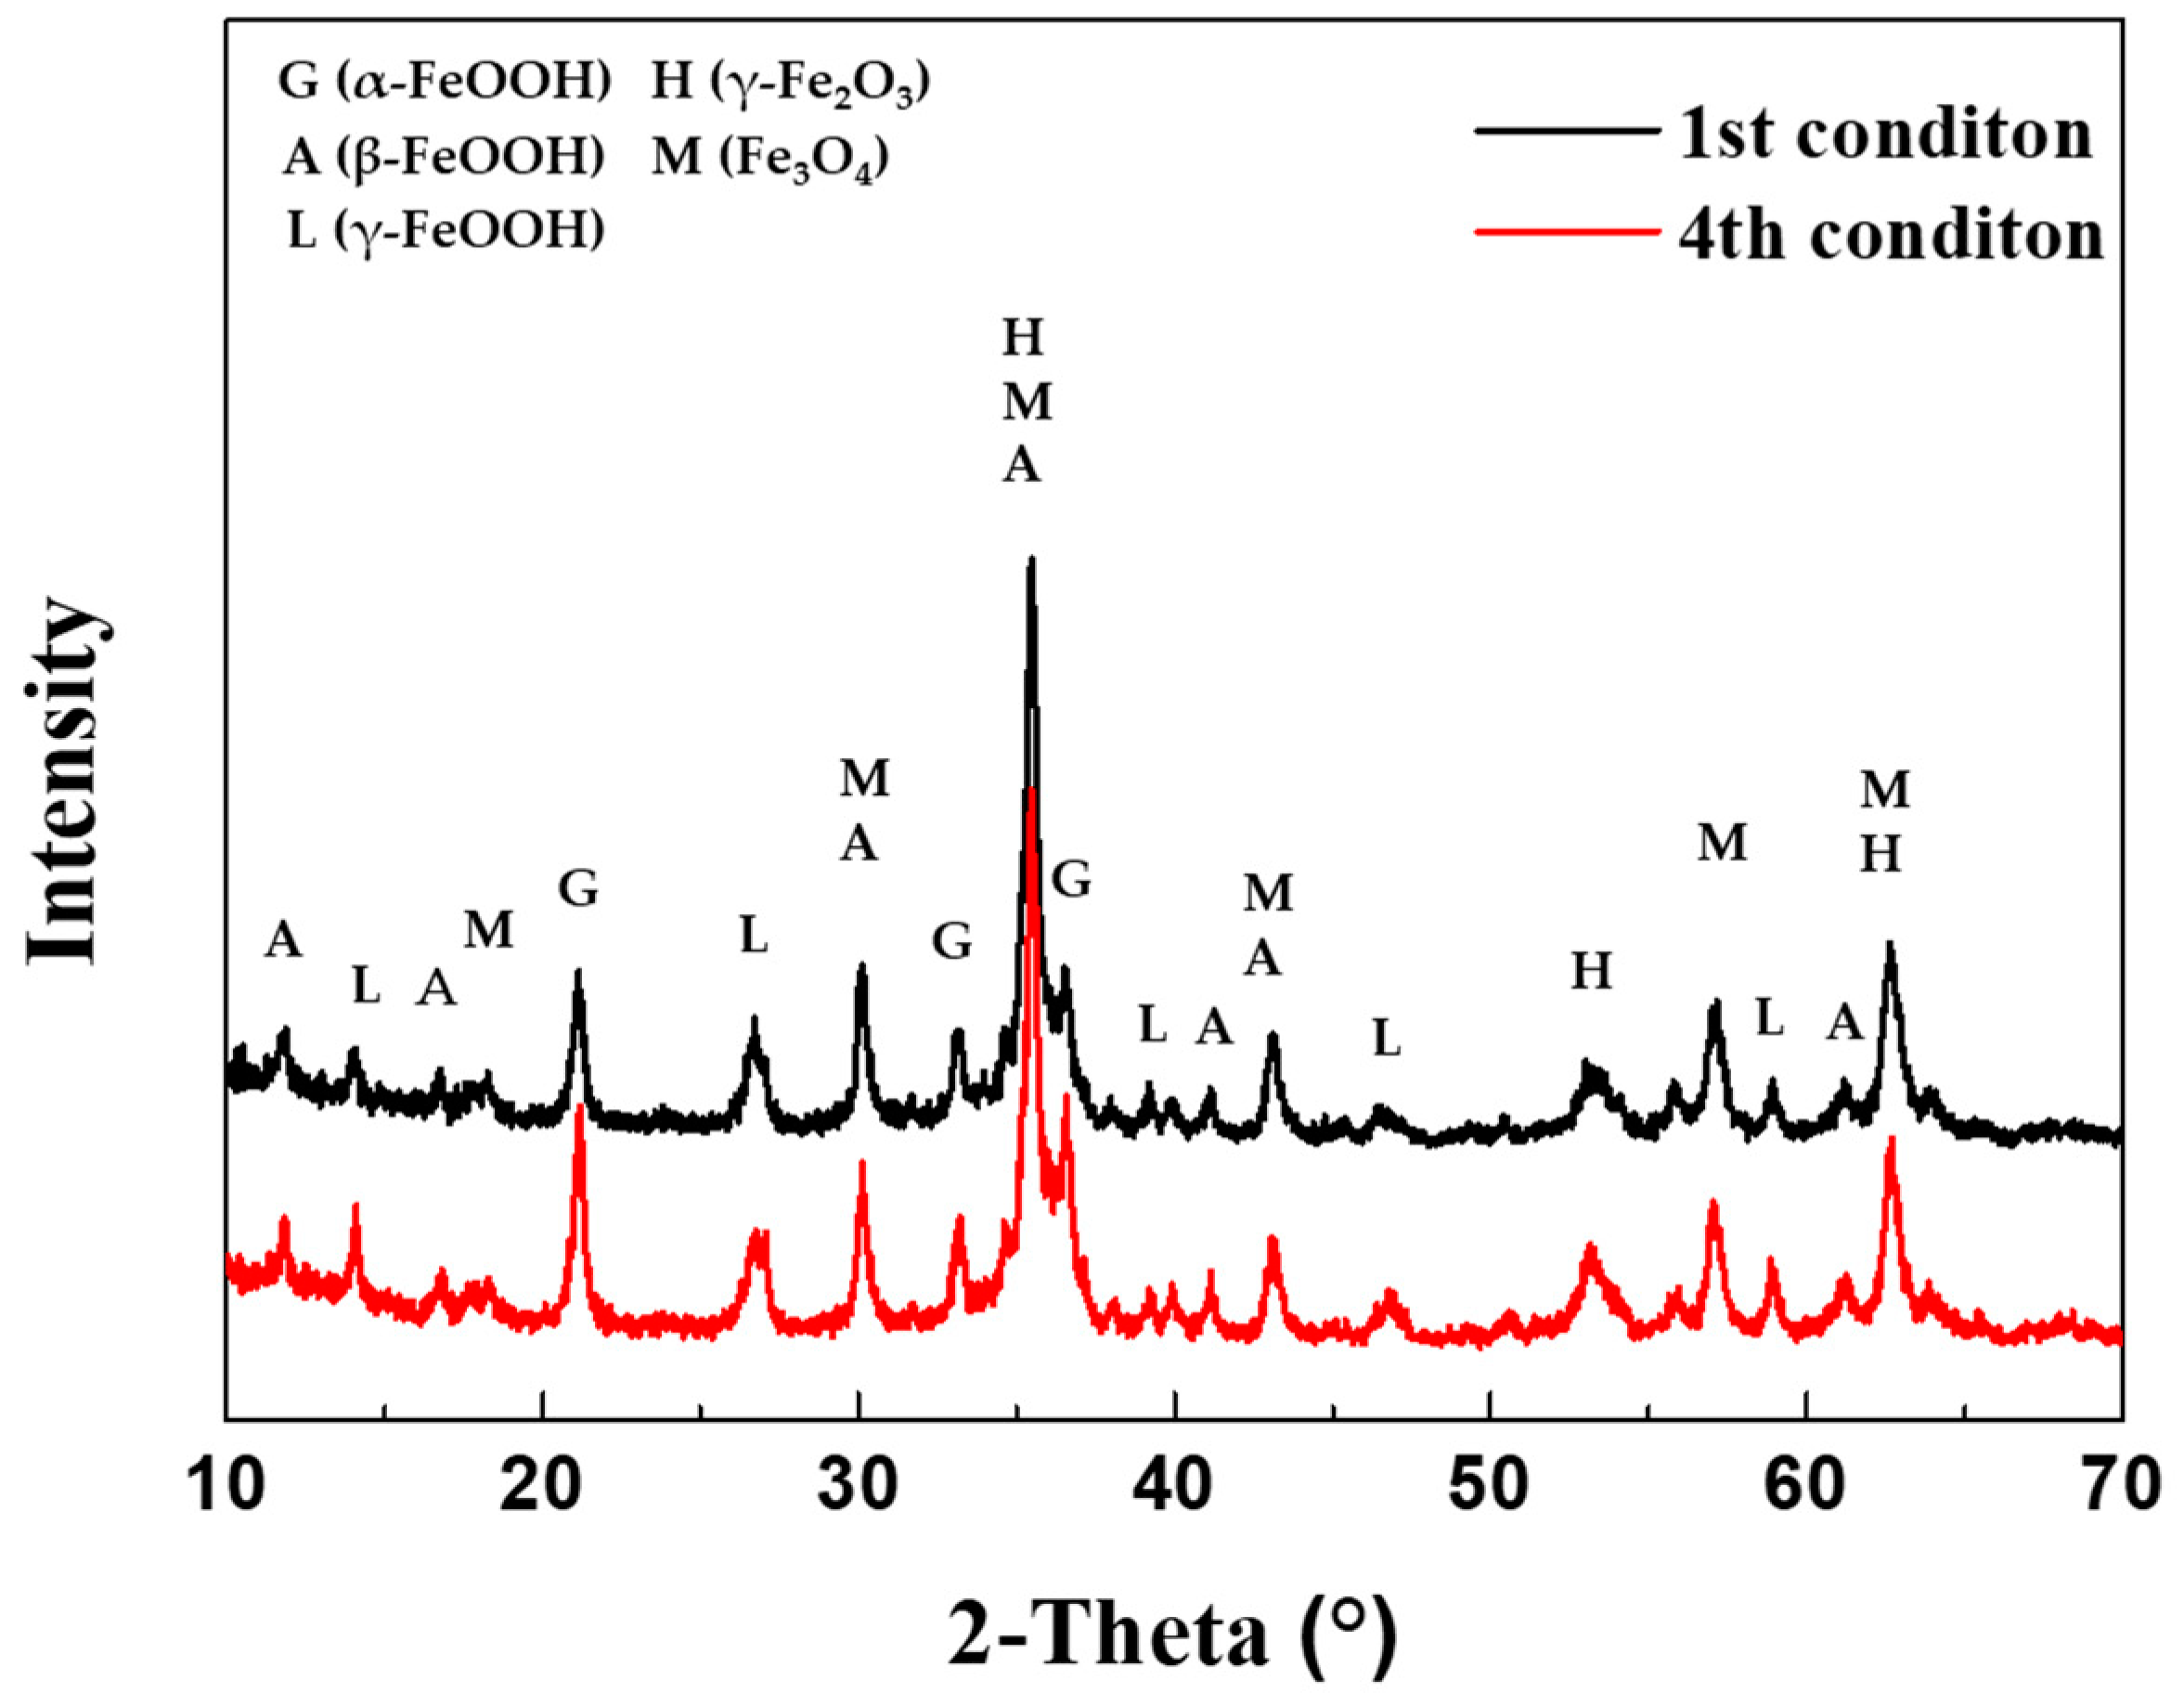
Figure 10.
EPMA analysis after CCT for 30 cycles of CP (a) 1st condition and (b) 4th condition.
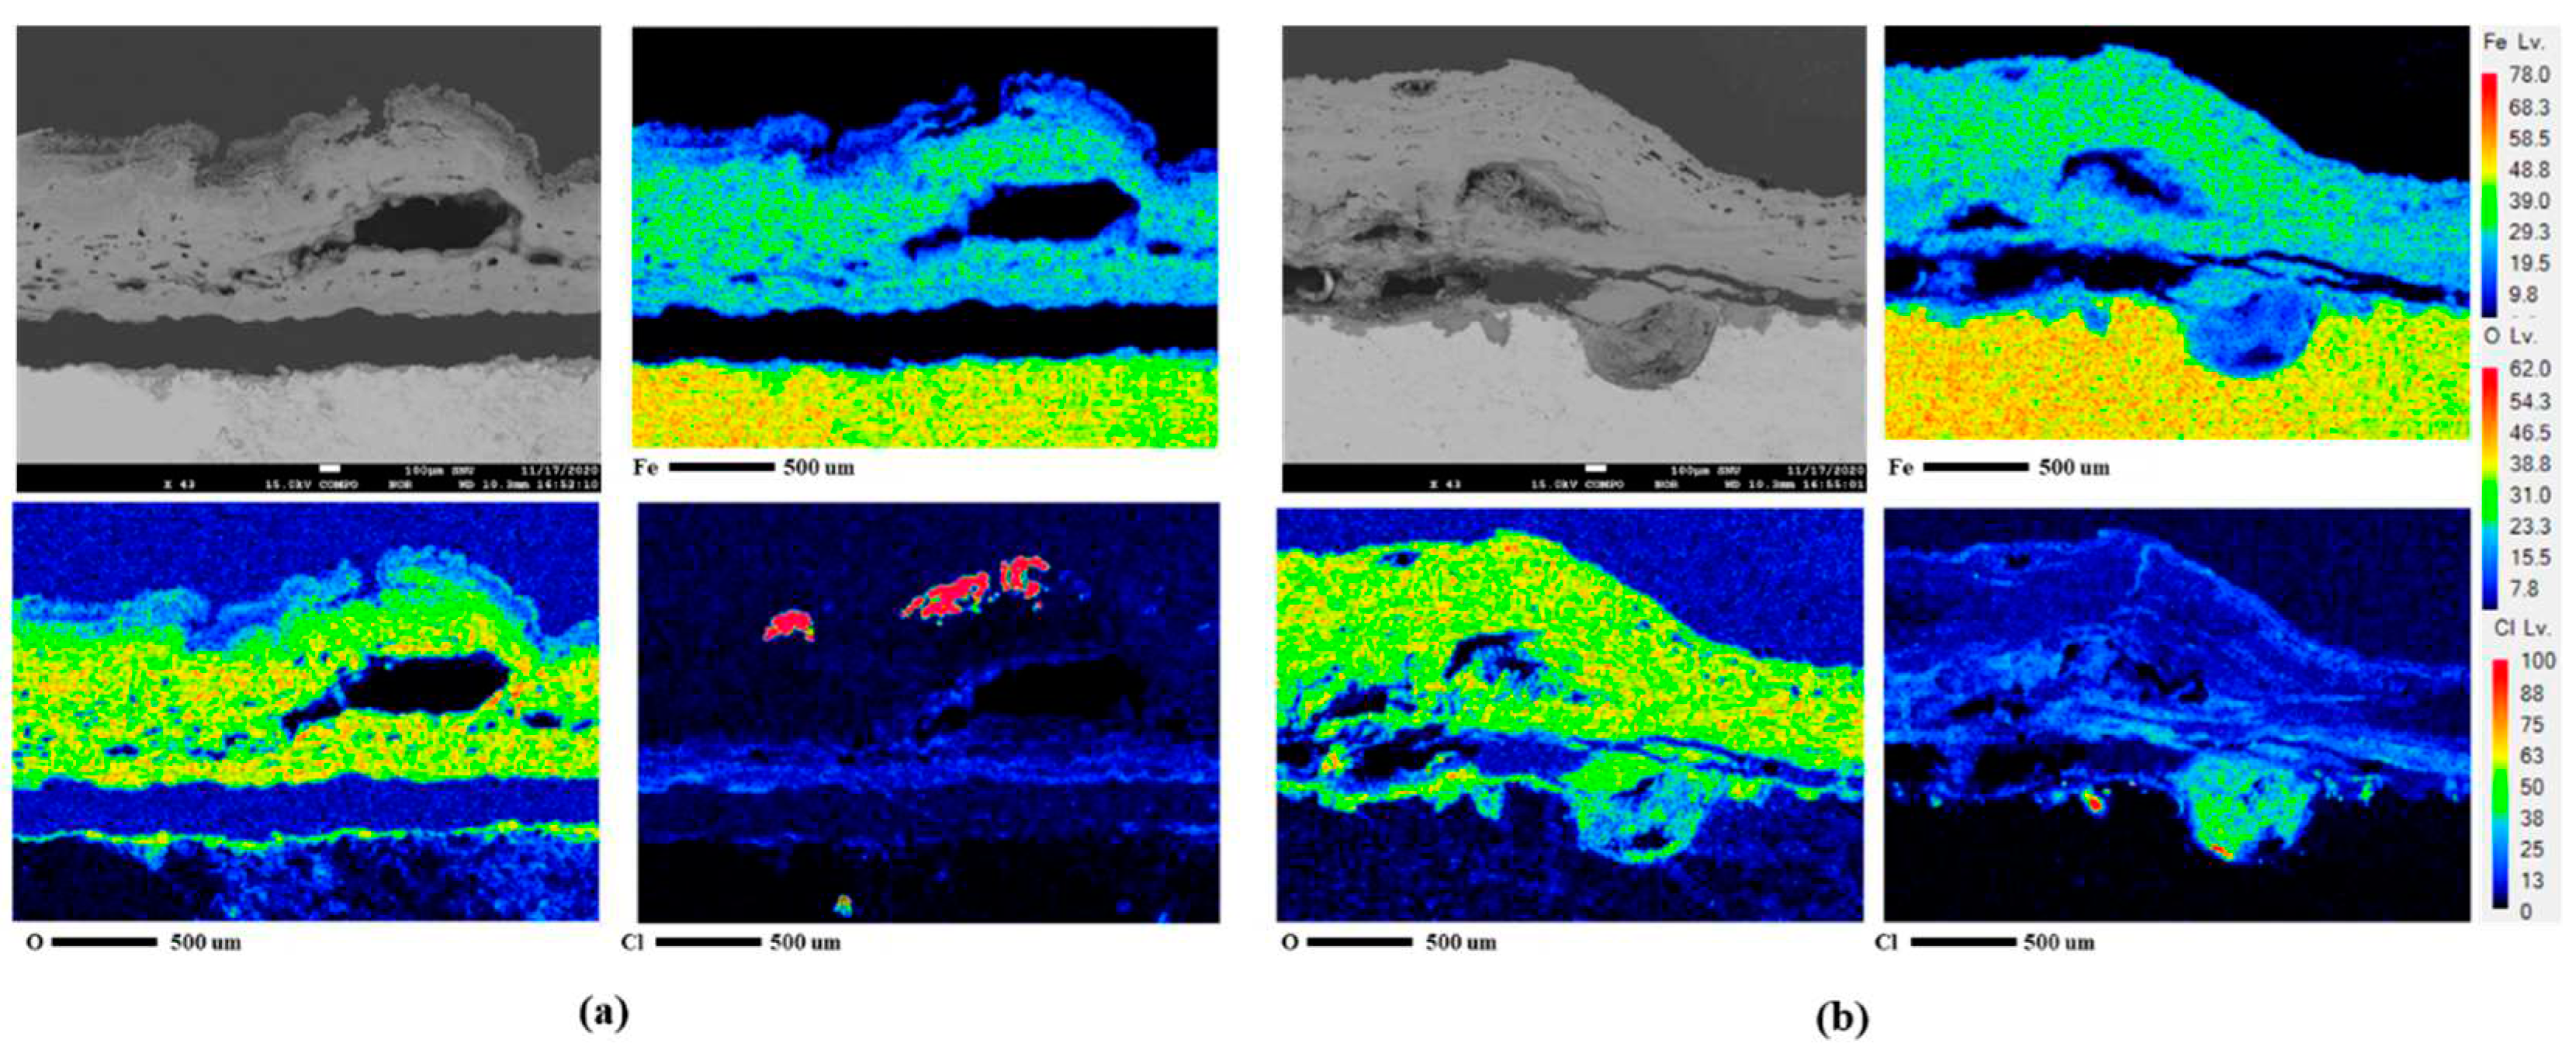
Figure 11.
Schematic diagram of the mechanism of localized corrosion of CP under CCT.
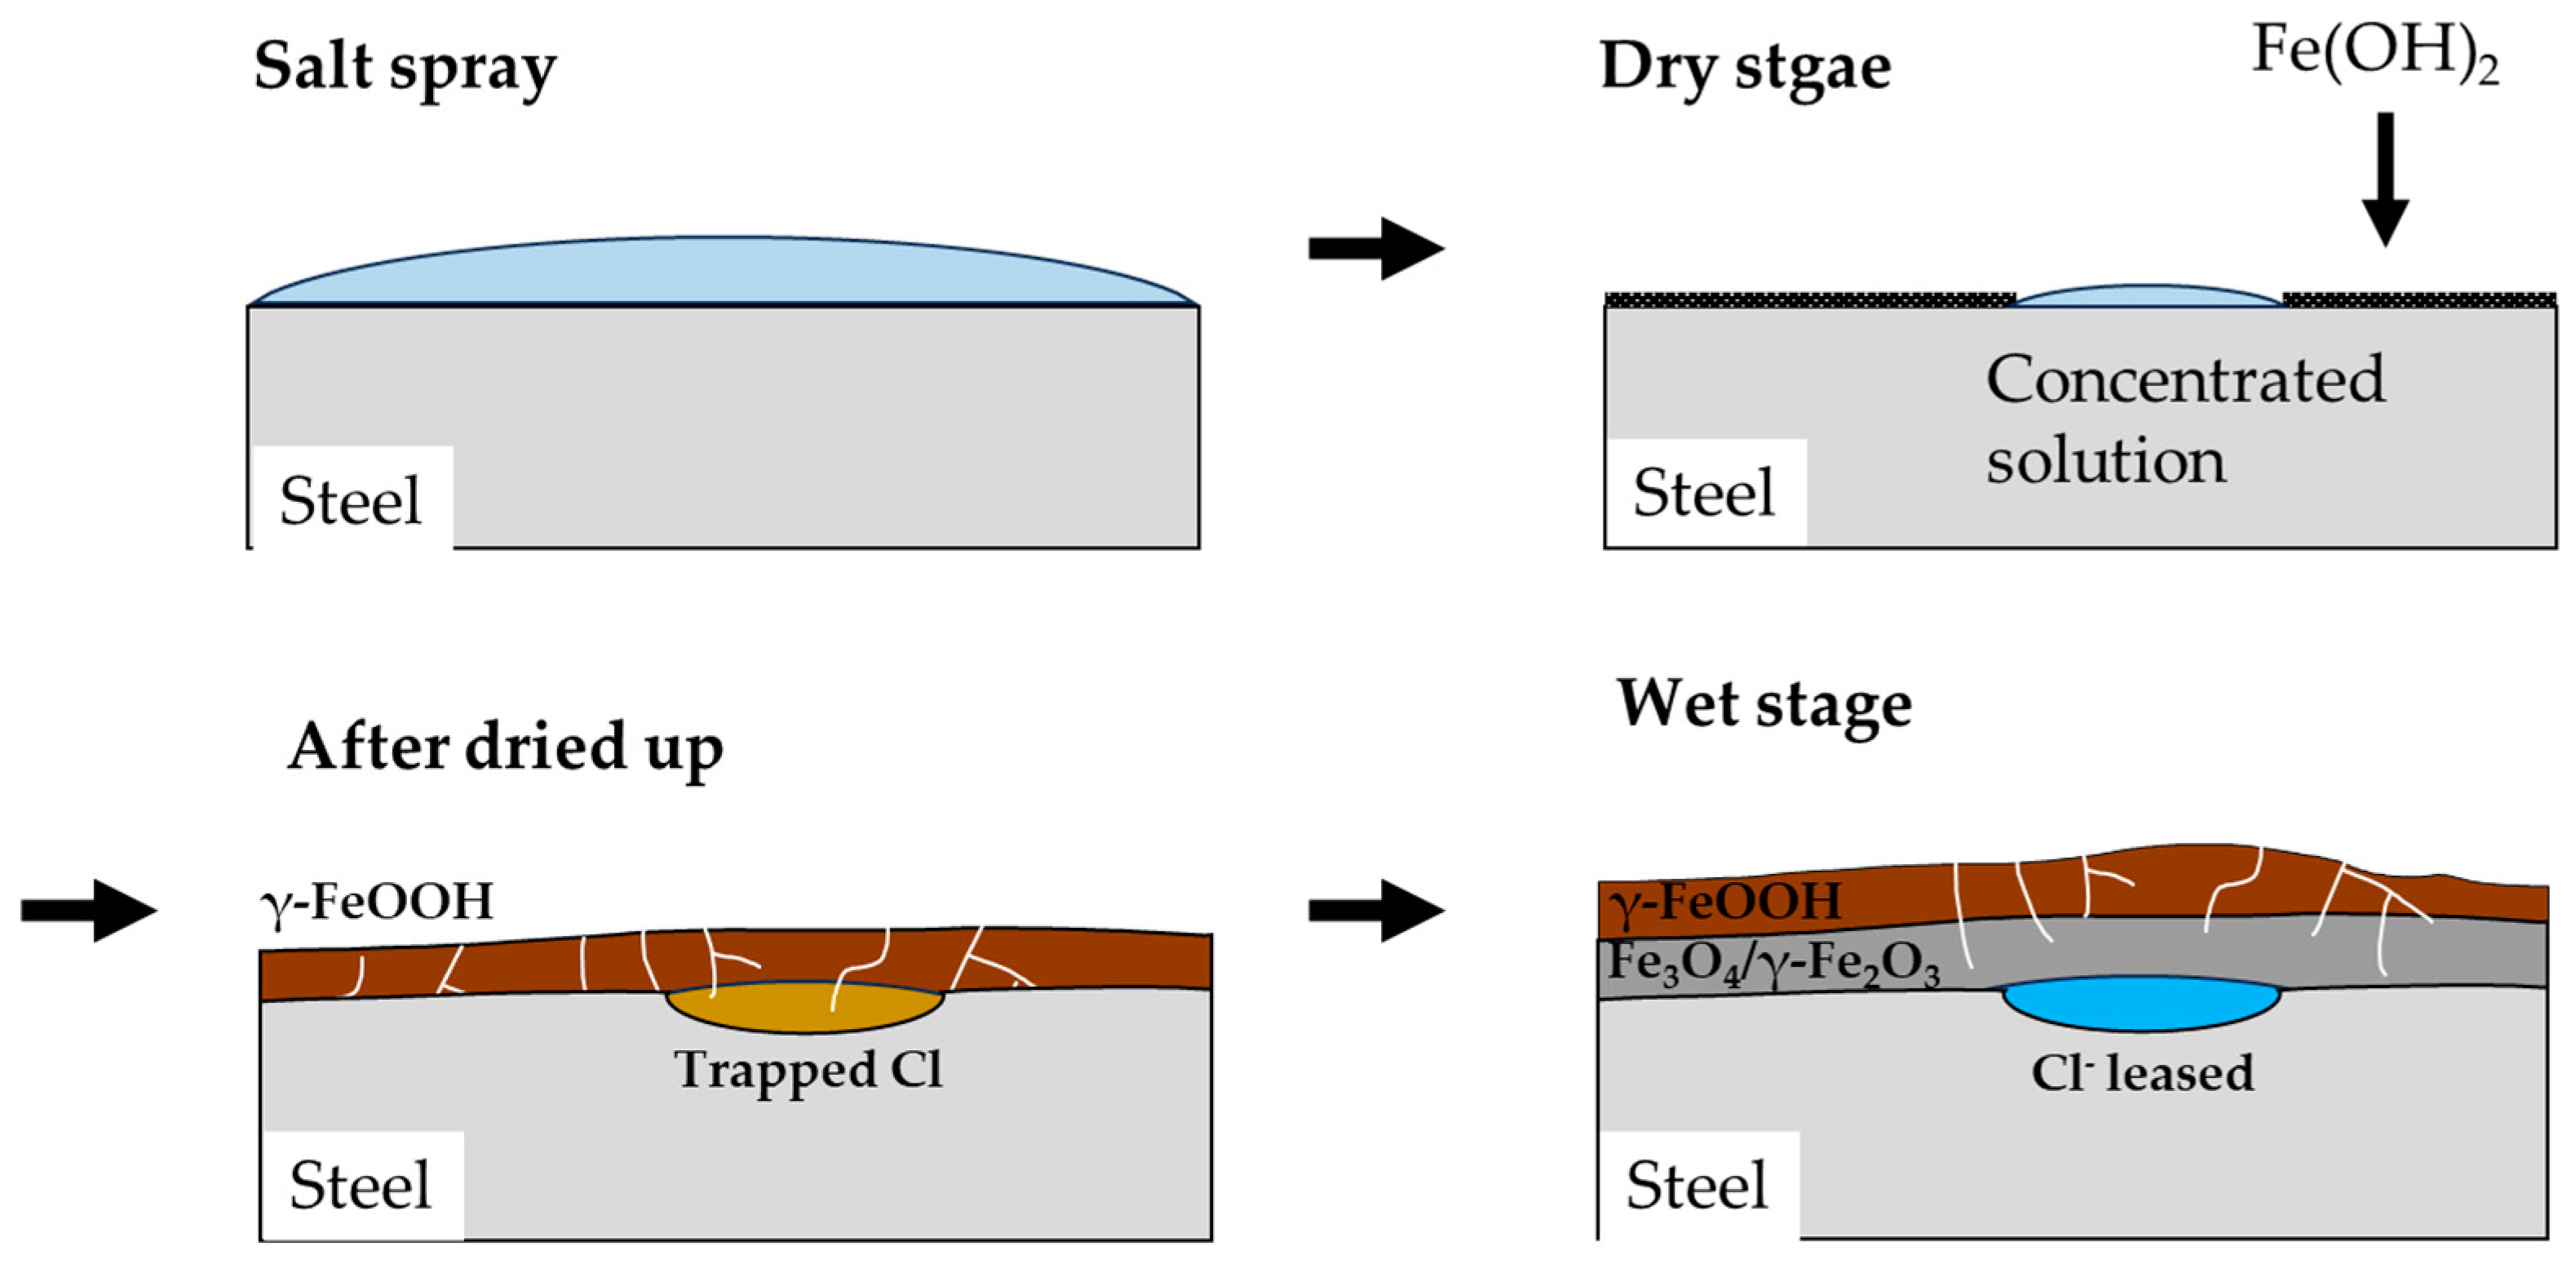
Figure 12.
Schematic diagram of corrosion behavior of 4th CCT condition in the later stages.
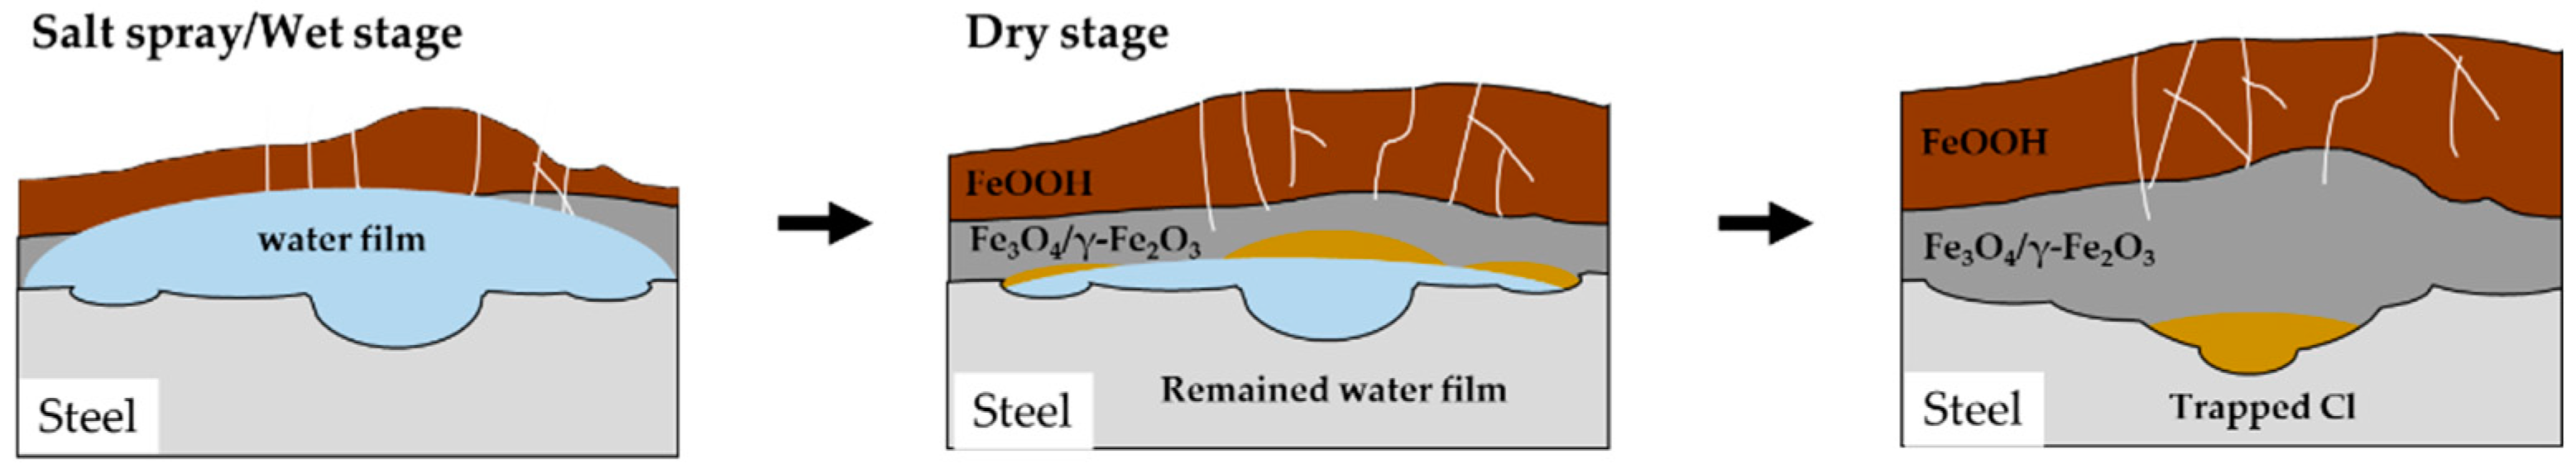

Table 1.
Concentration of main elements in the specimens (wt.%).
| Specimens | Composition (wt.%) | ||||||||
| C | Cr | Si | Mn | Ni | Al | Nb | Ti | Fe | |
| CP | 0.11-0.18 | - | 0.4-1.2 | 1.8-2.6 | 0.8-1.2 | 0.01-0.04 | 0.01-0.05 | 0.01-0.03 | Bal. |
Table 2.
CCT conditions of a single cycle conducted in this study.
| No. | Cycle flow | ||||||||||||||||||||||||||||||||||
| HH | 1 | 2 | 3 | 4 | 5 | 6 | 7 | 8 |
Feq. (/cycle) |
Ratio (/cycle) |
|||||||||||||||||||||||||
| MM | 15 | 30 | 45 | 60 | 15 | 30 | 45 | 60 | 15 | 30 | 45 | 60 | 15 | 30 | 45 | 60 | 15 | 30 | 45 | 60 | 15 | 30 | 45 | 60 | 15 | 30 | 45 | 60 | 15 | 30 | 45 | 60 | |||
| 1 | Satl spray | Ramp | Dry | Ramp | Wet | Ramp | 1 | 1 | |||||||||||||||||||||||||||
| 2 | Satl spray | Ramp | Dry | Ramp | Wet | Ramp | Dry | Ramp | Wet | Ramp | 2 | 1 | |||||||||||||||||||||||
| 3 | Satl spray | Ramp | Dry | Ramp | Wet | Ramp | Dry | Ramp | Wet | Ramp | 2 | 2 | |||||||||||||||||||||||
| 4 | Satl spray | Ramp | Dry | Ramp | Wet | Ramp | Dry | Ramp | Wet | Ramp | 2 | 3 | |||||||||||||||||||||||
Table 2.
Potentiodynamic polarization test results in 5 wt.% NaCl solution.
| Specimen |
Ecorr (VSCE) |
Icorr (A/cm2) |
βa (mVSCE/de.) |
βc (mVSCE/de.) |
| CP | -0.660 | 2.29·10-5 | 47.8 | 859.1 |
Table 3.
Parameters from EIS measurements.
| Specimen |
Rs (Ω*cm2) |
CPE 1 |
Rfilm (Ω*cm2) |
CPE 2 |
Rct (Ω*cm2) |
Rp (Ω*cm2) |
||
|
Qfilm (Fsn-1/cm2) |
n1 |
Qdl (Fsn-1/cm2) |
n2 | |||||
| CP | 4.06 | 3.20·10-4 | 0.86 | 10.23 | 2.31·10-4 | 0.85 | 994 | 1004 |
Table 4.
Regression coefficient of the corrosion data after CCT.
| Specimen | CCT condition |
Uniform corrosion [y (mg/cm2), x (cycle number)] |
Localized corrosion [y (μm), x (cycle number)] |
α1 (%) |
α2 (%) |
| CP | No.1 | y = 2.695 + 3.818 x, R2 = 99.3% | y = -2 + 12.87 x, R2 = 100.0% | - | - |
| No.2 | y = 2.132 + 4.024 x, R2 = 99.6% | y = 2.167+ 15.7 x, R2 = 100.0% | 5.4 | 22.0 | |
| No.3 | y = 3.272 + 4.31 x, R2 = 99.2% | y = -1.167+ 18.9 x, R2 = 100.0% | 12.9 | 46.9 | |
| No.4 | y = 0.2117 + 4.99 x, R2 = 100.0% | y = 2.667 + 20.53 x, R2 = 100.0% | 30.7 | 59.5 |
Disclaimer/Publisher’s Note: The statements, opinions and data contained in all publications are solely those of the individual author(s) and contributor(s) and not of MDPI and/or the editor(s). MDPI and/or the editor(s) disclaim responsibility for any injury to people or property resulting from any ideas, methods, instructions or products referred to in the content. |
© 2023 by the authors. Licensee MDPI, Basel, Switzerland. This article is an open access article distributed under the terms and conditions of the Creative Commons Attribution (CC BY) license (http://creativecommons.org/licenses/by/4.0/).
Copyright: This open access article is published under a Creative Commons CC BY 4.0 license, which permit the free download, distribution, and reuse, provided that the author and preprint are cited in any reuse.


