Submitted:
30 October 2023
Posted:
02 November 2023
You are already at the latest version
Abstract
Buildings are subject to intrinsic and extrinsic failures at all stages of the construction process, i.e., design to occupancy (i.e., use) as several failure types can affect them. There are three basic steps for researching building failures: listing, cataloging, and solving/deciding whether highlighting the least invasive and lowest cost intervention. Therefore, this research presents some methods used in construction for the intervention prioritization and seeks to illustrate the most suitable methodology for different settings failure x diagnosis x intervention. Therefore, the most traditional tools are shown: BASICO, SWIFT, FEMEA, AAF, and GUT matrix, where a critical assessment of the strengths and weaknesses is carried out. After that, a case study on maintenance services for the moisture on the building facades was performed. Finally, the GUT matrix and the FMEA method are the best results
Keywords:
maintenance management
; failure
; life cycle
1. Introduction
The building materials and components degradation in their life cycle is a well-known and non-controversial topic. Several authors [1,2,3] attribute this degradation to the effects of natural aging and/or natural and/or anthropogenic events. Therefore, it is necessary to define the building conservation state through qualitative and quantitative procedures and methods to assist in the identification, the extent of the damage, and the development of strategies for intervention [4,5,6,7].
After qualitative and quantitative analysis, maintenance services are planned to address the most critical areas, ensuring compliance with user safety, habitability, and sustainability, according to Brazilian standardization [8,9,10].
Nonetheless, a critical factor significantly influences the buildings’s life cycle – the enduring solutions, although more costly upfront, prove to be the most advantageous over the entirety of the structure’s lifecycle. [11,12]
The negligence maintenance added to a maintenance program's importance of being operated in a manner aimed at achieving goals and objectives [13]. Although the facilities management concept has been applied in Europe and the USA since the 1980s, it was only with the creation of the Brazilian Facilities Association in 2004. It should be noted that occurrences related to building failures often cause numerous inconveniences for users and professionals that consequences interfering with other installed systems.
Given the above, the creation of a maintenance management plan containing actions of detective, predictive, preventive, and corrective types (see Table 1), covering new and old systems.
The lists some possible factors that cause building deterioration: natural (resulting from climatic and biological agents), design error, building process influence, low maintenance services, being that failures resulting from one or more factors cause the loss of the building's functionality and compromises its cycle life [15].
Given that effective building maintenance is essential for maintaining both the structural integrity and visual appeal of a building over its entire lifespan, the owner or administrator bears the responsibility of supervising all activities related to materials and components. Consequently, establishing clearly defined building maintenance strategies becomes paramount
Maintenance management tools play a pivotal role in facilitating effective building system operation to meet user requirements and prolong the building’s life cycle. These contemporary management technologies empower sustainable maintenance practices and enable the anticipation of potential failures, thereby facilitating the timely execution of scheduled maintenance activities [16,17].
The methods practiced in other areas can be implemented within building maintenance procedures such as strategic maps, management performance indicators such as BSC (Balanced Score Card) and KPI (Key Performance Indicators); services such as SLA (Service Level Management) and practices such as PDCA (Plan, Do, Check and Control) [13].
The inspection procedure for a building can be defined as a check-up of the building, aiming at the functionality and durability of the project through a precise and careful diagnosis of all facilities to identify all pathological manifestations for future measures [18]. It is an important tool of engineering, see Figure 1.
The intervention “time” aspect directly interferes with the operations costs which have higher potential maximized in occupied structures, causing mobilizations, equipment downtime, performance production loss performance, and others [19].
Motivation and Contribution of the Work
Neglecting building maintenance and underestimating the importance of operating maintenance programs with well-defined goals and objectives can have profound repercussions on building life cycle, user safety, habitability, and sustainability because building failures can lead to numerous inconveniences for both users and professionals, causing disruptions in other integrated systems. The main contribution can be summarized as follows:
- (i)
- Management tools: system analysis methods including failures assessment and management that contributed to a prioritization services repair, i.e., the compilation of principals’ management methods to be employed in building maintenance. Moreover, the multi-criteria method is capable of being adjusted for any failure in buildings, making it possible to define the most appropriate tool to be used in each case study to extend the useful life of buildings and contribute to social, environmental, and economic aspects inserted in the sustainable development concept.
- (ii)
- Management impact: Reduced impact on planned building maintenance cost [12] with more efficient planning, enabling more strategic maintenance service cost planning because of integration analysis methods.
- (iii)
- Evaluation and testing: This work contributes to a simplified procedure. The methodological strategy introduces an easy and adaptable approach to the most appropriate management tool for each case since it is an important tool for planning services for which to validate the proposed approach in a specific case study about moisture façade.
To illustrate this study, i.e., the choice of the best management tool, the results of the research developed by [7] are presented in “Methods”, where the building moisture façade was mapped. This is very important research [20,21,22,23,24] because moisture reason different levels of deterioration in building materials and components, compromising its life cycle and consequently increasing maintenance costs.
Therefore, the moisture facade of a building was qualified and quantified according to the proposed methodology in 2 stages [7], as follows:
Stage 1 - Moisture facade qualification: the Autodesk AutoCAD (computational tool) was used to represent the study area (graphic representation of the facade), and then a thermographic camera was used to detect the presence of moisture on the façade in building materials. Finally, the thermograms overlapped on the project (design) of the facade and the different types of moisture were identified, such as accidental (resulting, for example, from failures in the piping systems), percolation (due to rainwater that allows access through cracks, others holes), upward (presence of water in the soil), among others.
Stage 2 – Moisture facade quantification: In this step, the area affected by each type of moisture building's facade was calculated and, finally, the GUT matrix was used to develop the strategy for repairing the anomalies.
The proposed methodology provided an easy approach to qualify and quantify moisture on the facade, as well as develop an intervention strategy (through the GUT matrix) which is important for planning repair services as it considers the causes of damage. However, others tools can be used, which can often generate doubts among professionals [21].
Management tools were developed to optimize the use of resources and reduce errors, prioritizing product/service quality, and user satisfaction, and ensuring project effectiveness. The GUT matrix stands out for not requiring formal training and is applied to solve quality-related problems [21].
However, as presented in this work, several tools can be used. Therefore, this paper aims to carry out a critical analysis of the tools applicable in prioritizing the intervention of building failures, that is, in maintenance services, presenting the definition of the methods: BASICO, SWIFT, FMEA, AAF, and GUT, their respective advantages and disadvantages. Therefore, highlighting the research is the analysis of some of the methods for prioritizing maintenance service procedures. Defined which is most suitable to assist future services to be carried out in favor of the design durability.
2. Materials and Methods
2.1. Materials
Once the project's failures have been carried out, identifying the causes of the pathological manifestations, it is important to assess their scope and the damage extent, including asymptomatic focus that has not yet been identified. The tool's significance makes it possible to measure the degree of risk, after the tendency loss, medium, and high development [25]. The tools presented in this work come from the Production Management Theory that undergo small adaptations, so that they can be successfully used in diagnostic engineering. In this sense, some tools that are to be used in the maintenance building services are briefly presented below.
2.1.1. BASIC Matrix
- (i)
- Benefits (B) for the organization, in this case, the enterprise under study.
- (ii)
- Results scope (R) to be achieved.
- (iii)
- Satisfaction (S) of employees directly involved in the process.
- (iv)
- Investment (I), i.e., the means for implementation.
- (v)
- Customer (C)represents the impact that improvements will provide to them.
- (vi)
- Execution (E), i.e., how the procedure will be carried out with physical, social, legal, and technical difficulties.
The scoring criteria for this tool are shown in Table 2. The matrix stage is based on the sum of the advantages offered to each procedure. Finally, the results are a list with decreasing order of sum. This method requires a specific requirement for the procedure, and it needs professional expertise. Furthermore, intervention criteria, such as risk and urgency, are removed from the analysis.
2.1.2.“. What/If” Structured Technique – SWIFT
This tool consists of meetings to discuss questions on the proposed topics. Therefore, the team has higher technical-administrative knowledge about the subject for manner dynamics efficiency. Cause and consequence must be presented at the meeting. Finally, a list of risks that could occur in an action/omission of procedure is listened to. However, the technique showed possible risks but is unable to classify to gravity.
The SWIFT tool presents itself as a general, qualitative, and simple-to-execute analysis [28] with applicability in the design or pre-operational phase and aims to identify the risks, such as building failures. However, it is employees in the inspection planning step when the engineering team and/ or professionals develop alternatives for eliminating failure potential.
2.1.3. Failure Mode and Effect Analysis (FMEA)
This tool was developed by NASA in 1963, during the APOLLO mission to analyze the possible failure modes in a product or process and determine the effects of each one on the system studied [29].
The technique consists of a deductive procedure [30]. It does not require complete calculations to elaborate a systematic and complete problem solution. It seeks to identify and rank critical failures in more detail, showing their potential risks and serving and the plan development to failures in products or processes.
2.1.4. Fault Tree Analysis (FTA)
The FTA tool is a failure analysis mode through a logical diagram [33,34]. It consists of identifying the top event or effect and, from there, all failures that, alone or together, may have contributed to appearance and, consequently, performance losses. The flowchart process used symbols such as the rectangle, the circle, and the logical operators AND and OR [33], see Figure 2.
2.1.5. GUT Matrix (Gravity, Urgency and Tendency)
The GUT prioritization matrix, as outlined by [7], provides a structured approach for problem identification, utilizing three key criteria: Gravity, Urgency, and Tendency, Gravity pertains to the severity of the potential damage, Urgency evaluates the timeframe within which undesirable outcomes might materialize if no intervention occurs; Tendency signifies the anticipated progression of a problem when left unattended. By multiplying these criteria (G x U x T), the GUT calculation offers a means to determine the highest or lowest priority for a given demand [35]. Importantly, this tool complements other strategies and is closely linked to the PDCA cycle (Plan, Do, Check, and Act) [36], see Figure 3.
Each of the indicators, representing various failure types), is evaluated on a scale of 1 to 5 across three characteristics: Gravity, Urgency, and Tendency, as detailed in Table 3. It is important to note that the observed correlation between the origins of these anomalies and their respective scores aligns with previous research [7,37], highlighting the connection between material performance and durability shortcomings.
GUT matrix limitation is a quantitative priority assessment [37]. Additionally, similar to other methods, the analysis is frequently conducted subjectively, without the assistance of an indicator table, leading to the potential for inaccuracies in the results assessment. This highlights a persistent issue regarding the inadequacy of attention directed toward maintenance routines.

Table 3.
The GUT scoring method for failure 1.
| Amount | Gravity | Urgency | Tendency |
|---|---|---|---|
| Result | Deadline | Progress | |
| 5 | Strongly | Priority | Strongly |
| 4 | High | Important | High |
| 3 | Severe | Urgent | Full |
| 2 | Low | Low | Little |
| 1 | No | No | No |
Table 4 presents the main advantages and disadvantages of each method described previously.
2.2. Methods
The managerial or operational process can quickly evolve into a complex question with many variants and limiting factors, including time, financial limitations, and technical expertise. In the face of anomalies and positive attributes alike, diagnostic professionals encounter constraints that prompt them to seek transparent and objective criteria for prioritizing essential interventions.
The multi-criteria method has a list of characteristics that weigh to be assigned to topics. Therefore The indicators (elements) combination creates a values "mosaic" for a better ordering of the tasks that will need to be carried out in advance [38]. This methodology could estimate the project life cycle due to anomalies. However, it can be adapted for each case [7].
Hence, when it comes to repairing and preserving building services, these actions can be considered as the parameters set by errors in design quality, material selection, or management tool particularities. In the case study presented below, the procedure will be used to define the best management tool considering the specific case. It is possible to adapt to other situations.
In this research, the process was suitable for evaluating management tools, see Table 5 and Equation (1). This precedent aims to create a relationship between which prioritization tool should be used given the evaluation indicators of each tool.
Being: is the estimated all indicators management tool.
A, B, C, D, E, F, G the indicator, see Table 5.
3. Results and Analysis. Case Study
Research on building facades involves extensive research of the impermeability of building materials, with the ultimate goal of formulating efficient maintenance and repair strategies. Moisture is very common in buildings and can lead to a spectrum of deterioration issues, ultimately diminishing the life cycle of structures [39,40,41,42]. However, detecting and assessing moisture presents a complex challenge.
In this context, infrared thermography emerges as a valuable tool for both qualitative and quantitative evaluation of moisture levels on building facades, as demonstrated in previous research [7]. This case study underscores the importance of defining the most suitable management tool for addressing these moisture-related concerns.
Delfim Moreira School, see Figure 4, stands as a testament to Brazil’s architectural heritage during the late 19th and early 20th centuries, Situated in Juiz de Fora city, Minas Gerais, this historic building serves as a vivid reminder of the past. The mansion's main façade exudes an elegant symmetry, characterized by three distinct panels flanked by prominent pilasters topped with Corinthian capitals. These panels are seamlessly interwoven with a rhythmic sequence of elongated spans, with the parapet windows taking center stage. However, these windows have seen better days, now appearing weathered and worn [7].
On the ground floor of the façade, the windows boast lintels and superlintels in a graceful arched design, framed in wood. The wooden sills, slightly protruding outward, add a touch of character. The windows are further adorned with a delicate frame that gracefully surrounds the entire perimeter, seamlessly integrating with the masonry for a polished finish.
When it comes to preserving this architectural gem, the primary challenge lies in dealing with the pervasive issue of moisture. The passage of time has exposed these venerable structures to numerous cycles of wetting and drying, significantly impacting the integrity of their materials. To safeguard this historical treasure, meticulous attention must be paid not only to investigative processes but also to the material's response to these environmental factors.
One of the primary determinants impacting the preservation of this building is the ever-present challenge of moisture infiltration. Addressing this issue necessitates careful consideration of investigative processes, as well as a thorough understanding of how various building materials interact with moisture, as outlined in [7].
Figure 5 and Figure 6 show the mapping of damage caused by moisture [7] obtained using a thermographic camera where a strategic methodology was used with the computational tools (i.e., Autodesk Autocad and MatLab). This procedure allowed us to define the moisture on the building's facade as well as classify it as follows:
Accidental moisture (AM): arises from issues within the piping systems, including rainwater, resulting in infiltrations.
Building moisture (BM): refers to the moisture trapped within the materials building during construction.
Percolation moisture (PM): is marked by the infiltration of external moisture into internal spaces, often through small cracks.
Upward moisture (UM): involves the presence of water rising from the ground.
Figure 5 illustrates a more pronounced occurrence of percolation moisture, while Figure 6 highlights the prevalence of upward moisture. Accidental moisture intrusion can be attributed to flaws in the rainwater collection system on the roof, whereas building moisture is a consequence of construction errors related to the expansion of the structure. These issues can be traced back to inadequate design and construction of the joints connecting different sections of the building.
The research detailed in [7], systematically categorized the interventions (refer to Table 6), taking into account the nature of the moisture problem and its potential to compromise the building’s life cycle and overall durability. This comprehensive approach was instrumental in the development of rehabilitation procedures.
Table 7 presents the analysis that listed and qualified the management tools in this moisture failure research, according to the proposed in Table 5. It is verifying the GUT matrix and FMEA is most appropriate. It should be noted that the evaluation was conducted individually so that the analysis of the factors of one of the methods did not influence the other competing method. The study also confirmed that methods with similar implementation routines tend to have similar scores. It can also be confirmed that the methods with lower scores about the criteria have more qualitative characteristics than quantitative ones or do not have an interface that allows them to be rewritten in numerical form.
Considering the proposed management maintenance services tool and based on the results presented in Table 7, an analysis of the FMEA tool is shown in Table 8.
Analyzing Table 8 it can see that there is a divergence in the database provided by the GUT matrix. It is possible to see that the professional qualification will have a strong influence on the results, making database analysis difficult. If the operator has little professional experience in anomaly diagnosis in buildings, it will compromise the intervention management, time, and cost of maintenance services.
In the case of the GUT matrix, it enables systematization and database collection to facilitate a potential problem, more clearly identifying possible harms under three dimensions: gravity, urgency, and tendency. It is easier and better to organize the database, i.e., it indicates the greater or lesser priority of the problem about others.
Finally, it is highlighted that the crucial value of this work is to strengthen the multidisciplinary professionals' work, to provide the survey phase (diagnosis), the database preparation, and the analysis phase to get an efficient study and achieve better results.
4. Conclusions
This work made it possible to approach different risk prioritization methods, making it possible to analyze them using different criteria, both qualitative and quantitative. Therefore, it was possible to observe that the methods depend on the situation and context, not to mention the expertise of the professionals who must possess the training and experience required for thorough, precise, and informed decision-making. The importance of using a supporting methodology at one’s disposal to aid in selecting the most suitable approach for a given intervention.
Furthermore, considering that most inspections are conducted visually, professionals who prioritize stringent criteria should not disregard the utility of tools like GUT or FMEA, as they encompass the necessary features for making precise interventions in the context of moisture-related issues, as illustrated in our case. However, they should choose a tool that provides an easy solution to the proposed problems, especially for maintenance services, as is the case with the GUT matrix.
It is also worth recommending that a qualitative analysis tool be used concomitantly, such as the Fault Tree Analysis, which complements the diagnosis process by mapping out the sequence of actions that lead to anomalies. This approach allows for a more accurate determination of the root causes of the problem, resulting in more good work while potentially reducing financial, material, and costs, even though it may necessitate a more elaborate implementation process.
Buildings are complex design and come from a set of different electrical, sanitary, fire, and structural systems that require periodic maintenance so that they can maintain safety for those who live there. The lack of life cycle building can lead to the loss of human life in addition to serious financial losses to people. Fortunately, growing awareness of the importance of building maintenance services is contributing to a considerable reduction in accidents and damage to people and property.
Author Contributions
Conceptualization V.G., M.T.B., W.S., E.C., M.A.R., R.A., E.C.; Methodology V.G., M.T.B., W.S.; Formal Analysis V.G., M.T.B., W.S., E.C., M.A.R., R.A., E.C.; Writing- original Draft Preparation V.G., M.T.B., W.S., E.C., M.A.R., R.A., E.C., Writing-Review & Editing V.G., M.T.B., W.S.; Project Administration V.G., M.T.B; Funding Acquisition M.T.B.
Acknowledgments
The corresponding author wants to thank the National Council for Scientific and Technological Development – CNPq; Coordination of Superior Level Staff Improvement (CAPES); Federal University of Juiz de Fora (UFJF)
Conflicts of Interest
The authors declare that there is no conflict of interest.
References
- Morais, G.A.; Lordsleem, A.C., Jr. Building maintenance management activity in a public institution. Eng. Constr. Manag. 2019, 26, 85–109. [Google Scholar] [CrossRef]
- Pantoja, J.; Moura, S.; Varum, H.; Caied, S. The influence of weighting coefficient in the evaluation of the critical degree in multi-story buildings via inspection. Paranoá 2020, 26, 126–139. [Google Scholar] [CrossRef]
- Barbosa, M.T.; Innocencio, C.R.; Salzani, L.O.; Pereira, T.S.; Souza, N.L.; Oliveira, L.F. Lime-based mortars with added sílica fume and bioproducts for restoration and preservation of heritage buildings. J. Build. Pathol. Rehabil. 2023, 8, 37. [Google Scholar] [CrossRef]
- Lerma, C.; Mas, A.; Gil, E.; Vercher, J.; Peñalver, M. Pathology of building materials in historic buildings. Relationship between laboratory testing and infrared thermography. Mater. Constr. 2014, 64, 313. [Google Scholar] [CrossRef]
- Cabrera, V.; Vizcaíno, R.; Miguel, A. A functional structure for state functions of moisture transfer in heritage building elements. Journal of Building Engineering 2020, 29, 101201. [Google Scholar] [CrossRef]
- Moghtadernejad, S.; Chouinard, L.E.; Mirza, M.S. Design strategies using multi-criteria decision-making tools to enhance the performance of building façades. Journal of Building Engineering 2020, 30, 101274. [Google Scholar] [CrossRef]
- Barbosa, M.T.; Rosse, V.J.; Laurindo, N. Thermography evaluation strategy proposal due to moisture damage on building facades. Journal of Building Engineering 2021, 43, 102555. [Google Scholar] [CrossRef]
- Brazilian standard (ABNT). NBR 14037: a handbook of operation, use, and maintenance of buildings – content and recommendations for elaboration and presentation”. 2011.
- Brazilian standard (ABNT). NBR 5674: maintenance of buildings – procedure. 2012.
- Brazilian standard (ABNT). NBR 15575: housing buildings up to five floors – performance – part 1: general Building requirements. 2022.
- Lima, W, Jr. ; Sousa, P.F.; Silva, K.A.; Sá, V.R. Proposal of preventive and corrective building maintenance plan. Brazilian Journal of Development 2021, 7, 116614–116629. [Google Scholar] [CrossRef]
- Plebankiewicz, E.; Gracki, J. Analysis of the impact of input data on the planned costs of Building maintenance. Sustainability 2021, 12, 12220. [Google Scholar] [CrossRef]
- Silva, M.L.B. Facilities management tools applied to building maintenance management. Gestão e Gerenciamento. 2018, 9, 22–32. [Google Scholar]
- Kardec, A.; Nacif, J. Maintenance: strategic. Rio de Janeiro: Qualitymark. 2012. 440p.
- Ndubuisi, O.; Chukwujindu, K.; Kikanme, E. Investigation of factors responsible for the deterioration of building structures in tertiary institutions. GSG Adv. Res. Rev. 2021, 9, 64–72. [Google Scholar] [CrossRef]
- Abuimara, T.; Hobson, B.; Gunay, B.; O’Brien, W.; Kane, M. Current state and future challenges in building management: practitioner interviews and a literature review. Journal of Building Engineering. 2021, 41, 102803. [Google Scholar] [CrossRef]
- Villa, V.; Bruno, G.; Aliev, K.; Piantanida, P.; Corneli, A.; Antonelli, D. Machine learning framework for the sustainable maintenance of buildings facilities. Sustainability 2022, 14, 681. [Google Scholar] [CrossRef]
- Gomide, T.; Gulio, M.A.; Faggundes Neto, J.; Flora, S.M. Building inspection São Paulo: Oficina de Textos, 2019. 168p.
- Zarpelam, J.B.; Silva, M.P. Application of GUT matrix in prioritizing tasks in the financial sector of a beverage company. In: COBREPO. Proceedings….pp. 1–12, 2020.
- Dafico, L.; Barreira, E.; Almeida, R.; Vicente, R. Machine learning models applied to moisture assessment in building materials. Construction and Building Materials 2023, 405, 133330. [Google Scholar] [CrossRef]
- Santos, E.; Lima, T.; Gaspar, P. Optimization of the production management of an upholstery manufacturing process using lean tools: a case study. App. Sci. 2023, 13, 9974. [Google Scholar] [CrossRef]
- Cornaro, C.; Bovesecchi, G.; Calcerano, F.; Martinelli, L.; Gigliarelli, E. An HBIM Integrated Approach Using Non-Destructive Techniques (NDT) to Support Energy and Environmental Improvement of Built Heritage: The Case Study of Palazzo Maffei Borghese in Rome. Sustainability. 2023, 15, 11389. [Google Scholar] [CrossRef]
- Alfano, F.; Palella, B.; Riccio, G. Moisture in historical buildings from causes to the application of specific diagnostic methodologies. Journal of Cultural Heritage. 2023, 61, 150–159. [Google Scholar] [CrossRef]
- Ragab, K.; Orhan, M.; Saka, K.; Zurigat, Y. A Study and Assessment of the Status of Energy Efficiency and Conservation at School Buildings. Sustainability 2022, 14, 10625. [Google Scholar] [CrossRef]
- Grossi, M.V.F. Diagnose and metododology. In: Manual diagnose engineering. São Paulo: Leud, pp. 228– 238. 2021.
- Trindade, B.M.; Oliveira, N.C.; Santos, M. Application of the basic matrix as a tool to assist the manager in decision making in cases of hiring in the seasonal period. In: VII Symposium Production Engineering. Proceedings… 2020. [CrossRef]
- L P, Servare Jr. MW. Application of daily routine management in the purchasing sector in an import and export company. Brazilian Journal of Production Engineering. 2021, 7, 126–138. [Google Scholar] [CrossRef]
- Kaercher, A.R.; Luz, D.F. Risk management. Interciência. 2017.
- Rabelo, M.H.; Silva, E.K.; Peres, A.P. Failure mode and effect analysis for the evaluation of environmental impacts of animal slaughter. Engenharia Sanitaria e Ambiental 2014, 19, 79–86. [Google Scholar] [CrossRef]
- Matos, R.B.; Milan, M. Systemic application of the failure method evaluation analysis (FMEA) for the development of performance indices on small-size enterprises. Rev. Árvore 2009, 33, 977–985. [Google Scholar] [CrossRef]
- Souza Filho, A.F.; Nogueira, S.C.; Carvalho, F.N.; Luz, I. Analysis of the Effectiveness of Application of the FMEA Methodology in a Manufacturing Process for TV Receivers. Brazilian Journal of Development 2020, 6, 34541–34554. [Google Scholar] [CrossRef]
- Brand, F.A.; Dalmolin, C.; Travassos, X.L., Jr.; Pachekoski, W.M. Evaluation of FMEA methodology as a tool to reduce environmental impacts in the industrial maintenance process. Rev. Elet. em Gestão, Educação e Tecnologia Ambiental. 2013, 10, 2081–2090. [Google Scholar] [CrossRef]
- Lana, L.D.; Quadros, J.; Weise, A.; Reis, R.; Rosa, L.; Buligon, A. Risk assessment of work at height in construction. Production Online 2014, 14, 344–363. [Google Scholar] [CrossRef]
- Miranda, B.; Zancanella, A.; Maziero, R.; Castro, B.; Rubio, J. Analysis of a steam generator using the FMEA and FTA techniques. Matéria 2021, 26, 2021. [Google Scholar] [CrossRef]
- Kepner, C.; Tregoe, B. The new rational manager. Princeton Research Press, 1997.
- Isniah, S.; Purba, H.; Debora, F. Plan do check action (PDCA) method: literature review. J. Sistem dan Manajemen Industrial. 2020, 4, 72–81. [Google Scholar] [CrossRef]
- Teixeira, G.H.; Silva, J.R.; Alves, E. Evaluation of the pathological manifestations of the Rio Negro building in Anápolis-Goiás. ALCONPAT 2022, 12, 433–448. [Google Scholar] [CrossRef]
- Riantaphyllou, E. Multi-criteria decision-making methods. In: Multi- criteria decision making methods: A comparative study. Springer, Boston, MA, 2002. p. 5-21. [CrossRef]
- Shen, X.; Li, L.; Cui, W.; Feng, Y. Coupled heat and moisture transfer in building material with freezing and thawing process. Journal of Building Engineering. 2018, 20, 609–615. [Google Scholar] [CrossRef]
- Vitiello, V.; Castelluccio, R.; Merino, M. Experimental research to evaluate the percentage change of thermal and mechanical performances of bricks in historical buildings due to moisture. Construction and Building Materials 2020, 224, 118107. [Google Scholar] [CrossRef]
- Lerma, C.; Mas, A.; Gil, E.; Vercher, J.; Peñalver, M. Pathology of building materials in historic buildings. Relationship between laboratory testing and infrared thermography. Materiales de Construccion 2014, 64, 313. [Google Scholar] [CrossRef]
- Bauer, E.; Pavón, E.; Barreira, E.; Castro, E. Analysis of building façade defects using infrared thermography: Laboratory studies. Journal of Building Engineering 2016, 6, 93–104. [Google Scholar] [CrossRef]
Figure 1.
Engineering diagnostic organization.
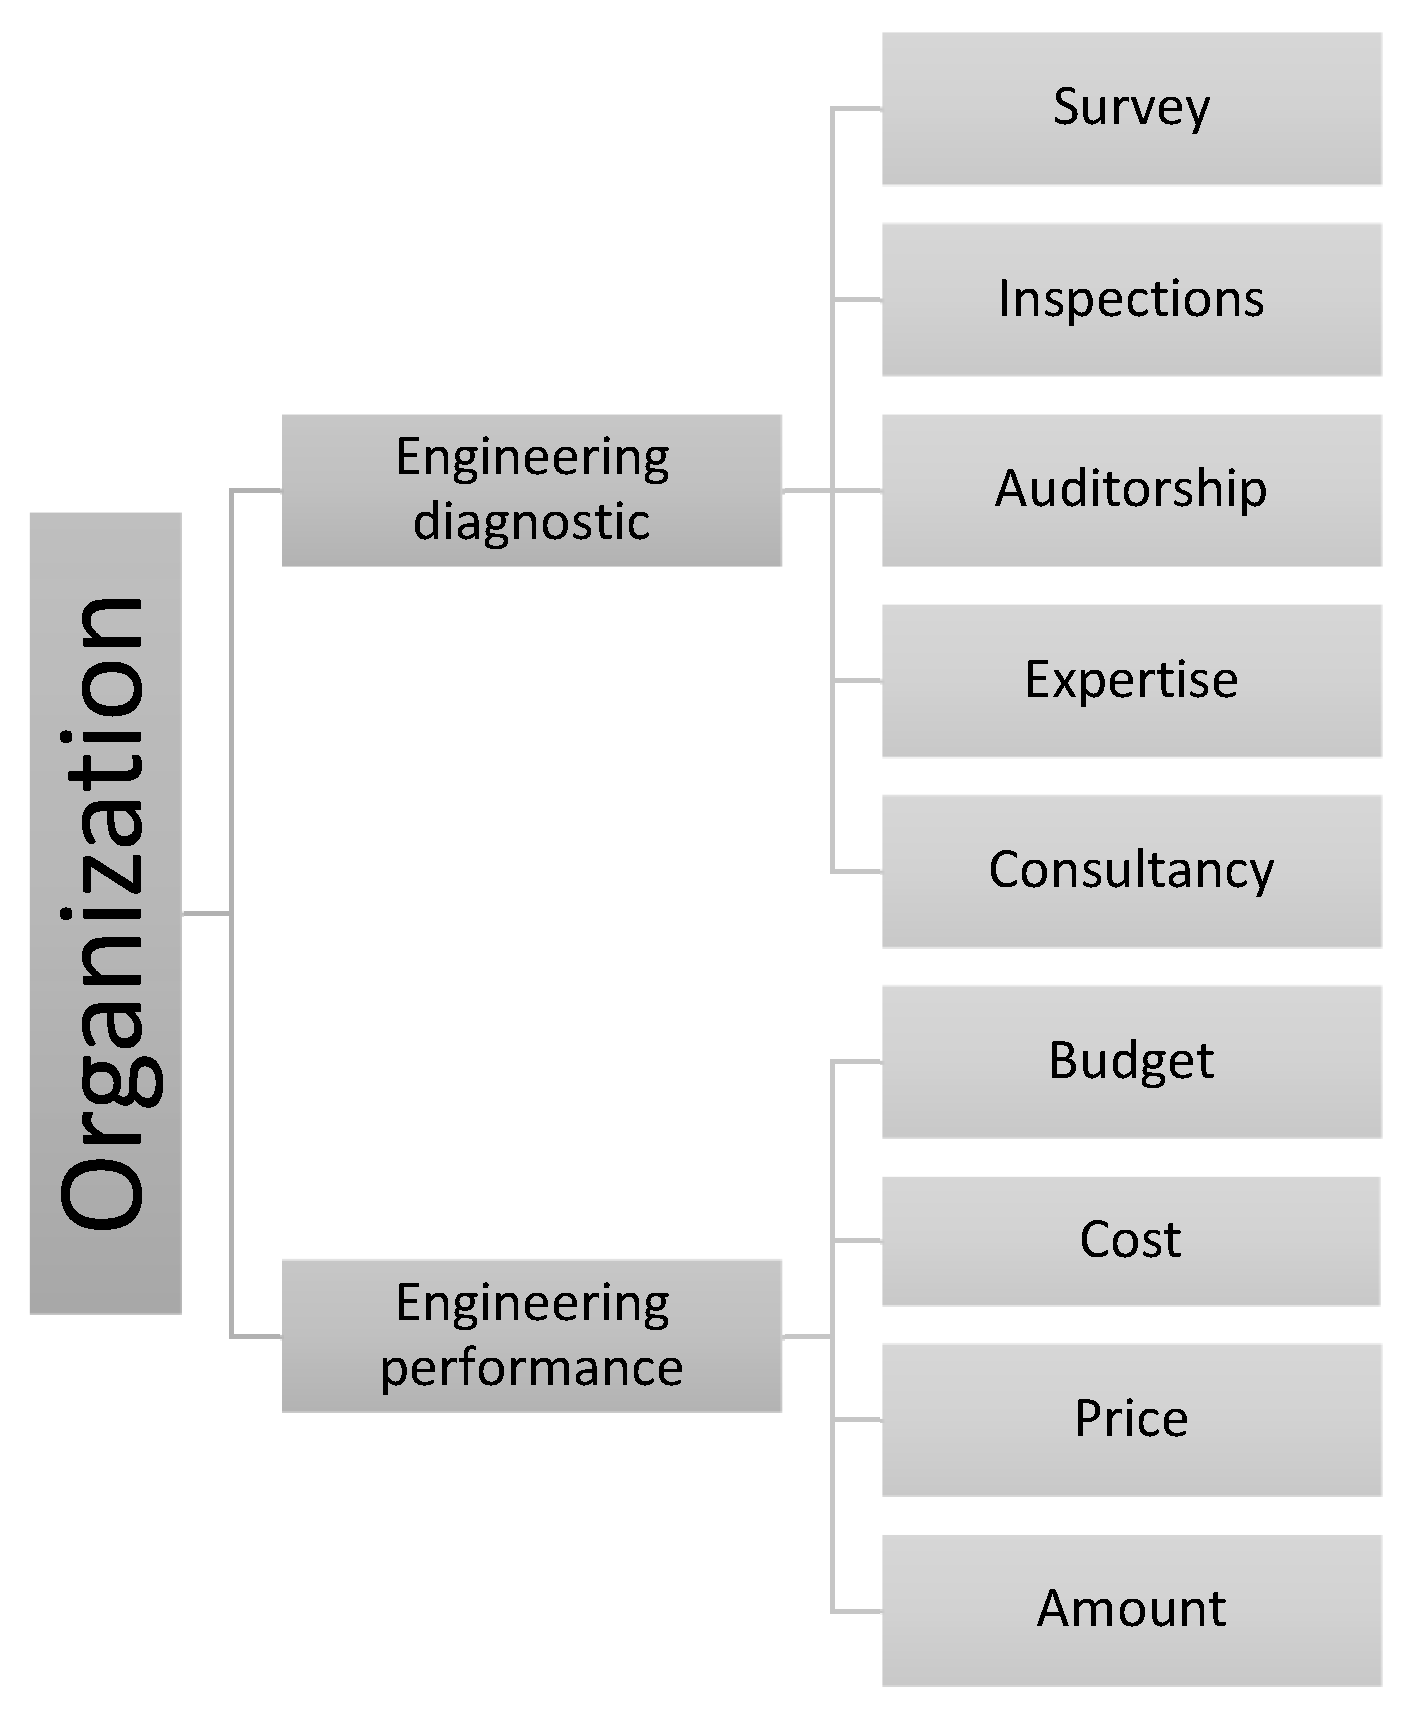
Figure 2.
FTA for structural rupture.
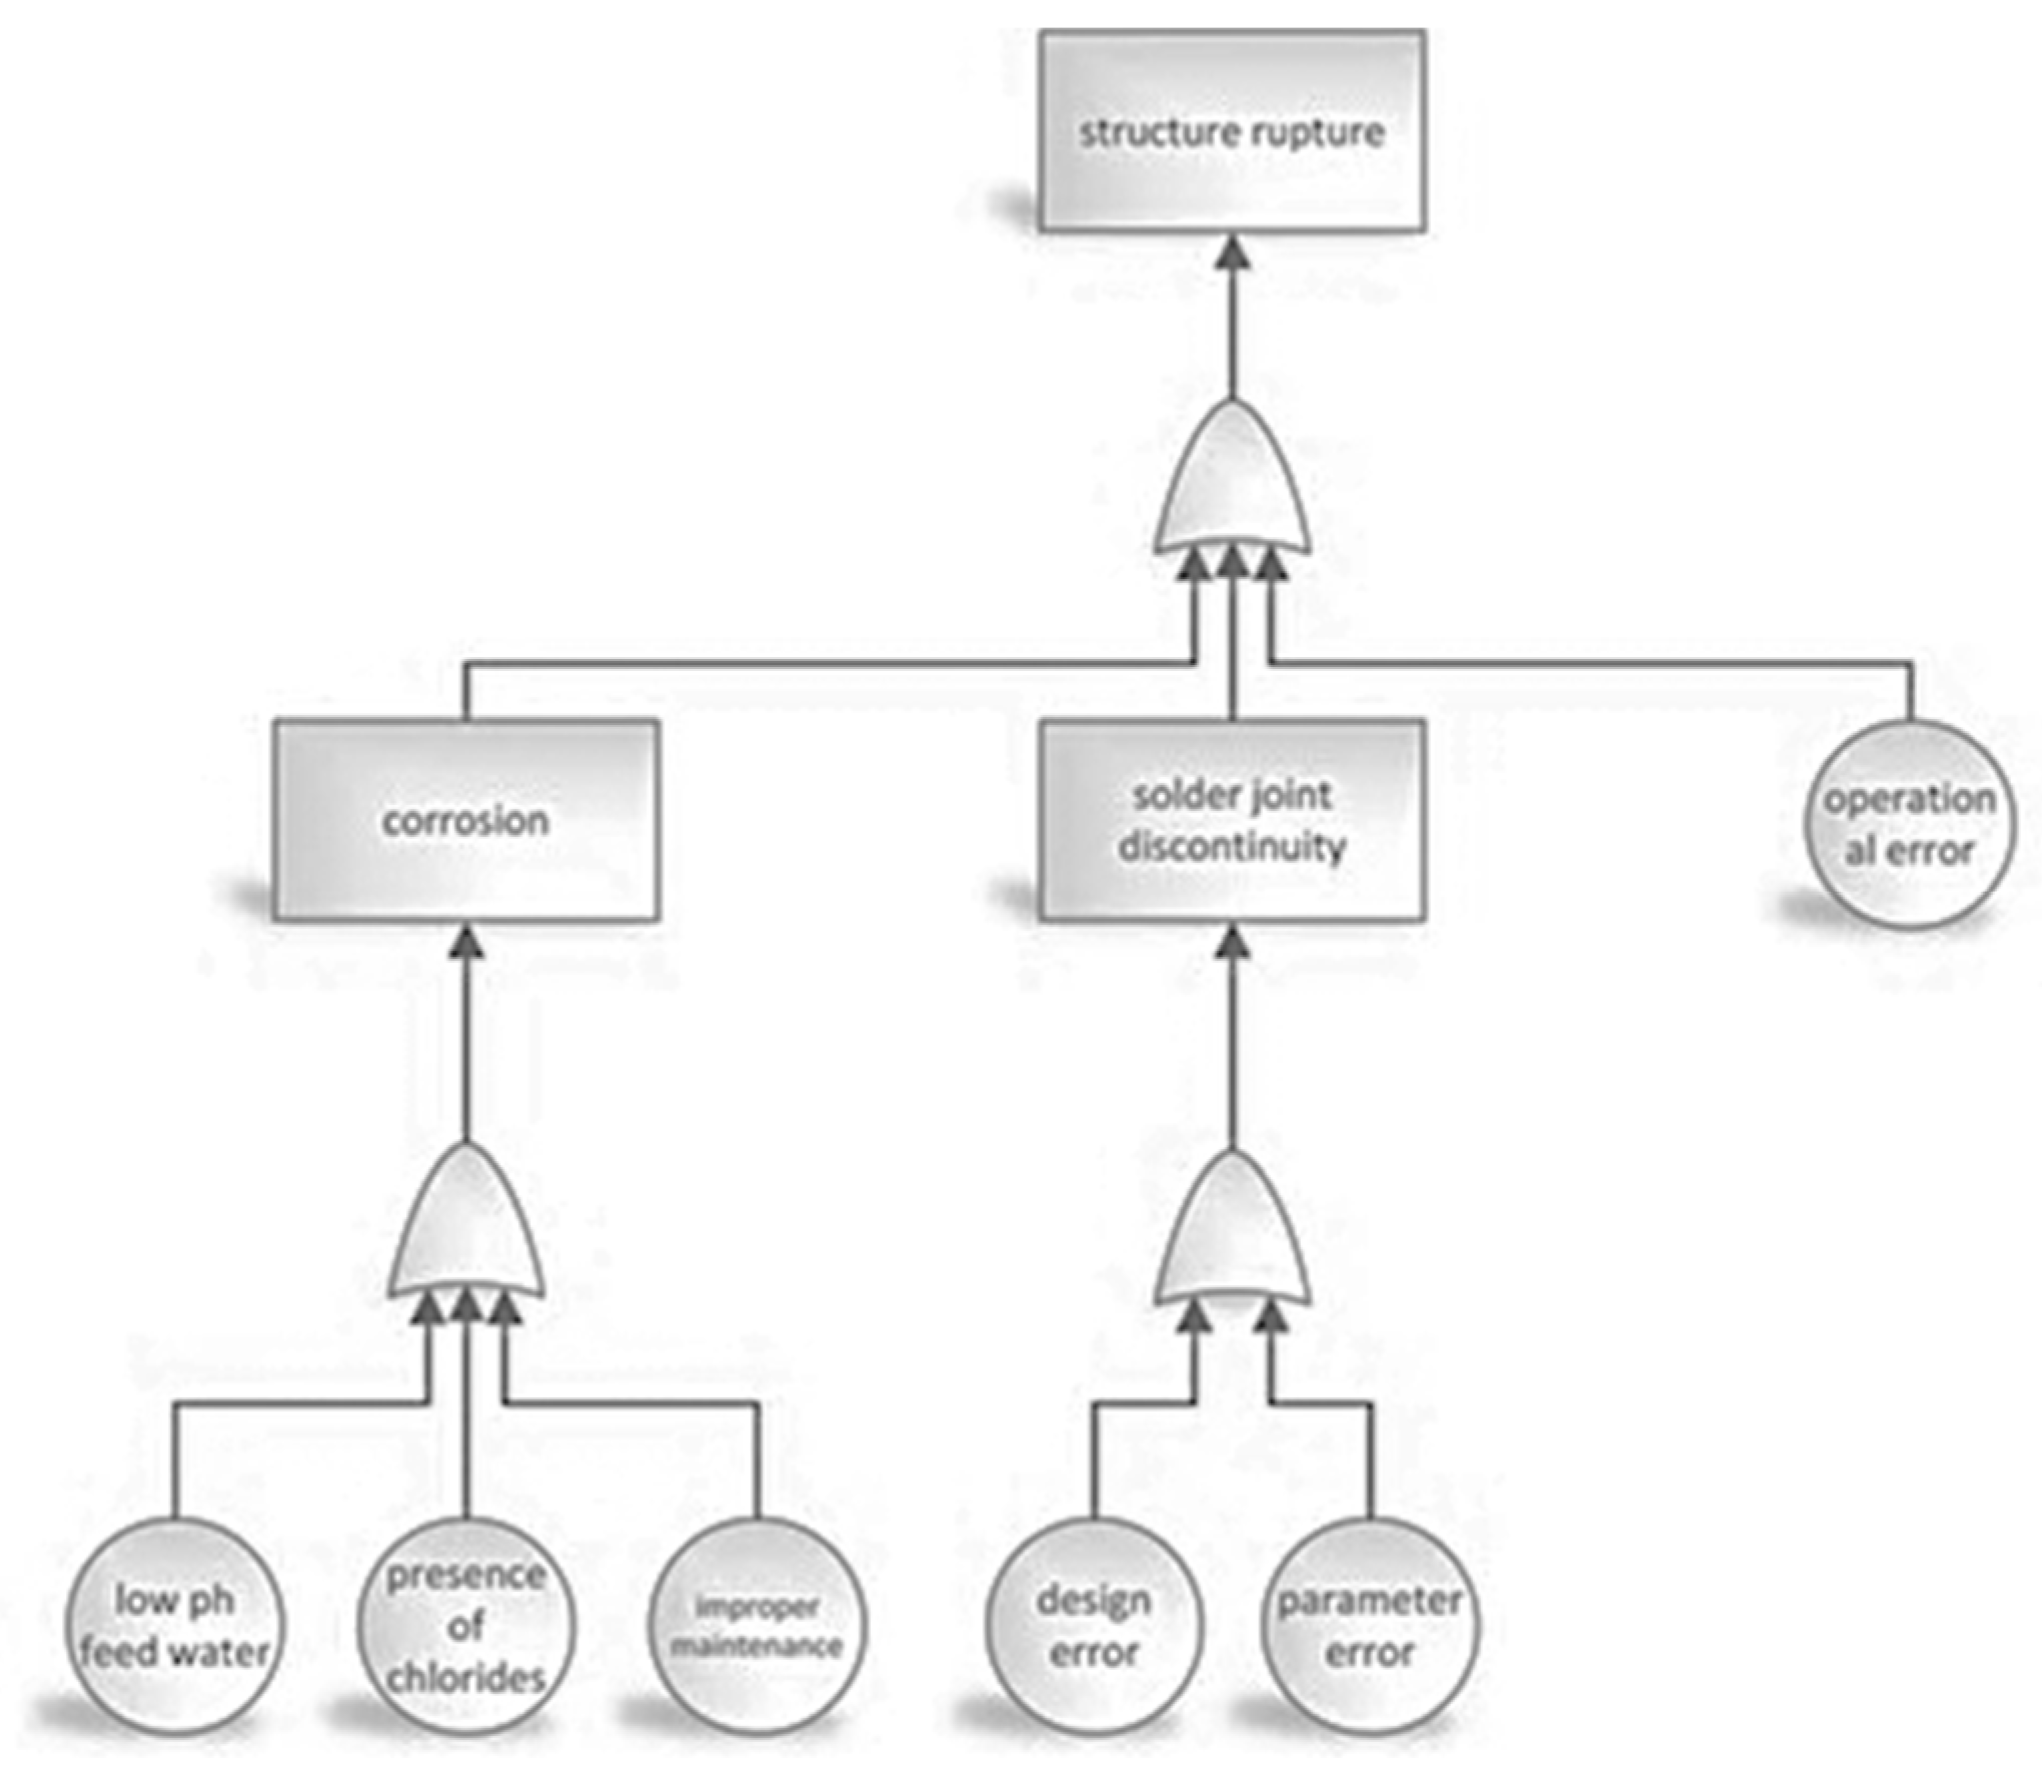
Figure 3.
PDCA tool.
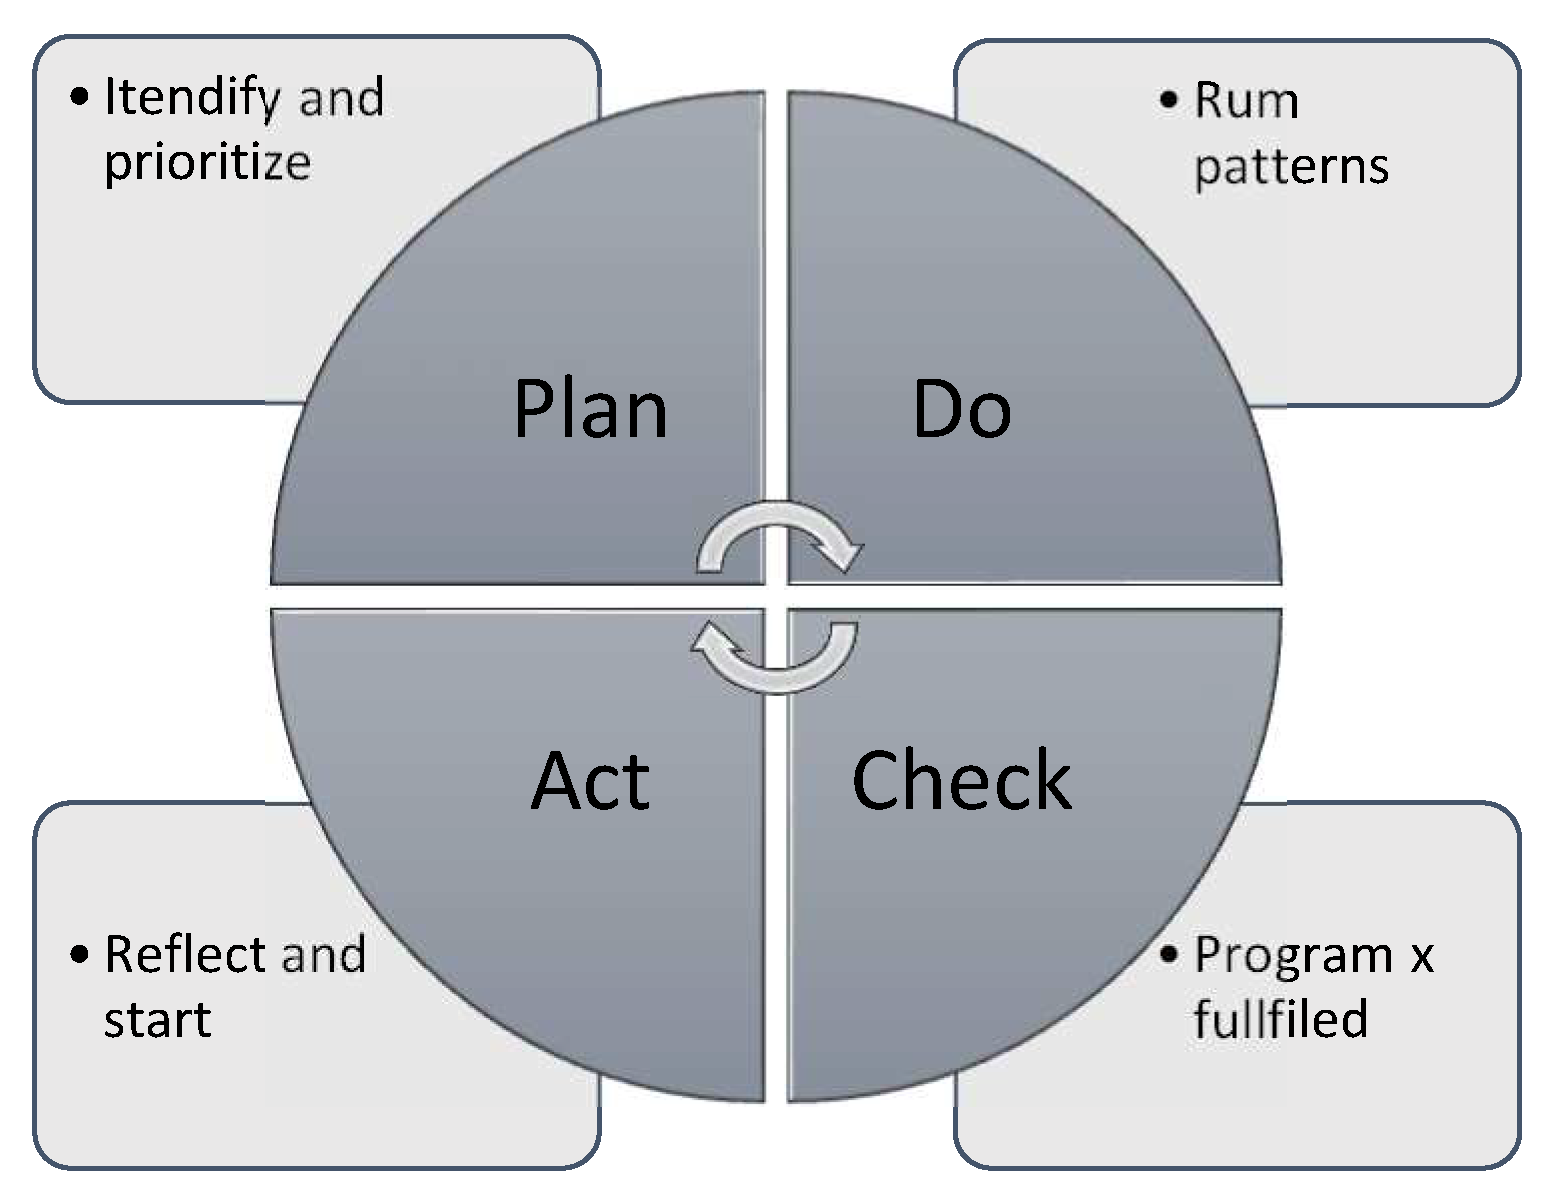
Figure 4.
Delfim Moreira School.
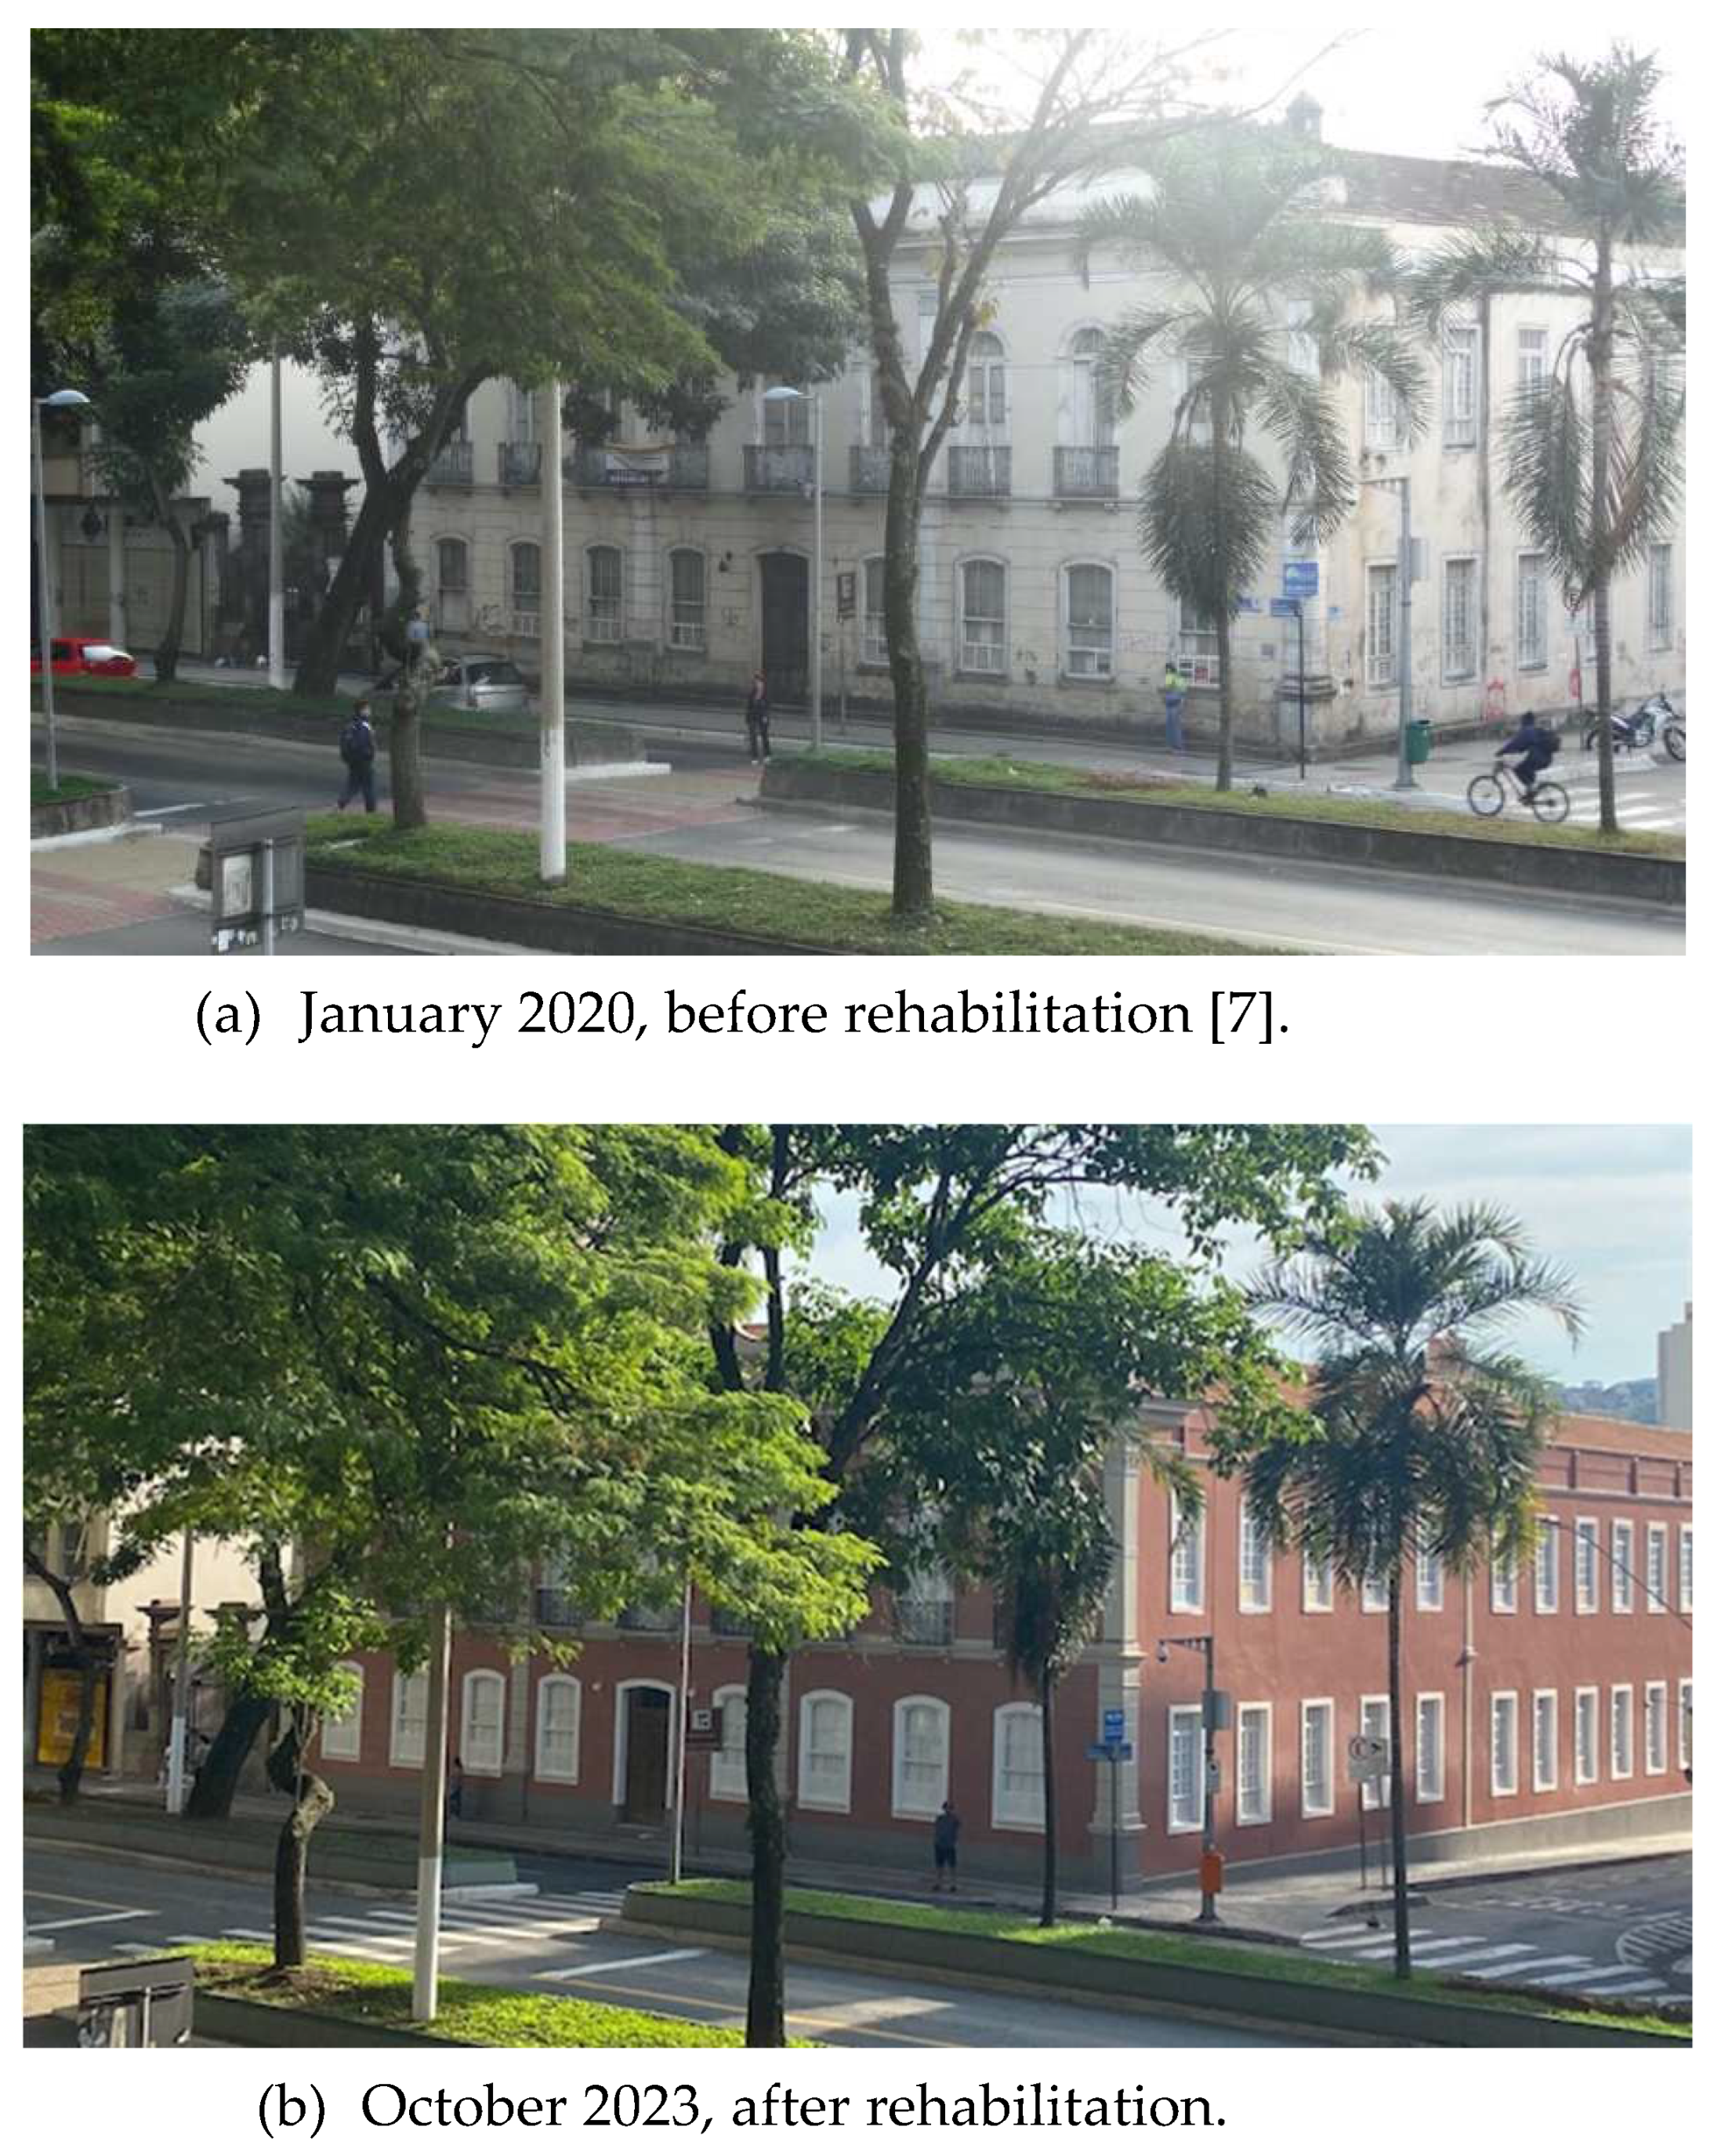
Figure 5.
The mapping of the damage on the main façade [7].
Figure 5.
The mapping of the damage on the main façade [7].
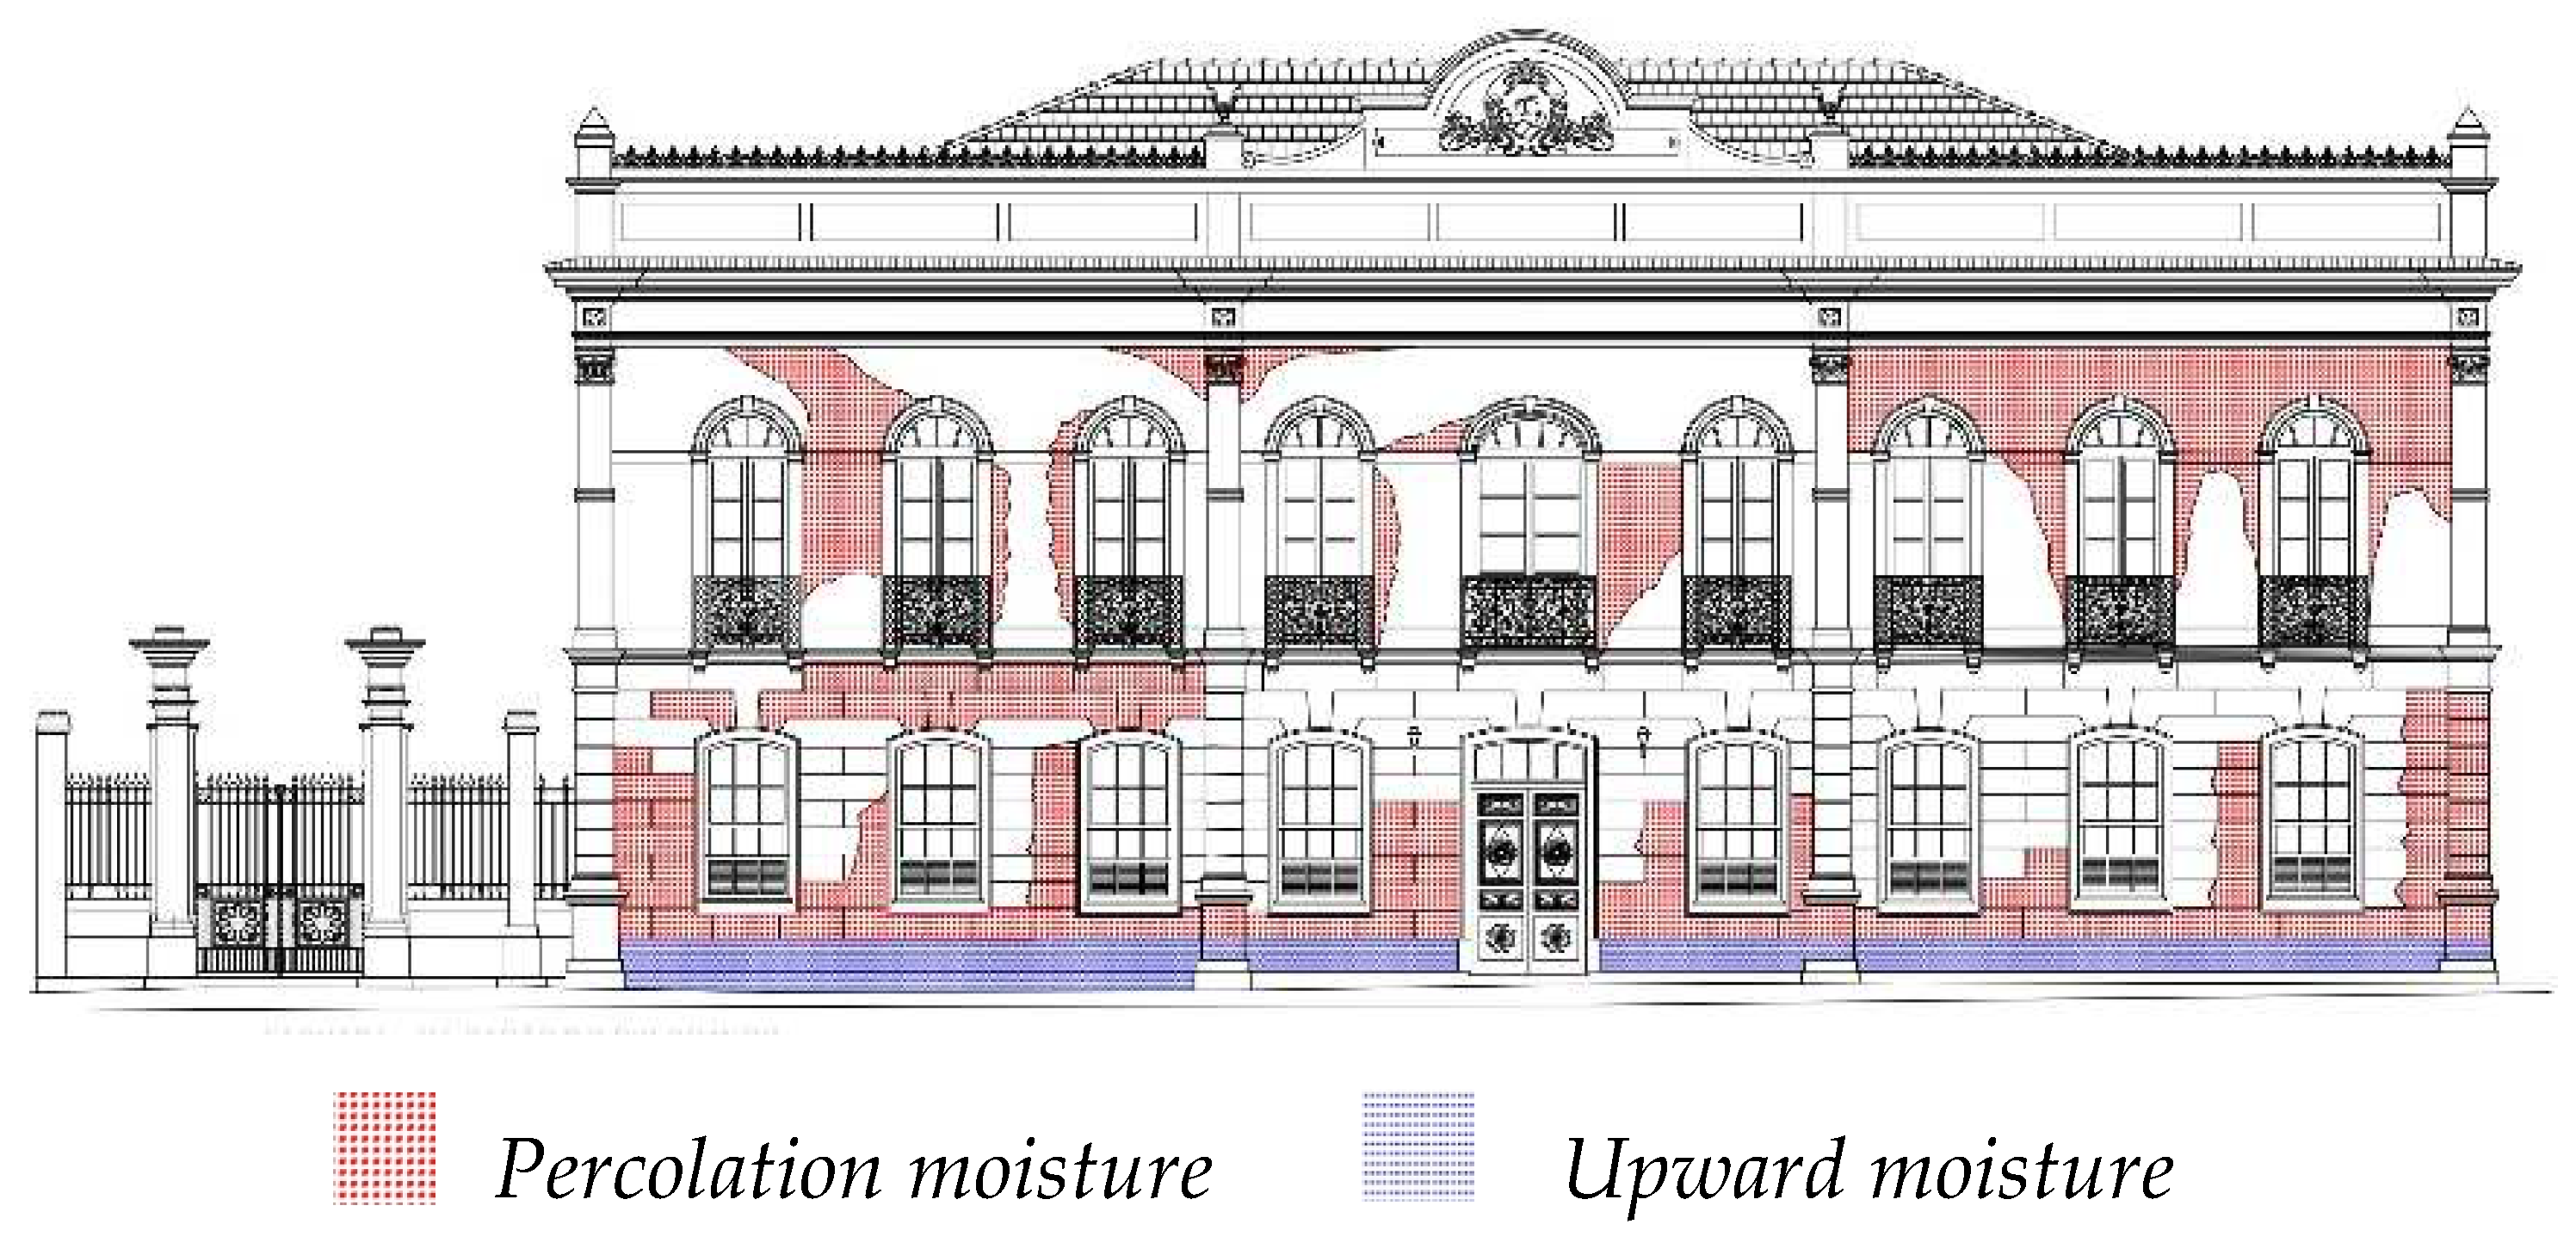
Figure 6.
The mapping of the damage on the secondary façade [7].
Figure 6.
The mapping of the damage on the secondary façade [7].
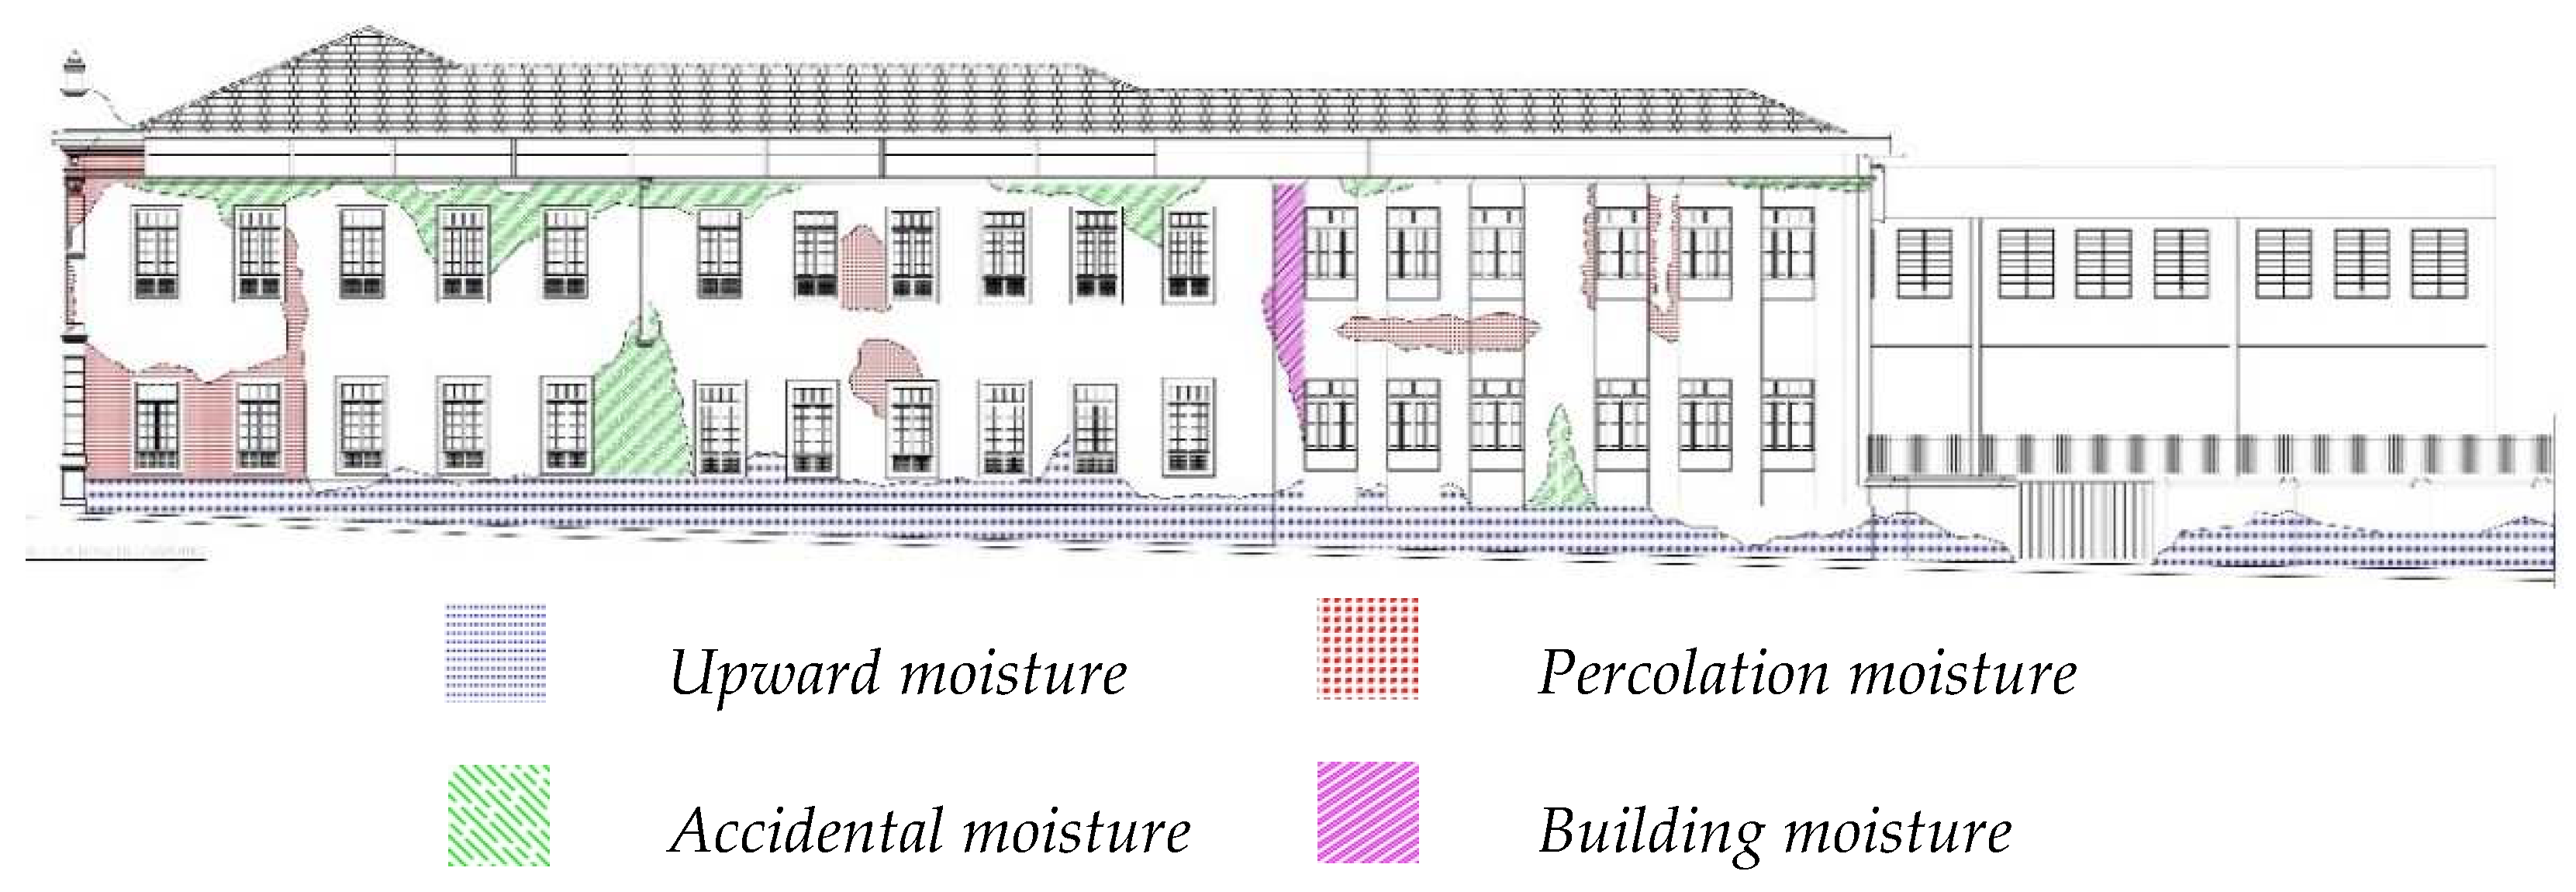
Table 1.
Maintenance types.1.
| Maintenance types | Applicability |
|---|---|
| Detective | Hidden or not a hidden failure |
| Predictive | Condition reform or performance parameter |
| Preventive | Constant and cyclical services |
| Corrective | Sudden and urgent demand, normally with high costs. |
Table 2.
Criteria Score (BASIC Matrix) 1.
| Amount | B | R | S | I | C | E |
|---|---|---|---|---|---|---|
| 5 | highest | 70 a 100% | highest | worst | highest | easiest |
| 4 | high | 40 a 70% | high | worse | high | easy |
| 3 | normal | 20 a 40% | normal | relevant | impact | normal |
| 2 | low | 5 a 20% | low | good | low | hard |
| 1 | lowest | até 5% | lowest | better | lowest | hardiest |
1 Table created by the authors based on [26].
Table 3.
FMEA tool 1.
| Amount | Event | Gravity | Cognition |
|---|---|---|---|
| 1 | Never | No | Almost certain |
| 2 | Lowest | Lowest | Highest |
| 3 | Unusual | Too small | High |
| 4 | Low | Small | Great |
| 5 | Accidental | Normal | Normal |
| 6 | Mean | Great | Low |
| 7 | Usual | High | Lowest |
| 8 | High | Highest | Minimum |
| 9 | Highest | Severe | Unusual |
| 10 | Sure | Very severe | Impossible |
Table 4.
Management tool: summary of advantages and disadvantages.
| Tool | Advantages | Disadvantages |
| BASIC | Easy and adaptable | Subjective and without urgency criterion |
| What/If (SWIFT) | Easy integration between professionals | Without urgency criterion |
| FMEA | Easy and cross-system improvement | Design-oriented and hide results. |
| AAF | Identifying the failure causes | Qualitative |
| GUT | Fast and adaptable to other tools | Prior research |
Table 5.
The indicators of the building failures for the characteristics of quality 1.
| Indicators | Description | Bad | Ordinary | Good | |
|---|---|---|---|---|---|
| A | Usability | Time spent to implement the chosen method | Low | Ordinary | High |
| B | Tools adaptation | Interoperability with other management and operation tools | No | Somewhat | Yes |
| C | Scope | Scope | Little | Several | A lot |
| D | Database quality | Database results | Unreliable | Accepted | Reliable |
| E | Diagnostic accuracy | Results detail | Poor | Ordinary | Excellent |
| F | Duration | Time spent | High | Average | Low |
| G | Professional expertise | Professional | High | Average | Low |
| Indicator weight | 0,8 | 1,0 | 1,2 | ||
Table 6.
The GUT matrix1.
| Type of moisture | Main façade (Fig. 4) | Secondary façade (Fig. 5) | ||||||||
|---|---|---|---|---|---|---|---|---|---|---|
| G | U | T | GUT | Priority scale | G | U | T | GUT | Priority scale | |
| UM | 5 | 4 | 4 | 80 | 20 | 5 | 4 | 4 | 80 | 20 |
| PM | 5 | 5 | 5 | 125 | 10 | 5 | 5 | 5 | 125 | 10 |
| AM | - | - | - | 5 | 4 | 3 | 60 | 40 | ||
| BM | - | - | - | 5 | 4 | 4 | 80 | 30 | ||
1 Table created by the authors based on [7].
Table 7.
Management tools analysis.
| Indicators | BASIC | SWIFT | FMEA | AAF | GUT | |
|---|---|---|---|---|---|---|
| A | Usability | 1,2 | 1,0 | 1,2 | 1,0 | 1,2 |
| B | Tools adaptation | 0,8 | 0,8 | 1,2 | 0,8 | 1,2 |
| C | Scope | 1,0 | 1,2 | 1,0 | 1,0 | 1,0 |
| D | Database quality | 1,0 | 1,0 | 1,2 | 1,2 | 1,2 |
| E | Diagnostic accuracy | 0,8 | 1,0 | 1,0 | 1,2 | 1,0 |
| F | Duration | 1,0 | 1,0 | 1,2 | 0,8 | 1,2 |
| G | Professional expertise | 1,2 | 1,0 | 0,8 | 0,8 | 0,8 |
| (Equation (1)) | 0,92 (4°) | 0,96 (2°) | 1,66 (1°) | 0,74 (3°) | 1,66 (1°) |
Table 8.
The FMEA.
| Type of moisture | Main façade (Fig. 4) | Secondary façade (Fig. 5) | ||||||||
|---|---|---|---|---|---|---|---|---|---|---|
| E | G | C | EGC | Priority scale | E | G | C | EGC | Priority scale | |
| UM | 9 | 9 | 5 | 405 | 10 | 9 | 9 | 5 | 405 | 10 |
| PM | 9 | 9 | 5 | 405 | 10 | 6 | 5 | 5 | 150 | 20 |
| AM | - | - | - | 9 | 9 | 5 | 405 | 10 | ||
| BM | - | - | - | 6 | 6 | 4 | 144 | 30 | ||
Disclaimer/Publisher’s Note: The statements, opinions and data contained in all publications are solely those of the individual author(s) and contributor(s) and not of MDPI and/or the editor(s). MDPI and/or the editor(s) disclaim responsibility for any injury to people or property resulting from any ideas, methods, instructions, or products referred to in the content. |
© 2023 by the authors. Licensee MDPI, Basel, Switzerland. This article is an open access article distributed under the terms and conditions of the Creative Commons Attribution (CC BY) license (http://creativecommons.org/licenses/by/4.0/).
Copyright: This open access article is published under a Creative Commons CC BY 4.0 license, which permit the free download, distribution, and reuse, provided that the author and preprint are cited in any reuse.


