Submitted:
01 November 2023
Posted:
01 November 2023
You are already at the latest version
Abstract
China's vast geographical and climatic diversity presents distinct challenges to its aviation industry, especially in understanding Density Altitude (DA). The study reveals a concentration of airports in the eastern and central regions due to socio-economic factors, while the west, shaped by the Tibetan Plateau, faces infrastructural constraints owing to geographical barriers and limited economic activity. Notable DA variations, particularly negative values in the northeast and discrepancies between DA and elevation in the south, underscore operational complexities. The prominent influence of humidity on DA, especially in the southern coast, prompts a reevaluation of conventional aviation practices. To address these challenges, there's a pressing need for specialized training, region-centric flight planning, comprehensive risk assessment, and increased awareness about humidity's impact on DA. As China's aviation sector expands, harnessing these insights is crucial for sustained operational excellence.
Keywords:
Chinese airports
; density altitude
1. Introduction
DA is a pivotal concept in aviation, serving as a gauge of how aircraft respond to various atmospheric conditions. According to the Federal Aviation Administration (FAA), DA is the vertical height above sea level in a standard atmosphere where one can find a given air density[1]. Essentially, DA reflects the altitude an aircraft feels it's flying at due to existing atmospheric conditions. Lower air densities can significantly impede aircraft performance, notably by lessening the engine's efficiency and diminishing the lift generated by the wings. Such impacts can lead to severe implications for aviation, such as a decrease in the aircraft's maximum weight allowance and longer distances required for safe takeoffs[2,3,4,5].
Several elements contribute to elevated DA, including heightened air temperatures, moisture content, diminished atmospheric pressure, or high-altitude airport locations[6]. High air temperature, dew point temperature, and altitude collectively pose significant challenges for aircraft performance. As each of these factors rise, the air's density diminishes, leading to high DA, a condition well-documented by the FAA[7,8,9,10]. For fixed-wing aircraft, high DA particularly affects the aircraft's takeoff and landing capabilities within short distances, a crucial aspect to consider for military missions in demanding environments[4]. however, there has been considerable discourse surrounding the importance of DA in flight safety and planning. Aircraft performance, influenced by parameters such as lift and thrust, heavily depends on air density. Higher DA generally translates to decreased aircraft efficiency. But what's particularly startling is the oversight of humidity's impact on DA in pilot training manuals, a factor that can substantially alter DA calculations[11]. This discrepancy highlights a lacuna in aviation education, potentially leaving aviation students unaware of the magnitude humidity can exert on their flight planning.
Chinese airports stand out in the global aviation arena due to a combination of geographic, meteorological, and operational complexities[12]. This complexity has been amplified in recent years, given China's rapid economic growth, urbanization, and increasing connectivity to the world[13]. China is home to a vast and varied topographical landscape, ranging from coastal regions in the east to mountainous terrains in the west, expansive plateaus in the north, and hilly regions in the south[14]. Also, Given its vast size and varied topography, China experiences a wide range of weather phenomena. All of these pose specific challenges related to DA and thus aircraft performance[15,16]. Given that DA is intrinsic to ensuring flight safety and optimal air traffic coordination, there emerges an imperative to critically assess the DA characteristics peculiar to Chinese aviation hubs. This necessitates a comprehensive evaluation of potential risks associated with fluctuations in DA and a discerning inquiry into the extent to which exclusionary factors, such as humidity, might modulate the aviation risk management paradigm.
The structure of this paper is outlined as follows: Section 2 introduces the data and methodologies employed. Section 3 provides a comprehensive discussion on the characteristics of DA at Chinese airports, considering both scenarios with and without humidity. Section 4 wraps up the paper with conclusions and offers recommendations for enhancing aviation operations.
2. Data and methodology
2.1. Data and data preprocessing
In the present research endeavor, an in-depth analysis of METAR (Meteorological Aviation Routine Weather Reports) records was conducted, focusing on 34 prominent airports that span various regions of China (as detailed in Table S1). The objective of this analysis was to compute the DA and engage in further comprehensive assessments.
The METAR datasets, inclusive of altitude and geolocation details of the airports, were procured from the IOWA State University's repository (accessible at IOWA State University Mesonet). The period scrutinized for this study extends from January 1, 2000, to December 31, 2022, encapsulating 22 years of data. It is crucial to highlight that the datasets sourced from IOWA State University do not span the entirety of these 22 years. To address this discrepancy, missing records were supplemented with METAR datasets obtained from the Civil Aviation Database, Civil Aviation Flight University of China.
METAR, an internationally standardized format, communicates current meteorological conditions at airports. It offers granular meteorological observations, encompassing aspects like wind patterns, visibility parameters, temperature, dew point, and sea-level pressure. These insights are paramount for pilots and airport administrators to make informed flight decisions and validate meteorological forecasts. Typically, these observations are furnished at intervals of either 30 or 60 minutes. Given the depth and frequency of this data, METAR serves as an optimal database for assessing DA dynamics at Chinese airports.
One critical parameter for DA calculations is the surface pressure. However, METAR reports primarily provide sea level pressure. To derive the surface pressure () for each airport necessary for subsequent DA computations, the following equation is employed:
Here, is the standard sea-level pressure (1013.25 hPa); represents the temperature lapse rate (-0.0065 K/m); stands for the standard temperature (288.15 K); denotes the gravitational acceleration (9.80665 m/s-2); is the molar mass of Earth's air (0.0289644 kg/mol); is the elevation of airport; and is the universal gas constant (8.31432 J/mol∙K)[17].
The intricate topographical features of the terrain play an indispensable role in comprehending regional variations in DA. To depict this, we harnessed the ETOP01 dataset, which boasts a fine-grained resolution of 1 arc-minute. Through this dataset, we constructed an in-depth visualization that portrays the spatial distribution of DA across the extensive geographic contours of China. Such a detailed representation not only enhances our understanding of the topographical influence on DA but also facilitates informed decision-making and strategic planning for aviation activities contingent on DA variations.
2.2. Calculation of dry DA
The DA is profoundly influenced by both the temperature and pressure at an airport's elevation height. In the realm of current aviation operations, consideration is predominantly given to the dry DA (abbreviated as DA_dry). This signifies that humidity isn't factored into current aviation management and operational strategies. In this context, DA_dry is characterized based on the in situ air temperature (T) and pressure (P) prevalent at the airport. The equation representing this relationship is:
Here, , , L, g retain the same connotations and values as delineated in equation (1). Additionally, stands for the specific gas constant, which is analogous to the constant mentioned in equation (1) but has been converted to units of 287.053 J kg-1 K-1 for compatibility and precision[6].
2.3. Calculations of DA Incorporating Humidity Factors
It is crucial to recognize that humidity exerts a substantial effect on DA. Neglecting the contribution of humidity can lead to inaccuracies in the DA estimations employed in modern aviation operations. To address this, we introduce a refined DA that encompasses the impact of humidity, hereafter referred to as DA_hum. This metric is a function of the in situ air temperature, pressure, and dew point. Notably, in METAR reports, humidity is represented by the dew point. The methodology to compute DA_hum utilizing dew point, temperature, and pressure is detailed below[6,17,18,19]:
Step1: Compute the Saturation Vapor Pressure:
Using the Clausius-Clapeyron equation, the saturation vapor pressure for a given dew point () in Celsius is:
Step2: Determine the Mixing Ratio ():
The mixing ratio is the mass of water vapor per mass of dry air. Given the saturation vapor pressure at the dew point and the total atmospheric pressure () is:
Step3: Calculate the Virtual Temperature (Tv):
The formula for the virtual temperature in terms of the actual temperature T (in Kelvin) and the mixing ratio w is:
The factor 0.61 comes from the ratio of the molecular weight of water vapor to the molecular weight of dry air.
Step4: calculate moist DA
3. Results
3.1. Characteristics of DA_dry
China's airport distribution presents an intriguing landscape, rooted in its unique topographical and socio-economic contours. Notably, the central and eastern regions of the country harbor a higher concentration of airports, contrasting the more sparse distribution found in the western territories. This distinction arises from the inherent geographical and demographic attributes of these regions. The western expanse of China is predominantly defined by the Tibetan Plateau and other high-altitude areas (Figure 1a). These regions, often referred to as the "Roof of the World", exhibit sparse population densities and lag in economic development. Consequently, the aviation infrastructure in these areas is limited, primarily due to the challenges posed by the high-altitude topography and the reduced economic impetus. In stark contrast, the central and eastern parts of China are hubs of economic vigor, driven by thriving industries, urban development, and denser populations. Understandably, these regions have witnessed the establishment of a multitude of airports, reflecting the high demand for connectivity and transportation.
Analyzing the DA_dry across Chinese airports provides fascinating insights (Figure 1b). Predominantly, Chinese airports register a positive DA_dry. An anomaly arises in the airports of northeastern China, where the DA_dry often dips below zero. This can be attributed to the unique combination of their slight elevation above sea level and the prevalent colder surface temperatures, which are frequently lower than the standard atmospheric benchmarks (Figure 1d). Eastern Chinese airports, despite having positive DA_dry, showcase relatively modest values. These regions, with their low altitudes, experience higher surface pressures (Figure 1c) and warmer temperatures compared to their northeastern counterparts. Venturing into the central and western terrains, the DA_dry magnifies considerably. The diminished pressures inherent to these elevated regions result in pronounced DA_dry values. The pinnacle of DA_dry is observed at the ZLLL airport, boasting an impressive elevation of 1947 meters, making it an outlier and a testament to the varied topographical canvas of China. In essence, the interplay between China's diverse landscapes and the consequent DA_dry patterns offers a compelling narrative, underscoring the importance of regional nuances in aviation planning and operations.
The absolute value of DA plays a pivotal role as a foundation for aviation operations. It's a widely recognized fact in aviation circles that both elevation and DA are crucial parameters that influence operational adjustments. The variance between DA and elevation, often referred to as the DA departure from elevation, provides insights into the operational efficiency of an aircraft relative to the standard benchmark for that elevation (Figure 2a). For a majority of airports situated in northeastern China, as well as the ZWYN and ZWW airports in the western region, the DA departure from elevation showcases a negative trend. This implies that aviation operations in these locales often achieve higher operational efficiency compared to the standard benchmark for the respective elevation. Conversely, most airports in central, southern China, and the ZWSH airport in the west exhibit a positive DA departure. This indicates that aircraft operations in these regions often grapple with elevated DA values, diverging from the standard benchmarks. Such divergence could suggest operational challenges or the need for additional adjustments during flight operations. The most pronounced DA departures are witnessed in the southernmost territories of China. Here, DA departures exceed 1200 feet for the majority of airports. The subtropical latitude of these areas often results in surface temperatures surpassing those in the standard atmosphere. Consequently, these regions see heightened DA values, signaling that aviation operations might frequently face higher DA challenges, potentially impacting their operational efficiency. the intricate dynamics between DA, elevation, and regional climatic conditions in China underline the need for tailored operational strategies. Recognizing and understanding these variances is paramount for ensuring optimal aviation operations in diverse geographies.
The fluctuations in DA hold profound implications for aviation operations. One effective metric to capture this variability is the standard deviation of DA (Figure 2b). An analysis of this metric across various airports unveils a distinct geographical pattern: airports situated in the north exhibit higher standard deviations of DA, while their southern counterparts tend to display lower values. This spatial distribution of DA variability can be traced back to the intrinsic climatic differences tied to latitude. The southern regions, with their lower latitudinal position, experience a subdued seasonal temperature cycle. As one moves northwards, the amplitude of the seasonal temperature oscillations intensifies, manifesting as pronounced differences between summer and winter temperatures. Such heightened variability in DA poses distinct operational challenges. Airports with a high standard deviation of DA demand greater operational agility. Fluctuating DA means that flight parameters may need recalibration more frequently compared to regions with more stable DA profiles. Elevated DA variability necessitates a more vigilant air traffic management approach. It's crucial for controllers to be acutely aware of the shifting DA values and strategize their responses accordingly. Wide fluctuations in DA could potentially impact the safety margins and operational efficiency. For instance, the take-off and landing procedures might require adjustments to accommodate the shifting DA values.
The DA maximum in relation to elevation stands as a linchpin in aviation operations, acting as a pivotal barometer for risk assessment and mitigation. DA encapsulates the atmospheric conditions "feel" from the viewpoint of an aircraft. When there's a pronounced deviation between the actual elevation and DA, aircraft performance can be critically hampered. Engines may offer reduced thrust, wings might provide diminished lift, and overall, the aircraft may necessitate more airflow over its wings for the requisite lift. This aspect is magnified at high-altitude airports, where even the baseline DA is elevated, accentuating the operational challenges. Elevated DA values, in relation to the actual elevation, signal potential operational hazards. Such conditions demand judicious operational recalibrations to ensure safety, especially during critical phases like takeoff and landing. A discernible trend is evident upon assessing the geographical distribution of these extreme DA values (Figure 2c). Airports in Central and Western China, typically set in higher terrains, often record values surging past 3500 feet, underscoring the intrinsic challenges posed by the high base DAs in these areas. Conversely, Southern and Eastern China exhibit more moderated DA extremes, thereby ensuring a relatively streamlined operational framework. Remarkably, the Northeastern corridors of China showcase the most subdued values, bestowing a more consistent and manageable operational milieu. Recognizing the implications of DA isn't only pivotal for immediate operational decisions but also plays a critical role in long-term infrastructural planning. For instance, regions grappling with marked DA extremes might necessitate the design of extended runways or might influence aircraft type choices to adeptly navigate the unique atmospheric challenges. The onus isn't solely on infrastructure. It's imperative that pilot training modules underscore the nuances of DA, especially in terrains where the difference between the actual elevation and DA is more pronounced. A profound understanding, paired with astute decision-making, can be instrumental in circumventing potential mishaps.
Figure 3 provides a comprehensive depiction of the frequency of DA_dry occurrences in relation to elevation for various specified thresholds. This frequency is determined as the proportion of times DA_dry, in relation to elevation, exceeds a certain threshold when compared to the overall occurrences of DA_dry in relation to elevation.
For the threshold of >500ft, a significant majority of airports exhibit a likelihood of occurrences by more than 30%, northern airports predominantly have frequencies above 30%. In the southern region of China, the frequency tends to be even higher, crossing the 50% mark. Intriguingly, airports located on Hainan Island approach an almost 100% occurrence rate at this threshold (Figure 3a). For threshold of >1000ft, airports in northeastern China hover around a 20% occurrence rate, central Chinese airports typically present around a 40% frequency. The southern region again showcases a predominant trend, with most airports exceeding 50% (Figure 3b). For threshold of >1500ft, northeastern airports generally report frequencies below 10%, Central regions exhibit around 15% and A few southern airports mark their presence with over 30% occurrences (Figure 3c). For threshold of >2000ft, airports in the northeast narrowly touch upon the 1% mark, coastal areas in eastern China remain subdued with frequencies below 10%, and most central, southern, and western regions showcase frequencies around 15% (Figure 3d). The percentage frequency of DA occurrences in relation to elevation can be interpreted as a measure of operational risk for aviation activities. Elevated frequencies, especially at higher thresholds, can be indicative of the challenges posed to aviation operations in those regions. As the percentage rises, so does the need for more meticulous planning, risk assessment, and strategic intervention to ensure the safety and efficiency of aviation operations. This data serves as a critical tool for airlines, regulatory bodies, and aviation infrastructure planners to anticipate challenges and optimize their strategies accordingly.
3.2. The influence of humidity on DA
In contemporary aviation practices, the implications of humidity on DA are surprisingly omitted from pilot training manuals. This oversight could potentially lead to significant deviations in actual DA performance, potentially posing safety risks. Recognizing the intricate relationship between humidity and DA, it is crucial to undertake a thorough investigation to determine the full extent of humidity's influence on DA.
Dew point is widely accepted as a reliable metric to gauge the moisture content in the air. A higher dew point indicates elevated moisture levels, whereas a lower value suggests drier conditions. An intriguing observation from long-term data indicates that the mean dew point for Chinese airports demonstrates a trend of incrementally increasing from the south to the north (Figure 4a). For instance, southern coastal airports register a dew point exceeding 18°C. In contrast, the southern interior regions average around 13°C. This disparity can be attributed to the fact that coastal airports in the south are geographically closer to the sea – a major source of humidity – and often experience higher temperatures. However, a markedly different scenario unfolds for the majority of airports in the western and northern parts of China. Their distance from the ocean combined with relatively higher latitudes contributes to significantly lower dew points, at times even plummeting below zero.
Drawing correlations from the spatial distribution of the dew point, it becomes evident that the influence of humidity on DA is more pronounced for airports in the southern coast (Figure 4b). Here, some airports experience a DA increment of over 300ft. In the south's inland areas, the increase is approximately 200ft. Conversely, for the majority of airports situated in the northern and western regions, the DA elevation due to humidity is less significant, with increments typically staying under 100ft. Understanding the role of humidity in DA determination is not merely academic; it has tangible operational implications. Given its clear influence, especially in certain geographies like the southern coast of China, it becomes imperative for the aviation industry to integrate humidity considerations into its operational protocols and training modules.
Incorporating humidity measurements can significantly impact the standard deviation of DA. Figure 5a illustrates that when humidity is factored in, the variability of DA across Chinese airports amplifies considerably. Most notably, airports in central and eastern China register an increased standard deviation exceeding 80ft. On the other hand, the three primary airports in western China consistently exhibit a deviation less than 50ft. An interesting observation is the notably lower deviation at the two airports in Hainan Island. The primary reason for this phenomenon is the typical atmospheric conditions of these airports, where humidity levels commonly approach saturation, resulting in minimal fluctuations. However, it's fascinating to note that the spatial pattern of these humidity-induced DA variations does not directly mirror the distribution pattern of long-term mean dew points across the region. This discrepancy can be attributed to the fact that the DA's standard deviation, when considering humidity (DA_hum), depends on a dynamic interplay of multiple factors, including surface pressure, surface temperature, and humidity. Each of these elements has its own inherent variability. As a result, the combined variations contribute to the intricate standard deviation values of DA. Thus, it's challenging to draw a direct parallel between the spatial patterns of DA variations and the long-term mean dew point distribution.
Further, the inclusion of humidity tends to escalate the peak DA values. In the southern regions of China, factoring in humidity results in a significant DA surge by over 300ft (Figure 5b). Conversely, several airports in western China and some in the northern parts see a more modest increase, ranging from 100-200ft. This elevation in maximum DA values poses operational challenges, demanding enhanced precaution and strategy. Despite the evident influence of humidity on DA, contemporary aviation operations largely neglect this aspect. Such omissions could inadvertently elevate operational risks, especially considering the pronounced DA spikes in certain regions due to humidity. Recognizing and integrating the impacts of humidity into aviation operational standards is, therefore, imperative to bolster flight safety.
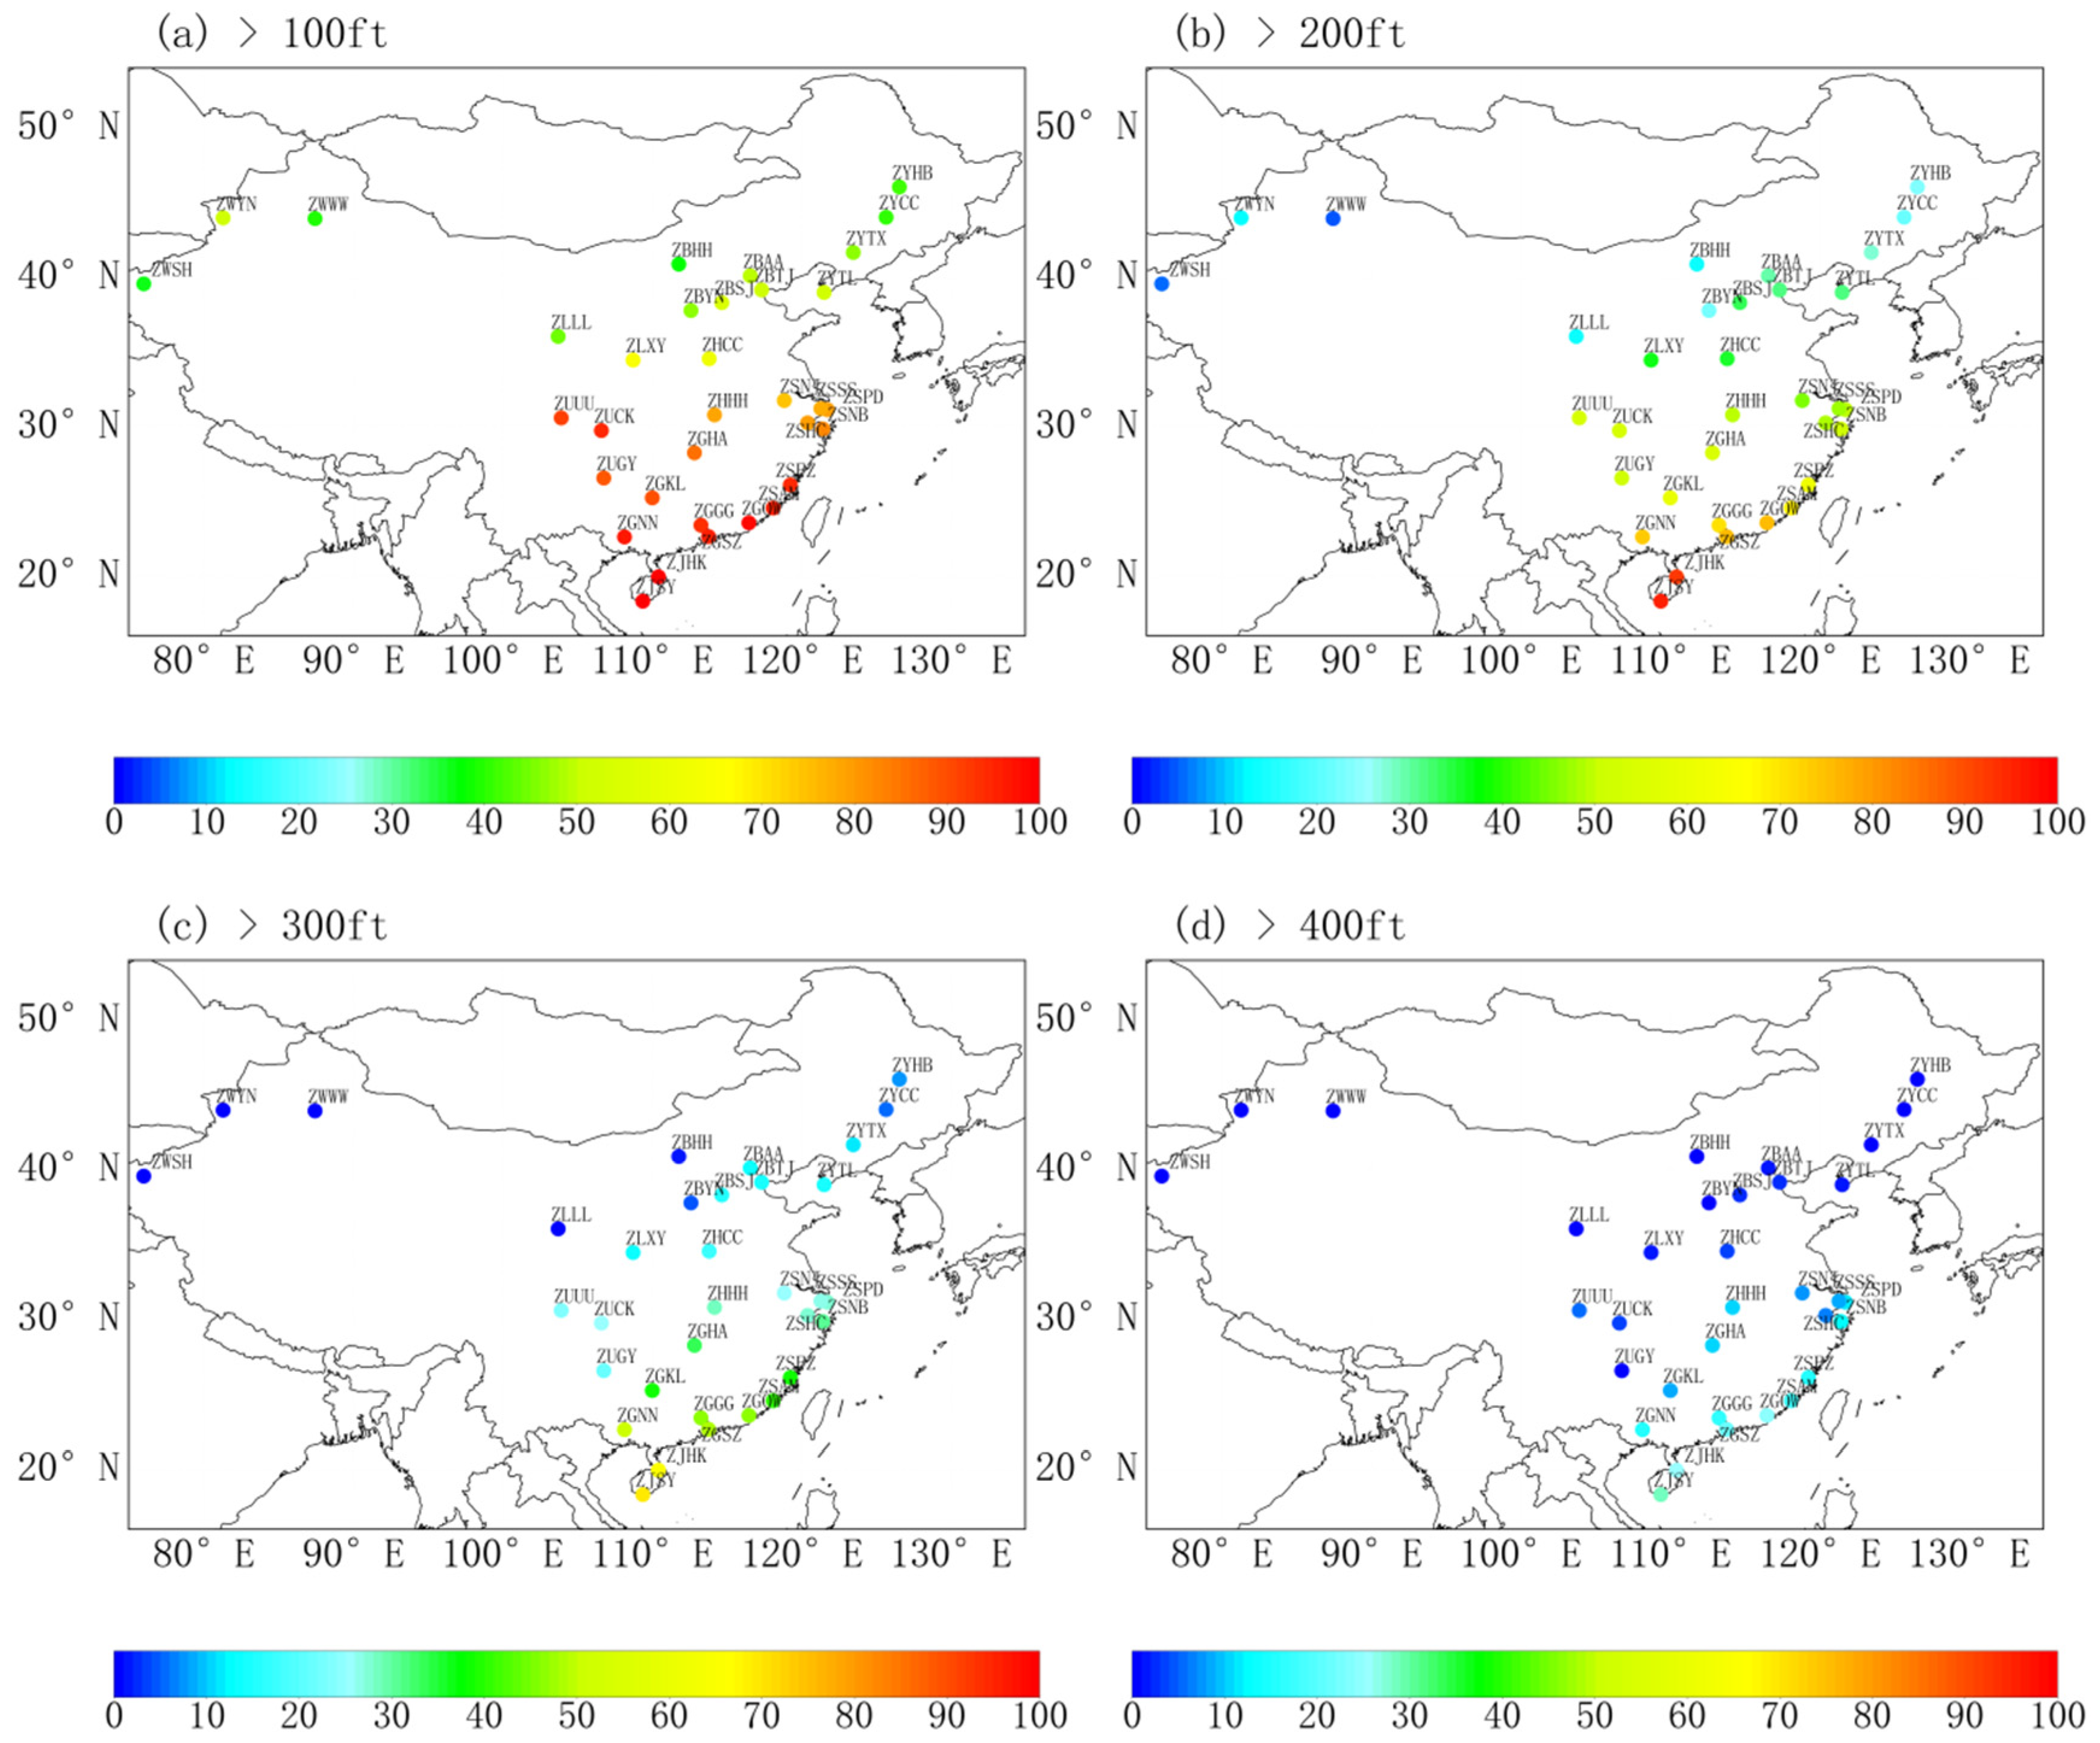
Figure 6 offers an insightful visualization of the disparity between DA_hum and DA_dry across various thresholds. This disparity is determined by subtracting DA_dry from DA_hum, followed by an analysis of how often these differences surpass specified thresholds. When examining the >100ft threshold, a stark contrast emerges between southern and northern Chinese airports (Figure 6a). The influence of humidity on DA is evident, with a staggering 90% of airports in the south displaying differences exceeding this threshold. Even in northern China, a significant portion, over 40% of airports demonstrate a pronounced impact of humidity on DA (Figure 6b). Moving to a >200ft threshold, Hainan Island stands out with over 90% of its airports surpassing this mark, underscoring the profound effect of humidity in this region. Similarly, a majority of southern Chinese airports, over 50%, surpass this threshold. In contrast, northern Chinese airports are less affected, with only about 25% exceeding the 200ft difference (Figure 6c). For a more pronounced threshold of >300ft, northern Chinese airports typically witness a subdued impact of humidity on DA, with rare occurrences of such pronounced disparities. Conversely, in central China, there's an approximate 30% chance that DA differences might exceed 300ft. This probability escalates even further in the extreme southern regions, where over half the airports can potentially experience such significant DA variations. Remarkably, for an even steeper threshold of >400ft, the overall influence of humidity on DA across Chinese airports diminishes. Only a select few airports, primarily located along the southern coast, exhibit a 20% likelihood of DA differences exceeding 400ft. Humidity plays an undeniable role in influencing Density Altitude, with its impact varying regionally. Neglecting to factor in humidity can inadvertently elevate operational risks, particularly in regions with substantial DA disparities. As such, it's crucial for aviation operations to integrate humidity's implications on DA to ensure optimal flight safety and performance.
4. Conclusions
China's vast expanse, diverse topography, and climatic conditions create a unique aviation landscape that is both challenging and instructive. This research delved deep into the interplay between topographical nuances, climatic factors, and their implications on DA – a critical parameter for aviation operations. The findings can be summarized as follows:
Airport Distribution & Topographical Implications: China’s uneven distribution of airports, predominantly in the eastern and central parts, aligns with its socio-economic and demographic patterns. The limited aviation infrastructure in the western part, defined by the Tibetan Plateau, is a natural outcome of both geographical impediments and relatively lesser economic activities.
Insights on DA_dry: The variations in DA_dry across Chinese airports offer a vivid illustration of China's climatic diversity. Particularly noteworthy are the negative values in the northeastern regions, standing as a testament to their distinct geographical and climatic attributes.
Operational Efficacy – DA vs. Elevation: The divergence between DA and elevation, especially in the southern regions, hints at potential operational challenges. This necessitates strategic adjustments and real-time responsiveness to ensure optimal flight efficiency and safety.
DA Variability & Implications: The significant variations in DA, especially in the northern regions, underscore the importance of understanding regional climatic patterns and their implications on aviation operations. This variability, induced by seasonal shifts, advocates for a flexible, region-specific approach to aviation planning.
Operational Challenges with Elevated DAs: High baseline DA values, as witnessed in central and western China, can pose significant challenges to aviation operations. Recognizing these intricacies and adapting to them becomes pivotal.
Humidity's Impact on DA: Humidity emerges as a potent factor influencing DA. Especially in the southern coastal regions, the DA surges significantly when factoring in humidity. This finding challenges the existing paradigms of aviation operations which often overlook the role of humidity in DA calculations.
Based on our analysis of the unique features of Chinese airports, we offer the following suggestions for enhancing further aviation operations:
Training & Capacity Building: Given the stark regional disparities and the significant influence of factors like humidity on DA, it is paramount to update training manuals and curriculums to include these considerations.
Operational Adjustments: Flight planning and operational protocols need to be region-specific, factoring in the localized influences on DA. This is especially relevant for regions with pronounced DA deviations due to climatic factors.
Risk Assessment & Management: With insights like those from Figure 3 highlighting the frequency of elevated DA occurrences, it becomes crucial to have robust risk assessment mechanisms. Understanding the thresholds and associated risks will aid in crafting effective risk mitigation strategies.
Awareness & Advocacy: Elevate awareness within the aviation community about the implications of humidity and other regional factors on DA. Building a community that is informed and responsive is key to ensuring safety and efficiency.
In Conclusion, China's aviation landscape, influenced by its vast geographical and climatic variations, calls for a tailored, region-specific approach. Recognizing the myriad factors influencing DA and weaving them into operational protocols is not just a matter of academic interest but a critical imperative for ensuring safety and efficacy in aviation operations. As China continues to grow and its aviation sector expands, these insights and recommendations can be instrumental in steering the industry towards greater operational excellence.
Author Contributions
Conceptualization, X.K. and H.S.; methodology, X.K. and H.S.; software, G.Z. and X.Z.; formal analysis, X.Z.; writing—original draft preparation, X.K. and H.S.; visualization, G.Z. All authors have read and agreed to the published version of the manuscript.
Funding
This research was supported financially by the Key Laboratory of Flight Techniques and Flight Safety, Civil Aviation Administration of China (Grant No. FZ2020ZZ05), the Fundamental Research Funds for the Central Universities (Grant No. JG2022-24), and Sichuan Science and Technology Program (Grant No. 2022YFS0540).
Institutional Review Board Statement
Not applicable
Informed Consent Statement
Not applicable
Data Availability Statement
Conflicts of Interest
The authors declare no conflicts of interest. The funders had no role in the design of this study; in the collection, analyses, or interpretation of data; in the writing of the manuscript, or in the decision to publish the results.
References
- Saarlas, M. Aircraft Performance; John Wiley & Sons, 2006.
- Prentice, R.A. Aviation Weather Services Handbook; Skyhorse Publishing Inc., 2010.
- Bureau, U.S.W. Aviation Weather, for Pilots and Flight Operations Personnel; US Government Printing Office, 1965.
- Mcrae, M.; Lee, R.A.; Steinschneider, S.; Galgano, F. Assessing Aircraft Performance in a Warming Climate. 2021, 13, 20. [CrossRef]
- Wang, K.; Peng, X.; Dan, B.; Liu, H.; Cheng, S.; Fu, N.; Fu, H.; Liu, C. Decreased Aircraft Takeoff Performance under Global Warming. Atmosphere 2023, 14, 106. [Google Scholar] [CrossRef]
- Guinn, T.A.; Barry, R.J. Quantifying the Effects of Humidity on Density Altitude Calculations for Professional Aviation Education. Int. J. Aviat. Aeronaut. Aerosp. 2016, 3, 2. [Google Scholar] [CrossRef]
- Saarlas, M. Aircraft Performance; John Wiley & Sons, 2006.
- Grigorie, T.L.; Dinca, L.; Corcau, J.-I.; Grigorie, O. Aircrafts’ Altitude Measurement Using Pressure Information: Barometric Altitude and Density Altitude. Wseas Trans. Circuits Syst. ISSN 2010, 1109–2734. [Google Scholar]
- Goodman, C.J.; Griswold, J.D.S. Climate Impacts on Density Altitude and Aviation Operations. J. Appl. Meteorol. Climatol. 2018, 57, 517–523. [Google Scholar] [CrossRef]
- Guinn, T.A.; Halperin, D.J.; Herbster, C.G. Climatology of Estimated Altimeter Error Due to Nonstandard Temperatures. J. Appl. Meteorol. Climatol. 2021, 60, 377–390. [Google Scholar] [CrossRef]
- Administration, F.A. Pilot’s Handbook of Aeronautical Knowledge; Skyhorse Publishing Inc., 2009.
- Kang, X.; Meng, Z.; Feng, W.; Liu, Y. Climate Change Impacts on the Density Altitude of Chinese Airports in Summer; Environmental and Earth Sciences, 2023.
- Muñoz-Esparza, D.; Shin, H.H.; Keller, T.L.; Ikeda, K.; Sharman, R.D.; Steiner, M.; Rawdon, J.; Pokodner, G. Revisiting the Precipitous Terrain Classification from a Meteorological Perspective. J. Appl. Meteorol. Climatol. 2021. [Google Scholar] [CrossRef]
- Gibbons, S.; Wu, W. Airports, Access and Local Economic Performance: Evidence from China. J. Econ. Geogr. 2020, 20, 903–937. [Google Scholar] [CrossRef]
- Reiche, C.; McGillen, C.; Siegel, J.; Brody, F. Are We Ready to Weather Urban Air Mobility (UAM)? In Proceedings of the 2019 Integrated Communications, Navigation and Surveillance Conference (ICNS); IEEE, 2019; pp. 1–7.
- Reiche, C.; Cohen, A.P.; Fernando, C. An Initial Assessment of the Potential Weather Barriers of Urban Air Mobility. IEEE Trans. Intell. Transp. Syst. 2021, 22, 6018–6027. [Google Scholar] [CrossRef]
- Houghton, J.T. The Physics of Atmospheres; Cambridge University Press, 2002; ISBN 978-0-521-01122-8.
- National Oceanic and Atmospheric Administration US Standard Atmosphere, 1976; Technical Report., 1976.
- Wallace, J.M. Atmospheric Science: An Introductory Survey; Elsevier Academic Press, 2006; ISBN 978-0-12-732951-2.
- Bolton, D. The Computation of Equivalent Potential Temperature. Mon. Weather Rev. 1980, 108, 1046–1053. [Google Scholar] [CrossRef]
Figure 1.
Spatial representation of China's terrain elevation (m) (a); the long-term average of DA_dry (b), surface pressure (c), and surface temperature (d) at Chinese airports.
Figure 1.
Spatial representation of China's terrain elevation (m) (a); the long-term average of DA_dry (b), surface pressure (c), and surface temperature (d) at Chinese airports.
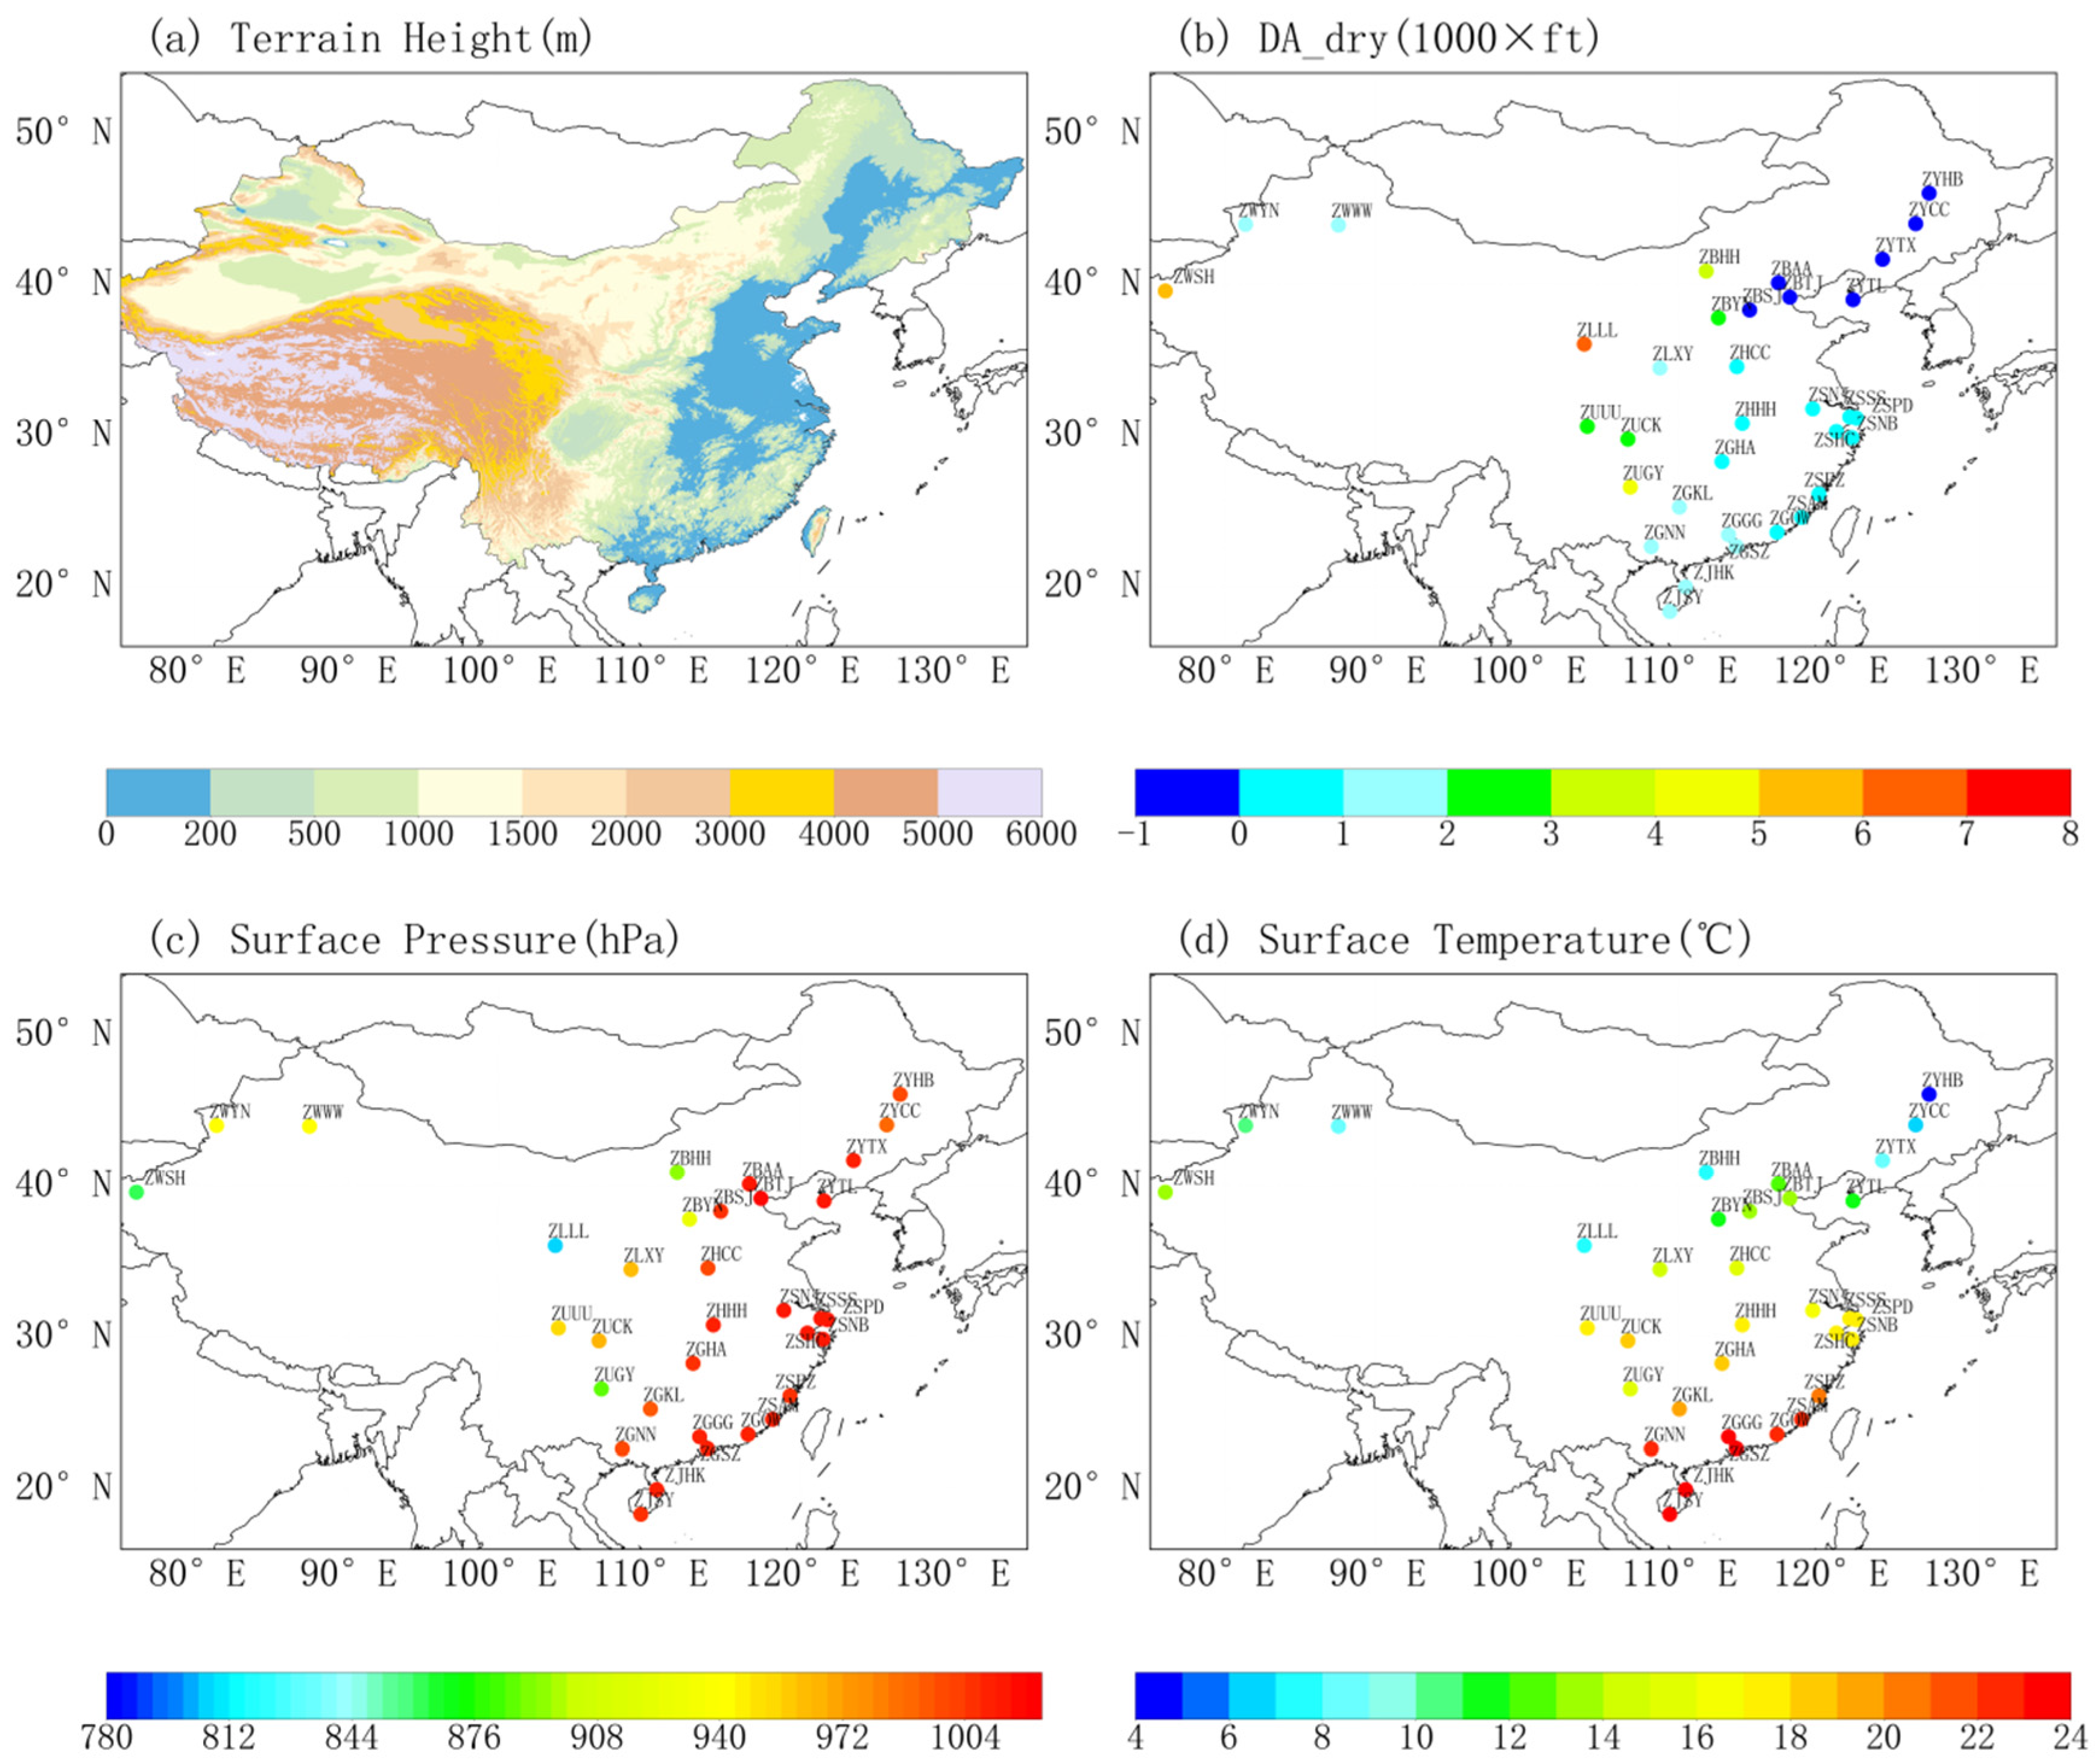
Figure 2.
The spatial patterns of the long-term average difference between DA_dry and elevation (a), the standard deviation of DA_dry (b), and the peak values of the DA_dry-elevation discrepancy for Chinese airports (c).
Figure 2.
The spatial patterns of the long-term average difference between DA_dry and elevation (a), the standard deviation of DA_dry (b), and the peak values of the DA_dry-elevation discrepancy for Chinese airports (c).
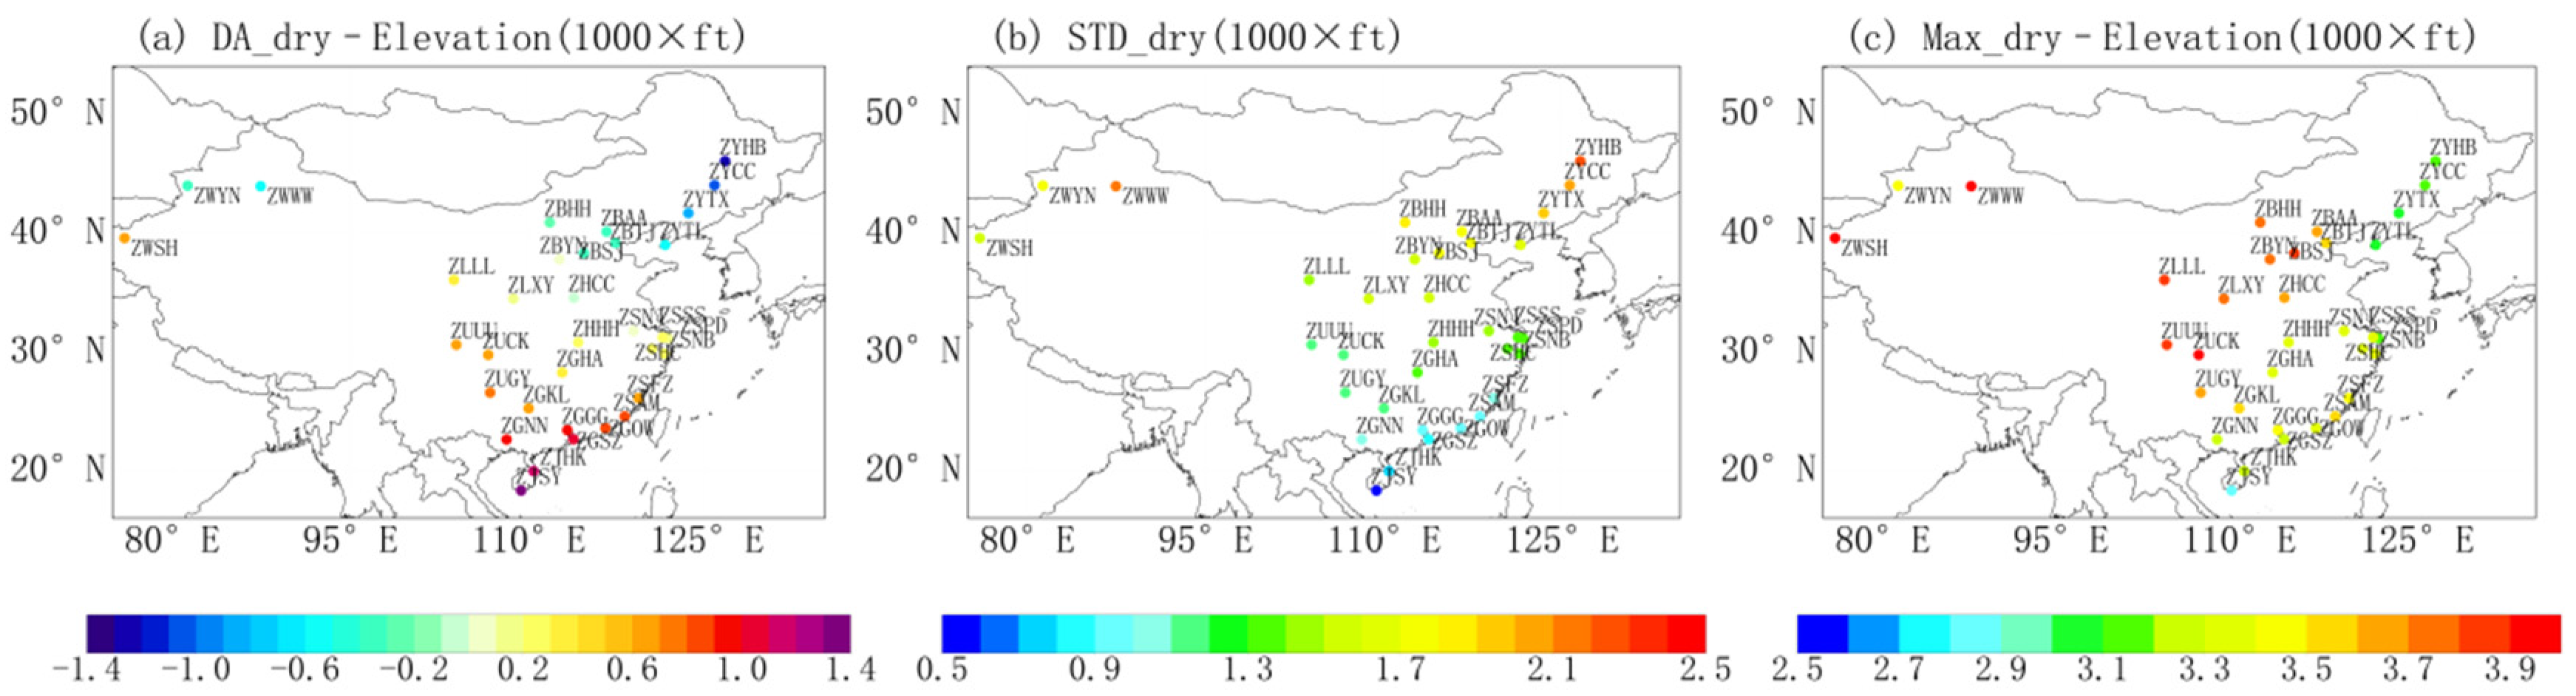
Figure 3.
The frequency (%) of DA_dry occurrence in relation to elevation for (a) > 500ft, (b) >1000ft, (c) >1500ft, (d) >2000ft.
Figure 3.
The frequency (%) of DA_dry occurrence in relation to elevation for (a) > 500ft, (b) >1000ft, (c) >1500ft, (d) >2000ft.

Figure 4.
the spatial distributions of long-term average of dew point (a), and DA_hum – DA_dry (b).
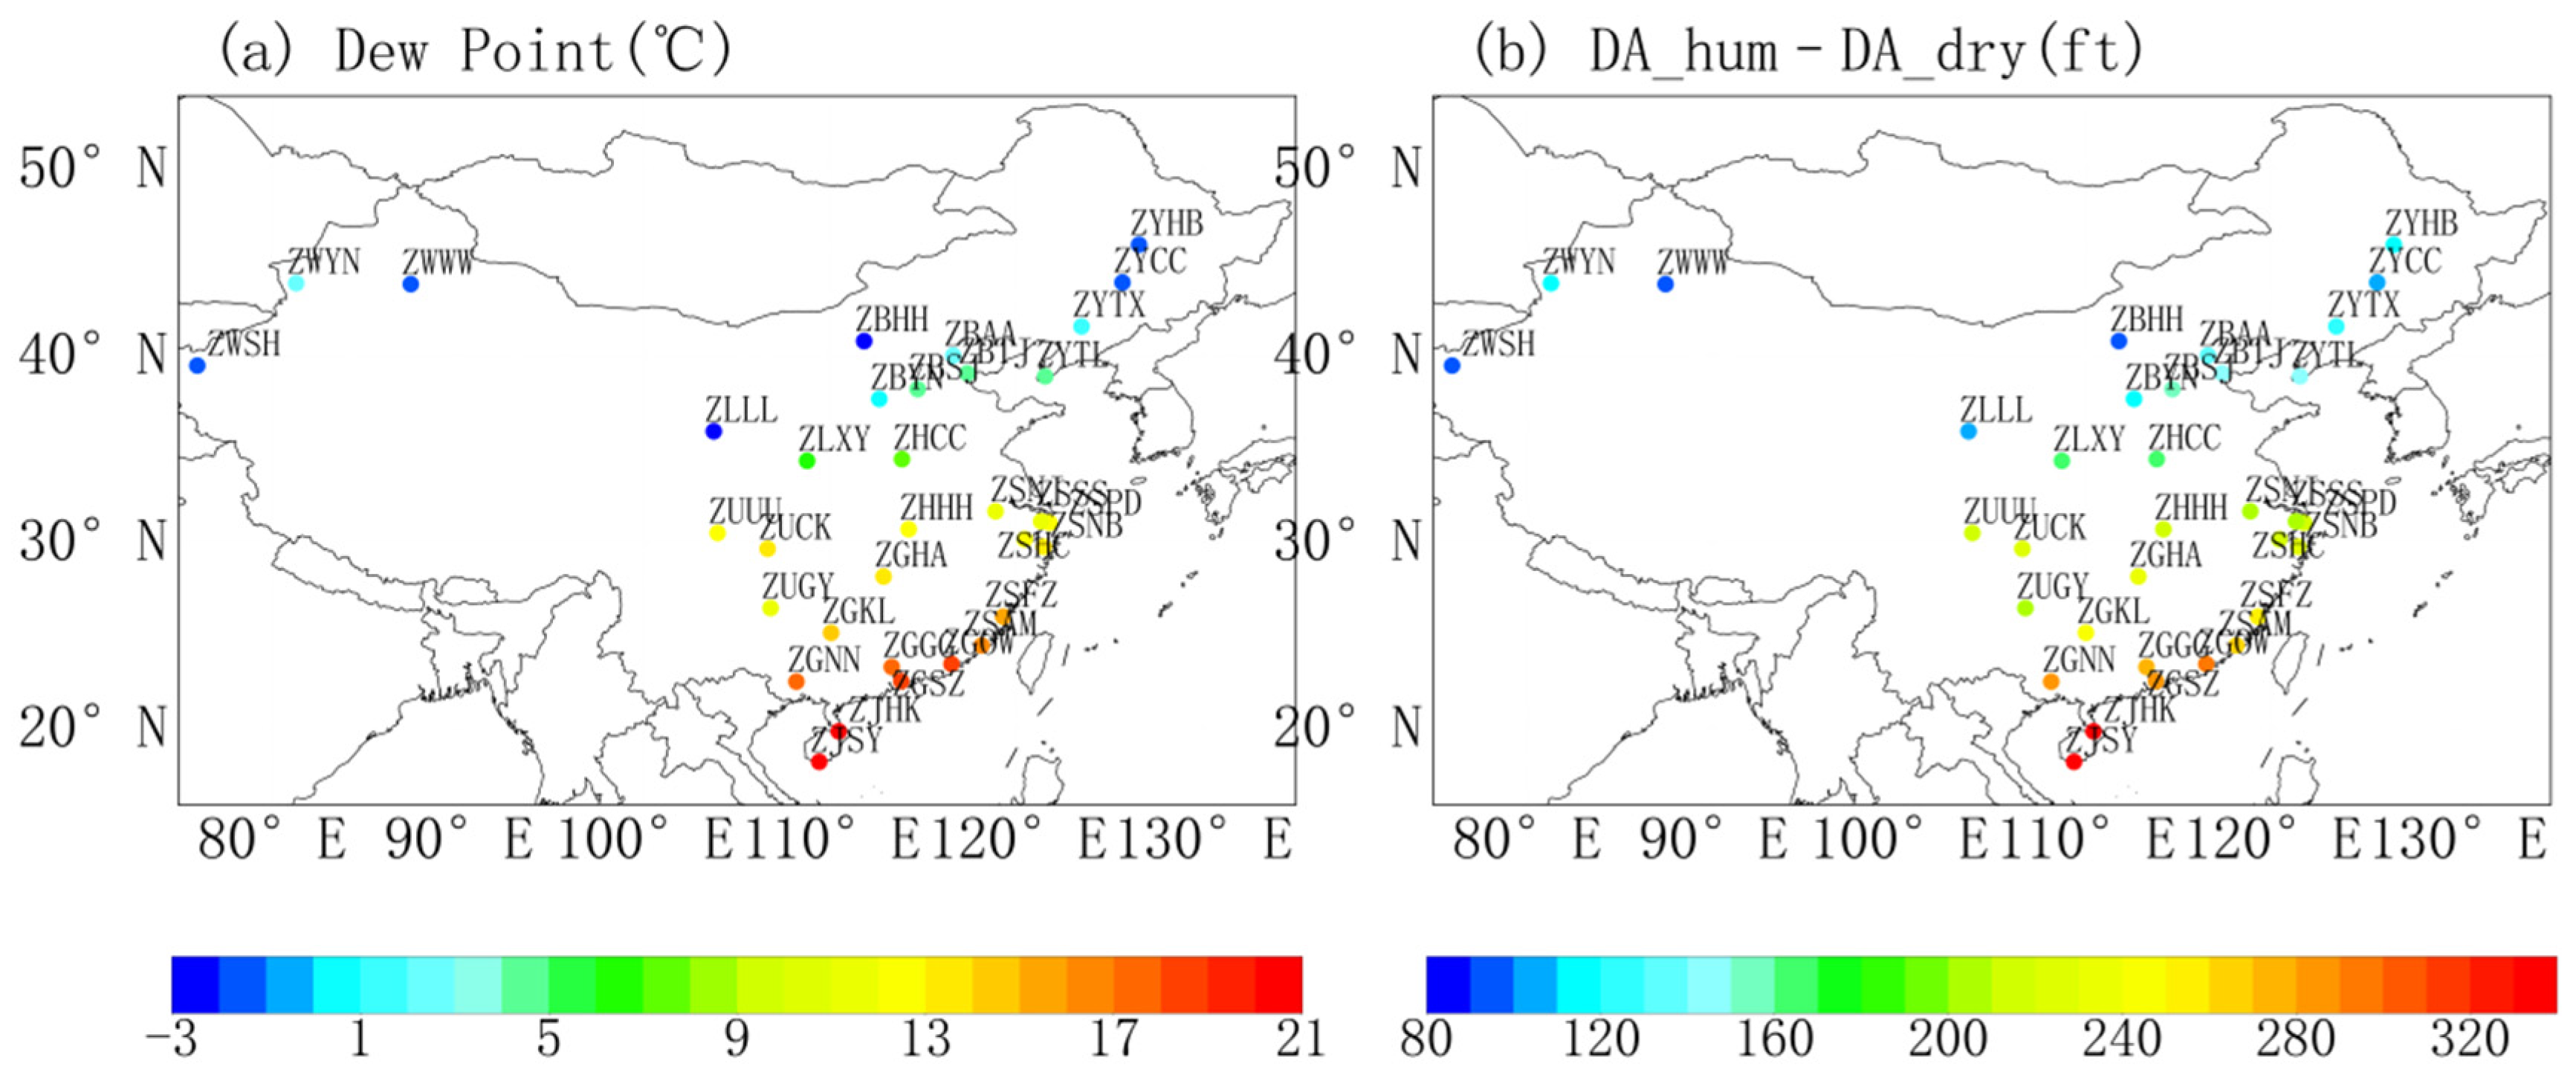
Figure 5.
the spatial distributions of the difference of standard deviation (a) and maxmium values (b) between DA_hum and DA_dry.
Figure 5.
the spatial distributions of the difference of standard deviation (a) and maxmium values (b) between DA_hum and DA_dry.
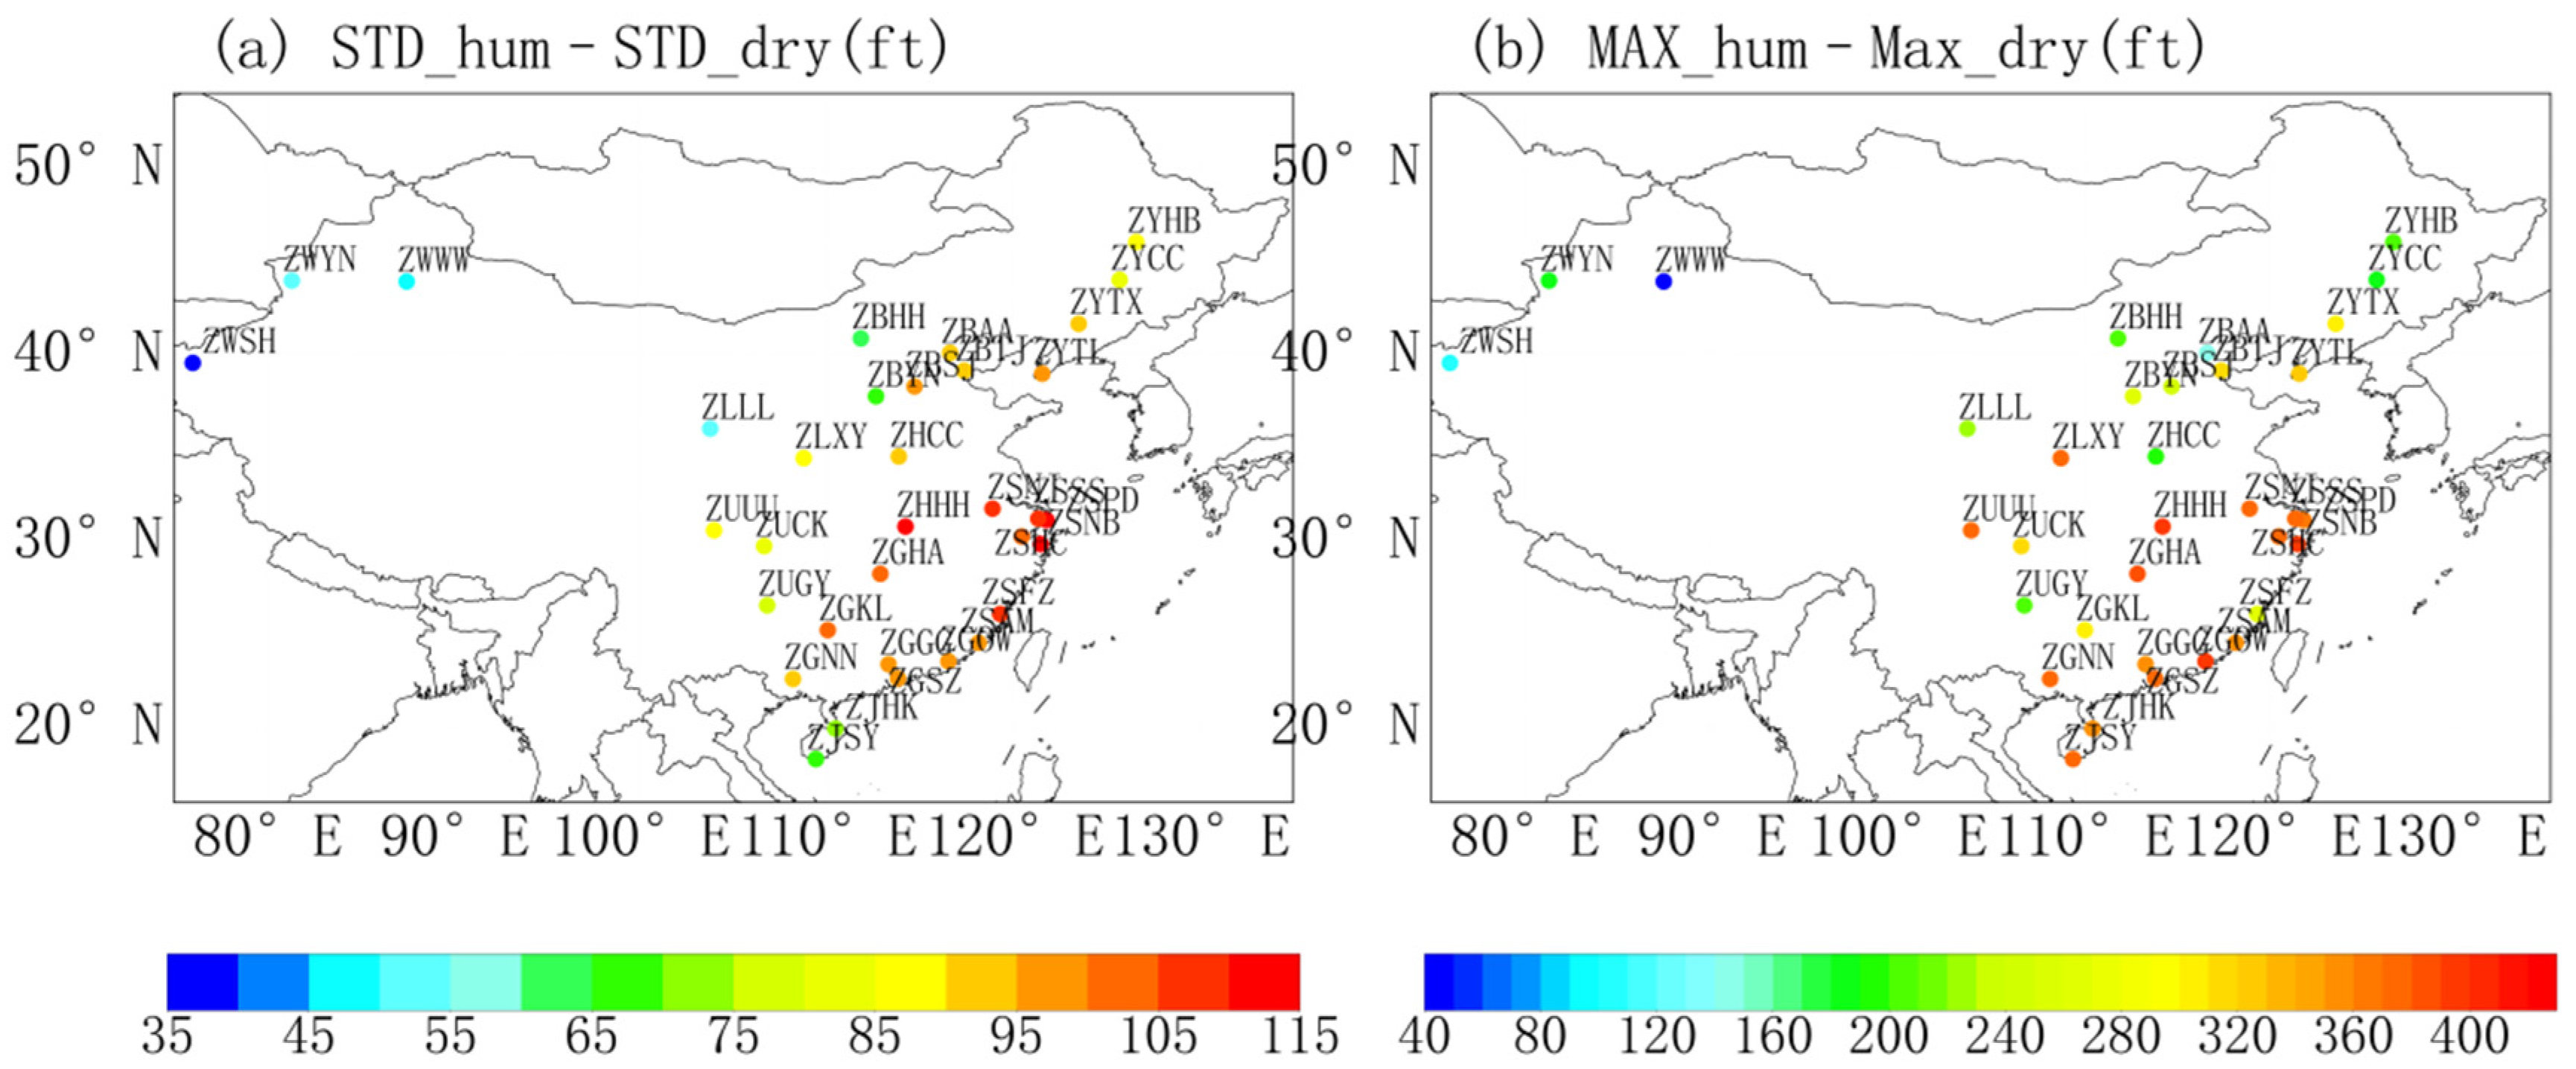
Figure 6.
The frequency (%) of DA_hum - DA_dry occurrence for (a) > 100ft, (b) >200ft, (c) >300ft, (d) >400ft.
Figure 6.
The frequency (%) of DA_hum - DA_dry occurrence for (a) > 100ft, (b) >200ft, (c) >300ft, (d) >400ft.
Disclaimer/Publisher’s Note: The statements, opinions and data contained in all publications are solely those of the individual author(s) and contributor(s) and not of MDPI and/or the editor(s). MDPI and/or the editor(s) disclaim responsibility for any injury to people or property resulting from any ideas, methods, instructions or products referred to in the content. |
© 2023 by the authors. Licensee MDPI, Basel, Switzerland. This article is an open access article distributed under the terms and conditions of the Creative Commons Attribution (CC BY) license (http://creativecommons.org/licenses/by/4.0/).
Copyright: This open access article is published under a Creative Commons CC BY 4.0 license, which permit the free download, distribution, and reuse, provided that the author and preprint are cited in any reuse.


