
Submitted:
31 August 2023
Posted:
04 September 2023
You are already at the latest version
Abstract
This study examines the projected impact of climate change on the Density Altitude (DA) at Chinese airports during the summer by the end of the 21st century. Findings indicate that climate change is expected to significantly increase the DA at all Chinese airports, with an estimated rise between 300 and 800 feet. The analysis suggests temperature increases will universally contribute to a rise in DA. Pressure changes, however, are more variable. Most airports are predicted to see an increase in pressure, which could offset some temperature effects on the DA. Airports in eastern China are expected to see a decrease in pressure, amplifying the effects on DA and creating operational challenges.
Keywords:
density altitude
; Chinese airports
; climate change
1. Introduction
As climate change continues to affect global weather patterns, its impact on aviation becomes increasingly important to understand. One such impact is the alteration of DA, which directly influences aircraft performance and airport operations [1]. Higher DAs reduce aircraft performance, requiring longer takeoff distances and reducing climb rates [2]. Similarly, during landing, increased DA can result in longer landing distances and a decreased margin of safety [3]. These effects are due to the reduced air density, leading to a decrease in engine power output and lift generated by the wings [4,5,6,7]. Understanding and accounting for DA is essential for maintaining aircraft performance and airport operation.
DA is affected by three primary factors: temperature, pressure, and humidity [8,9,10]. Warmer temperatures cause air molecules to spread out, resulting in a decrease in air density, thus the increased DA. Lower pressure is associated with lower air density, resulting in a higher DA. In such conditions, aircraft engines produce less power, and wings generate less lift, which can negatively affect performance. Humidity, or the amount of water vapor in the air, also influences DA, although to a lesser extent than temperature and pressure. As humidity increases, the air density decreases, leading to a higher DA. As climate change continues to impact atmospheric conditions, understanding the impact of temperature, pressure, and humidity on DA is essential for safe and efficient airport operations.
As the second-largest economy and the most populous country in the world, China is an important player in the aviation industry, with numerous airports having been built across the country in the past few decades. considering China's vast territory and diverse climate, the effects of climate change on airport operations are critical to understand and address. The summer season (JJA) in China is characterized by high temperatures and rapidly changing air pressure, and the effects of climate change on DA are most pronounced, making it an ideal case study for examining the effects of climate change on DA at airports.
The paper is organized as follows: Section 2 presents data and methods used. In Section 3 the effects of climate change on the DA of Chinese airports is analyzed, and the contributions of temperature and air pressure to these changes are thoroughly examined. the conclusion and the future works are discussed in Section 4.
2. Data and methodology
2.1. Data
We utilize surface air pressure and temperature data derived from Coupled Model Intercomparison Project Phase 6 (CMIP6) models (Table S1) under both historical and high-emission SSP5-8.5 scenarios [11] to estimate DA throughout the summer season. Current research indicates that CMIP6 models exhibit substantial enhancements and increased climate sensitivity in comparison to their CMIP5 counterparts [12,13]. The climate warming associated with the high-emission SSP5-8.5 scenario surpasses the recommendations set forth by the Paris Climate Agreement [14], yielding a more pronounced signal-to-noise ratio. However, surface pressure and air temperature responses to climate variations remain relatively linear with global mean warming, facilitating the effortless adaptation of our results to less warming scenarios. Additionally, the topographical details of the land are derived from the ETOP01 data set [15], which offers a granular resolution of 1 arc-minute. This data is utilized to create a comprehensive illustration of the distribution of DA across the vast geographical expanse of China. This approach provides a nuanced understanding of the terrain, aiding in the efficient planning and execution of relevant strategies or operations related to DA.
For the CMIP6 data, we initially interpolate values from a range of models onto a 1° × 1° resolution grid. Following this, we calculate time-averaged modeled surface air temperature and air pressure for the periods 1995–2014 and 2081–2100, which represent the present and late 21st-century climates, respectively. We then determine target variables from each model and compute the multi-model ensemble mean for every grid cell. Subsequently, we interpolate the gridded data to the positions of 243 major-city transport airports throughout China, covering a majority of regions.
Using the interpolated surface air pressure and air temperature, we calculate the DA for each airport. This information is then utilized to assess the potential impacts of climate change on the DA of Chinese airports during summer months (JJA).
2.2. Calculation of DA
The DA in this paper is defined as a function of air temperature and pressure:
where , are the standard temperature and density at Mean Sea Level (MSL), L (-0.065K m-1) is the standard atmosphere vertical temperature gradient, g is gravity (9.80665 m s-2), and Rd is the gas constant for dry air (287.053J kg-1 K-1) [16]. Although the accurate DA calculations require factoring in humidity effects due to their significant role in flight planning[17,18,19]. Unfortunately, this crucial aspect is often overlooked in many introductory pilot training manuals [17]. The performance criteria published in the "Pilot’s Operating Handbook" (POH) typically depend on International Standard Atmosphere (ISA) conditions at sea level (598F/158C and 29.92 in. Hg/1013.25 hPa), with no consideration for humidity [19]. Furthermore, a significant portion of aviation literature [20,21,22,23,24,25,26] scarcely addresses the influence of humidity on DA calculations. In addition, the computation of DA for aircraft performance charts or manual flight computers conventionally requires only an understanding of pressure altitude and air temperature, omitting the role of humidity [17]. Thus in alignment with current aviation planning, our DA calculations in this paper primarily focus on the air temperature and pressure effects on DA, thereby excluding the humidity impact.
3. Results
3.1. DA in Chinese airports
The DA values across Chinese airports exhibit a clear geographical trend: lower DA values in Eastern China, intermediate DA values in Central China, and higher DA values in Western China (Figure 1b). This pattern is intrinsically linked to the varying altitudes of these regions (Figure 1a). The Eastern region, featuring coastal plains and hilly lands, is home to airports with lower altitudes. Consequently, most airports in this region report DA values ranging from 1000 to 3000 feet. This lower DA promotes more efficient aircraft performance, due to the denser air which provides greater lift and engine power. Moving inland, Central China's more diverse topography, characterized by basins and rolling plateaus, yields airports with moderately higher altitudes. Accordingly, the DA in these areas typically lies between 4000 and 9000 feet. These elevated DA values require pilots to adjust their flight operations, as they can lead to decreased engine power, lower climb rates, and longer take-off and landing distances. In Western China, the geographical landscape becomes even more dramatic, dominated by the towering heights of the Tibetan Plateau. Airports in these areas exist at substantial altitudes, causing the DA to exceed 9000 feet. This high DA imposes significant operational considerations, as the reduced air density can further diminish engine performance and increase take-off and landing distances. This trend underscores a close correlation between the DA and geographical elevation. Each regional characteristic, from the coastal plains of the East to the high plateaus of the West, contributes distinctively to the DA values, which in turn significantly influences airport and flight operations across China.
In the future timeframe of 2081-2100, we observe a noteworthy shift in the DA ranging from 200 to 800 feet across China, signifying substantial variations in aviation conditions. There is an east to west gradient in these changes, suggesting that the DA changes escalate notably as one moves from the eastern to the western regions of the country. In the eastern region of China, characterized primarily by its flat, low-altitude terrain, the DA tends to shift by approximately 200-400 feet. When considering the central part of the country, the landscape undergoes a noticeable transition. The terrain height increases, and it is therefore unsurprising to witness an accompanying rise in the DA changes to about 400-600 feet. Moving further to the Western region, the terrain is predominantly characterized by high-altitude plateaus. It is within these challenging terrains that the most significant DA changes take place, often exceeding 600 feet. The predicted DA changes are likely to have significant implications for flight operations across the country, and thus necessitates continual monitoring and adaptation by the aviation industry to ensure safety and efficiency in the face of these changing conditions.
Figure 2 provides a quantitative illustration of the number of airports expected to experience varying degrees of explicit DA changes. The largest subset of airports - a total of 95, accounting for 39.1% of all airports - are projected to confront DA increases of 500-600 feet. Moreover, a further 55 airports, which represent 22.6% of the total, are anticipated to face DA increases within the range of 400-500 feet. Additionally, a group of 45 airports, comprising 18.5% of all airports, are estimated to undergo DA fluctuations of 600-700 feet. Such a significant shift will almost certainly necessitate meaningful adaptations in flight operations, including alterations in payload, modifications to fuel efficiency strategies, and adjustments in take-off and landing distances. A smaller yet crucial group of 10 airports, accounting for 4.1% of all airports, are forecasted to experience substantial DA increases ranging between 700-800 feet. Despite their smaller quantity, these airports will likely be confronted with significant challenges, given the substantial magnitude of these projected DA alterations. Simultaneously, there are 38 airports, representing 15.6% of all airports, that are projected to encounter DA shifts in the comparatively lower range of 200-400 feet. Although these changes may seem less severe compared to others, they still demand meticulous consideration, foresight, and planning to ensure operational safety and efficiency.
3.2. The contribution of temperature to DA
Changes in DA are predominantly attributed to alterations in surface air temperature and surface pressure. To discern the distinct influences of these two factors, we conducted a detailed analysis, keeping the surface pressure values constant at 1995-2014 levels while applying projected temperature values for the periods of 2081-2100. This approach allows us to isolate and explicitly quantify the direct contribution of surface air temperature to DA changes.
Our research illustrates a noticeable trend that the ascension of temperatures is leading to a consistent rise in DA across all airports in China for the predicted period of 2081-2100 (Figure 3a). This observed pattern is more discernible in the southern regions, demonstrating moderate yet significant escalations in central China, and culminating in remarkable elevations in the northern areas. In the case of southern China, the anticipated rise in DA as a consequence of temperature fluctuations is about 450 feet. In stark contrast, northern China may witness a more pronounced alteration in DA exceeding 550 feet. Of all regions, the northwest of Xinjiang province stands out as it is expected to endure the most considerable temperature-induced DA alterations, with increases potentially surpassing 800 feet.
These observed shifts in DA are found to correspond directly with changes in temperature (Figure 3b). To elucidate, the progression of temperature alterations escalates from south to north, starting with a rise of approximately 3°C in southern China, around 5°C in the central regions, and surging to over 6°C in northern China. The apex of these temperature changes is discovered in the northwest of Xinjiang province. The distinctive climatic conditions of this region, characterized by its extreme climate and high-altitude environment, exacerbate the impact of temperature changes on DA. This particular situation underscores the pivotal role that surface air temperature plays in influencing DA. As we stand on the brink of a future where global temperatures continue to ascend, these findings accentuate the urgency for implementing climate-adaptive strategies in the aviation sector. This is crucial to maintaining optimal flight performance and ensuring safety, especially in light of the increasing demands and challenges posed by climate change.
In order to provide a comprehensive numerical representation of the number of airports, we conducted a statistical analysis in Figure 4. As depicted in the diagram, the effect of projected temperature changes primarily influences an increase in the DA range from 300 to 800 feet. It is noteworthy to highlight that the majority of airports experience a DA alteration within the range of 500-600 feet. This category accounts for a substantial 42.8% of all surveyed airports. Further analysis of the data reveals that there are 70 airports that have registered DA changes within the 600-700 feet range, attributable to the aforementioned projected temperature variations. These constitute a significant 28.8% of all examined airports. Moreover, an additional 55 airports, representing 22.6% of the total, are reported to have DA shifts within the same range of 600-700 feet. However, the extremes of the DA change spectrum, specifically the 300-400 feet and 700-800 feet ranges, are found to be less impacted by temperature fluctuations. Thus, the number of airports reporting DA changes within these intervals due to projected temperature changes remains relatively low. This data suggests that the temperature impacts on airport DA change are not uniformly distributed but exhibit a certain trend favoring a particular range.
3.3. The contribution of surface air pressure to DA
In addition to the temperature's influence on DA, we further investigated the impact of surface pressure changes on DA variations. To do this, we held temperature levels constant to those in 1995-2014, then recalculated DA using projected surface air pressure values for the periods 2081-2100. We then evaluated the differences between these recalculated DAs and the original DAs from 1995-2014, thus isolating the effect of surface pressure changes.
Our comprehensive analysis elucidates that alterations in surface pressure wield a unique and significant influence on Density Altitude (DA), the extent of which varies geographically, as illustrated in Figure 5a. In the eastern part of China, particularly north of the Yangtze River, the majority of airports are predicted to confront an escalation in DA as a consequence of changes in surface pressure. However, the degree of these increases remains relatively minimal. This is primarily attributable to a slight decrease in pressure within this region, as demonstrated in Figure 5b. Conversely, a substantial number of airports situated in regions beyond the east are expected to witness a coherent decline in DA. This involves changes approximating -50 feet in the central areas and plunging below -100 feet in most of the western regions. This phenomenon can be traced back to an anticipated rise in pressure during the 2081-2100 periods within these geographical locations. An area of particular interest lies in the southern and western peripheries of the Qinghai-Tibet Plateau, where the surface pressure changes tend to have an extraordinarily pronounced effect on the DA. A decrease in surface pressure in these regions results in a dramatic reduction of DA, with projected reductions surpassing 200 feet.
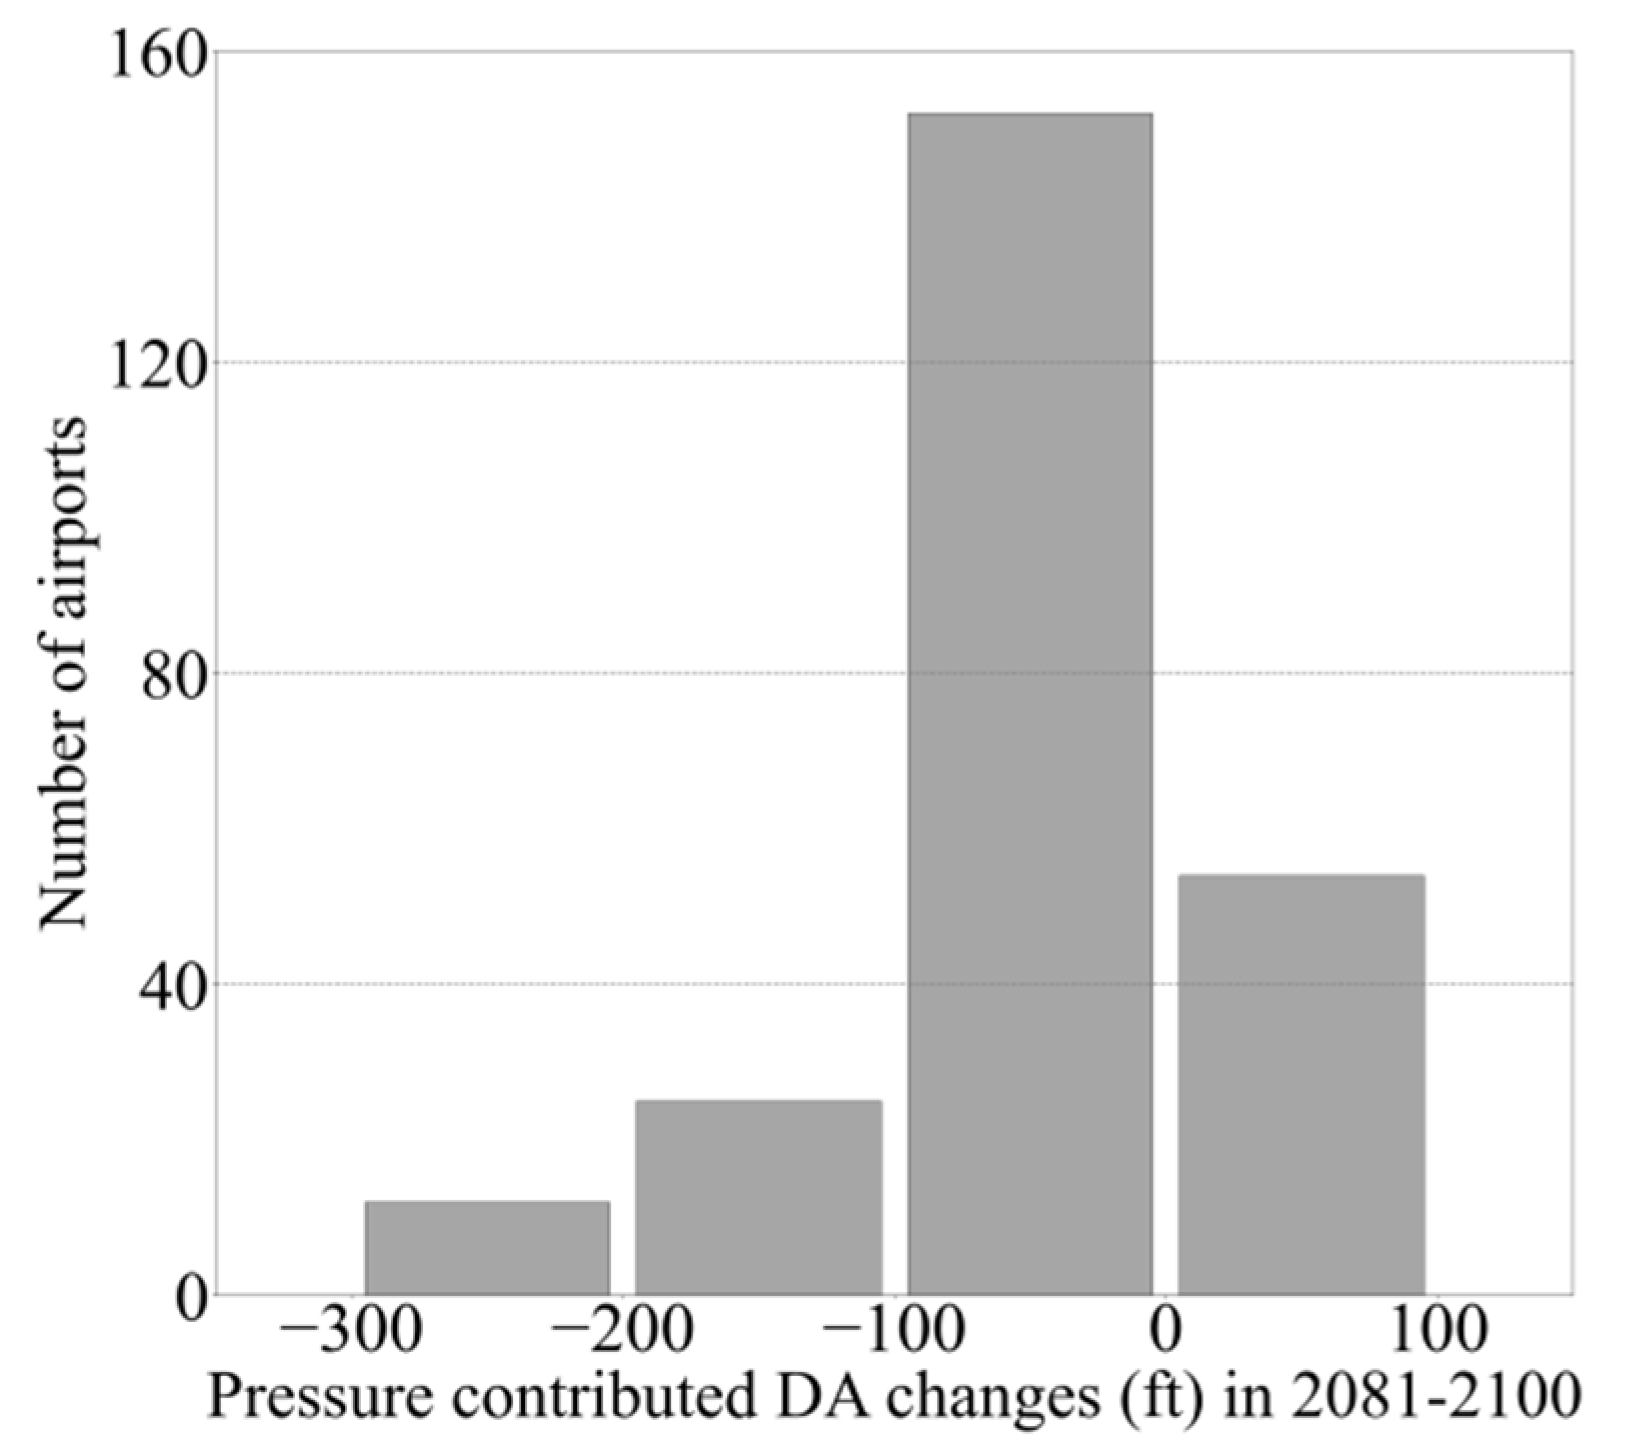
In an effort to quantify the number of airports for each range of explicit DA alterations, we have conducted a comprehensive statistical analysis, the results of which are depicted in Figure 6. As demonstrated in the said Figure, the implications of projected changes in surface air pressure on DA values present a more intricate scenario compared to the effects induced by temperature changes. Here, the majority of the airports are observed to experience a reduction in DA, while a minority of them show a tendency towards increased DA. Our data reveal that there are 152 airports that display DA changes within the range of -100 to 0 feet, which can be attributed to the predicted alterations in surface air pressure. This subset represents a significant 62.6% of all surveyed airports. Furthermore, 25 airports, amounting to 10.3% of the total number, show DA shifts ranging from -200 to -100 feet due to similar changes in surface air pressure. In comparison, the number of airports experiencing DA changes within the range of 0 to 100 feet due to projected surface air pressure changes appears to be relatively minimal.
While the effects of temperature changes on DA are broad and generally increasing, surface pressure changes can lead to both increases and decreases in DA, depending on the geographical region. This illustrates the complexity of DA changes and the need for region-specific adaptive strategies in aviation. What seems apparent from these findings is that, in most airports, the anticipated changes in surface air pressure are likely to counterbalance the impact of temperature changes on DA. This suggests a nuanced interplay between different atmospheric variables in influencing DA, making it crucial for future climate models and aviation planning to consider these combined effects.
From our analysis, it's evident that compared to the impacts of projected surface air temperature variations on DA, the influence of projected surface pressure changes on DA is relatively less pronounced. This analysis holds true even though the projected variations for both temperature and pressure appear to be of similar magnitudes. The reason behind this phenomenon can be attributed to the manner in which DA responds to changes in temperature and surface pressure. Specifically, DA varies in direct proportion to the changes in temperature and surface pressure with respect to their respective base values. That is, a unit change in temperature or surface pressure from their base values will result in a proportional change in DA. However, it's critical to note that the base values of surface air pressure are significantly larger than those of surface air temperature. As a result, even though temperature and pressure changes might be similar in magnitude, the relative changes in temperature from its base values tend to be more significant than those of surface pressure from its larger base values. This results in temperature variations having a more pronounced effect on DA changes compared to surface pressure variations. Therefore, it's crucial that this differential sensitivity of DA to temperature and pressure changes be considered in the modeling of future climate scenarios and the development of responsive strategies in aviation planning.
4. Concluding Remarks
This study critically assesses the extent to which climate change, projected to culminate by the end of the 21st century, will impact the DA changes at Chinese airports during the summer months. We have found that climate change is expected to significantly increase the DA at all Chinese airports. The anticipated increase in DA ranges between 300 and 800 feet, illustrating the profound impact of these climatic changes.
Furthermore, our analysis suggests that the projected temperature increases will invariably lead to a rise in the DA at all Chinese airports. However, the situation is more nuanced when considering the projected pressure changes. In most Chinese airports, it is expected that there will be an increase in pressure by the end of the 21st century, which tends to counteract the effects of the temperature on the DA. In contrast, certain airports located in the eastern regions of China are predicted to experience a decrease in pressure by the end of the 21st century. This decrease in pressure coupled with an increase in temperature tends to amplify the effects on DA, thereby creating a challenging environment for aviation operations.
Our research, while comprehensive, mainly focuses on the average effects of projected pressure and temperature changes on DA. The analyses are premised on the mean states of temperature and pressure over a 20-year period from 1981 to 2100. However, it is worth noting that aviation performance is often more dependent on the instantaneous status of DA rather than the mean states. As such, the real-time DA status may fluctuate more than the average states, posing additional challenges to aviation operations.
To alleviate the potential impact of climate change on airport operations, it is imperative to develop innovative technologies and procedures to minimize the effects of DA on airport operations. For instance, we need to explore the potential of advanced aircraft designs and materials that can enhance performance at high-Das [27]. Noteworthy strides have been made in this regard, with engine manufacturers having developed engines with improved performance at high-DAs [28]. Moreover, aircraft manufacturers are now incorporating wing designs that generate more lift at high-DAs [29]. Beyond aircraft design, improvements in air traffic management systems have been made to optimize aircraft routes and reduce delays related to DA [30]. These collective efforts highlight the significant potential for technological advancements and strategic planning to help mitigate the challenges of climate change on aviation operations.
Acknowledgments
This research was supported financially by the Key Laboratory of Flight Techniques and Flight Safety, Civil Aviation Administration of China (Grant No. FZ2020ZZ05), the Fundamental Research Funds for the Central Universities (Grant No. JG2022-24), and Sichuan Science and Technology Program (Grant No. 2022YFS0540).
Conflicts of Interest
The authors declare no conflict of interest. The funders had no role in the design of the study; in the collection, analyses, or interpretation of data; in the writing of the manuscript, or in the decision to publish the results.
References
- Goodman; J., C.; Griswold, S.; D., J. Climate Impacts on Density Altitude and Aviation Operations. Journal of Applied Meteorology and Climatology 2018, 57, 517–523. [CrossRef]
- Daidzic; E, N. Aircraft takeoff performance in high-density-altitude conditions. Journal of Aircraft 2012, 49, 1201–1210.
- Padfield; D, G. Helicopter flight dynamics: the theory and application of flying qualities and simulation modelling. John Wiley & Sons 2008 Apr 15.
- Collins; M. Into thin air: What density altitude really means. Aircraft Owners and Pilots Association 2016, 3 rules of thumb for fl.
- Hoover; L, A. Density altitude and aircraft performance. . Yakima Washington Pilots Association FAA Wings Seminar, Canyon Flying, 19 pp 2010.
- J, H. Density Altitude Turns Bold Pilots into Old Pilots. If you Survive! T-craft aero club newsletter 2015, 12, 1–2.
- Wright; J., C.; Palmer; L., J.; Scott; A.., M. The effects of high-density altitude on aircraft performance: A review of the literature. Journal of Aeronautics and Aerospace Engineering 2010, 2, 24–31.
- Bowen; S, I. The most important equation in all of aerodynamics. Journal of Applied Meteorology and Climatology 2005, 44, 854–860.
- Kroes; Michael; Rardon; James; Nolan; Michael. Aircraft Basic Science, Eighth Edition; New York, NY: McGraw-Hill Education, 2013. [Google Scholar]
- Wells; Alexander; Young; Seth. Airport Planning & Management (eBook); New York, NY: McGraw-Hill Education, 2004. [Google Scholar]
- Veronika; Eyring; Sandrine; Bony; Meehl; A., G.; Senior; A., C.; Bjorn; Stevens; et al. Overview of the Coupled Model Intercomparison Project Phase 6 (CMIP6) experimental design and organization. Geoscientific Model Development 2016, 9, 1937–1958. [CrossRef]
- Eyring, V.; Cox, P. M.; Flato, G. M.; Gleckler, P. J.; Abramowitz, G.; Caldwell, P.; Collins, W. D.; Gier, B. K.; Hall, A. D.; Hoffman, F. M.; et al. Taking climate model evaluation to the next level. Nature Climate Change 2019, 9, 102–110. [Google Scholar] [CrossRef]
- Zelinka; D., M.; Coauthors. Causes of Higher Climate Sensitivity in CMIP6 Models. Geophysical Research Letters 2020, 47, e2019GL085782. [CrossRef]
- Masson-Delmotte; Valérie; Zhai; Panmao; Pirani; Anna; Connors; L, S.; Péan; Clotilde; et al. Climate change 2021: the physical science basis. Contribution of working group I to the sixth assessment report of the intergovernmental panel on climate change 2021, 2.
- Amante; Christopher; Eakins; W, B. ETOPO1 arc-minute global relief model: procedures, data sources and analysis. National Geophysical Data Center, Boulder, CO. 2008.
- Halperin; J., D.; Guinn; A., T.; Strazzo; E., S.; Thomas; L., R. Density Altitude: Climatology of Daily Maximum Values and Evaluation of Approximations for General Aviation. Weather, Climate, and Society 2022, 14, 1083–1097. [CrossRef]
- Guinn; Thomas; Barry; Randell. Quantifying the Effects of Humidity on Density Altitude Calculations for Professional Aviation Education. International Journal of Aviation, Aeronautics, and Aerospace 2016, 3. [Google Scholar]
- McRae; Evans, M. A risk-based approach to planning aircraft acquisitions in a warming climate. Villanova University 2019.
- Administration, F. A. FAA-H-8083-2A, Risk management handbook. 2022.
- Administration, F. A. Weather FORCES, SOURCES, and RESOURCES. 2015.
- Administration, F. A. FAA-H-8083-28, Aviation Weather Handbook. 2022.
- Administration, F. A. Helicopter flying handbook. 2019.
- Administration, F. A. Aviation weather services. FAA Advisory Circular 0045H, Change 1. 2014, 346 pp.
- Administration, F. A. Pilot's Handbook of Aeronautical Knowledge (FAA-H-8083-25C). 2023.
- Force, U. S. A. Aircraft performance engineering for reciprocating engines. Air Force Manual 1954, 367 pp.
- Force, U. S. A. Weather for aircrews. Department of the air force 1997. [Google Scholar]
- Gudmundsson; S. General Aviation Aircraft Design: Applied Methods and Procedures. Butterworth Heinemann 2013.
- Geng; J.; He; Y.; Luo; J. Research on the performance improvement of aero engines at high density altitudes. Journal of Engineering for Gas Turbines and Power 2016, 138, 062602.
- Kroo; I. High lift and high-density altitude performance in aircraft design. Journal of Aircraft 2006, 43, 1–12.
- Sridhar; B.; Chen; Y., N.; Ng; K, H. Air traffic management in high-density altitude operations: Challenges and opportunities. Transportation Research Part C: Emerging Technologies 2011, 19, 1045–1060.
Figure 1.
The spatial distributions of Chinese terrain height (m) (a); and the Mean summer DA (1000*ft) of Chinese airports in 1995-2014 periods (b); and the projected DA changes (ft) in 2081-2010 periods (c).
Figure 1.
The spatial distributions of Chinese terrain height (m) (a); and the Mean summer DA (1000*ft) of Chinese airports in 1995-2014 periods (b); and the projected DA changes (ft) in 2081-2010 periods (c).
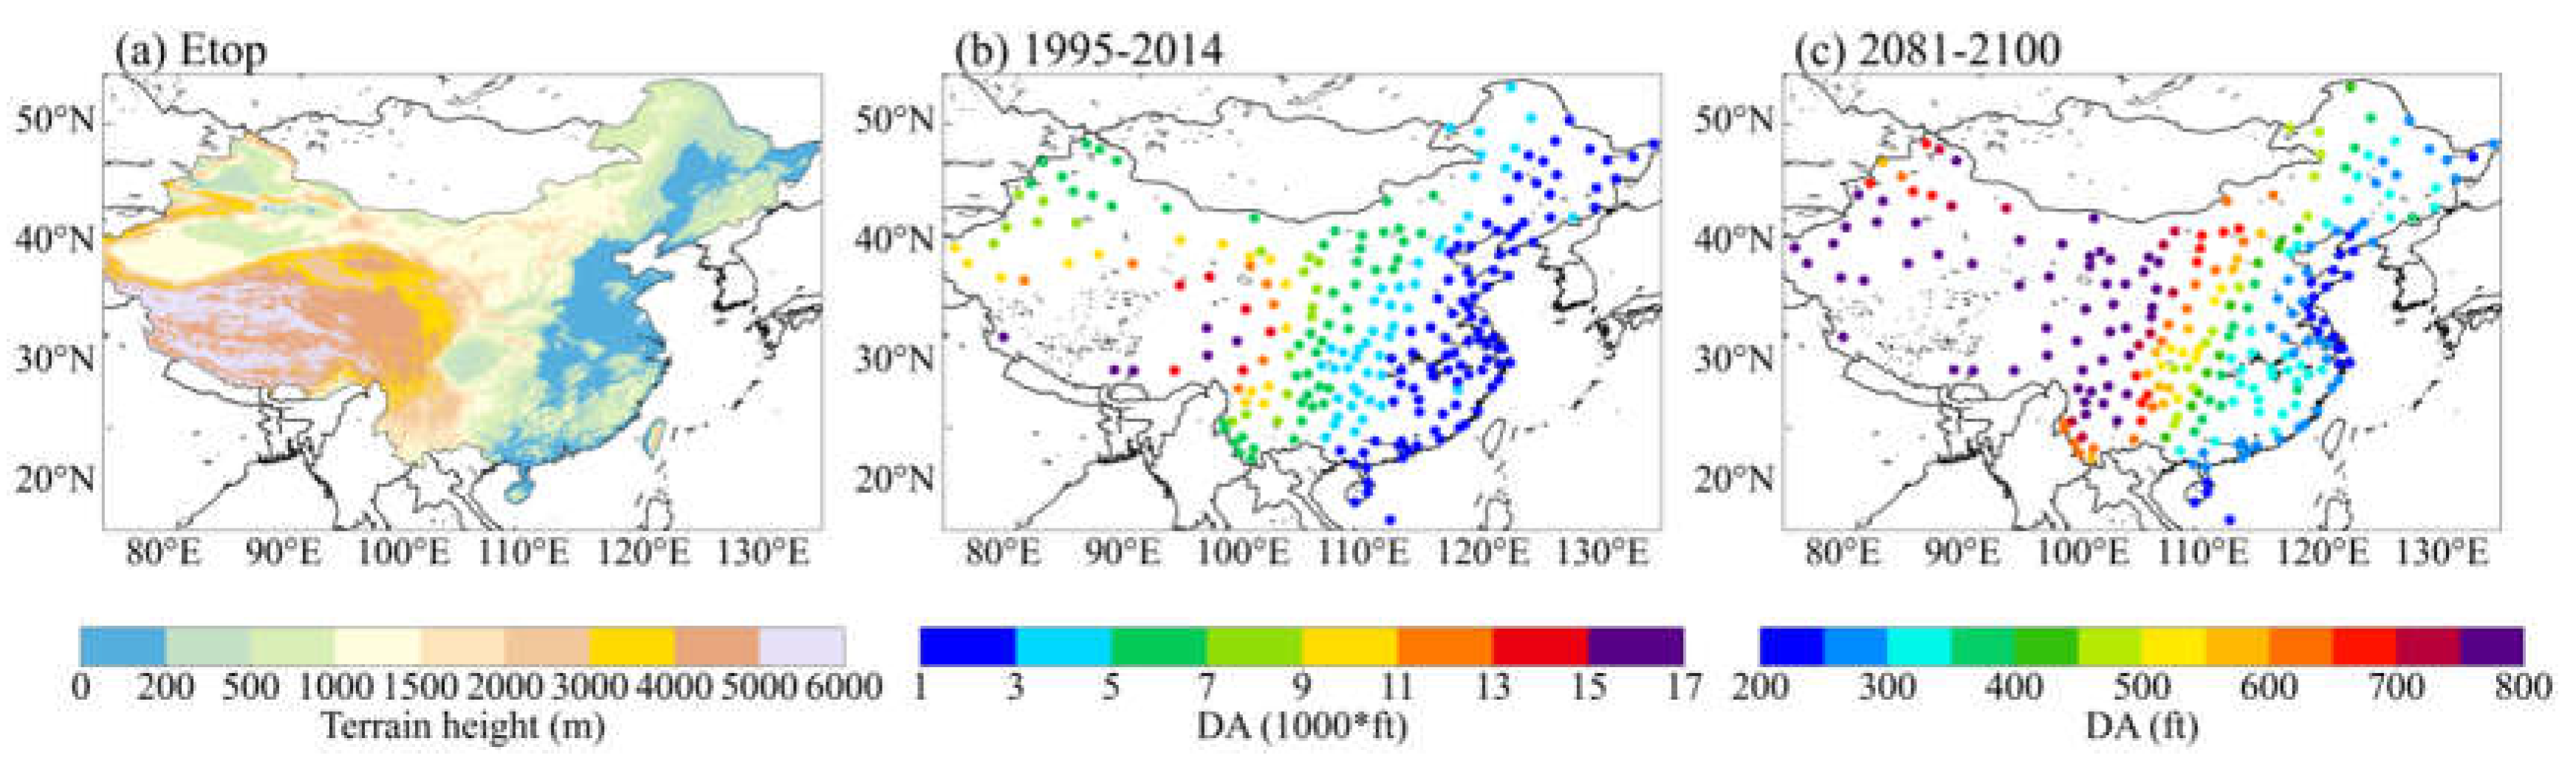
Figure 2.
Frequency of occurrence in number of airports for projected DA changes.
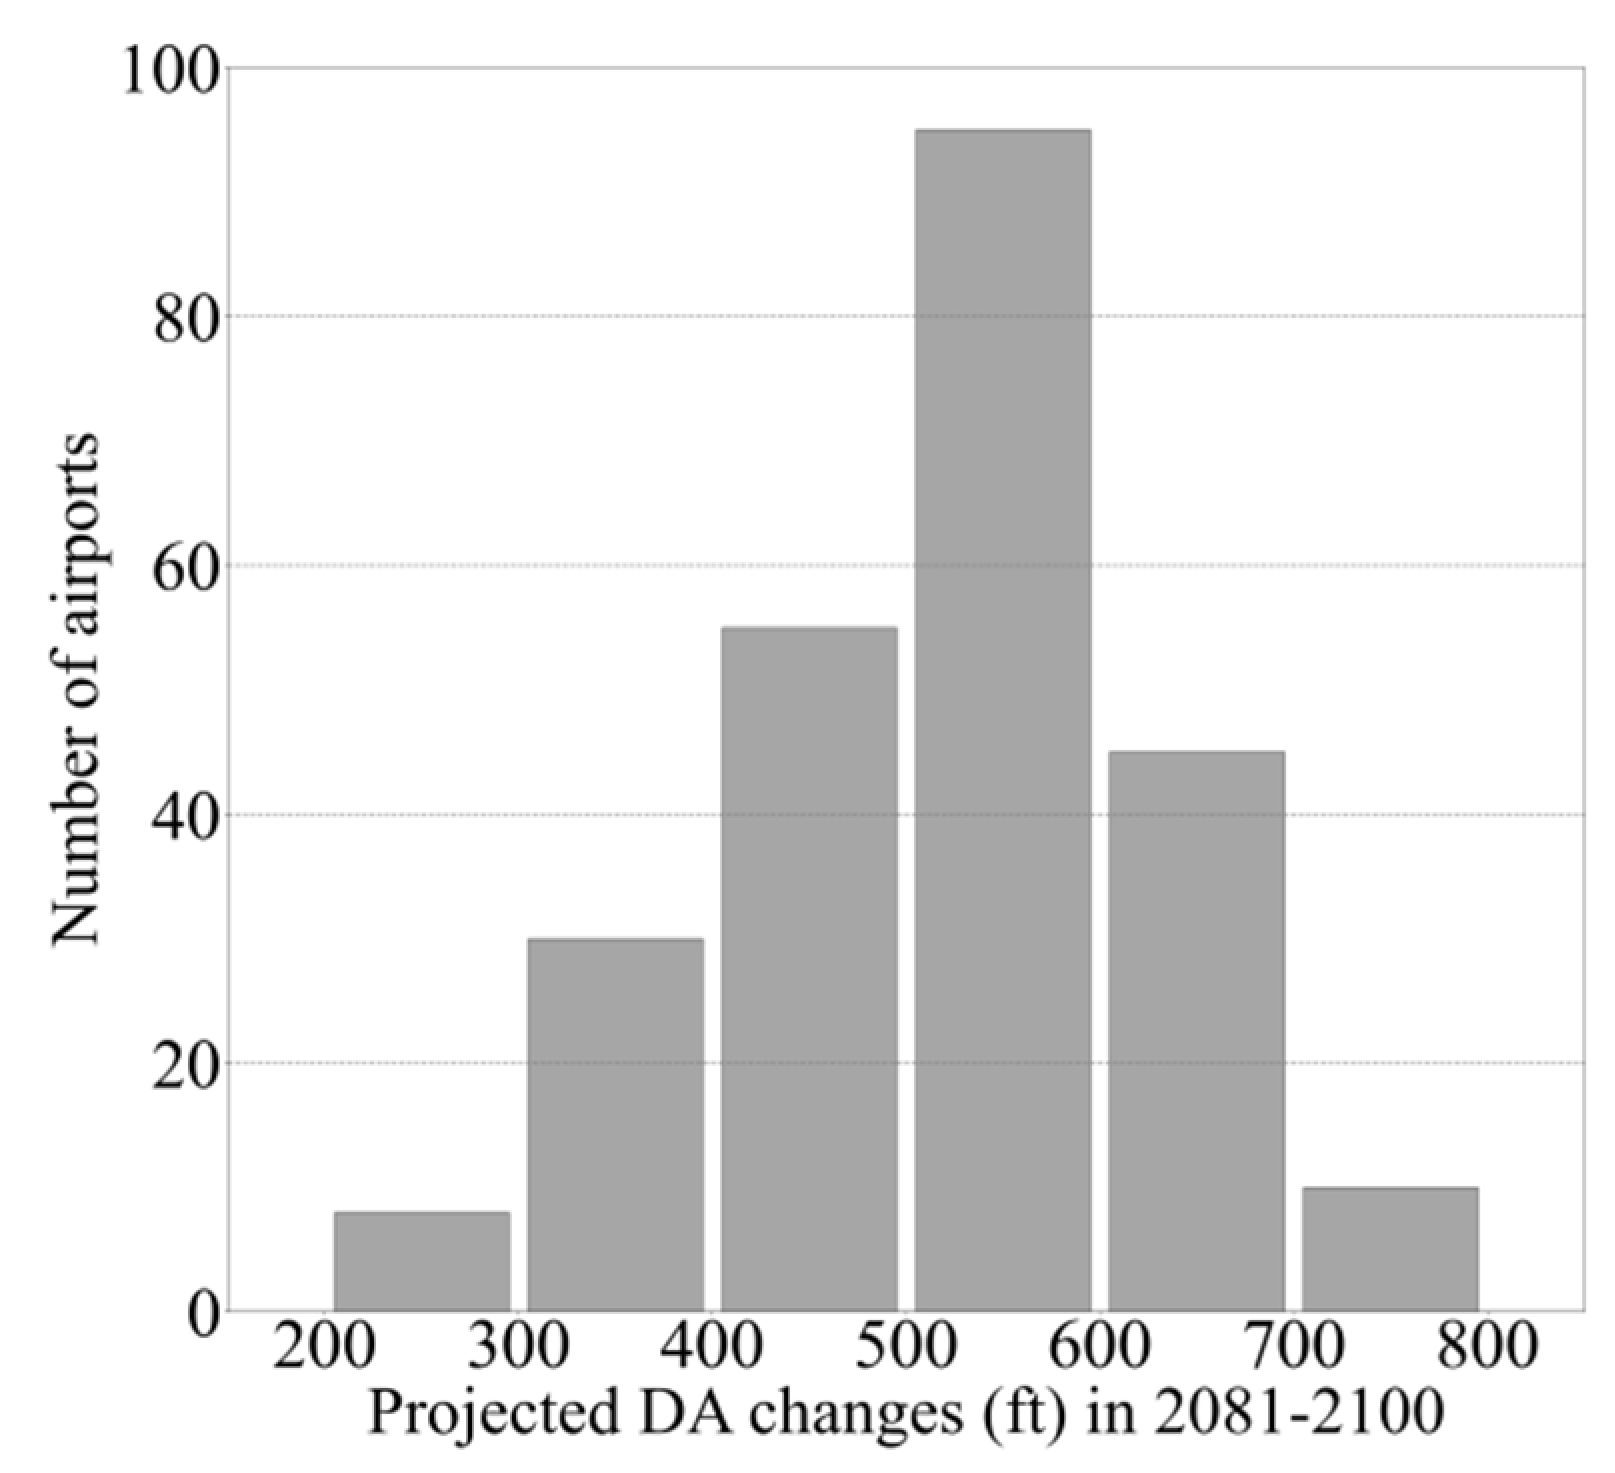
Figure 3.
The spatial distribution of temperature contributed DA changes (ft) (a) and projected temperature changes (℃) (b) for Chinese airports in 2081-2100 periods.
Figure 3.
The spatial distribution of temperature contributed DA changes (ft) (a) and projected temperature changes (℃) (b) for Chinese airports in 2081-2100 periods.
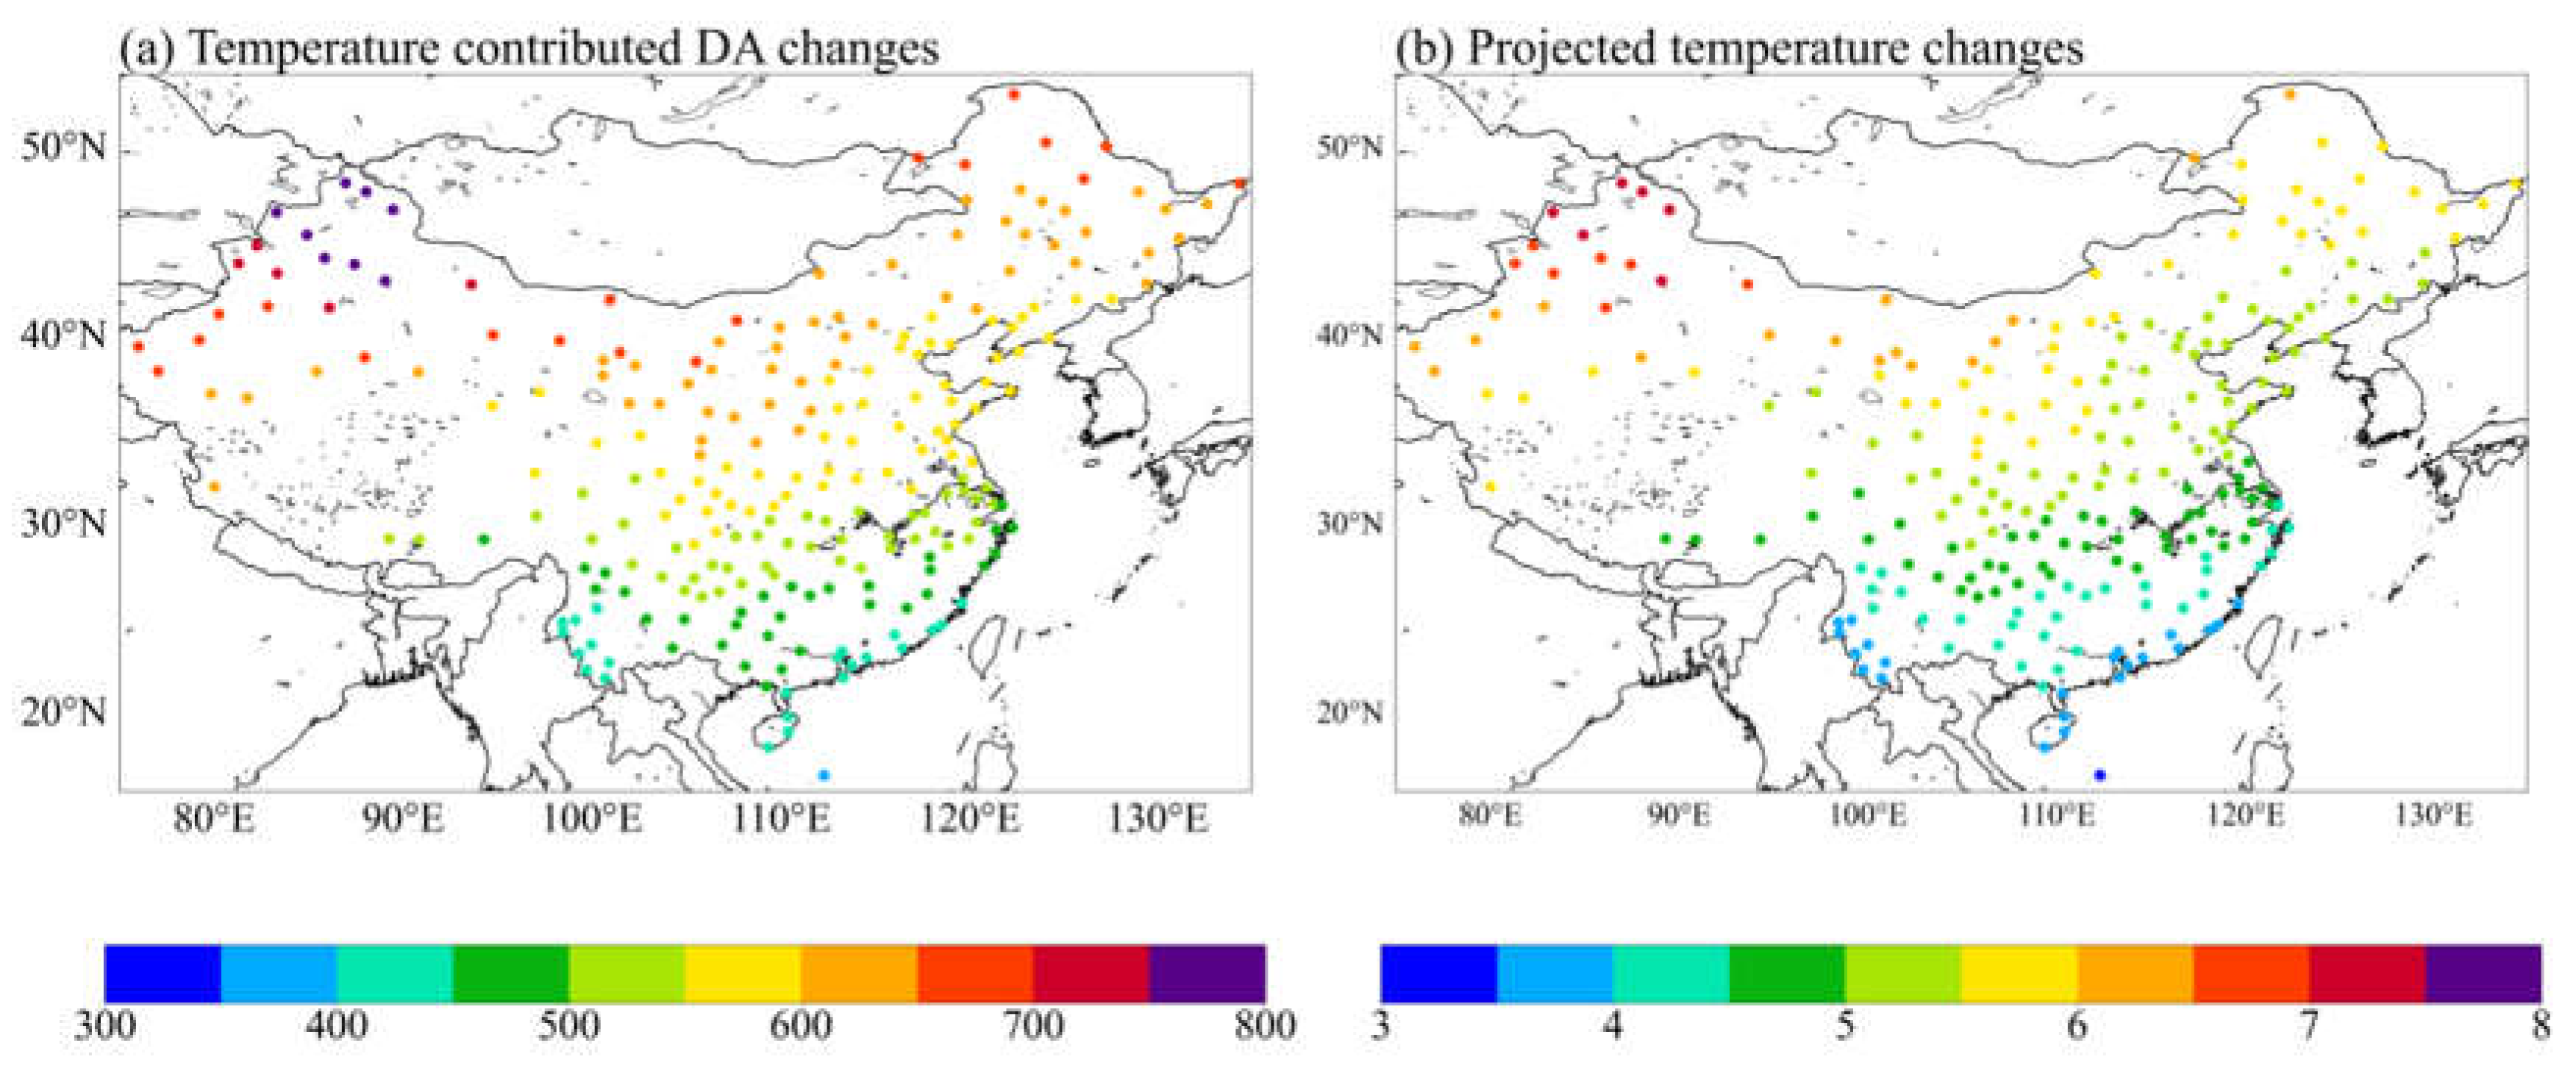
Figure 4.
Frequency of occurrence in number of airports for temperature contributed DA changes.
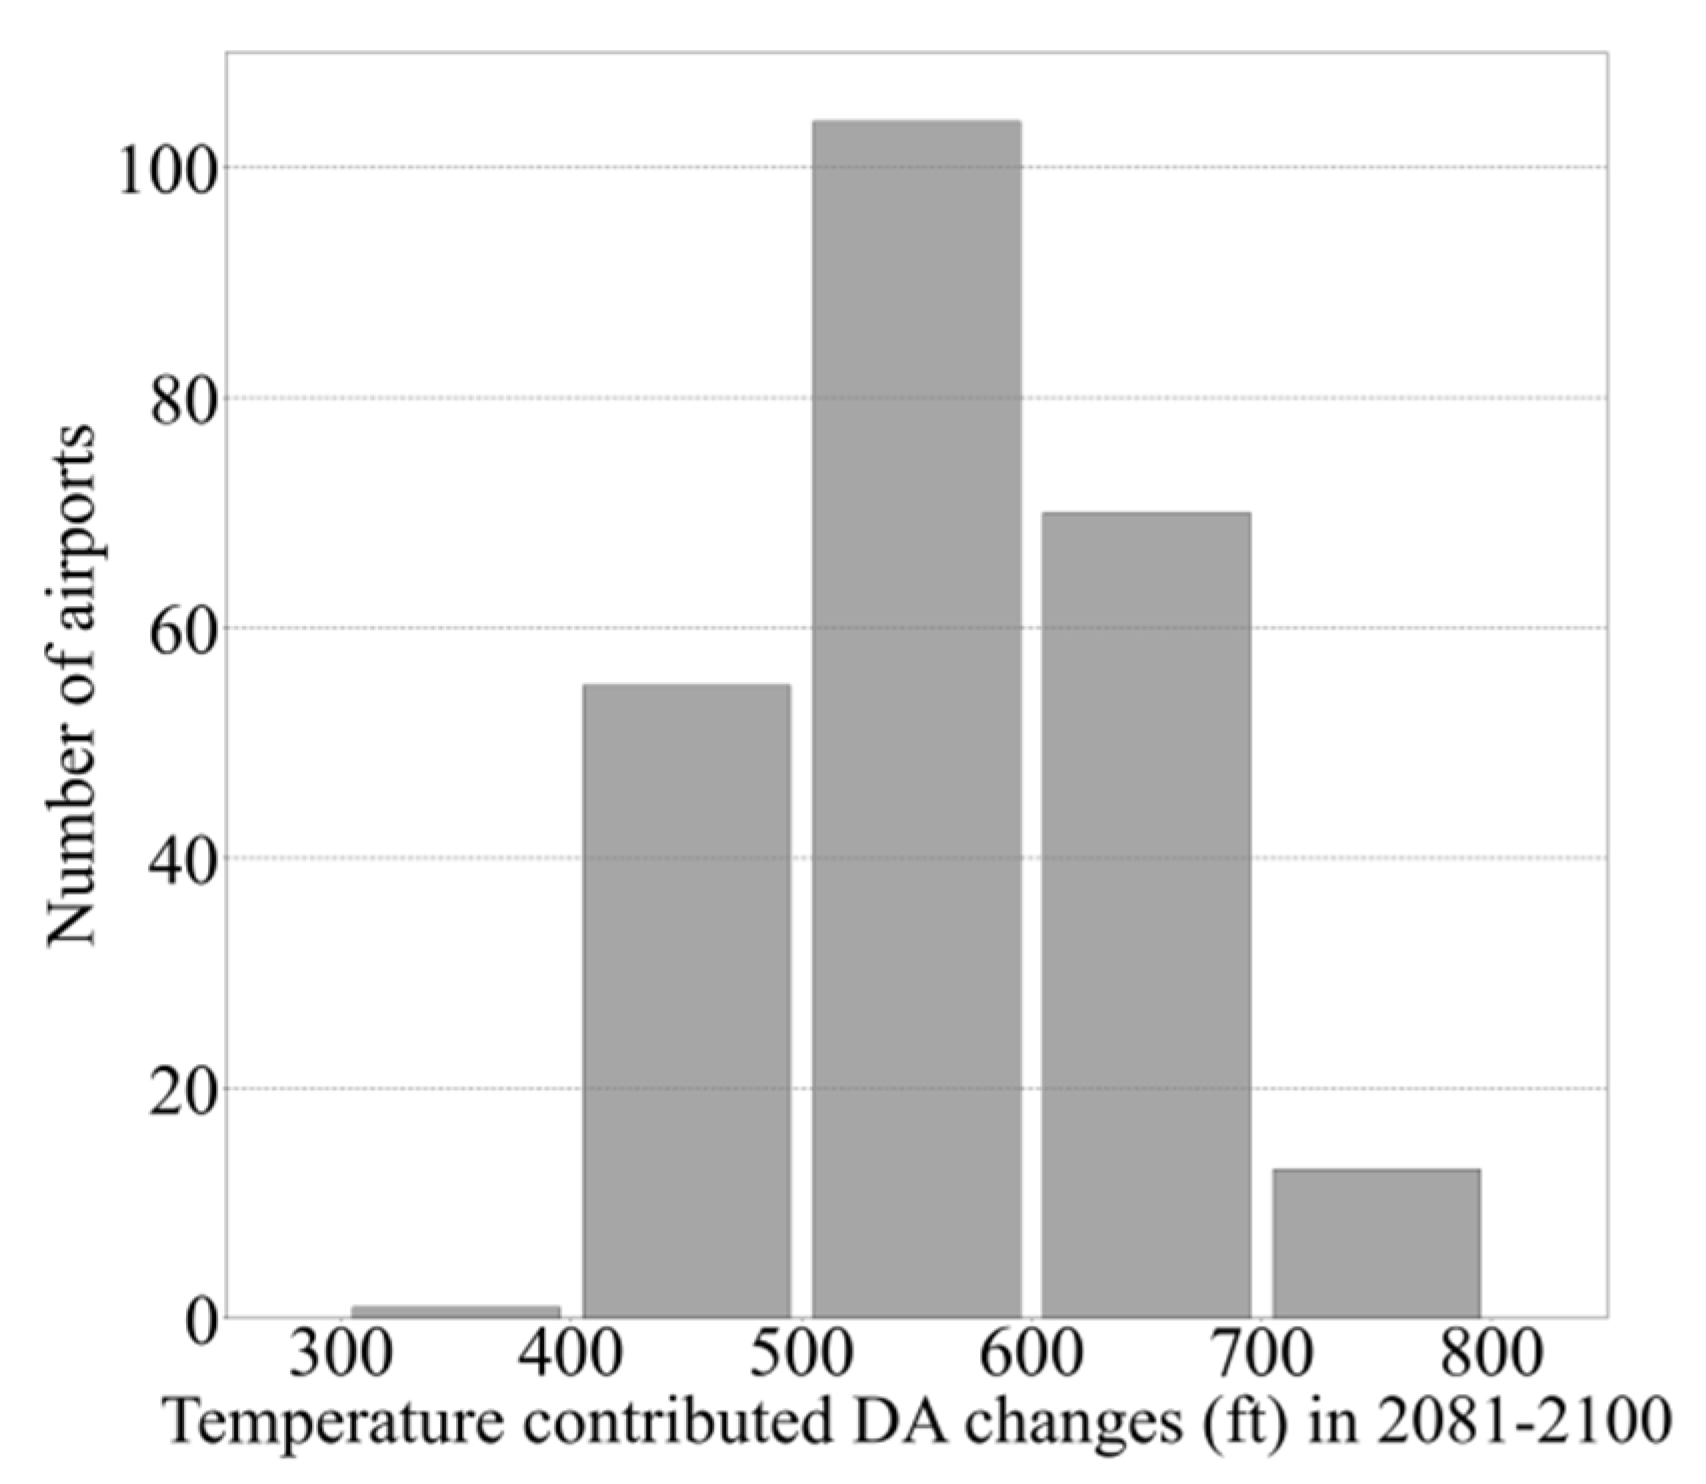
Figure 5.
the spatial distribution of Pressure contributed DA changes (ft) (a) and projected temperature changes (℃) (b) for Chinese airports in 2081-2100 periods.
Figure 5.
the spatial distribution of Pressure contributed DA changes (ft) (a) and projected temperature changes (℃) (b) for Chinese airports in 2081-2100 periods.
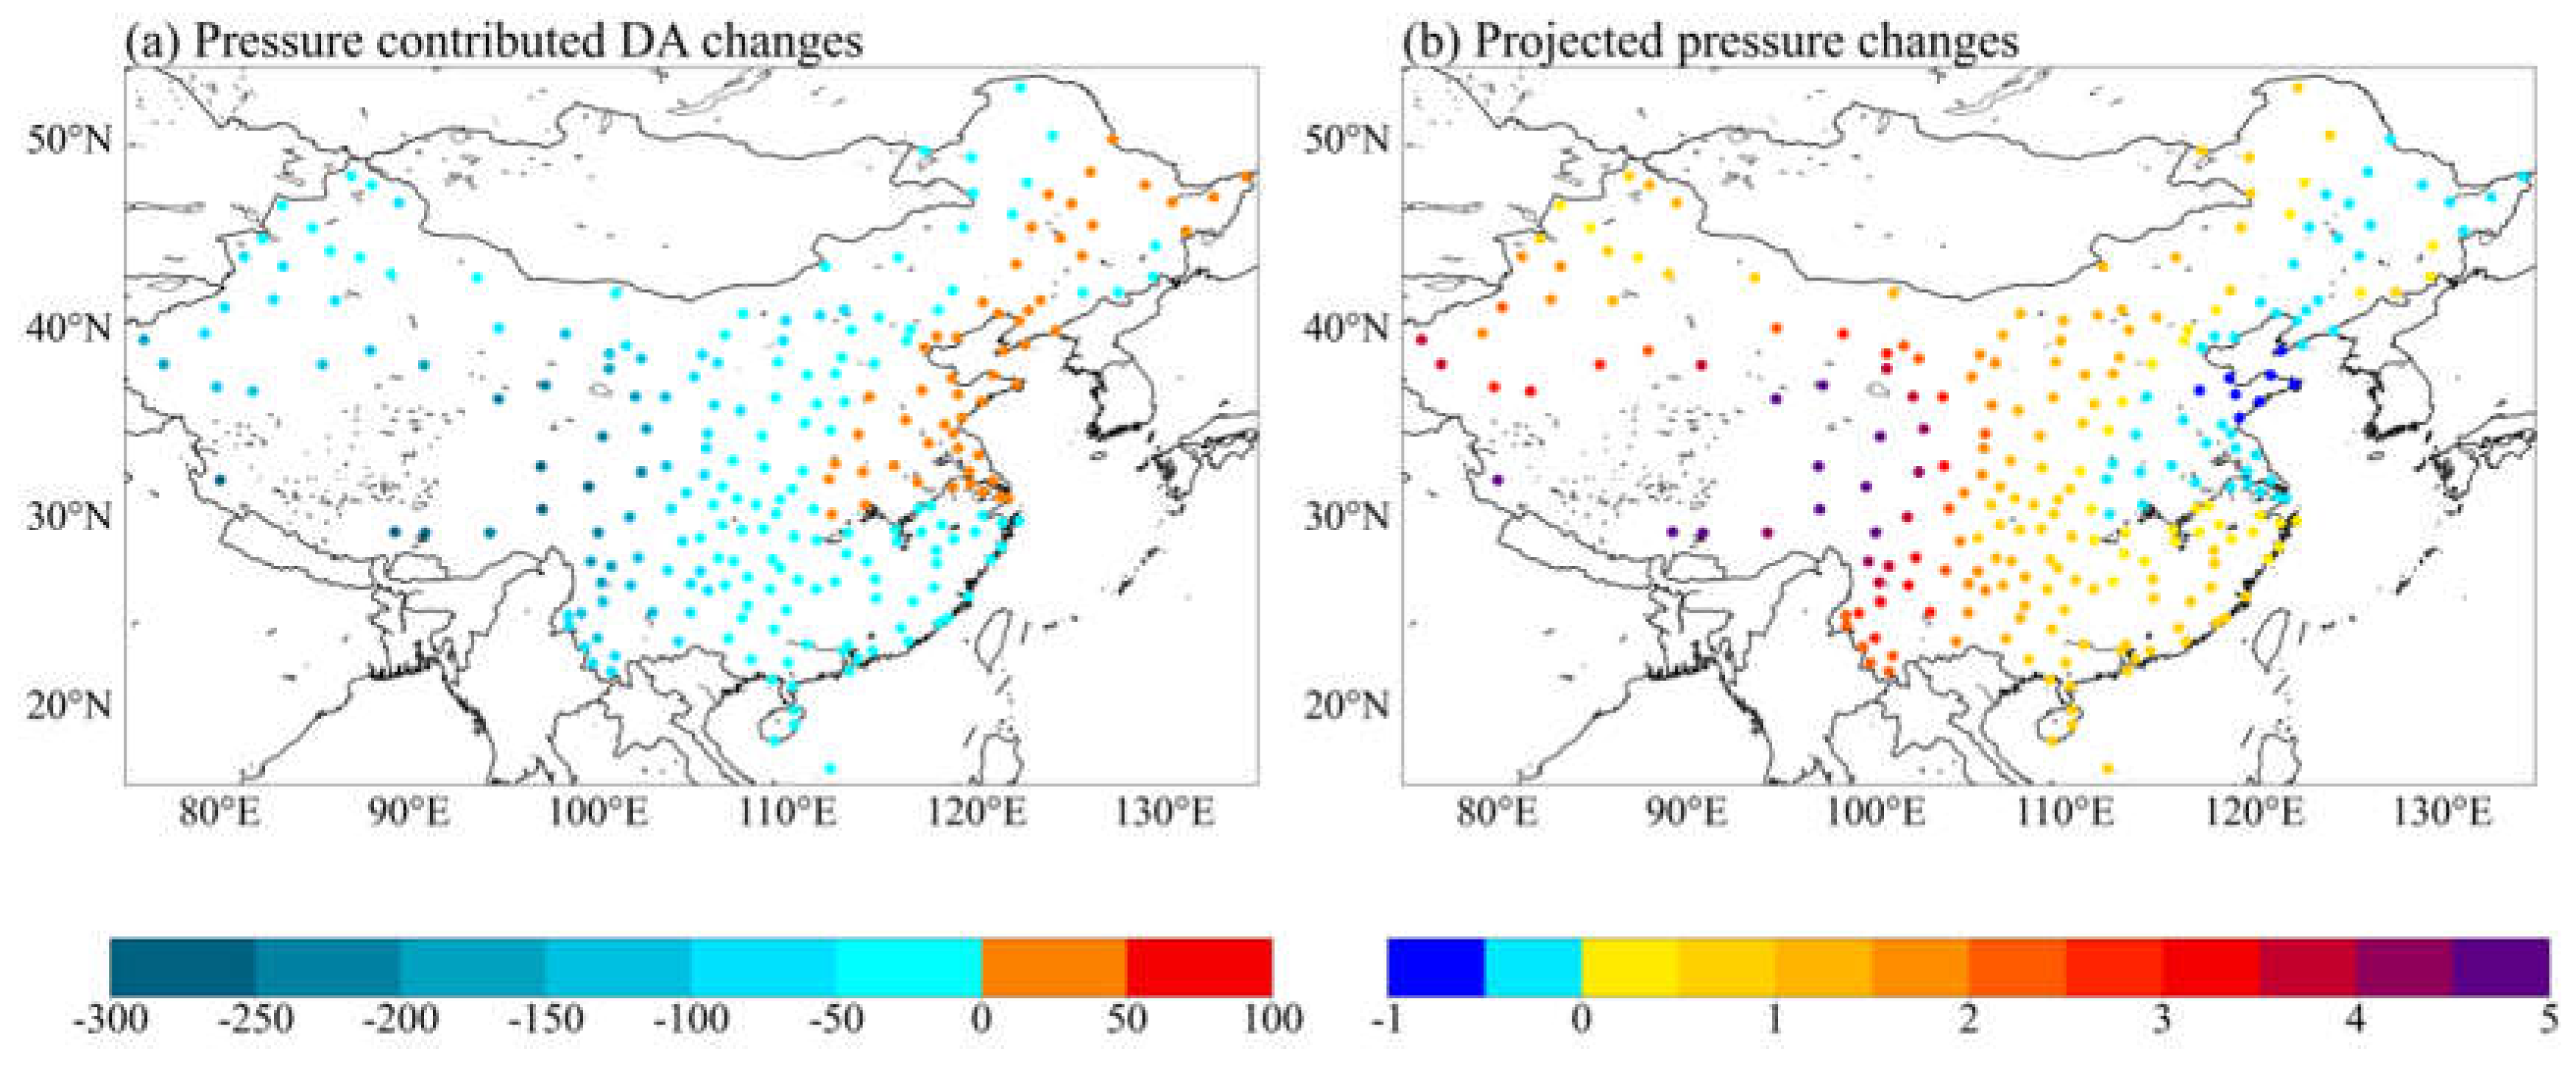
Figure 6.
Frequency of occurrence in number of airports for pressure contributed DA changes.
Disclaimer/Publisher’s Note: The statements, opinions and data contained in all publications are solely those of the individual author(s) and contributor(s) and not of MDPI and/or the editor(s). MDPI and/or the editor(s) disclaim responsibility for any injury to people or property resulting from any ideas, methods, instructions or products referred to in the content. |
© 2023 by the authors. Licensee MDPI, Basel, Switzerland. This article is an open access article distributed under the terms and conditions of the Creative Commons Attribution (CC BY) license (http://creativecommons.org/licenses/by/4.0/).
Copyright: This open access article is published under a Creative Commons CC BY 4.0 license, which permit the free download, distribution, and reuse, provided that the author and preprint are cited in any reuse.


