

Submitted:
29 October 2023
Posted:
30 October 2023
You are already at the latest version
Abstract
The rising global concern for environmental sustainability has driven a surge in green invest-ments' popularity. This study examines the multifractal characteristics and efficiency of various green stock indexes, such as Clean Science and Technology, ISE Clean Edge Global Wind Energy Index, iShares Global Clean Energy ETF, Nasdaq Clean Edge Green Energy, and Solactive Clean Energy. The research covers the period from October 4, 2021, to October 4, 2023. The central ob-jective of this research is to evaluate the efficiency of clean energy stock markets and dissect their influence on investment decisions and market performance in the realm of green investments. To accomplish this, the study employs the Wright test (2000) and the Detrended Fluctuation Analysis (DFA) method. The findings indicate the presence of negative serial autocorrelation within the Rankings and Signals tests. Furthermore, the DFA analysis concurrently reveals long memory patterns in most green indexes, with the notable exception being the Nasdaq Clean Edge index, which exhibits tendencies toward anti-persistence. These results imply that prices inadequately incorporate available information, resulting in non-i.i.d. price fluctuations. These implications are significant for investors, as they indicate the potential for predictable returns and opportunities for arbitrage and abnormal profits, challenging the assumptions of random walk and information efficiency hypotheses.
Keywords:
Serial autocorrelation
; Stock markets
; Green energy
; Sustainability
1. Introduction
The global financial crisis of 2008, coupled with escalating environmental degradation, prompted policymakers to formulate strategies aimed at promoting a green and sustainable economic paradigm. This involved the implementation of measures to curtail greenhouse gas emissions, epitomized by the Paris Agreement, and championing a circular economy, exemplified by initiatives like the American and European Green Deals. Consequently, businesses restructured their models to prioritize socially responsible and sustainable investments, now considered standard practice for market participants, drawing the attention of both investors and traders. Within this framework, environmental, social, and corporate governance, socially responsible investment, responsible investment, sustainable investment, and the adoption of clean energy are paramount themes [1,2].
The authors in study [3] emphasize the increasing demand for clean energy due to concerns about greenhouse gas emissions and reducing reliance on fossil fuels. Governments worldwide are setting higher targets for renewable energy and emissions reduction, leading to expanded investment opportunities in the clean energy sector. Companies involved in renewable energy solutions, such as solar panels and wind turbines, are experiencing rapid growth and offering attractive returns to investors. With growing environmental awareness, green investments are gaining popularity, particularly in the clean energy industry, which focuses on renewable sources such as solar, wind, hydroelectric, geothermal, and biomass [4].
The scarcity of fossil fuel reserves is another driving force behind the transition to clean energy. Although substantial reserves of oil, gas, and coal still exist in the ground, the extraction process has become more challenging and costly. This situation has resulted in fluctuating oil prices and concerns about energy security, especially for countries heavily reliant on fossil fuels, as they are susceptible to supply disruptions and price increases. Simultaneously, there have been remarkable advancements in clean energy technologies, particularly in the areas of solar and wind energy. These technologies have become increasingly profitable and efficient, making them a viable alternative to fossil fuels. Furthermore, there is a growing recognition of the economic benefits associated with clean energy, particularly in terms of job creation and the promotion of local economic development [5,6,7].Parte superior do formulárioParte superior do formulárioParte superior do formulário
The global recognition of clean energy as an alternative to dirty energy sources, such as crude oil, has been driven by several factors, including climate change, fossil fuel scarcity, innovations in clean energy technology, and volatile oil prices. In the 2015 Paris Climate Agreement, a wide range of countries committed to transitioning to climate-resilient economies. Consequently, following the 2015 Paris Climate Agreement, investments in clean energy stocks flourished due to the growing interest of investors and policymakers [8,9]
The shift to clean energy represents a significant transformation in the global energy landscape. It is driven by a complex interplay of factors, each contributing to the underlying dynamics of this transition. At the heart of the transition is a growing recognition of the environmental consequences of continued reliance on fossil fuels. Greenhouse gas emissions, primarily carbon dioxide from the burning of coal, oil, and natural gas, have contributed to the warming of the Earth's atmosphere, leading to a range of adverse effects such as rising sea levels, extreme weather events, and disruptions to ecosystems. This heightened awareness of climate change has led to global efforts to reduce emissions and limit global warming, with the 2015 Paris Climate Agreement and subsequent conferences like COP26 serving as critical milestones [10,11,12,13].
The reduction in energy consumption has led to a decrease in prices and necessitated production cutbacks [14]. During this period, tensions escalated between Saudi Arabia and Russia, two major oil-producing nations [15]. Faced with the ongoing price decline, Saudi Arabia proposed reducing oil production by oil-producing nations to stabilize market prices. However, Russia's refusal led to heightened tensions between the two countries and worsened the economic impact on the sector. The post-pandemic resurgence of economic activity in 2021 resulted in an imbalance between energy supply and demand, causing higher prices and market instability. Study [15] provided compelling data that establishes a strong correlation between economic activity and energy usage. The energy crisis that followed the pandemic was further exacerbated by the outbreak of hostilities between Russia and Ukraine, officially declared in the early months of 2022. As a result of the conflict, Russia disrupted energy supplies to European nations. This not only caused an energy crisis in Europe but also led to instability in the global energy market, as threats and geopolitical actions have varying impacts on price volatility, as indicated by the study [16].
The environmental consequences stemming from the development and widespread use of primary energy sources, particularly fossil fuels, have grown increasingly severe, posing significant threats to human well-being. Consequently, sustainable energy sources have garnered substantial global attention. Clean energy stocks have emerged as a distinct asset class, notably among market participants with environmental concerns. However, prior research has largely overlooked the strategies that clean energy investors might employ to mitigate negative risks. One notable gap in the current literature is the limited understanding of the efficiency of clean energy stock markets. The importance of this matter is paramount within the context of renewable and non-renewable energy sources, as well as the advancement of renewable energy technology. The significance of this issue can be observed from several perspectives. The efficiency of clean energy stock markets can directly influence energy consumption and economic sectors, thereby promoting job growth. Moreover, the link between market efficiency and the accuracy of pricing information establishes a strong connection, implying that the impact of clean energy stock markets can have implications for other sectors, including the fossil fuel market, such as crude oil. Furthermore, the efficiency of clean energy stock markets wields considerable influence over technological preferences and political support for renewable energy, thus impacting the trajectory of clean energy technology. Additionally, the extent of market inefficiency can serve as a significant tool for market regulators. By gaining a deep understanding of market inefficiencies, regulators can identify specific areas in need of improvement and strive to establish a more efficient market for renewable energy.
Addressing the research inquiry regarding potential serial autocorrelation within the price series of green indexes is crucial to understanding the efficiency of clean energy stock markets. The primary objective of this research endeavor is to conduct a thorough assessment of these markets. By diving into the intricacies of these markets, the study aims to reveal critical insights into their functionality, their interaction with investment decision-making processes, and their overall impact within the sphere of green investments.
The study comprises 7 distinct sections to systematically address the outlined research objectives. Section 2 explores an in-depth analysis of prior studies concerning the efficiency of clean energy stock indexes. Section 3 delineates the data utilized and the methodologies employed in addressing the research inquiries. Section 4 offers an extensive data analysis and interprets the acquired results. Section 5 engages in a comprehensive discussion of the findings. Section 6 presents well-grounded conclusions derived from the paper's results and discussions. Finally, Section 7 scrutinizes the practical implications emerging from the study's outcomes.
2. Literature Review
The concept of market efficiency was initially proposed in study [17], suggesting that the value of stocks upon their public introduction reflected the most comprehensive information available, establishing the best estimate of their worth. Subsequently, mathematician [18], aligned with the notion of market efficiency, observed that asset price behavior fluctuates randomly and unpredictably, signifying independence from previous fluctuations, consequently formulating the random walk hypothesis. The [18] work significantly contributed to what would become one of the most prominent theories in finance - the market efficiency hypothesis. Later scholars such as [19,20] reinforced the random walk hypothesis, indicating that investors could not affect future returns based on historical prices, thereby being unable to exploit what seemed to be a "perfect" market to attain the sought-after extraordinary returns. Subsequent studies like [21,22] bolstered the random walk hypothesis, portraying asset price behavior as a stochastic process where future predictions of securities are unaffected by their historical prices. Subsequently, [23] empirically tested asset price behavior using the random walk model, examining daily quotes from 30 Dow Jones Industrial Average indexes between 1957 and 1962. The outcomes corroborated the random walk model, indicating that asset prices lack memory, rendering future prices entirely unpredictable based on past prices. Additionally, the work [24] emphasized that confirming the market efficiency hypothesis necessitates specific conditions: the absence of transaction costs, universal information availability to all market participants, and consensus on the impact of information on current and future securities values. While the verification of these conditions is considered adequate, it is not essential, as these premises are not entirely achieved in real market scenarios.
Related Empirical Studies
In recent years, global events such as the COVID-19 pandemic in 2020 and the volatility of energy markets in 2022 have brought significant attention to the intricate relationship between clean and dirty energy sources. The COVID-19 pandemic presented an unexpected and unprecedented disruption in the global energy landscape. Lockdowns and reduced economic activity led to a sharp decrease in energy consumption, temporarily reducing greenhouse gas emissions. While this resulted in lower pollution levels, it also underscored the global energy system's dependence on fossil fuels. The pandemic served as a warning, emphasizing the need to transition to cleaner energy sources to mitigate climate change. The year 2022 witnessed significant fluctuations in energy markets. This volatility, often influenced by geopolitical tensions and supply-demand dynamics, highlighted the fragility of relying on fossil fuels for energy security. The unpredictability of energy prices and supply disruptions underscored the need for diversification and resilience in the energy sector. Renewable energy sources, with their inherent stability and sustainability, have gained prominence as a potential solution to mitigate such volatility.
Studies [25,26,27] conducted investigations into long-term memory within cryptocurrency markets. Utilizing a sliding window approach, [25] highlighted that the generalized Hurst exponents in the Bitcoin market surpass 0.5, suggesting the presence of long-term memory. Furthermore, [26] identified multifractal characteristics within the series and indicated that both long-range correlations and the presence of fat-tailed distributions contribute to the multifractal behavior of Bitcoin. [27] underscored significant asymmetric features in cross-correlation, displaying persistence and multifractality in the majority of cases. Among cryptocurrencies, Bitcoin and Litecoin demonstrate the most multifractal behavior, whereas Monero and Ripple typically exhibit relatively lower multifractal characteristics.
Refs [28,29] delved into the dynamics of efficiency and long-term memory in major globally traded currencies. [28] found higher efficiency levels in the JPY and CHF foreign exchange markets. They observed that the impact of trading volume on efficiency is only significant for JPY and CHF. The GBP seems to be the least efficient, followed by the EUR. [29] demonstrated that the four exchange rate series exhibit significant multifractal properties across timescales, and the yen has the lowest multifractal properties among the four exchange rate series, indicating the highest market efficiency.
Studies [30,31] delved into the multifractal non-trending fluctuation of various international markets. [30] examined the comparative efficiency of 12 Islamic and conventional stock markets. The findings indicate that developed markets are relatively more efficient, followed by BRICS stock markets. The comparative efficiency analysis shows that almost all Islamic stock markets, excluding Russia, Jordan, and Pakistan, are more efficient than their conventional counterparts. [31] explored the market efficiency hypothesis for 22 sectors of the European credit market. The authors concluded that all Eurozone credit market sectors exhibit multifractal nature and are marked by a persistent long-memory phenomenon in their short and long-term components.
The studies conducted by [32,33] examined the presence of long memory in both conventional markets and clean energy stock indexes. The investigation [33] analyzed the price of crude oil, the New York Stock Exchange (NYSE), and the S&P Global Clean Energy Index. The findings illustrate that the clean energy index appears to have a greater time series dependency than the others and is less exposed to the price of oil than the NYSE market. The authors in [32] examined market efficiency in its form in clean energy stock indexes. The authors revealed asymmetric multifractality in the US, European, and global clean energy stock indexes. They observed higher efficiency in the upward trend in European and global clean stock indexes, while the US market is less efficient when the market trends upward. The market inefficiency measure, varying over time, suggests that US clean energy reserves are becoming relatively more efficient over time.
Studies [34,35] conducted evaluations pertaining to the efficiency of markets for renewable energy and fossil fuels. [34] have provided evidence indicating that the rising and decreasing patterns observed in China's clean energy stock indexes exhibit notable multifractal features. The Chinese clean energy stock market exhibits significant inefficiency, irrespective of the magnitude of changes. According to a study by [35], the negative effects of the pandemic are more severe for fossil fuel industries than for businesses involved in renewable energy. Moreover, it was seen that clean energy enterprises had superior success amongst the pandemic as a result of heightened investor focus, while fossil fuel corporations did not manifest any notable progress.
The research conducted in studies [36,37] was aimed at examining the intricate interrelationships between indexes comprising clean energy stocks and metals that are pivotal in fueling the demand for clean energy solutions. In their study, [36] observed that the multifractality of markets experienced a notable increase during the upheavals caused by the 2020 pandemic, while market efficiency demonstrated a decline. A detailed analysis revealed that the S&P Global 1200 Carbon Efficient index displayed the highest degree of multifractality but the lowest efficiency. In contrast, the S&P Global Clean Energy index exhibited relatively lower multifractality but a greater degree of efficiency. The insights provided by [37] highlighted statistically significant non-linear connections existing between the studied markets. Their research underlined that nearly all energy-sensitive metals, with the exception of cobalt, showcased significant and positive associations with indexes tracking clean energy stocks. This vital research emphasized the necessity of comprehending and examining the dynamic relationships between energy-sensitive metals and the stock markets focused on clean energy. This comprehension is particularly critical considering the substantial surge in investments being directed towards clean energy stocks and the frequent recurrence of periods marked by uncertainty within the financial markets.
The study conducted by [38] brought to light some intriguing findings regarding the market dynamics of clean energy stocks. Despite the historical perception of this market as having lower liquidity compared to more traditional financial markets, their research revealed that the clean energy stocks index displayed a somewhat lower efficiency. This assessment was based on an analysis of short-term integration between clean energy stocks and another related market. Furthermore, considering the recent surge in investments within the clean energy sector, these findings hold significant implications. The research concluded by suggesting that the clean energy stock market is gradually progressing toward achieving parity in terms of price equilibrium and information discovery.
Conversely, the study conducted by [39] delved into the evaluation of market efficiency by examining sustainable stock indexes in comparison to traditional markets. Their analysis encompassed a period spanning from 2018 to 2023. In the course of this study, the empirical data uncovered that the return data series exhibited indications of both efficiency and inefficiency, signifying a complex and multifaceted financial landscape. Furthermore, their research highlighted a distinct negative autocorrelation observed among specific markets, such as the crude oil market, the Clean Energy Fuels index, the global clean energy index, the gold market, and the natural gas market.
In conclusion, the escalating environmental damage due to the widespread utilization of primary energy sources, particularly fossil fuels, has posed severe adverse impacts on human life. Consequently, the emergence and utilization of clean energies have garnered widespread global attention. Despite clean energy equities emerging as a novel asset class, particularly appealing to environmentally conscious investors, previous studies have given minimal consideration to how investors in clean energy markets can mitigate their negative risk. Overall, understanding the efficiency of clean energy markets holds significant importance, as it empowers investors to make informed decisions about investment placements. The act of making well-informed decisions has the potential to significantly impact the advancement and widespread adoption of clean energy technology.
3. Material and Methods
3.1. Materials
The data employed in this investigation comprises daily price indexes. The sample encompasses various green stock indexes, including Clean Science and Technology (CLEA.NS), ISE Clean Edge Global Wind Energy Index (GWE), iShares Global Clean Energy ETF (ICLN.O), Nasdaq Clean Edge Green Energy (CELS), and Solactive Clean Energy (COLCLNNEP), spanning from October 4, 2021, to October 4, 2023. Examining sustainable energy indexes holds significant importance from the perspective of sustainability and innovation. These subsectors collectively represent a diverse landscape of sustainable energy solutions and studying them contributes to numerous critical aspects: fostering innovation, resource optimization, market insights, environmental impact, policy alignment, and technological convergence. The data were sourced via the Thomson Reuters Eikon platform and are represented in US dollars.
3.2. Methods
The research will progress through several stages. Graphs of the markets will be constructed at both levels and returns to assess the evolution of the markets under analysis. The sample will be characterized using descriptive statistics to verify whether the data follows a normal distribution. To determine the stationarity of the time series, the panel unit test proposed by [40] will be employed, which involves the Fisher Chi-square and Choi Z-stat tests. The Fisher Chi-square, also known as the Pesaran and Pesaran test, evaluates the cross-sectional independence of panel data based on the Fisher chi-square statistic. In contrast, the PP-Choi Z-stat test, developed by [41], examines the presence of cross-sectional dependence in panel data. It is based on the Z-statistic and helps determine whether there is a correlation or interdependence among the observations of individuals in the panel. To detect structural breaks, we will employ the model by [42]. To investigate whether the price series of the green indexes show serial autocorrelation, we will conduct a non-parametric test developed by [43], which encompasses the rank test and the sign test for the heteroscedastic series. The application of these methods allows for more accurate estimations, particularly in cases where the sample size is small, providing higher statistical power compared to traditional variance ratio tests when serial correlation is present [44].
The methodology [43] involves two test types: the rank test for homoscedastic series and the sign test for heteroscedastic series. The rank test of the variance involves ordering the stock return series.
is considered as the position of return, , between :
where signifies the inverse of the cumulative standardized normal distribution, r_2t^' represents the standardized linear transformation of return positions, and r_2t^' is a standardized reverse transformation to a normal distribution.
The rejection of the random walk hypothesis in relation to stock returns is generated by a simulation process, where the statistics and are substituted with the simulated values and . By employing bootstrap estimates, which include generating consecutive and random data, it becomes possible to imitate the statistical characteristics of the actual sample distribution. This allows for the approximation of the precise distribution of and at a certain confidence level. According to [43] method, an additional test known as the signal variance ratio is suggested. This test takes into account the sign of the returns in order to estimate the signal ratio, which exhibits heteroscedasticity. Therefore, the following statistical test can be employed:
Were,
The estimation of the distribution of can be approximated by employing bootstrap approaches, specifically by utilizing and employing the ratio of variance by ranks. The value of is derived from the sequence , in which each element has an equal likelihood of being either 1 or -1.
In order to fortify the resilience of our research question, we aim to explore whether the indexes representing clean energy stocks manifest persistency, thereby gauging their predictability. To achieve this, we intend to leverage the Detrended Fluctuation Analysis (DFA) methodology. DFA serves as an analytical tool that scrutinizes temporal dependencies inherent in non-stationary data sequences. By assuming the non-stationarity of time series, this approach mitigates the risk of generating deceptive findings when exploring extended datasets. The DFA exponent is elucidated as follows: implies an anti-persistent series, characterizes a series demonstrating a random walk, and connotes a persistent series. A prominent advantage of employing DFA is its proficiency in eliminating trends within data sequences that could potentially distort the actual correlation within random variable fluctuations. This technique facilitates the discernment of enduring correlations present in signals with underlying polynomial trends, which might otherwise obscure genuine correlations. In summary, the DFA methodology encompasses the following procedural stages:
1. Consider a signal , where ranges from 1 to the total number of points in the series. Then, by integrating the signal, a new series is obtained.
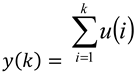
- The integrated signal is segmented into boxes of equal length .
- For each box of size , we fit a polynomial of degree 1, denoted as , which signifies the trend within each box.
- Within each box, the signal is subtracted from the signal .
- As a result, for each box of size 'n', we calculate its root mean square, namely
The calculation above is repeated for different box sizes . As a result, if has a power-law relationship, then such a function is proportional to raised to the power.
In this context, represents the exponent of long-range correlation, signifying the strong self-similarity of the signal, with its interpretation outlined in Table 1.
The hypotheses presented for Table 1 DFA results are as follows:
These hypotheses are structured to test the significance of the scaling exponent () derived from the DFA analysis. The null hypothesis () suggests that the scaling exponent is equal to 0.5, implying a random or uncorrelated series, while the alternative hypothesis () posits that the scaling exponent differs from 0.5, suggesting a non-random or correlated series within the analyzed data. This comparison is fundamental in determining whether the series exhibits characteristics of long-term memory or persistence in its behavior.
4. Discussion
4.1. Characteristic Statistics
Figure 1 displays the evolution of daily returns for green stock indexes, including Clean Science and Technology (CLEA.NS), ISE Clean Edge Global Wind Energy Index (GWE), iShares Global Clean Energy ETF (ICLN.O), Nasdaq Clean Edge Green Energy (CELS), and Solactive Clean Energy (COLCLNNEP), observed between October 4, 2021, and October 4, 2023. A visual examination of the graph indicates a relatively stable mean return, hovering around zero. The data, however, shows significant variations that highlight the volatility to which these markets were subject, which was particularly noticeable in the first few months of 2022, coinciding with the impact of the 2022 Russian invasion of Ukraine. This suggests the presence of structural breaks in the time series.
Figure 2 presents the mean returns of green stock indexes, namely Clean Science and Technology (CLEA.NS), ISE Clean Edge Global Wind Energy Index (GWE), iShares Global Clean Energy ETF (ICLN.O), Nasdaq Clean Edge Green Energy (CELS), and Solactive Clean Energy (COLCLNNEP), during the period spanning from October 4, 2021, to October 4, 2023. Based on a graphical examination, it is apparent that the CLEA.NS, GWE, ICLN.O, CELS, and COLCLNNEP indexes exhibit negative mean returns, as indicated by their respective values of -0.001105, -0.001104, -0.001155, -0.001069, and -0.000972. The anticipated result can be attributed to the market volatility resulting from the occurrences of 2022.
Figure 3 displays the standard deviations of various green stock indexes, namely Clean Science and Technology (CLEA.NS), ISE Clean Edge Global Wind Energy Index (GWE), iShares Global Clean Energy ETF (ICLN.O), Nasdaq Clean Edge Green Energy (CELS), and Solactive Clean Energy (CLNNEP), over the time span from October 4, 2021, to October 4, 2023. The findings indicate that the CELS index exhibits the highest standard deviation, with a value of 0.040134. This is followed by CLEA.NS (0.028600), ICLN.O (0.027019), COLCLNNEP (0.017126), and GWE (0.014992). The observed results exhibit a high degree of variability and deviate significantly from the mean, as anticipated given the prevailing uncertainty in global markets.
Figure 4 displays the skewness observed in the green stock indexes, namely Clean Science and Technology (CLEA.NS), ISE Clean Edge Global Wind Energy Index (GWE), iShares Global Clean Energy ETF (ICLN.O), Nasdaq Clean Edge Green Energy (CELS), and Solactive Clean Energy (COLCLNNEP), during the time span from October 4, 2021, to October 4, 2023. By doing graphical analysis, it has been shown that the green indexes CELS (-0.113715) and COLCLNNEP (-0.257882) exhibit negative asymmetries. Conversely, the indexes CLEA.NS (0.255947), GWE (0.035625), and ICLN.O (0.601671) demonstrate positive asymmetries. Nevertheless, it is important to acknowledge that the temporal data exhibits values that deviate from zero, indicating the presence of non-Gaussian distributions.
In Figure 5, we can observe the kurtosis of the green stock indexes, Clean Science and Technology (CLEA.NS), ISE Clean Edge Global Wind Energy Index (GWE), iShares Global Clean Energy ETF (ICLN.O), Nasdaq Clean Edge Green Energy (CELS), and Solactive Clean Energy (COLCLNNEP), over the period from October 4, 2021, to October 4, 2023. Upon graphical analysis, it is evident that the green indexes CELS (14.50736), ICLN.O (12.65731), CLEA.NS (7.748667), COLCLNNEP (6.396084), and GWE (3.830488) exhibit values higher than 3 (the reference value), validating the outcomes of the asymmetries. This observation leads us to suggest that the time series of the green indexes do not follow Gaussian distributions.
4.2. Diagnostic
Time Series Stationarity
To assess the stationarity assumption of the green stock indexes, namely Clean Science and Technology (CLEA.NS), ISE Clean Edge Global Wind Energy Index (GWE), iShares Global Clean Energy ETF (ICLN.O), Nasdaq Clean Edge Green Energy (CELS), and Solactive Clean Energy (COLCLNNEP), over the period from October 4, 2021, to October 4, 2023. We used the panel unit root test proposed by [40]. Specifically, we utilized the Fisher Chi-square and Choi Z-statistic methods. The proposed methodology demonstrates a high level of resilience in accurately identifying the appropriate lag level for each individual time series, ultimately leading to the attainment of equilibrium characterized by a mean of zero and a variance of one. The findings suggest that the time series displays unit roots when assessing the original price series. In order to attain stationarity, a logarithmic transformation was applied to the initial differences, resulting in the rejection of the null hypothesis at a significance level of 1% (refer to Table 2).
Unit root test with structural break
The results of the unit root test conducted by [42] on various green indexes, namely Clean Science and Technology (CLEA.NS), ISE Clean Edge Global Wind Energy Index (GWE), iShares Global Clean Energy ETF (ICLN.O), Nasdaq Clean Edge Green Energy (CELS), and Solactive Clean Energy (KOLCLNNEP), during the period from October 4, 2021, to October 4, 2023, are shown in Figure 6. In summary, the green indexes that are being examined have experienced significant drops at different points in time. On April 15, 2022, the CLEA.NS index saw a decline, while the GWE index followed suit on February 28, 2022. The iShares Global Clean Energy ETF and the Nasdaq Clean Edge Green Energy index saw a decrease on July 4, 2022, while the Solactive Clean Energy index mirrored this trend a few days later, namely on July 13, 2023. These occurrences serve as indicators of times characterized by fluctuations and instability within the clean energy market. These phenomena are closely linked to the prevailing atmosphere of uncertainty in the global financial markets, which has been influenced by the Russian incursion into Ukraine. The authors [39,45,46] have provided corroboration for these findings, demonstrating the presence of significant volatility in green energy indexes, as well as fossil fuels and other related factors.
4.3. Methodologic Results
Table 3 illustrates the outcomes derived from the application of the Rank and Sign tests, an analysis technique introduced by Wright in 2000, on a spectrum of green indexes encompassing Clean Science and Technology (CLEA.NS), ISE Clean Edge Global Wind Energy Index (GWE), iShares Global Clean Energy ETF (ICLN.O), Nasdaq Clean Edge Green Energy (CELS), and Solactive Clean Energy (COLCLNNEP). These assessments spanned a comprehensive timeframe, from October 4, 2021, to October 4, 2023, investigating the potential predictability of stock prices in these environmentally inclined indexes. The Wright method, known for its non-parametric approach, involved conducting Rank Variance Ratio tests, examining homoscedastic conditions, and Sign tests, exploring heteroscedastic scenarios. These assessments were conducted over varying lag periods of 2, 4, 8, and 16 days, meticulously examining the statistical characteristics of these green indexes. The results unveiled compelling insights. Firstly, they refuted the notion of a random walk within these indexes, challenging the theory that future stock prices cannot be anticipated from past prices. This is a significant deviation from the traditional assumption, opening up possibilities for investors to derive insights and make more informed decisions based on historical data. Further, the rejection of the random walk hypothesis was fortified by the Sign test (martingale), substantiating the assertion that these data series do not follow an entirely random or unpredictable pattern. Instead, they demonstrated a discernible level of autocorrelation, suggesting that past price performance may offer indications of future movements. Another crucial finding was the presence of negative serial autocorrelation across all the indexes. This was confirmed by the variance ratios in both the Rank and Sign tests, indicating a phenomenon of mean reversion. When these indexes veer away from their historical averages, there's a proclivity for them to revert to those mean levels over time. Moreover, the study revealed a remarkable similarity in the serial autocorrelation and mean reversion patterns among the various green indexes examined. This implies that distinctions in price behaviors between these indexes may be minimal, potentially reducing the efficacy of diversification strategies among these indexes. In conclusion, these findings offer a valuable vantage point for investors in green indexes, potentially enabling them to leverage observed autocorrelation and mean reversion trends to optimize their trading or investment strategies. Additionally, researchers and analysts must consider these outcomes when evaluating the performance and predictability of these indexes within the context of sustainable and clean energy investments.
5. Discussion
In Table 4, the results obtained from utilizing the monofractal Detrended Fluctuation Analysis (DFA) model on various green indexes between October 4, 2021, and October 4, 2023, are displayed. DFA, a statistical method for analyzing time series data, yields exponent values that offer insights into long-term memory or data persistence. Notably, Clean Science and Technology (CLEA.NS) showcases a DFA exponent of 0.53, while the ISE Clean Edge Global Wind Energy Index (GWE) presents a slope of 0.58, indicating extended memory within these indexes. Similarly, iShares Global Clean Energy ETF (ICLN.O) reveals a DFA exponent of 0.53, and Solactive Clean Energy (COLCLNNEP) displays a slope of 0.59, signifying pronounced persistence, with the latter exhibiting the strongest long-term memory presence. Contrastingly, the NASDAQ Clean Edge Green Energy index registers a slope of 0.48, suggesting anti-persistence and a likelihood of short-term fluctuations. Overall, most green indexes manifest long-term memory, excluding the CELS index, which displays anti-persistence and a distinctive behavioral pattern characterized by short-term fluctuations. These DFA exponents provide valuable insights into the statistical properties of these indexes during the specified duration. The results imply that green index prices do not fully encapsulate all available information, and price variations are non-independent and non-identically distributed. This divergence from the random walk theory and informational efficiency holds noteworthy consequences for investors, hinting at the potential predictability of certain returns. This scenario generates arbitrage opportunities and the prospect of anomalous returns, conflicting with the foundational assumptions of financial market theories. Essentially, these findings suggest exploitable patterns or trends in the market behavior of these green indexes. Authors [47,48], respectively, corroborate these findings in the cryptocurrency and international markets.
6. Conclusions
The investigation rigorously evaluated a diverse range of green stock indexes, notably Clean Science and Technology (CLEA.NS), ISE Clean Edge Global Wind Energy Index (GWE), iShares Global Clean Energy ETF (ICLN.O), NASDAQ Clean Edge Green Energy (CELS), and Solactive Clean Energy (COLCLNNEP). Findings indicate the emergence of intricate and nonlinear movements in these indexes price behaviors. This complexity likely stems from various influential factors impacting these green stocks, such as political shifts, technological advancements, and investor sentiment.
Of paramount importance in this investigation is the exploration of the interrelationship between past and future stock returns. The research uncovered a noteworthy pattern wherein the past performance of these indexes exerts a substantial influence on their subsequent returns, a phenomenon commonly referred to as serial autocorrelation. The implications drawn from this discovery indicate a tendency for underperforming indexes in the past to gravitate back towards an average performance level in subsequent periods, suggesting a discernible negative influence stemming from past performance on future returns. These empirical findings serve as the cornerstone of this study, offering profound implications for investors and analysts. They pave the way for strategic decision-making, encouraging a deeper understanding and utilization of the observed patterns within these indexes to inform future investment strategies. To ensure the robustness of the results, the analysis employed the monofractal Detrended Fluctuation Analysis (DFA) method. Outcomes from this analysis highlight the presence of long memory in the green indexes, except for the Nasdaq Clean Edge index, which demonstrated anti-persistence at 0.48. Long memory infers a sustained impact of past price movements on future prices, potentially fostering predictability in stock returns. The implications of these findings extend to investors, questioning the efficient market hypothesis (EMH) as stock prices in these green indexes might not fully assimilate available information effectively. Furthermore, the observed deviations from the random walk model and information efficiency hint at possibilities for traders to identify trading strategies that exploit these patterns. Potential arbitrage opportunities (capitalizing on price differences across markets) and abnormal returns (returns surpassing the anticipated level in an efficient market) could be discerned within these green stock indexes.
In conclusion, the findings of this comprehensive analysis underscore the intricate and multifaceted nature of green stock indexes, portraying a complex interplay of market behaviors influenced by multifractal patterns. The evidence of past performance significantly impacting future returns in these indexes signifies the potential for informed investment strategies and predictive patterns. The long memory detected in most green indexes implies a sustained effect of historical stock movements on future pricing, offering a window into potentially predictable stock returns. Such insights raise substantial questions about the conventional Efficient Market Hypothesis (EMH), suggesting that green indexes may not swiftly absorb available information, opening avenues for traders to exploit these deviations for profitable strategies. The discovered anti-persistent nature of the Nasdaq Clean Edge index adds a layer of intriguing complexity to the discussion, indicating distinct behavior within this particular index. These conclusions collectively empower investors and analysts to refine their investment decision-making, uncover potential arbitrage opportunities, and possibly achieve abnormal returns within the realm of green stock markets, fostering an environment for strategic and informed investment decisions in this unique financial landscape.
7. Practical Implications
In the current era characterized by an escalating focus on sustainable investments and the transition towards greener economies, this study's insights hold profound significance. The analysis of multifractality and efficiency in green stock indexes provides a critical understanding of the intricate dynamics governing these financial instruments. By shedding light on the intricate and nonlinear behaviors of these indexes, the research underscores the complex interplay of various factors, such as policy shifts, technological advancements, and investor sentiments, within the realm of green energy investments. The study's conclusions have a broad spectrum of practical implications that provide financial analysts, investors, and politicians with useful guidance while navigating the global field of green energy investments. Investors can make well-informed decisions by having a solid understanding of the enduring impact of past performance on future returns. Armed with the knowledge of serial autocorrelation, investors can adopt more strategic approaches, leveraging historical patterns to anticipate potential trends in green stock indexes. This understanding can guide portfolio adjustments and investment decisions, offering the potential to optimize returns and minimize risks within the evolving landscape of sustainable investments. The observed non-linearity and multifractality in these green indexes can be used by financial analysts to improve their prediction models. Including the study's long-term memory findings in their analytical models can improve forecasting precision and risk evaluations. These insights make it possible to assess market dynamics more thoroughly, which helps to produce more intelligent and well-rounded investment suggestions. These results can be used by policymakers to promote a more open and knowledgeable investment climate in the green energy industry. Authorities may take steps to improve investor information and market regulations in light of the constraints on market efficiency. Policymakers may enhance the resilience and sustainability of the investment landscape by encouraging more informed decision-making and guaranteeing transparent markets.
Lastly, this study's practical consequences highlight the necessity of a sophisticated approach to investment strategies in the green energy industry. Through recognition and utilization of the noted trends and departures from market efficiency, stakeholders and investors can seize opportunities, mitigate risks, and promote the expansion and steadiness of sustainable financial markets.
Author Contributions
Conceptualization, R.D., M.C., C.P., P.H., P.A., V.M. R.S. and L.A.; methodology, R.D. and M.C.; software, R.D.; validation, R.D.; formal analysis, R.D., M.C., C.P., P.H., P.A., V.M., R.S. and L.A.; investigation, R.D., M.C., C.P., P.H., P.A., V.M., R.S. and L.A.; resources, R.D., M.C., C.P., P.H., P.A., V.M., R.S. and L.A.; data curation, R.D. and M.C.; writing—original draft preparation, R.D., M.C., C.P., P.H., P.A., V.M., R.S. and L.A.; writing—review and editing, R.D. and M.C.; visualization, R.D. and M.C.; supervision, R.D.; project administration, R.D.; funding acquisition, R.D. All authors have read and agreed to the published version of the manuscript.
Funding
The authors are pleased to acknowledge financial support from Instituto Politécnico de Setúbal [RAADRI program].
Conflicts of Interest
The authors declare no conflict of interest. The funders had no role in the design of the study; in the collection, analyses, or interpretation of data; in the writing of the manuscript; or in the decision to publish the results.
References
- Broadstock, D.C.; Chan, K.; Cheng, L.T.W.; Wang, X. The Role of ESG Performance during Times of Financial Crisis: Evidence from COVID-19 in China. Financ Res Lett 2021, 38. [Google Scholar] [CrossRef]
- Gregory, R.P. Market Efficiency in ESG Indexes: Trading Opportunities. The Journal of Impact and ESG Investing 2021. [Google Scholar] [CrossRef]
- Elie, B.; Naji, J.; Dutta, A.; Uddin, G.S. Gold and Crude Oil as Safe-Haven Assets for Clean Energy Stock Indices: Blended Copulas Approach. Energy 2019, 178. [Google Scholar] [CrossRef]
- Dutta, A.; Bouri, E.; Das, D.; Roubaud, D. Assessment and Optimization of Clean Energy Equity Risks and Commodity Price Volatility Indexes: Implications for Sustainability. J Clean Prod 2020, 243, 118669. [Google Scholar] [CrossRef]
- Karim, S.; Naeem, M.A. Do Global Factors Drive the Interconnectedness among Green, Islamic and Conventional Financial Markets? International Journal of Managerial Finance 2022, 18. [Google Scholar] [CrossRef]
- Lu, X.; Liu, K.; Lai, K.K.; Cui, H. Transmission between EU Allowance Prices and Clean Energy Index. In Proceedings of the Procedia Computer Science; 2021; Vol. 199. [Google Scholar] [CrossRef]
- Kanamura, T. A Model of Price Correlations between Clean Energy Indices and Energy Commodities. Journal of Sustainable Finance and Investment 2022, 12. [Google Scholar] [CrossRef]
- Fuentes, F.; Herrera, R. Dynamics of Connectedness in Clean Energy Stocks. Energies (Basel) 2020, 13. [Google Scholar] [CrossRef]
- Thai, H.N. Quantile Dependence between Green Bonds, Stocks, Bitcoin, Commodities and Clean Energy. Econ Comput Econ Cybern Stud Res 2021, 55. [Google Scholar] [CrossRef]
- Farid, S.; Karim, S.; Naeem, M.A.; Nepal, R.; Jamasb, T. Co-Movement between Dirty and Clean Energy: A Time-Frequency Perspective. Energy Econ 2023, 119. [Google Scholar] [CrossRef]
- Papageorgiou, C.; Saam, M.; Schulte, P. Substitution between Clean and Dirty Energy Inputs: A Macroeconomic Perspective. Review of Economics and Statistics 2017, 99. [Google Scholar] [CrossRef]
- Ren, B.; Lucey, B. A Clean, Green Haven?—Examining the Relationship between Clean Energy, Clean and Dirty Cryptocurrencies. Energy Econ 2022, 109. [Google Scholar] [CrossRef]
- Ren, B.; Lucey, B.M. A Clean, Green Haven?- Examining the Relationship between Clean Energy, Clean and Dirty Cryptocurrencies. SSRN Electronic Journal 2021. [Google Scholar] [CrossRef]
- Mensi, W.; Rehman, M.U.; Vo, X.V. Dynamic Frequency Relationships and Volatility Spillovers in Natural Gas, Crude Oil, Gas Oil, Gasoline, and Heating Oil Markets: Implications for Portfolio Management. Resources Policy 2021, 73, 102172. [Google Scholar] [CrossRef]
- Mensi, W.; Rehman, M.U.; Maitra, D.; Al-Yahyaee, K.H.; Vo, X.V. Oil, Natural Gas and BRICS Stock Markets: Evidence of Systemic Risks and Co-Movements in the Time-Frequency Domain. Resources Policy 2021, 72, 102062. [Google Scholar] [CrossRef]
- Qin, Y.; Hong, K.; Chen, J.; Zhang, Z. Asymmetric Effects of Geopolitical Risks on Energy Returns and Volatility under Different Market Conditions. Energy Econ 2020, 90, 104851. [Google Scholar] [CrossRef]
- Gibson, G.R. The Stock Markets of London, Paris and New York.; G.P. Putnam’s Sons: New York, 1889. [Google Scholar]
- Bachelier, L. Bachelier, L. Théorie de La Spéculation. Annales scientifiques de l’École normale supérieure 1900. [CrossRef]
- Cowles, A. Can Stock Market Forecasters Forecast? Econometrica 1933. [Google Scholar] [CrossRef]
- Cowles, A. Stock Market Forecasting. Econometrica 1944. [Google Scholar] [CrossRef]
- Roberts, H.V. STOCK-MARKET “PATTERNS” AND FINANCIAL ANALYSIS: METHODOLOGICAL SUGGESTIONS. J Finance 1959. [Google Scholar] [CrossRef]
- Osborne, M.F.M. Brownian Motion in the Stock Market. Oper Res 1959. [Google Scholar] [CrossRef]
- Fama, E.F. The Behavior of Stock-Market Prices. The Journal of Business 1965. [Google Scholar] [CrossRef]
- Fama, E.F. Efficient Capital Markets: A Review of Theory and Empirical Work. J Finance 1970. [Google Scholar] [CrossRef]
- Jiang, Y.; Nie, H.; Ruan, W. Time-Varying Long-Term Memory in Bitcoin Market. Financ Res Lett 2018, 25, 280–284. [Google Scholar] [CrossRef]
- da Silva Filho, A.C.; Maganini, N.D.; de Almeida, E.F. Multifractal Analysis of Bitcoin Market. Physica A: Statistical Mechanics and its Applications 2018, 512, 954–967. [Google Scholar] [CrossRef]
- Kristjanpoller, W.; Bouri, E. Asymmetric Multifractal Cross-Correlations between the Main World Currencies and the Main Cryptocurrencies. Physica A: Statistical Mechanics and its Applications 2019, 523, 1057–1071. [Google Scholar] [CrossRef]
- Shahzad, S.J.H.; Hernandez, J.A.; Hanif, W.; Kayani, G.M. Intraday Return Inefficiency and Long Memory in the Volatilities of Forex Markets and the Role of Trading Volume. Physica A: Statistical Mechanics and its Applications 2018, 506, 433–450. [Google Scholar] [CrossRef]
- Han, C.; Wang, Y.; Ning, Y. Comparative Analysis of the Multifractality and Efficiency of Exchange Markets: Evidence from Exchange Rates Dynamics of Major World Currencies. Physica A: Statistical Mechanics and its Applications 2019, 535, 122365. [Google Scholar] [CrossRef]
- Ali, S.; Shahzad, S.J.H.; Raza, N.; Al-Yahyaee, K.H. Stock Market Efficiency: A Comparative Analysis of Islamic and Conventional Stock Markets. Physica A: Statistical Mechanics and its Applications 2018, 503, 139–153. [Google Scholar] [CrossRef]
- Aloui, C.; Shahzad, S.J.H.; Jammazi, R. Dynamic Efficiency of European Credit Sectors: A Rolling-Window Multifractal Detrended Fluctuation Analysis. Physica A: Statistical Mechanics and its Applications 2018, 506, 337–349. [Google Scholar] [CrossRef]
- Shahzad, S.J.H.; Bouri, E.; Kayani, G.M.; Nasir, R.M.; Kristoufek, L. Are Clean Energy Stocks Efficient? Asymmetric Multifractal Scaling Behaviour. Physica A: Statistical Mechanics and its Applications 2020, 550. [Google Scholar] [CrossRef]
- Ferreira, P.; Loures, L.C. An Econophysics Study of the S&P Global Clean Energy Index. Sustainability (Switzerland) 2020, 12. [Google Scholar] [CrossRef]
- Yao, C.Z.; Mo, Y.N.; Zhang, Z.K. A Study of the Efficiency of the Chinese Clean Energy Stock Market and Its Correlation with the Crude Oil Market Based on an Asymmetric Multifractal Scaling Behavior Analysis. North American Journal of Economics and Finance 2021, 58. [Google Scholar] [CrossRef]
- Wan, D.; Xue, R.; Linnenluecke, M.; Tian, J.; Shan, Y. The Impact of Investor Attention during COVID-19 on Investment in Clean Energy versus Fossil Fuel Firms. Financ Res Lett 2021. [Google Scholar] [CrossRef]
- Ferreira, J.; Morais, F. Does the Coronavirus Crash Affect Green Equity Markets’ Efficiency? A Multifractal Analysis. Journal of Sustainable Finance and Investment 2022. [Google Scholar] [CrossRef]
- Gustafsson, R.; Dutta, A.; Bouri, E. Are Energy Metals Hedges or Safe Havens for Clean Energy Stock Returns? Energy 2022, 244. [Google Scholar] [CrossRef]
- Choi, G.; Park, K.; Yi, E.; Ahn, K. Price Fairness: Clean Energy Stocks and the Overall Market. Chaos Solitons Fractals 2023, 168. [Google Scholar] [CrossRef]
- Dias, R.; Horta, N.; Chambino, M. Clean Energy Action Index Efficiency: An Analysis in Global Uncertainty Contexts. Energies (Basel) 2023, 16. [Google Scholar] [CrossRef]
- Phillips, P.C.B.; Perron, P. Testing for a Unit Root in Time Series Regression. Biometrika 1988, 75, 335–346. [Google Scholar] [CrossRef]
- Choi, I. Unit Root Tests for Panel Data. J Int Money Finance 2001, 20, 249–272. [Google Scholar] [CrossRef]
- Clemente, J.; Montañés, A.; Reyes, M. Testing for a Unit Root in Variables with a Double Change in the Mean. Econ Lett 1998, 59, 175–182. [Google Scholar] [CrossRef]
- Wright, J.H. Alternative Variance-Ratio Tests Using Ranks and Signs. Journal of Business and Economic Statistics 2000. [Google Scholar] [CrossRef]
- Vats, A.; Kamaiah, B. Is There a Random Walk in Indian Foreign Exchange Market? Int J Econ Finance 2011, 3, 157–165. [Google Scholar] [CrossRef]
- Santana, T.; Horta, N.; Revez, C.; Santos Dias, R.M.T.; Zebende, G.F. Effects of Interdependence and Contagion between Oil and Metals by ρ DCCA: An Case of Study about the COVID-19. 2023, 1–11. [CrossRef]
- Dias, R.; Alexandre, P.; Teixeira, N.; Chambino, M. Clean Energy Stocks: Resilient Safe Havens in the Volatility of Dirty Cryptocurrencies. 2023. [CrossRef]
- Chambino, M.; Manuel, R.; Dias, T.; Horta, N.R. Asymmetric Efficiency of Cryptocurrencies during the 2020 and 2022 Events. 2023, 2, 23–33. [CrossRef]
- Dias, R.; Chambino, M.; Horta, N.H. Long-Term Dependencies in Central European Stock Markets: A Crisp-Set. 2023, 2, 10–17. [CrossRef]
Figure 1.
Evolution, in returns, of the green stock indexes, from October 4, 2021, to October 4, 2023.
Figure 1.
Evolution, in returns, of the green stock indexes, from October 4, 2021, to October 4, 2023.
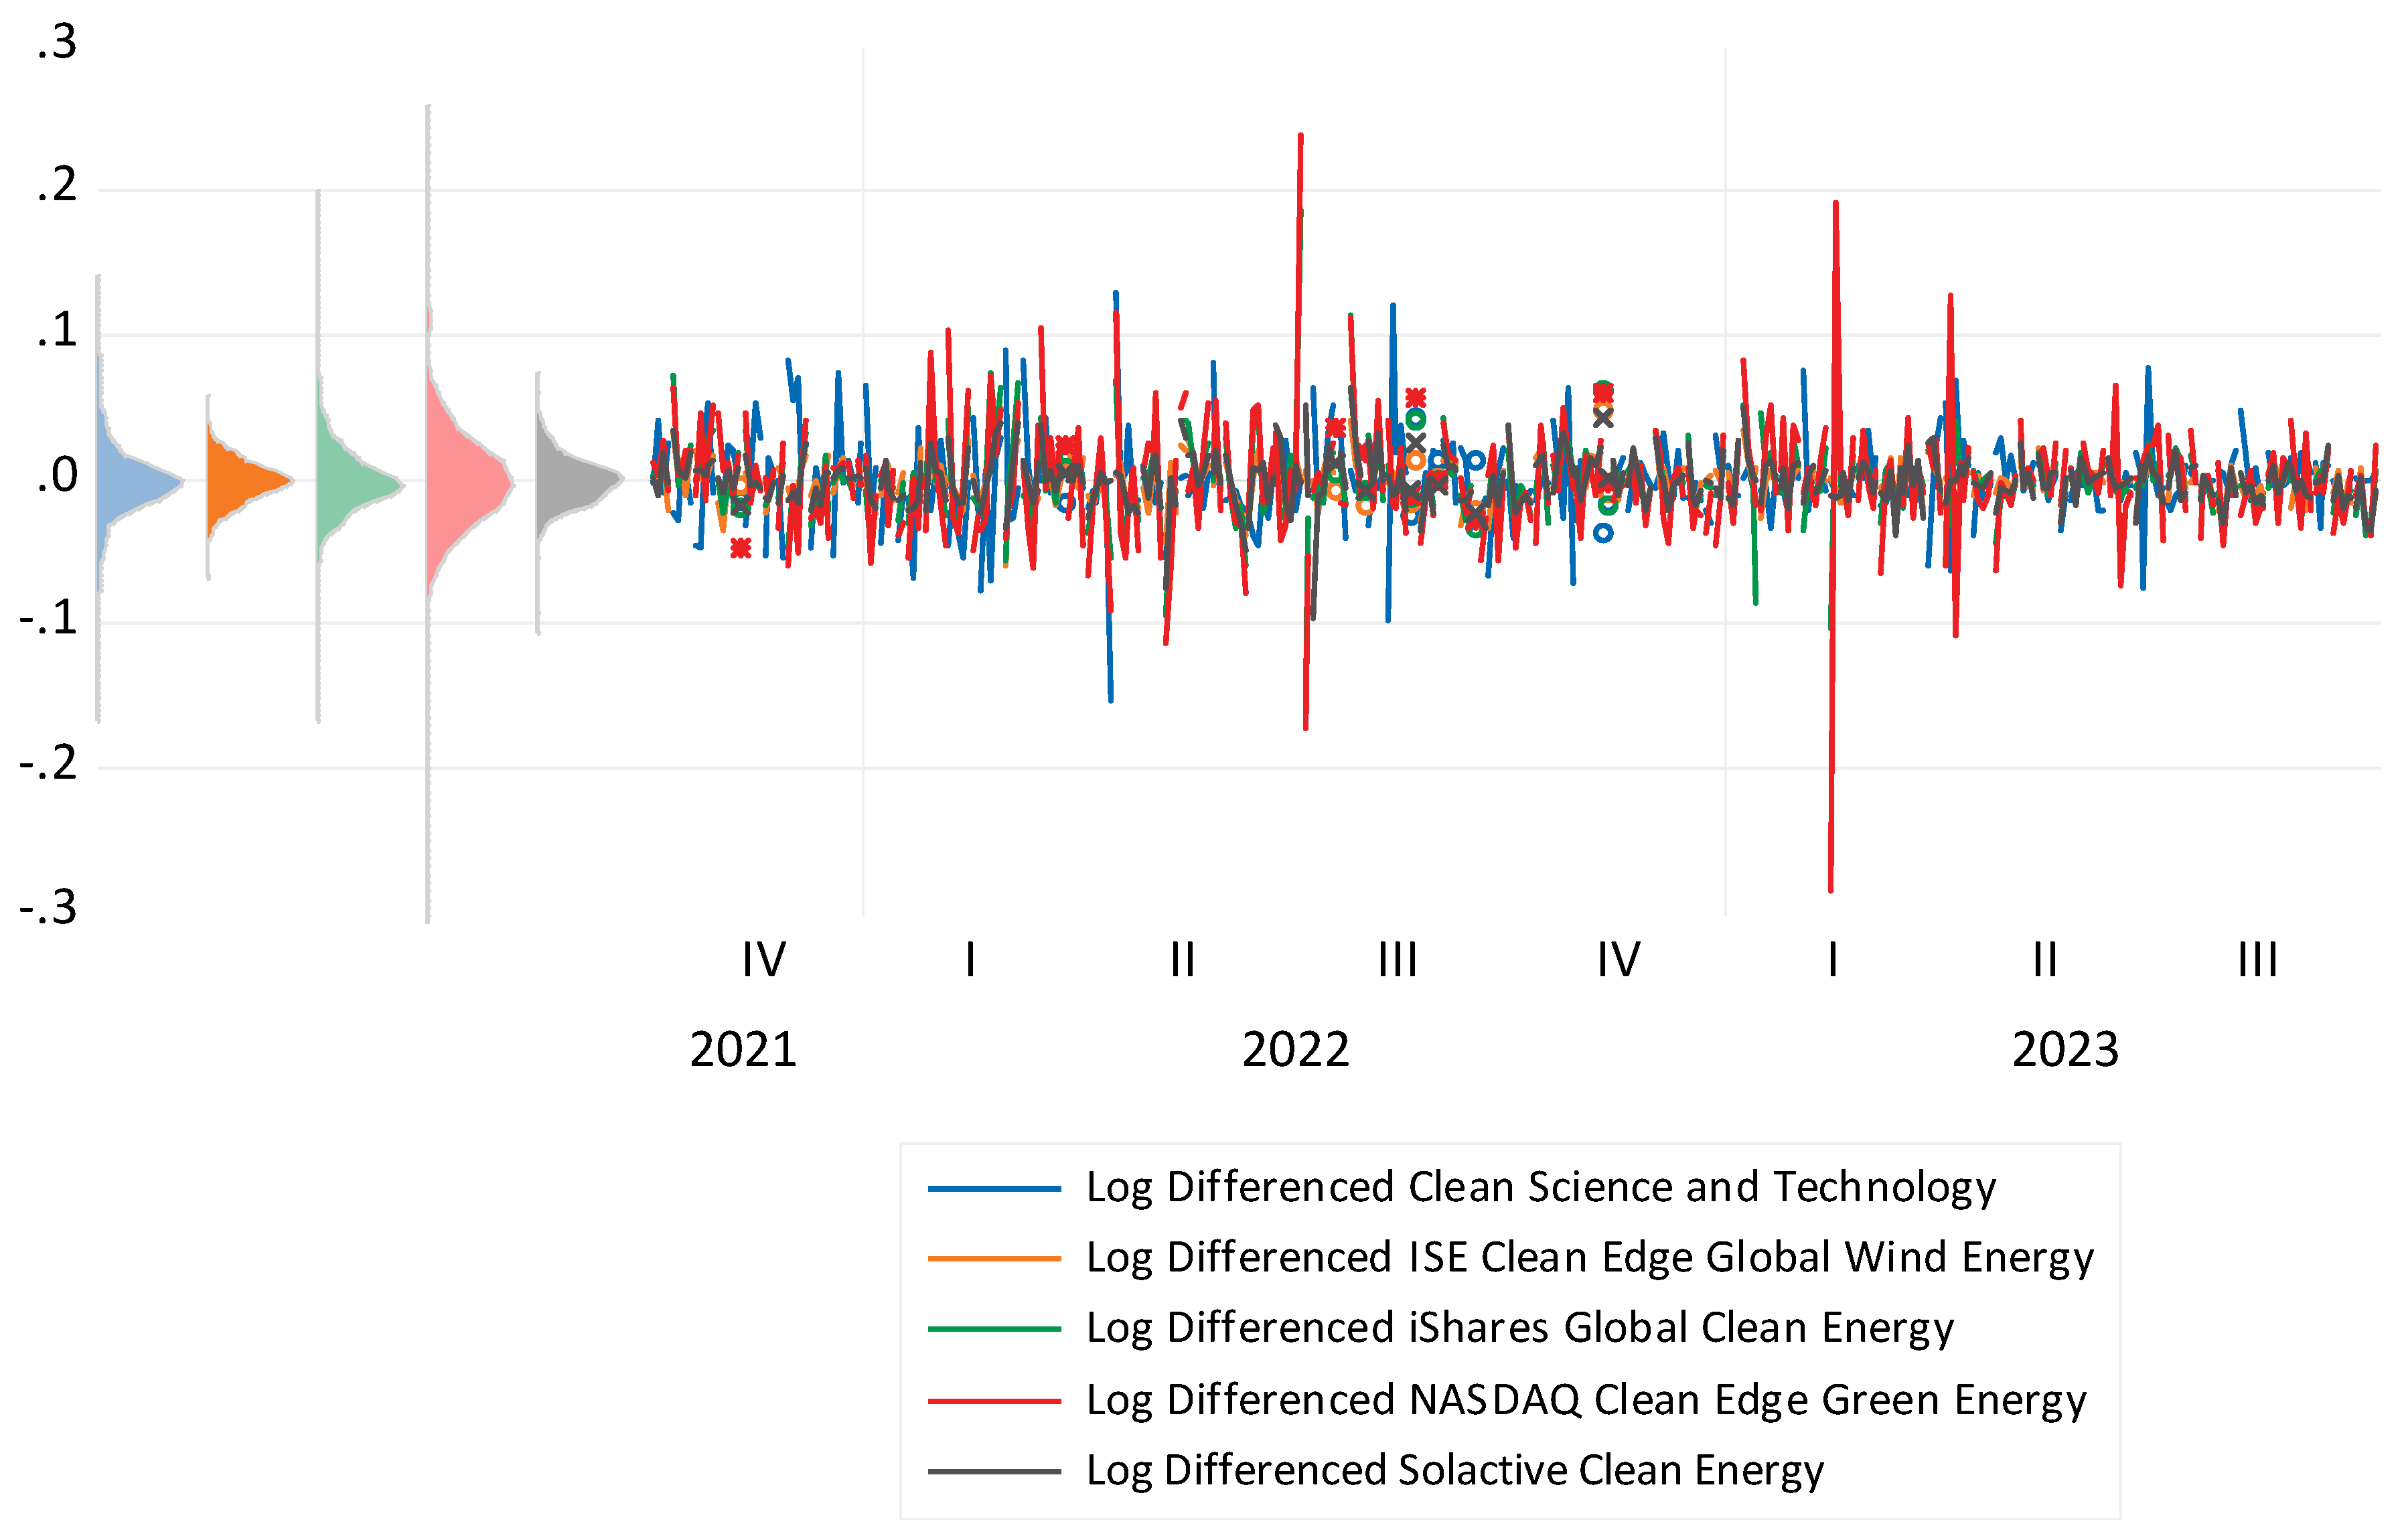
Figure 2.
Evolution of the mean returns of the green stock indexes, from October 4, 2021, to October 4, 2023.
Figure 2.
Evolution of the mean returns of the green stock indexes, from October 4, 2021, to October 4, 2023.
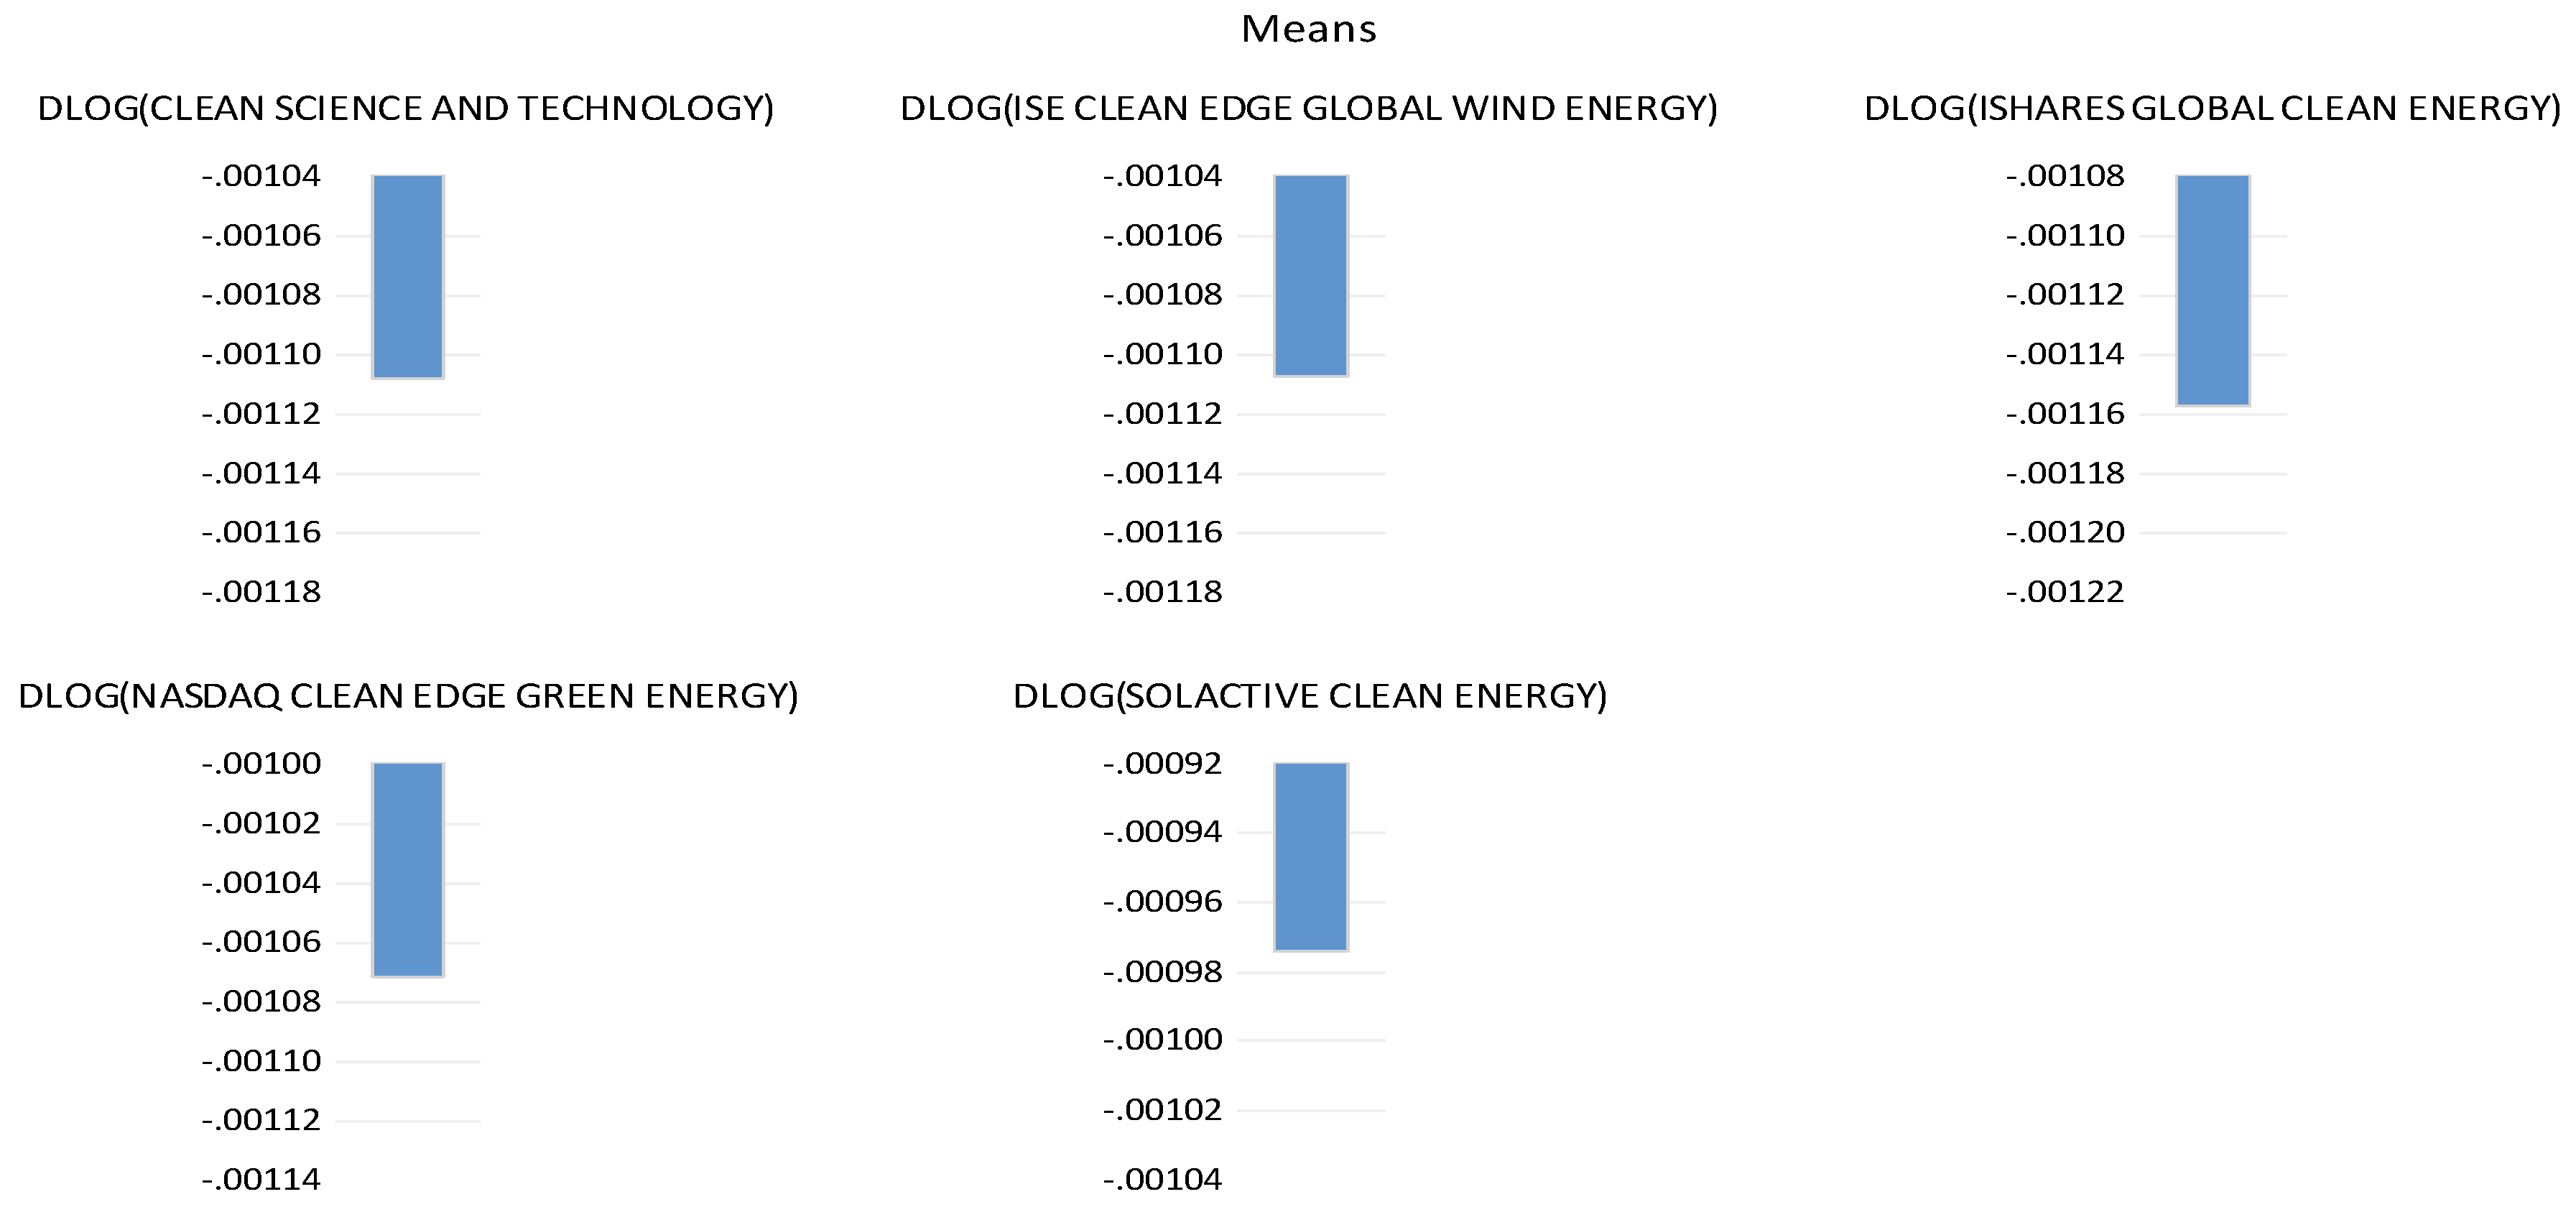
Figure 3.
Evolution of standard deviations for green stock indexes, from October 4, 2021, to October 4, 2023.
Figure 3.
Evolution of standard deviations for green stock indexes, from October 4, 2021, to October 4, 2023.
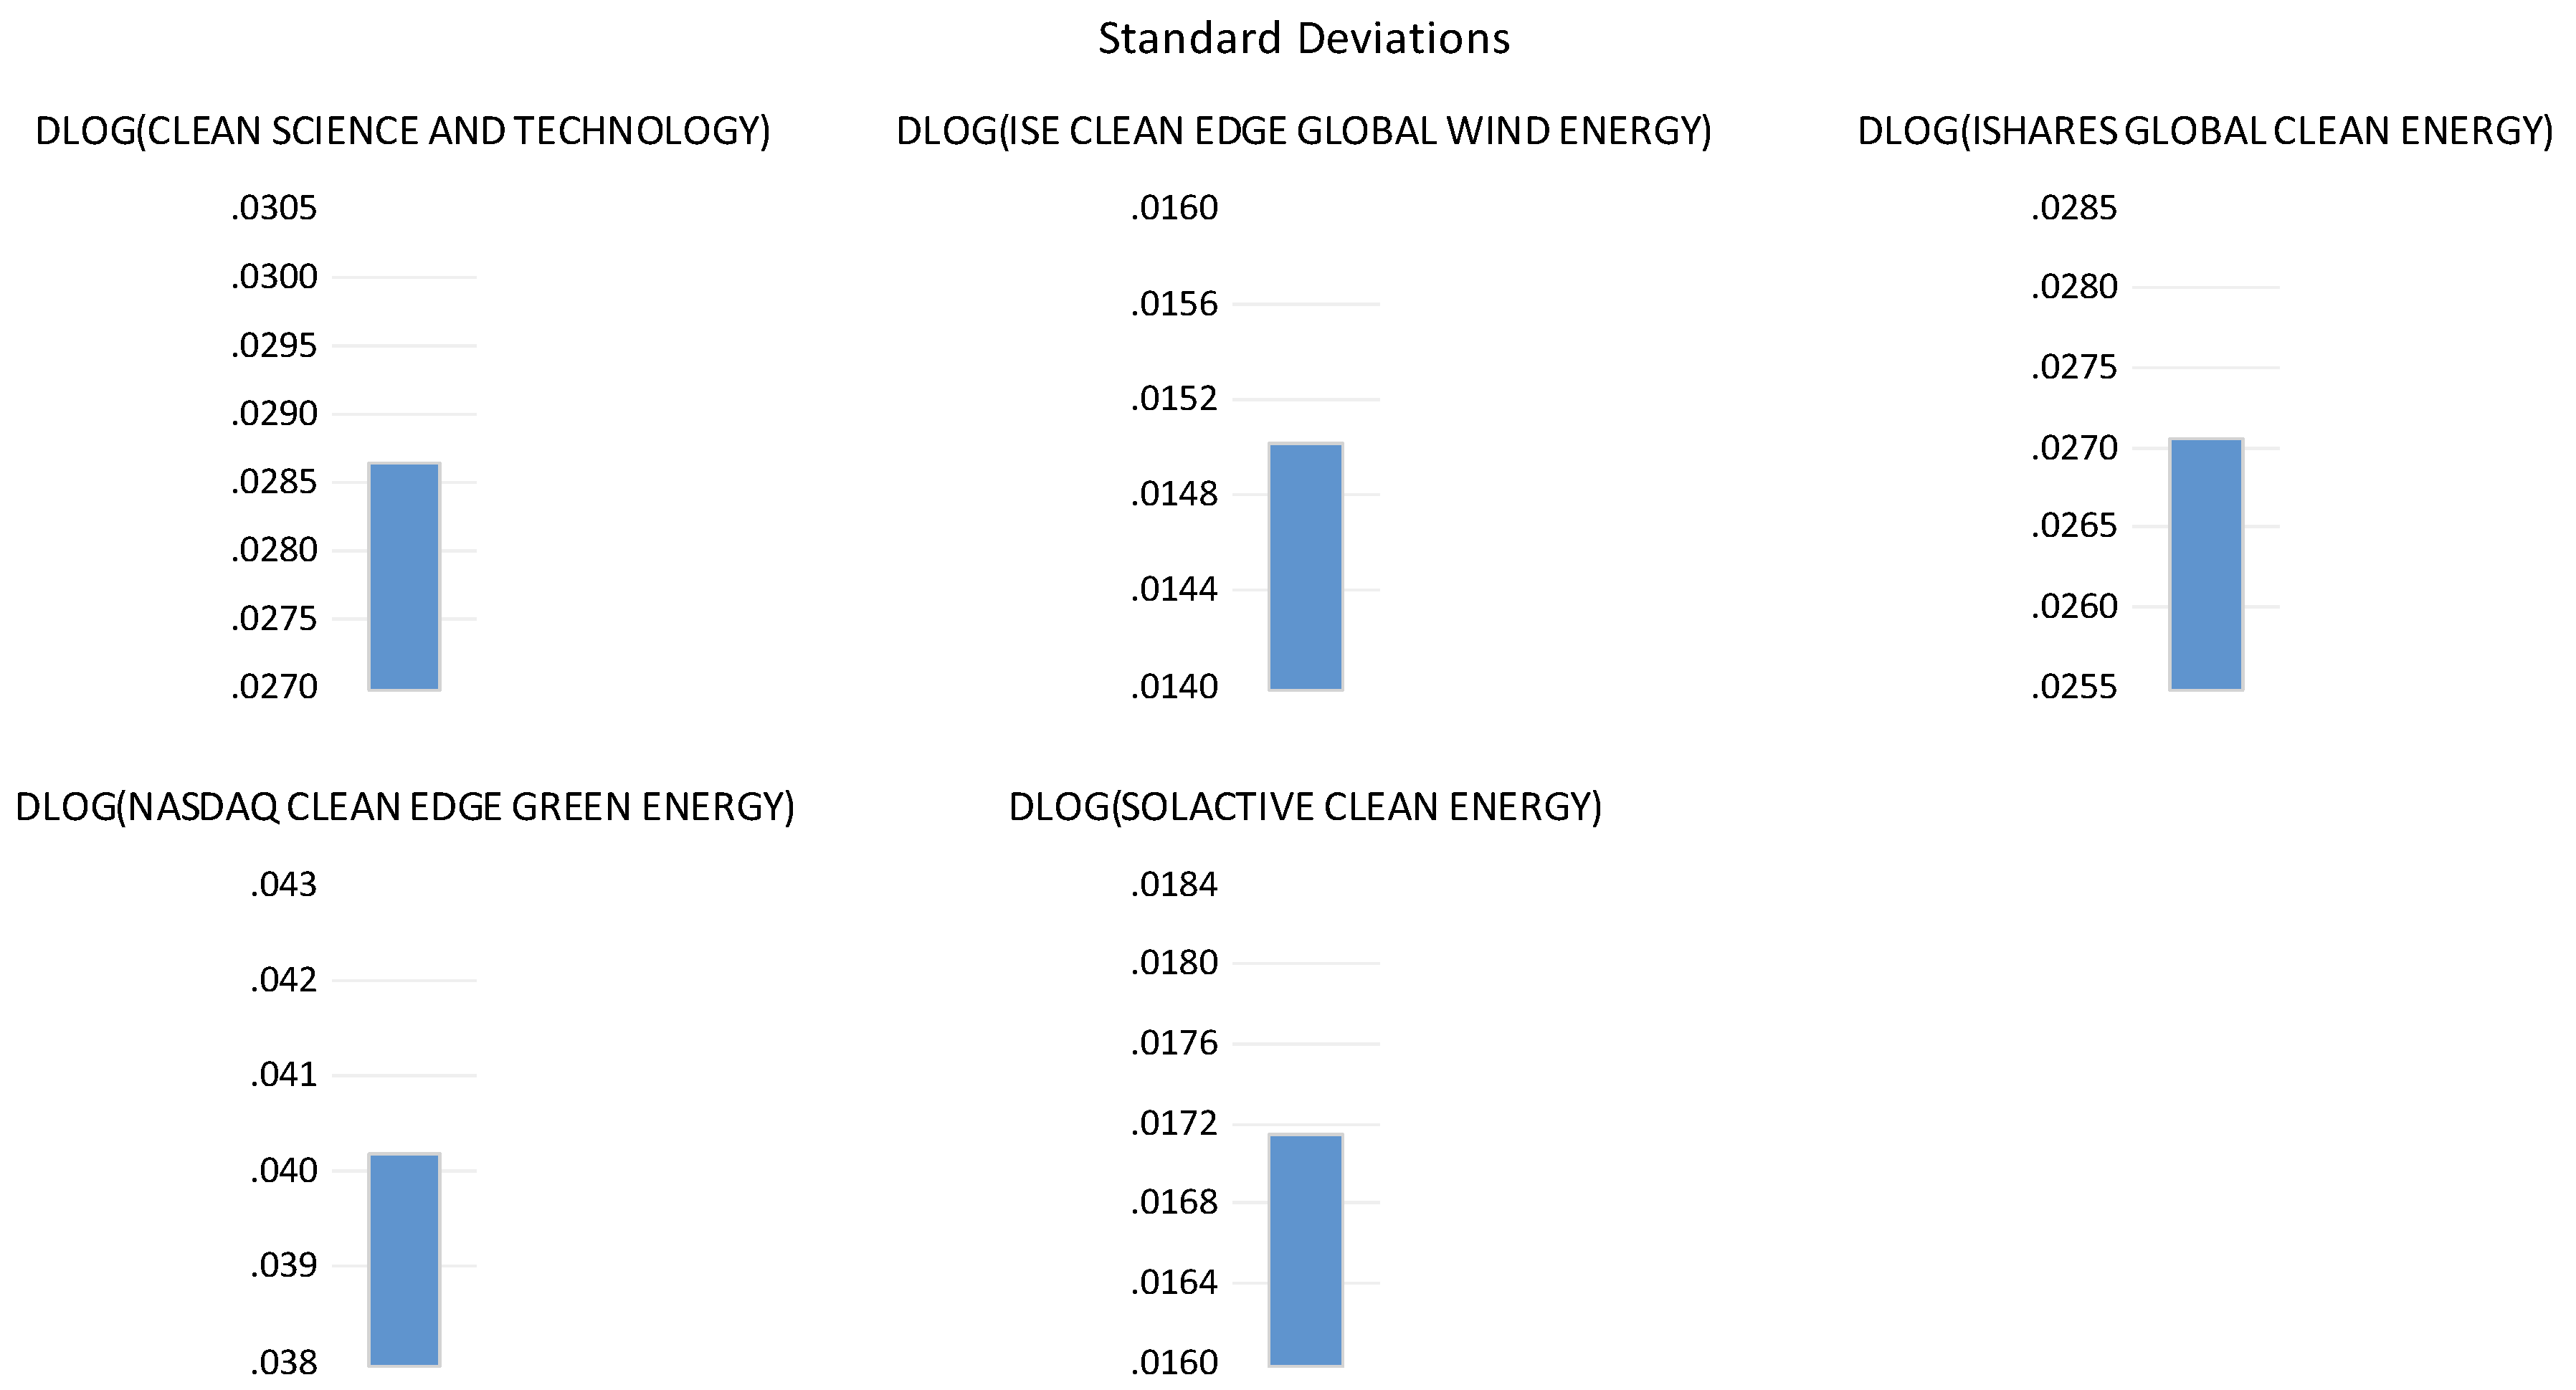
Figure 4.
Evolution of skewness in green stock markets, from October 4, 2021, to October 4, 2023.
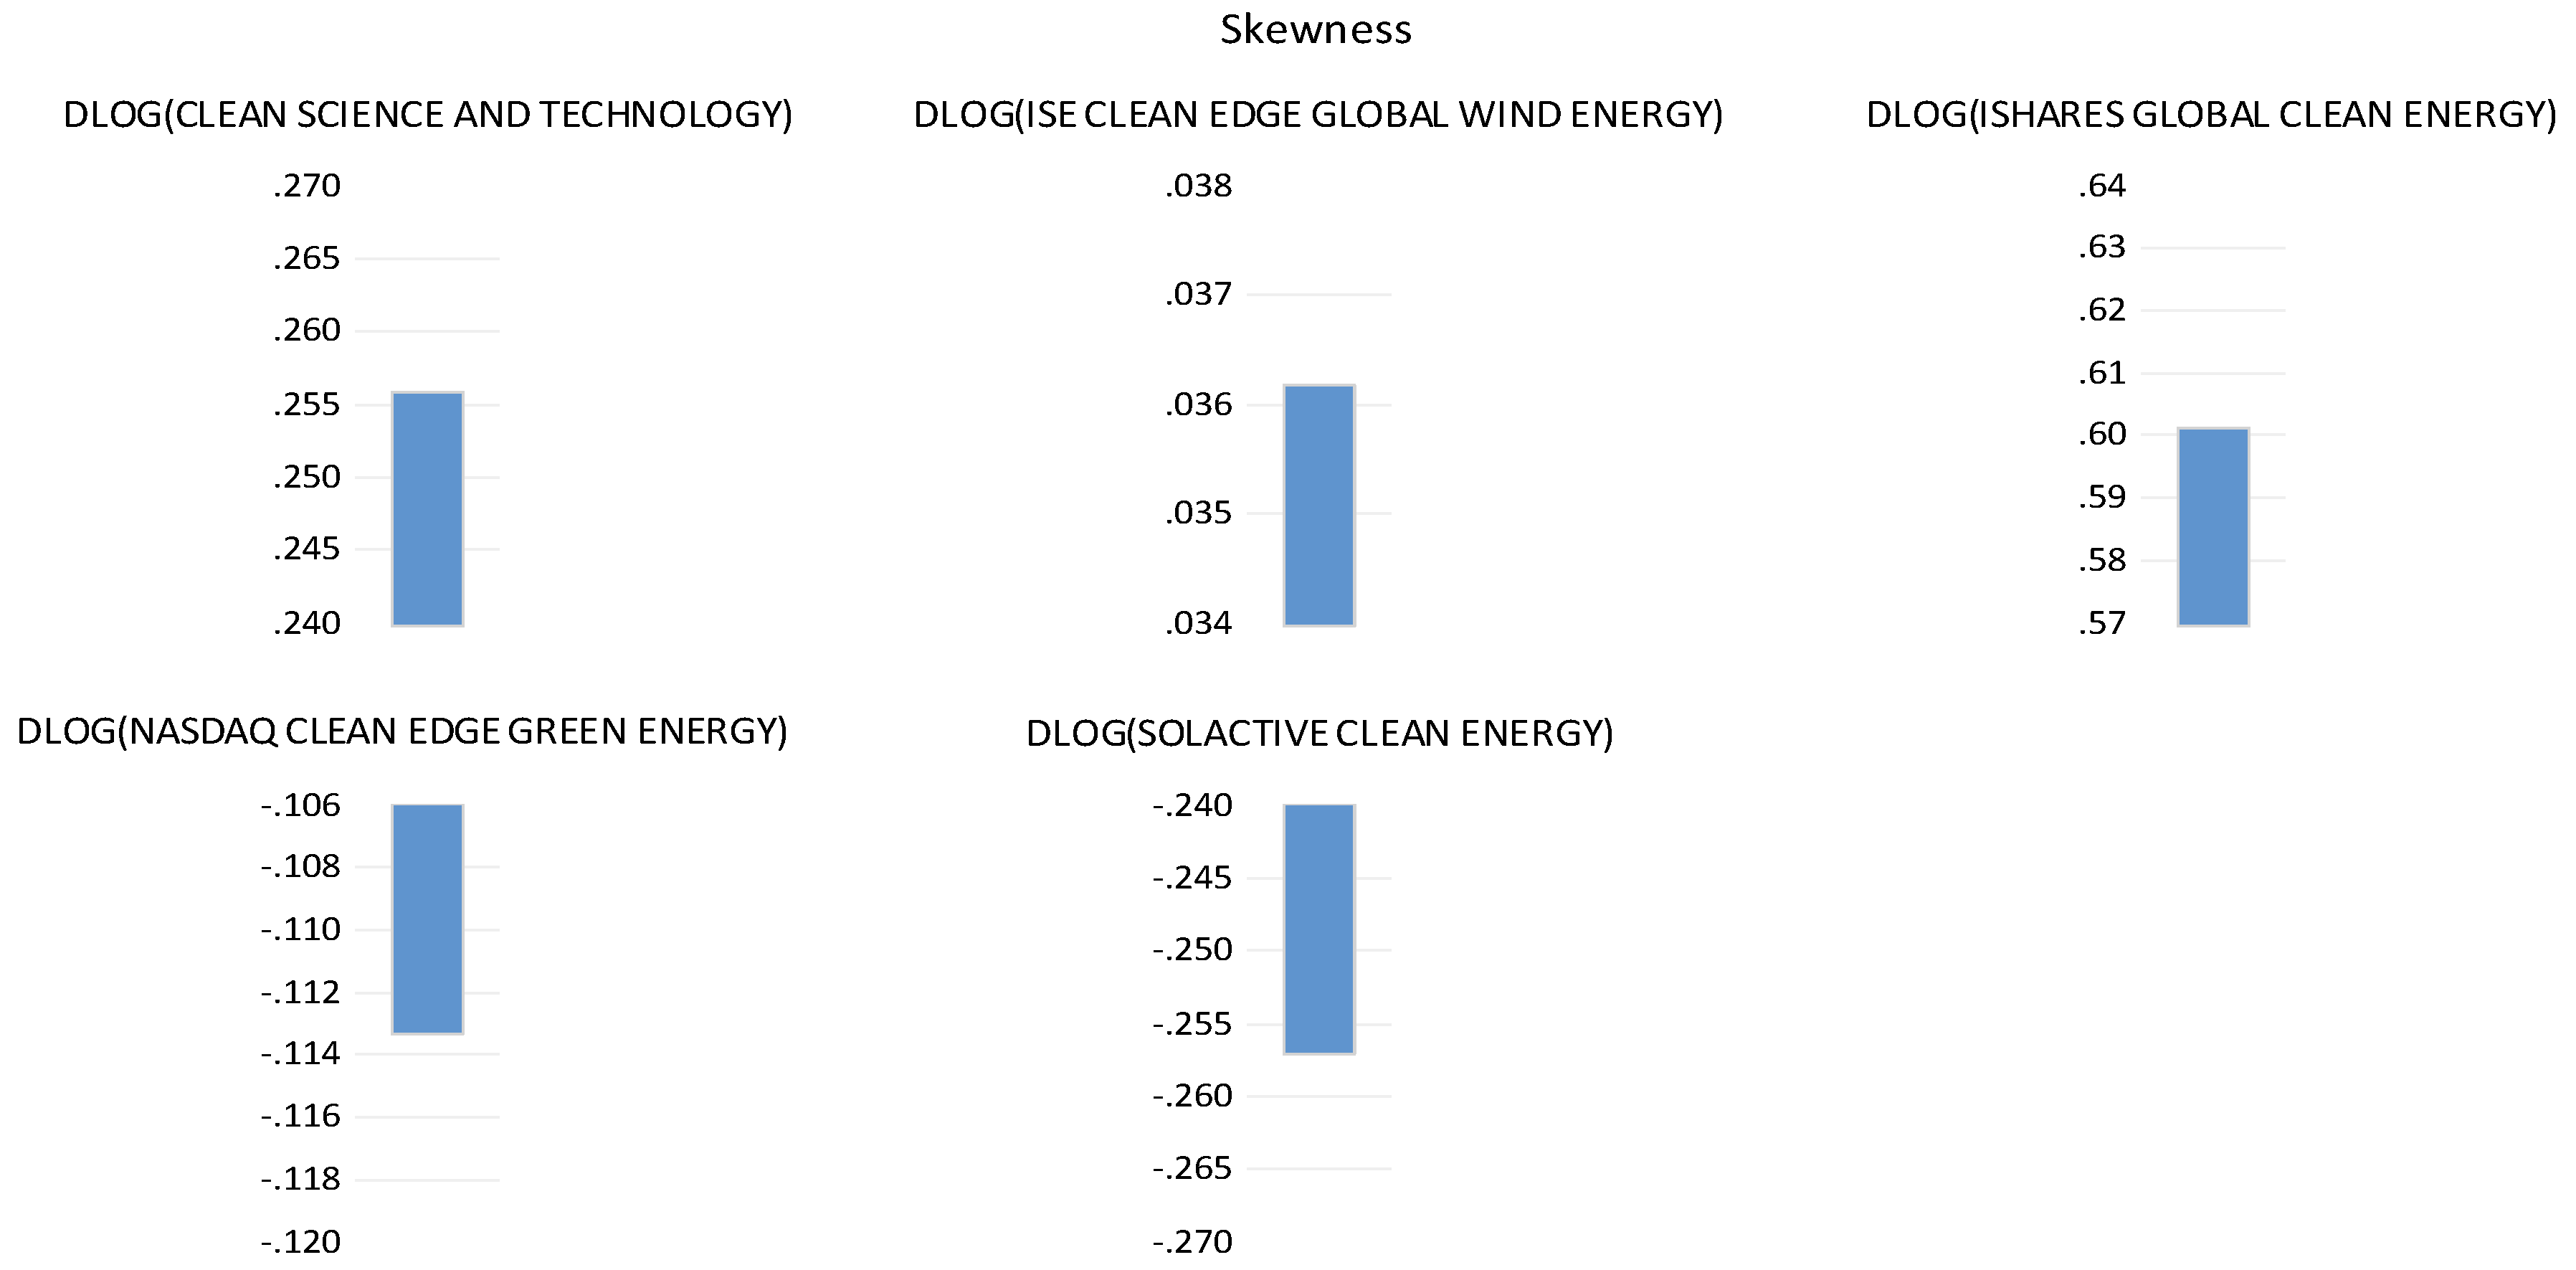
Figure 5.
Evolution of the kurtosis values in the green stock indexes from October 4, 2021, to October 4, 2023.
Figure 5.
Evolution of the kurtosis values in the green stock indexes from October 4, 2021, to October 4, 2023.
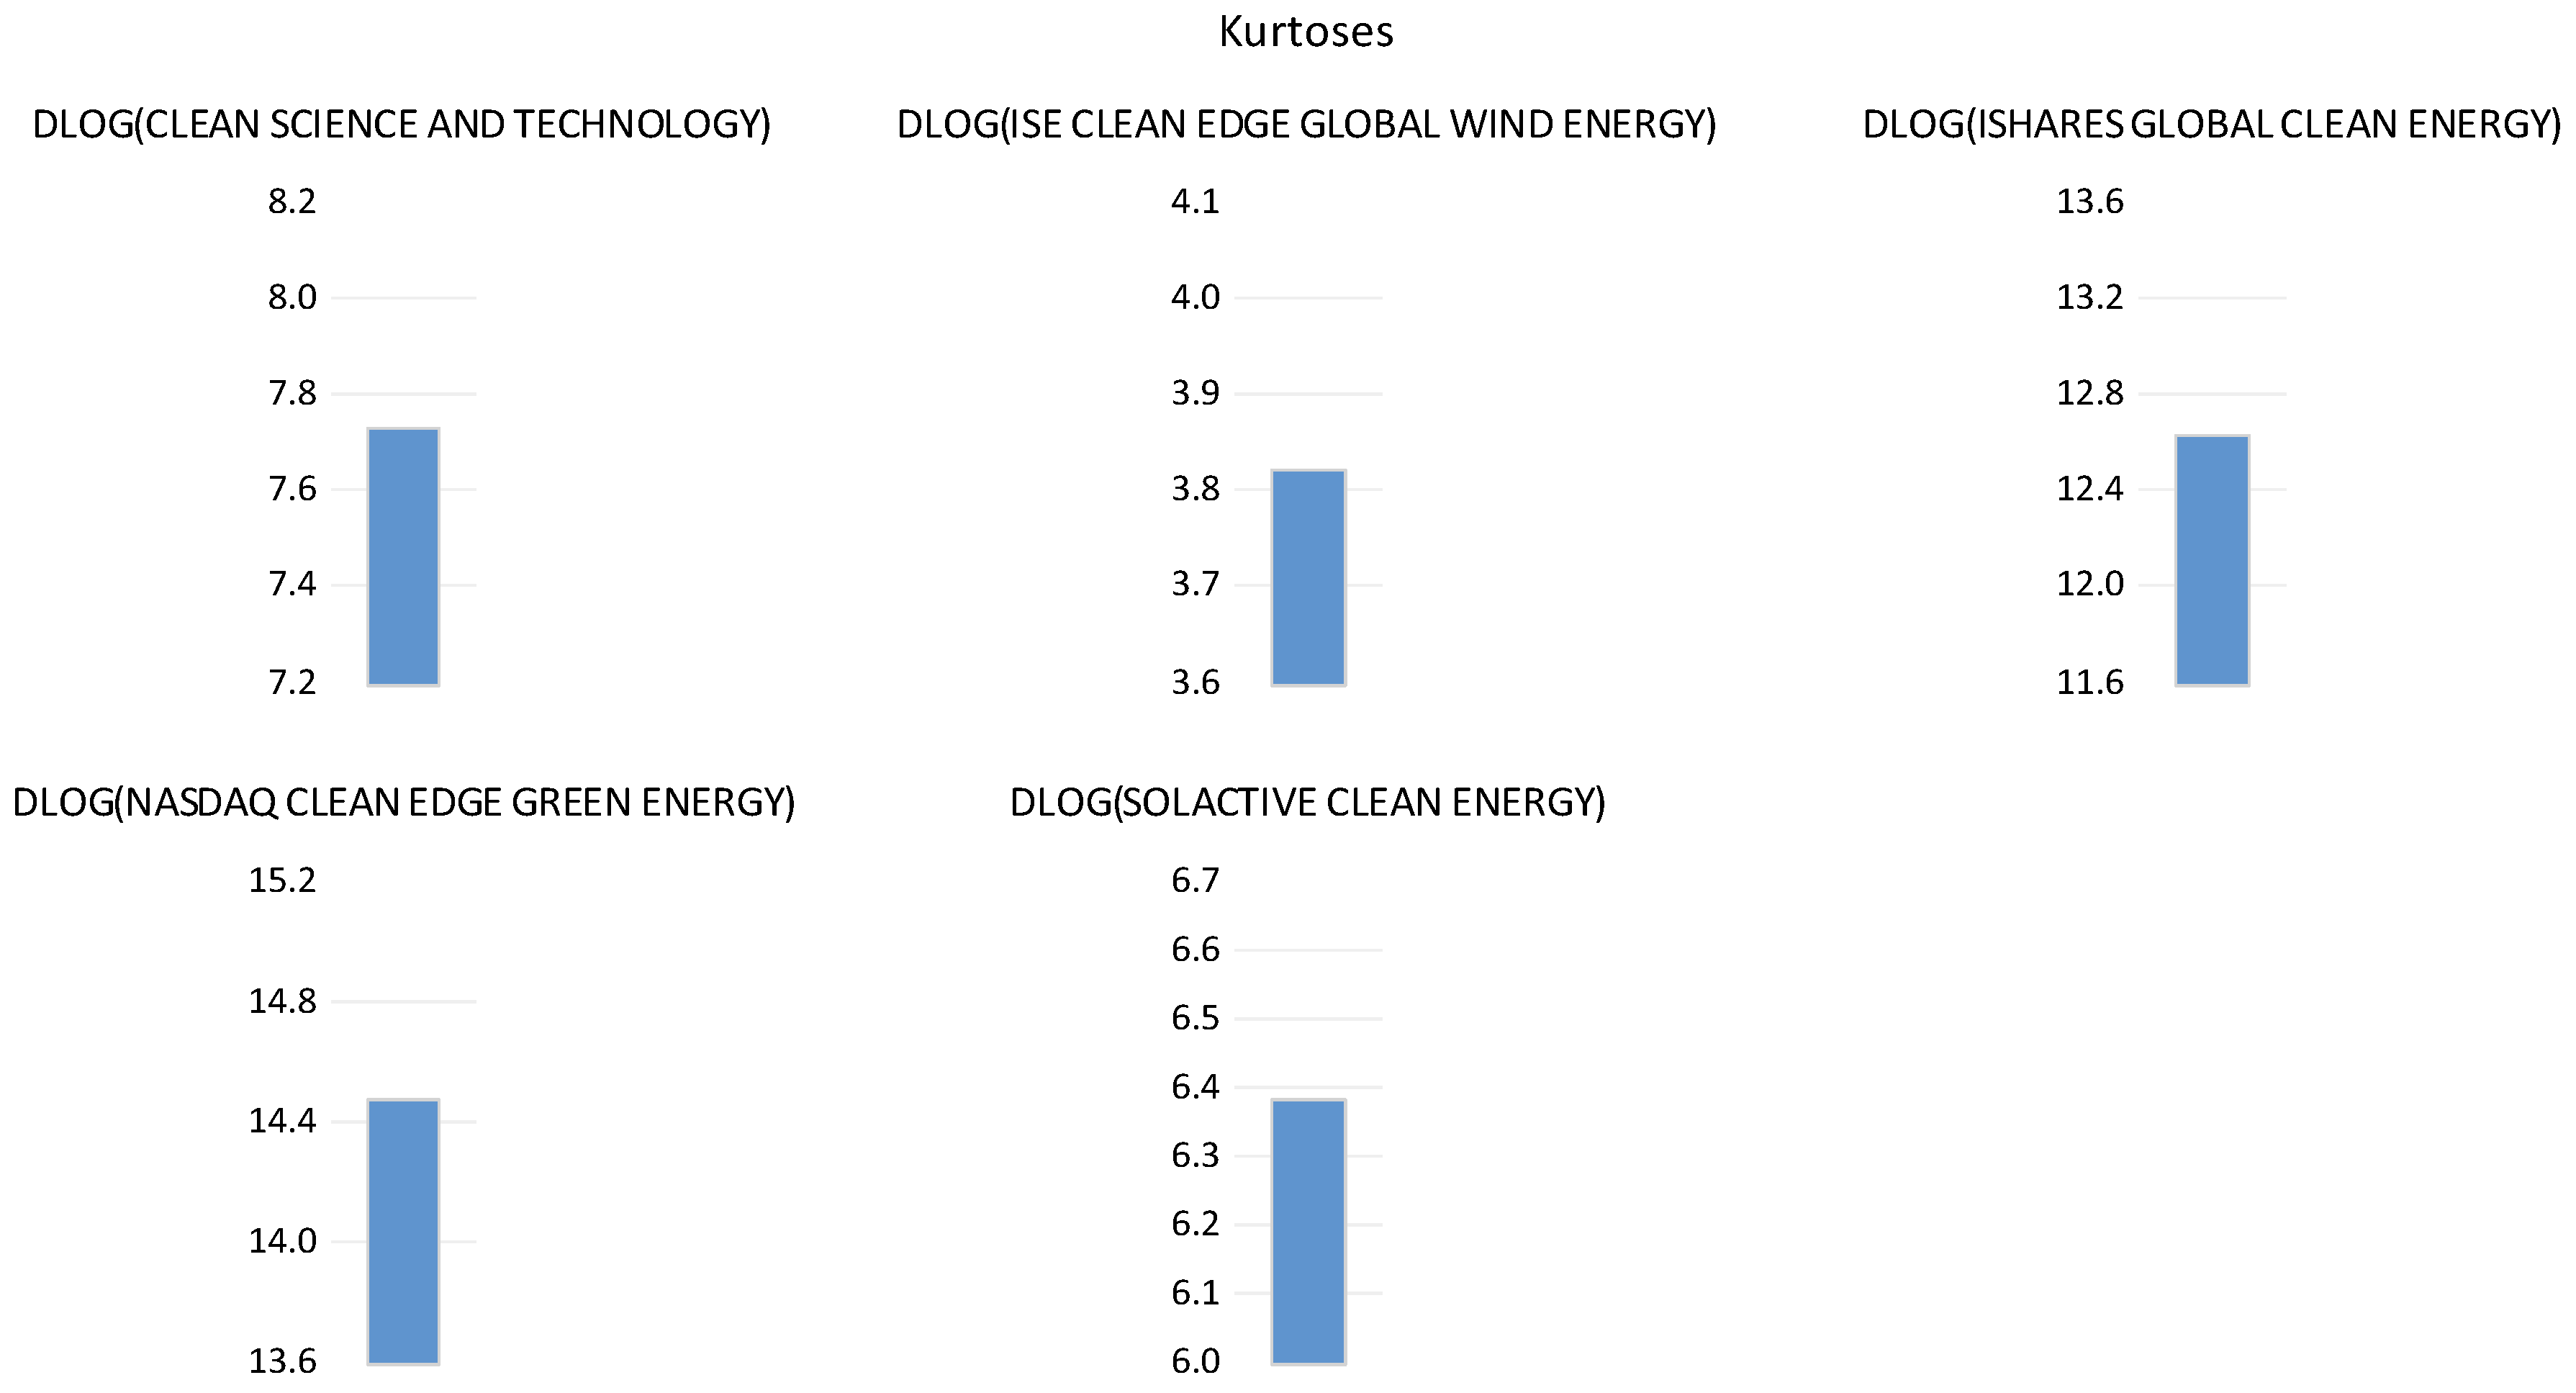
Figure 6.
Summary graphs of the results of the structural break unit root test concerning green stock indexes under analysis, from October 2021 to October 2023.
Figure 6.
Summary graphs of the results of the structural break unit root test concerning green stock indexes under analysis, from October 2021 to October 2023.
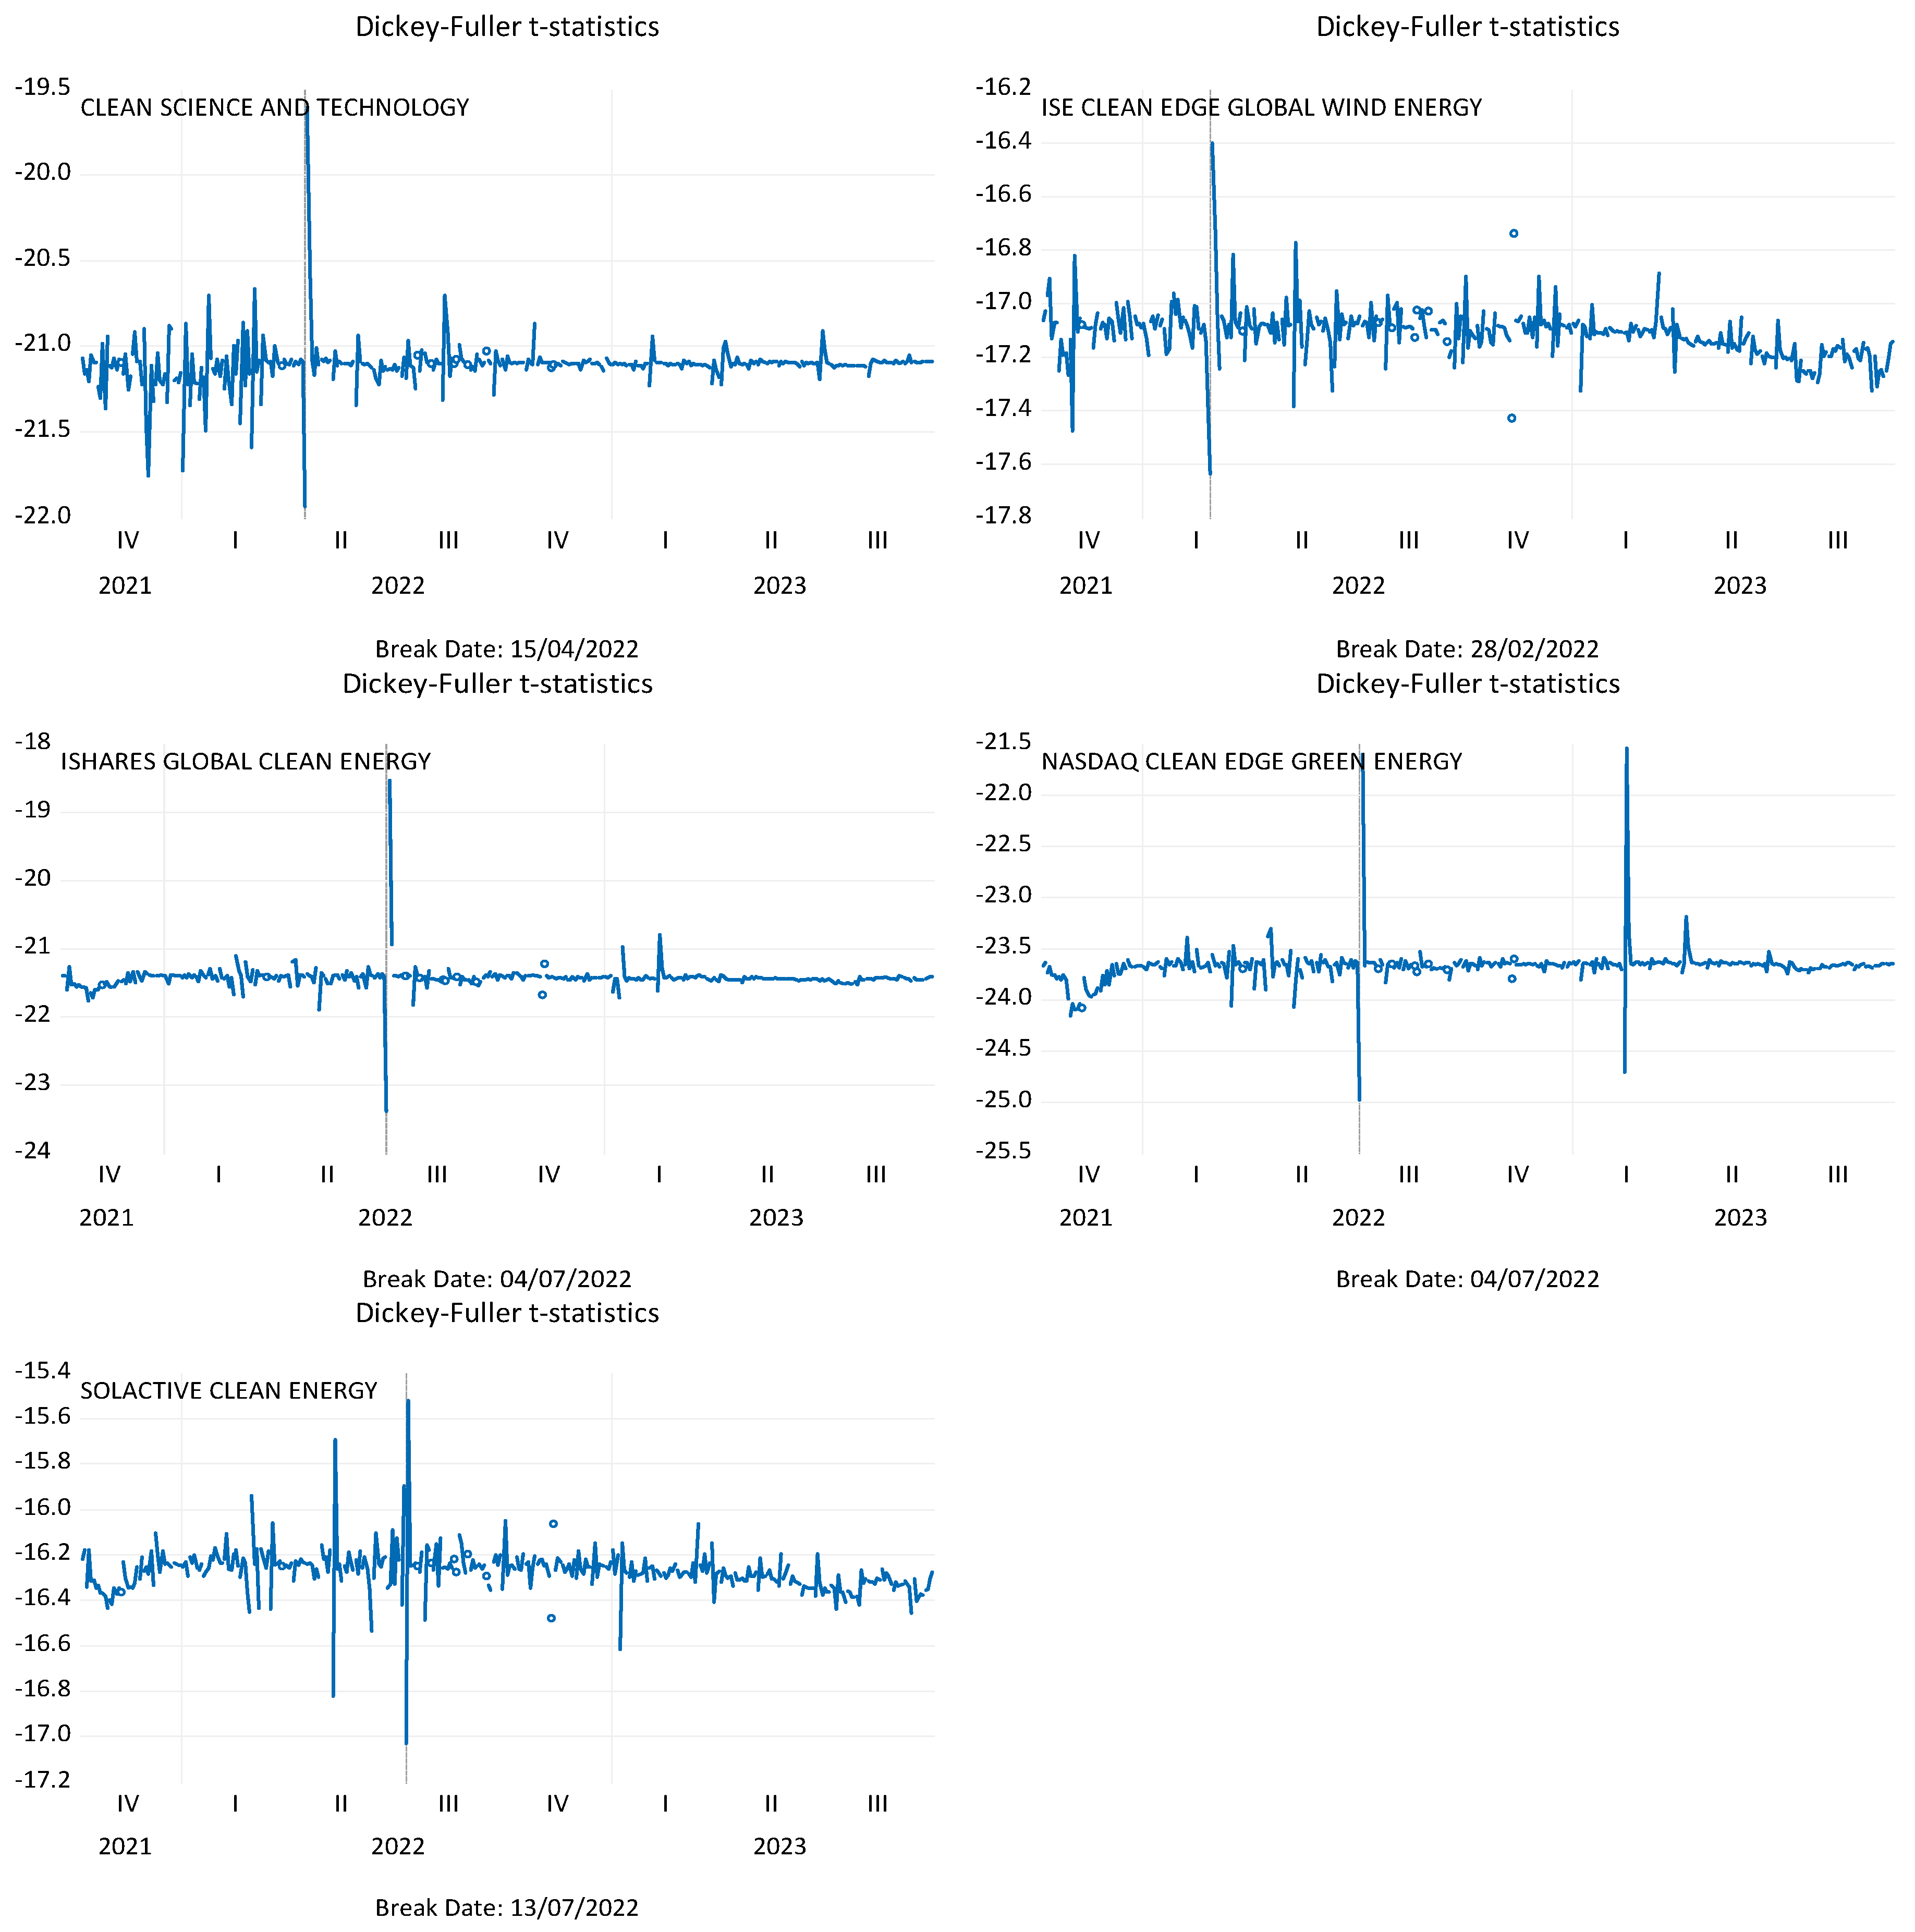

Table 1.
Detrended Fluctuation Analysis interpretation (DFA).
| Exponent | Type of signal |
| long-range anti-persistent | |
| ≃ 0.5 | uncorrelated, white noise |
| > 0.5 | long-range persistent |
Source: Own elaboration.
Table 2.
[40] Fisher Chi-square and Choi Z-stat., in returns, concerning green stock indexes, from October 4, 2021, to October 4, 2023.
Table 2.
[40] Fisher Chi-square and Choi Z-stat., in returns, concerning green stock indexes, from October 4, 2021, to October 4, 2023.
| Null Hypothesis: Unit root (individual unit root process) | |||
|---|---|---|---|
| Method | Statistic | Prob. * | |
| PP - Fisher Chi-square | 879.493 | 0.0000 | |
| PP - Choi Z-stat | -29.0333 | 0.0000 | |
| Series | Prob. | Bandwidth | Obs. |
| CLEA.NS | 0.0000 | 4.0 | 373 |
| GWE | 0.0000 | 4.0 | 373 |
| ICLN.O | 0.0000 | 2.0 | 373 |
| CELS | 0.0000 | 4.0 | 373 |
| COLCLNNEP | 0.0000 | 1.0 | 373 |
Source: Own elaboration. Note: * Probabilities for Fisher tests are computed using an asymptotic Chi-square distribution. All other tests assume asymptotic normality.
Table 3.
Summary outcomes derived from the Rankings and Signals Test [43] conducted on green stock indexes under analysis, from October 4, 2021, to October 4, 2023.
Table 3.
Summary outcomes derived from the Rankings and Signals Test [43] conducted on green stock indexes under analysis, from October 4, 2021, to October 4, 2023.
| Null Hypothesis: CLEAN SCIENCE and TECHNOLOGY is a random walk | ||||
| Joint Tests | Value | df | Probability | |
| Max |z| (at period 2) | 9.994939 | 374 | 0.0000 | |
| Wald (Chi-Square) | 100.2079 | 4 | 0.0000 | |
| Period | Var. Ratio | Std. Error | z-Statistic | Probability |
| 2 | 0.483174 | 0.051709 | -9.994939 | 0.0000 |
| 4 | 0.255180 | 0.096738 | -7.699338 | 0.0000 |
| 8 | 0.158066 | 0.152957 | -5.504395 | 0.0000 |
| 16 | 0.102001 | 0.227607 | -3.945399 | 0.0000 |
| Null Hypothesis: CLEAN SCIENCE and TECHNOLOGY is a martingale | ||||
| Joint Tests | Value | df | Probability | |
| Max |z| (at period 2) | 6.308470 | 374 | 0.0000 | |
| Wald (Chi-Square) | 39.93788 | 4 | 0.0000 | |
| Period | Var. Ratio | Std. Error | z-Statistic | Probability |
| 2 | 0.673797 | 0.051709 | -6.308470 | 0.0000 |
| 4 | 0.508021 | 0.096738 | -5.085668 | 0.0000 |
| 8 | 0.441176 | 0.152957 | -3.653478 | 0.0000 |
| 16 | 0.443182 | 0.227607 | -2.446405 | 0.0130 |
| Null Hypothesis: ISE CLEAN EDGE GLOBAL WIND ENERGY is a random walk | ||||
| Joint Tests | Value | df | Probability | |
| Max |z| (at period 2) | 8.178828 | 374 | 0.0000 | |
| Wald (Chi-Square) | 68.85653 | 4 | 0.0000 | |
| Period | Var. Ratio | Std. Error | z-Statistic | Probability |
| 2 | 0.577083 | 0.051709 | -8.178828 | 0.0000 |
| 4 | 0.289840 | 0.096738 | -7.341051 | 0.0000 |
| 8 | 0.164139 | 0.152957 | -5.464694 | 0.0000 |
| 16 | 0.089025 | 0.227607 | -4.002407 | 0.0000 |
| Null Hypothesis: ISE CLEAN EDGE GLOBAL WIND ENERGY is a martingale | ||||
| Joint Tests | Value | df | Probability | |
| Max |z| (at period 2) | 5.377712 | 374 | 0.0000 | |
| Wald (Chi-Square) | 31.30177 | 4 | 0.0000 | |
| Period | Var. Ratio | Std. Error | z-Statistic | Probability |
| 2 | 0.721925 | 0.051709 | -5.377712 | 0.0000 |
| 4 | 0.494652 | 0.096738 | -5.223865 | 0.0000 |
| 8 | 0.379679 | 0.152957 | -4.055535 | 0.0000 |
| 16 | 0.320187 | 0.227607 | -2.986787 | 0.0030 |
| Null Hypothesis: ISHARES GLOBAL CLEAN ENERGY is a random walk | ||||
| Joint Tests | Value | df | Probability | |
| Max |z| (at period 2) | 9.417171 | 374 | 0.0000 | |
| Wald (Chi-Square) | 88.78441 | 4 | 0.0000 | |
| Period | Var. Ratio | Std. Error | z-Statistic | Probability |
| 2 | 0.513050 | 0.051709 | -9.417171 | 0.0000 |
| 4 | 0.273813 | 0.096738 | -7.506716 | 0.0000 |
| 8 | 0.177030 | 0.152957 | -5.380412 | 0.0000 |
| 16 | 0.125721 | 0.227607 | -3.841181 | 0.0000 |
| Null Hypothesis: ISHARES GLOBAL CLEAN ENERGY is a martingale | ||||
| Joint Tests | Value | df | Probability | |
| Max |z| (at period 2) | 6.205052 | 374 | 0.0000 | |
| Wald (Chi-Square) | 39.82362 | 4 | 0.0000 | |
| Period | Var. Ratio | Std. Error | z-Statistic | Probability |
| 2 | 0.679144 | 0.051709 | -6.205052 | 0.0000 |
| 4 | 0.494652 | 0.096738 | -5.223865 | 0.0000 |
| 8 | 0.433155 | 0.152957 | -3.705920 | 0.0000 |
| 16 | 0.315508 | 0.227607 | -3.007345 | 0.0010 |
| Null Hypothesis: NASDAQ CLEAN EDGE GREEN ENERGY is a random walk | ||||
| Joint Tests | Value | df | Probability | |
| Max |z| (at period 2) | 9.257230 | 374 | 0.0000 | |
| Wald (Chi-Square) | 85.71079 | 4 | 0.0000 | |
| Period | Var. Ratio | Std. Error | z-Statistic | Probability |
| 2 | 0.521320 | 0.051709 | -9.257230 | 0.0000 |
| 4 | 0.282798 | 0.096738 | -7.413840 | 0.0000 |
| 8 | 0.171109 | 0.152957 | -5.419128 | 0.0000 |
| 16 | 0.110758 | 0.227607 | -3.906923 | 0.0000 |
| Null Hypothesis: NASDAQ CLEAN EDGE GREEN ENERGY is a martingale | ||||
| Joint Tests | Value | df | Probability | |
| Max |z| (at period 2) | 6.825558 | 374 | 0.0000 | |
| Wald (Chi-Square) | 47.55788 | 4 | 0.0000 | |
| Period | Var. Ratio | Std. Error | z-Statistic | Probability |
| 2 | 0.647059 | 0.051709 | -6.825558 | 0.0000 |
| 4 | 0.521390 | 0.096738 | -4.947470 | 0.0000 |
| 8 | 0.467914 | 0.152957 | -3.478670 | 0.0010 |
| 16 | 0.395722 | 0.227607 | -2.654922 | 0.0050 |
| Null Hypothesis: SOLACTIVE CLEAN ENERGY is a random walk | ||||
| Joint Tests | Value | df | Probability | |
| Max |z| (at period 2) | 7.740761 | 374 | 0.0000 | |
| Wald (Chi-Square) | 63.64372 | 4 | 0.0000 | |
| Period | Var. Ratio | Std. Error | z-Statistic | Probability |
| 2 | 0.599735 | 0.051709 | -7.740761 | 0.0000 |
| 4 | 0.295083 | 0.096738 | -7.286844 | 0.0000 |
| 8 | 0.165171 | 0.152957 | -5.457946 | 0.0000 |
| 16 | 0.078355 | 0.227607 | -4.049289 | 0.0000 |
| Null Hypothesis: SOLACTIVE CLEAN ENERGY is a martingale | ||||
| Joint Tests | Value | df | Probability | |
| Max |z| (at period 2) | 5.170877 | 374 | 0.0000 | |
| Wald (Chi-Square) | 29.24052 | 4 | 0.0000 | |
| Period | Var. Ratio | Std. Error | z-Statistic | Probability |
| 2 | 0.732620 | 0.051709 | -5.170877 | 0.0000 |
| 4 | 0.521390 | 0.096738 | -4.947470 | 0.0000 |
| 8 | 0.418449 | 0.152957 | -3.802064 | 0.0000 |
| 16 | 0.290775 | 0.227607 | -3.116009 | 0.0010 |
Source: Own elaboration.
Table 4.
DFA results of green stock indexes under analysis, from October 4, 2021, to October 4, 2023.
Table 4.
DFA results of green stock indexes under analysis, from October 4, 2021, to October 4, 2023.
| Green Stock Indexes | DFA exponent (crisis period) |
| CLEA.NS | = 0.99) |
| GWE | = 0.99) |
| ICLN.O | = 0.98) |
| CELS | = 0.99) |
| COLCLNNEP | = 0.99) |
Source: Own elaboration. Note: The hypotheses are and .
Disclaimer/Publisher’s Note: The statements, opinions and data contained in all publications are solely those of the individual author(s) and contributor(s) and not of MDPI and/or the editor(s). MDPI and/or the editor(s) disclaim responsibility for any injury to people or property resulting from any ideas, methods, instructions or products referred to in the content. |
© 2023 by the authors. Licensee MDPI, Basel, Switzerland. This article is an open access article distributed under the terms and conditions of the Creative Commons Attribution (CC BY) license (http://creativecommons.org/licenses/by/4.0/).
Copyright: This open access article is published under a Creative Commons CC BY 4.0 license, which permit the free download, distribution, and reuse, provided that the author and preprint are cited in any reuse.


