1. Introduction
Greenhouse gas accounting conventions have played a major role in framing our understanding of what human activities cause climate change, and in guiding policy responses [
1]. Several assumptions were made when these accounting conventions were first developed, because land use emission processes were unclear, land carbon emissions were thought to be part of a self-balancing biosphere carbon pool, and aerosol cooling and atmospheric interaction of emissions were little known. These assumptions include the focus on fossil fuel emissions, the adoption of net land carbon accounting, exclusion of aerosol cooling and the arbitrary choice of 100 year GWPs to compare gases [
2].
Since these conventions were framed climate science has advanced and estimates of biosphere and ocean carbon flux have improved. One recent advance in emissions accounting – consistent gross CO
2 accounting – has substantially boosted the value of land use emissions, particularly deforestation, placing fossil fuels second to land use as a carbon emission source [
3]. A second development - emissions-based Effective Radiative Forcing (ERF) – has removed the need for time period-related metrics to compare different gases, enabling potentially more accurate estimates of climate impact of each gas [
4]. Thirdly, when cooling emissions are included, this allow us to better determine responsibility for present day warming and to re-examine policy responses. Newly available time series datasets, together with ERF models constrained to observations, now allow us to more fully answer the question “What human activities have caused present-day warming?”
The aim of this study is to consolidate arguments supporting these accounting changes, to combine and apply these to emissions data from 1750-2020, to compare their impact, and to establish sector responsibility for present-day warming. The novel aspect of this study is to determine the combined effect of these proposed advances, to test their validity and to explore their usefulness to climate policy.
2. Review of novel emissions accounting advances
2.1. Consistent CO2 emissions accounting
The IPCC inventory category Land Use/Land Use Change and Forestry (LULUCF) reports
net CO
2 emissions and sinks on ‘managed’ land, whereas all other emissions, CO
2 or otherwise, are reported as
gross [
5]. Wedderburn-Bisshop 2024 reviews the arguments supporting consistent
gross accounting and its implications, finding that LULUCF has released more CO
2 than fossil fuels, with
gross emissions 2.8 times greater than
net since 1750 [
3]. Consistent accounting thereby boosts the relative climate impact of sectors causing LULUCF emissions, notably agriculture and forestry.
Presently, convention dictates that 100% of fossil carbon is counted but only a third of LULUCF carbon is counted (the part that remains in the atmosphere to cause warming). The inconsistency here is that carbon emissions from all sources have an equal proportion remaining in the atmosphere. To be consistent, carbon emissions from all sources could be assessed as net or gross. Here we adopt the latter.
Extending this reasoning, slash and burn agriculture – where regrowth follows deforestation – has been noted as an example where net accounting may be justified. However, we believe that photosynthesis cannot be claimed as anthropogenic, other than plantings, as it occurs
despite human intervention. Making the distinction that Nature is responsible for plant growth and humanity responsible for deforestation underlines the need for full gross carbon accounting to more fully describe sources and sinks [
3].
Net LULUCF CO2 accounting was also justified with the reasoning that fossil fuel carbon is ‘truly new carbon’, additional to the biosphere carbon pool. Gross carbon accounting (consistent with treatment of all other emissions) reasons that old growth deforestation carbon is equally ‘new carbon’.
2.2. Inclusive accounting
Sector contributions are incomplete due to conventional partial accounting. This is most obvious in the case of fossil fuels, where co-emitted aerosols, whose cooling has until now masked most CO
2 warming, are rarely reported [
4]. Including short term emissions leads to a more comprehensive and inclusive inventory, however there are other factors that must be considered, such as the dangers presented by aerosols to human health [
6] as well as implications for longer term warming (see 5.3).
Partial accounting is also evident in attributing land use emissions to agriculture. Although several authors have looked at comprehensive land and agriculture emissions, eg [
7,
8], net accounting is used and past deforestation is overlooked. Fossil carbon emissions overtook land emissions in the 1960’s, but warming from past land carbon emissions continues. This can be rectified by incorporating past deforestation as done here, or by including carbon opportunity cost in yearly inventories [
9]. Agricultural fire emissions are also partially and inconsistently accounted, as discussed in Supplementary Material.
2.3. Using ERF for sector comparison
Debate on how to compare the various greenhouse emission species has been robust, particularly comparing CO
2 to methane [
10], hindering agreement on mitigation effectiveness and sector comparisons [
11]. 100-year Global Warming Potentials (GWP
100) are the conventional IPCC metric, but recent advances in emissions-based Effective Radiative Forcing (ERF) and derived Global Surface Air Temperature (GSAT) change, as described in the IPCC’s AR6 Section 6.4 and Supplementary Material 6.SM.1 [
4], present a more comprehensive and less time period-related means of comparing emission species.
Emissions-based ERFs are tested and constrained with historic observations, making them ideal for this study of warming since 1750 [
12]. ERF is believed to produce more accurate estimates of climate impact for agriculture because conventional GWP use can distort mitigation effectiveness [
13]. Although ERFs are seen to be most useful for this study, the benefit of GWPs is that their time periods can be chosen for future climate target dates [
11]. Matthews et al., 2009, validate the use of sector cumulative emissions, finding that climate response is not sensitive to background concentrations or timing of those emissions [
14].
Aviation is comparable to agriculture in that it produces an array of long- and short-lived emissions, aerosols, as well as water vapour and cloud impacts. ERF is now commonly used in aviation climate impact studies as the most accurate means of comparing these disparate emissions and impacts [
15].
2.4. Loss of additional sink capacity (LASC)
Land use change such as deforestation not only causes landscape carbon loss but also prevents future additional vegetation carbon storage that would have occurred, mostly due to CO
2 fertilisation. The 1850-2021 timeseries used here is from Dorgeist et al, 2024, who estimate LASC to be 2.7Gt CO
2 /year for the period 2012-2021 [
16].
3. Materials and Methods
3.1. Data Sources
Carbon emission timeseries from 1750 to 2020 are from the Global Carbon Budget, with Houghton and Castanho 2023 (H&C) LULUCF gross CO
2 data, LASC from Dorgeist et al, 2024, with timeseries data for all other emission species from PRIMAP-hist, CEDS and FAO data plus fire emissions from the GFED4. Data source references are given in
Table S1. Data on land use carbon deficit are from Erb et al., 2018 [
17], and crop outputs are further allocated using biomass flows from IPCC AR5 chapter 11 [
18]. Detailed data on agricultural emissions is now available (e.g. [
19]), but these studies do not capture past deforestation.
Emissions-based ERF values since 1750 are from the IPCC’s AR6 Section 6.4, and Supplementary Material 6.SM.1 [
4], with error updates from Roesch et al., 2024 [
20]. Data are limited to the 11 emission species for which emissions-based ERF is documented [
4], being carbon dioxide (CO
2), methane (CH
4), nitrous oxide (N
2O), halocarbons, nitrogen oxides (NOx), non-methane volatile organic compounds (NMVOCs), carbon monoxide (CO), sulphur dioxide (SO
2), organic carbon (OC), black carbon (BC) and ammonia (NH
3). Land use albedo change is from AR6 chapter 7 [
21].
This study has not applied time-discounted land carbon emissions, e.g. [
22]. We believe that no discount rate is warranted when using gross accounting of CO
2 as we do here, because cumulative ERF is calculated for the entire period from 1750, and any discounting based on carbon drawdown could be equally applied to fossil fuel and LULUCF carbon emissions because they share the same fate: biosphere drawdown with a remaining airborne fraction.
3.2. Attributing ERF and GSAT to Sectors
Sectors have been chosen to demonstrate the impact of these accounting advances, being ‘Fossil Fuel’; ‘Industry’; ‘Agriculture’, further divided into ‘Animal Agriculture’ and ‘Other Agriculture’; ’Forestry’; ‘Waste’; and ‘Other’. Animal Agriculture is identified separately due to its high emissions and land use. These sector groupings require dissecting to finer detail, but for the purpose of this study, they demonstrate the concepts. The agriculture categories include land and production emissions only, and do not include on-farm fossil fuel use, processing, or distribution.
Please see
Supplementary materials Section 2 for a full description of Methods. In brief, methods are as follows: Proposed accounting changes as listed in
Table S2 items 1, 2 and 4 are acquired from published datasets as per
Table S1, and ERF is applied in the following manner:
For each emission species, cumulative emissions and sector contribution proportions are taken from the data and multiple studies as referenced, presented in
Tables S4 and S5.
ERFs for each emissions species, as published in AR5, are then allocated to sectors in the derived proportions (
Table S5).
ERFs for each sector are then the sum of ERFs for each species attributed to each sector (
Table S6).
3.3. Errors and Accuracy
Uncertainties are drawn from the source data and published ERF estimates as referenced. Land use emissions are variable from year to year, however the use of cumulative emissions from 1750-2020 minimises any variability influence.
Recent fossil fuel CO
2 emissions are known to +/- 5% [
23], however biosphere carbon flow uncertainty is in the order of +/-20% [
24]. Aerosol cooling is an important contributor to this assessment that has an even higher uncertainty, in the order of +/-70% [
4]. Sector ERF uncertainty estimates are given in Results. These uncertainties imply that this study gives an indicative, rather than exhaustive result, however agriculture emissions are conservative.
Gross LULUCF CO
2 emission values from Houghton and Castanho, 2023, are conservative because: a) deforestation emissions are based on FAO
net in-country data, thereby excluding re-clearing [
25,
26]; b) gross forest loss from finer-grained remote sensing studies indicate that forest loss exceeds current estimates [
27,
28], perhaps four times greater in extent than previous assessments [
29]; and c) emissions are understated due to narrowly defined managed land [
30].
Additionally, there are two major reasons why these values are conservative. Firstly, this study is limited to emissions from 1750-2021, ignoring the 1,100Gt CO
2 deforestation emissions prior to 1750 [
31]. Secondly, carbon from agricultural fires that supress forest regrowth is excluded for reasons given in Supplementary Material, which, if included, would double agricultural carbon emissions [
32].
Several recently published data sets document agricultural emissions to a greater detail than that used here, e.g. [
33,
34], however these use conventional net land carbon accounting and are not directly relatable to the sectors as used here. This offers a useful area for further study.
4. Results
It should be noted that these results are based on the following assumptions: 1. That land use carbon emissions are accounted in full, rather than with conventional net accounting (see 2.1); 2. That both warming and cooling emissions due to each sector be included (see 2.2); and 3. That emissions-based ERFs are more suitable for assessing warming from each gas. Results of applying proposed accounting changes listed in
Table 1 are given in
Supplementary Table S6, and
Figure 1 and
Figure 2 below.
4.1. Consistent gross LULUCF CO2 accounting
Of the accounting advances applied here, consistent gross CO2 emissions accounting is the most unconventional but consequential. Gross accounting finds that since 1750 agriculture has emitted 98% as much CO2 as fossil fuel, and forestry has emitted 30% as much CO2 as fossil fuel.
Forestry carbon emissions (timber harvest and wood fuel) are estimated here proportionally to land carbon deficit. However, comprehensive forestry sources and sinks can be quite complex, e.g. [
35], therefore our Forestry estimate here should be seen as indicative.
4.2. Sector ERF and GSAT
ERF of each emission species is attributed to sectors as described in 3.2, and derived sector ERF and GSAT values are presented in
Table S6.
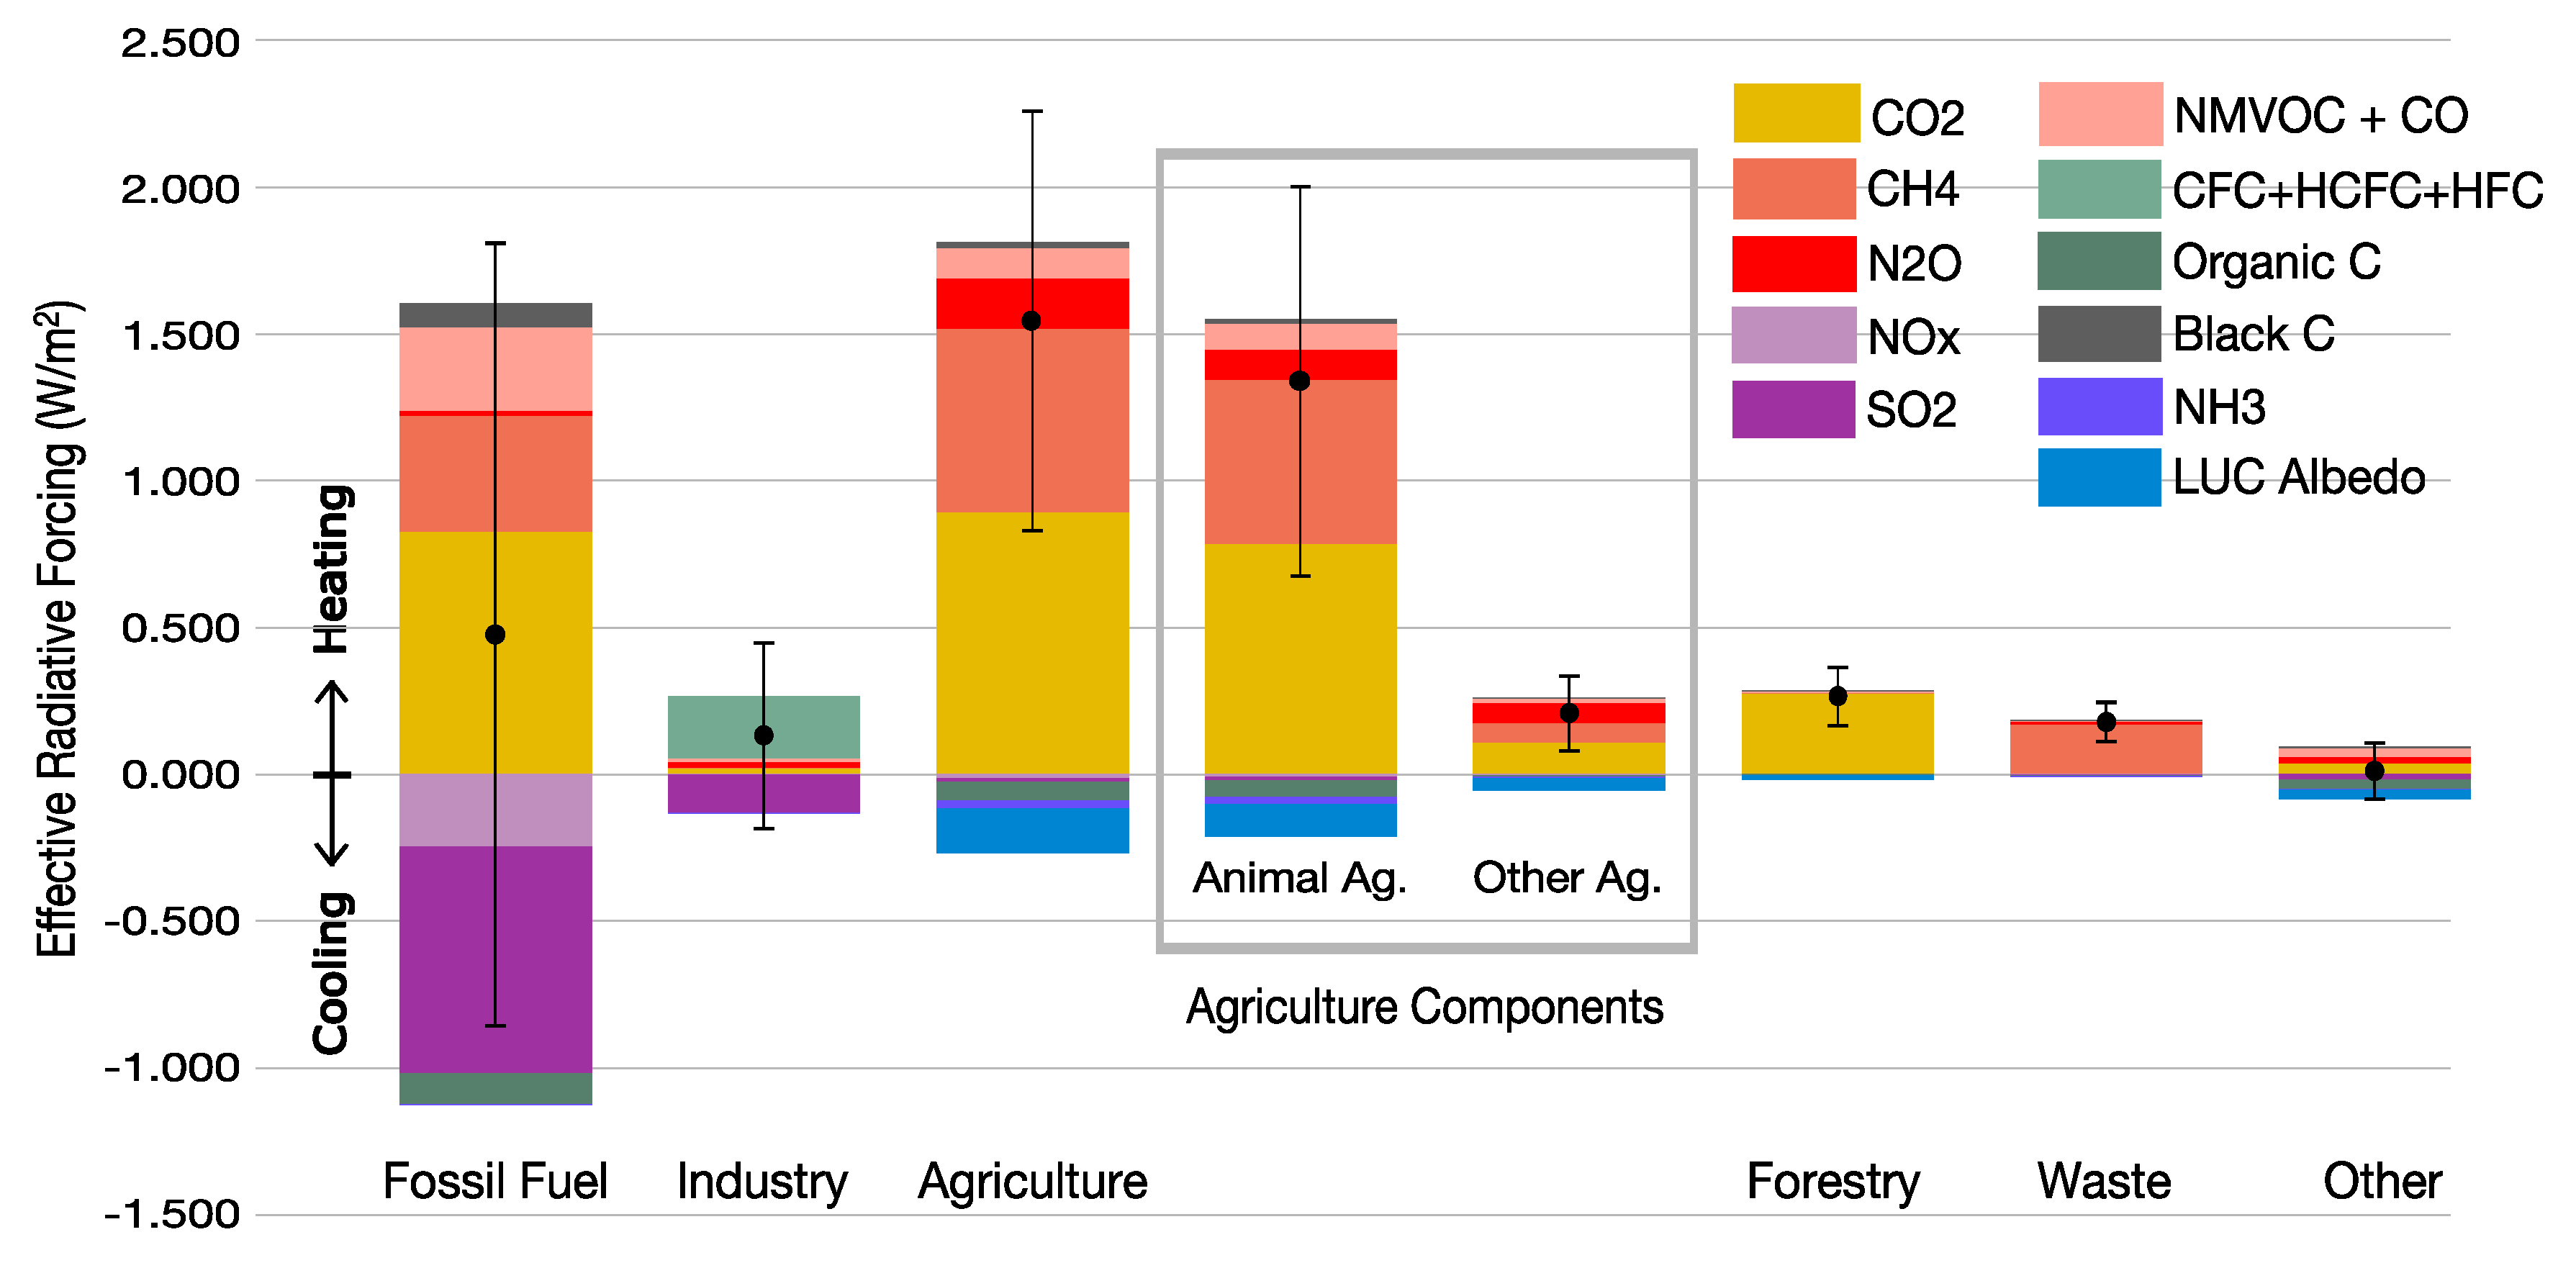
This attribution finds that agriculture has caused 0.74ºC (0.47º-0.99ºC) net GSAT warming from 1750 to 2020, with 86% of this (0.64ºC, 0.42º-0.85ºC) attributable to animal agriculture. Fossil fuels have caused 0.21ºC (-0.44º-0.85ºC) net GSAT change due to strong SO2 and NOx aerosol cooling. Methane, having no cooling co-emissions, is responsible for 0.60ºC (0.41º-0.78ºC) warming. Inclusive accounting finds that fossil fuel warming is 0.79°C together with 0.59°C cooling from co-emissions, whereas agriculture has caused 0.86°C warming but only 0.13°C cooling, with most of the cooling from land use albedo change and organic carbon from fires.
Figure 1 presents results from
Table S5, showing sector ERF due to each emission species and land use albedo change.
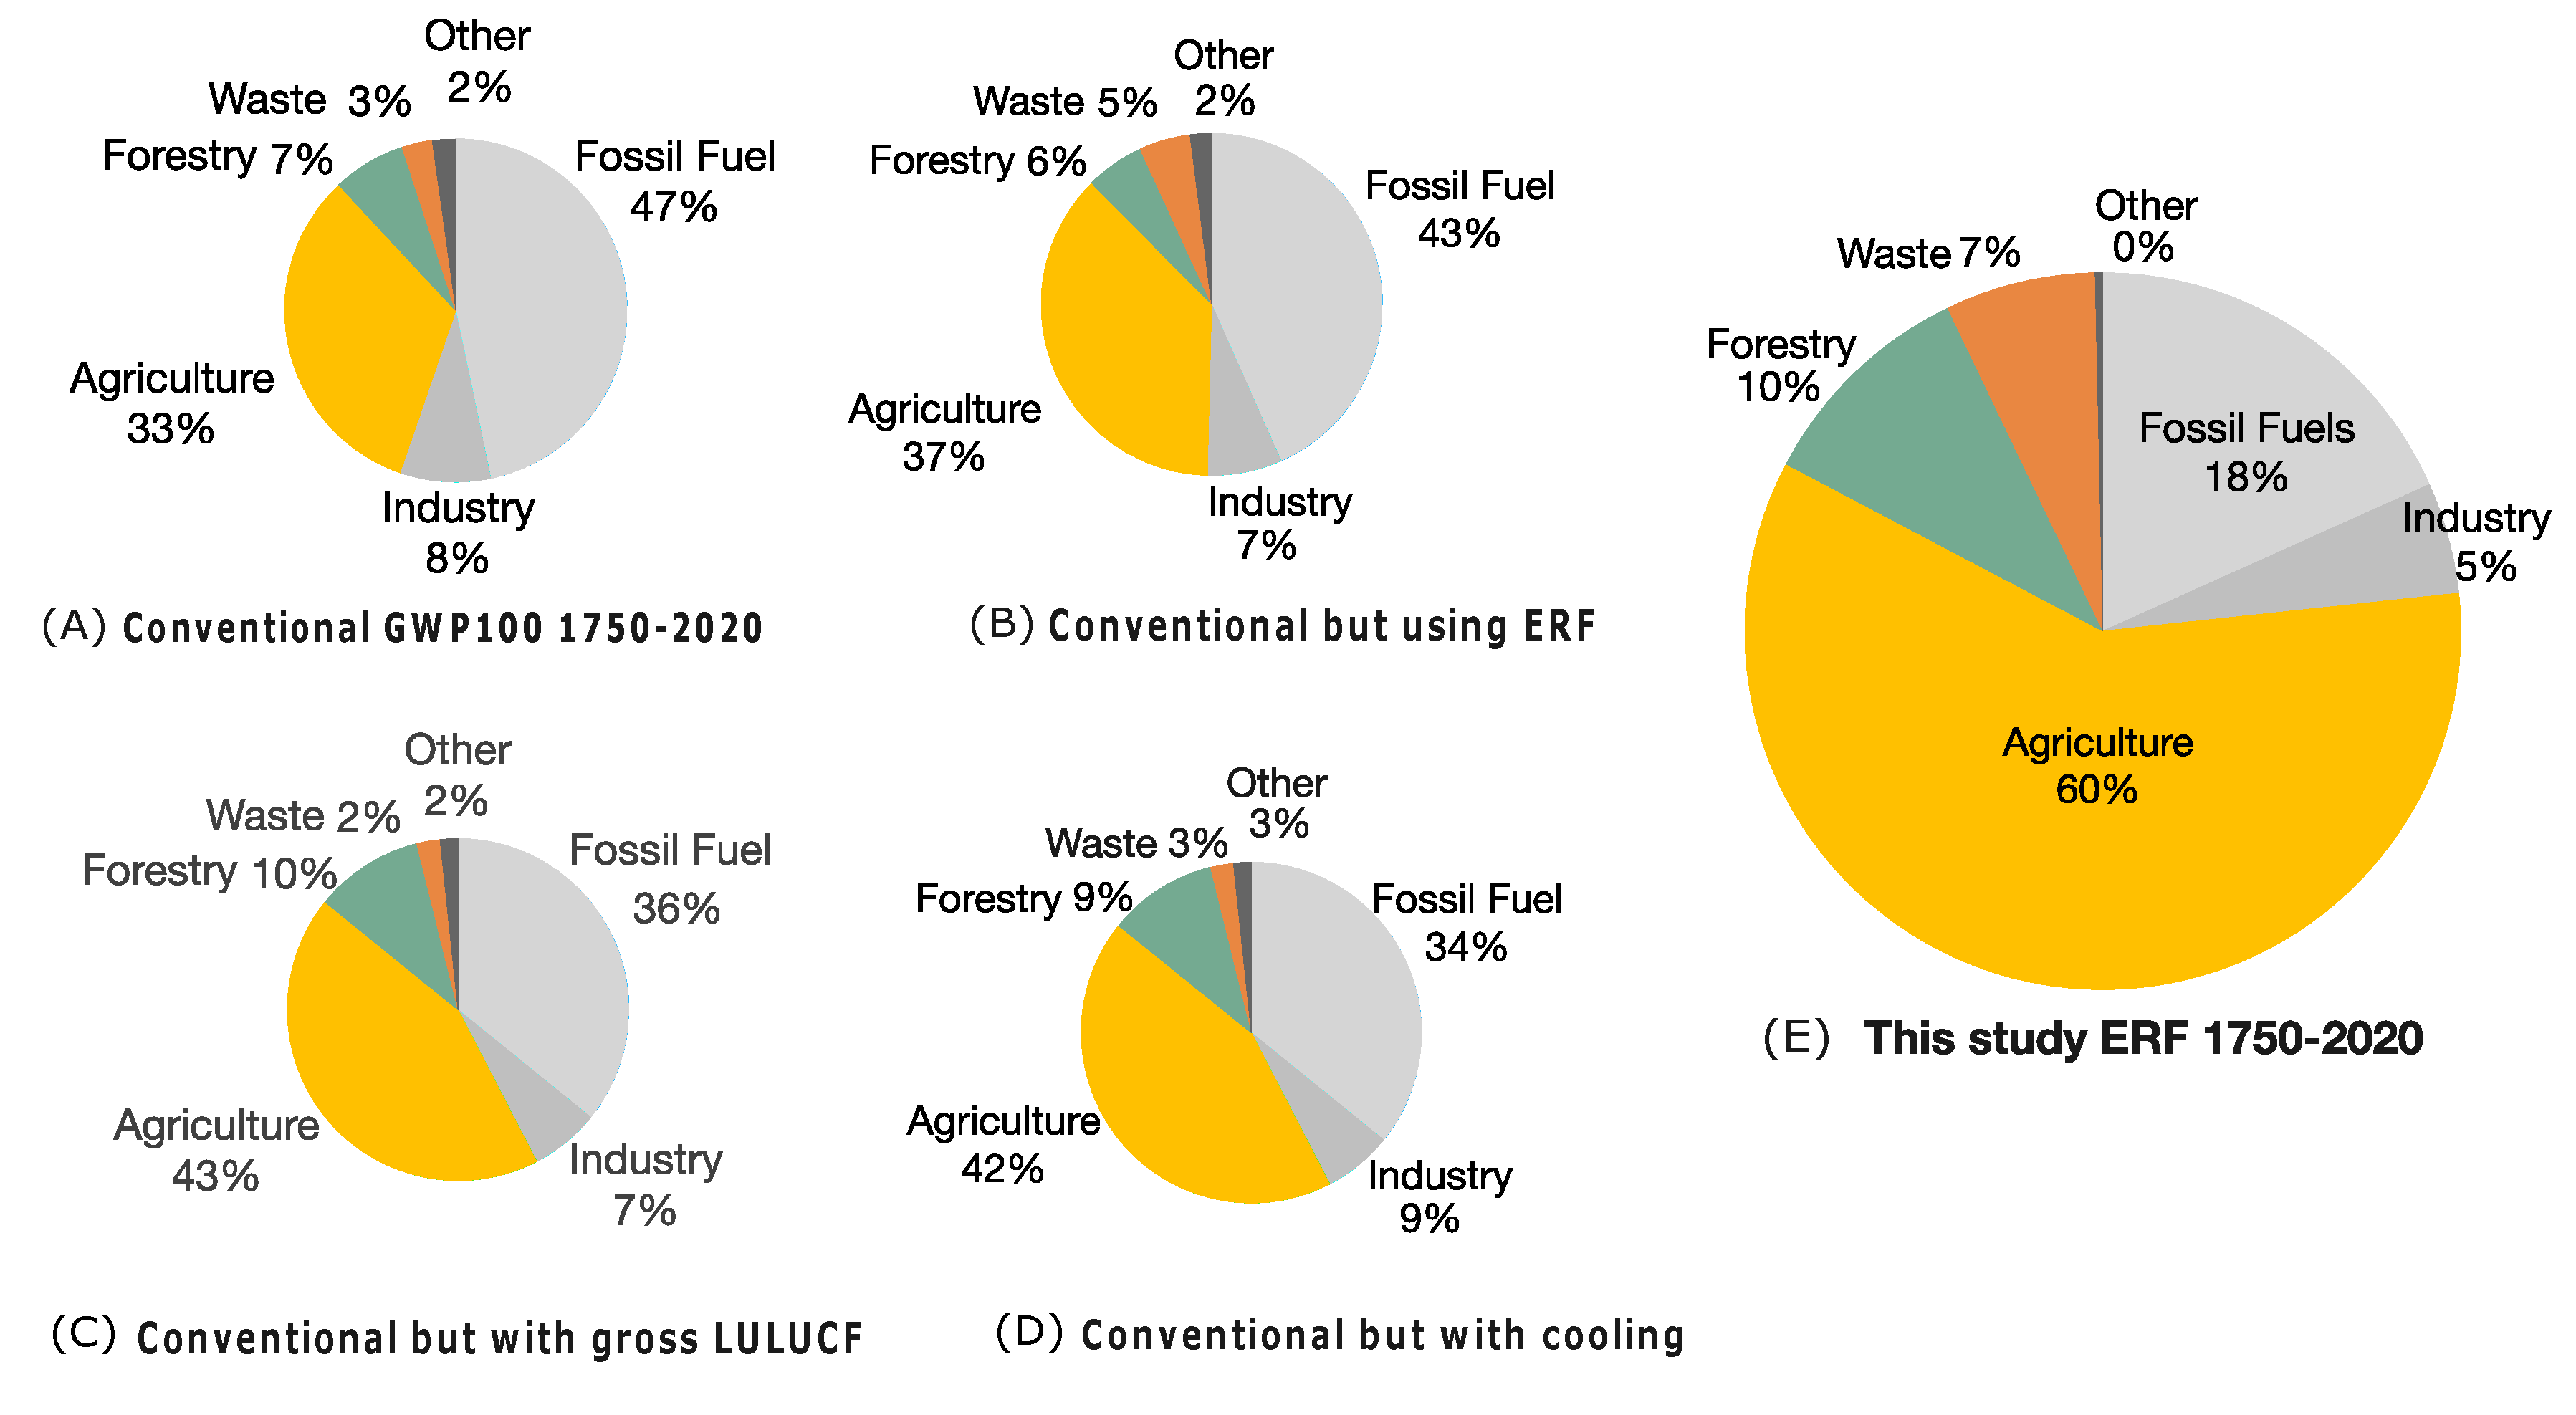
Figure 2 compares the impact of each of the accounting changes using the full 1750-2020 datasets.
Figure 2A shows conventional accounting (including the use of GWP
100).
Figure 2B–D show conventional accounting but with each of the proposed changes included individually.
Figure 2B shows conventional accounting but using IPCC published ERF values instead of GWPs to compare emission species. Note that ERF values reflect greater warming from methane.
Figure 2C depicts convention but with gross LULUCF carbon accounting, and
Figure 2D depicts convention but with cooling emissions included. Sector contributions are most influenced by the use of gross LULUCF and the inclusion of cooling emissions.
Figure 2E shows the sector results of applying all proposed accounting changes, summarising the results shown in
Figure 1. Here we see that gross LULUCF and the inclusion of cooling emissions have a rather dramatic impact on sector responsibility for present-day warming, with agriculture dominating at 60% of warming.
4.3. Validation and sensitivity analyses
Gross LULUCF carbon accounting and sector attribution: Present-day land use offers a reasonability test on land carbon emissions, being the result of all previous land use changes. The 2019 IPCC report on climate change and land [
36] finds that grazing pastures take up 37% of the ice-free land; managed forests 22%; and cropland 12%, with built-up land taking up 1%. Grazing therefore uses 75% of agricultural land, with cropland using 25%. This compares with the carbon deficit as used here of 49% for grazing, 25% for crops, 23% for forestry and 2% for infrastructure. This comparison is reasonable considering that cropland emissions are greater due to higher original forest cover, and about half of grazing land was originally grassland, resulting in lower carbon loss.
A sensitivity analysis was carried out using 15% higher and 15% lower gross LULUCF carbon emissions. This increased/decreased total carbon emissions, but the relative ranking of sectors did not change.
Sector contributions using ERF rather than GWPs: In other studies using this methodology, Dreyfus et al., 2022 [
37] used ERF in a similar way, finding that fossil fuels had caused 20% of net global warming to 2015. Here we find fossil fuels caused 17% of net warming to 2020 (
Figure 2E). In addition, Dreyfus et al. found methane to be responsible for 50% of GSAT temperature rise, whereas we find it to have caused 49% of net GSAT.
As a comparison with GWPs, from 1750 to 2020, 4216Gt of CO2 and 26.4Gt of methane was emitted from all sources, causing 2.058W/m2 and 1.195W/m2 ERF respectively. Cumulative methane emissions therefore caused 92 times more ERF than CO2 since 1750 by weight. This value can be partially explained by the use of gross carbon accounting, but is greater than the conventional GWP20 factor of 82. If emissions were tabulated each year using the conventional GWP100 factor, this would have underestimated methane’s ERF.
A sensitivity analysis was carried out using the same ERF dataset, but with emission sector proportions from recent emissions data (from 2000 to 2021). This approach is a test on sensitivity to sector proportions such as fossil fuels becoming the dominant CO2 emission source circa 1965, and the dramatic rise in all emission species, particularly the 250% rise in airborne methane. As expected, the fossil fuels/industry sector rose slightly in ranking, but agriculture remained the leading emissions sector.
5. Discussion
5.1. Significant findings
Consistent, inclusive accounting as applied here clearly identifies agriculture as the leading cause of present-day global warming, substantially due to CO2 from past and present deforestation and methane. Unlike fossil fuels, agriculture has produced minimal cooling emissions to mask its warming.
With this accounting, animal agriculture provides ‘low hanging fruit’ mitigation opportunities that could benefit several Earth systems, particularly biodiversity and climate. Animal agriculture is the greatest methane emitter, but it also offers the greatest carbon opportunity cost/drawdown potential.
This accounting brings into focus the impact of methane, which has caused a substantial 49% of total net GSAT temperature change and 70% of net fossil GSAT, but without cooling co-emissions, as noted by others [
37]. As noted in
Section 4.3, the use of GWP
100 understates present-day warming from methane. Methane therefore presents itself as a prime target for mitigation, particularly because it is the only means available to slow warming in the near term [
37,
38].
5.2. Usefulness of this accounting
The author believes that this accounting is useful because it:
Offers a more comprehensive and transparent account of sectors driving climate change.
Properly values emissions from past deforestation that are not visible with conventional greenhouse inventory accounting, but which still contribute to warming.
Values current deforestation and avoided deforestation more consistently.
Provides a more transparent and less timeframe-dependent means to compare emission species.
Re-focuses our attention on forests as a major climate disruptor, giving reason for optimism because deforestation is reversible.
Also, this accounting is beneficial in levelling the global north/south divide, in that developed countries deforested long ago can be compared with those experiencing active deforestation. At present, Brazil is being pressured to reduce deforestation, principally by the developed world, and as beneficial as that would be, this accounting would refocus critical attention on previously deforested nations as well as those experiencing current deforestation.
5.3. The dangers of aerosol cooling
Including aerosol cooling is considered necessary for a comprehensive assessment of global warming, however that most cooling aerosols have a strong negative impact on health [
6], and aerosol ERF values still have high uncertainty [
39].
Cooling aerosols, as shown in
Figure 1, although they are short-lived, have masked 75% of ERF from fossil fuel warming, but when skies clear of aerosols this will result in future warming. This is the ‘Faustian bargain’ [
40] that may be accelerating global warming [
41]. Efforts to reduce aerosols due to their health impacts are proving effective [
42], threatening additional warming in coming decades [
39]. Cooling aerosols have been proposed as a geoengineering measure, however this introduces the prospect of ‘cooling credits’, that may dangerously distort carbon markets [
43]. Also, most cooling aerosols have a strong negative impact on health [
6]. The prospect of decreased aerosol cooling emphasises the urgency for quitting fossil fuels and drawing down legacy carbon.
Although values are uncertain, the cooling impact of aerosols is well accepted, as well as the understanding that short term emissions have a long term impact through climate-carbon feedback [
44]. Also, a change to sector ranking is unlikely because LULUCF CO
2 emissions presented here are conservative for reasons given in section 3.3.
5.4. Policy implications
Choice of accounting conventions causes dramatic differences in sector responsibility for present-day climate change as seen in
Figure 2. This indicates a need to review accounting conventions and policy implications.
While quitting fossil fuels remains urgent, this accounting re-focuses our attention on forests. Normalising and adopting gross deforestation emissions accounting would support policies aimed at reducing deforestation and preserving forests, because deforestation and avoided deforestation carbon costs increase in value by a factor of 2.8 [
3]. Knowing that clearing and re-clearing re-release an increasing proportion of fossil carbon [
3] informs policy that destruction of forest of any age could be seen in the same way as burning coal.
Forest restoration may also benefit from policies informed by a greater appreciation of the role of past deforestation in causing climate change. Restoring forests is commonly recognised as the most effective, lowest cost natural mitigation option [
45]. The current atmospheric CO
2 burden is about 1,100Gt, and ocean loading is 690Gt CO
2, some of which would return to the atmosphere if atmospheric CO
2 were lowered. Restoring degraded forest outside agricultural and urban lands could draw down 550 – 1330Gt CO
2 [
46], and based on carbon deficits from Erb et.al., 2018, land used for animal agriculture has a carbon potential of about 540Gt CO
2. Together these would substantially reduce CO
2 atmospheric loading. When methane emissions are also considered, this confirms other findings that strong controls on animal agriculture would have a major impact on climate change [
47].
Agriculture becomes the major disruptor of five planetary boundaries: biosphere integrity, land system change, freshwater change, biogeochemical flows [
48], and now climate change. In the author’s view, this emphasises the need for policies to address this sector if we are to have a liveable future. Agricultural subsidies globally have been described as overwhelmingly harmful [
49]. Initiatives aimed at reducing harmful agricultural subsidies and initiatives such as the EU Green Deal are susceptible to industry influence, and misinformed and uninformed debate has enabled harmful agricultural industries to obstruct understanding and policy [
50]. These accounting advances may usefully support policy reform.
6. Conclusions
This study aimed to review arguments for, and to apply accepted but unconventional advances in emissions accounting, to determine sector responsibility for present-day climate change, and to test their impact and usefulness to policy. These results appear to achieve the aim of portraying sector warming contributions more comprehensively and transparently. While there are reservations related to the inclusion of high uncertainty aerosol cooling, we believe this accounting is useful for these purposes. These results reinforce the value of forests and identify high emission sectors, which we believe will lead to better informed mitigation actions and assist our transition to the age of drawdown.
Supplementary Materials
The following supporting information can be downloaded at the website of this paper posted on Preprints.org. Table S1: Timeseries emission data sources. Table S2: Methodology for attribution of LULUCF carbon emissions to sectors. Table S3: Attribution of emission species to sectors. Table S5: Attribution of emission species proportions to sectors. References [
17,
18,
19,
23,
26,
32,
51,
52,
53,
54,
55,
56,
57,
58,
59,
60] are cited in the Supplementary Materials.
Funding
This research received no external funding.
Data Availability Statement
Acknowledgments
I am also indebted to the many hundreds of dedicated climate scientists who have contributed to the data and the body of science that has enabled the current level of informed debate.
Conflicts of Interest
The author is biased against industrial scale deforestation, witnessed while monitoring deforestation for the Queensland government. This did influence the study topic, however every effort was made to make sure my personal judgement was unbiased.
References
- Ascui F, Lovell H. As frames collide. Accounting, Auditing and Accountability. 2011;24(8):978–99.
- Bonduki Y, Callander BA (eds ), Griggs DJ, Houghton JT, Lim B, Mamaty I, et al. IPCC Guidelines for National Greenhouse Gas Inventories. Vol.3. Greenhouse Gas Inventory Reference Manual. Revised 1996. OECD; 1997. book.
- Wedderburn-Bisshop G. Deforestation – a call for consistent carbon accounting. Environ Res Lett [Internet]. 2024 [cited 2024 Sep 23]; Available from: http://iopscience.iop.org/article/10.1088/1748-9326/ad7d21.
- Szopa S, Naik V, Adhikary B, Artaxo P, Berntsen T, Collins S, et al. Short-Lived Climate Forcers. In: Climate Change 2021: The Physical Science Basis Contribution of Working Group I to the Sixth Assessment Report of the Intergovernmental Panel on Climate Change. Cambridge, UK and New York: Cambridge University Press; 2021. p. 817–922.
- Houghton J, Meira Filho L, Lim B, Treanton K, Mamaty I, Bonduki Y, et al. Revised 1996 IPCC Guidelines for National Greenhouse Gas Inventories [Internet]. IPCC, UK Meteorological Office; 1996. Available from: https://www.ipcc.ch/report/revised-1996-ipcc-guidelines-for-national-greenhouse-gas-inventories/.
- Polonik P, Ricke K, Burney J. Paris Agreement’s Ambiguity About Aerosols Drives Uncertain Health and Climate Outcomes. Earth’s Future. 2021;9(5):e2020EF001787.
- Davis SJ, Burney JA, Pongratz J, Caldeira K. Methods for attributing land-use emissions to products. Carbon Management. 2014 Mar 4;5(2):233–45.
- Crippa M, Solazzo E, Guizzardi D, Monforti-Ferrario F, Tubiello FN, Leip A. Food systems are responsible for a third of global anthropogenic GHG emissions. Nature Food. 2021 Mar;2(3):198–209.
- Hayek MN, Harwatt H, Ripple WJ, Mueller ND. The carbon opportunity cost of animal-sourced food production on land. Nature Sustainability. 2021;1–4.
- Allen M, Lynch J, Cain M, Frame DJ. Climate metrics for ruminant livestock. 2022 Jul 14 [cited 2022 Sep 13]; Available from: https://policycommons.net/artifacts/2539344/programme-briefing/3561773/.
- Abernethy S, Jackson RB. Global temperature goals should determine the time horizons for greenhouse gas emission metrics. Environ Res Lett. 2022 Feb;17(2):024019.
- Thornhill GD, Collins WJ, Kramer RJ, Olivié D, Skeie RB, O’Connor FM, et al. Effective radiative forcing from emissions of reactive gases and aerosols – a multi-model comparison. Atmospheric Chemistry and Physics. 2021 Jan 21;21(2):853–74.
- Brazzola N, Wohland J, Patt A. Offsetting unabated agricultural emissions with CO2 removal to achieve ambitious climate targets. PLOS ONE. 2021 Mar 17;16(3):e0247887.
- Matthews HD, Gillett NP, Stott PA, Zickfeld K. The proportionality of global warming to cumulative carbon emissions. Nature. 2009 Jun;459(7248):829–32.
- Lee DS, Fahey DW, Skowron A, Allen MR, Burkhardt U, Chen Q, et al. The contribution of global aviation to anthropogenic climate forcing for 2000 to 2018. Atmospheric Environment. 2021 Jan 1;244:117834.
- Dorgeist L, Schwingshackl C, Bultan S, Pongratz J. A consistent budgeting of terrestrial carbon fluxes. Nat Commun. 2024 Aug 28;15(1):7426.
- Erb KH, Kastner T, Plutzar C, Bais ALS, Carvalhais N, Fetzel T, et al. Unexpectedly large impact of forest management and grazing on global vegetation biomass. Nature. 2018 Jan;553(7686):73–6.
- Smith P, Bustamante M, Ahammad H, Clark H, Dong H, Elsiddig E, et al. Agriculture, Forestry and Other Land Use (AFOLU). In: IPCC AR5 WG3 Chapter 11 Agriculture, Forestry and Other Land Use (AFOLU) [Internet]. Cambridge UK and NY: Cambridge University Press,; 2014. Available from: https://www.researchgate.net/publication/280076738_IPCC_AR5_WG3_Chapter_11_Agriculture_Forestry_and_Other_Land_Use_AFOLU.
- Singh C, Persson UM. Global patterns of commodity-driven deforestation and associated carbon emissions [Internet]. 2024 [cited 2024 Apr 24]. Available from: https://eartharxiv.org/repository/view/7000/.
- Roesch CM, Ballinger AP, Schurer AP, Hegerl GC. Combining temperature and precipitation to constrain the aerosol contribution to observed climate change. Journal of Climate [Internet]. 2024 Apr 24 [cited 2024 May 1];1(aop). Available from: https://journals.ametsoc.org/view/journals/clim/aop/JCLI-D-23-0347.1/JCLI-D-23-0347.1.xml.
- Forster P, Storelvmo T, Armour K, Collins W, Dufresne JL, Frame D, et al. The Earth’s Energy Budget, Climate Feedbacks, and Climate Sensitivity. In: Climate Change 2021: The Physical Science Basis Contribution of Working Group I to the Sixth Assessment Report of the Intergovernmental Panel on Climate Change [Internet]. Cambridge University Press, Cambridge, United Kingdom and New York, USA; 2021. Available from: https://www.ipcc.ch/report/ar6/wg1/chapter/chapter-7/.
- Searchinger T, Waite R, Hanson C, Ranganathan J. Creating a Sustainable Food Future: A Menu of Solutions to Feed Nearly 10 Billion People by 2050 | World Resources Institute [Internet]. World Resources Institute; 2018 Dec [cited 2018 Dec 6]. Available from: https://www.wri.org/publication/creating-sustainable-food-future.
- Friedlingstein P, O’Sullivan M, Jones MW, Andrew RM, Bakker DCE, Hauck J, et al. Global Carbon Budget 2023. Earth System Science Data. 2023 Dec 5;15(12):5301–69.
- Grassi G, Schwingshackl C, Gasser T, Houghton RA, Sitch S, Canadell JG, et al. Harmonising the land-use flux estimates of global models and national inventories for 2000–2020. Earth System Science Data. 2023 Mar 10;15(3):1093–114.
- Jia G, Shevliakova E, Artaxo P, Noblet-Ducoudre N, Houghton R, House J, et al. Land–climate interactions. In: Shukla P, Skea J, Calvo Buendia E, Masson-Delmotte V, Portner H, Roberts D, et al., editors. Climate Change and Land: an IPCC special report on climate change, desertification, land degradation, sustainable land management, food security, and greenhouse gas fluxes in terrestrial ecosystems [Internet]. Intergovernmental Panel on Climate Change; 2019. Available from: https://www.ipcc.ch/site/assets/uploads/sites/4/2020/08/05_Chapter-2-V3.pdf.
- Houghton RA, Castanho A. Annual emissions of carbon from land use, land-use change, and forestry from 1850 to 2020. Earth System Science Data. 2023 May 23;15(5):2025–54.
- Bayer AD, Lindeskog M, Pugh TAM, Anthoni PM, Fuchs R, Arneth A. Uncertainties in the land-use flux resulting from land-use change reconstructions and gross land transitions. Earth System Dynamics. 2017 Feb 1;8:91–111.
- Qin Y, Xiao X, Wigneron JP, Ciais P, Brandt M, Fan L, et al. Carbon loss from forest degradation exceeds that from deforestation in the Brazilian Amazon. Nat Clim Chang. 2021 May;11(5):442–8.
- Winkler K, Fuchs R, Rounsevell M, Herold M. Global land use changes are four times greater than previously estimated. Nat Commun. 2021 May 11;12(1):2501.
- Heinrich V, House J, Gibbs DA, Harris N, Herold M, Grassi G, et al. Mind the gap: reconciling tropical forest carbon flux estimates from earth observation and national reporting requires transparency. Carbon Balance and Management. 2023 Nov 20;18(1):22.
- Kaplan JO, Krumhardt KM, Ellis EC, Ruddiman WF, Lemmen C, Goldewijk KK. Holocene carbon emissions as a result of anthropogenic land cover change. The Holocene. 2011 Aug 1;21(5):775–91.
- van der Werf GR, Randerson JT, Giglio L, van Leeuwen TT, Chen Y, Rogers BM, et al. Global fire emissions estimates during 1997–2016. Earth System Science Data. 2017 Sep 12;9(2):697–720.
- Ray DK, Sloat LL, Garcia AS, Davis KF, Ali T, Xie W. Crop harvests for direct food use insufficient to meet the UN’s food security goal. Nat Food. 2022 May;3(5):367–74.
- Clark M, Springmann M, Rayner M, Scarborough P, Hill J, Tilman D, et al. Estimating the environmental impacts of 57,000 food products. Proceedings of the National Academy of Sciences. 2022 Aug 16;119(33):e2120584119.
- Sato A, Nojiri Y. Assessing the contribution of harvested wood products under greenhouse gas estimation: accounting under the Paris Agreement and the potential for double-counting among the choice of approaches. Carbon Balance and Management. 2019 Nov 26;14(1):15.
- IPCC. IPCC Special Report on Climate Change, Desertification, Land Degradation, Sustainable Land Management, Food Security, and Greenhouse gas fluxes in Terrestrial Ecosystems Summary for Policymakers [Internet]. Intergovernmental Panel on Climate Change (IPCC); 2019 Aug. Available from: https://www.ipcc.ch/site/assets/uploads/2019/08/4.-SPM_Approved_Microsite_FINAL.pdf.
- Dreyfus GB, Xu Y, Shindell DT, Zaelke D, Ramanathan V. Mitigating climate disruption in time: A self-consistent approach for avoiding both near-term and long-term global warming. Proceedings of the National Academy of Sciences. 2022 May 31;119(22):e2123536119.
- Lelieveld J, Klingmüller K, Pozzer A, Burnett RT, Haines A, Ramanathan V. Effects of fossil fuel and total anthropogenic emission removal on public health and climate. PNAS. 2019 Apr 9;116(15):7192–7.
- Quaas J, Jia H, Smith C, Albright AL, Aas W, Bellouin N, et al. Robust evidence for reversal of the trend in aerosol effective climate forcing. Atmospheric Chemistry and Physics. 2022 Sep 21;22(18):12221–39.
- Hansen J, Kharecha P, Sato M. Climate forcing growth rates: doubling down on our Faustian bargain. Environ Res Lett. 2013 Mar;8(1):011006.
- Hansen JE, Kharecha P, Sato M, Tselioudis G, Kelly J, Bauer SE, et al. Global Warming Has Accelerated: Are the United Nations and the Public Well-Informed? Environment: Science and Policy for Sustainable Development. 2025 Jan 2;67(1):6–44.
- Chowdhury S, Pozzer A, Haines A, Klingmüller K, Münzel T, Paasonen P, et al. Global health burden of ambient PM2.5 and the contribution of anthropogenic black carbon and organic aerosols. Environment International. 2022 Jan 15;159:107020.
- Diamond MS, Wanser K, Boucher O. “Cooling credits” are not a viable climate solution. Climatic Change. 2023 Jul 4;176(7):96.
- Fu B, Gasser T, Li B, Tao S, Ciais P, Piao S, et al. Short-lived climate forcers have long-term climate impacts via the carbon–climate feedback. Nat Clim Chang. 2020 Sep;10(9):851–5.
- Wilkinson K. The Drawdown Review: Climate Solutions for a New Decade [Internet]. International: Project Drawdown; 2020 [cited 2020 Mar 23]. Available from: https://www.drawdown.org/drawdown-framework/drawdown-review-2020.
- Mo L, Zohner CM, Reich PB, Liang J, de Miguel S, Nabuurs GJ, et al. Integrated global assessment of the natural forest carbon potential. Nature. 2023 Dec;624(7990):92–101.
- Eisen MB, Brown PO. Rapid global phaseout of animal agriculture has the potential to stabilize greenhouse gas levels for 30 years and offset 68 percent of CO2 emissions this century. PLOS Climate. 2022 Feb 1;1(2):e0000010.
- Campbell B, Beare D, Bennett E, Hall-Spencer J, Ingram J, Jaramillo F, et al. Agriculture production as a major driver of the Earth system exceeding planetary boundaries. Ecology and Society [Internet]. 2017 Oct 12 [cited 2017 Dec 13];22(4). Available from: https://www.ecologyandsociety.org/vol22/iss4/art8/.
- Damania R, Balseca E, de Fontaunbert C, Gill J, Kim K, Rentschler J, et al. Detox Development: Repurposing Environmentally Harmful Subsidies [Internet]. Washington, DC: World Bank Group; 2023. Available from: https://openknowledge.worldbank.org/server/api/core/bitstreams/61d04aca-1b95-4c06-8199-3c4a423cb7fe/content?utm_source=Plant+Based+Treaty&utm_campaign=20db4d4929-EMAIL_CAMPAIGN_2023_08_12_04_47&utm_medium=email&utm_term=0_-20db4d4929-%5BLIST_EMAIL_ID%5D&mc_cid=20db4d4929&mc_eid=5787831cf1.
- Morris V, Jacquet J. The animal agriculture industry, US universities, and the obstruction of climate understanding and policy. Climatic Change. 2024 Feb 26;177(3):41.
- Hoesly RM, Smith SJ, Feng L, Klimont Z, Janssens-Maenhout G, Pitkanen T, et al. Historical (1750–2014) anthropogenic emissions of reactive gases and aerosols from the Community Emissions Data System (CEDS). Geoscientific Model Development. 2018 Jan 29;11(1):369–408.
- Millington JDA, Perkins O, Smith C. Human Fire Use and Management: A Global Database of Anthropogenic Fire Impacts for Modelling. Fire. 2022 Aug;5(4):87.
- Lauk C, Erb KH. Biomass consumed in anthropogenic vegetation fires: Global patterns and processes. Ecological Economics. 2009 Dec;69(2):301–9.
- FAO. Forest Resource Assessment 2020 Remote Sensing Survey [Internet]. Rome: FAO; 2022 [cited 2022 Aug 1]. Available from: http://www.fao.org/documents/card/en/c/cb9970en.
- Stern DI, Kaufmann RK. Estimates of global anthropogenic methane emissions 1860–1993. Chemosphere. 1996 Jul 1;33(1):159–76.
- Gütschow J, Pflüger M. The PRIMAP-hist national historical emissions time series (1750-2021) v2.4.1 [Internet]. Zenodo; 2023 [cited 2023 Oct 10]. Available from: https://zenodo.org/record/7585420.
- Canadell, Monterio P, Costa M, Cotrim da Cunha L, Cox P, Eliseev A, et al., editors. Global Carbon and Other Biogeochemical Cycles and Feedbacks. In: Climate Change 2021 – The Physical Science Basis: Working Group I Contribution to the Sixth Assessment Report of the Intergovernmental Panel on Climate Change [Internet]. Cambridge: Cambridge University Press; 2021 [cited 2023 Jul 14]. p. 673–816. Available from: https://www.cambridge.org/core/books/climate-change-2021-the-physical-science-basis/global-carbon-and-other-biogeochemical-cycles-and-feedbacks/93DFD13E855AC1F1B502965CABE28B7F.
- O’Rourke PR, Smith SJ, Mott A, Ahsan H, McDuffie EE, Crippa M, et al. CEDS v_2021_02_05 Release Emission Data [Internet]. Zenodo; 2021 [cited 2023 Jul 23]. Available from: https://zenodo.org/record/4509372.
- Andela N, Morton DC, Giglio L, Paugam R, Chen Y, Hantson S, et al. The Global Fire Atlas of individual fire size, duration, speed and direction. Earth System Science Data. 2019 Apr 24;11(2):529–52.
- Sankaran M, Hanan NP, Scholes RJ, Ratnam J, Augustine DJ, Cade BS, et al. Determinants of woody cover in African savannas. Nature. 2005 Dec 8;438(7069):846–9.
|
Disclaimer/Publisher’s Note: The statements, opinions and data contained in all publications are solely those of the individual author(s) and contributor(s) and not of MDPI and/or the editor(s). MDPI and/or the editor(s) disclaim responsibility for any injury to people or property resulting from any ideas, methods, instructions or products referred to in the content. |
© 2025 by the authors. Licensee MDPI, Basel, Switzerland. This article is an open access article distributed under the terms and conditions of the Creative Commons Attribution (CC BY) license (http://creativecommons.org/licenses/by/4.0/).