
Submitted:
27 October 2023
Posted:
27 October 2023
You are already at the latest version
Abstract
A new mesogenic non-symmetric dimeric monomer with a terminal olefin function, forming a twist bend nematic (Ntb) as well as a nematic (N) phase was synthesized, using an enhanced synthetic methodology, which avoids isomerization of the terminal double bond in the preparation of the dimer. This monomer was attached to a pentamethyldisiloxane group, resulting in SmA LC phase behaviour of the ensuing material. Linking the monomer to a siloxane main chain resulted in nematic phase behaviour. Detailed studies with the Ntb phase forming dimer DTC5C7 show full miscibility of the dimer and the new LC polymer in the LC state, suggesting that the side-chain LC polymer forms a Ntb phase as the low temperature nematic phase. Copolymerizing the monomer with a cyanobiphenyl based monomer allows to tune the glass transition and phase behavior further.
Keywords:
side chain liquid crystal polymer
; pentamethydisiloxane
; Ntb phase
; isomers of coupling reaction
; non-symmetry dimer
; liquid crystal monomers
1. Introduction
Since the first side-chain liquid crystal polymer been reported in 1978 [1,2,3,4,5,6]. the interest in the synthesis and applications of side-chain liquid crystal polymers (SCLCPs) has evolved. Side-chain liquid crystal polymers are polymers, where mesogenic units are attached to backbones via flexible spacers. Thus, three elements are crucial in determining the properties of liquid crystal side-chain polymers: the polymer backbones, the spacers and the mesogenic units. Among all the backbones reported in the literature, polymethylsiloxanes are arguably the most flexible; this is combined with their excellent thermal stability and low glass transition temperatures. For a given backbone, the molecular structure of the mesogenic units, together with the length and parity of spacers, can have a profound effect on liquid crystal properties and the transition temperature ranges. However, as crystallization might be observed in some of the SCLCPs, a considerable amount of effort has been carried out to prevent polymers from unwanted crystallization and to reduce glass transition temperatures. Examples of such efforts are the use of different type of spacers [7], the variation of the length of the spacers [8], the use of mesogens which are either terminally or laterally attached to the side chains [9], the use of copolymers with different mesogenic units [10] or even simply the use non-mesogenic groups [11,12].
So far, there is no reports on polysiloxanes coupled with side chain dimers to form side chain liquid crystal polymer that exhibits Ntb phase behavior; though it is noted, that number of polymers have been reported that carry di-mesogenic side chains, mainly based on malonate branching groups [13,14,15]. The Ntb phase for dimers is known to show often non-typical optical defect textures, also it is not easy to distinguish it from the nematic phase by X-ray diffraction. So, in this study, a monomer was designed to consist of hydrocarbon units as spacers, triphenyl and biphenyl as mesogenic units, together with terminal double bonds, all designed for controlling the transition temperature and phase sequence.
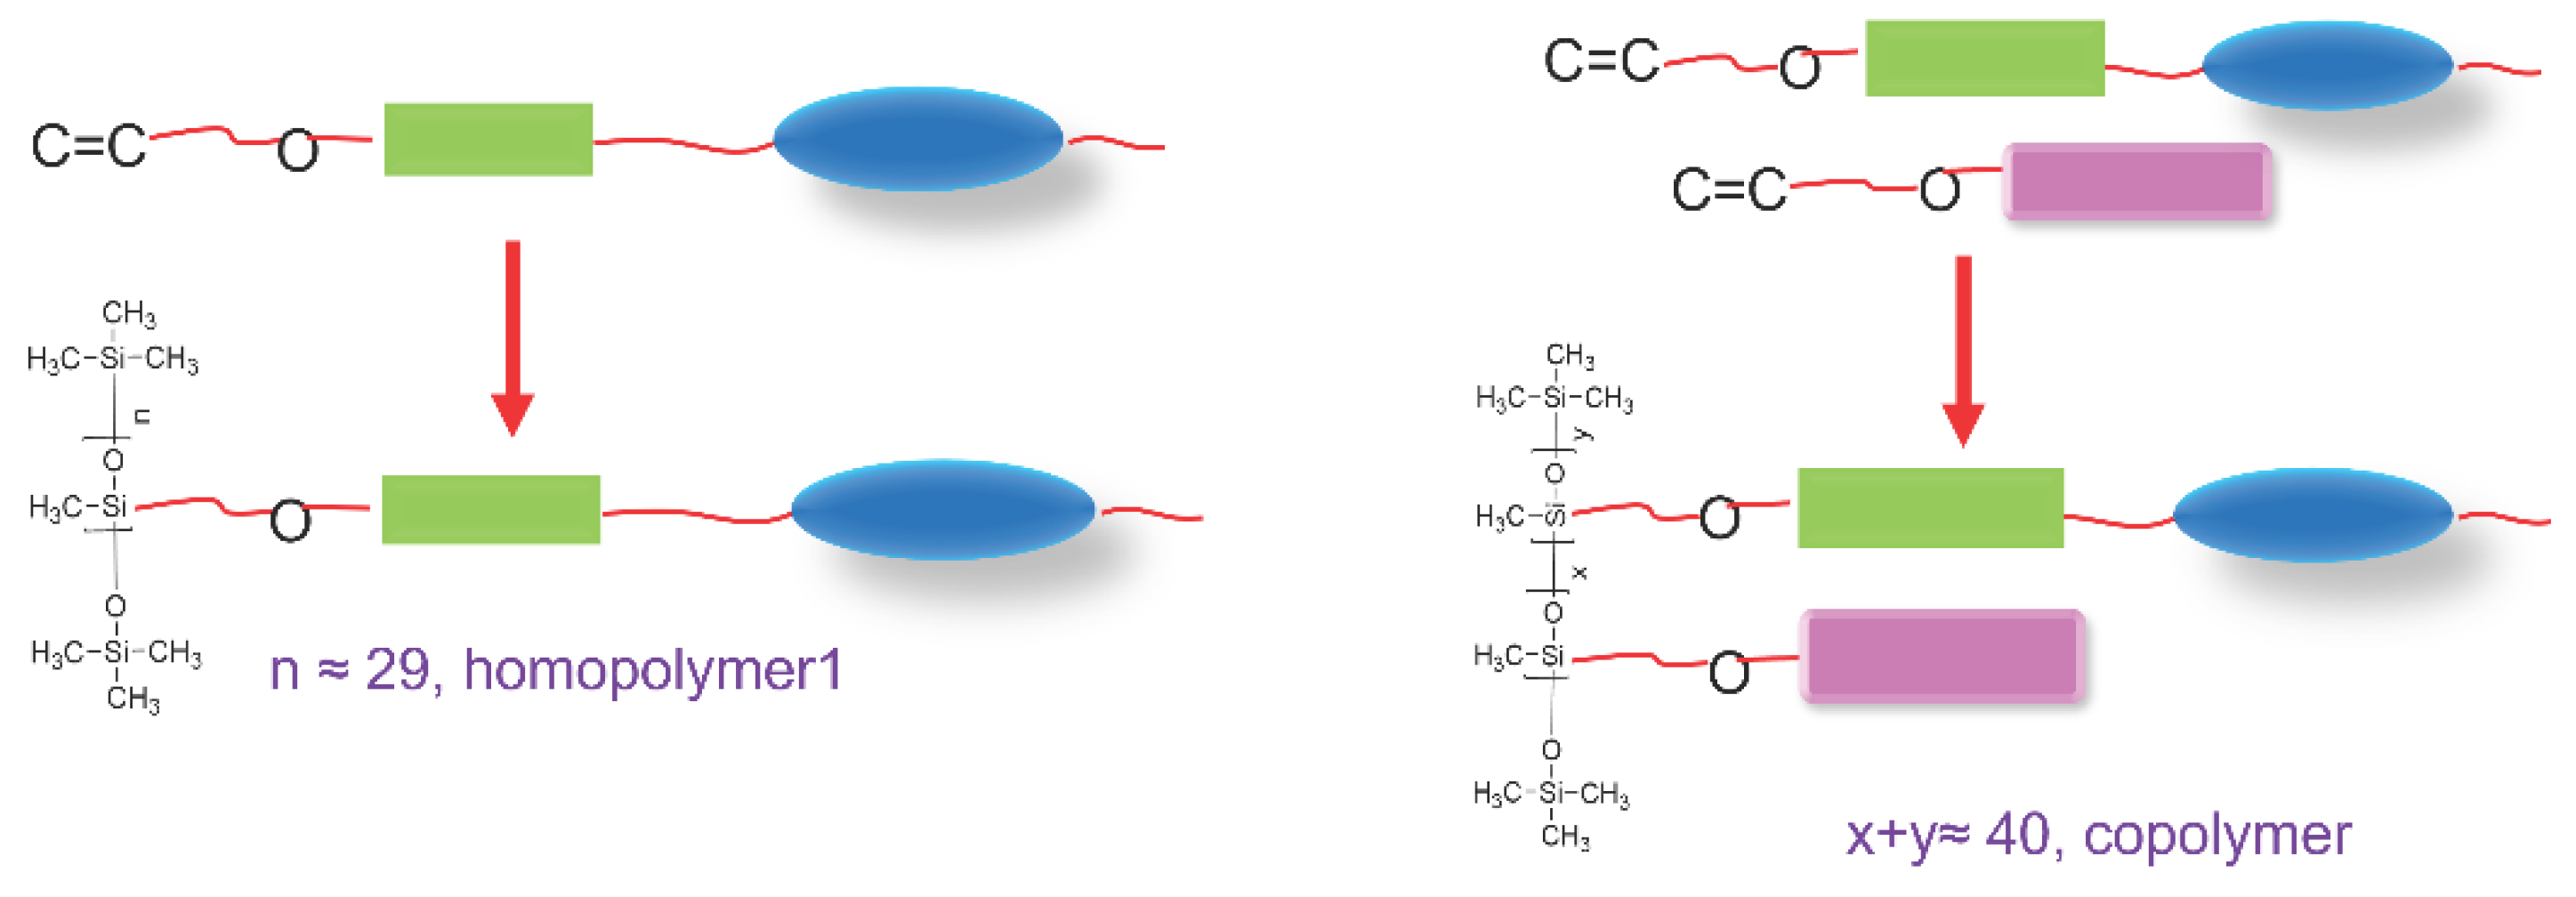
The reason why this architecture was chosen is because (a) it has been reported that dimers with similar structures such as DTC5Cn show the Ntb phase [16], even for related linear oligomers [17] (b) the dimers structurally related to the system discussed here exhibit the Ntb phase over a large temperature range, a feature that makes it possible to tune the transition temperature of the Ntb phase by fine tuning the architecture [18]. Also, (c) a nonsymmetric mesogenic system containing altogether five aromatic rings may result in a lower melting point when compared with a six membered ring system. This is critical, as the transition temperatures of side chain polymers are often higher than these of the monomers. Since pentamethydisiloxane derivatives can exhibit properties associated with polymers and maintain the low viscosity of monomers, it is interesting to investigate the liquid crystal functionalized Ntb system too. Additional results of a copolymerization that was carried out to eliminate crystallization are reported. The overall approach is shown in Figure 1.
There were two challenges in this project. Firstly, there was a challenge in the preparation of the mesogen. The challenges is that isomers were formed. They are a byproduct of the Suzuki-Miyaura coupling reaction in presence of hydrocarbon chains that carry olefinic functions. To eliminate the isomers, a co-catalyst has been used together with the conventional Pd catalyst. The second challenge was that it is difficult to identify the Ntb phase of polymers, therefore, binary mixtures of the homopolymer with the Ntb forming material were used to observe the liquid crystal defect textures using optical polarizing microscopy at controlled temperatures. Textures of liquid crystal phases of monomer and homopolymer 1 (HP1) were analyzed by optical polarizing microscopy (OPM), differential scanning calorimetry (DSC), and through the construction of phase diagrams.
2. Experimental
2.1. Materials
Poly(methylhydrosiloxane) (average Mn 1,700-3,200) and a solution of platinum divinyl tetramethyl disiloxane complexs, with a platinum concentration of 2.5-5 wt% were purchased from Sigma-Aldrich and used as received.
All other starting materials come from Alfa Aesa, Manchester Organics, Fluorochem, and Apollo Scientific. All compounds purchased were used without further purification. TLC Thin layer chromatography was used TLC Silica gel 60 F254 Merck KGaA.
The degree of polymerization which written as is calculated by /, using the values obtained by Gel Permeation Chromatography (GPC), where Mw is the weight average molecular weight of the polymer, and M0 is the molecular weight of the repeating unit or monomer. Molecular weight distribution, also called polydispersity, is calculated by Gel Permeation Chromatography (GPC) as the value of /.
2.2. Methods
Column Chromatography: all purification by column chromatography utilized Fluorochem Ltd. Silica gel 60A 35-70-micron silica gel, and Fisher Scientific U.K Lilted general purpose low iron grade sand.
1H-NMR 400MHz, 13C-NMR 101MHz and 19F-NMR 377MHz were recorded on a Jeol JNM ECP400 spectrometer.
The thermal transitions were both investigated by differential scanning calorimetry (DSC) and optical polarizing microscopy (OPM). OPM was performed using Olypus BX51 Polarizing Microscope equipped with a Linkam LTS350 heating stage. The DSC data is from a Perkin Elmer Differential Scanning Calorimeter DSC 4000, an aluminum reference pan has been used to load the reference and sample, the calibration material is standard indium. DSC results were normally quoted by the average values for the onset of the second heating and cooling curve, the heating rate, if not mentioned specifically, was at 10 ˚C/min.
Gel Permeation Chromatography (GPC) was run on a 350A HT-GPC system, equipped with two VE-1122 solvent delivery pumps, a VE-7510 solvent degasser, a Vortex 430 autosampler, and the 350A HT detector module. Samples were passed through microfilters before measurement to remove gel. Disposable microfilters were from Whatman Puradisc 25 TF. 0.2 μm PTFE Membrane with Polypropylene Housing Diameter 25mm.
Elemental Analysis was collected from FISONS Instruments EA 1108 CHN and using software Eager Xperience for processing the data.
X-ray powder diffraction data were collected from samples mounted on zero-background silicon discs. A PANAlytical Empyrean diffractometer operating in Bragg-Brentano geometry with copper Kα1 (λ = 1.540546 Å) and a PIXEL detector was used for the data collection. Data were collected in the range 3°≤2𝜃 ≤ 30°.
Monomers were characterized by high resolution mass spectrometers. The samples were run on the Bruker maXis, a Hybrid Quadrupole / Atmospheric Pressure Ionization orthogonal accelerated Time-Of-Flight mass spectrometer.
The side chain liquid crystal polymers were characterized by NMR, gel permeation chromatography (GPC), differential scanning calorimetry, and optical polarizing microscopy.
2.3. Purification of polymers
As the amount of the monomers is always in excess in the polymer analogous reaction with the poly (methylhydrosiloxane backbone, and as the traces of monomers can strongly influence the phase transition of related polymers, it was necessary to remove the monomers and purify the polymers. Purification was achieved by repeated precipitation with methanol, after dissolving the polymer with minimum volumes of toluene. The removal of monomers was monitored by DOSY-NMR, and thin layer chromatography on silica with appropriate solvent combination.
2.4. Synthesis of monomers
The synthesis route used to prepare the vinylic monomer is shown in Scheme 1. The monomer was synthesized in twelve step synthesis route, this was followed by the synthesis of the pentamethyldisiloxane derivative and the polymers.
The overall synthesis is based on a convergent approach. It starts with the conversion of heptanedioic acid to the related acid chloride 1 by using oxalyl chloride. The acid chloride reacts with bromobenzene through a Friedel-Crafts acylation reaction to obtain compound 2. The two keto groups were then reduced by a reaction with triethyl silane and trifluoroacetic acid to reach compound 3. Compound 3 was reacted with compound 8, which was obtained in a separate reaction pathway published earlier on [19]. To make compound 8, the synthesis was based on another convergent synthesis route. After the reaction of 1,2-difluorobenzene with n-butyllithium, following by reaction with trimethyl borate, the boronic acid intermediate 4 was obtained. This was reacted in a coupling reaction with compound 6. Compound 6 was obtained by reacting bromobenzene with oxalyl chloride and n-pentanoic acid in a Friedel-Crafts acylation, followed by reduction of the ketone group with triethylsilane and trifluoroacetic acid. The coupling of compound 4 and compound 6 resulted in compound 7, which was converted into a boronic acid by reacting first with n-butyllithium. This was followed by the reaction with trimethyl borate to form compound 8. Compound 3 and compound 8 were coupled to form compound 9. (Shown in Scheme 1). The overall reaction pathway procedure towards this type of dimers has already been reported earlier and hence the chemical characterization will not be reported here again [17,18,20]
Monomer M1 was synthesized through a Suzuki-Miyaura coupling reaction of compound 9 and compound 11. Compound 11 was prepared by a Williamson Etherification, followed by lithiation and a Miyaura coupling reaction.
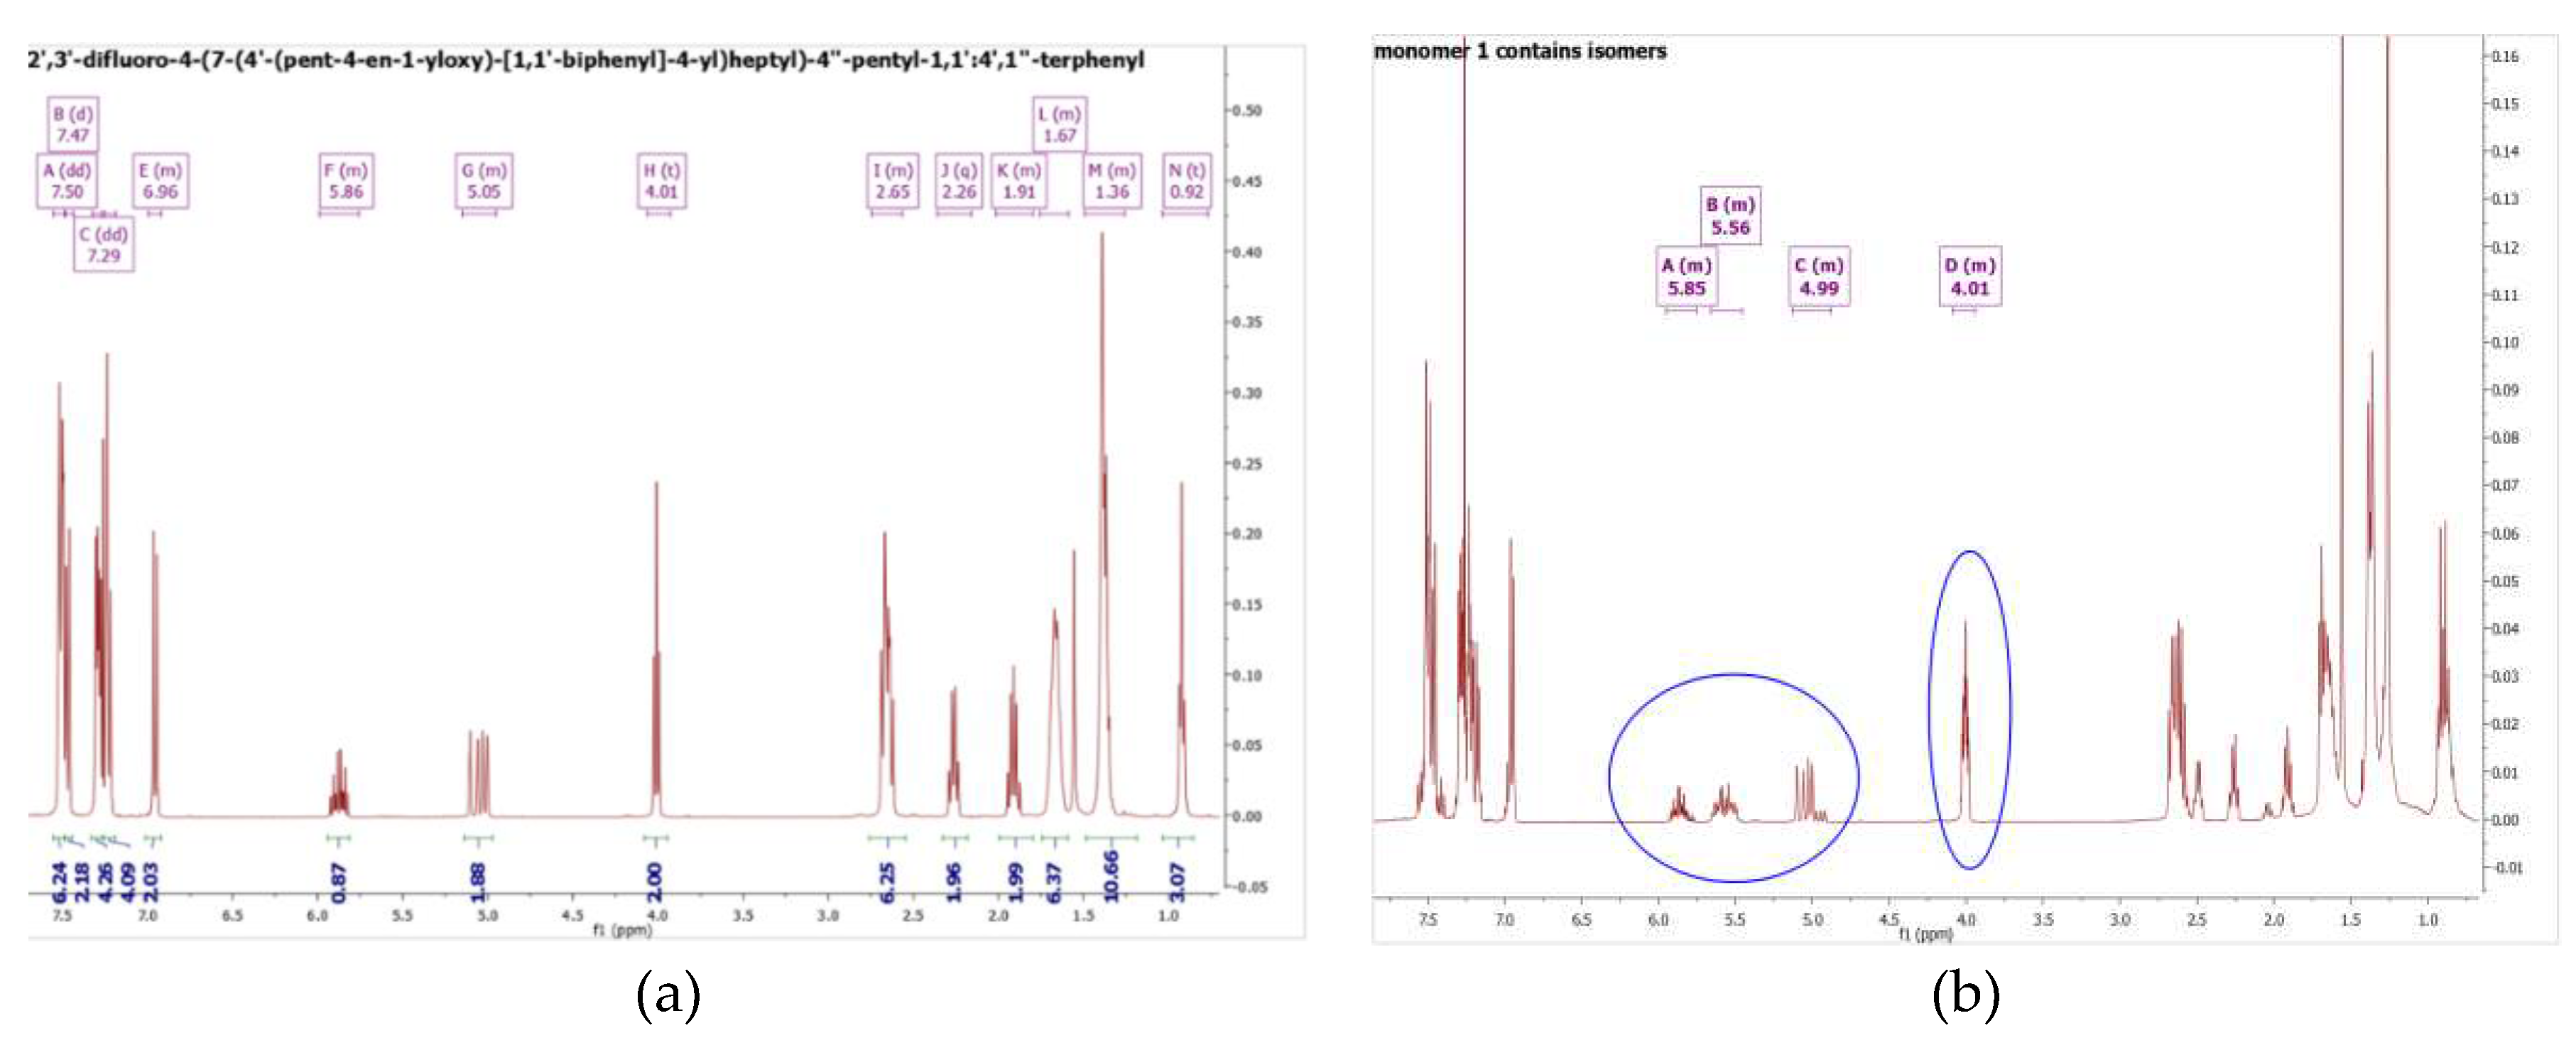
In this synthesis, for the preparation of the monomer, a cocatalyst was used in the Suzuki-Miyaura Coupling to eliminate the formation of isomers in the alkene chain of the hydrocarbon groups of the monomers. The occurrence of isomerization reactions was been discussed early on in 1993 [21]. An alternative to produce isomer free products is to use P(Ph3)4 without cocatalyst. It was found that the main catalyst concentration cannot be higher than 0.5% mol to avoid isomerization of the terminal double bond (see Figure 2(b)). However, in this procedure, the yield was only 15%, which is very low. Hence a [1,1’-Bis(diphenylphosphino)ferrocene] dichloropalladium (II) complex with a dichloromethane/ triphenyl arsine catalyst system was employed. The latter catalyst system was not only used to avoid formation of the isomers during coupling reaction, but also to help maintain the yield of the isolated product after column chromatography at higher than 50%. This is due to the bulky structure of the main catalyst formed together with the cocatalyst, suppressing the beta-hydride elimination reaction which produces isomers. 1HNMR results for the pure monomer are shown in Figure 2 (a) and an example of an isomer formed during the initial exploratory work is shown in Figure 2(b).
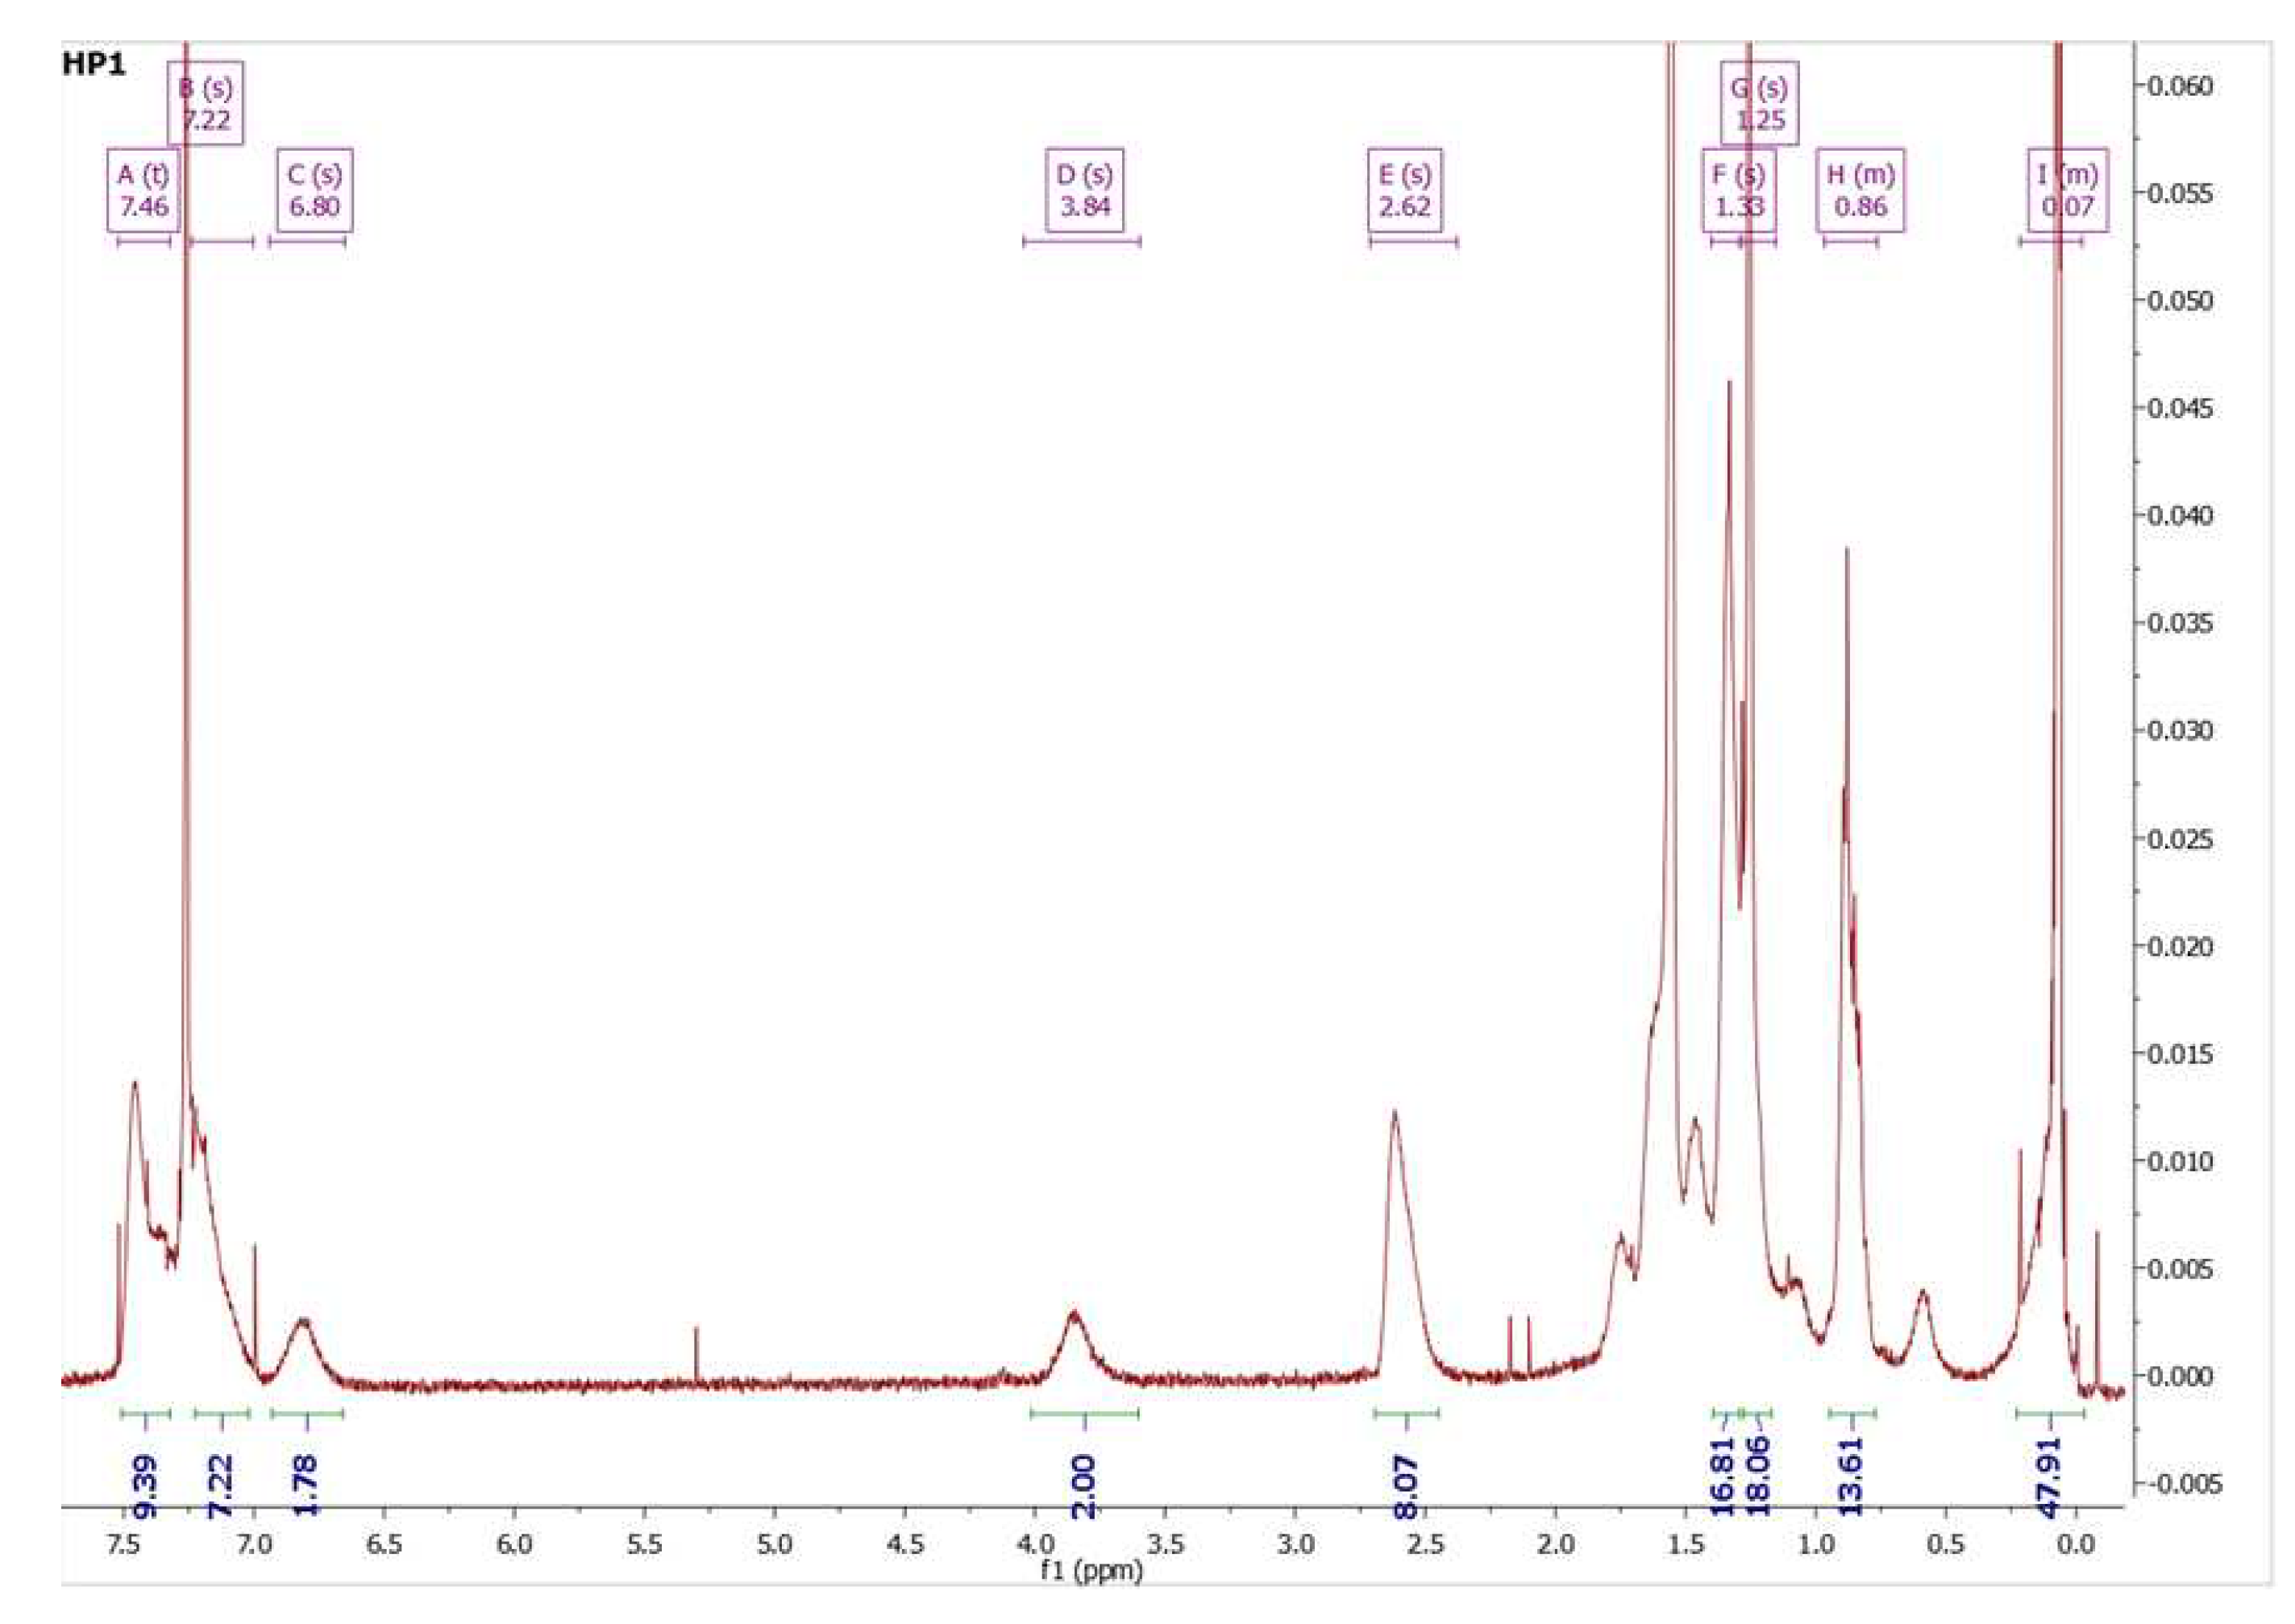
The 1HNMR (CDCl3) spectra for HP1 is virtually identical to the monomer M1, the addition of the signals for the silyl protons at δ= 0.07 (48, s, Si-CH3), δ= 0.86 (14,s, Si-CH2) and the loss of signals for the vinylic protons at δ = 5.99 – 5.75 (1H, m, -CH=CH2), 5.15 – 4.95 (2H, m, -CH=CH2). See and below as the 1HNMR of monomer M1 and polymer HP1. As typical for polymers the signals are somewhat broaden when compared to the monomer. The synthesis of monomer 4'-(pent-4-en-1-yloxy)-[1,1'-biphenyl]-4-carbonitrile discussed later in this work and corresponding homopolymer has been reported in detail much earlier on [22,23].
Synthesis of the yet unreported steps for the preparation of M1.
2',3'-difluoro-4-(7-(4'-(pent-4-en-1-yloxy)-[1,1'-biphenyl]-4-yl) heptyl)-4''-pentyl-1,1':4',1''-terphenyl M1
(2,3-difluoro-4-(pent-4-en-1-yloxy) phenyl) boronic acid 11 (0.11 g, 0.52 mmol) and 4-(7-(4-bromophenyl) heptyl)-2',3'-difluoro-4''-pentyl-1,1':4',1''-terphenyl 9 (0.32 g, 0.52 mmol), caesium carbonate was put in THF (50 mL) and water and the solution was degassed for 3 times. After that, the [1,1’-Bis(diphenylphosphino)ferrocene] dichloropalladium(II) complex with dichloromethane (2.12 mg, 0.5 mol%, 2.6 × 10⁻⁶ mmol) was added. This was followed by addition of triphenyl arsine (23 mg, 1.5 mol%, and 7.8 × 10⁻⁵ mmol), the stirred mixture was stirred at 60 ̊C overnight. The cooled mixture was poured into brine and the product was extracted into chloroform (3×30 mL). The combined organic layer was dried by anhydrous MgSO4, and the solvent was removed under vacuum. The crude compound M1 was purified by column chromatography (DCM: Hexane= 1:4) and recrystallized from iso-propanol.
Yield: 0.18 g, 51.6 %
High Resolution Mass Spectroscopy: m/z 693.3883, err -0.4 ppm.
Elemental Analysis: Theoretical: C 84.14%; H 7.81%; Experimental: C 84.20 %; H 7.83%
1HNMR (400 MHz, CDCl3): δ 7.50 (6H, dd, J = 6.5, 2.3 Hz), 7.47 (2H, d, J = 8.1 Hz), 7.29 (4H, dd, J = 8.1, 4.0 Hz), 7.23 (4H, t, J = 5.8 Hz), 6.99 – 6.92 (2H, m), 5.99 – 5.75 (1H, m), 5.15 – 4.95 (2H, m), 4.01 (2H, t, J = 6.4 Hz), 2.74 – 2.57 (6H, m), 2.26 (2H, q, J = 7.2 Hz), 2.02 – 1.80 (2H, m), 1.76 – 1.59 (6H, m), 1.49 – 1.26 (10H, m), 0.92 (3H, t, J = 6.7 Hz).
13CNMR (101 MHz, CDCl3): δ 158.53, 143.23, 143.15, 141.52, 138.34, 137.98, 133.75, 132.04, 129.61, 128.91,128.82, 128.07, 126.69, 124.73, 124.70,115.34, 114.86, 67.37, 35.84, 35.68, 31.71, 31.61, 31.49, 31.25, 30.28, 29.48, 29.36, 28.61, 22.71, 14.20
19F NMR (377 MHz, CDCl3): δ -143.21
2.5. Synthesis of the pentamethyldisiloxane derivative (PMDS1)
The pentamethydisiloxane derivative was prepared by a platinum-catalyzed hydrosilylation, as shown in Scheme 2.
After the hydrosilylation reaction with 1,1,1,3,3-pentamethyl-1,3-disiloxane and M1, using Karstedt’s catalyst, the pentamethydisiloxane derivative PMDS1 was obtained (see Scheme 2). The synthesis is described in detail below:
1-(5-((4'-(7-(2',3'-difluoro-4''-pentyl-[1,1':4',1''-terphenyl]-4-yl) heptyl)-[1,1'-biphenyl]-4-yl) oxy) pentyl) -1,1,3,3,3-pentamethyldisiloxane PMDS 1
Monomer 2',3'-difluoro-4-(7-(4'-(pent-4-en-1-yloxy)-[1,1'-biphenyl]-4-yl)heptyl)-4''-pentyl-1,1':4',1''-terphenyl M1 (0.17 g, 0.254 mmol) in anhydrous toluene (50mL) was stirred vigorously under nitrogen with 1,1,1,3,3-pentamethyldisiloxane (0.5 mL, 2.56 mmol) at 50°C for 3 days, using a Karstedt’s catalyst solution in xylene (Pt ˜2%) (0.5 mL, 0.0224 mmol) as the catalyst. The solvent was removed by vacuum and catalyst was removed by passing the dry crude through silica gel and washing it DCM. Silica gel column chromatography was used to further purify the crude (DCM/Petrol=1/2). After recrystallization by isopropanol, it was obtained as a white solid, yielding 67 mg, 32.4%.
1H NMR (400 MHz, CDCl3): δ 7.54 – 7.43 (m, 8H), 7.32 – 7.26 (m, 4H), 7.23 (dd, J = 7.8, 5.0 Hz, 4H), 6.98 – 6.91 (m, 2H), 3.99 (t, J = 6.6 Hz, 2H), 2.65 (dt, J = 12.6, 8.0 Hz, 6H), 1.87 – 1.75 (m, 1H), 1.66 (dd, J = 13.0, 7.2 Hz, 6H), 1.45 – 1.19 (m, 17H), 0.99 – 0.81 (m, 6H), 0.10 – 0.03 (m,12H).
(Carbon-fluorine-proton decoupled) 13CNMR (101 MHz, CDCl3): δ 158.63,148.63,143.20,143.12,141.39,138.36,133.60, 132.11, 129.60, 128.89,128.85,128.81,128.03,126.66,124.68, 114.83, 68.16, 35.83, 35.68, 31.71, 31.61, 31.49, 31.25,29.88,29.49,29.21,28.37,23.29,22.71,22.64,18.46, 14.20, 2.14,1.18,0.51.
19FNMR (376 MHz, CDCl3): δ -143.12
2.6. Synthesis of the homopolymers (HP1 and PCN)
After a hydrosilylation reaction with poly(methylhydrosiloxane) and M1, using Karstedt’s catalyst, HP 1 and PCN were obtained. The synthesis is described in detail below, see Scheme 3:
PCN
PCN has been reported earlier [24,25]. The phase transition was found to be: I-SmA 166.6 °C in this work, values which are very close to the transition range reported previously of I-SmA 169.5 [24,25].
The polymers were synthesized by hydrosilylation of the monomer 4'-(pent-4-en-1-yloxy)-[1,1'-biphenyl]-4-carbonitrile (1.2 g, 4.56 mmol), and polymethylhydrosilane (Mn≈1700 ~3200, 0.228g, 3.8 mmol) using dry toluene as solvent with 2 drops of Karsted’s catalyst (Pt~2%) and the solutions were stirred at 60 °C for 3 days, whilst under an atmosphere of nitrogen. After the reaction was completed, further purification was carried out by repeated precipitation into methanol several times and the product was dried under vacuum.
Isolated yield: 0.25 g, 20.4 %
1H-NMR (400 MHz, CDCl3): δ 7.47 (s, 14H), 7.25 – 7.00 (m, 8H), 6.84 (s, 4H), 3.86 (s, 4H), 2.63 (s, 7H), 1.61 (t, 26H), 0.90 (s, 4H), 0.59 (s, 4H), 0.09 (d, 19H).
The calculation of the yield is listed as below:
The siloxane unit is the repeating unit of the polymer backbone, at 60.1 g/mol in molecular weight. Therefore, 0.228 g of polymer backbone which, except for the end groups, consists of the repeating units of the siloxane unit. It can be assumed that the molar amounts were:
The molecular weight of repeating units of siloxane unit which contains 4'-(pent-4-en-1-yloxy)-[1,1'-biphenyl]-4-carbonitrile is 323.1 g/mol. The isolated yield of the polymer PCN can be calculated as:
HP1
2',3'-difluoro-4-(7-(4'-(pent-4-en-1-yloxy)-[1,1'-biphenyl]-4-yl)heptyl)-4''-pentyl-1,1':4',1''-terphenyl M1 (0.15g, 0.224 mmol) in dry toluene (30 ml) was stirred with polymethylhydrosilane (Mn≈1700 ~3200, 0.01g, 0.166 mmol) at 60 °C under nitrogen, then 1 drop of Karsted’s catalyst (Pt ~2%) was added. The reaction mixture was stirred for 3 days. After the reaction finished, purification was carried out by repeated precipitations into methanol and the product was dried under vacuum.
Yield: 0.031g, 25.6 %
1HNMR (400 MHz, CDCl3): δ 7.46 (t, 9H), 7.22 (s, 7H), 6.80 (s, 2H), δ 3.84 (s,2H), 2.62 (s, 8H), 1.33 (s, 17H), 1.27 (d, 18H), 0.97 – 0.76 (m, 13H), 0.23 – 0.02 (m, 48H). Shown in Figure 3.
The calculation of the yield is listed as below:
The siloxane unit is the repeating unit of the polymer backbone, at 60.1 g/mol in molecular weight. Therefore, 0.01g of polymer backbone which, except for the end groups, consists of the repeating units of the siloxane unit. It can be assumed that the molar amounts were:
The molecular weight of repeating units of the siloxane unit which contains monomer 1 is 730.4 g/mol. The isolated yield of the HP1 can be calculated as:
2.7. Synthesis of the copolymer (CoP1)
After the hydrosilylation reaction with poly(methylhydrosiloxane) and M1 using Karstedt’s catalyst, CoP1 was obtained. The synthesis in details described below, see Scheme 4:
CoP1
The polymers were synthesized by hydrosilylation of the monomer 4'-(pent-4-en-1-yloxy)-[1,1'-biphenyl]-4-carbonitrile (1.2 g, 4.56 mmol), and polymethylhydrosilane (Mn≈1700 ~3200, 0.051g, 0.85 mmol) using dry toluene as solvent with 2 drops of Karsted’s catalyst (Pt~2%) and stirred at 60 °C for 3 days, while under an atmosphere of nitrogen. After the reaction was finished, further purification was carried out by repeated precipitation into methanol several times and the product was dried under vacuum.
Isolated yield: 0.102g, 21.2%.
1HNMR (400 MHz, CDCl3) solvent: δ 7.71 – 7.30 (m,6H), 6.84 (s, 2H), 3.86 (s, 2H), 1.75 (s, 2H), 1.45 (s, 4H), 0.57 (s, 2H), 0.07 (dd, J = 13.9, 8.0 Hz, 4H).
Calculation of the copolymer composition procedure is as below:
The calculation on the actual molar ratio of the monomers for the reaction is based on 1HNMR results:
The signal with the chemical shift at δ 3.86 ppm belongs to the -CH2-O group, integration of which is 4. While the chemical shift above 6.5 ppm is associated with the phenyl ring protons, integration of which is 28. Assuming that there is x mol of 4'-(pent-4-en-1-yloxy)-[1,1'-biphenyl]-4-carbonitrile, and y mol of M1. The calculation of each group of protons can be performed by integration of the 1HNMR signals.
Therefore, the actual mol ratio is (M1: MCN=1.2:0.8).
The siloxane unit is the repeating units of the polymer backbone, with a molecular weight of 60.1 g/mol. Therefore, 0.051g of poly(methylhydrosiloxane) consists of almost all the repeating units of siloxane backbone, and it can be assumed that the molar amount will be.
As the actual molar ratio of the monomers is (M1: MCN=1.2:0.8). The molecular weight of repeating units of siloxane unit which contains monomer 1 is 730.4 g/mol, whereas the compound containing monomer 4'-(pent-4-en-1-yloxy)-[1,1'-biphenyl]-4-carbonitrile is 323.13 g/mol.
0.102g = 1.2 a 730.40 + 0.8 a 323.13
Thus a= 0.09 ,
The isolated yield of the CoP 1 can be calculated as:
The GPC results, indicate that the polydispersity is relatively narrow, and broadly like that of the polymer backbone, for the homopolymer and copolymer (see Table 1).
3. Results and Discussion
3.1. DSC studies
To investigate the phase behavior of materials, DSC measurements were used, and the data for second cooling and heating curves are listed below (Table 2).
Melting point and isotropic point are all measured as the onset temperature of heating and cooling curves separately by DSC.
The melting points for polymer PCN and CoP1 cannot be determined as below the room temperature.
- a)
- Cr= crystalline; I=isotropic; Nx= unknown nematic phase; Smx = unknown smectic phase
- b)
- Mesophase types were determined by optical polarizer microscopy.
- c)
- Monotropic phases are shown in square brackets; enthalpies are shown in parentheses, unit (J/g)
- d)
- measured as difference between onset and offset temperatures ()
To facilitate the comparison, the thermal properties of monomer M1, the pentamethydisiloxane PMDS1 and polymers are given in Table 2. It can be seen that after polymerization, both melting points and isotropisation temperature for the polymer increase when compared with the related monomer and the pentamethydisiloxane PMDS1. For the pentamethydisiloxane, the transition temperature and the liquid crystal phase behaviors can often provide very useful information in prediction on related homopolymers [25,26,27]. All the transitions of the phase change are reduced for the pentamethydisiloxane, when compared with related monomer. Homopolymer 1 (HP1) shows crystallization without a glass transition. A route to eliminate the crystallization is through the introduction of another mesogenic monomer or even non-mesogenic units, to separate the side chains of monomers well away from each other. For copolymer (CoP1), both crystallization tendencies and melting points are eliminated on the second heating and cooling curve of the DSC and the liquid crystal phase is stable at room temperature. The isotropisation temperature decreases for the copolymer, compared with homopolymers. It is noteworthy that not only can copolymerization helps to eliminate the crystallization, but it can also help to stabilize the liquid crystal phase at room temperature. Based on the transition temperatures of HP1 and CoP1 (Table 2), the crystalline tendencies are eliminated in the copolymer because the incorporation of the short length of monomer 4'-(pent-4-en-1-yloxy)-[1,1'-biphenyl]-4-carbonitrile, has broken the π-π interactions of phenyl rings within the long side chains. Besides, due to the flexibility of the polymer backbones, the glass transition temperature is lower than room temperature.
An interesting and important feature is the width of the N-Iso transition on linking M1 either to a pentamethyldisiloxane end group or the polysiloxane main chain. M1 is characterized by a transition width of 3.81- 3.85 ˚C, somewhat wider, than the literature known material MCN, but in line with results reported for other dimesogenic dimers with lateral fluoro groups. Linking MCN to a polysiloxane main chain results in a widening of the transition interval and an increase of the enthalpy, in line with the original reports [24,25]. Typically, widening of transitions on attachment to polymers are linked to kinetic effects; molecular mobility is decreased due to increased viscosity, but even more to the influence of polydispersity of the main chain. Polymer chains of differing lengths exhibit different transition temperatures. A polydisperse sample is thus an ensemble of series of systems, transitioning at different temperatures, and, together with the ensuing biphasic regions associated with first order phase transitions are the cause of widening the transition intervals. Attachment of M1 to a pentamethyldisiloxane end group narrows the transition somewhat to 2.36-2.48 ˚C when compared to M1 with the vinylic end group of (3.81- 3.85 ˚C), but the transition enthalpy increases dramatically to 17.5-17.7 J/g, very high indeed for a liquid crystal to isotropic transition. This is indicative of a major order-disorder transformation. It suggests also that a different LC phase is formed as the highest stable LC state. The attachment to the polysiloxane main chain has an equally dramatic effect. The transition to the monotropic low temperature smectic phase of M1 is lost and the transition enthalpy is reduced to 10.4-10.6 J/g when compared to the pentamethyldisiloxane derivative PMDS1, indicative of a lower ordering. However, the transition interval is enormous, it reaches 29.62-32.76 ˚C; depending whether the values are collected on heating or cooling. This suggests that multiple processes take place. For M1 the nematic phase range is ~12 ˚C and the Ntb phase has a range of about 30 ˚C. The extreme widening of the transition would thus be explainable by a combination of the biphasic behavior observed already in mixture of dimers, where additional phases transition peaks seem to appear in DSC experiments, but are nothing more than the effects of the end points of the biphasic regions of the phase diagram [28]. For the polymer additionally an overlap of the phase transitions of polymers of different chain lengths and transitions between different phases such as the N and the Ntb phase play a role. Or in other words, when on cooling some of the polymer chains in this ensemble still undergo an Iso to N transition, others are already on the way to the N to Ntb transition. This broadens the transition range to the extreme. This view is supported by the results for CoP1. Even more complexity is introduced, the range of the transition interval increases marginally to 34.6 -38.6 ˚C, but the transition enthalpy associated with the loss of order is broadly similar to that for PCN and much smaller than observed for HP1. This confirms the argument that for HP1, a broad and flat peak masks multiple transitions in the polymer. However, as only one transition was detectable by DSC, the term Nx is used for the LC phase in Table 2.
OPM studies
The liquid crystal defect textures of M1, obtained from OPM are shown below (see Figure 4b). The material forms a nematic phase at 114 and a further phase transition takes place at 103 , close to the DSC measured value of 102.5 (DSC was recorded at 10 min-1) was detected. The texture changes indicates a transition from the nematic phase (see Figure 4a) to the twist-bend nematic phase (Figure 4c). The twist-bend nematic phase texture does not change under slight shearing (Figure 4d). After being sheared at 80 , the texture does not change much but flows very slowly due to high viscosity (Figure 4e). If the sample is sheared more vigorously at 95 , a texture change occurs and only a homotropic texture was observed. Texture changes associated with the phase transition at 89.9 could not be identified that clearly under OPM, however a more ordered smectic phase had formed noticeable in shearing experiments were a very high viscosity was noticed. It was also found that the cooling rate influences strongly the OPM textures. When cooling at a high rate of 10 , the texture shows no focal conic type shape defects (Figure 5a). Reducing the cooling rate to 3 , induces small focal conic features (Figure 5b), further reducing the cooling rate to 0.1 , results in larger focal conic domains (see Figure 5c).
It is interesting to analyze the liquid crystal phase formed by the pentamethydisiloxane functionalized monomer M1 that exhibits Ntb phase behavior. As shown in Figure 6(a), for PMDS1 exhibits a SmA phase that emerges from the isotropic state as typical bãtonets [29] defects. The bãtonets merge to form the smectic phase texture, see Figure 6(b). As the temperature is reduced, the bãtonets grows into mini-focal-conic domains. As the end group is a widely reported pentamethydisolane group, this is not surprising, as this type of siloxane end group can produce nano-segregation to form smectic phase behavior [30,31]. The short siloxane group destabilizes the heliconical structure and favors layer formation. This results in a SmA phase.
To identify the phase texture of the HP1, contact preparations of DTC5C7 (see Figure 7) with homopolymer 1 (HP1) was carried out and monitored by OPM. DTC5C7 was chosen as a contact compound for HP1. One reason is because it has broadly similar transition temperatures when compared to HP1, the other reason is because its Ntb phase transition temperature locates within the phase transitions of HP1. This makes it a good indicator of the existence of a Ntb phase in HP1. Results can be found in Figure 8. On the left-hand side, DTC5C7 is shown in the micrographs, while on the right-hand side the defect textures of HP1 can be seen. From Figure 8 a to b, as the temperature is reduced to 120 , the texture changes from the nematic to the Ntb phase. After annealing the polymer for 1 day, the two liquid crystal phases textures began to merge (see Figure 8c). Further annealing for 2 days made the textures clearer, the whole area of DTC5C7 and HP1 completely merged and exhibited the same texture as shown in Figure 8 d-e. Figure 8 f-h, shows the coalescence of both compounds at 120 over a wider viewing field by using a smaller magnification. This result needs further conformation, the current data however, reveals that the Ntb phase of DTC5C7 and the unknown nematic phase, provisionally identified as Nx of HP1 mix fully. As both molecules are structurally very similar, this suggests that the Nx phase of the HP1 is an Ntb phase. This would be the first example of a Ntb found in a side chain polymer.
X-ray powder diffraction
The results X-ray powder diffraction analysis for the copolymer which exhibits one liquid crystal phase, which is stable at room temperature are discussed. The X-ray powder diffraction was collected to gain more information on the phase structure (see Figure 9 and Table 3). The X-ray powder diffraction pattern is dominated by a wide-angle at 2𝜃 =19.8 ˚ (d=4.49 Å). This related to the fluidic mesogen in the liquid crystal state. The shoulder-like peak at 2 𝜃 = 12.3 ˚ (d= 7.2 Å) is often found for siloxane polymers. The small angle of the peak at 2 𝜃 = 4.249 ˚ (d= 20.8 Å) is typical for Ntb and N materials and is simply associated with an electron densities of the mesogenic units which are only orientationally ordered but do not have positional ordering. [18] This confirms that the overall phase is that of a nematic like phase.
Phase diagram
As it was found to be difficult to identify the phase structure of the monomer unambiguously, therefore an exploratory phase diagram with defined mixtures was constructed, following the results of DSC experiments. The phase diagram of binary mixtures of CBC9CB and monomer M1 was constructed to identify the phase transitions of Ntb phase.
The exploratory phase diagram for the mixtures of CBC9CB and monomer M1 shows the results from the second cooling DSC run Figure 10a. The transition temperature from the nematic to the isotropic decreases somewhat linearly with increasing amount of M1. Progressing from pure CBC9CB to pure monomer M1, the nematic phase range firstly becomes wider, then is reduced to the narrowest area at 50 wt%, and finally grows slightly on the side of the monomer M1. The Ntb region for both pure compounds are wider until approaching ~50 wt%, which results in the narrowest range. Interestingly, for the mixtures, the Ntb phase is enantiotropic, independent of the composition change. For 25% wt and 75 % wt mixtures, the Ntb phase is stable at room temperature, whereas for 50 wt% the Ntb phase is only stable over a small temperature range and finally changes to a smectic phase whose structure is still to be determined.
Figure 10b shows the enthalpy values of the mixtures as a function of concentration of monomer M1, the enthalpies are associated with the Iso-N and N-Ntb transition and are based on the measurements obtained from second cooling runs of the DSC scans. They are plotted as a function of concentration of monomer M1 in CBC9CB binary mixtures. The enthalpy values for the Iso-N transition exhibit a substantial decrease with increasing molar fraction of the monomer M1. The value of the transition enthalpy of pure CBC9CB of 1.01 KJ/ mol to 0.27 KJ/ mol for pure monomer M1 are quite different. This is noted that the CBCnCB series exhibit different enthalpy values for the N-Iso transition compared to dimers containing fluoro groups in the mesogenic units [32,33]. The enthalpy values for the N-Ntb transition display a dramatic increase with increasing concentration of monomer M1. With the value from the transition enthalpy of pure CBC9CB of 0.415 KJ/mol increasing to 6.84 KJ/mol for pure monomer M1, this is almost seventeen times larger in value. Figure 10c shows the DSC results of one of the mixtures 25 wt% M1-75 wt% CBC9CB as an example. In addition to the wide melting transitions, the exothermic peak related to the crystallization temperature was not observed by DSC, because the system forms a glassy liquid crystal state above 30 . Similar results have been observed by DSC on second heating and cooling curves for all the other mixtures.
Polysiloxanes
For homopolymer 1 (HP1), there is only one liquid crystal phase recorded by DSC. However, it is noted that the peak is broad and unresolved and thus a phase transition between the nematic and the Ntb phase might be obscured, or simply not measurable due to a biphasic region. From Figure 8, it can be provisionally deduced that this is a Ntb phase since there is no boundary or miscibility gap between binary mixtures of DTC5C7 and HP1 in the Ntb phase. OPM pictures for HP1 depicted in Figure 11, show that this liquid crystal texture remains the same until crystallization at 107.9.
OPM pictures for the copolymer CoP1 are also shown in Figure 12. Schlieren textures are clearer at temperatures close to isotropisation temperature. Crystallization peaks were not traced by DSC, because the polymer remains in the liquid crystal phase at room temperature. This was already evidenced by X-ray powder diffraction experiments measured at room temperature (Figure 9). Recording pictures at higher magnification shows that branches between long rope like features occur (see Figure 12e-f) and long annealing times reveal an oily streak like texture which can ofter be observed for Ntb forming materials. This might could be interpreted a variation of the rope texture that are found often in twist-bend systems.
The thermal behavior of a comparative mixture of M1 and MCN (molar ratio of 1.2:0.8, the same as in CoP1, were studied by OPM. The OPM data, for that mixture show a nematic to smectic A phase transition on cooling at 105 ˚C. (see Figure 13a-c). When these two monomers are linked to the polymer backbone, the smectic A phase is suppressed in CoP1, the nematic phase remains. As observed for HP1, the phase transition range as measured by DSC is extremely wide, possibly masking a N- Ntb transition; this would be in line with OPM observations. However in the absence of more detailed studies, more potentially with more complex behaviour as a copolymer is involved, the phase is provisionally identified as Nx.
4. Conclusions
A new vinylic dimesogenic monomer showing the Ntb phase was synthesized. Current synthetic methods were improved for achieving an isomer free olefin group containing material. This monomer was attached a pentamethyldisiloxane group, resulting in SmA LC phase behaviour of the ensuing material. Linking the monomer to siloxane main chain results in a polymer forming nematic phase behavior with and extremely wide transition range. Detailed studies with the Ntb phase forming dimer DTC5C7 show full miscibility of the dimer and the new LC polymer in all LC phases, suggesting that the side-chain LC polymer forms a Ntb phase as a low temperature nematic phase. Copolymerizing the monomer with a cyanobiphenyl based monomer allows to tune the glass transition, prevent crystallization and to tune the phase behavior further to a nematic phase behavior at room temperature.
Acknowledgments
W.J. thanks the CSC (Chinese Scholarship Council) for the funding of the PhD program. W. J thanks also the Henry Lester Trust, the Great Britain-China Educational Trust and the British Federation of Women Graduates for support for the living expenses during the PhD program. Dr Robert Lewis, Dr Tim Prior, Dr Timothy Dunstan, Mr Dean Moore and Mr Sean Moore from University of Hull Chemistry Department are thanked for help and the data collection for DSC, elemental analysis, GPC, X-ray powder diffraction data.
References
- Finkelmann, H.; Happ, M.; Portugal, M.; Ringsdorf, H. Liquid crystalline polymers with biphenyl-moieties as mesogenic group. Die Makromolekulare Chemie: Macromolecular Chemistry and Physics 1978, 179, 2541–2544. [Google Scholar] [CrossRef]
- Finkelmann, H.; Ringsdorf, H.; Wendorff, J.H. Model considerations and examples of enantiotropic liquid crystalline polymers. Polyreactions in ordered systems, 14. Die Makromolekulare Chemie: Macromolecular Chemistry and Physics 1978, 179, 273–276. [Google Scholar] [CrossRef]
- Finkelmann, H.; Koldehoff, J.; Ringsdorf, H. Synthesis and Characterization of Liquid-Crystalline Polymers with Cholesteric Phase. Angewandte Chemie International Edition in English 1978, 17, 935–936. [Google Scholar] [CrossRef]
- Finkelmann, H.; Day, D. Structure of mesomorphic polymer phases. Die Makromolekulare Chemie: Macromolecular Chemistry and Physics 1979, 180, 2269–2274. [Google Scholar] [CrossRef]
- Finkelmann, H.; Rehage, G. Investigations on liquid crystalline polysiloxanes, 2. Optical properties of cholesteric phases and influence of the flexible spacer on the mobility of the mesogenic groups. Die Makromolekulare Chemie, Rapid Communications 1980, 1, 733–740. [Google Scholar] [CrossRef]
- Finkelmann, H.; Rehage, G. Investigations on liquid crystalline polysiloxanes, 1. Synthesis and characterization of linear polymers. Die Makromolekulare Chemie, Rapid Communications 1980, 1, 31–34. [Google Scholar] [CrossRef]
- Milano, J.C.; Robert, J.M.; Vernet, J.L.; Gallot, B. The thioether spacer in liquid crystalline polysiloxanes with cyano-and nitrobiphenyl mesogens. Macromolecular Chemistry and Physics 1999, 200, 1580–1586. [Google Scholar] [CrossRef]
- Jeng, G.P.C.; Kuo, J.F.; Chen, C.Y. Synthesis and mesomorphic behavior of terminally carboxyl oligo (ethylene oxide) monomethyl ethers-substituted side chain liquid crystalline polysiloxanes. I. Journal of Applied Polymer Science 1993, 47, 697–706. [Google Scholar] [CrossRef]
- Gray, G.W.; Hill, J.S.; Lacey, D. Synthesis and properties of some liquid crystal polysiloxanes with laterally or terminally attached side chains. Molecular Crystals and Liquid Crystals 1991, 197, 43–55. [Google Scholar] [CrossRef]
- Day, G.M.; Kim, H.-J.; Jackson, W.R.; Simon, G.P. Synthesis and characterization of novel chiral liquid crystalline polysiloxanes. Acta polymerica 1999, 50, 96–104. [Google Scholar] [CrossRef]
- Hsu, C.S.; Lu, Y.H. Synthesis and characterization of side-chain liquid crystalline polysiloxanes containing 4-alkanyloxyphenyl trans-4-alkylcyclohexanoate side groups. Journal of Polymer Science Part A: Polymer Chemistry 1991, 29, 977–986. [Google Scholar] [CrossRef]
- Richard, H.; Mauzac, M.; Sigaud, G.; Achard, M.; Hardouin, F. Liquid crystal side chain polysiloxanes containing various proportions of non-mesogenic units. Liquid Crystals 1991, 9, 679–689. [Google Scholar] [CrossRef]
- Kawashima, Y.; Nozaki, K.; Hiyama, T.; Yoshio, M.; Kanie, K.; Kato, T. Liquid-crystalline stereoregular polyketone prepared from a mesogenic vinylarene and carbon monoxide. Journal of Polymer Science Part A: Polymer Chemistry 2003, 41, 3556–3563. [Google Scholar] [CrossRef]
- Gu, H.D.; Chen, L.; Yan, J.X. Effect of chiral isosorbide groups on mesomorphic properties of side-chain liquid-crystalline polysiloxanes. Liquid Crystals 2009, 36, 1319–1327. [Google Scholar] [CrossRef]
- Huang, H.; Cong, Y.; Lin, Z.; Zhang, B. Synthesis and properties of side-chain liquid crystalline polymers grafted with chiral dimers containing cholesteryl groups. Liquid Crystals 2020, 47, 723–736. [Google Scholar] [CrossRef]
- Sebastián, N.; Tamba, M.-G.; Stannarius, R.; de la Fuente, M.R.; Salamonczyk, M.; Cukrov, G.; Gleeson, J.; Sprunt, S.; Jakli, A.; Welch, C.; et al. Mesophase structure and behaviour in bulk and restricted geometry of a dimeric compound exhibiting a nematic–nematic transition. Physical Chemistry Chemical Physics 2016, 18, 19299–19308. [Google Scholar] [CrossRef] [PubMed]
- Saha, R.; Babakhanova, G.; Parsouzi, Z.; Rajabi, M.; Gyawali, P.; Welch, C.; Mehl, G.H.; Gleeson, J.; Lavrentovich, O.D.; Sprunt, S. Oligomeric odd–even effect in liquid crystals. Materials Horizons 2019, 6, 1905–1912. [Google Scholar] [CrossRef]
- Ahmed, Z.; Welch, C.; Mehl, G.H. The design and investigation of the self-assembly of dimers with two nematic phases. RSC Advances 2015, 5, 93513–93521. [Google Scholar] [CrossRef]
- Tamba, M.; Salili, S.; Zhang, C.; Jákli, A.; Mehl, G.H.; Stannarius, R.; Eremin, A. A fibre forming smectic twist–bent liquid crystalline phase. RSC Advances 2015, 5, 11207–11211. [Google Scholar] [CrossRef]
- Merkel, K.; Loska, B.; Welch, C.; Mehl, G.H.; Kocot, A. Molecular biaxiality determines the helical structure–infrared measurements of the molecular order in the nematic twist-bend phase of difluoro terphenyl dimer. Physical Chemistry Chemical Physics 2021, 23, 4151–4160. [Google Scholar] [CrossRef]
- Johnson, C.R.; Braun, M.P. A two-step, three-component synthesis of PGE1: utilization of. alpha.-iodo enones in Pd (0)-catalyzed cross-couplings of organoboranes. Journal of the American Chemical Society 1993, 115, 11014–11015. [Google Scholar] [CrossRef]
- Mano, J.F.; Correia, N.T.; Moura Ramos, J.J.; Fernandes, A.C. A thermally stimulated discharge currents study of the molecular motions in two polysiloxane side-chain liquid crystalline polymers. Journal of Polymer Science Part B: Polymer Physics 1995, 33, 269–277. [Google Scholar] [CrossRef]
- McArdle, C.B. Side chain liquid crystal polymers; Springer Science & Business Media, 1990. [Google Scholar]
- Gemmell, P.; Gray, G.W.; Lacey, D. Effects of molecular structure on the properties of terminally cyano-substituted side chain liquid crystalline polysiloxanes. Molecular Crystals and Liquid Crystals 1985, 122, 205–218. [Google Scholar] [CrossRef]
- Stevens, H.; Rehage, G.; Finkelmann, H. Phase transformations of liquid crystalline side-chain oligomers. Macromolecules 1984, 17, 851–856. [Google Scholar] [CrossRef]
- Finkelmann, H. Liquid crystalline side-chain polymers. Philosophical Transactions of the Royal Society of London. Series A, Mathematical and Physical Sciences 1983, 309, 105–114. [Google Scholar]
- Shibaev, V.; Plate, N. Synthesis and structure of liquid-crystalline side-chain polymers. Pure and applied chemistry 1985, 57, 1589–1602. [Google Scholar] [CrossRef]
- Ramou, E.; Ahmed, Z.; Welch, C.; Karahaliou, P.; Mehl, G.H. The stabilisation of the Nx phase in mixtures. Soft Matter 2016, 12, 888–899. [Google Scholar] [CrossRef]
- Dierking, I. Textures of Liquid Crystals; John Wiley & Sons, 2003. [Google Scholar]
- Newton, J.; Coles, H.; Hodge, P.; Hannington, J. Synthesis and properties of low-molar-mass liquid-crystalline siloxane derivatives. Journal of Materials Chemistry 1994, 4, 869–874. [Google Scholar] [CrossRef]
- Mehl, G.H.; Goodby, J.W. Substituted siloxysilanes and the structure of oligomeric liquid crystals. Chemical Communications 1999, 13–14. [Google Scholar] [CrossRef]
- Stevenson, W.D.; Zou, H.X.; Zeng, X.B.; Welch, C.; Ungar, G.; Mehl, G.H. Dynamic calorimetry and XRD studies of the nematic and twist-bend nematic phase transitions in a series of dimers with increasing spacer length. Physical Chemistry Chemical Physics 2018, 20, 25268–25274. [Google Scholar] [CrossRef]
- Stevenson, W.D.; Zeng, X.B.; Welch, C.; Thakur, A.K.; Ungar, G.; Mehl, G.H. Macroscopic chirality of twist-bend nematic phase in bent dimers confirmed by circular dichroism. Journal of Materials Chemistry C 2020, 8, 1041–1047. [Google Scholar] [CrossRef]
Figure 1.
Schematic representation of the design approach.
Scheme 1.
Synthesis route to monomer M1.
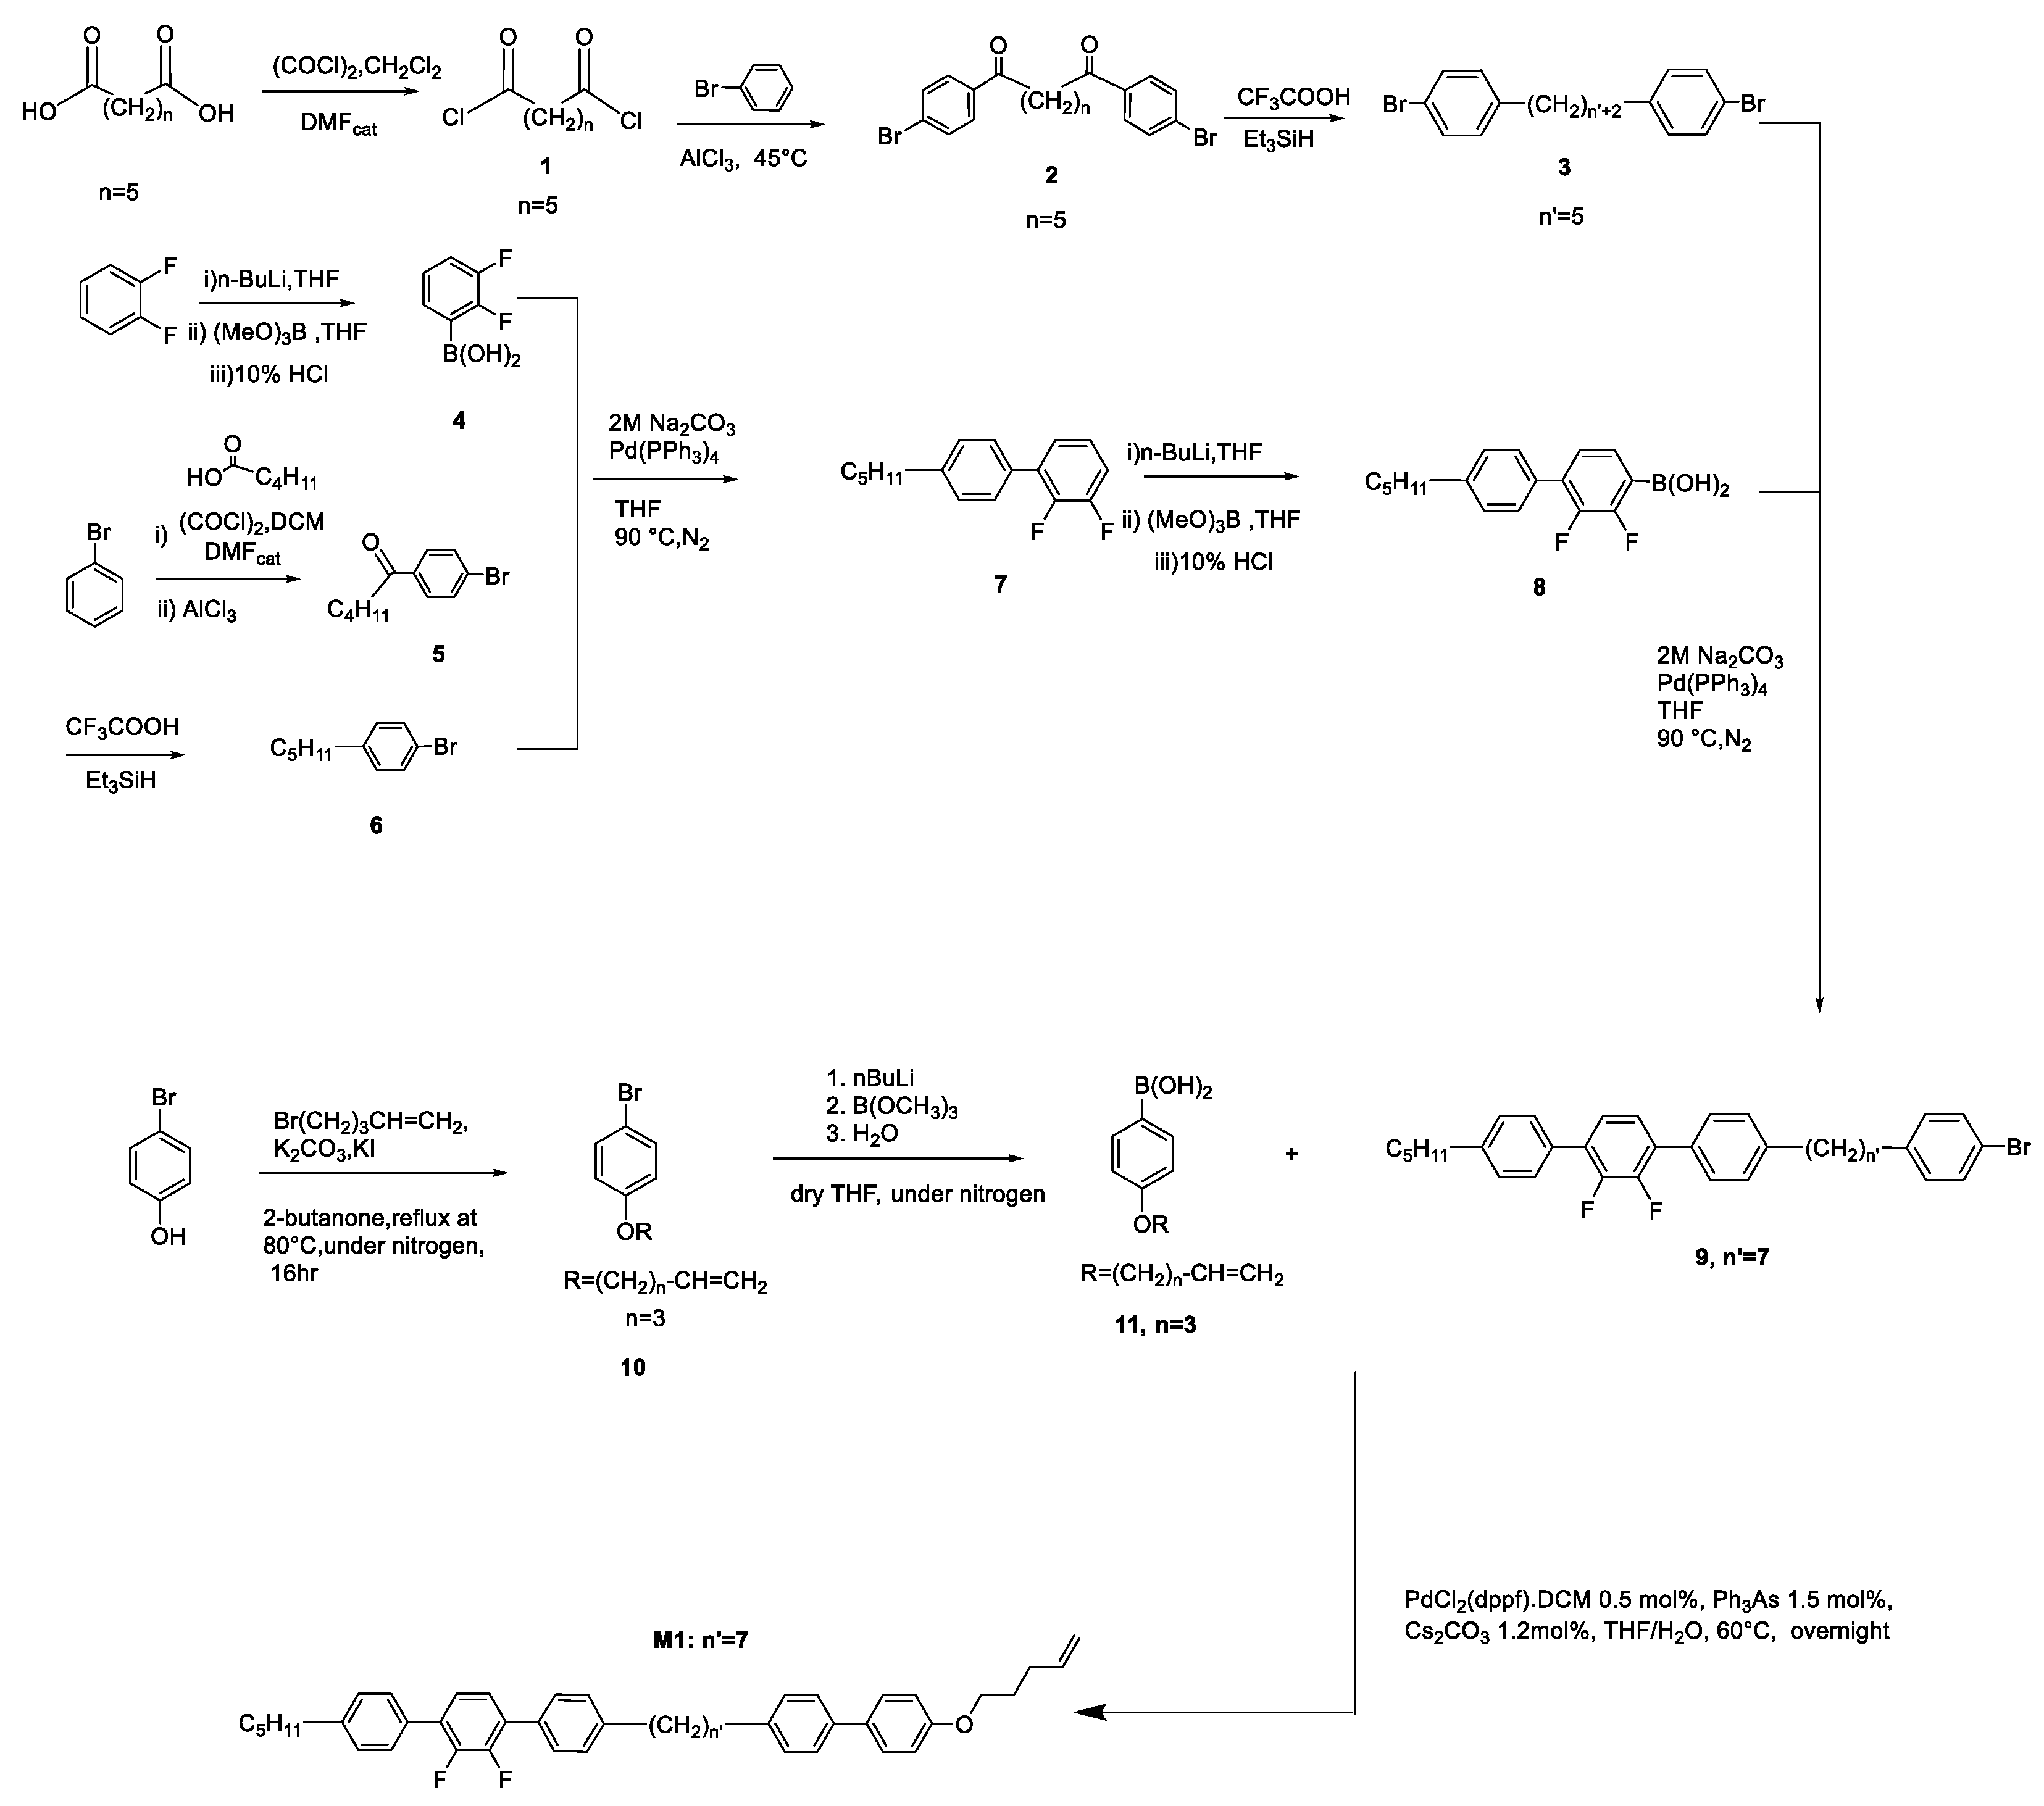
Figure 2.
a) 1HNMR of pure monomer M1 (b) 1HNMR of monomer M1 with isomers (isomer peaks highlight in blue circle).
Figure 2.
a) 1HNMR of pure monomer M1 (b) 1HNMR of monomer M1 with isomers (isomer peaks highlight in blue circle).
Scheme 2.
Synthesis route of pentamethydisiloxane PMDS 1.
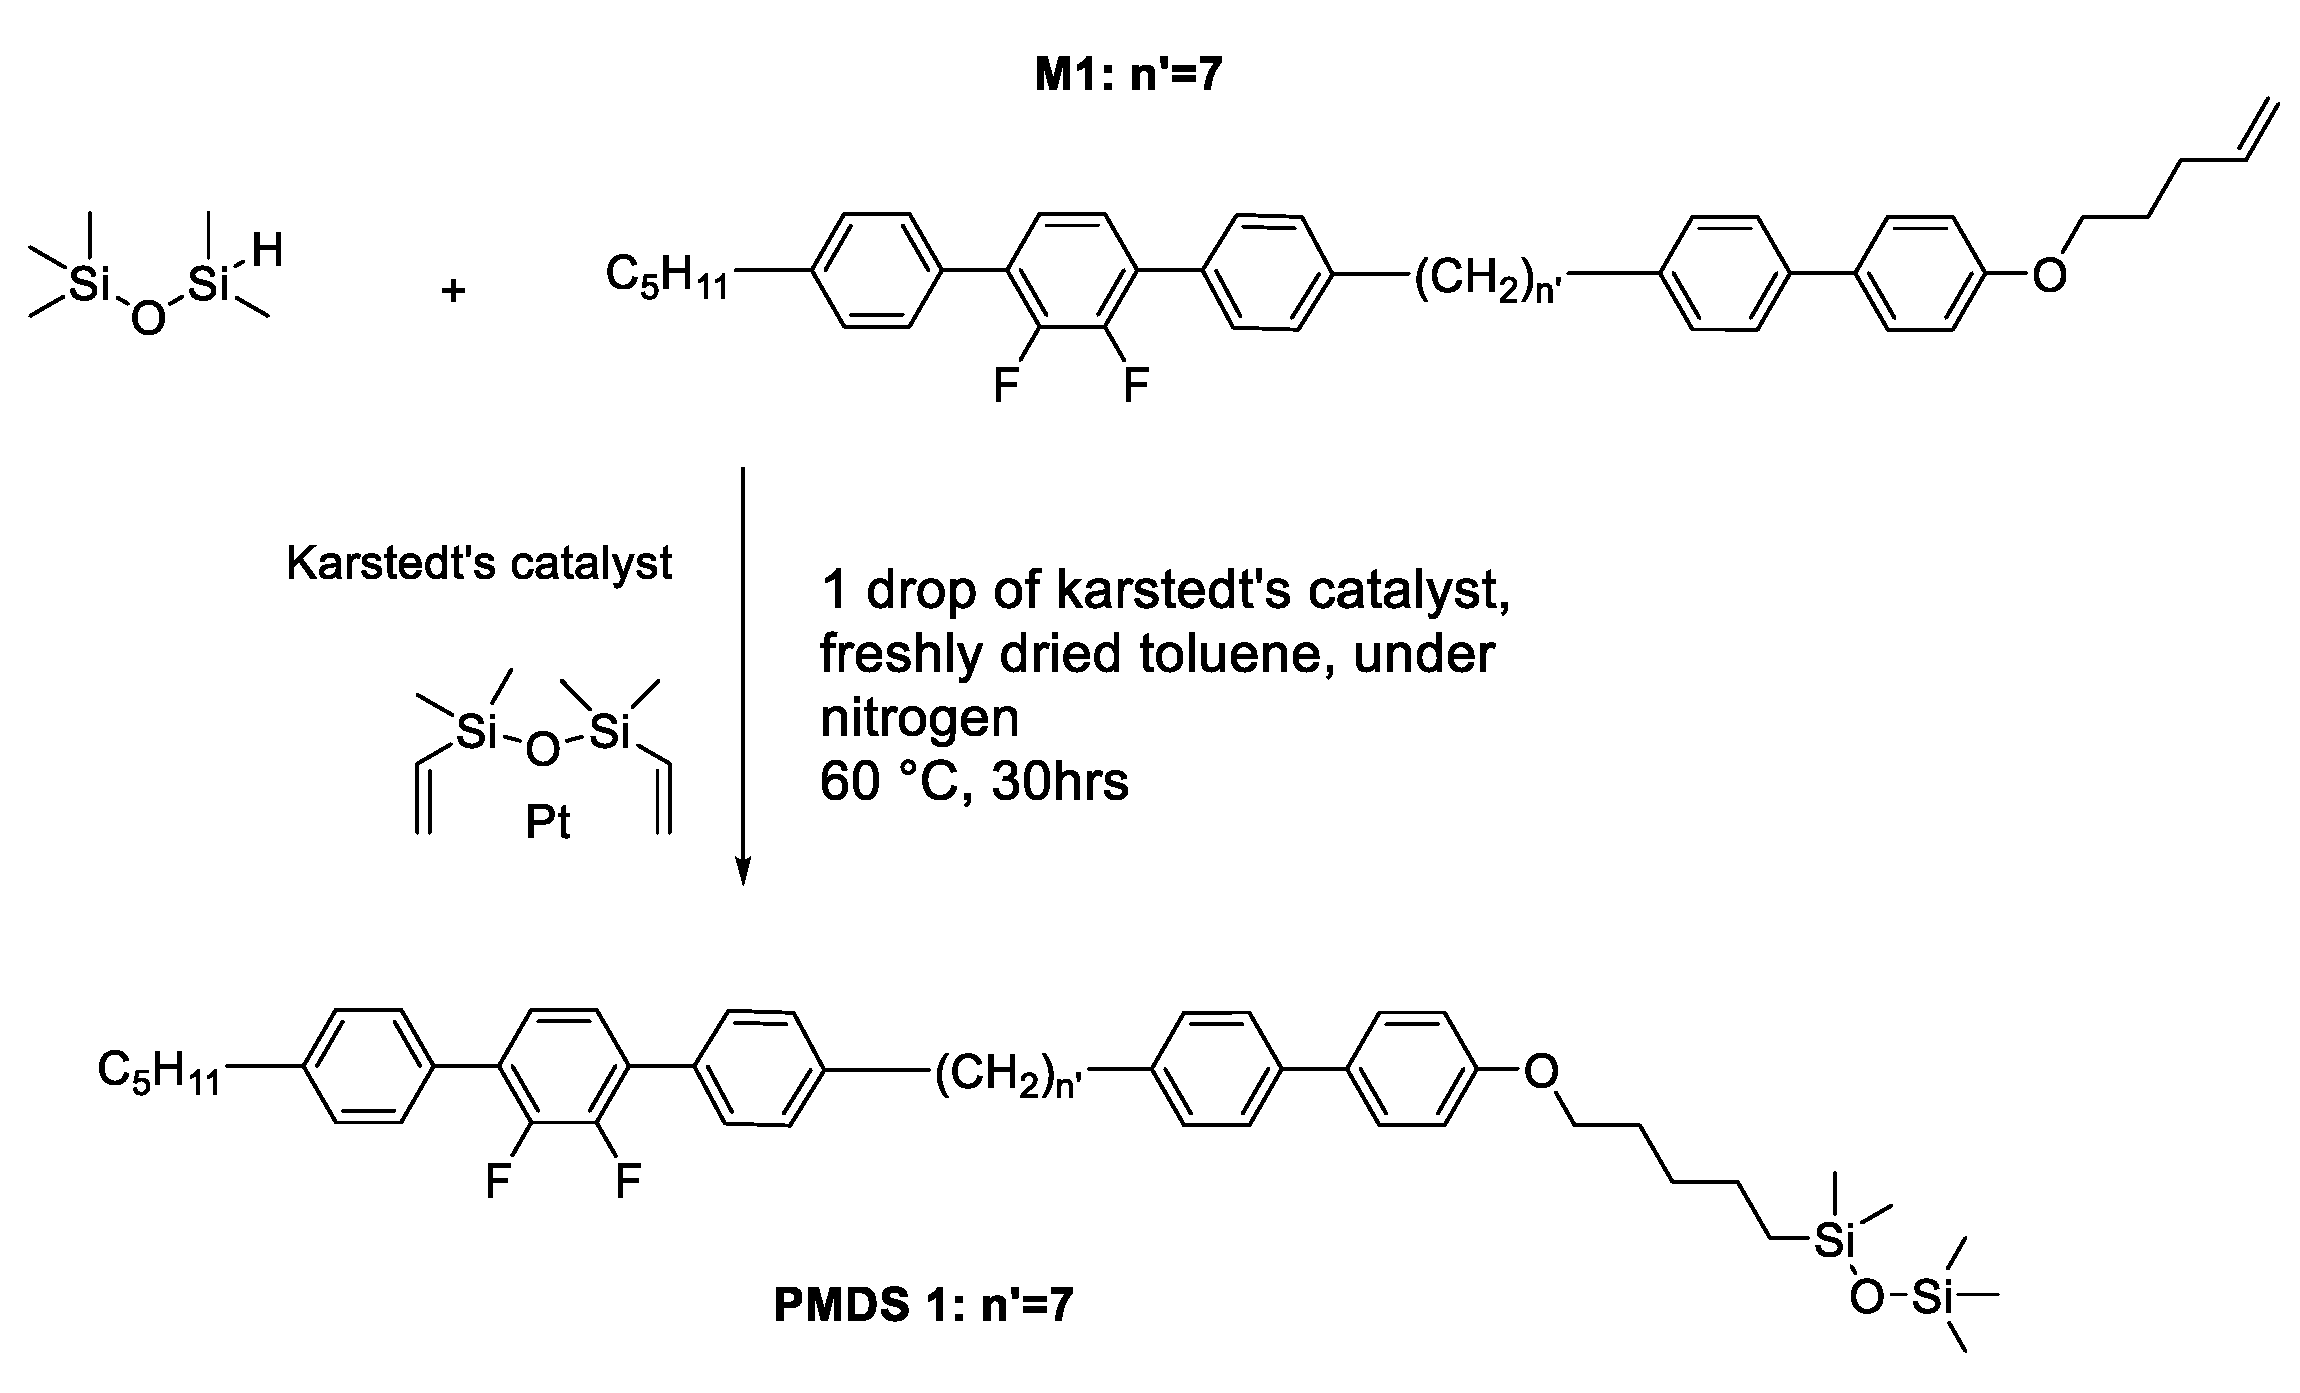
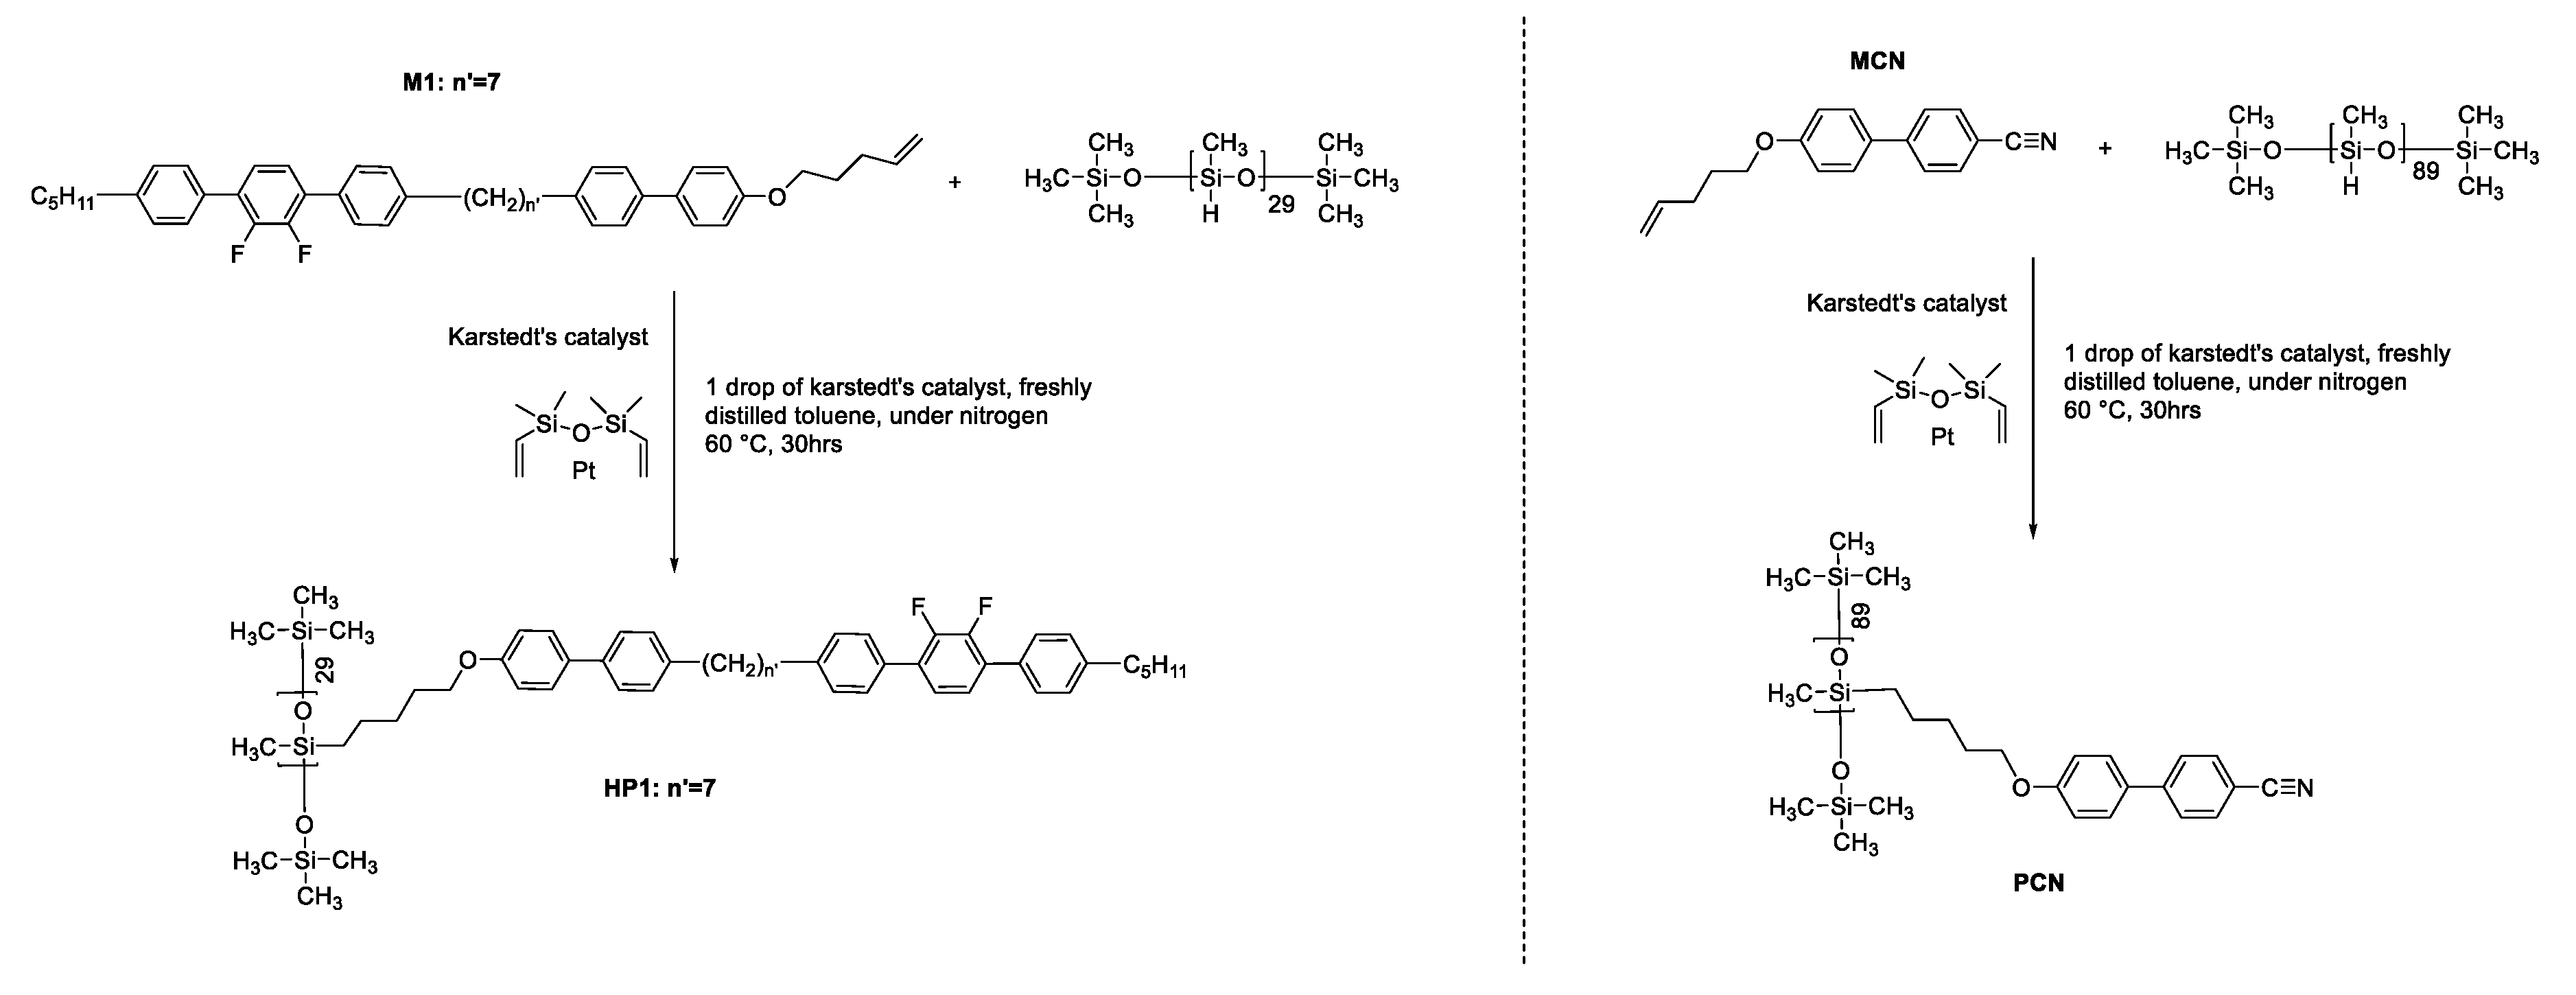
Figure 3.
HNMR of homopolymer HP1.
Scheme 4.
Synthesis route of homopolymer CoP 1.
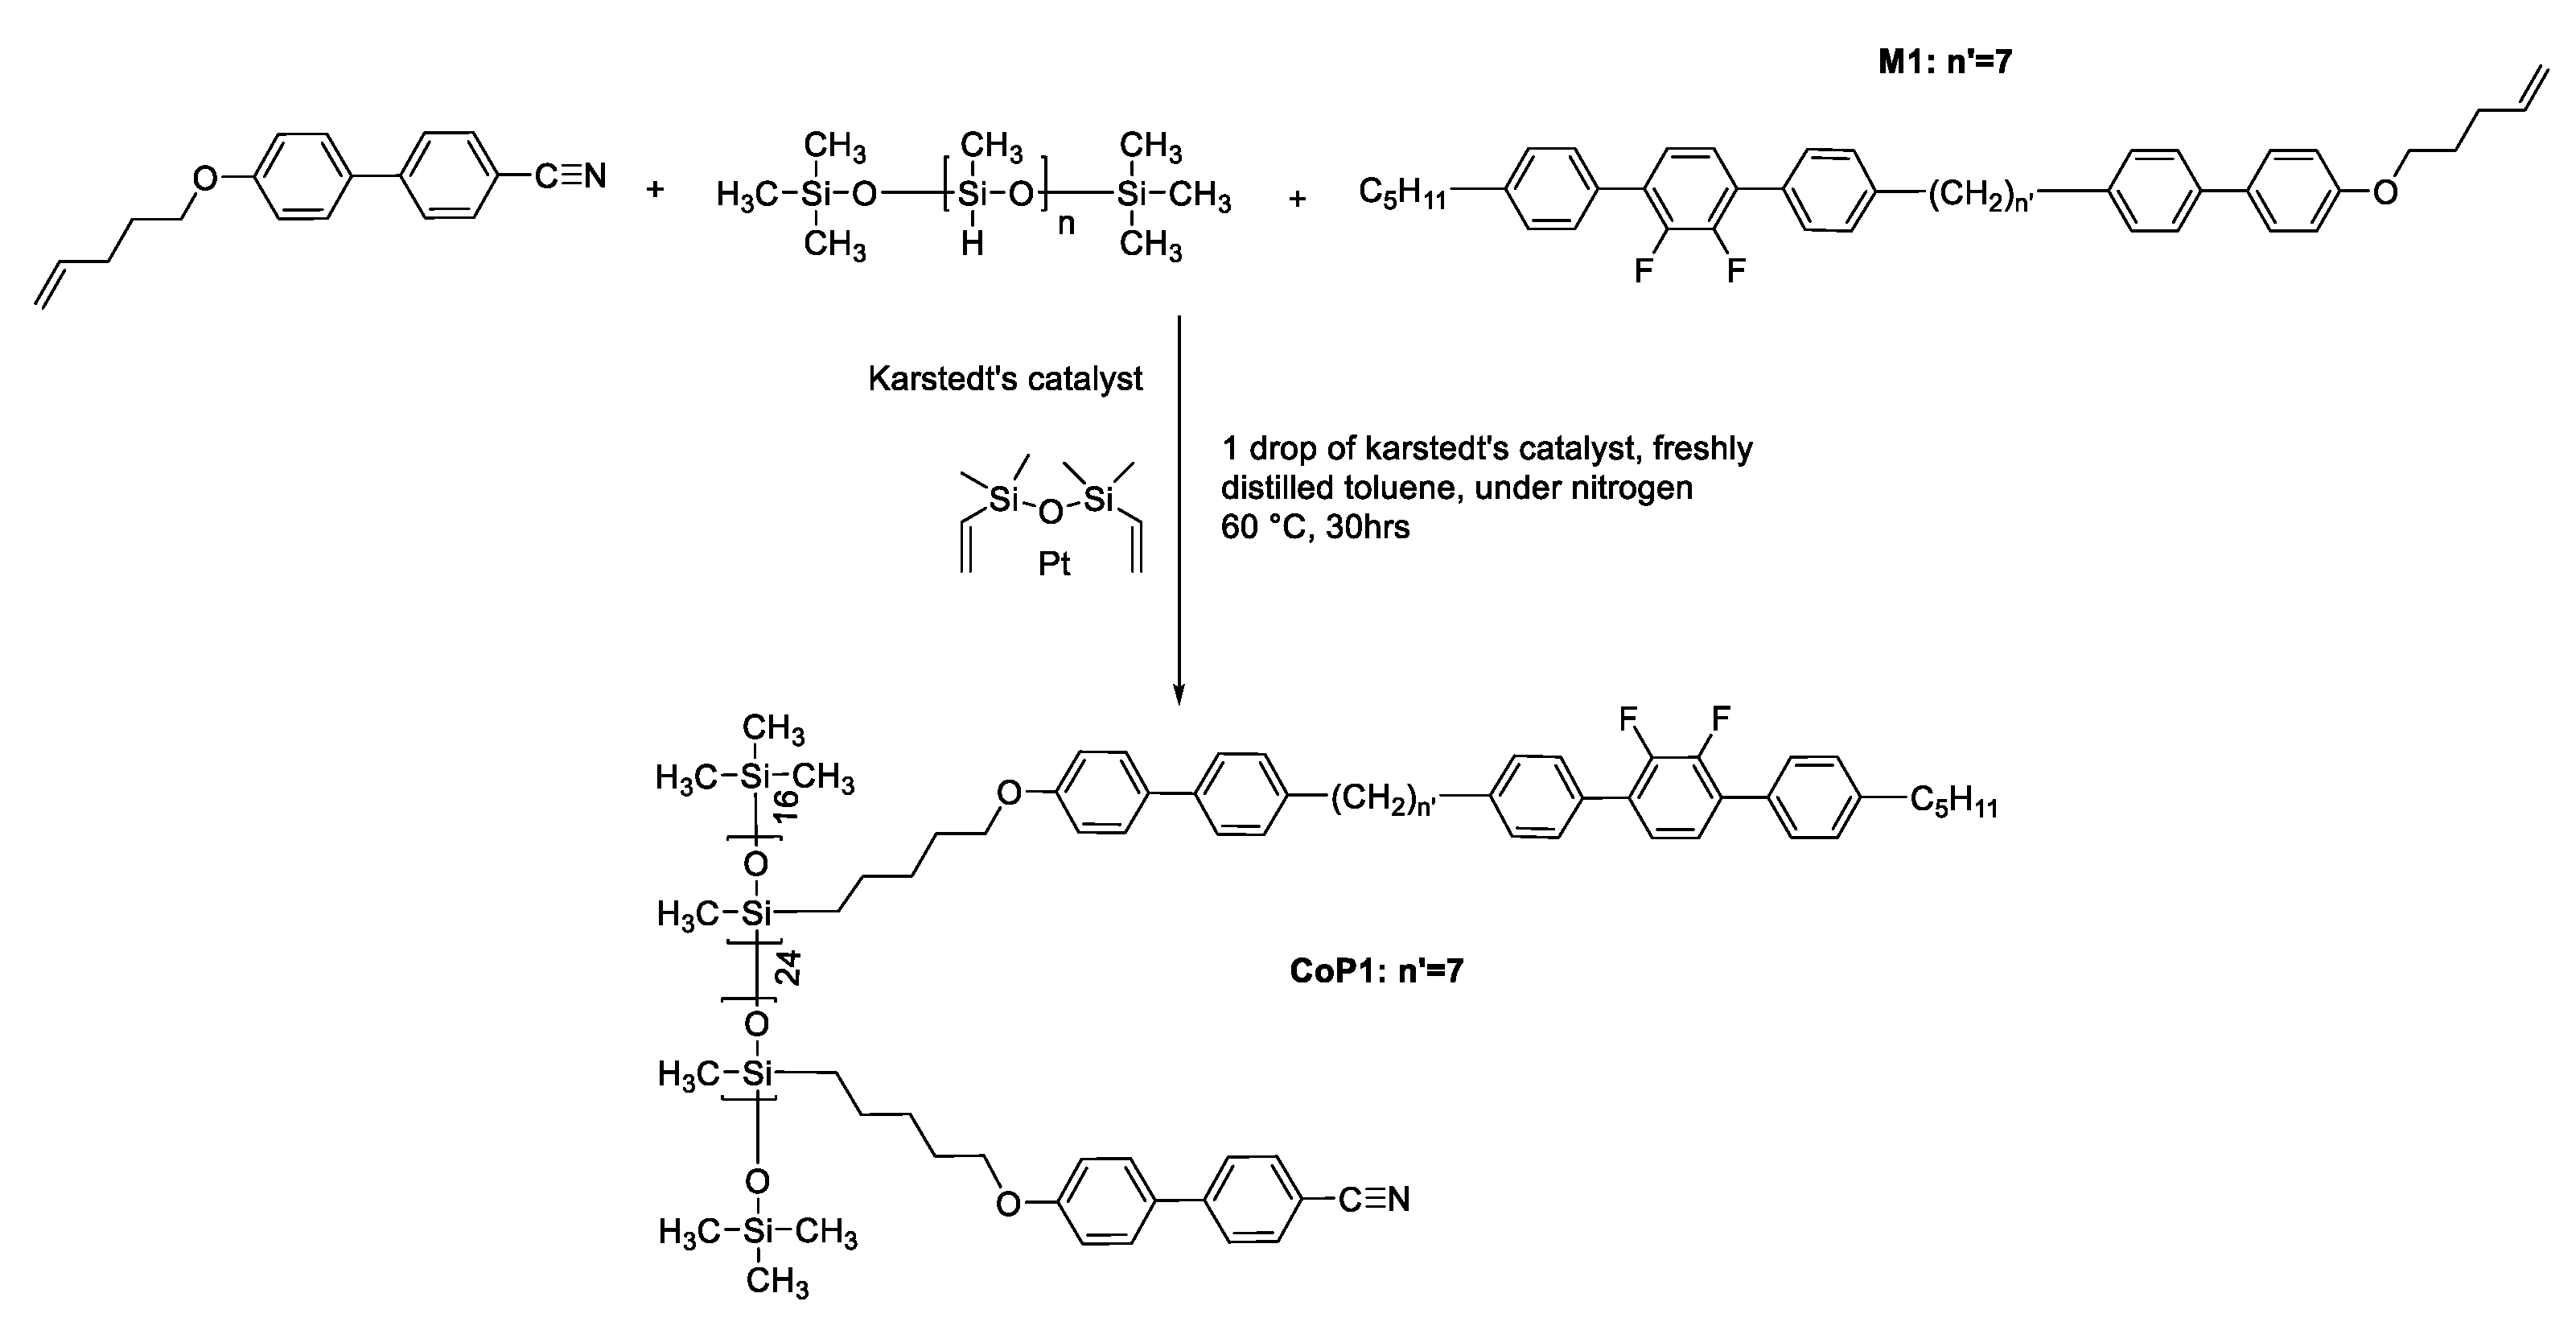
Figure 4.
OPM of monomer M1, the scale bar is 105μm. (a) nematic phase at 112 (b) phase transition at 10 (top left is in Ntb phase, while bottom right is in N phase) (c) Ntb phase at 100 (d) Ntb phase at 100 after shearing (e) phase texture under gently shearing at 80 (f) homeotropic texture after shearing at 95

Figure 5.
Textures measured by OPM of M1 at the 103 ℃ at different cooling rates. Top left is the Ntb phase, and bottom right is the nematic phase. (a) cooling rate at 10 0.1 ℃/min under 103 ℃ (b) cooling rate at 3 0.1 ℃/min under 103 ℃ (c) cooling rate at 0.1 ℃/min, under 103 ℃.
Figure 5.
Textures measured by OPM of M1 at the 103 ℃ at different cooling rates. Top left is the Ntb phase, and bottom right is the nematic phase. (a) cooling rate at 10 0.1 ℃/min under 103 ℃ (b) cooling rate at 3 0.1 ℃/min under 103 ℃ (c) cooling rate at 0.1 ℃/min, under 103 ℃.
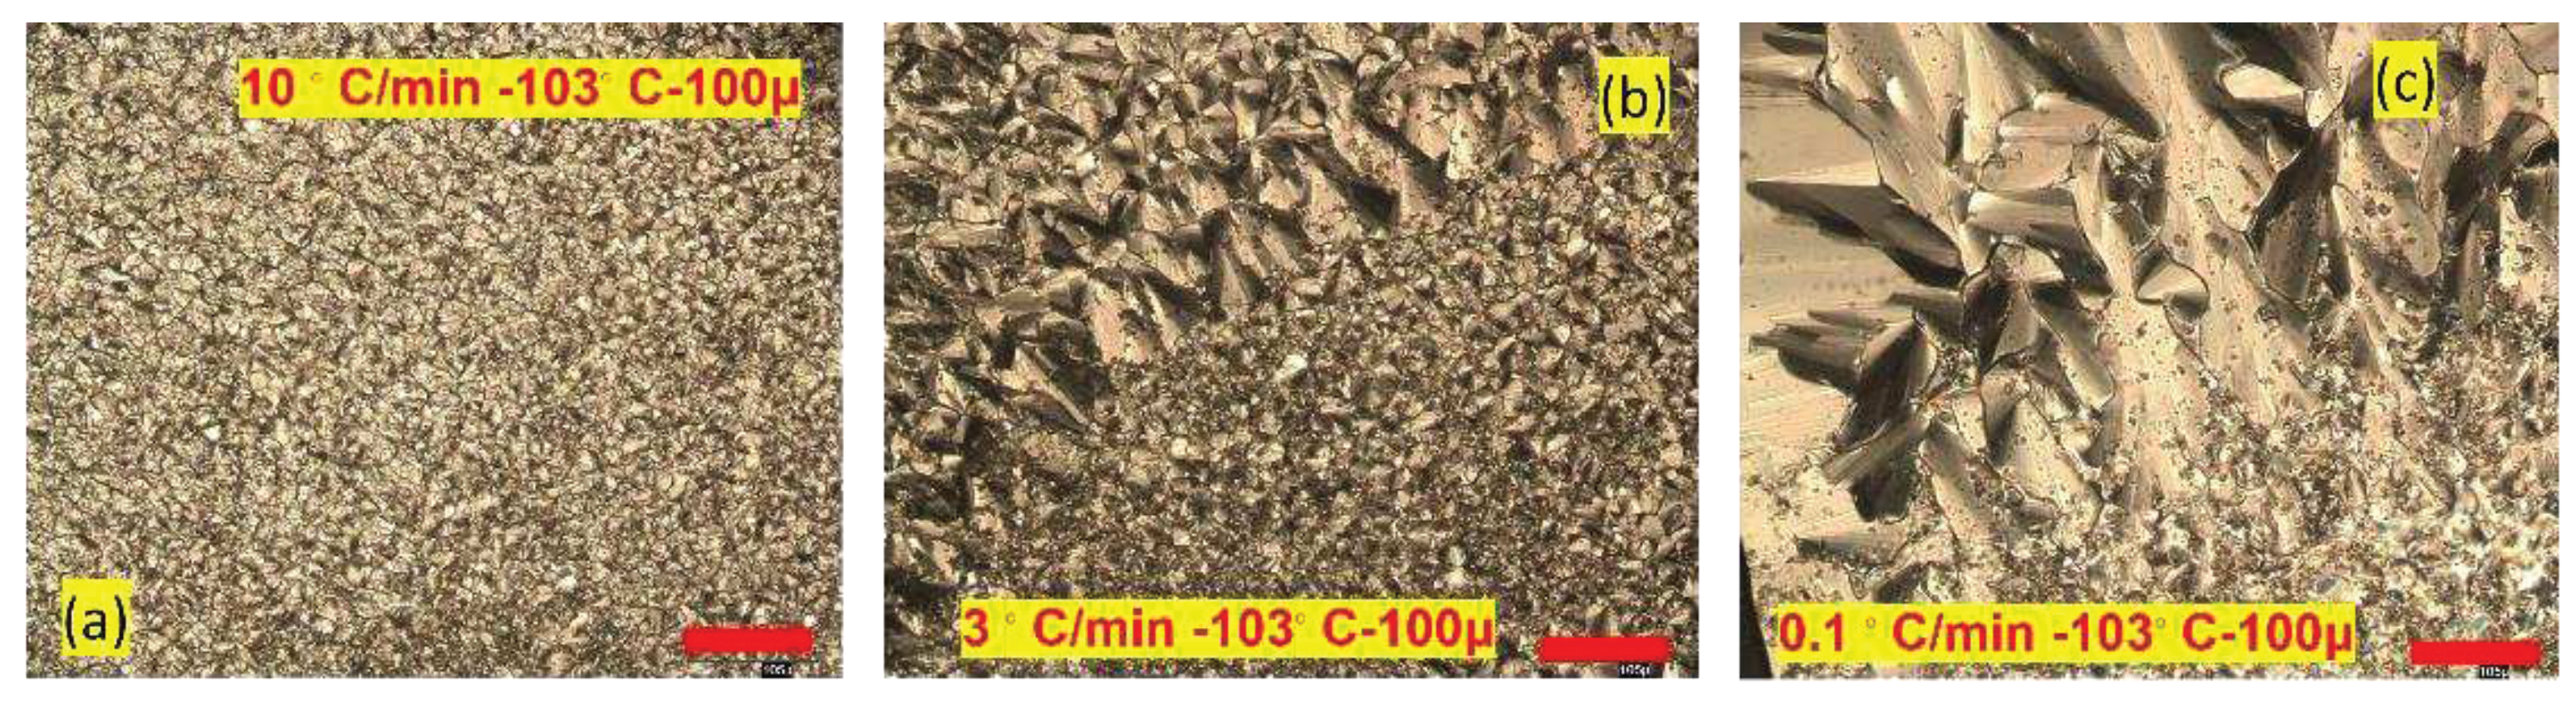
Figure 6.
OPM of pentamethydisiloxane derivative PMDS1, the scale bar is 105μm. (a) A smectic phase emerges from the isotropic state. Bãtonet shapes at 1090.1 ℃ (b) SmA phase at 108 ℃ (c) SmX phase at 74 ℃.
Figure 6.
OPM of pentamethydisiloxane derivative PMDS1, the scale bar is 105μm. (a) A smectic phase emerges from the isotropic state. Bãtonet shapes at 1090.1 ℃ (b) SmA phase at 108 ℃ (c) SmX phase at 74 ℃.
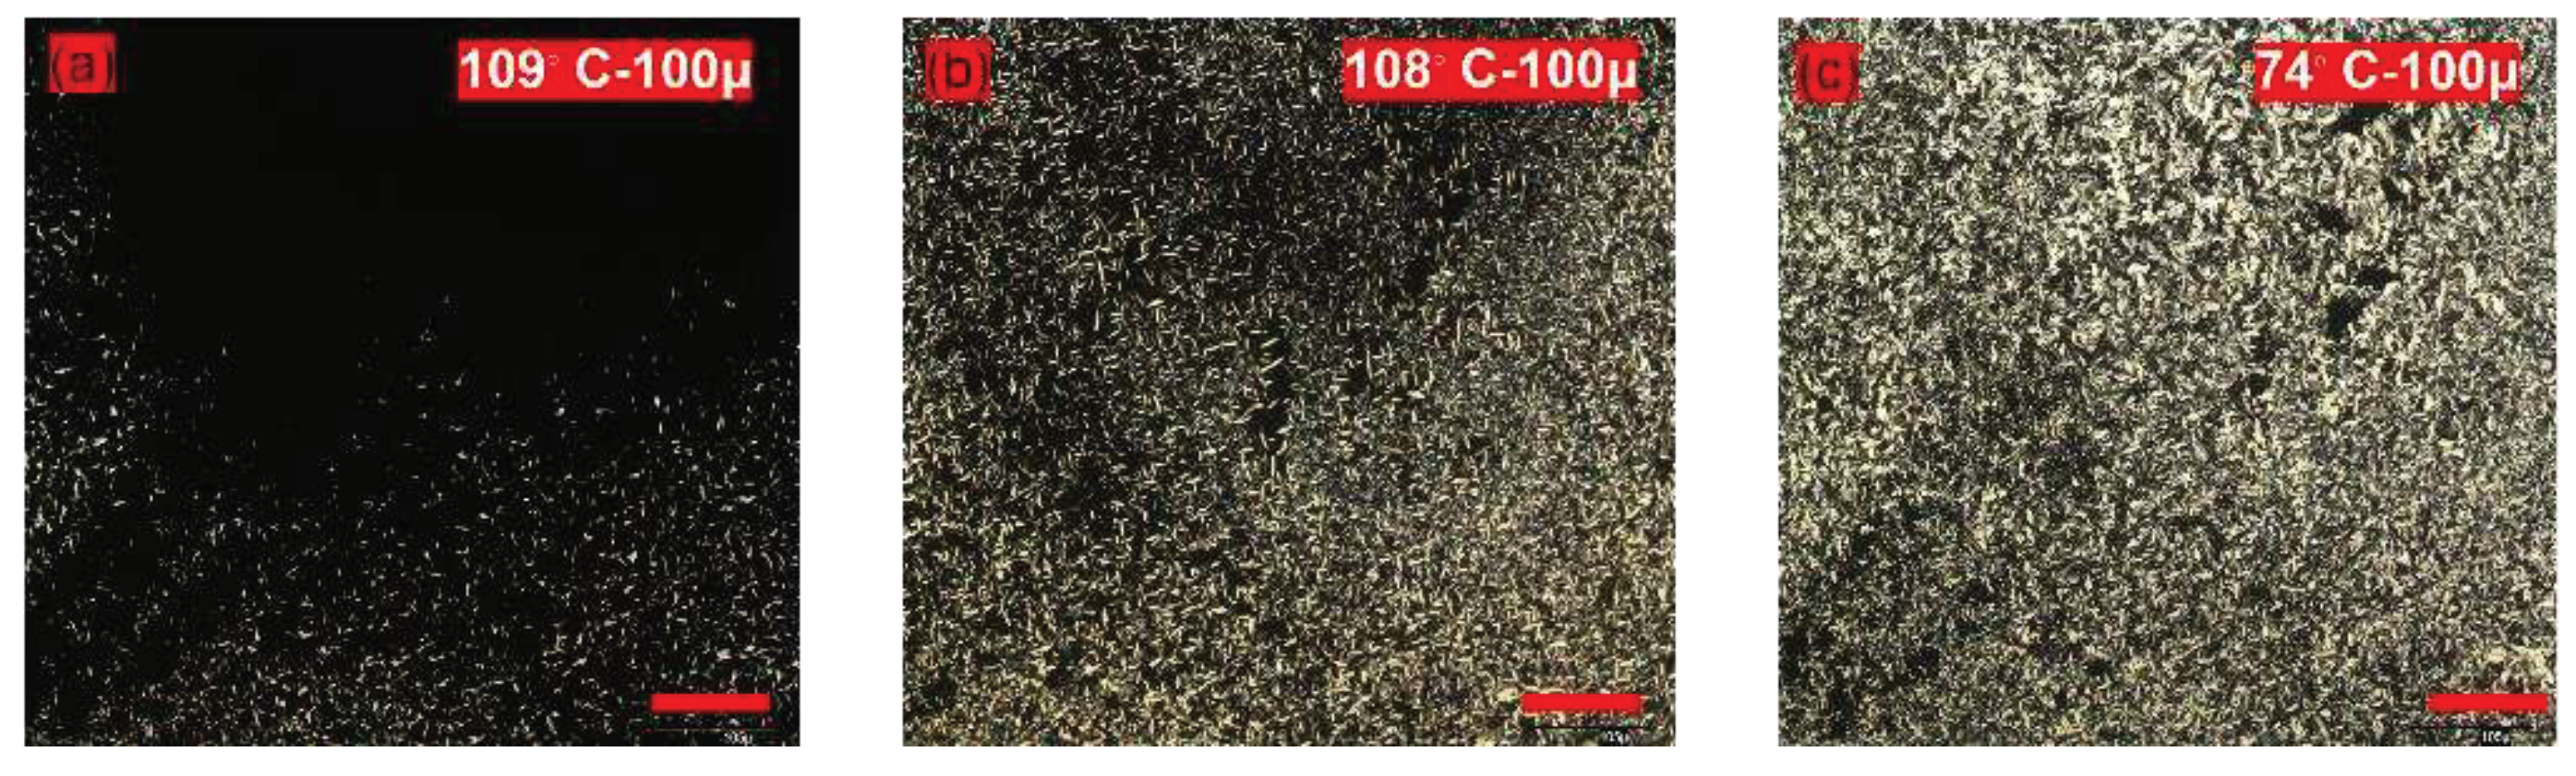
Figure 7.
Structure of DTC5C7.
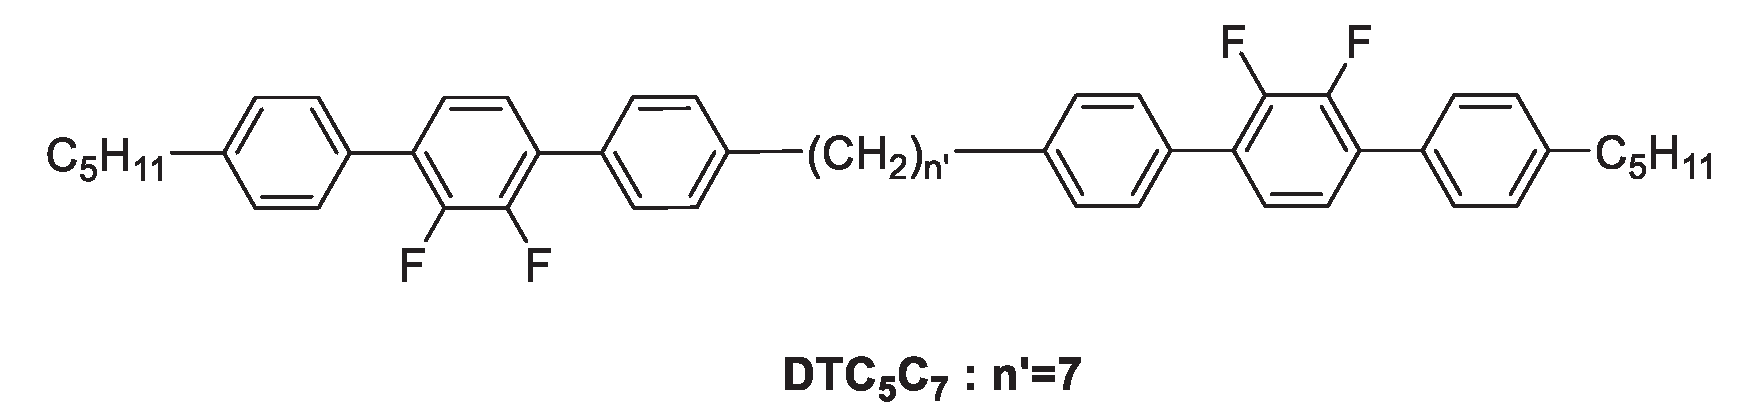
Figure 8.
Textures of the contact preparation HP1 with DTC5C7, displayed by optical polarization microscopy. The scale bar is 105 μm. Left side shows the texture of DTC5C7, right side the texture of HP1, blue dash line indicates the initial separation line (a) texture at 138, DTC5C7 at nematic phase on the left side (b) texture at 120, DTC5C7 in the Ntb phase on the left- side (c) texture at 120, after annealing for 1 day, both sides gradually merge (d),(e) textures at 120, after annealing for 2 days, more clear textures are formed (f) texture at 120, where DTC5C7 shows the Ntb phase in small magnification (g) texture at 120 after annealing for 1 days in a small magnification (h) texture at 120 after annealing for 2 days at a small magnification (x40).
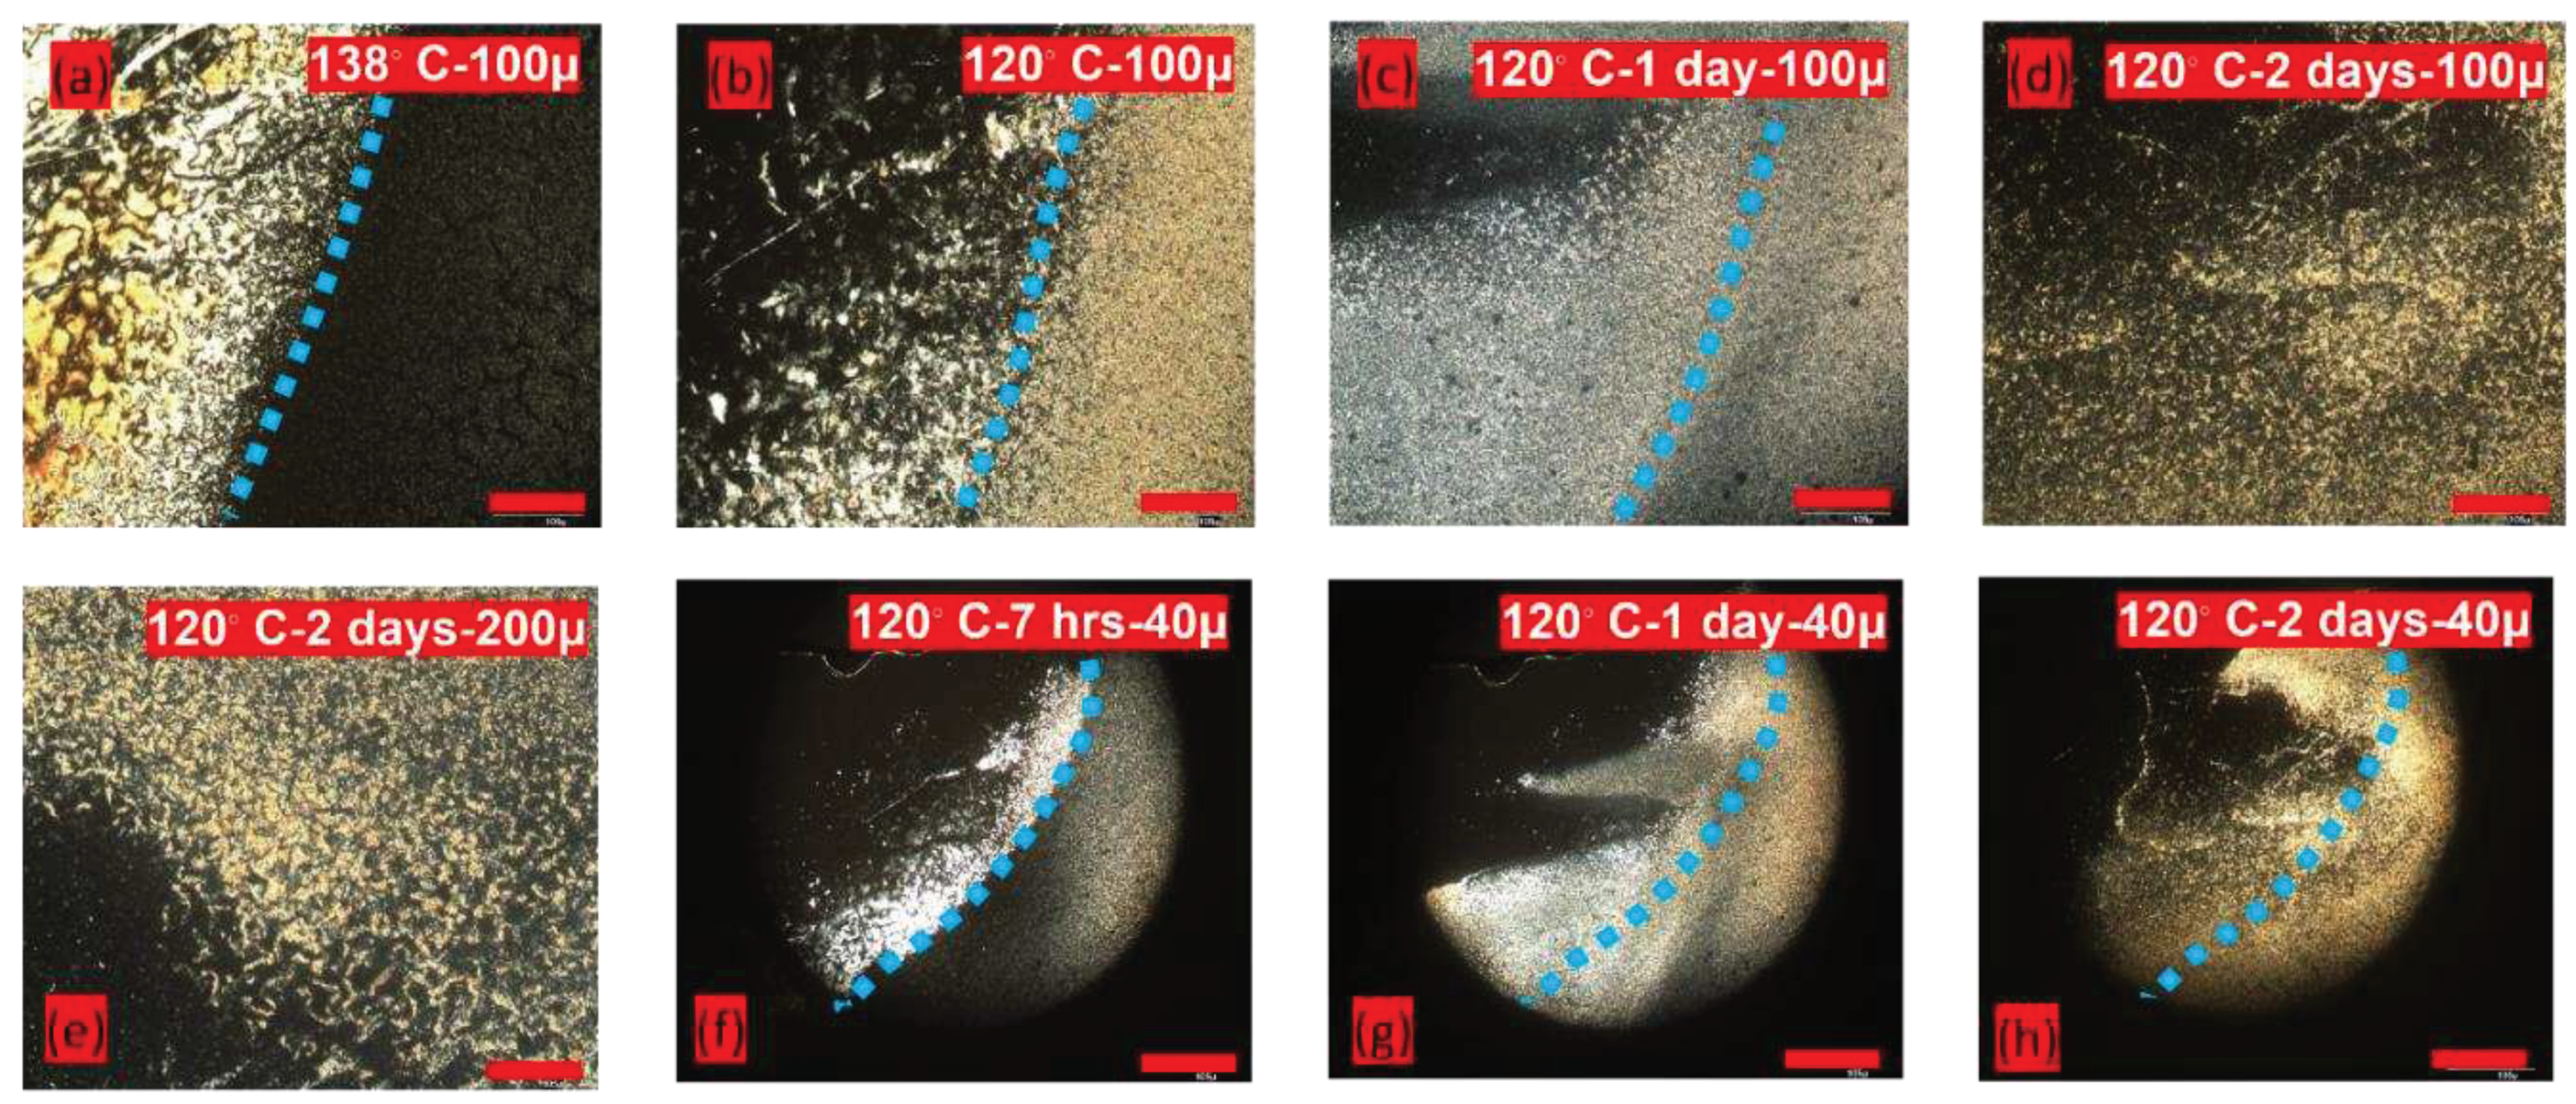
Figure 9.
Plot of 2𝜃 against intensity of the X-ray powder diffraction patterns at room temperature of copolymer1 (CoP1)
Figure 9.
Plot of 2𝜃 against intensity of the X-ray powder diffraction patterns at room temperature of copolymer1 (CoP1)
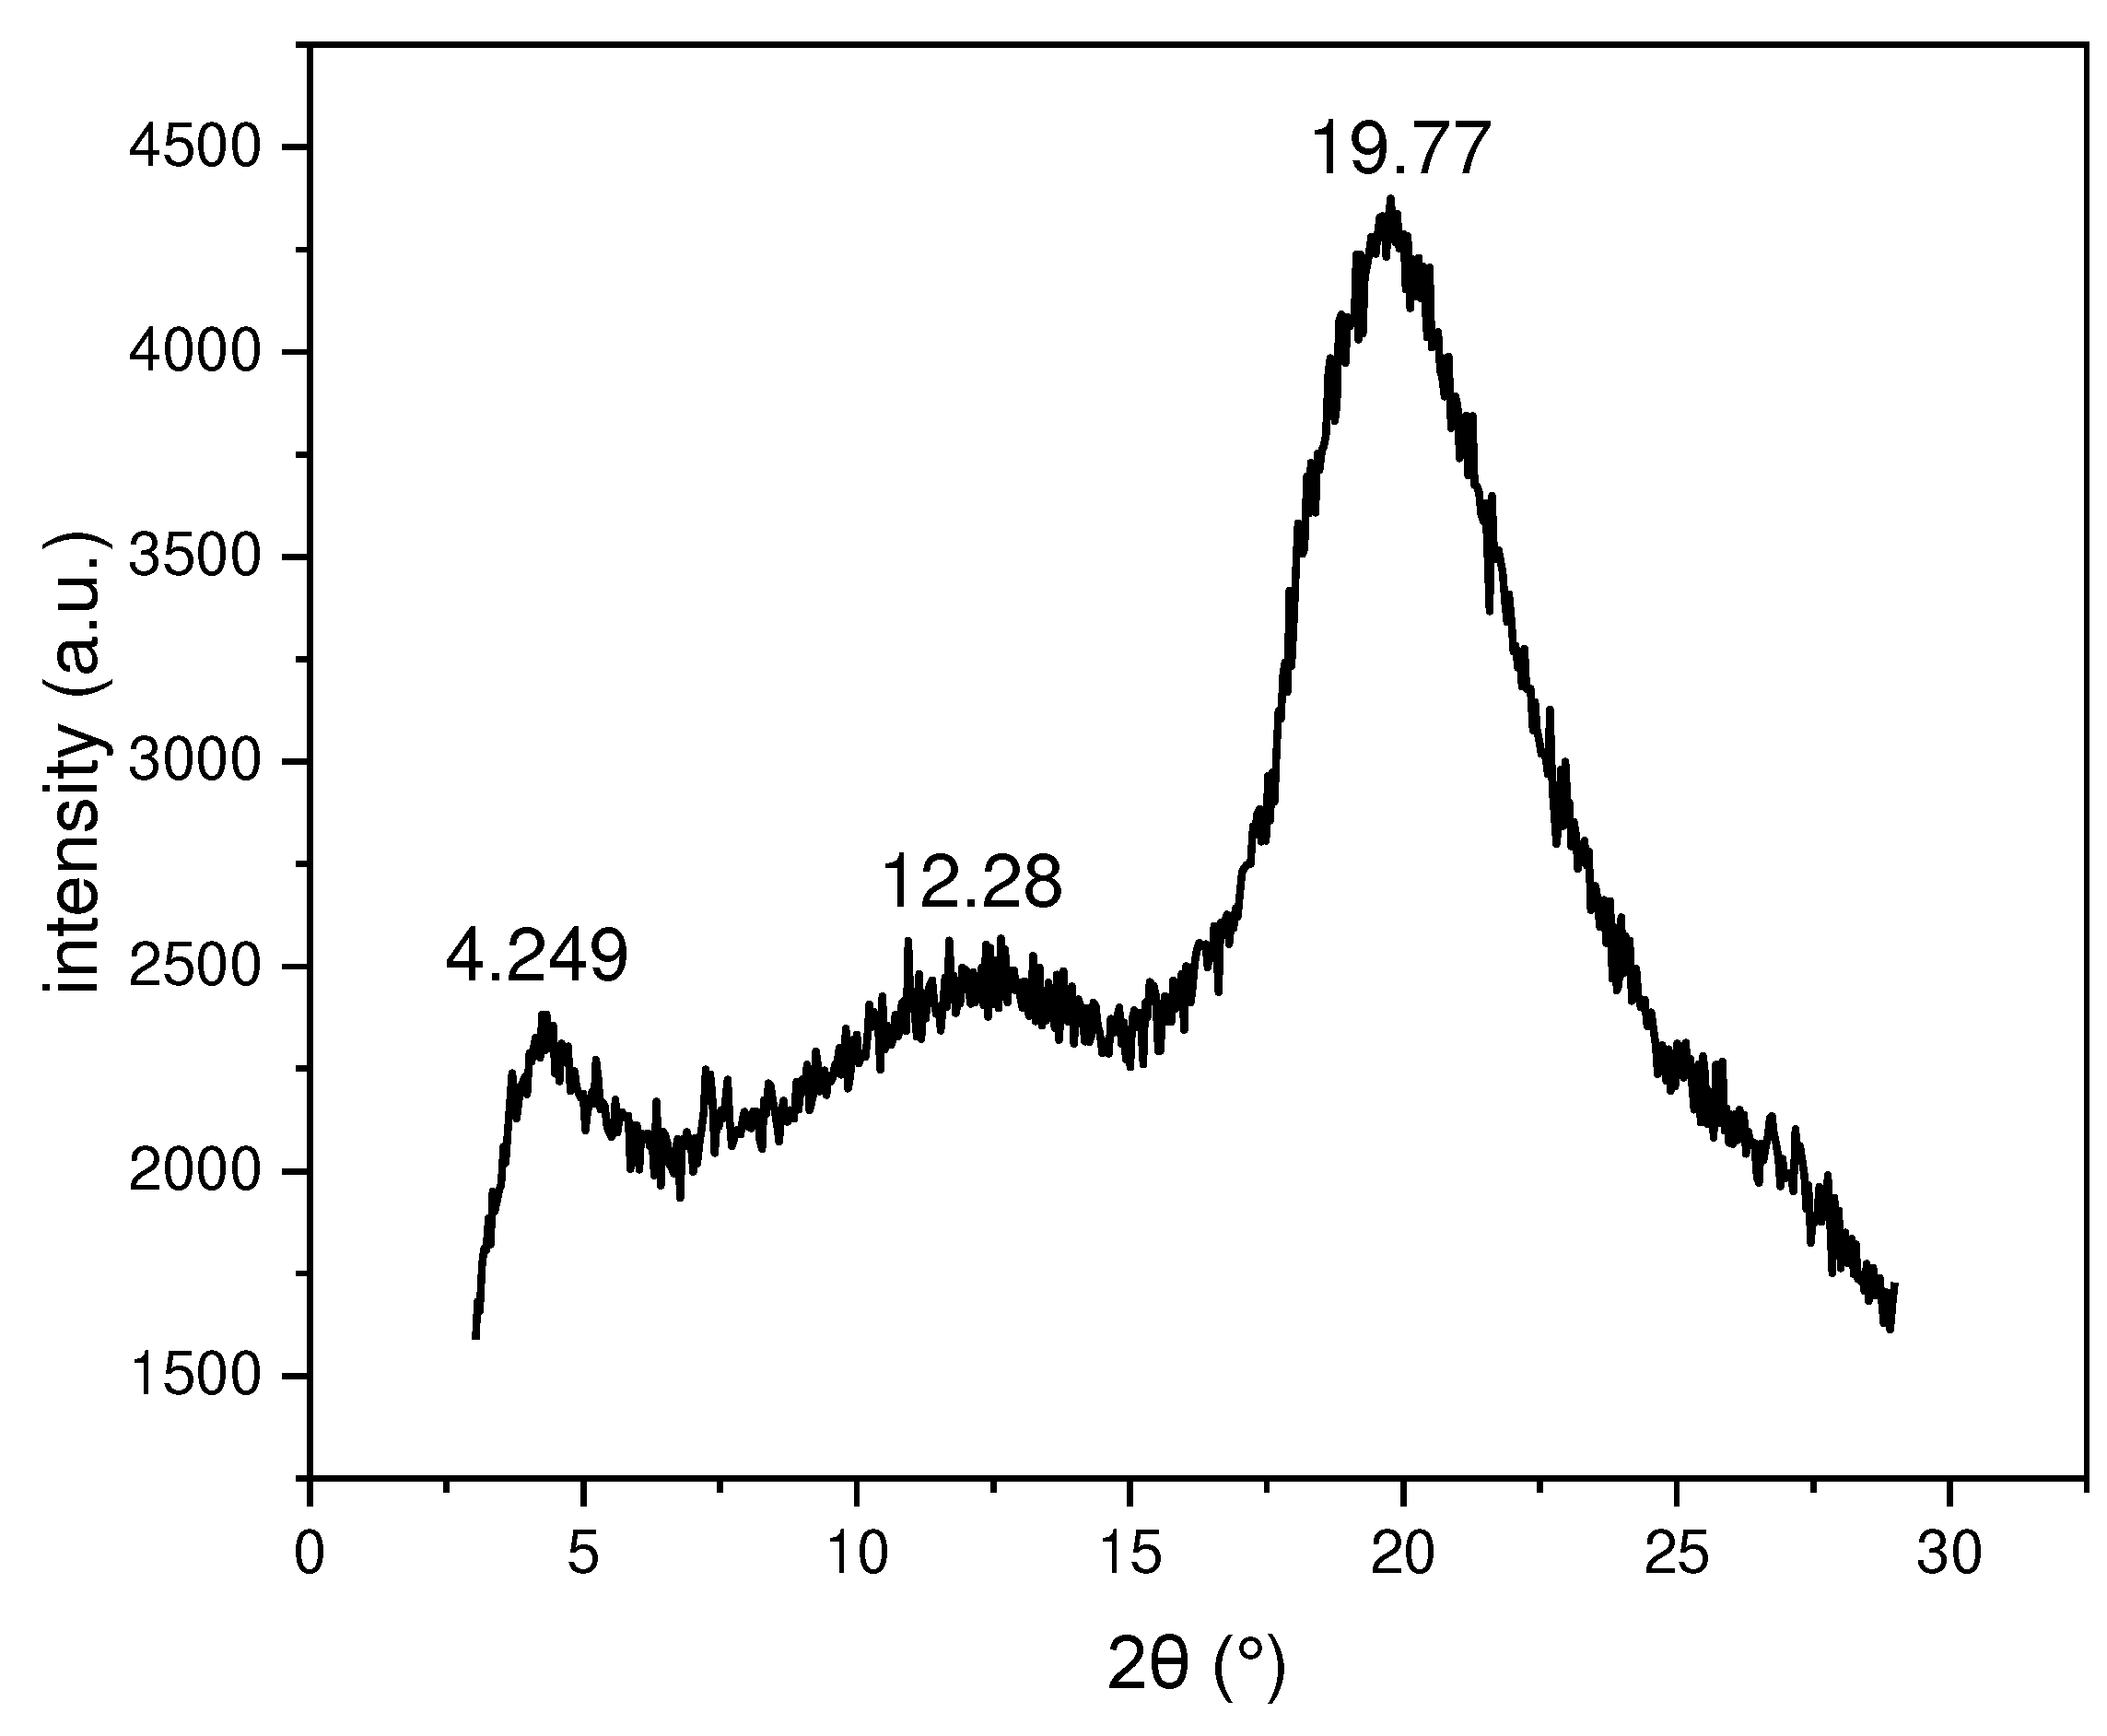
Figure 10.
a)Temperature concentration phase diagrams for the CBC9CB-M1 binary mixtures. Closed colorful symbols are used to denote the transition temperatures taken from the second cooling DSC run. Dash lines represent potential transitions unresolved by the DSC experiments. (b) Enthalpy values from the second cooling run of DSC as a function of concentration of monomer M1, for the Iso-N and N-Ntb phase of the CBC9CB -M1 binary mixtures. Red close circles for the N-Ntb enthalpy changes, while blue square represents the Iso-N enthalpies. (c) 2nd heating and cooling curve at 10℃/min result of a 25 wt% M1 and 75 wt% CBC9CB.
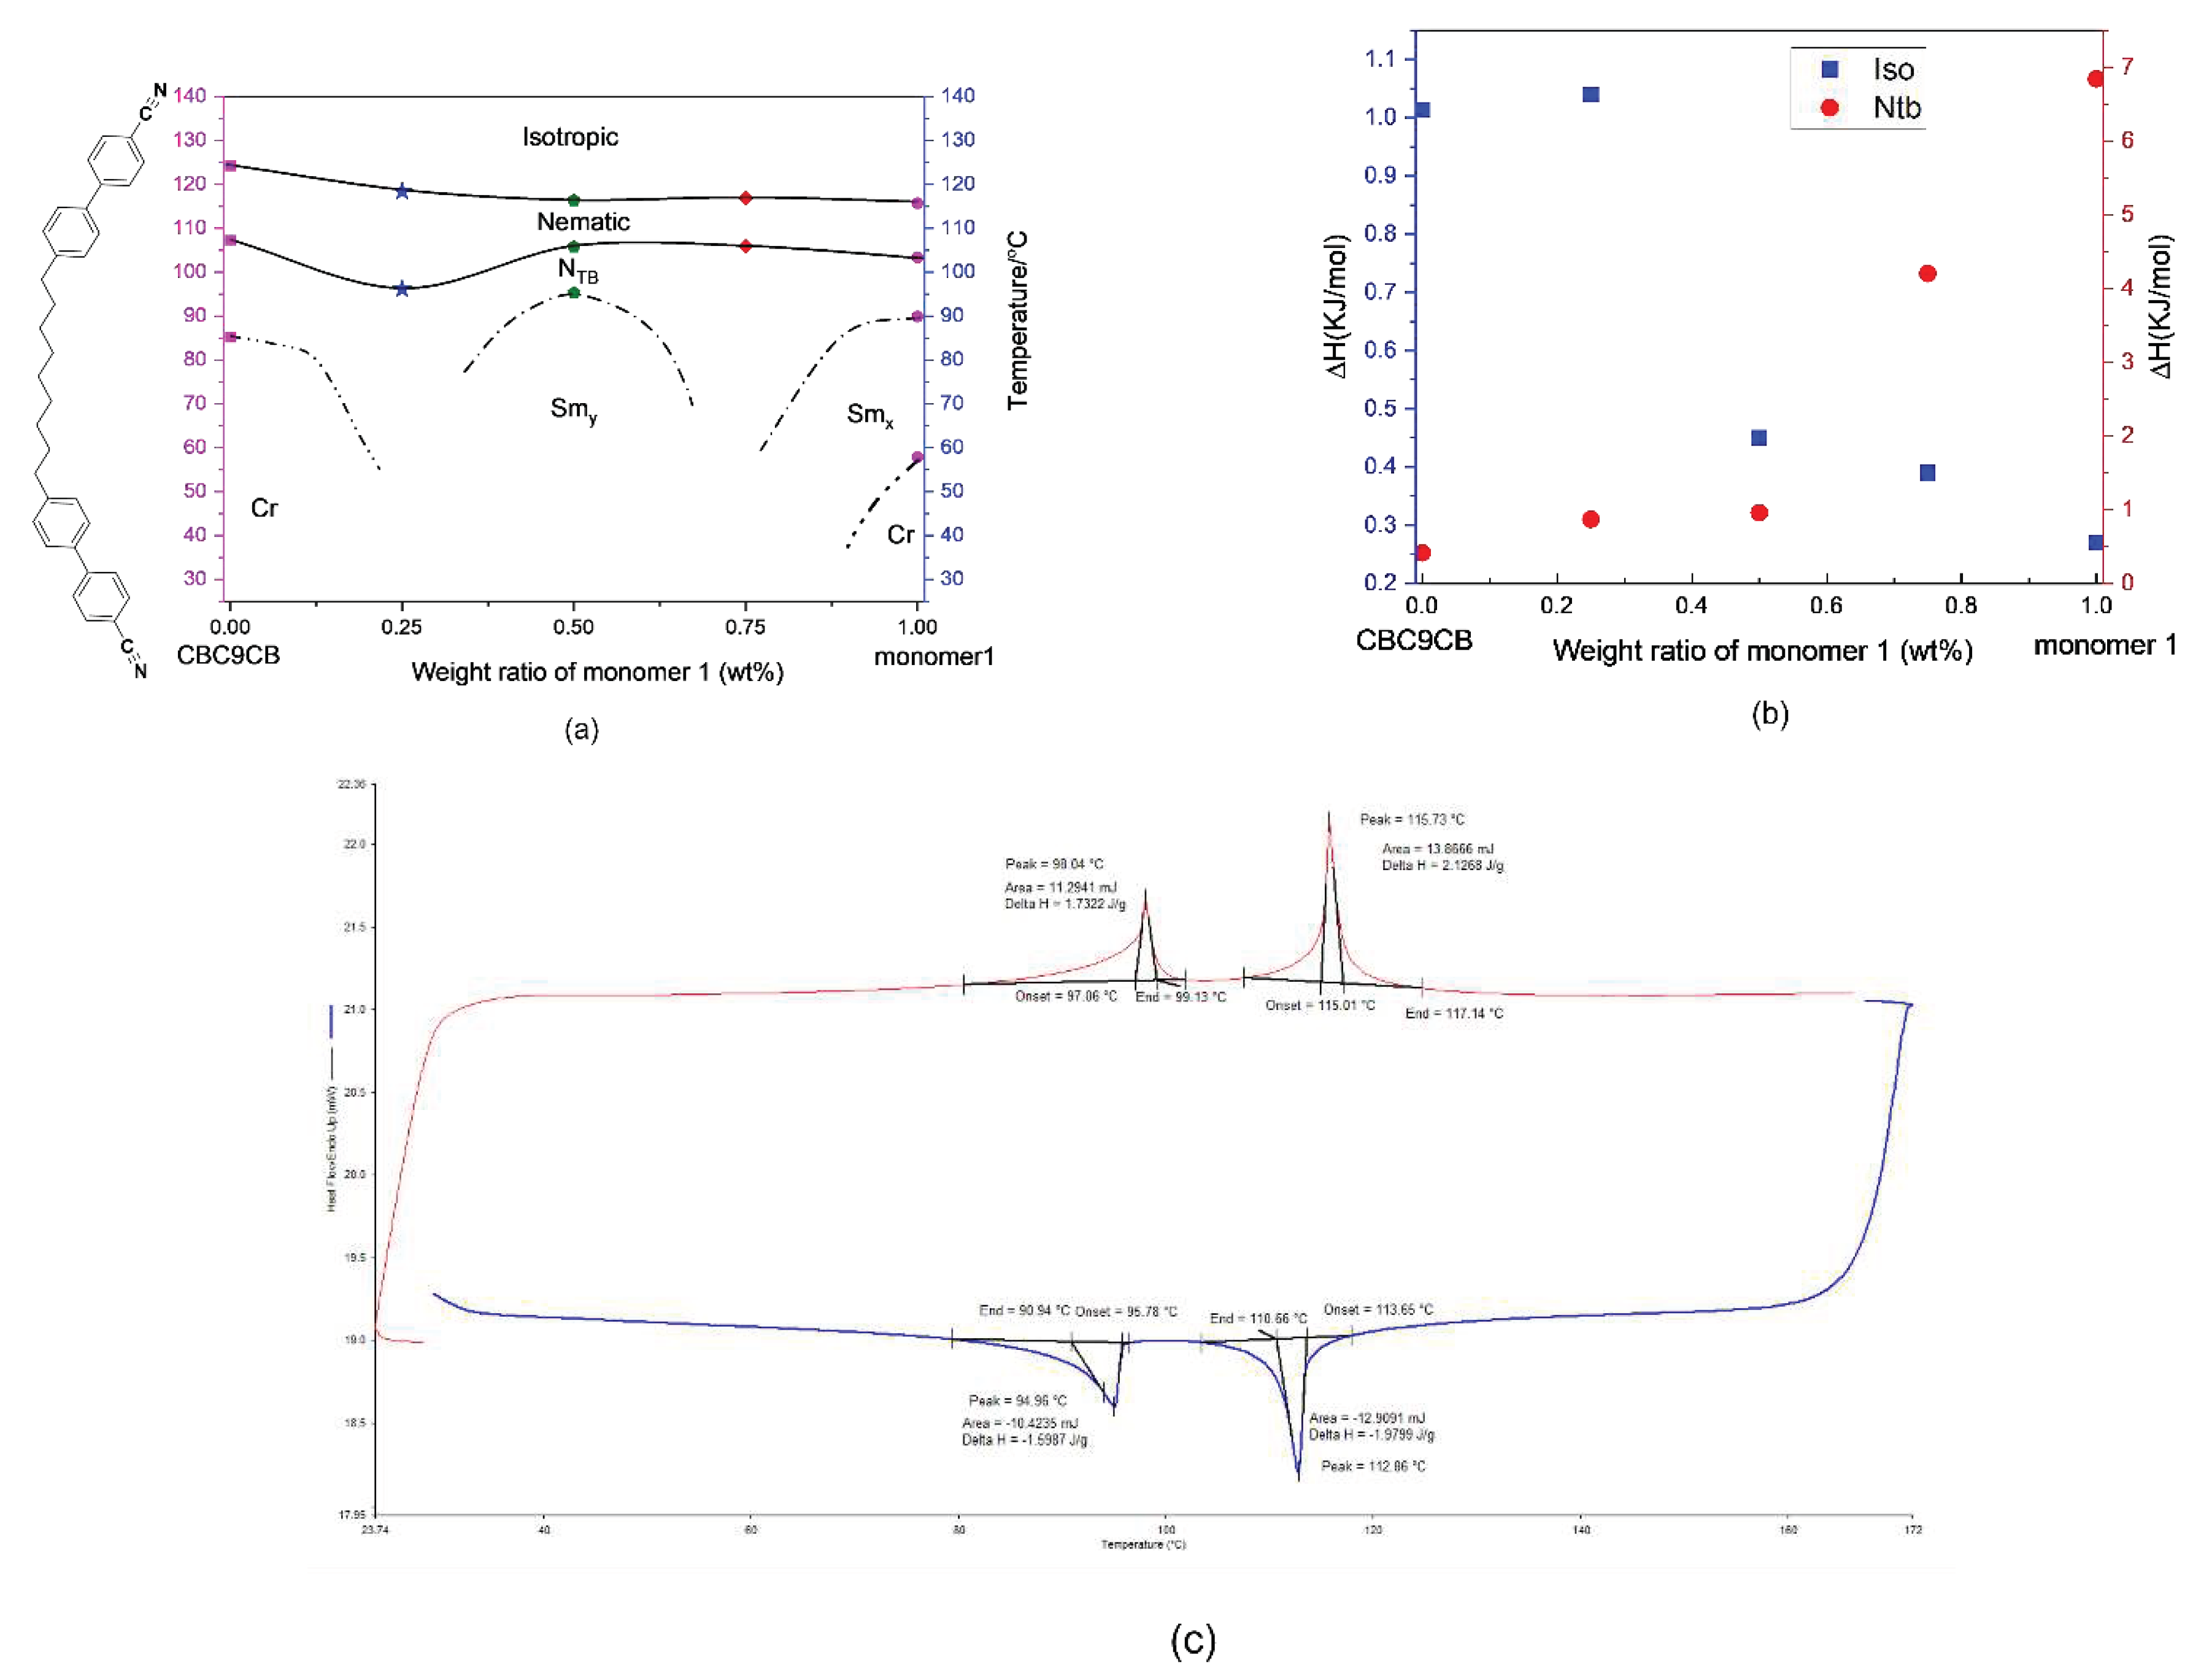
Figure 11.
Defec texture of homopolymer 1 (HP1), as by optical polarization microscopy. The scale bar is 105 μm (a) at 110 (b) at 139 (c) at 160
Figure 11.
Defec texture of homopolymer 1 (HP1), as by optical polarization microscopy. The scale bar is 105 μm (a) at 110 (b) at 139 (c) at 160
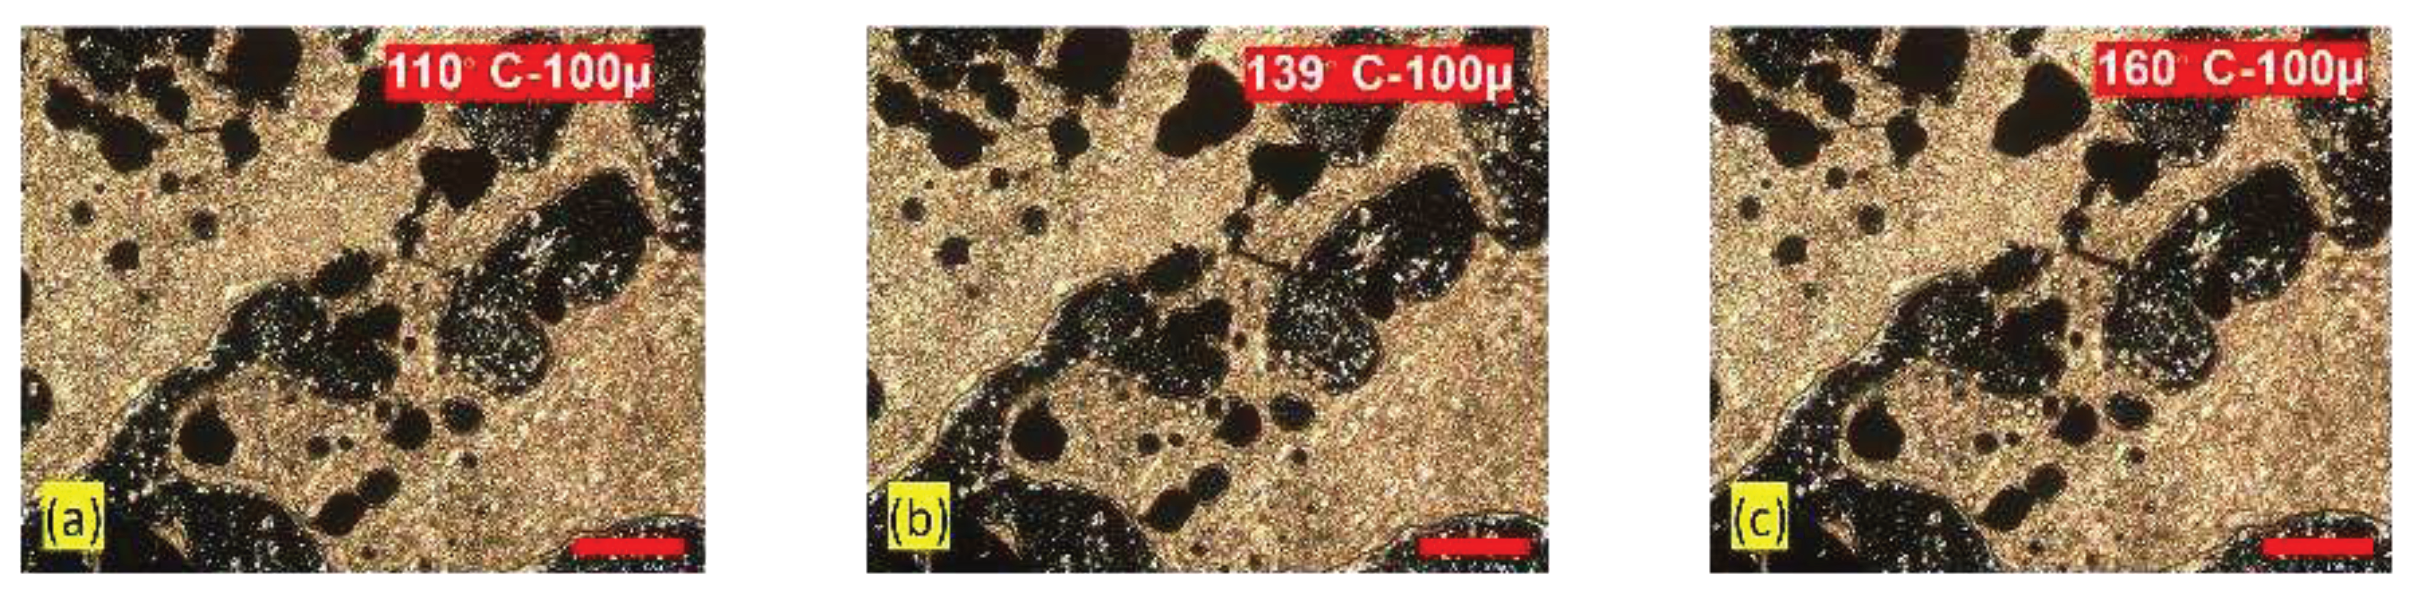
Figure 12.
Optical polarization microscopy displayed by flow contact of copolymer CoP1. The scale bar is 105μm. (a) Nx phase at 100℃ (b) Nx phase at 125℃ (c) Nx phase at 135℃ (d) Nx phase at 140℃ (e) Ntb phase in schlieren texture at 139℃ in 200u (f) Nx phase in schilren texture at 140℃ in 200u resolution.
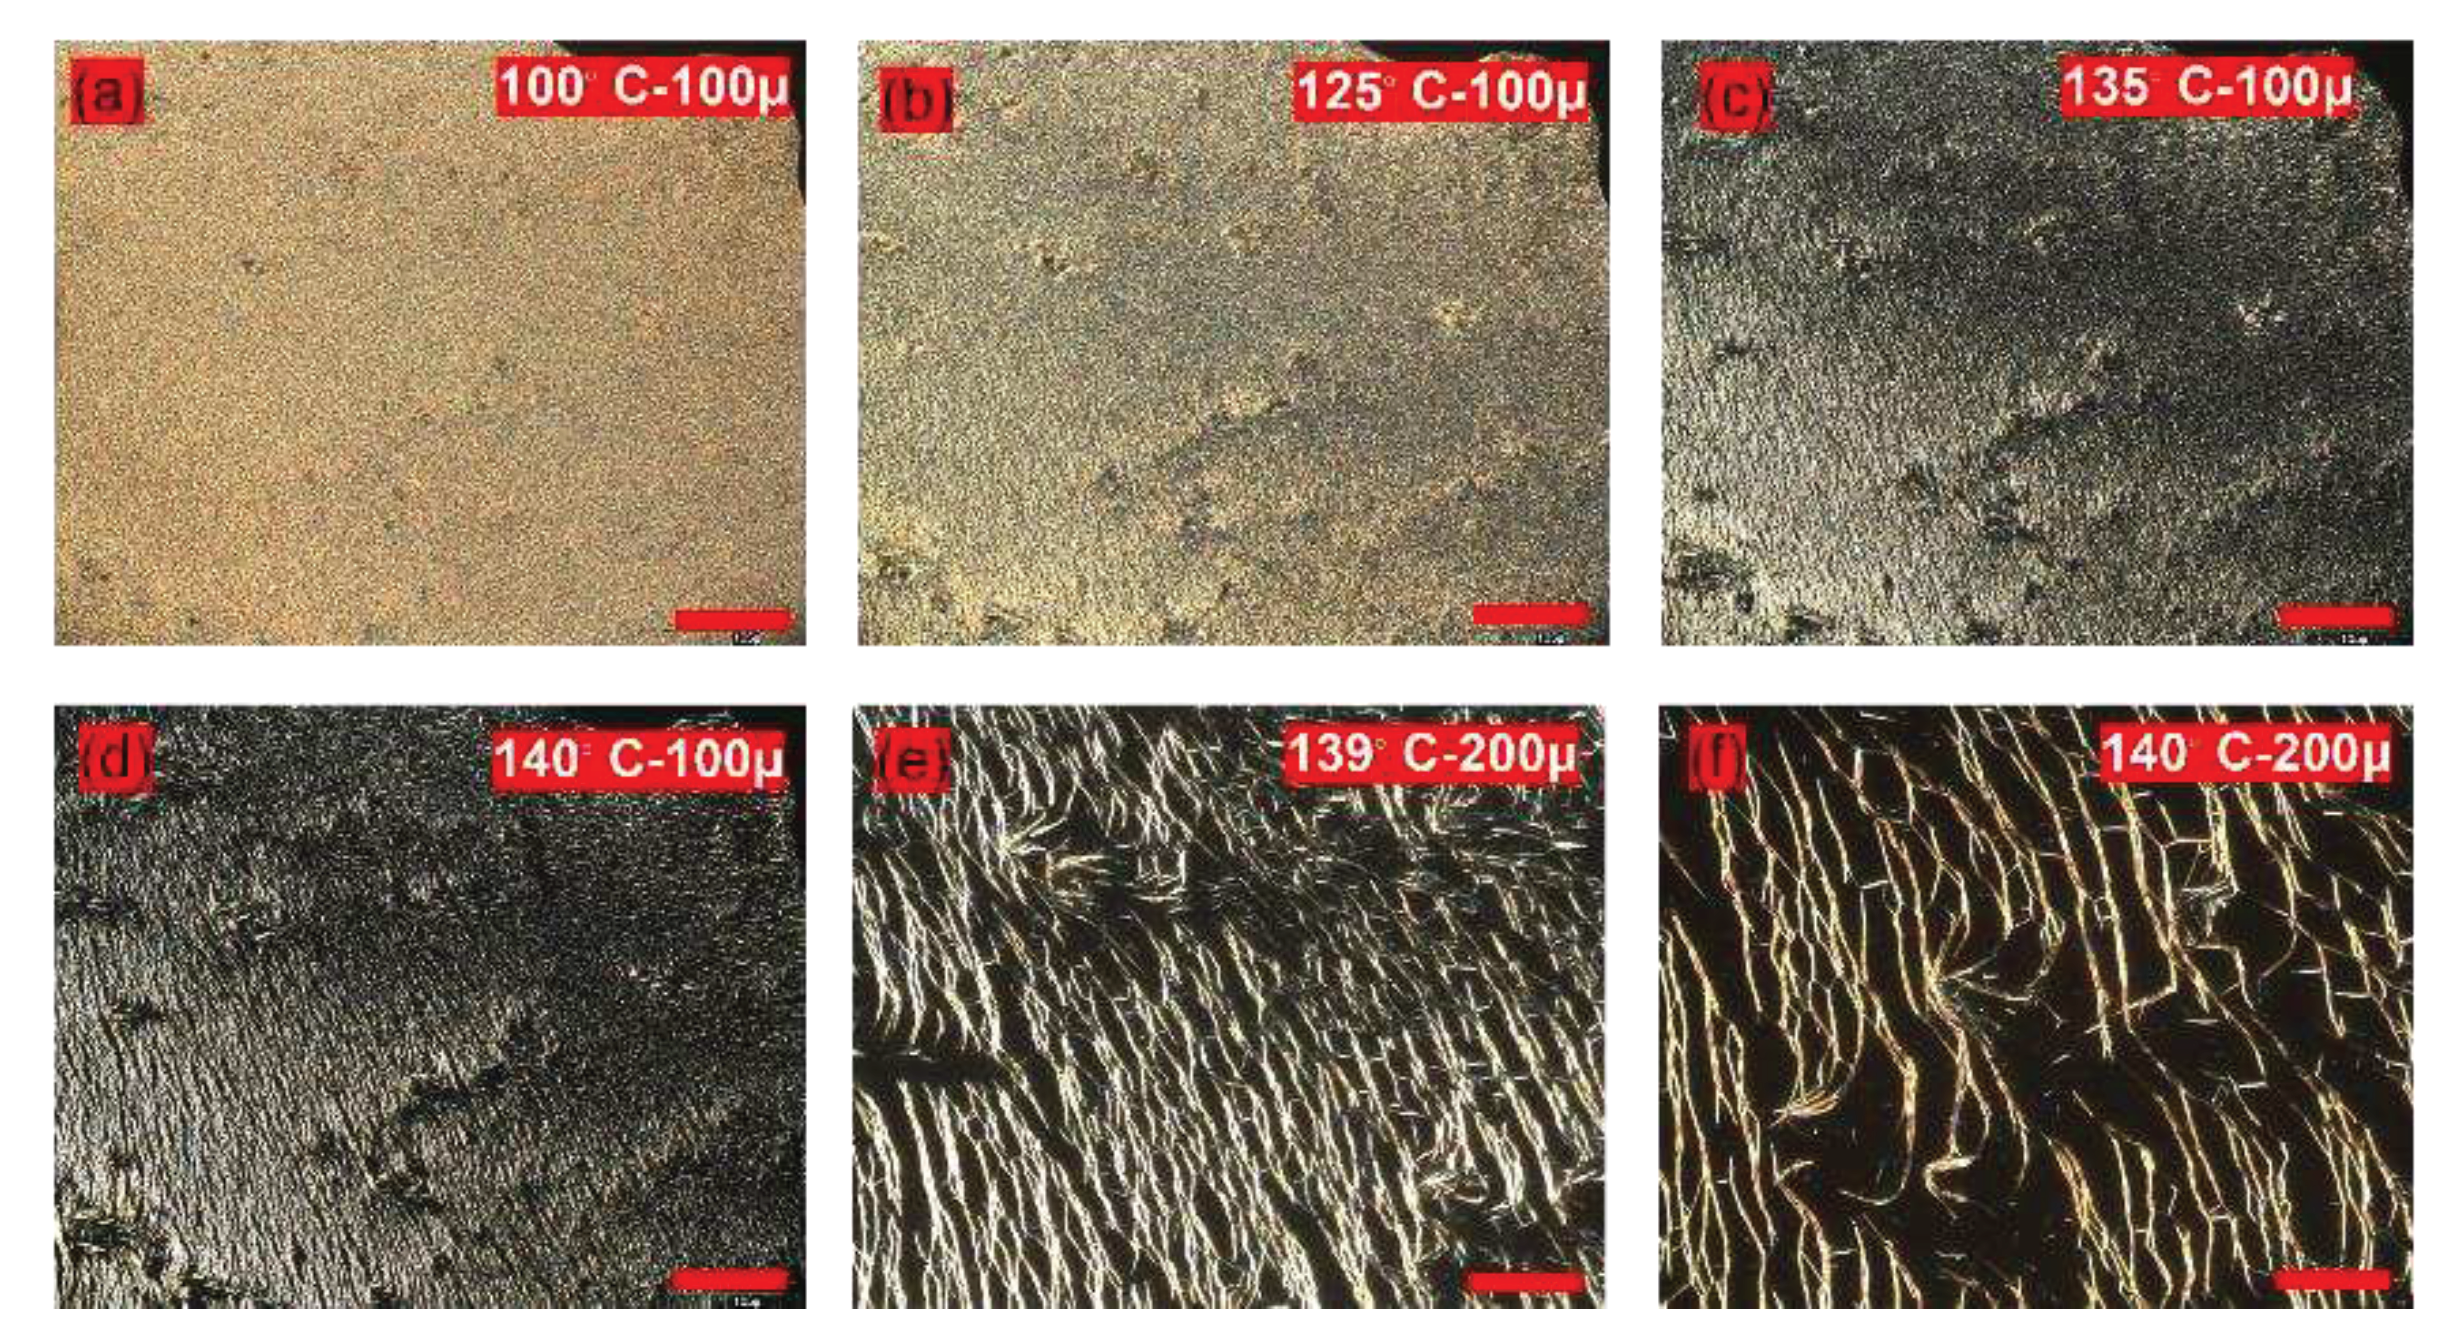
Figure 13.
Optical polarization microscopy of mixture of M1: MCN; molar ratio = 1.2: 0.8. The scale bar is 105μm. (a) phase transition from a nematic phase with a homeotrpic orientation to the SmA phase at 106℃ (b) SmA phase at 104℃ (c) SmA phase at 91℃.
Figure 13.
Optical polarization microscopy of mixture of M1: MCN; molar ratio = 1.2: 0.8. The scale bar is 105μm. (a) phase transition from a nematic phase with a homeotrpic orientation to the SmA phase at 106℃ (b) SmA phase at 104℃ (c) SmA phase at 91℃.
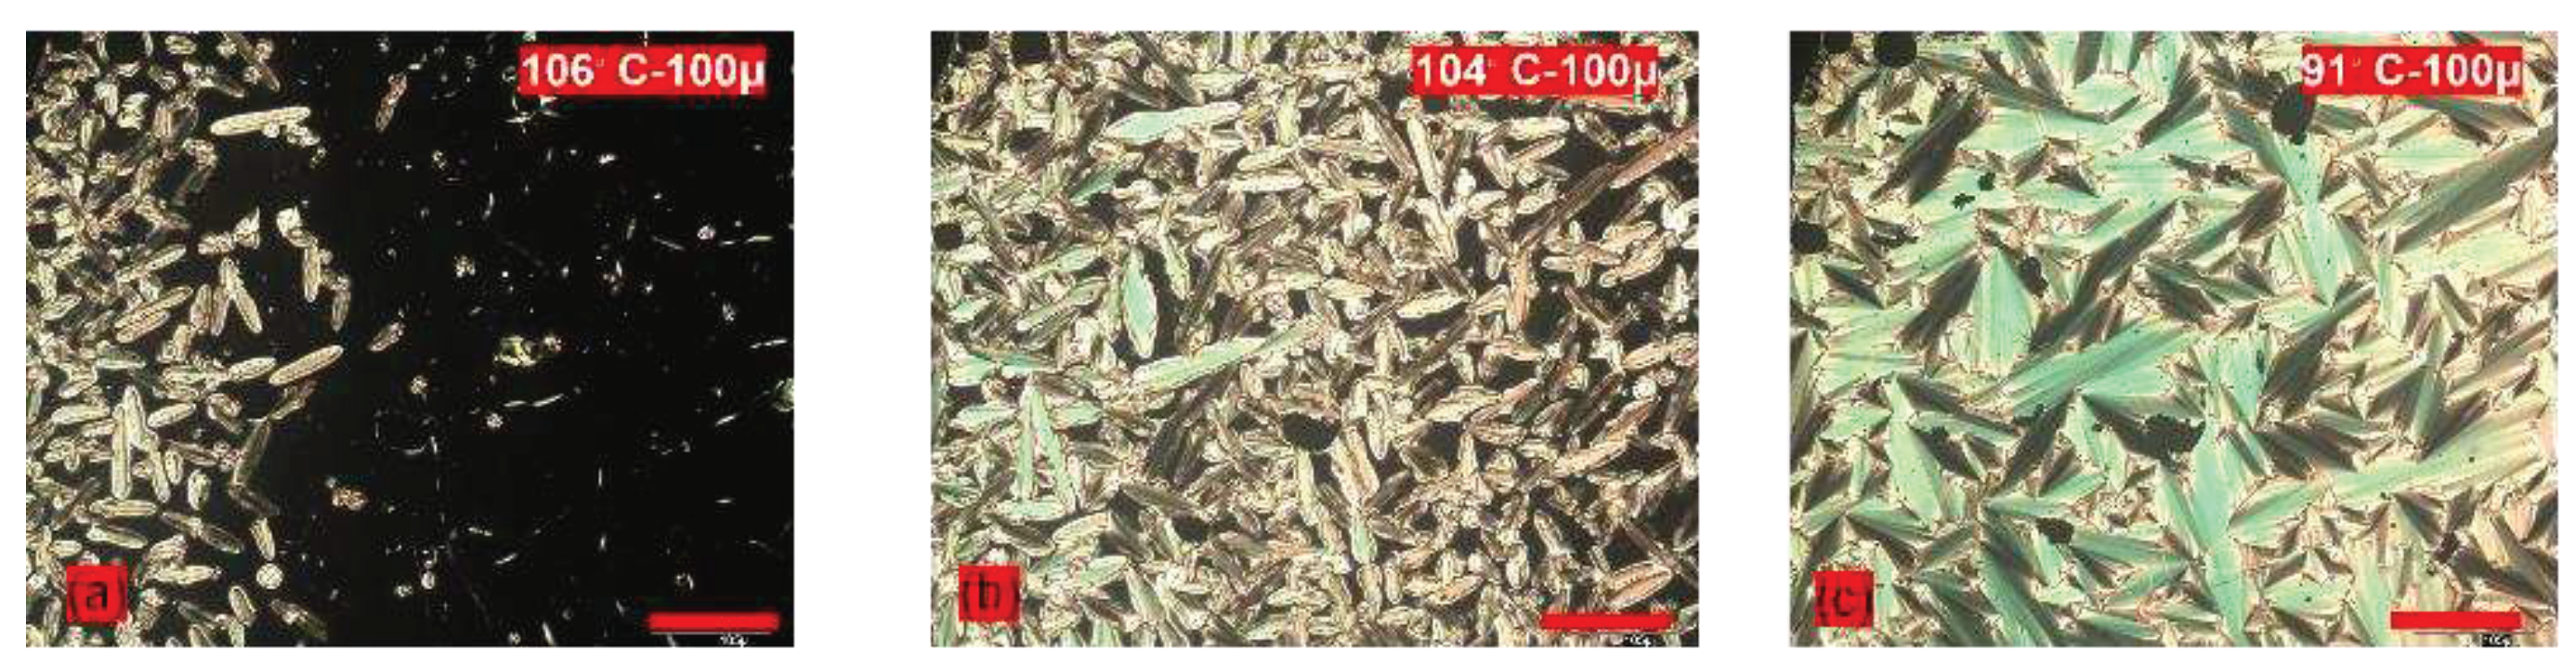

Table 1.
GPC results of polymers.
| Compound No | GPC results | weight average DP obtained by GPC | Average molecular weight of repeating units | ||
| / | / | ||||
| Polysiloxane backbone | 830 | 663 | 1.25 | 13.8 | 60.1 |
| HP1 | 21494 | 15441 | 1.39 | 29.4 | 730.4 |
| PCN | 28848 | 14212 | 2.0 | 89.3 | 323.1 |
| CoP1 (M1: MCN=1.2: 0.8) | 22720 | 12778 | 1.8 | 40 | 567.5 |
Table 2.
Phase transition and phase transition enthalpies for monomer, pentamethyldisiloxane derivative, and polymers.
Table 2.
Phase transition and phase transition enthalpies for monomer, pentamethyldisiloxane derivative, and polymers.
| Compound No | spacer length | Fluorine numbers on mesogenic rings | Transition temperature (using onset and offset of the peaks), measured by DSC at 10 /min, enthalpies unit (J/g) | Highest LC -I temperature peak width d) |
| M1 | 5 | 2 | Cr 87.5 Ntb 101.5 (10.1) N 113.0 (0.51) I a) | 3.81 |
| I 114.2 (-0.53) N 102.5 (-10.2) Ntb 90.6 (-3.6) Smx 59 Cr | 3.85 | |||
| MCN | - | - | Cr 86.4 (93.7) I | - |
| I 66.9 (-1.5) [N 49.3] Cr | 1.51 | |||
| PMDS 1 | 5 | 2 | Cr 68.7 Smx 92.5 (1.79) SmA 110.5 (17.5) I | 2.36 |
| I 108.6 (-17.7) SmA 90.4 (-1) SmX 45.3 Cr | 2.48 | |||
| HP1 | 5 | 2 | Cr 107.1 NX 182.9 (10.6) I | 32.76 |
| I 174.1 (-10.4) Nx 106.8 Cr | 29.62 | |||
| PCN | 5 | 0 | SA 164.9 (5.2) I | 9.45 |
| I 166.6 (-5.3) SA | 4.87 | |||
| CoP1 (M1: MCN=1.2: 0.8) | 5 | 2 | N 141.39 (7.01) I | 34.5 |
| I 148.3 (-5.9) N | 38.6 |
Table 3.
Summary of X-ray powder diffraction data of copolymer 1(CoP1) at room temperature.
| 2 𝜃 (˚) | d-value (Å) |
| 4.249 | 20.78 |
| 12.28 | 7.20 |
| 19.77 | 4.49 |
Disclaimer/Publisher’s Note: The statements, opinions and data contained in all publications are solely those of the individual author(s) and contributor(s) and not of MDPI and/or the editor(s). MDPI and/or the editor(s) disclaim responsibility for any injury to people or property resulting from any ideas, methods, instructions or products referred to in the content. |
© 2023 by the authors. Licensee MDPI, Basel, Switzerland. This article is an open access article distributed under the terms and conditions of the Creative Commons Attribution (CC BY) license (http://creativecommons.org/licenses/by/4.0/).
Copyright: This open access article is published under a Creative Commons CC BY 4.0 license, which permit the free download, distribution, and reuse, provided that the author and preprint are cited in any reuse.


