Submitted:
27 October 2023
Posted:
30 October 2023
You are already at the latest version
Abstract
With a software-defined network (SDN), the control plane is separated from the data plane, allowing the control of network flows to be easy and dynamic at the same time. While the controller, which is equipped with various control applications, is capable of analyzing a large amount of data, it may become overburdened when it is faced with a large volume of traffic. The intrusion detection system (IDS) is an example of control applications that can be used to detect intrusions. It is recommended to deploy instances of the IDS across the data plane. This will improve the processing power and detection rate and as a result reduce the load on the controller at the same time. While there is no doubt that an IDS would be beneficial for improving detection rates, installing one at each switch in the data plane would be costly. To address this issue, this paper proposes the deployment of IDS chains across the data plane. The controller directs incoming traffic via alternative paths, including the IDS chain, which increases the detection rate while avoiding overloading. In order to improve transmission efficiency, our study proposes a method of balancing the distribution of flows and assigning them to specific IDS chains. This approach minimizes the cost of flow grouping through the use of a new incoming traffic grouping technique. Our method is tested and evaluated through the use of a test bed and trace-based simulation, and has been proven to effectively reduce delays and hop counts across various traffic scenarios.
Keywords:
attack
; forwarding traffic
; Intrusion detection
; load balancing
; SDN
; matching problem
1. Introduction
Software-defined networking (SDN) allows a computer network to be intelligently and centrally controlled through software applications. There is a separation between the control plane (SDN controllers and network applications) and the data plane (switches and their connections) of the network [1]. The network can be programmed and managed more effectively by using a controller. In the SDN application layer, the typical network applications, such as intrusion detection systems (IDS), load balancing, and firewalls, are present [2]. Based on reports received from applications installed, the controller analyzes traffic for forwarding, anomaly detection, and other purposes. There is a possibility of overhead for the controller since there is a large volume of traffic and multiple applications that it must handle [3]. IDS is one of the network applications in SDN. Using IDS, the controller can detect anomalous traffic flows and then install rules in the switch’s flow tables in order to block or reroute abnormal traffic. Although the IDS application improves the controller’s performance, there are some challenges to implementing intrusion detection. SDN applications for security services result in significant overhead for the controller. It is possible to reduce the controller’s overhead by incorporating security applications, such as IDS and firewalls, into the data plane. The assignment of IDS to all switches can improve detection rates. However, employing IDS on switches is expensive and not feasible within a limited budget. In addition to being costly, IDS requires a considerable amount of time and causes delays in the transmission process. Thus, it would not be helpful to process traffic on all switches along the path from source to destination.
It would be beneficial if we could provide some chains of IDS across the data plane. The result would be a higher attack detection rate and a lower controller overhead. Figure 1 illustrates the application layer, control plane, and data plane in an SDN. The blue dashed lines from the switches to the controller show the control network lines, and the solid black lines between the switches are the data network lines. Originally, there is not any IDSs across the data plane. Here, several IDSs are deployed on the switches in the data plane. In the data plane, four switches are equipped with IDS components. This network has some flows such as , , and . The dashed lines in different colors present the routing path of these three traffic flows: , , and . The controller redirects each of these flows through an alternative path instead of the shortest one, including an IDS chain, to perform intrusion detection. Each IDS chain consists of some IDS components, and there is at least one IDS in every IDS chain. It is reasonable to assume that the lengths of the IDS chains are the same. A measure of the effectiveness of an IDS is its detection rate. The detection rate of blocked malicious packets can be determined by dividing the number of blocked malicious packets by the total number of malicious packets received. The controller is responsible for installing flow rules. Rather than sending traffic to the shortest path, these rules redirect traffic to alternative paths. Intruder detection systems are placed along these alternative paths. It is difficult to determine the best path and to select an IDS chain for each flow. In general, IDS applications can’t achieve an acceptable detection rate due to their limitations. It may be possible to resolve this problem by deploying a chain of IDSs. It is not possible to install IDS on all switches due to the installation costs and limitations associated with the flow tables. Therefore, it is necessary to limit the number of IDSs. As incoming traffic is grouped, there is no need for many IDSs. Performance measurements can be affected significantly by the grouping and assignment of flows, particularly when high loads are present and transmission delays are caused by non-shortest path routing.
In this paper, we discuss how to maintain a balanced flow group and how to match them with IDS chains. This paper presents a design and implementation of SDN to deploy IDS on selected switches in the data plane, with the goal of increasing the detection rate and preventing controller overload. We address the challenge of forwarding flows from a source to a destination when traffic passes through specific switches [4]. To this end, we propose a method of flow grouping and matching IDSs for a balance between detection rate and delay. Our approach involves deploying chains of IDSs across the data plane and redirecting flows through these chains, which can be arranged in either a fixed or dynamic order. However, as IDSs are only placed on certain switches, this can result in additional hops and increased latency.
To mitigate this, we also propose a method of grouping incoming traffic to reduce the limitations of maintaining a large flow table and transmission delay, which leads to fewer rules in flow tables and all flows in a group following the same path.
We initially used K-means clustering but found it unsuitable for this problem since each flow has a source and a destination. Therefore, we proposed using a 1-dimensional space to calculate distances in G, where the distance between the two points is the Euclidean distance. We also determined that the number of hops between them should calculate the distance between the source/destination of flows and centroids. We introduce an adapted form of K-means clustering, featuring a novel distance metric within a two-dimensional (2-D) space. Our main contribution of this article, which extends the conference paper [4] are as follows:
- We introduce a novel approach to deploying chains of IDSs in the data plane, enhancing intrusion detection rates and reducing dropped data packets. This strategic distribution of multiple IDS chains in the data plane not only avoids controller overload but also contributes to effective intrusion detection.
- We propose a creative centroid-based modification of the K-means clustering method, which efficiently groups incoming data flows to reduce data transmission delays.
- To address the complex joint optimization problem, we present a two-phase algorithm that effectively achieves our optimization goals.
- Our paper delves deep into the intricacies of flow grouping and the association of flow groups with IDS chains under varying scenarios. We introduce two distinct models for this association process: the minimum cost 2-D matching and the minimum cost 3-D matching.
- We provide a comprehensive evaluation of our approach on a real testbed under various measurements, demonstrating its practical effectiveness.
The structure of the paper is as follows: In Section 2, the related works on deploying IDS on SDN, load balancing, and grouping traffic approaches are reviewed. The background and rationale behind the proposed approach are presented in Section 3. The proposed approach, which is based on grouping flows and assigning them to IDS chains, is detailed in Section 4. The evaluation and performance of the scheme are discussed in Section 5. Lastly, we provide a brief conclusion in Section 6.
2. Related Work
During recent years, there has been a considerable amount of researches that integrate IDS into SDN [5,6,7,8,9]. Latah et al. in [10] propose an efficient multi-level hybrid intrusion detection method for SDNs. A kNN is used as the first level; an Extreme Learning Machine (ELM) is used as the second level; and a Hierarchical Extreme Learning Machine (H-ELM) is used as the third level. According to the experimental study, this system achieves the highest level of accuracy when compared to conventional supervised machine learning algorithms based on the NSL-KDD benchmark dataset. Overall accuracy was significantly improved as a result of this approach. Zhao et al. in [11] present a novel IDS model for SDN that is designed to collect and analyze traffic at the control plane. The proposed IDS model addresses the limitation of data processing capacity using a probability-based traffic sampling method, using a genetic algorithm that estimates the sampling probability for each sampling point by analyzing the total number of false negatives. Based on the IDS’s limited detection capacity, this technique determines the best sampling rate for each switch. As a result, they improved the effectiveness of intrusion detection under medium network loads. Cui et al. in [12] propose a mechanism for detecting and defending against DDoS attacks in SDN environments. In order to implement the detection, an unbalanced distribution of traffic was taken into account. An algorithm such as K-Means can detect the unbalance in traffic. As an unsupervised machine learning algorithm, K-Means enhanced the adaptability of the detection method and allowed the detection of attacks of different scales and types. By using an entropy-based anomaly detection system, Niknami et al. in [13] propose a method of determining a method to detect abnormal traffic variations, they combine entropy and relative entropy. Using KL-divergence, entropy, and machine learning methods simultaneously eliminates the uncertainty associated with the entropy threshold and enhances detection performance.
In a study by Yazdinejadna et al [14], a novel approach to attack detection within the data plane, centered on SDN architecture, is presented. Their work introduces a zone-based architecture for KIDS (Kangaroo Intrusion Detection System) to enhance scalability and anomaly detection. An innovative IDS design is employed, which leverages consecutive jumps after attack detection to efficiently notify the SDN controller and other IDS components. Goo et al [15] introduce a methodology for traffic categorization rooted in a correlation model. Their approach assesses traffic flow similarity using Euclidean distance and examines flow connectivity by considering factors such as flow occurrence time, source and destination IP addresses, port pairs, and the Transport-Layer protocol. To alleviate the controller’s load and enhance attack detection rates, Niknami et al. propose a distinctive extension for SDN [4]. They advocate the deployment of IDSs in the data plane, where a chain of IDSs is interconnected with various switches. This novel approach incorporates a new distance measurement technique and a modified version of the K-means algorithm to group incoming data flows and steer flow groups toward the IDS chains.
The present paper serves as an expansion of the work presented in [4]. Results show that increasing the number of IDSs positively impacts malicious packet detection. Delay times are similar for multiple IDSs and mixed IDS configurations, with single IDS setups having lower delay times. Mixed IDS setups yield higher detection rates, nearing those of multiple IDSs. The use of multiple IDSs, as opposed to a single IDS, increases the probability of detecting anomalous flows. The study also examines clustering methods’ impact on controller overhead, drop rates, and detection rates, finding that balancing clusters based on data rates enhances IDS drop rates. The purpose of this paper is to provide a completely separate K-means clustering and later matching between virtual centers and IDS. In addition, we conducted totally new evaluations in the experimental part. In our approach, the location of is any switch in the given network, and it can be the center for multiple clusters. We run K-mean and adjust location of groups based on closeness for the distance of flow and centroid of groups. Then by providing balanced groups and assigning flow groups to IDS chains the controller installed a forwarding rule for each group.
3. Background and Motivation
This paper aims to deploy IDS chains across a data plane to increase the attack detection rate and decrease overhead on the controller when there is a large amount of traffic in the SDN. An IDS describes a suspected intrusion and then signals an alarm once it has happened [16]. Regarding detection techniques, IDS can be divided into three categories: signature-based (knowledge-based), anomaly-based (behavior-based), and hybrid. Signature-based IDS detects network traffic for signs of attacks and uses those signatures as a reference to detect future attacks. Anomaly detection IDS detects traffic anomalies based on tracking them. It is a hybrid IDS that uses both knowledge and anomaly technologies. By using hybrid detection, it is possible to identify both predefined and undefined intrusions [17]. Similarly, IDSs can be categorized into three types according to their data collection techniques: Host-based, Network-based, and Hybrid systems, which combine two approaches [18]. The SDN architecture separates the control plane’s decision-making from the data plane’s traffic forwarding while logically centralizing decision-making into a controller whose functionality can be extended via network applications. A centralized control plane provides a global view in SDN, enabling traffic engineering, security, load balancing, and other network management strategies to be implemented based on defined network policies. All switches in the network are monitored by the controller, which sets rules in the flow tables on each switch. Through the use of OpenFlow [19], a centralized controller communicates with switches and handles the routing and forwarding of the data plane. The controller monitors all switches in the network and sets rules for each switch’s flow tables. Switches send packet-in messages to controllers whenever new packets arrive that do not match entries in the flow table. An SDN-based IDS detects and reports malicious behavior or attacks to the controller. In SDN, the IDS is currently designed using a machine learning approach [20]. A machine learning-based IDS can be trained more easily with the centralization of the SDN [21].
Clustering algorithms are designed to partition the set of nodes into distinct clusters, and the challenge revolves around choosing the cluster head, often referred to as the centroid, and effectively managing these clusters. The K-means clustering technique aims to group similar items into clusters [22]. Each cluster begins with centroids selected at random, and then the positions of these centroids are optimized iteratively. The centroid of a cluster represents its central point. In the K-means algorithm, K centroids are determined, and each data point is assigned to the nearest cluster, with a goal of minimizing the size of these centroids. K is a hyper-parameter to the K-means algorithm. There is usually a heuristic approach to determining the number of clusters K. Most strategies involve running K-means with a variety of K values in order to determine which value is the most appropriate. In order to solve minimum-cost assignment problems [23], the balanced K-means algorithm can be implemented using the Munkres algorithm [24] or the Hungarian algorithm [25].
Matching problems are generally concerned with finding a set of edges whose vertex belongs to at least one of these edges. Suppose a network G with nodes and a set of links E between nodes . In Weighted Matching method, there is weight for edges and the algorithm tries to identify a set of disjoint edges that have the greatest weight sum. A bipartite graph consists of two vertex sets of equal size [26], and the Perfect Weighted Matching algorithm is intended to generate an edge set on this graph. Authors in [27] presented an extension of Weighted Matching called Weighted 3-D Matching algorithm by utilizing 3-D hyper-graphs. A general weight 3-D matching problem can be approximated using the Iterative Round Search technique.
4. IDSMatch: Deploying IDS Chains in SDN
In this paper, we introduce an innovative extension to the data plane within SDNs, with a specific focus on tackling issues related to anomaly detection and controller overload. Within the network infrastructure, IDS applications are commonly integrated into the control plane layer. However, when the network experiences a substantial influx of incoming traffic, its ability to effectively identify anomalies becomes constrained. Moreover, there exists a limited bandwidth for communication between the data plane and the control plane. Since SDNs rely exclusively on a centralized controller to manage network traffic, a high volume of incoming traffic can overwhelm the controller, potentially leading to network failures. Deploying IDS on specific data plane switches can relieve the SDN controller’s load, and increasing the number of IDSs enhances attack detection chances in specific traffic flows. However, deploying IDS on all switches is impractical due to costs and delays. Our proposal involves strategically placing IDS chains across the data plane and directing flows through specific paths that include these IDS chains. This routing approach increases transmission delay compared to the shortest path. To mitigate this delay, we group incoming flows and route all flows within a group through the same path. A classifier categorizes traffic patterns upon entry into the network to assign the most suitable IDS chain. Grouping is based on the proximity of source and destination flows to the group’s centroid. The proposed approach organizes incoming flows by measuring the distance between their source and destination points relative to a central reference point. Flows sharing the same cluster ID are regarded as part of a cohesive cluster and are subjected to identical security protocols. Subsequently, each cluster of flows is allocated a dedicated sequence of IDSs. To direct packet flow within each group through the designated IDS chain, the controller establishes rules. The task of assigning each group to an appropriate IDS chain is known to be NP-hard, and to address this complexity, we propose a modified version of the K-means algorithm as an approximate solution.
Theorem 1.
The complexity of the flow grouping problem being NP-hard implies that the likelihood of discovering highly efficient algorithms to achieve optimal solutions is quite low.
Proof.
The overall strategy involves clustering flows and defining a set of rules applicable to each cluster. Flow categorization hinges on the proximity of source and destination hosts to the cluster’s centroid. Subsequently, the task is to allocate each cluster to an IDS chain, which can be likened to solving a matching problem. Following this, the controller configures flow rules that reroute packets from flows within each cluster through a predetermined sequence of IDSs within the assigned chain. The conventional K-means algorithm typically relies on assessing the distance between data points and their respective centroids. Nevertheless, in our specific problem, we encounter a distinct challenge that necessitates a different similarity metric than the standard K-means approach. We must devise a unique grouping strategy and similarity measurement. In our context, the data points represent flows with distinct source () and destination () attributes. To adapt the K-means clustering to our scenario, we apply it to pairs . The distance measurement employed is , where and denote the centroids of a cluster with center c. Here, we present formal definitions for flow grouping, distance measurement, and the process of matching IDS, inspired by the concepts introduced in [4].
Definition 1
(Grouping strategy and GroupFlow). Grouping strategy Δ partitions the incoming traffic flow based on the similarity of specific features such as the same source or same destination. The total number of groups K is a predefined parameter. is the j-th group or j-th GroupFlow including multiple flows with similar features. All flows in have been routed through the same path and passed through some specific IDSs.
Definition 2
(Distance). The distance measurement is the summation of the distance of each source to the cluster centroid ’s source, and the distance of each destination to the cluster centroid ’s destination. Distance value is used to find the nearest cluster centroid for each GroupFlow [4].
Definition 3
(Matching GroupFlow with IDS Chain). For a specific GroupFlow , an IDS chain I is assigned by matching the centroid of that GroupFlow with the head of an IDS chain. The assignment is based on the weight of the link between the source of the cluster and the head or tail of the IDS chain [4].
Figure 2 illustrates an example for three clusters and three IDS chains. h represents the head of IDS chain, while t signifies the tail of this IDS chain. Figure 2a shows the shortest path method, which calculates the distance between sources and destinations of flows and initial centroids. We have the distance measurement and flows would be divided into three clusters with centroids . The GroupFlows would be assigned to the IDS chain based on the shortest hop count. , , and are assigned to the first IDS chain based on the shortest path. is assigned to the second IDS chain. and are assigned to the third IDS chain. Figure 2b illustrates the balanced grouping method. After grouping the flows, groups will have different numbers of members. Balanced clustering aims to achieve an equitable distribution of data points within each cluster, ensuring an equal workload for each cluster. Our approach is different from common techniques. Instead of relying on the count of group members to assess balance, we determine balance by considering the total data rate of the groups. For this example, Figure 2a shows that the first cluster has three members, the second one has only one member, and the third one has two members. In order to make a balance for the amount of processing on each IDS chain, we make a balance for the total amount of traffic in each group. The weight of a group can be defined as . For this example, we assumed that the data rate of flow is the same, therefore balancing would be based on the total number of members in each group. Figure 2b shows the balanced groups.
Utilizing a perfect matching algorithm, each balanced GroupFlow is assigned to a head and tail based on the shortest path, which encompasses the sum of hops from the source to the chain’s head, the hops between the head and tail, and the hops between the tail and the destination. In Figure 2c, you can observe the allocation of IDS chain heads and tails to the source and destination of the centroids. Every cluster k has a virtual center, comprising both the source and the destination . The matching process involves connecting to and associating with , where and correspond to the head and tail of two distinct IDS chains. This arrangement results in interconnections between IDS chains. In the real test bed, we consider network delay, which is based on the number of hops and congestion on links. Table 1 shows the hop counts and the assigned IDS chain for each method.
We summarize the steps of the proposed approach as follows:
- Perform clustering for the pair using a distance metric defined as the sum of distances from to the center and from to the center within a cluster with its central point at . The distance between each host and the cluster center is computed as the cumulative number of hops.
- Find balanced GroupFlows based on the amount of traffic for each group.
- Employ the standard perfect matching technique to establish pairs between cluster centers and IDS chain configurations. Note that the connections between IDS chain heads and tails are not fixed and can be reconfigured as needed.
The process of grouping flows is achieved by employing a modified variant of the K-means clustering technique. In Algorithms 1 and 2, the procedures for grouping incoming traffic into K clusters, creating balanced groups, and then matching the GroupFlows to the IDS chains are delineated. The initial step involves the random initialization of K cluster centroids. Subsequently, in the second step, the distances between each pair and the centroid are computed, and flows are assigned to their respective clusters based on these distances. Once all the flows have been clustered, the centroids are updated by identifying new centroids in a way that minimizes the sum of the shortest path distances from all flows in cluster j to the new centroid. This iterative process continues until it reaches a stable state.
| Algorithm 1 Balanced-Flow Grouping |
|
| Algorithm 2 Perfect Minimum Bipartite Matching |
|
When using any clustering method, it is important to ensure that the algorithm is converging in a meaningful way. To answer this question, we need to define a related optimization problem and make the concept of convergence more precise as per the reference [30]. Convergence in this context means that the algorithm has successfully completed the clustering or grouping of data points into K clusters. The algorithm will be deemed to have correctly grouped the data points if the difference in the values of the last two iterations is less than a specified threshold. The classical K-means algorithm is designed for Euclidean distance, which is known to satisfy the triangle inequality as per reference [31].
In order to avoid redundant distance calculations, it is necessary to use triangle inequality in order to determine the bounds. Since most distance calculations using standard K-means are redundant, the optimized algorithm uses a more efficient calculation method. The distance between a point and a center does not need to be calculated in order to determine that the point should not be assigned to that center if it is far from the center. It is not necessary to calculate the exact distance to determine that a point should be assigned to the first center if a point is substantially closer to it than to any other [32,33].
In order to have balanced GroupFlows, there is some transferring of flows between GroupFlows, resulting in even number of flows in each group. Eventually, there would be an equal number of flows in each GroupFlow. In the experiment section, we consider the number of flows and traffic rate for balancing groups. The perfect matching method is done based on the hop count between the GroupFlows and heads and tails of the IDS chains. There is not any fixed connection between heads and tails. Perfect matching makes some cross-connection between heads and tails based on finding the best chain for GroupFlows. This algorithm returns a list of balanced groups and their matched IDS chain.
This problem is NP-hard. To address it, we take an approach that relies on an approximation technique involving the reconfiguration of incoming flows using a modified version of the K-means clustering algorithm. We formulate the problem of grouping incoming traffic as an optimization problem with the primary aim of reducing overhead or minimizing costs. This issue is divided into two sub-problems: one involving the grouping of incoming traffic, and the other focused on IDS assignment. They can be formulated as follows:
Problem 1.
The first objective is to group incoming traffic in a balanced manner to reduce transmission delay. Factors that should be considered when determining the appropriate grouping include the distance of flows to the cluster’s centroid and the total amount of traffic flows in each cluster.
Here, represents the cost of clustering incoming traffic. This cost represents the overhead of the controller due to additional work required for grouping the incoming traffic. The cost is based on the total number of traffic flows and total traffic rate in each cluster . For the purpose of simplification, we can assume that the value of is equal to 1 in our calculations.
Problem 2.
The secondary goal is to allocate an IDS chain to each GroupFlow in a manner that reduces the overall count of malicious packets while guaranteeing that all traffic passes through an IDS chain prior to reaching its final destination. Given that the positions of IDS chains are pre-established, the problem can be formulated as follows:
Here, we evaluate the cost associated with assigning a GroupFlow to an IDS chain , denoted as . This cost is determined by considering the cumulative traffic rate of each GroupFlow and the distance between the GroupFlow’s centroid and the IDS chain. The traffic rate of the j-th GroupFlow is represented as , and the data rate of a flow f is denoted as . The distance between the IDS chain I and the GroupFlow is quantified as , which signifies the number of hops between the cluster’s head and . The matrix is employed to indicate the assignment of each GroupFlow to a specific IDS chain .
Theorem 2.
The proposed approach is a 3-approximation algorithm [34] for flows with different sources to different destinations in a network with some IDS chains.
Proof.
The calculation of the 3-approximation ratio is based on the triangle inequality and the optimality of each matching stage. For each head node , there is a corresponding tail node which is assigned in the first round of approach. In addition, the pair is matched to a group of flows with source and destination in the second round of the approach. We assume that in the optimal solution, the node h should be paired with node , and the pair should be balanced by the GroupFlow whose source and destination are and respectively. The relation among these nodes is shown in Figure 3 and Figure 4, which is a geometric graph. The total distance generated by our algorithm is , and the optimal value is . □
Based on the triangle inequality theorem, it can be deduced that and for each . Based on the optimality of the first round of matching, it can be inferred that . Furthermore, the optimality of the second round of matching ensures that:
Combining these inequity relationships:
Therefore,
5. Evaluation
In order to validate our proposed method, we conduct real-world experiments on our test bed network. This network includes gateway nodes, SDN switches, and servers that serve as sources and destinations. The topology of the network is arranged in a perfect tree with four layers. The network is equipped with 32 servers, 15 SDN switches, and some regular L2 switches. The servers, except for the gateway, are equipped with dual-core processors running at 2.4 GHz, 4 GB of RAM, and a 500 GB hard disk drive [35]. The controller used in our experiment is a Dell 3248 PowerEdge server, running the ONOS software.The structure of the data center is illustrated in Figure 5a. Our set up includes a control network and a data network. The control network connects all management ports of the SDN switches (Pica8 p-3922) and the SDN controller through an L2 switch. The SDN switches are configured as out-of-band controllers, which separates the control and data planes. The topology is arranged in a three-level complete binary tree. The dotted lines in the star topology in Figure 5a indicate the control network. There are two types of SDN switches: the root switch and the leaf switch, for the gateway. There is a connection between the gateway and the root SDN switch, and there is a connection between the servers and the leaf SDN switch. For simulation purposes, we evaluate the performance of our approach over 75-node CORONET and 24-node USNET network topologies, as shown in Figure 5b,c respectively. For the test bed, the performance measurement is network delay, based on hops and link congestion. Whereas in the simulation, the performance measurement is hop counts.
In our network, IDSs are installed on servers associated with each switch. The controller is aware of the links, their utilization, and the SDN switches, allowing for a global perspective of the network. After configuring the network and flow settings, we analyze the results from various perspectives to provide insight into the performance of the proposed algorithm. To demonstrate its feasibility and efficiency, we conduct experiments on a real test bed using Snortas the IDS. Legitimate traffic is generated using the Ostinatotraffic generator in normal and burst modes, while malicious traffic is generated using Kali Linux. Deploying IDSs into the network leads to an increase in transmission delay as packets are redirected to the server for detection before being sent back to the network to continue their path. There is also constant background traffic between all servers, with 64 byte packets and randomly selected sources and destinations. In the original paper [4], it’s evident that deploying more IDSs enhances detection rates. Multiple IDSs can introduce slightly higher delays due to using alternative paths, but this delay is not significant. Higher attack rates boost detection rates and reduce missed detections, as more samples improve detection probability. Surprisingly, attack rates have little impact on dropping rates, mainly influenced by switch capacity rather than attack ratios. Increased attack rates lead to higher delays, as switches need to alert the controller before taking action. Consequently, with more attack samples, detection rates, missed detection rates, and dropping rates all rise. In this study, we evaluate our approach using measurements of network delay in the real test bed and the number of hops in the simulation.
5.1. Network Delay under Different Scale of Incoming Traffic
We consider the scale of traffic as the total number of flows and data rate (weight) for each flow. In this section, we define three scales for the incoming traffic based on the production of the number of flows and weight of flows. We categorize traffic in small, medium, and large traffic. Figure 6, Figure 7 and Figure 8 illustrate the network delay under different scale of incoming traffic: small, medium, and large traffic, for topologies with different sparsity. We define different scenarios: 1) One IDS in the chain, 2) Three fixed IDSs in the chain, and 3) Five IDSs in the chain. Figure 6 shows the network delay for the topology with sparsity . The result shows that perfect matching decreases network even for a large scale of traffic. Despite that with a longer IDs chain, there would be higher detection rate, Figure 6c shows higher amount of network delay. There are similar results for topology with sparsity in Figure 7 and for the network with sparsity which is shown in Figure 8. The network delay in a topology with higher sparsity () is higher than the network delay in a topology with a lower sparsity ().
5.2. Number of Hops under Different Scales of Incoming Traffic
Figure 9 illustrates the number of hops measurement under different scales of incoming traffic. The result for the topology with sparsity shows that for the perfect matching there is smaller number of hops in comparison with the balanced group method. Figure 10 and Figure 11 display the result for the network with sparsity and , respectively. For the sparse network, the number of hops for the perfect matching method differs from the balanced method greatly.
5.3. Network Delay under Varying Weights and Varying Number of Flows
Findings as reported in [4] underscore the significance of incoming traffic volume as a pivotal metric for assessing the effectiveness of IDS deployment within the data plane. Additionally, it’s worth noting that the quantity of IDSs within each chain has a notable impact on all the recorded metrics. We conducted some experiments to figure out the impact of the weight of flows and number of flows in incoming traffic on the network delay. Figure 12 shows the delay network when there is a fixed amount of incoming traffic and a varying weight between 10 and 300. The results for flow number 100, 300, and 500 show that a larger rate of traffic increases the network delay. Figure 13 shows the delay network when there is a varying amount of incoming traffic from 100 to 500 and a fixed weight of 100, 200, and 300. The results show that although a larger amount of incoming traffic increases the network delay, the impact that the weight of flows has on network delay is greater than the impact of the amount of traffic.
5.4. Unbalancing Factor
After assigning the GroupFlow of the network to the IDS chain, computing the balancing factor that will indicate whether the data are balanced IDS chains would be helpful for evaluating the assignment process. The groups are roughly balanced if there is the same amount of traffic for each IDS chain. Table 2 shows the balancing factor for the shortest path, balancing, and matching methods. We consider the topology which is shown in Figure 5c for this experiment. The higher number of unbalancing factors shows the uneven traffic rate for IDS chains.
6. Conclusions
It is necessary to have a chain of IDSs on a large and busy network as a single IDS may be susceptible to packet loss. Further, a centralized controller is responsible for handling all underlying network packets for security services, which results in significant overhead. As an alternative, security services can be deployed as network functions on switches within the data plane. By creating an approximation model, we proposed a novel method of detecting attacks in the data plane. We developed a novel method for grouping incoming flows intuitively. Each group consists of a number of flows that are processed into an IDS chain. As a result of assigning flows to IDS chains, grouped flows are diverted on a longer path and processed by the assigned IDS chain. To evaluate our approach, we discussed several factors, including detection rate, hop count, and delay time. Under different scenarios, the proposed approach meets these measurements. Future work will focus on grouping flows based on the common K links in their path to the destinations. The flows with the same K sub-path would be assigned to the same group.
Acknowledgments
This research was supported in part by NSF grants CNS 2214940, CPS 2128378, CNS 2107014, CNS 2150152, CNS 1824440, and CNS 1828363.
Conflicts of Interest
The authors declare no conflict of interest.
References
- Cox, J.H.; Chung, J.; Donovan, S.; Ivey, J.; Clark, R.J.; Riley, G.; Owen, H.L. Advancing software-defined networks: A survey. IEEE Access 2017, 5, 25487–25526. [Google Scholar] [CrossRef]
- Hakiri, A.; Gokhale, A.; Berthou, P.; Schmidt, D.C.; Gayraud, T. Software-defined networking: Challenges and research opportunities for future internet. Computer Networks 2014, 75, 453–471. [Google Scholar] [CrossRef]
- Yoon, C.; Park, T.; Lee, S.; Kang, H.; Shin, S.; Zhang, Z. Enabling security functions with SDN: A feasibility study. Computer Networks 2015, 85, 19–35. [Google Scholar] [CrossRef]
- Niknami, N.; Wu, J. Enhancing Load Balancing by Intrusion Detection System Chain on SDN Data Plane. In Proceedings of the Proc. of the IEEE Conf. on Communications and Network Security (CNS), 2022. [Google Scholar]
- Shipulin, K. We need to talk about IDS signatures. Network Security 2018, 2018, 8–13. [Google Scholar] [CrossRef]
- Zwane, S.; Tarwireyi, P.; Adigun, M. Ensemble learning approach for flow-based intrusion detection system. In Proceedings of the 2019 IEEE AFRICON. IEEE, 2019; pp. 1–8. [Google Scholar]
- Alzahrani, A.O.; Alenazi, M.J. Designing a network intrusion detection system based on machine learning for software defined networks. Future Internet 2021, 13, 111. [Google Scholar] [CrossRef]
- Muthamil Sudar, K.; Deepalakshmi, P. An intelligent flow-based and signature-based IDS for SDNs using ensemble feature selection and a multi-layer machine learning-based classifier. Journal of Intelligent & Fuzzy Systems 2021, 40, 4237–4256. [Google Scholar]
- Niknami, N.; Inkrott, E.; Wu, J. Towards Analysis of the Performance of IDSs in Software-Defined Networks.
- Latah, M.; Toker, L. An efficient flow-based multi-level hybrid intrusion detection system for software-defined networks. CCF Transactions on Networking 2020, 3, 261–271. [Google Scholar] [CrossRef]
- Zhao, X.; Su, H.; Sun, Z. An Intrusion Detection System Based on Genetic Algorithm for Software-Defined Networks. Mathematics 2022, 10, 3941. [Google Scholar] [CrossRef]
- Cui, J.; Zhang, J.; He, J.; Zhong, H.; Lu, Y. DDoS detection and defense mechanism for SDN controllers with K-Means. In Proceedings of the 2020 IEEE/ACM 13th International Conference on Utility and Cloud Computing (UCC). IEEE, 2020; pp. 394–401. [Google Scholar]
- Niknami, N.; Wu, J. Entropy-KL-ML: Enhancing the Entropy-KL-based Anomaly Detection on Software-Defined Networks. IEEE Transactions on Network Science and Engineering 2022. [Google Scholar] [CrossRef]
- Yazdinejadna, A.; Parizi, R.M.; Dehghantanha, A.; Khan, M.S. A kangaroo-based intrusion detection system on software-defined networks. Computer Networks 2021, 184, 107688. [Google Scholar] [CrossRef]
- Goo, Y.H.; Lee, S.H.; Choi, S.; Choi, M.J.; Kim, M.S. A traffic grouping method using the correlation model of network flow. In Proceedings of the Proc. of IEEE 19th Asia-Pacific Network Operations and Management Symposium (APNOMS), 2017; pp. 386–390. [Google Scholar]
- Chakraborty, N. Intrusion detection system and intrusion prevention system: A comparative study. Intl. Journal of Computing and Business Research (IJCBR) 2013, 4, 1–8. [Google Scholar]
- Qaddoori, S.L.; Ali, Q.I. AN IN-DEPTH CHARACTERIZATION OF INTRUSION DETECTION SYSTEMS (IDS). Journal of Modern Technology and Engineering 2021, 6, 161–188. [Google Scholar]
- Khraisat, A.; Gondal, I.; Vamplew, P.; Kamruzzaman, J. Survey of intrusion detection systems: techniques, datasets and challenges. Cybersecurity 2019, 2, 1–22. [Google Scholar] [CrossRef]
- McKeown, N.; Anderson, T.; Balakrishnan, H.; Parulkar, G.; Peterson, L.; Rexford, J.; Shenker, S.; Turner, J. OpenFlow: enabling innovation in campus networks. ACM SIGCOMM Computer Communication Review 2008, 38, 69–74. [Google Scholar] [CrossRef]
- Hande, Y.; Muddana, A. A survey on intrusion detection system for software defined networks (SDN). In Research Anthology on Artificial Intelligence Applications in Security; 2021; pp. 467–489.
- Hande, Y.; Muddana, A.; Darade, S. Software-defined network-based intrusion detection system. In Innovations in Electronics and Communication Engineering; Springer, 2018; pp. 535–543.
- MacQueen, J.; et al. Some methods for classification and analysis of multivariate observations. In Proceedings of the Proc. of 5th Berkeley Symposium on Mathematical Statistics and Probability, 1967; Vol. 1, pp. 281–297.
- Malinen, M.I.; Fränti, P. Balanced k-means for clustering. In Proceedings of the Intl. Workshops on Statistical Techniques in Pattern Recognition and Structural and Syntactic Pattern Recognition. Springer, 2014; pp. 32–41. [Google Scholar]
- Chang, X.; Nie, F.; Ma, Z.; Yang, Y. Balanced k-means and min-cut clustering. arXiv 2014, arXiv:1411.6235. [Google Scholar]
- Burkard, R.; Dell’Amico, M.; Martello, S. Assignment problems: revised reprint; SIAM, 2012.
- Karp, R.M. An algorithm to solve the m× n assignment problem in expected time O (mn log n). Networks 1980, 10, 143–152. [Google Scholar] [CrossRef]
- Johnson, T.; Wu, J. Improvements to Worker Assignment in Bike Sharing Systems. In Proceedings of the Proc. of IEEE 18th Intl. Conf. on Mobile Ad Hoc and Smart Systems (MASS), 2021; pp. 639–644. [Google Scholar]
- Vattani, A. The hardness of k-means clustering in the plane. Manuscript 2009, 617. [Google Scholar]
- Mahajan, M.; Nimbhorkar, P.; Varadarajan, K. The planar k-means problem is NP-hard. In Proceedings of the Proc. of Intl. Workshop on Algorithms and Computation, 2009; pp. 274–285. [Google Scholar]
- Thorpe, M.; Theil, F.; Johansen, A.M.; Cade, N. Convergence of the k-means minimization problem using Γ-convergence. SIAM Journal on Applied Mathematics 2015, 75, 2444–2474. [Google Scholar] [CrossRef]
- Coates, A.; Ng, A.; Lee, H. An analysis of single-layer networks in unsupervised feature learning. In Proceedings of the Proc. of 14th Intl. Conf. on Artificial Intelligence and Statistics, 2011; pp. 215–223. [Google Scholar]
- Elkan, C. Using the triangle inequality to accelerate k-means. In Proceedings of the Proc. of 20th Intl Conf. on Machine Learning (ICML), 2003; pp. 147–153. [Google Scholar]
- Hamerly, G. Making k-means even faster. In Proceedings of the Proc. of Intl. Conf. on Data Mining (SIAM), 2010; pp. 130–140. [Google Scholar]
- Duan, Y.; Wu, J. Spatial-temporal inventory rebalancing for bike sharing systems with worker recruitment. IEEE Transactions on Mobile Computing 2020. [Google Scholar] [CrossRef]
- Biswas, R. Mitigation of Different Network Attacks and Optimization in Software Defined Network. PhD thesis, Temple University, 2021.
Figure 1.
Forwarding traffic flows through IDSs in an SDN.
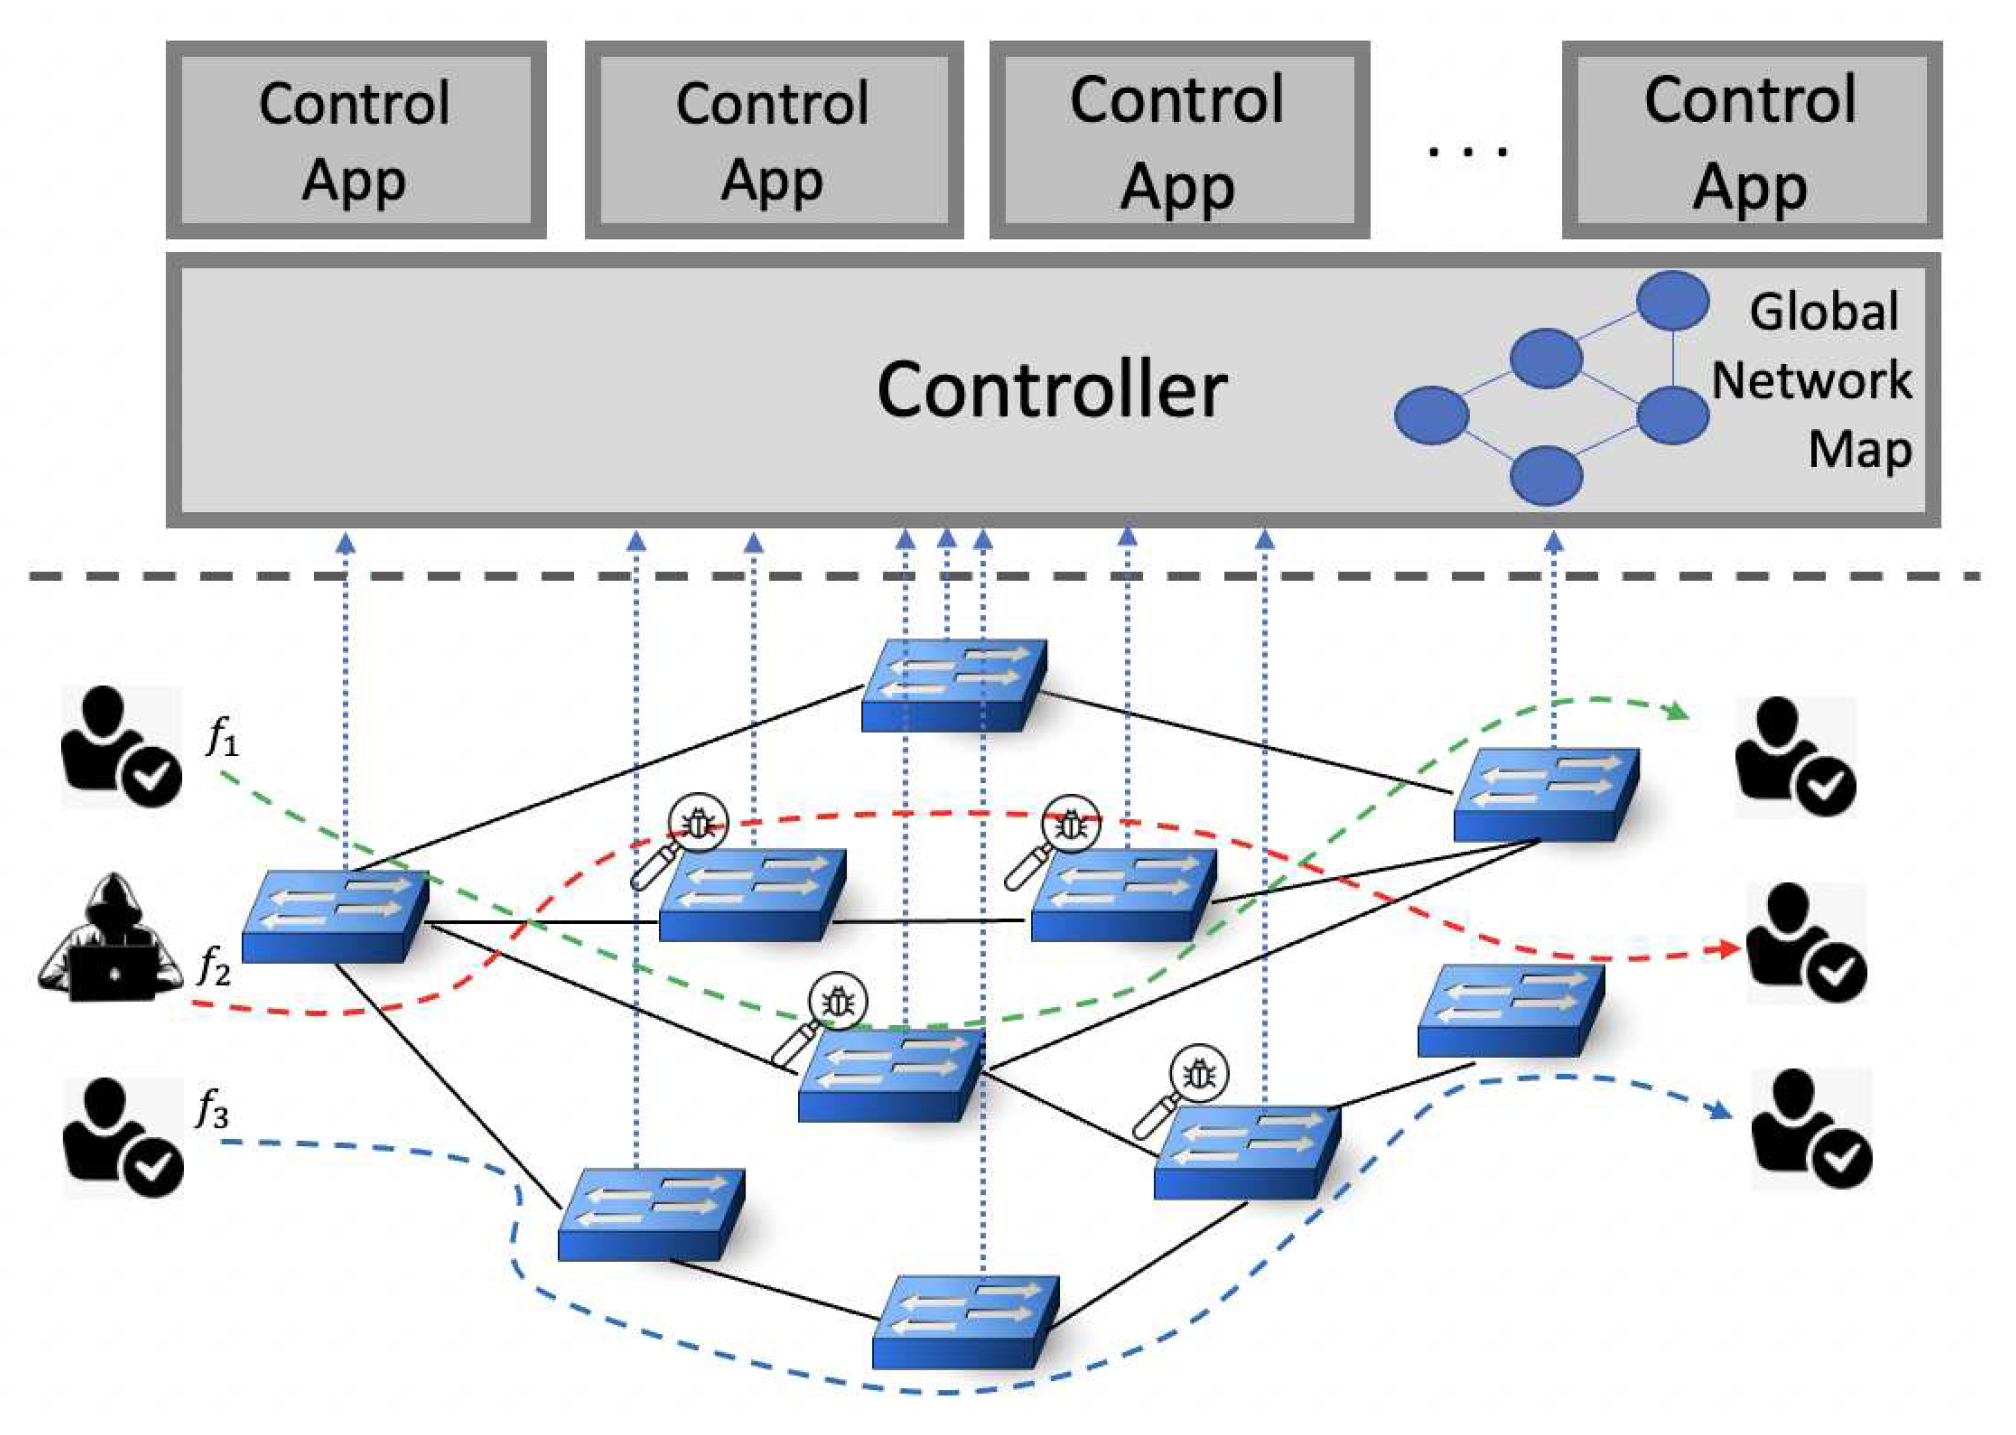
Figure 2.
Different methods of assigning IDS chain to incoming traffic.
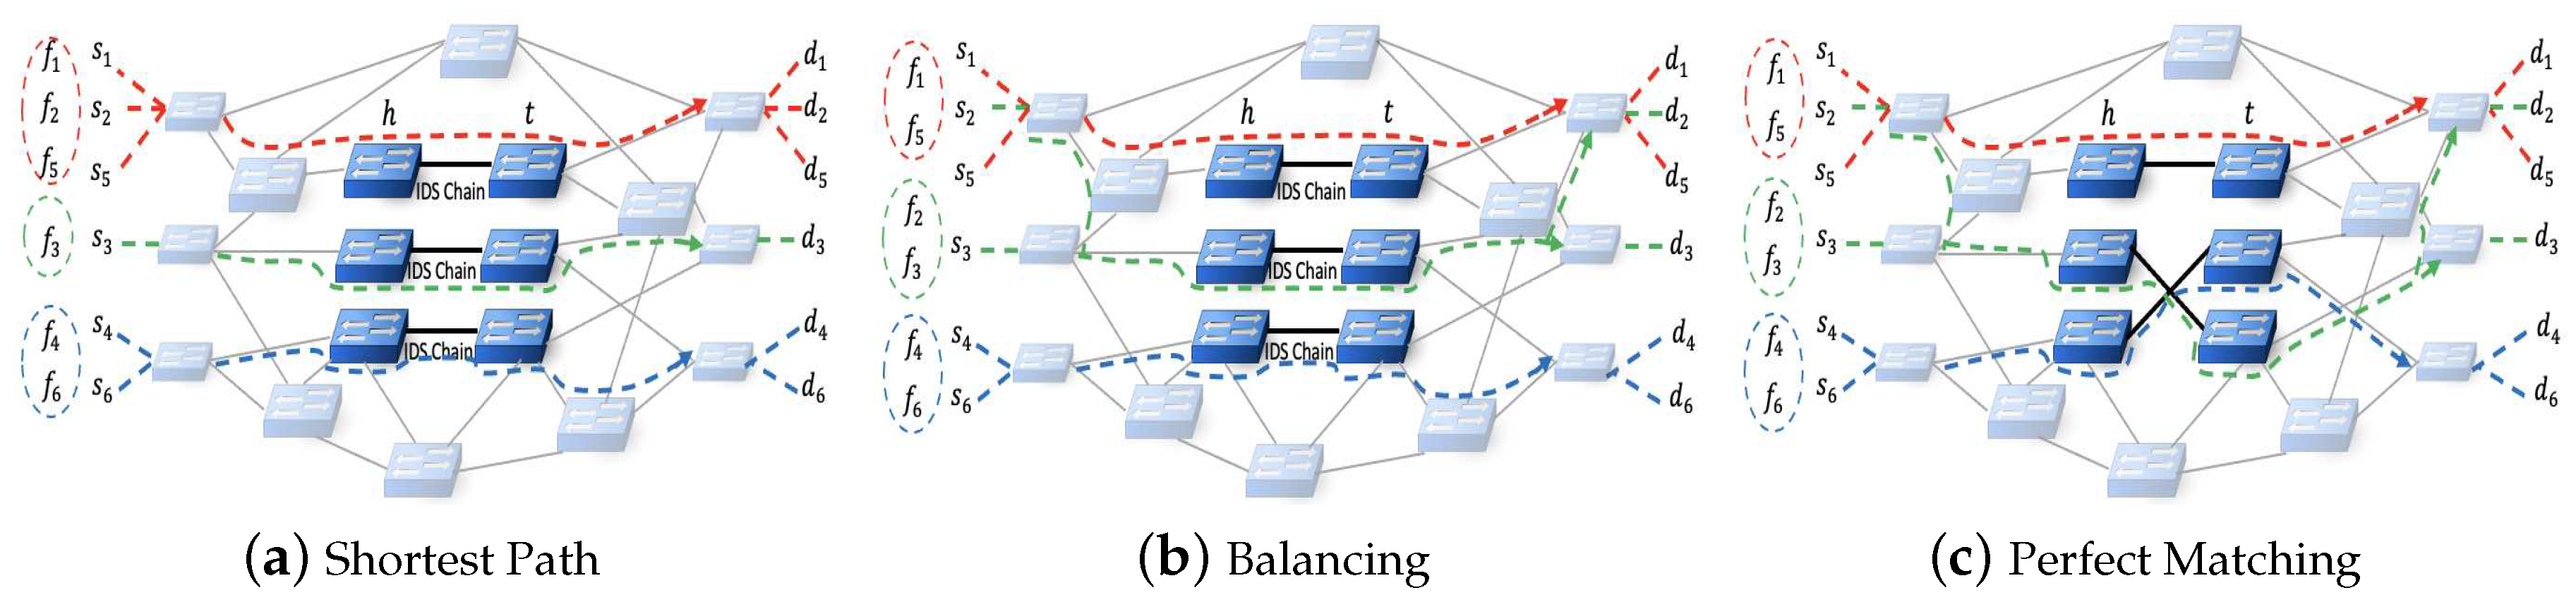
Figure 3.
Procedures of the matching algorithm.
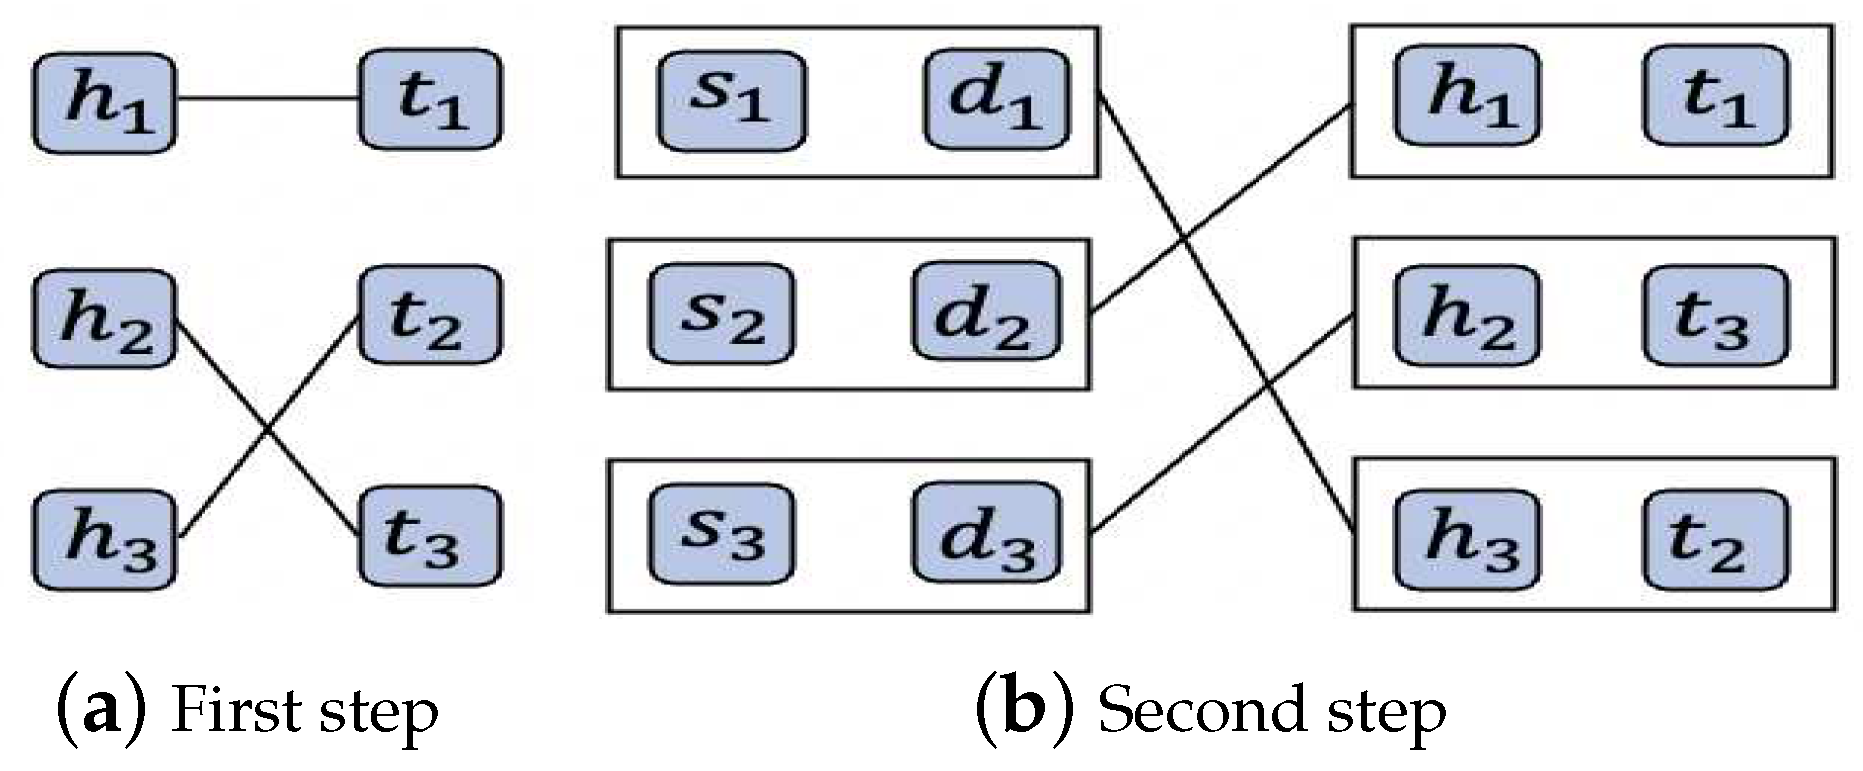
Figure 4.
Relationship between assignment and OPT.
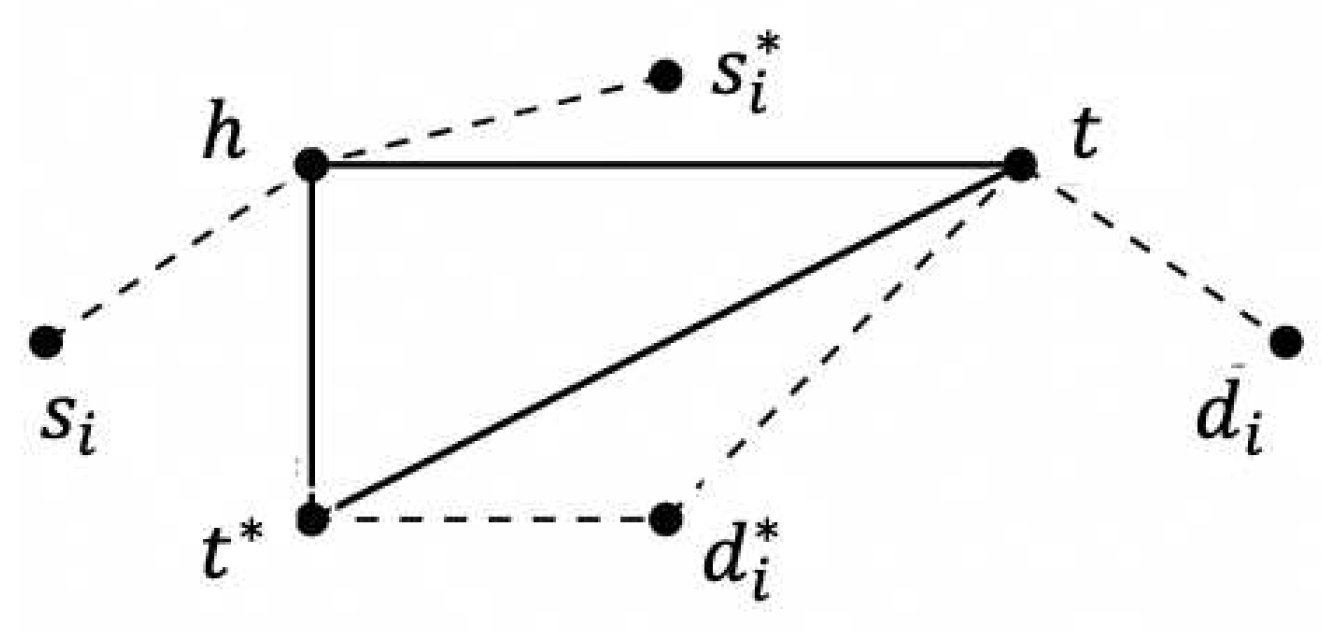
Figure 5.
Topologies.
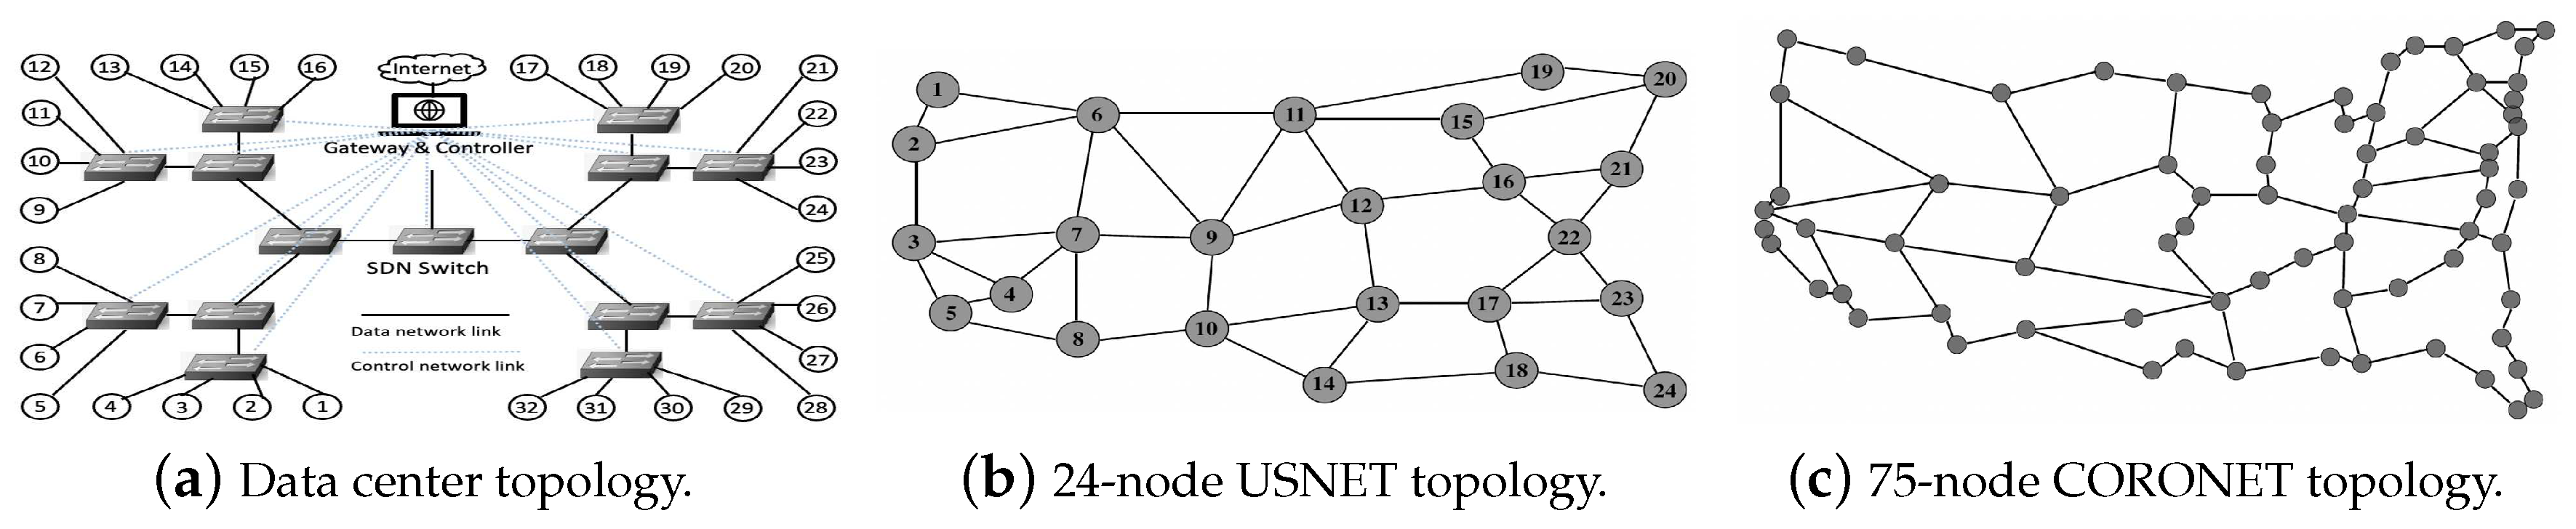
Figure 6.
Detection time for topology 1 (Sparsity=).
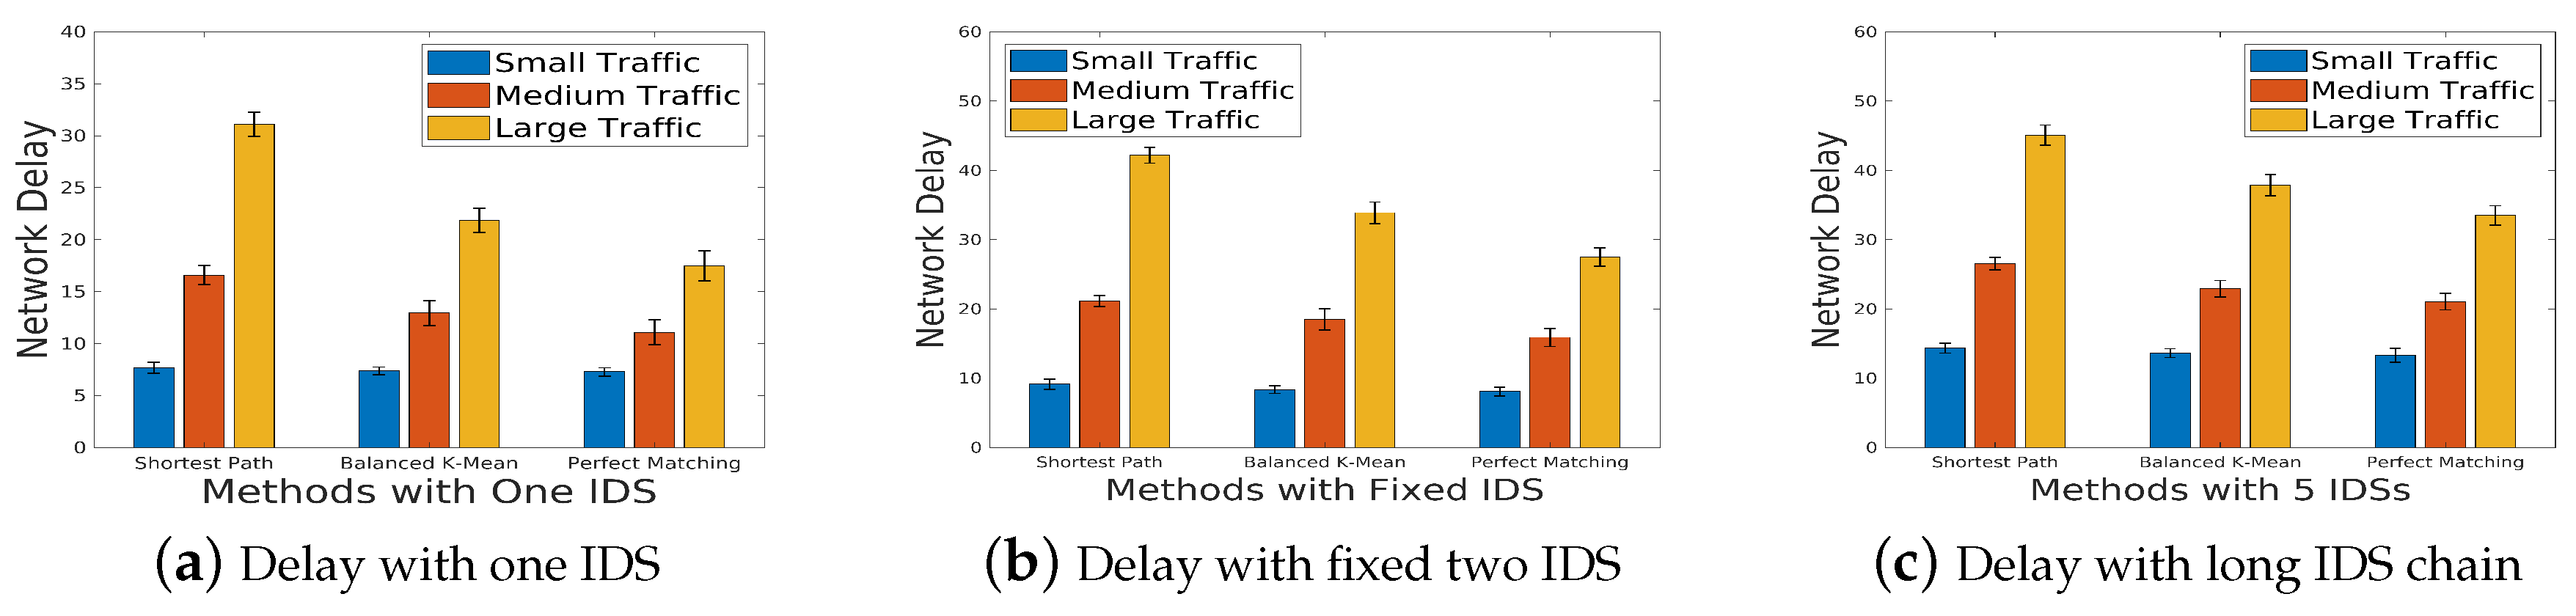
Figure 7.
Detection time for topology 2 (Sparsity=).
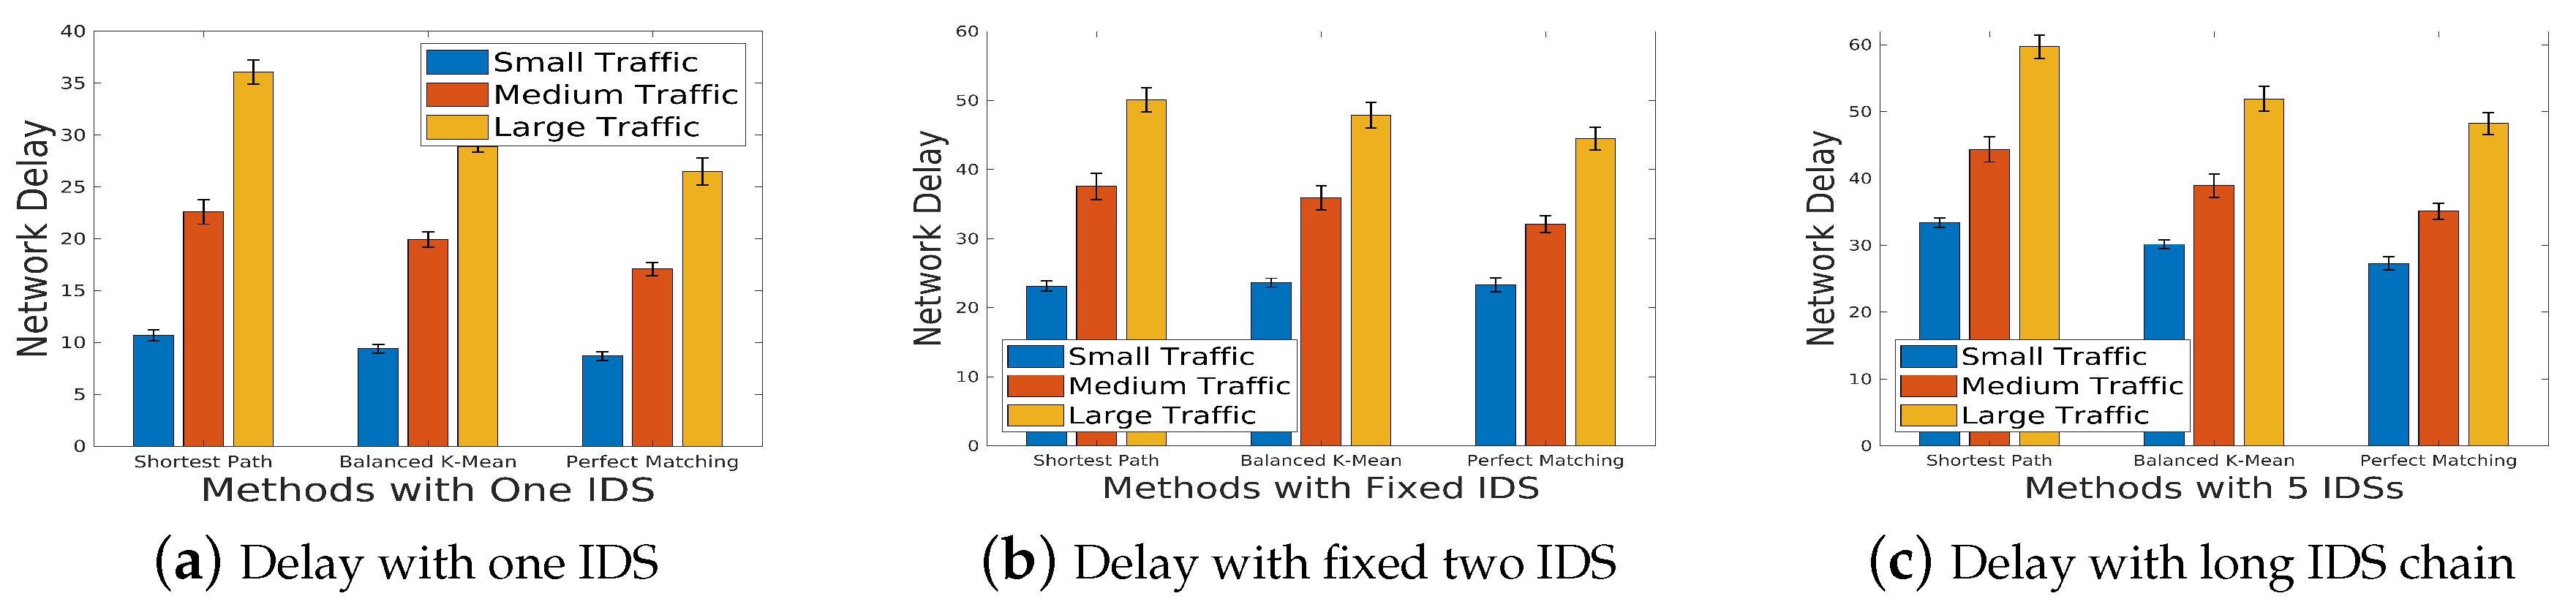
Figure 8.
Detection time for topology 3 (Sparsity=).
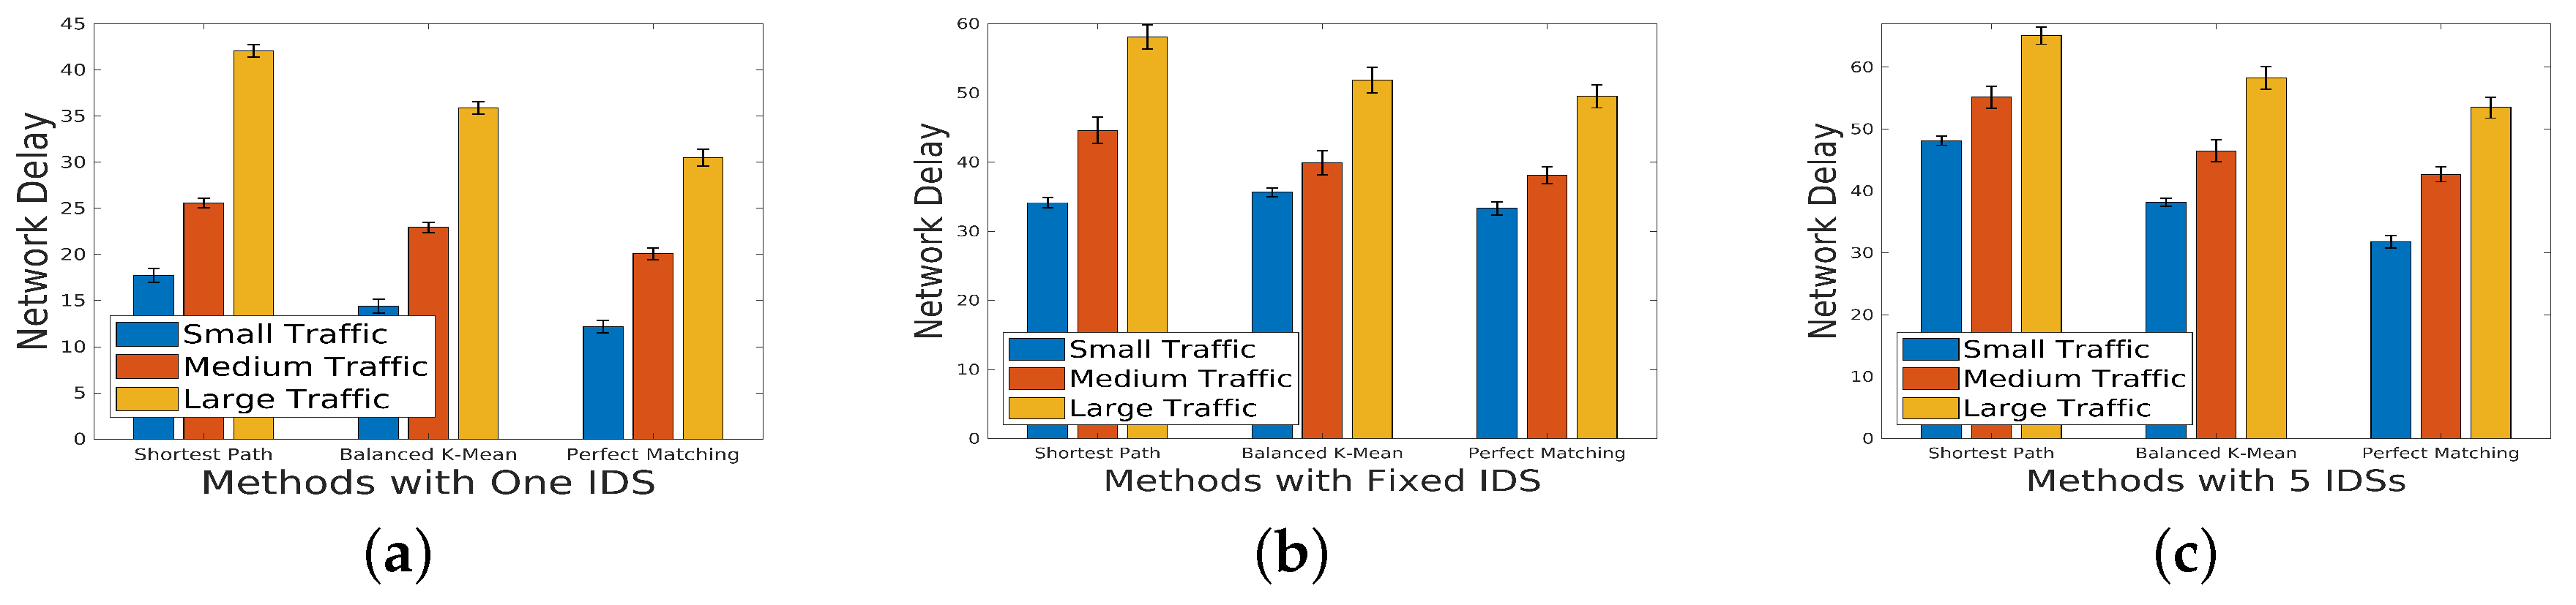
Figure 9.
Number of hops for topology 1 (Sparsity=).
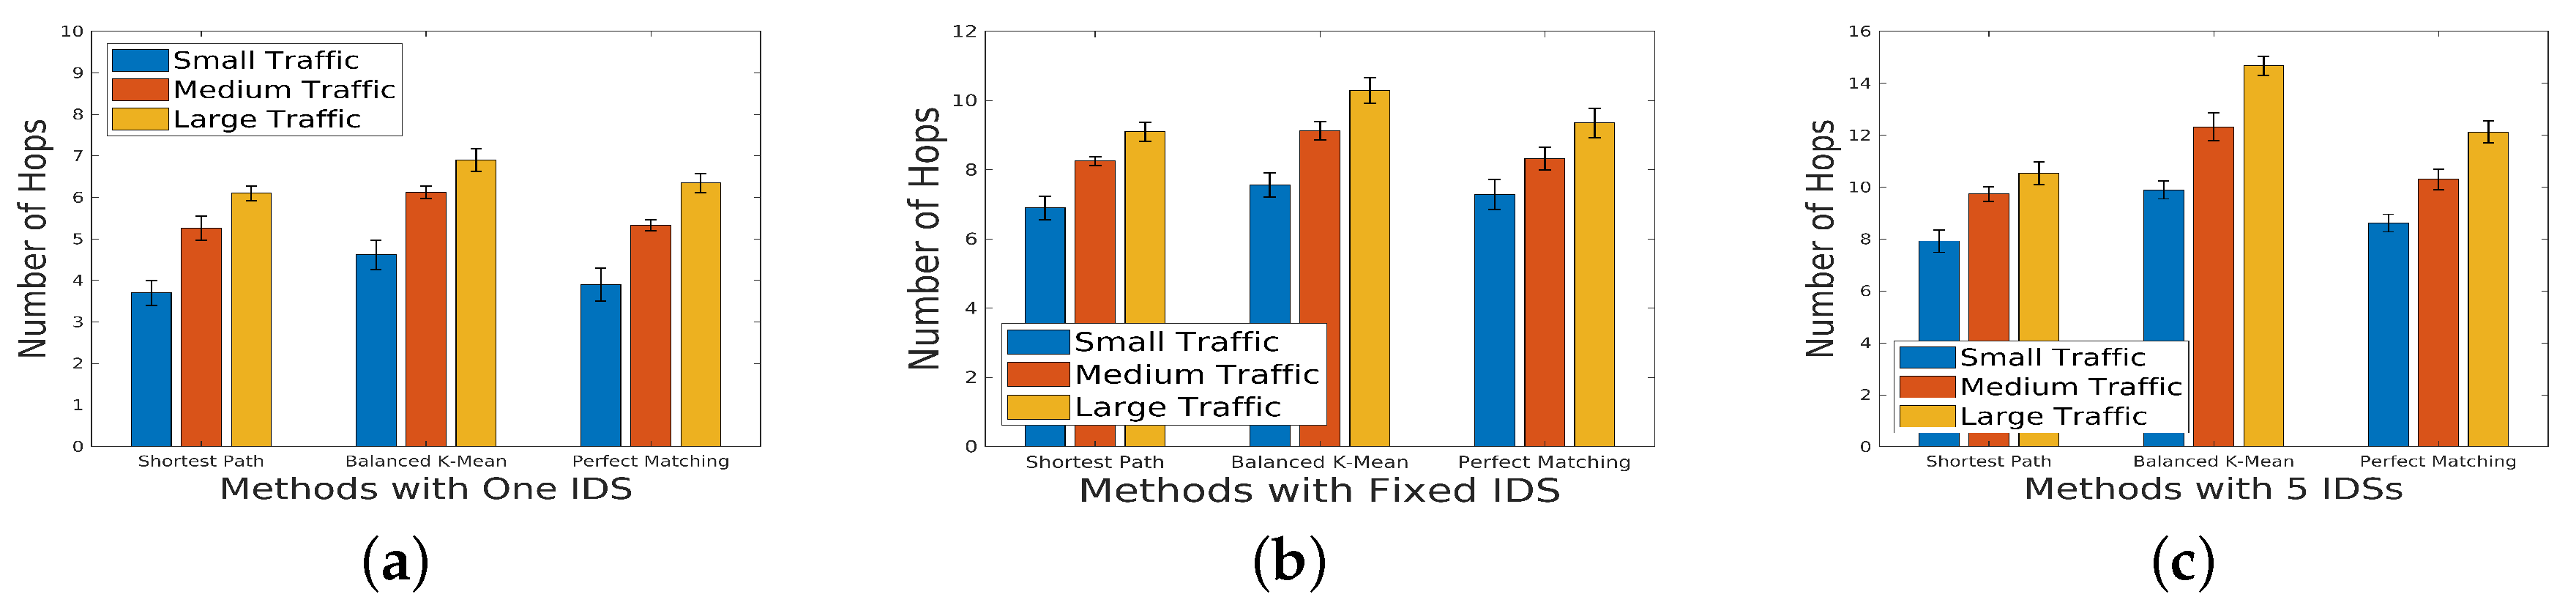
Figure 10.
Number of hops for topology 2 (Sparsity=).
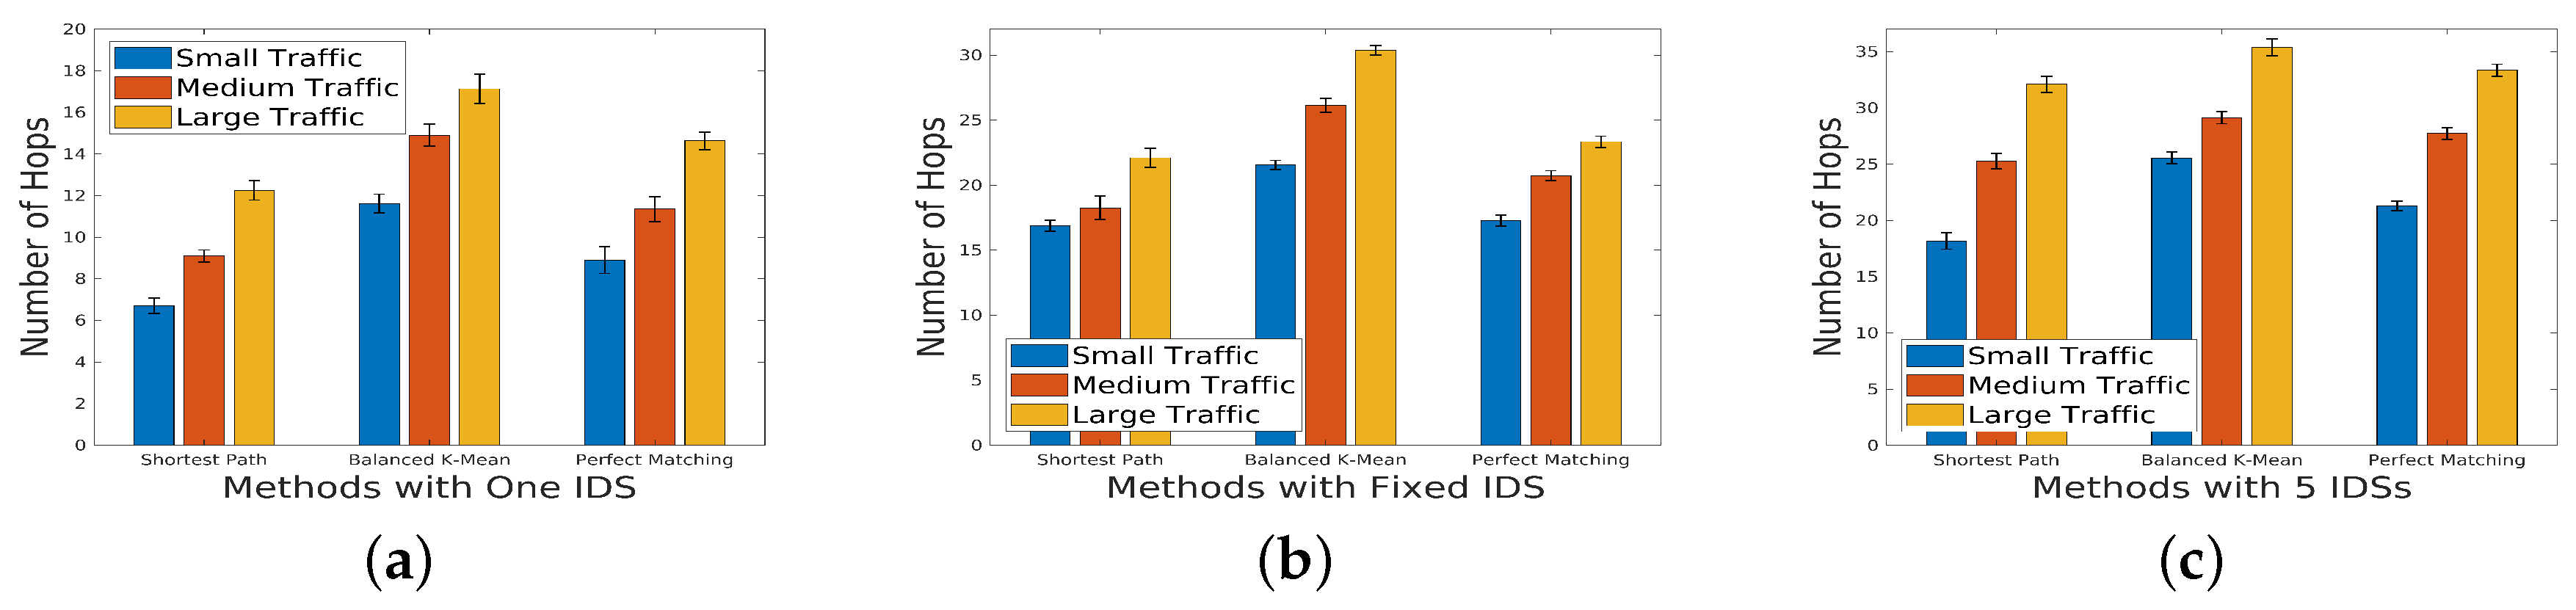
Figure 11.
Number of hops for topology 3 (Sparsity=).
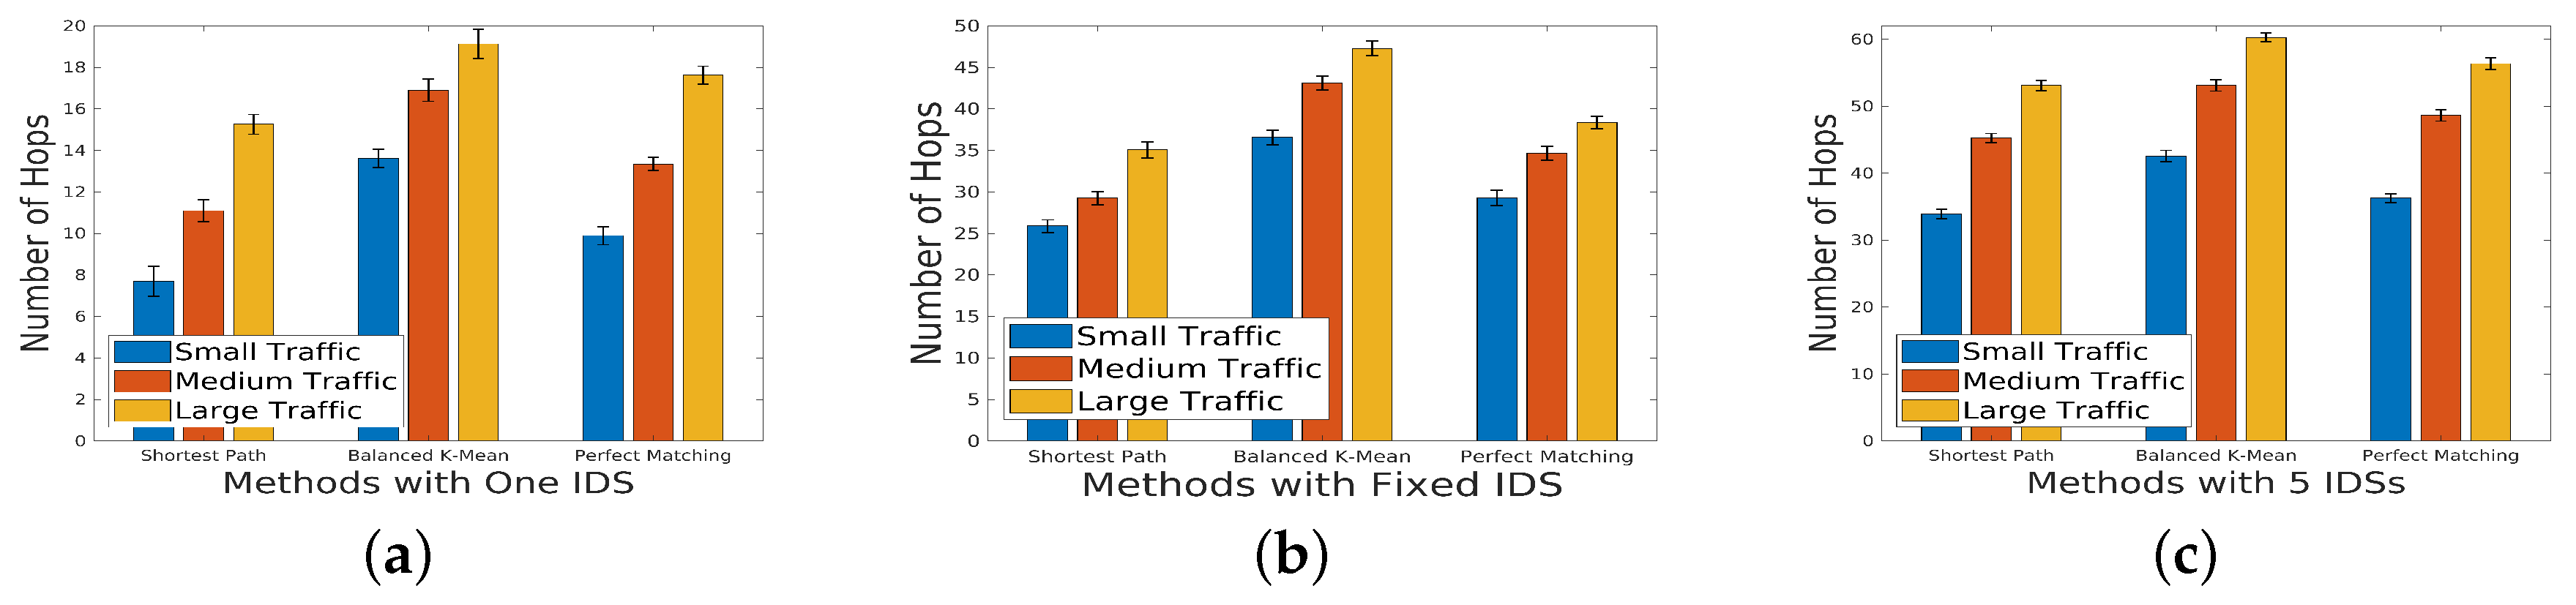
Figure 12.
Network Delay for different flow weights.
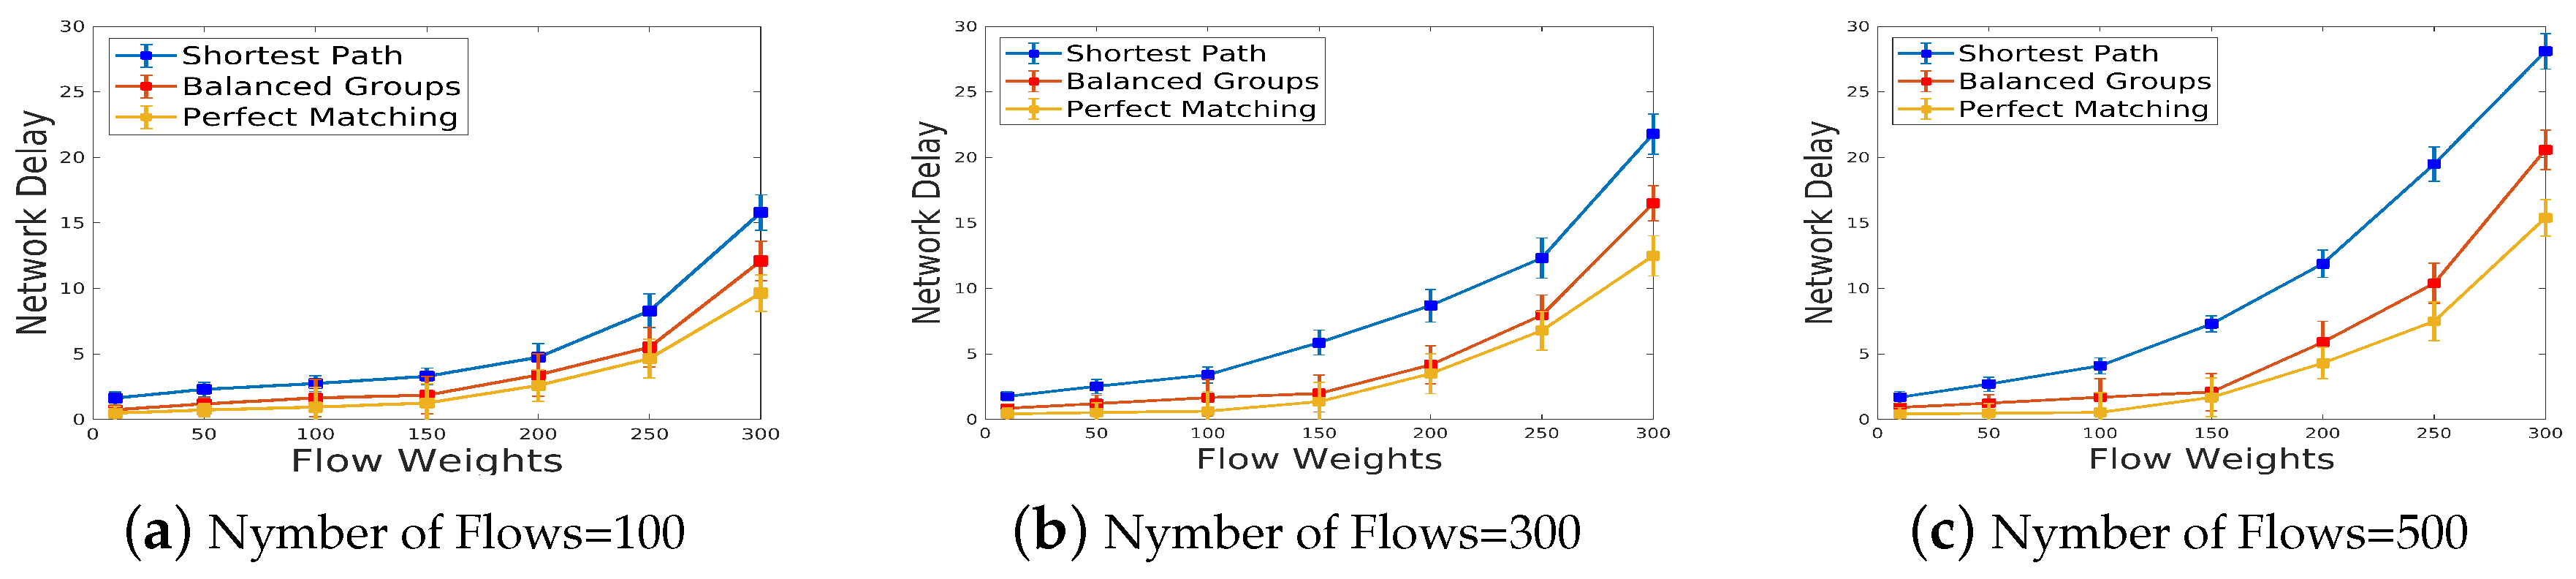
Figure 13.
Network Delay for the different number of flows.
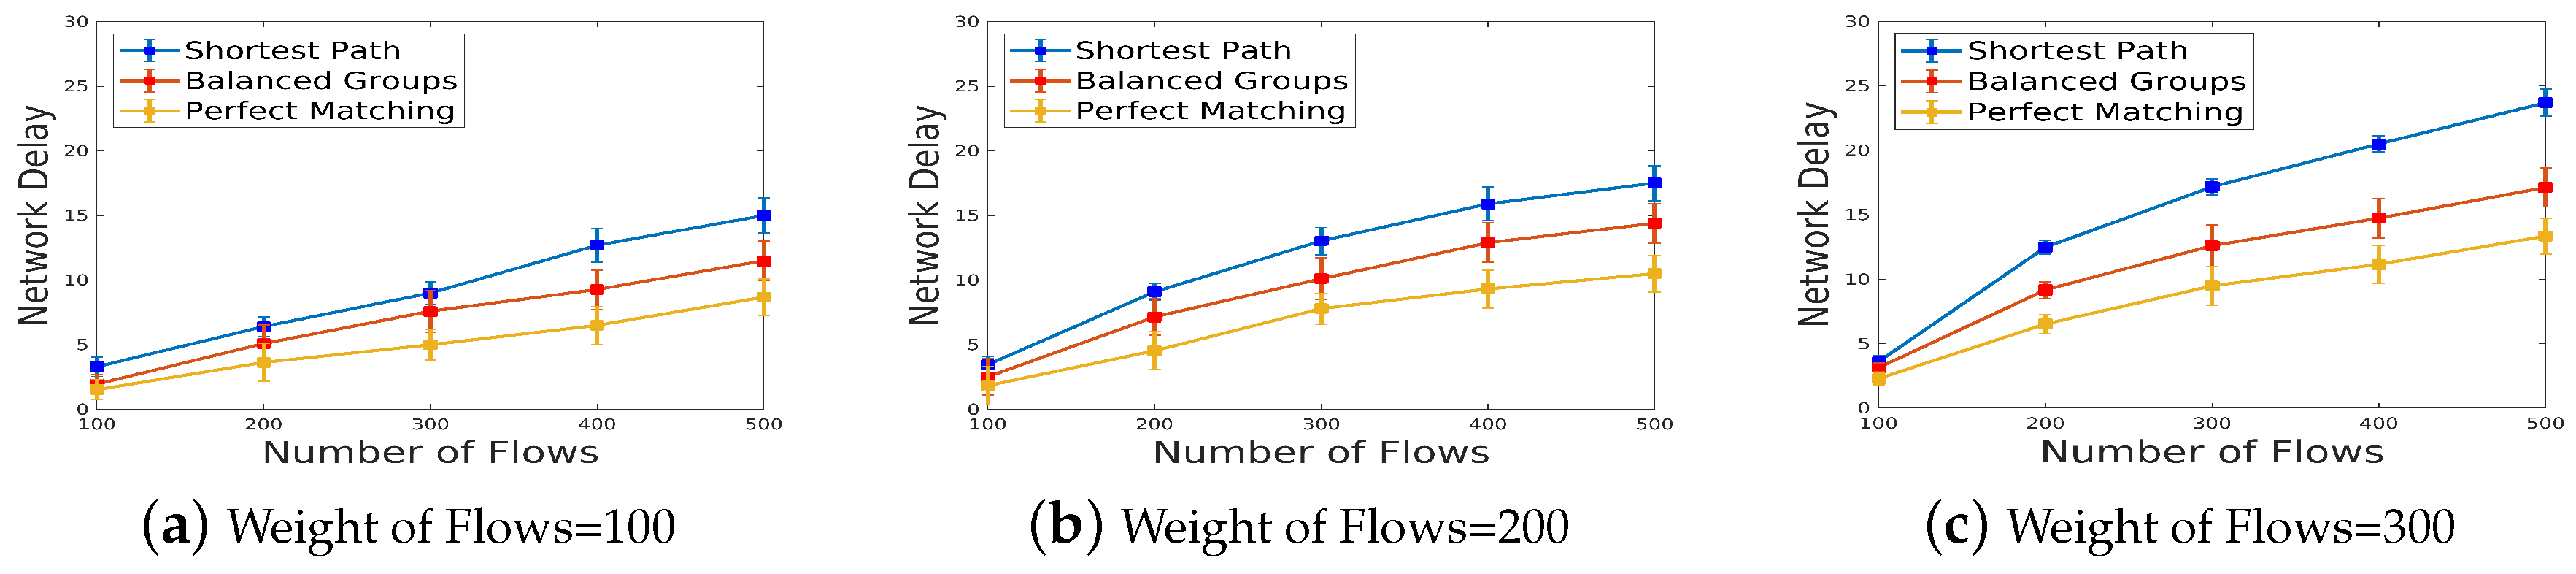

Table 1.
Fixed IDS chain for each flow
| Shortest Path | Balanced | Matching | ||||
|---|---|---|---|---|---|---|
| Flow | Group | IDS | Group | IDS | Group | IDS |
| Total | 34 | 38 | 34 | |||
Table 2.
Unbalancing Factor.
| Flows | Shortest Path | Balancing | Matching |
|---|---|---|---|
| IDS Chain 1 | |||
| IDS Chain 2 | |||
| IDS Chain 3 |
Disclaimer/Publisher’s Note: The statements, opinions and data contained in all publications are solely those of the individual author(s) and contributor(s) and not of MDPI and/or the editor(s). MDPI and/or the editor(s) disclaim responsibility for any injury to people or property resulting from any ideas, methods, instructions or products referred to in the content. |
© 2023 by the authors. Licensee MDPI, Basel, Switzerland. This article is an open access article distributed under the terms and conditions of the Creative Commons Attribution (CC BY) license (http://creativecommons.org/licenses/by/4.0/).
Copyright: This open access article is published under a Creative Commons CC BY 4.0 license, which permit the free download, distribution, and reuse, provided that the author and preprint are cited in any reuse.


