
Submitted:
25 October 2023
Posted:
26 October 2023
You are already at the latest version
Abstract
To solve the problem of complex sensor installation and easy damage in contact displacement measurement, a non-contact measurement method of brace displacement in bridge swivel construction based on binocular vision is proposed in this study. Combined with monitoring data in a swivel construction interchange project, binocular vision system was compared and analyzed with the traditional displacement meter and total station. Results showed that force versus displacement variation plots were obtained by binocular visual measurement in the weighing test, the inflection point can be clearly distinguished, and the position of the inflection point was the same as that of the displacement meter; monitoring data of binocular vision measurement and total station were compared and analyzed in the bridge swivel process, the average error was no more than 0.18 mm, the maximum error was no more than 0.42 mm, and the standard deviation was no more than 0.12. The method proposed in this study can be used as an alternative to displacement meter and total station measurement methods in bridge swivel construction, the problem of complex sensor installation and easy damage is solved in brace displacement measurement, equipment and labor costs can be effectively saved.
Keywords:
binocular vision
; bridge swivel construction
; brace displacement
; mark point matching
1. Introduction
In the planning and construction of bridges, it is inevitable to cross roads, railroads, valleys, rivers and other terrains, bridge construction is disturbed by special terrain, bridge swivel construction technology is an effective method to solve this problem[1]. To reduce the risk of overturning and ensure the safety in the bridge swivel process, weighing tests are performed before bridge swivel, the whole process is monitored during bridge swivel[2]. The spherical hinge rotation method is often used in bridge swivel, the jacking force is used to push the spherical hinge to rotate. In the bridge swivel, the displacement meter or tables of percentage has been used to measure the spherical hinge displacement for the safety of the rotation[3]. During the measurement process, when the object to be measured is in contact with the displacement meter, the probe is susceptible to wear and tear. In the construction monitoring of the turnaround, the measurement data of total station is limited, and the equipment cost is relatively high.
In recent years, a variety of non-contact measurement methods have been widely used in bridge engineering, such as: measurement of cross-bridge displacement was measured by using a non-contact laser Doppler vibrometer[4],microwave interferometric radar was used for multi-point displacement and influence line measurements on large span bridges[5] and so on. However, there are still certain problems, when non-contact measurement is applied in the process of bridge construction, for example, laser systems are not only costly, but the measuring distance is limited[6], the radar can be used for remote measurements, but the reflective surface needs to be mounted on the structure[7], engineering testing requirements are difficult to be met practically. New non-contact measurement methods and corresponding systems are urgently needed to solve the problem[8]. Binocular vision technology[9,10] is an important research direction in computer vision, it has been successfully applied to the measurement of displacement of large structures. Binocular vision measurement techniques are included in the non-contact measurement, high precision, sustainable measurement and other advantages are more prominent[11,12], and 3D image target reconstruction can be accomplished cost-effectively through dynamic, marker-less binocular vision measurement systems[13]. Fukuda et al. [14] developed a vision-based displacement sensor, which monitors the dynamic response using a robust target search algorithm. Santos et al. [15] described a method for performing vision system calibration , which allows in situ calibration while the deck is moving. Wang et al. [16] investigated an oversized 3D-scale event sensing and localization system based on binocular stereo vision, a model for computing target coordinates in the physical world coordinate system is proposed. Zhang et al. [17] addressed the problem of distance measurement for critical sensors and sensor networks in structure monitoring, a planar space algorithm based on binocular stereo vision is proposed. Shao et al. [18] proposed a phase-based calibration method for binocular vision sensors, which only uses a planar target to obtain camera intrinsic and extrinsic parameters. Due to the abundance of extractable features on a planar target, this method is widely applied in on-site and automatic calibration. Wang et al. [19] improved the coarse-to-fine matching algorithm to establish a high-precision and high-efficiency stereo vision measurement system. The measurement accuracy of this method can reach 0.1 mm in laboratory conditions and can be adjusted to millimeters according to practical requirements. Zheng et al. [20] proposed a new high-precision non-coplanar calibration method based on an affine coordinate calibration model. They further established a more accurate camera calibration model to obtain precise intrinsic and extrinsic parameters, as a result, the relative measurement accuracy of the binocular camera system can be within 3/110. Currently, binocular vision has been widely used in the field of engineering displacement measurement, Dong[21], Busca[22] et al, used binocular vision measurement techniques combined with targets for real-time monitoring of the dynamic response of bridges, monitoring costs are significantly reduced, and better accuracy is achieved. By implementing an object search algorithm, Feng et al. [23] achieved remote measurement of dynamic displacement of a bridge without the need for target markers, and by comparing with conventional contact displacement sensors, the accuracy of the proposed binocular vision measurement algorithm was demonstrated. Shan et al. [24] proposed a new detection method of bridge surface defects, using scale-invariant feature transform algorithm and feature extraction algorithm in binocular vision measurement, the reliability and practicality of this method was demonstrated by the real bridge measurement. Deng et al. [25] proposed a non-contact measurement method for 3D vibration detection with structured light, binocular visual photographs in time series were recognized by time-domain modalities, it was shown by cantilever tests , the cantilever test shows that this method is superior to contact measurement sensors, and more modal information can be provided. Sun et al. [26,27] utilized the principle of binocular vision measurement in the aeroelastic response measurement of a saddle-shaped membrane structure, they overcame the limitations of conventional contact sensors that can only measure one-dimensional data at a single point, after the camera arrangement has been optimized, the full-field aeroelastic response of the membrane structure can be obtained. In summary, the application of binocular vision measurement technology in conventional bridges has achieved good results. Shao et al. [28] utilized binocular vision to acquire vibration displacement response, compared with traditional sensors, displacement response data based on binocular vision is more accurate, cost-effective, and easier to achieve precise three-dimensional vibration displacement measurement. Wu et al. [29] applied super-resolution reconstruction to structure displacement measurement based on binocular vision, they used a deep learning-based super-resolution algorithm to improve visual measurement performance, effectively enhancing the accuracy of measuring adjacent corner distances [30], the advantages of low cost, high accuracy, and continuous remote measurement are clearly demonstrated. However, its application in bridge swivel measurement and monitoring is limited and needs further promotion and application.
Based on the sub-pixel edge detection method and binocular vision measurement principle, a binocular vision displacement monitoring system was constructed in this study, highly accurate matching and positioning of measurement point marks was achieved, the method can be used as an alternative to displacement meter and total station measurement methods in bridge swivel construction, the problem of complicated and easily damaged sensor installation in contact displacement measurement is solved. Through actual engineering weighing test measurements, the effectiveness of binocular vision measurement systems and their feasibility in weighing tests were verified. The main studies are as follows: MATLAB calibration toolbox is used for camera calibration, the OpenCV computer vision library for the Python platform is called for image capture processing, target information extraction and coordinate calculation, binocular vision measurement model was built. In a swivel construction interchange project, through comparing binocular vision measurement technology with traditional displacement meter and total station monitoring data, the application effects and economic benefits are analyzed in detail during the weighing tests and bridge swivel.
2. Binocular measurement theory and system
The main equipment for binocular vision measurement is a computer, and the ideal linear model is small-aperture imaging, scene object information is acquired by mimicking the human eyes in this measurement method, when both human eyes look at the same object, the difference in vision is created, the difference is “parallax”, which creates the sense of three-dimensionality. Binocular cameras are left and right cameras in two different viewing angles, through simultaneously shooting objects in space with the left and right cameras, two parallax maps with different viewpoints are obtained. The ideal imaging model for binocular vision measurement is shown in Figure 1.
Binocular vision measurement is the conversion of pixel coordinates of a point in space into real 3D world coordinates. The binocular vision measurement model mainly consists of the image pixel coordinate system, the image physical coordinate system, the camera coordinate system and the world 3D coordinate system. If the 3D coordinates of a point P in space are (XW, YW, ZW), the projections of this point on cameras C1 and C2 are P1 (u1, v1), P2 (u2, v2) respectively. The conversion of world 3D coordinates to camera coordinates and image pixel coordinates to world coordinates are shown in Eq. (1) and Eq. (2).
In the equation, R is the rotation matrix of the rigid body transformation of the world 3D coordinate system and the camera coordinate system; T is the translation matrix of the rigid body transformation of the world 3D coordinate system and the camera coordinate system; W is the external reference matrix.
The optical system of a camera consists of lenses, in the lens manufacturing process, some deviations will be produced generally, and these errors cause the actual imaging to deviate from the ideal imaging. This deviation is known as the aberration error of the camera in the field of computer vision. Camera distortion is mainly divided into cushion distortion and barrel distortion. In the hypothesis, the actual imaging coordinates are (x, y), then the ideal imaging coordinates are (x’, y’).
In the formula: xl’, yl’ and xr’, yr’ indicates the ideal imaging coordinates under the radial aberration and tangential aberration of the camera, if the higher term of δ is ignored, k1, k2 and p1, p2 are the radial aberration parameters and tangential aberration parameters of the camera.
2.1. Camera calibration and feature extraction
Camera calibration is one of the key steps in the implementation of stereo vision technology. Internal parameters of optical and geometric properties and external parameters concerning the three-dimensional position and orientation of the coordinate system are mainly included in the calibrated parameters[31]. The methods commonly used for camera calibration include Tsai’s calibration method, camera calibration based on active vision, and Zhang’s calibration method. Zhang’s calibration method is simple to operate, has high accuracy, and is suitable for most situations. Therefore, this system adopts Zhang’s calibration method and uses the MATLAB stereo camera calibration toolbox for calibration. The left camera is taken as the reference coordinate system, and several groups of chessboard patterns at different positions are captured, the camera’s intrinsic matrix and extrinsic matrix are obtained by solving for the unknown parameters in Eq. (6) and equation Eq. (7).
During the solving process, the Cholesky decomposition method is employed to decompose matrix B and obtain the camera’s intrinsic matrix M. By substituting the intrinsic matrix into Eq. (6), the extrinsic parameters can be solved.
In the image acquisition process, the captured image does not meet the demand due to noise, light source, and other factors, image pre-processing is usually performed first to eliminate irrelevant content, and to enhance the recovery of useful and relevant information[12,32], this method ensures the accuracy of feature extraction and stereo matching, it is to ensure the accuracy of feature extraction as well as stereo matching. The pre-processed stereo-matched images are obtained by four steps: graying, Gaussian filtering, gamma conversion and background grayscale aliasing[33]. Hough transform[34] and sub-pixel edge detection[35], are commonly used to detect the center of a circle in feature extraction, the Hough transform is computationally intensive, and it has high environmental requirements[36], so a concentric circle detection method is used based on sub-pixel edge detection[37]. Edge is one of the very important features of an image, which retains the geometric information of the original image, and the amount of data processed is substantially reduced by edge detection. The Canny operator [38] is used to obtain the whole-pixel edge initial value of the target identification point, and then the whole-pixel edge initial value is used as the center, The set of sub-pixel edge points is ellipse-fitted to obtain the exact location of the target identification point. Finally, through the sorting position correction of marker points, the set of marker detection points used to solve for the calibration parameters is obtained, high precision calibration of cameras is achieved in complex environments. The gradient value of the pixel is greater than the gradient value of the edge in the image, therefore, a subset of points with larger gradient values are used as edges in practice. The Otsu method is employed to segment the image and divide the three-dimensional histogram into four parts. Eq. (8) is used to calculate the probabilities of the target region and the background region. The optimal threshold vector (a, b) satisfies Eq. (9), thereby achieving precise sub-pixel edge localization, the detection efficiency and detection accuracy are effectively improved [39,40].
2.2. Marker Point Matching Technology
Marker point matching is essentially finding the corresponding points by image alignment[10]. Stereo matching is a very critical step for binocular measurement techniques[41,42], and the results of subsequent 3D reconstructions will be influenced by the matching results. The algorithm of stereo matching can be divided into global matching algorithm and local matching algorithm. The local matching algorithm utilizes only the constraint information of the corresponding pixel and adjacent pixels, it is widely used due to their low time complexity. Local matching algorithms are classified into three main categories: region matching[43], feature matching and phase matching. The current matching algorithm will determine the effectiveness of the matching algorithm in three ways. The local area matching algorithm is applied in this study, which selects the matching primitive as the grayscale value of the pixel within the window. A window is created centered on the matching pixel in the reference image, and the corresponding pixel is searched in the other image, the search strategy is determined by establishing a similarity metric factor to calculate the correlation value in the window, and correlation values are used to determine whether two image points correspond to each other. With the right matching algorithm, matching efficiency can be more easily obtained in terms of accuracy and speed, through the region matching algorithm, the dense parallax map can be obtained, and the advantages of simple implementation, smaller computation, more suitable for real-time systems are more prominent. In the application of this study, binocular vision measurement technology is used as a replacement for displacement gauges and total stations. the area matching operator is more efficient and real-time compared with the other two operators, and engineering needs can be well met.
2.3. Measurement Systems
Based on the measurement principle and marker matching technology for image distortion correction, measurement point image detection and tracking, measurement point stereo matching, marker image localization and binocular vision measurement model solving, structural displacement is measured by binocular vision measurement systems. Laptops, calibration boards, and binocular cameras are used as the basic equipment for binocular vision measurement systems, the solid circle is the target (Figure 2). MATLAB calibration toolbox is used for camera calibration, the Open CV computer vision library for the Python platform is called for image capture processing, target information extraction and coordinate calculation (Figure 3).
3. Test verification
3.1. Project Introduction
The main bridge of an overpass is a (65+115+65) m variable section prestressed concrete continuous girder, the bridge is designed as a full width, the plane is located on the right deviation curve with R=1100m, the bridge deck width is 31.56m, and the cross slope of the bridge deck is 3% in one direction. Swivel construction method is applied in the main bridge, parallel existing railroads exist on both sides of the construction site, 2×56m sections of the turned beam are poured respectively by means of bracket cast-in-place before the turnaround. Then the beam section is turned, first 2# main pier clockwise rotation 89°, after 3# main pier counterclockwise rotation 85°. After turning into position, the side span and middle span will be joined in turn, the 2# main pier and 3# main pier are set along the centerline of the lateral piers with a pre-eccentricity of 17cm. The pile foundation and the lower bearing are biased to the inner side of the curve, rectangular solid piers are used in the substructure main pier, five-column pier is applied to the side pier, and bored pile foundation is used in foundation treatment. The total weight of the rotating body is 16,500t, and the time of the rotating body is 88 minutes. The rotating bridge is shown in Figure 4.
The project turntable system consists of lower turntable, upper turntable, spherical hinge, brace, ring slide and rotating traction system. The radius of the spherical hinge plane is 2m, the radius of the spherical surface is 8m, the coefficient of static friction of the spherical hinge is 0.1, and the coefficient of dynamic friction is 0.06. The rotating body system is shown in Figure 5. Lower spherical hinge surface is drilled with tetrafluoroethylene sliding Vane inlay holes, each ball hinge is equipped with 918 sliding Vane. The turntable is an octagonal structure, and length, width and height are 17m, 13m and 2.5m respectively. The multidirectional force state is formed mainly during the rotation of the in the process of bridge swivel, multi-directional force states are formed. Prestressing bars in horizontal, vertical and longitudinal directions are arranged in the structure. Braces are poured on the upper turn-table, it acts as an insurance during the swivel process. Each upper turntable is equipped with 8 double cylindrical legs, and 8 braces are symmetrically distributed on both sides of the longitudinal axis. Each cylindrical shape is a steel tube with diameter of 24mm and height of 800mm, the tube is filled with C50 micro-expansion concrete, and steel plates of 30 mm thickness are installed under the tube. The part where the ball hinge is connected to the upper turntable is the turntable, and the turntable traction force is applied directly on the turntable. The diameter of the turntable is 11.5m and the height is 1.0m. The pre-buried 19φS 15.2 steel strand traction cables with strength grade of 1860 MPa are embedded in the turntable, each cable is buried in a length greater than 4.5 m, each pair of ropes is symmetrical in the center of the turntable, and the cables are wound evenly around the turntable.
3.2. Measurement system validation
To lay the foundation for further application in practical engineering, according to the actual engineering weighing test measurement environment, the measurement accuracy of the binocular vision measurement system was analyzed at different measuring distances (1 m, 5 m, 10 m), and the effectiveness of the system was verified, the test environment is deployed as shown in Figure 6.
The MATLAB calibration toolbox is used for camera calibration. A total of 11 sets of checkerboard images were taken at different positions and angles for the test calibration, the calibration results are shown in Table 1 and Table 2.
After the calibration was completed, the images can be taken and processed, according to the internal and external parameter matrix obtained from the binocular camera calibration, then the 3D world coordinates of the target circle center can be obtained, these coordinates are used to calculate the distance before and after target spacing or target displacement. The test results are shown in Figure 7.
According to the actual engineering weighing test measurement environment, the measurement distances are about 1m, 5m and 10m respectively in this test. When the measurement distance is 1m, the average error of binocular vision measurement is 0.04mm, the maximum error is 0.07mm and the standard deviation is 0.02. When the measurement distance is 5m, the average error is 0.25mm, the maximum error is 0.34mm, and the standard deviation is 0.07. When the measurement distance is 10m, the average error is 0.46mm, the maximum error is 0.63mm, and the standard deviation is 0.14. The relationship between the distance measured and the error is proportional as shown in Figure 8. The reason is that the acquired 3D coordinates of the target circle center are converted from the corresponding image pixel coordinates, and the pixel coordinate system has pixel (px) as the smallest unit in binocular vision measurement. When the total number of pixels in the image captured by the camera is constant, the farther away the object is from the captured object, the fewer pixels it occupies in the image, and the larger the pixel coordinate calculation error will be. When the measurement distance is within 10 m in the test, average error can be controlled to within 0.46mm. The monitoring accuracy requirements can be well met in swivel construction, and the field weighing test requirements are met, the validity of the binocular vision measurement system and its feasibility in weighing tests were verified.
3.3. Analysis of test results
3.3.1. Weighing test and result analysis
In the monitoring of bridge swivel construction, the overall attitude change of the bridge is reflected to some extent by the displacement of the braced foot, during the weighing test and the swivel process. To verify the effect of binocular vision measurement technology applied in the construction monitoring of brace displacement, the monitoring of brace displacement was carried out in the process of weighing test and swivel process of the dependent project.
In the actual construction process, due to the difference in concrete pouring volume on both sides of the T structure, different prestress tensioning and other influencing factors, the unbalanced moment (MG) and eccentricity (e) may be generated on both sides of the T structure. The calculation of the size of the rotating traction force and the control of the rotating attitude are affected by the unbalanced moment and eccentricity, and to ensure the safety and smoothness of the rotation process, the weighing test and determination of the counterweight scheme were carried out before the rotation.
The spherical hinge rotation method was used in the weighing test of this project, the jack was applied to the spherical hinge part to apply the jacking force, at the simultaneous displacement of the spherical hinge part is measured, a graph of the variation of the jacking force versus the displacement of the spherical hinge was created. When the inflection point of the relationship diagram appears, the beam is in a critical state where the jacking force, unbalance moment and spherical hinge moment (MZ) are in balance. At this point, to calculate the spherical hinge unbalance moment and the spherical hinge frictional moment, the three-force equilibrium equation can be established.
(1) Pre-test estimation
According to the construction design drawings and the site construction, the unbalanced moment of this project is mainly caused by wall guardrail, protective net and hanger, the difference of concrete square quantity poured in the bridge section.
Based on the actual square volume of concrete poured in each phase at the project site, the unbalanced moment caused by the difference in the square volume of section pouring was estimated, as shown in Table 3. The difference of pouring square is positive with more southeast side of bridge center than northwest side, and negative vice versa; the unbalanced moment is positive with bias to southeast side of bridge center, and negative vice versa.
According to the construction design drawings and site conditions, the estimated unbalance moment caused by the unbalance of wall guardrail, protective net and hanger is shown in Table 4. The unbalance moment is positive to the southeast side of the bridge center, and negative vice versa.
1) The total unbalanced moment caused by the construction of the main beam of pier #2 is 8270kN·m, which is biased to the southeast.
2) The total unbalanced moment caused by the construction of the main beam of Pier 3# is 35730kN·m, which is biased to the southeast.
According to the unbalanced moment estimation of the main beam of pier 2# and the main beam of pier 3, the actual eccentricity can be further calculated, as shown in Table 5.
According to the results of unbalanced moment and eccentricity estimation, the pre-weighting estimation was carried out. From Table 6, it is obtained that:
1) The estimated eccentricity of the main beam of pier 2# is 0.05 m (eccentric to the southeast of the bridge center), which meets the eccentricity requirement of 0.05m~0.15m and does not require pre-weighting.
2) The estimated eccentricity of the main beam of pier 3# is 0.22 m (eccentric to the southeast side of the bridge center), which does not meet the eccentricity requirement of 0.05 m~0.15 m. Considering the small eccentricity and the possibility of estimation error, the eccentricity can be adjusted to 0.07 m in advance. The unbalanced moment of the configuration is 24750kN·m from the following Eq. (10), which can be counterweighted at 55 t located at 45 m west of the bridge center.
According to the maximum frictional moment of the ball hinge and the unbalance moment after the pre-weighting, the maximum jacking force P and the minimum jacking force PMIN can be calculated by the following Eq. (11) and Eq. (12), and the estimated jacking force is shown in Table 7. The number of jacks required can be estimated by the maximum jacking force (4 sets of 400 t), the graded loading criteria can be estimated from the minimum jacking force (It is for security reasons and accuracy of data acquisition, when 4 jacks were loaded at the same time, each loaded with 0.5MPa is a level).
(2) Test deployment and flow
Through the pre-test estimates, it is known that four 400 t jacks can meet the project weighing test requirements. To further verify the application effect of binocular vision measurement system in the weighing test of the rotating bridge, the conventional displacement meter and binocular vision measurement system were adopted to monitor the spherical hinge displacement together, and the field equipment is deployed as shown in Figure 9 and Figure 10, the hydraulic jack and displacement meter supporting facilities are deployed as shown in Figure 11.
In the plan view of the deployment of the binocular vision measurement system, two binocular cameras were arranged along the down-bridge direction and cross-bridge direction respectively, it is to ensure that all targets can be shot. To facilitate the deployment of the measurement system, each binocular camera was connected to a Bluetooth transmitting device separately, and the Bluetooth information was received by the laptop for binocular camera shooting and processing.
(3) Analysis of test results
After weighing test on the main beam of pier 2# based on binocular vision measurement technology, binocular vision measurement and displacement meter measurement results were compared and analyzed, the location of the inflection point was obtained, the equilibrium equation is established and the frictional and unbalanced moments are solved. Then the spherical hinge friction coefficient and the T-structure eccentricity are introduced, and the counterweight scheme was determined, finally, the effect of binocular vision measurement applied in the weighing test was obtained.
With the data from the weighing test of pier 2# (Figure 12), the inflection point can be clearly distinguished from the graph of force versus displacement obtained by binocular vision measurements, and the position of the inflection point is the same as that of the displacement meter. In the small mileage side jacking test, when the jacking force is less than 2580kN, the graph of force versus displacement variation shows a stable trend. When the jacking force is greater than 2580kN, the displacement data show a sudden change, then the jacking force of 2580kN is the inflection point of the graph of the relationship between the lateral force and displacement change of small mileage, the bridge is in equilibrium under the jacking force, spherical hinge friction moment and unbalance moment at this time. In the graphs of force versus displacement change on the large mileage side, the inside of the curve, and the outside of the curve, it is also obvious that the locations of the inflection points are 7096kN, 4536kN, and 5079kN.
The equilibrium equation was established by the position of the inflection point, then the results of the weighing test can be derived (Table 8). The longitudinal eccentricity of pier 2# is 0.067 m (eccentric to the large mileage side), the cross-bridge eccentricity is 0.008 m (eccentric to the outside of the curve), which meet the requirements of the site turning and do not need to adjust the counterweight.
3.3.2. Bridge swivel test and result analysis
In the process of bridge swivel, the spherical hinge alone or the spherical hinge and the brace together can bear the force, which was the most unfavorable stage in the whole construction process, the change in attitude of the bridge can be reflected to some extent by the displacement of the brace, therefore, the brace needs to be monitored in real time at this stage. Nevertheless, the total station is expensive (about 100000~350000 RMB) and measurement data are limited. Thus, the pier 2# of the relying project is used as the test object, binocular visual measurement system (the main equipment is the camera, each is about 5000~50000 RMB) is used for real-time monitoring of the brace displacement. Finally, it was used to compare with the total station to analyze its economic benefits and application effects.
(1) Test deployment and process
The deployment plan and elevation of the whole process of brace displacement monitoring during bridge swivel are shown in Figure 13 and Figure 14. The circular targets for binocular vision measurement were spray-painted on the legs in the longitudinal and cross-bridge directions respectively, a total of 4 targets were sprayed for each rotating system, and the brace in the direction of large mileage is the 1st measurement point by counting clockwise. The naming method was the pier number followed by the point number, for example, point 1 of main pier 2# is recorded as “2#-1”. The total station reflective sheet is posted next to the target, and the reflective sheet number is the same as the target number.
The binocular cameras were placed at a distance of about 4 m from the target, according to the location of the target, four binocular cameras were laid on each main pier. The signal was transmitted to the laptop through Bluetooth wireless transmission equipment, and the total station was deployed next to the binocular camera. To monitor the brace displacement during the bridge turning process in real time, four total stations were set up, and the measurement data were compared and analyzed with the binocular visual measurement data.
(2) Analysis of test results
Through the comparative analysis of binocular vision measurement and total station monitoring data in Figure 15.a), b), c), d), it is found that the average error of point 1# in binocular vision measurement is 0.18 mm, with a maximum error of 0.42 mm and a standard deviation of 0.12. For point 4#, the average error is 0.17 mm, with a maximum error of 0.32 mm and a standard deviation of 0.1. Point 2# has an average error of 0.18 mm, with a maximum error of 0.33 mm and a standard deviation of 0.09. Point 3# has an average error of 0.13 mm, with a maximum error of 0.29 mm and a standard deviation of 0.08. In Figure 15.a) and Figure 15.b), the displacement of the brace decreased as the rotation angle of the structure increased up to 25°, while in Figure 15.c) and Figure 15.d), the displacement of the supporting foot increased. From 25° to the end of the rotation, the displacement of the brace remained stable. According to the weighing test results, the longitudinal eccentricity of pier 2# is 0.067 m, towards the larger span side, and the lateral eccentricity is 0.008 m, towards the outer side of the curve. Point 1# is located on the larger span side, with the maximum displacement of the brace decreasing to -18.71 mm. Point 4# is located on the outer side of the curve, with the maximum displacement of the brace decreasing to -6.42 mm. Point 2# is located on the inner side of the curve, with the maximum displacement increasing to 6.11 mm. Point 3# is located on the smaller span side, with the maximum displacement of the brace increasing to 19.13 mm. When the bridge rotates, the dynamic friction coefficient is much smaller than the static friction coefficient, resulting in a decrease in the friction torque of the spherical hinge, causing the brace to decrease on the eccentric side and increase on the opposite side. In this project, the gap between the brace and the sliding track is 20 mm. When the brace on the larger span side stops descending and comes into contact with the sliding track, it stops descending. At this time, the brace and the spherical hinge jointly bear the self-weight of the structure and the rotational traction force.
By comparing data from binocular vision measurements with total station monitoring (Figure 16), we can conclude that the standard deviation does not exceed 0.12, and this error is close to the error of the weighing test. Since the monitoring of the brace displacement is basically close to the environment of the spherical hinge displacement measurement of the weighing test, the better stability of binocular vision measurement in swivel construction monitoring was shown to be effective through testing.
4. Conclusion
Based on the sub-pixel edge detection method as well as the binocular vision measurement principle, the binocular vision displacement monitoring system was constructed in this study, highly accurate matching and positioning of measurement point marks was achieved, and it was applied to bridge swivel construction brace displacement measurement. The method proposed in this study can be used as an alternative to displacement meter and total station measurement methods in bridge swivel construction, the problem of complex sensor installation and easy damage is solved in brace displacement measurement. The main findings are as follows:
(1) According to the actual engineering weighing test measurement environment, MATLAB calibration toolbox was used for camera calibration, and the OpenCV computer vision library for the Python platform was called, within 10m measuring distance, the average error of the binocular vision measurement system can be controlled to within 0.46 mm. The field weighing test requirements are met, the validity of the binocular vision measurement system and its feasibility in weighing tests were verified.
(2) Combined with monitoring data in a swivel construction interchange project, the binocular vision system was compared and analyzed with the traditional displacement meter and total station. Results showed that force versus displacement variation plots were obtained by binocular visual measurement in the weighing test, the inflection point can be clearly distinguished, and the position of the inflection point is the same as that of the displacement meter, binocular vision measurements are consistent with displacement meter test results; monitoring data of binocular vision measurement and total station were compared and analyzed in the bridge swivel process, the average error is no more than 0.18 mm, the maximum error is no more than 0.42 mm, and the standard deviation is no more than 0.12, the better stability of binocular vision measurement is demonstrated in the monitoring of swivel construction.
For the actual bridge swivel weighing test and the monitoring of the brace displacement during the swivel process, the method proposed in this study was verified to be feasible. The problem of complex sensor installation and easy damage is solved in brace displacement measurement, equipment and labor costs can be effectively saved, and monitoring requirements are met. It can be used as a reference for similar swivel projects and the promotion and application of this technology.
References
- Su, M.; Wang, J.; Peng, H.; Cai, C.S.; Dai, G.L. State-of-the-art review of the development and application of bridge rotation construction methods in China. Sci. China-Technol. Sci. 2021, 64, 1137–1152. [Google Scholar] [CrossRef]
- Liu, T.; Fan, J.F.; Peng, Z.Q. Central Load-Bearing Control in the Construction Process of the Concrete Spherical Joint Nandu River Swing Bridge: A Case Study. Buildings-Basel 2022, 12, 17. [Google Scholar] [CrossRef]
- Shao, J.H.; Duan, M.J.; Yang, W.; Li, Y.Z. Research on the critical technique of synchronous rotation construction with large angle for T-shape curve rigid frame bridge. Sci Rep 2022, 12, 16. [Google Scholar] [CrossRef]
- Garg, P.; Moreu, F.; Ozdagli, A.; Taha, M.R.; Mascarenas, D. Noncontact Dynamic Displacement Measurement of Structures Using a Moving Laser Doppler Vibrometer. J. Bridge Eng. 2019, 24, 13. [Google Scholar] [CrossRef]
- Zhang, G.W.; Wu, Y.L.; Zhao, W.J.; Zhang, J. Radar-based multipoint displacement measurements of a 1200-m-long suspension bridge. ISPRS-J. Photogramm. Remote Sens. 2020, 167, 71–84. [Google Scholar] [CrossRef]
- Kohut, P.; Holak, K.; Uhl, T.; Ortyl, L.; Owerko, T.; Kuras, P.; Kocierz, R. Monitoring of a civil structure’s state based on noncontact measurements. Struct. Health Monit. 2013, 12, 411–429. [Google Scholar] [CrossRef]
- Gentile, C.; Bernardini, G. An interferometric radar for non-contact measurement of deflections on civil engineering structures: laboratory and full-scale tests. Struct. Infrastruct. Eng. 2010, 6, 521–534. [Google Scholar] [CrossRef]
- Wu, S.; Qian, J.J.I.C.S.E.; Science, E. Study on The Technical Plan of Continuous Beam Rotation Construction Monitoring and Early Warning. 2021, 804, 022075 (022078pp). [CrossRef]
- Ye, X.W.; Ni, Y.Q.; Wai, T.T.; Wong, K.Y.; Zhang, X.M.; Xu, F. A vision-based system for dynamic displacement measurement of long-span bridges: algorithm and verification. Smart. Struct. Syst. 2013, 12, 363–379. [Google Scholar] [CrossRef]
- Li, H.Z.; Zhang, B.J. Application of integrated binocular stereo vision measurement and wireless sensor system in athlete displacement test. Alex. Eng. J. 2021, 60, 4325–4335. [Google Scholar] [CrossRef]
- Hu, Q.J.; Feng, Z.Y.; He, L.P.; Shou, Z.H.; Zeng, J.S.; Tan, J.; Bai, Y.; Cai, Q.J.; Gu, Y.C. Accuracy Improvement of Binocular Vision Measurement System for Slope Deformation Monitoring. Sensors 2020, 20, 19. [Google Scholar] [CrossRef]
- Guo, N.; Zhao, Q.K.; Fan, H.W.; Yu, H.M.; Cui, X.W.; Lv, M.; Li, T.T. Binocular stereo vision calibration based on accurate ellipse detection algorithm of direct calculation and grating conversion check. Optik 2021, 242, 14. [Google Scholar] [CrossRef]
- Zhang, T.; Liu, J.H.; Liu, S.L.; Tang, C.T.; Jin, P. A 3D reconstruction method for pipeline inspection based on multi-vision. Measurement 2017, 98, 35–48. [Google Scholar] [CrossRef]
- Fukuda, Y.; Feng, M.Q.; Shinozuka, M. Cost-effective vision-based system for monitoring dynamic response of civil engineering structures. Struct. Control. Health Monit. 2010, 17, 918–936. [Google Scholar] [CrossRef]
- Santos, C.A.; Costa, C.O.; Batista, J.P.J.S. Long Deck Suspension Bridge Monitoring: The Vision System Calibration Problem. 2012, 48, 108-123. [CrossRef]
- Wang, J.; Wang, X.J.; Liu, F.; Gong, Y.; Wang, H.H.; Qin, Z. Modeling of binocular stereo vision for remote coordinate measurement and fast calibration. Opt. Lasers Eng. 2014, 54, 269–274. [Google Scholar] [CrossRef]
- Zhang, E.S.; Wang, S.B. Plane-Space Algorithm Based on Binocular Stereo vision With Its Estimation of Range and Measurement Boundary. IEEE Access 2018, 6, 62450–62457. [Google Scholar] [CrossRef]
- Shao, M.W.; Wang, P.; Wang, Y.J. Phase-Based Calibration Method for a Binocular Vision Sensor. IEEE Access 2021, 9, 44354–44362. [Google Scholar] [CrossRef]
- Wang, C.; Xiao, T.; Gong, Z.Q.; Yang, S.T.; Zhang, D.L.; Deng, F. Wireless Binocular Stereovision Measurement System Based on Improved Coarse-to-Fine Matching Algorithm. Struct. Control. Health Monit. 2023, 2023, 19. [Google Scholar] [CrossRef]
- Zheng, H.; Duan, F.J.; Fu, X.; Liu, C.W.; Li, T.Y.; Yan, M. A non-coplanar high-precision calibration method for cameras based on an affine coordinate correction model. Meas. Sci. Technol. 2023, 34, 22. [Google Scholar] [CrossRef]
- Dong, C.Z.; Ye, X.W.; Jin, T. Identification of structural dynamic characteristics based on machine vision technology. Measurement 2018, 126, 405–416. [Google Scholar] [CrossRef]
- Busca, G.; Cigada, A.; Mazzoleni, P.; Zappa, E. Vibration Monitoring of Multiple Bridge Points by Means of a Unique Vision-Based Measuring System. Exp. Mech. 2014, 54, 255–271. [Google Scholar] [CrossRef]
- Feng, M.Q.; Fukuda, Y.; Feng, D.M.; Mizuta, M. Nontarget Vision Sensor for Remote Measurement of Bridge Dynamic Response. J. Bridge Eng. 2015, 20, 12. [Google Scholar] [CrossRef]
- Shan, B.H.; Yan, Y.; Wang, H.; Yang, Y. Stereovision-based surface flaws detection experiment of foundations of Yiqiao Bridge. Adv. Mech. Eng. 2017, 9, 14. [Google Scholar] [CrossRef]
- Deng, H.X.; Wang, J.; Zhang, J.; Liang, C.J.; Ma, M.C.; Zhong, X.; Yu, L.D. A stereovision measurement for large deformation of light structures. Measurement 2019, 136, 387–394. [Google Scholar] [CrossRef]
- Sun, X.Y.; Wu, H.Z.; Wu, Y. Vibration monitoring of an open-type one-way tensioned membrane structure based on stereovision. Rev. Sci. Instrum. 2019, 90, 18. [Google Scholar] [CrossRef]
- Sun, X.Y.; Wu, H.Z.; Shan, B.H. Application of stereovision on a saddle-shaped membrane structure in aero-elastic wind tunnel test. Rev. Sci. Instrum. 2020, 91, 14. [Google Scholar] [CrossRef]
- Shao, Y.D.; Li, L.; Li, J.; An, S.J.; Hao, H. Computer vision based target-free 3D vibration displacement measurement of structures. Eng. Struct. 2021, 246, 16. [Google Scholar] [CrossRef]
- Wu, L.J.; Cai, Z.W.; Lin, C.H.; Chen, Z.C.; Cheng, S.Y.; Lin, P.J. Investigation of the super-resolution methods for vision based structural measurement. Smart. Struct. Syst. 2022, 30, 287–301. [Google Scholar] [CrossRef]
- Feng, W.W.; Zhang, S.Q.; Liu, H.B.; Yu, Q.F.; Wu, S.; Zhang, D.S. Unmanned aerial vehicle-aided stereo camera calibration for outdoor applications. Opt. Eng. 2020, 59, 14. [Google Scholar] [CrossRef]
- Cai, B.L.; Wang, Y.W.; Wu, J.J.; Wang, M.Y.; Li, F.; Ma, M.C.; Chen, X.C.; Wang, K.Y. An effective method for camera calibration in defocus scene with circular gratings. Opt. Lasers Eng. 2019, 114, 44–49. [Google Scholar] [CrossRef]
- Fang, J.Z.; Xu, S.X.; Yang, Y.; Wang, Y. Localization and measurement method of continuous casting slab model based on binocular vision. Microw. Opt. Technol. Lett. 2020, 62, 53–59. [Google Scholar] [CrossRef]
- Tang, Y.C.; Li, L.J.; Feng, W.X.; Liu, F.; Zou, X.J.; Chen, M.Y. Binocular vision measurement and its application in full-field convex deformation of concrete-filled steel tubular columns. Measurement 2018, 130, 372–383. [Google Scholar] [CrossRef]
- Yao, Z.J.; Yi, W.D. Curvature aided Hough transform for circle detection. Expert Syst. Appl. 2016, 51, 26–33. [Google Scholar] [CrossRef]
- He, L.P.; Tan, J.; Hu, Q.J.; He, S.S.; Cai, Q.J.; Fu, Y.T.; Tang, S. Non-Contact Measurement of the Surface Displacement of a Slope Based on a Smart Binocular Vision System. Sensors 2018, 18, 18. [Google Scholar] [CrossRef]
- Huang, Q.; Liu, J.L. Practical limitations of lane detection algorithm based on Hough transform in challenging scenarios. Int. J. Adv. Robot. Syst. 2021, 18, 13. [Google Scholar] [CrossRef]
- Hu, H.B.; Zheng, X.P.; Yin, J.J.; Wang, Y.Y. Research on O-ring Dimension Measurement Algorithm Based on Cubic Spline Interpolation. Appl. Sci.-Basel 2021, 11, 16. [Google Scholar] [CrossRef]
- Han, Y.; Chu, Z.N.; Zhao, K. Target positioning method in binocular vision manipulator control based on improved canny operator. Multimed. Tools Appl. 2020, 79, 9599–9614. [Google Scholar] [CrossRef]
- Xie, X.; Ge, S.L.; Xie, M.Y.; Hu, F.P.; Jiang, N. An improved industrial sub-pixel edge detection algorithm based on coarse and precise location. J. Ambient Intell. Humaniz. Comput. 2020, 11, 2061–2070. [Google Scholar] [CrossRef]
- Zhao, L. Motion Track Enhancement Method of Sports Video Image Based on OTSU Algorithm. Wirel. Commun. Mob. Comput. 2022, 2022, 10. [Google Scholar] [CrossRef]
- Zhang, S.F.; Li, B.; Ren, F.J.; Dong, R. High-Precision Measurement of Binocular Telecentric Vision System With Novel Calibration and Matching Methods. IEEE Access 2019, 7, 54682–54692. [Google Scholar] [CrossRef]
- Chen, L.; Zhong, G.W.; Han, Z.; Li, Q.W.; Wang, Y.J.; Pan, H.H. Binocular visual dimension measurement method for rectangular workpiece with a precise stereoscopic matching algorithm. Meas. Sci. Technol. 2023, 34, 13. [Google Scholar] [CrossRef]
- Gao, G.H.; Wang, S.Y.; Shuai, C.Y. Optimization of greenhouse tomato localization in overlapping areas. Alex. Eng. J. 2023, 66, 107–121. [Google Scholar] [CrossRef]
Figure 1.
Binocular vision measurement model.
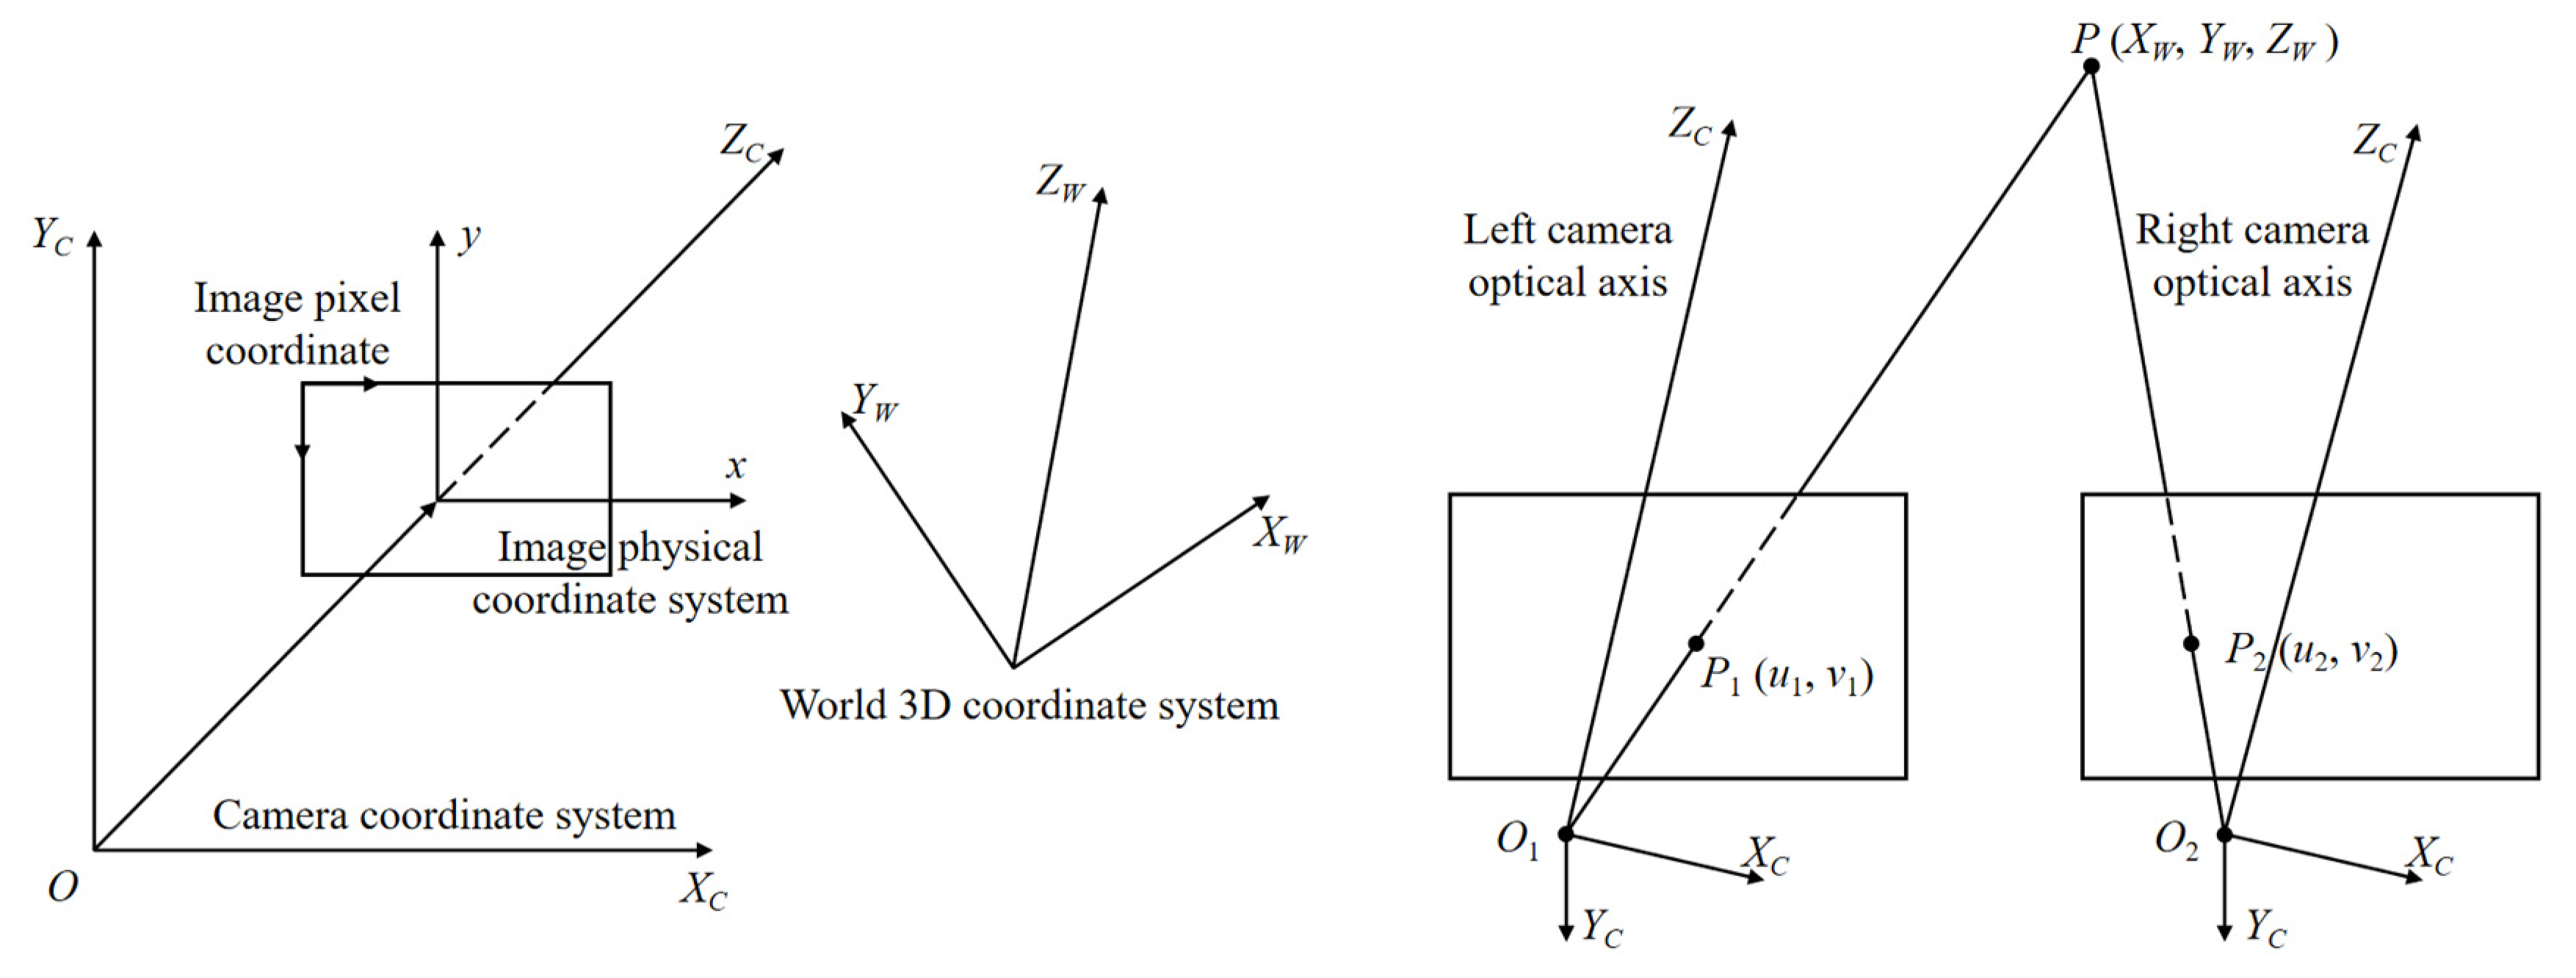
Figure 2.
Measurement equipment.
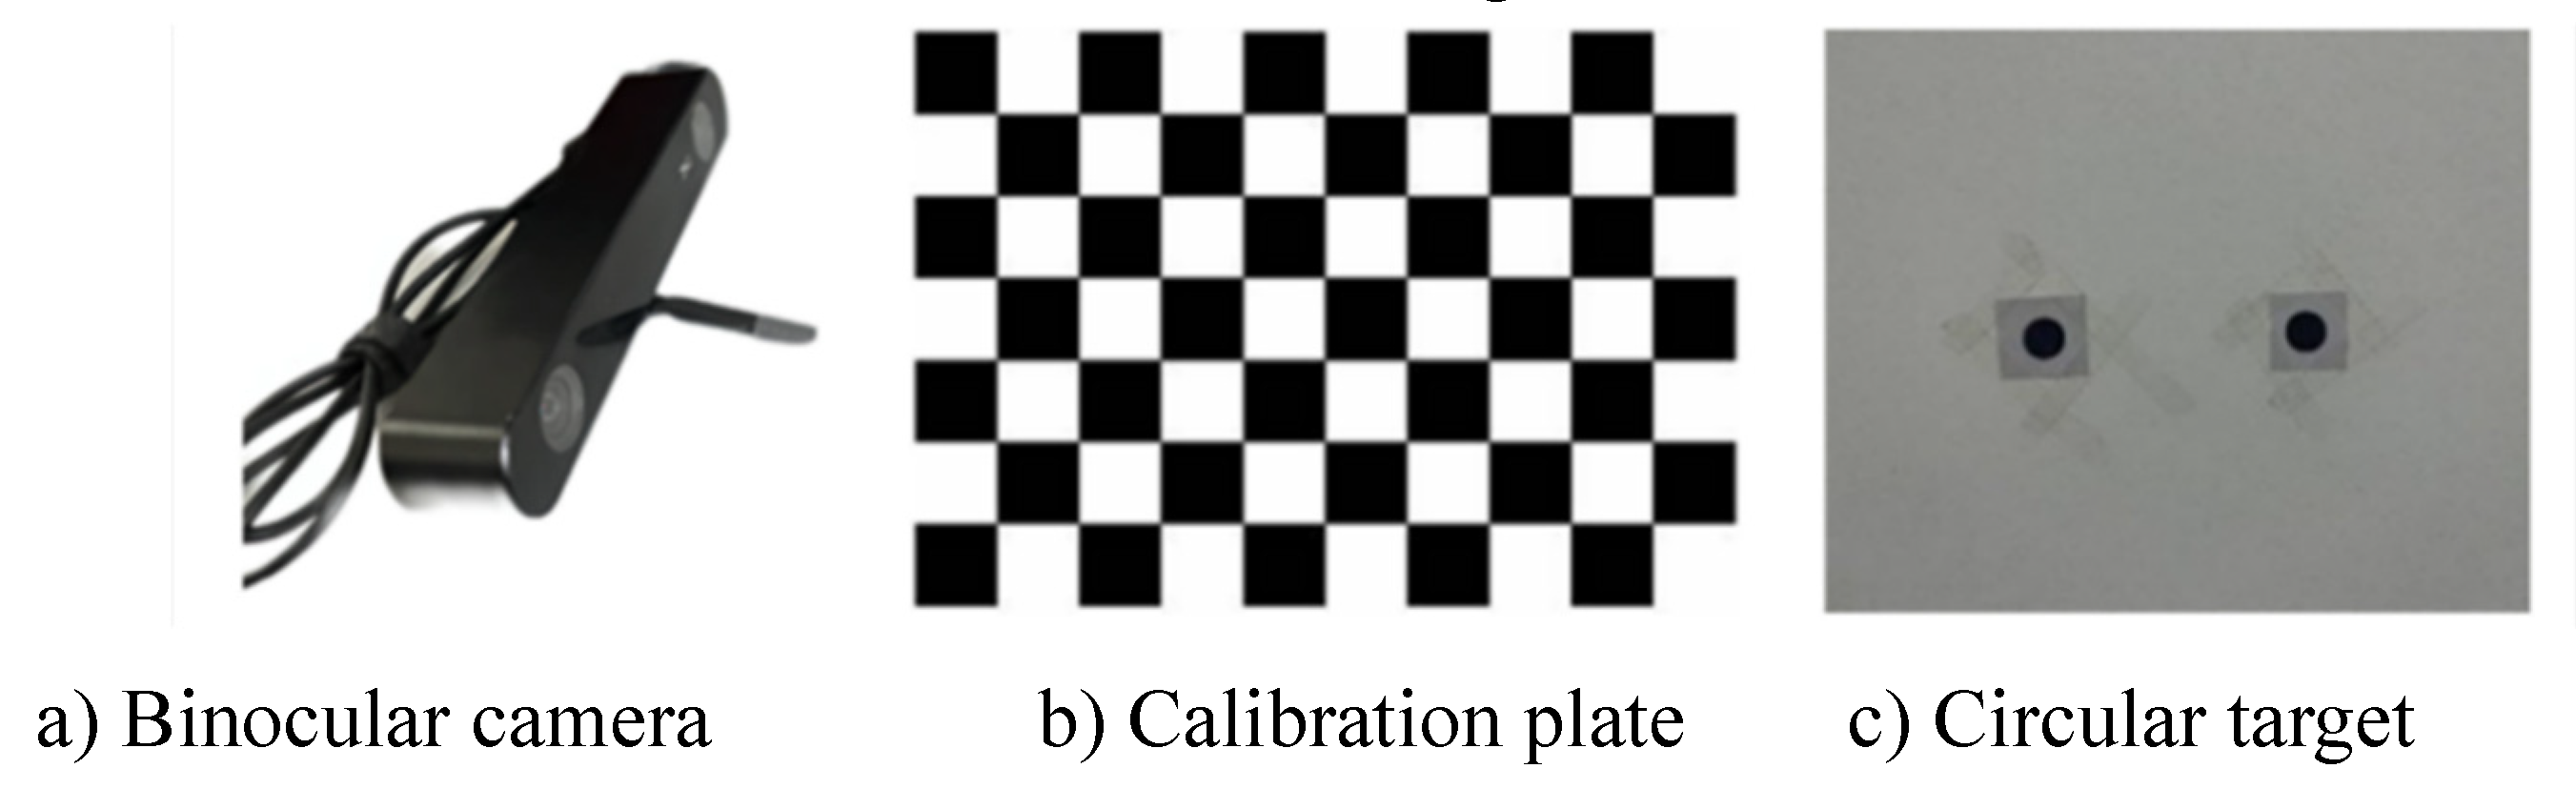
Figure 3.
Binocular vision measurement procedure.
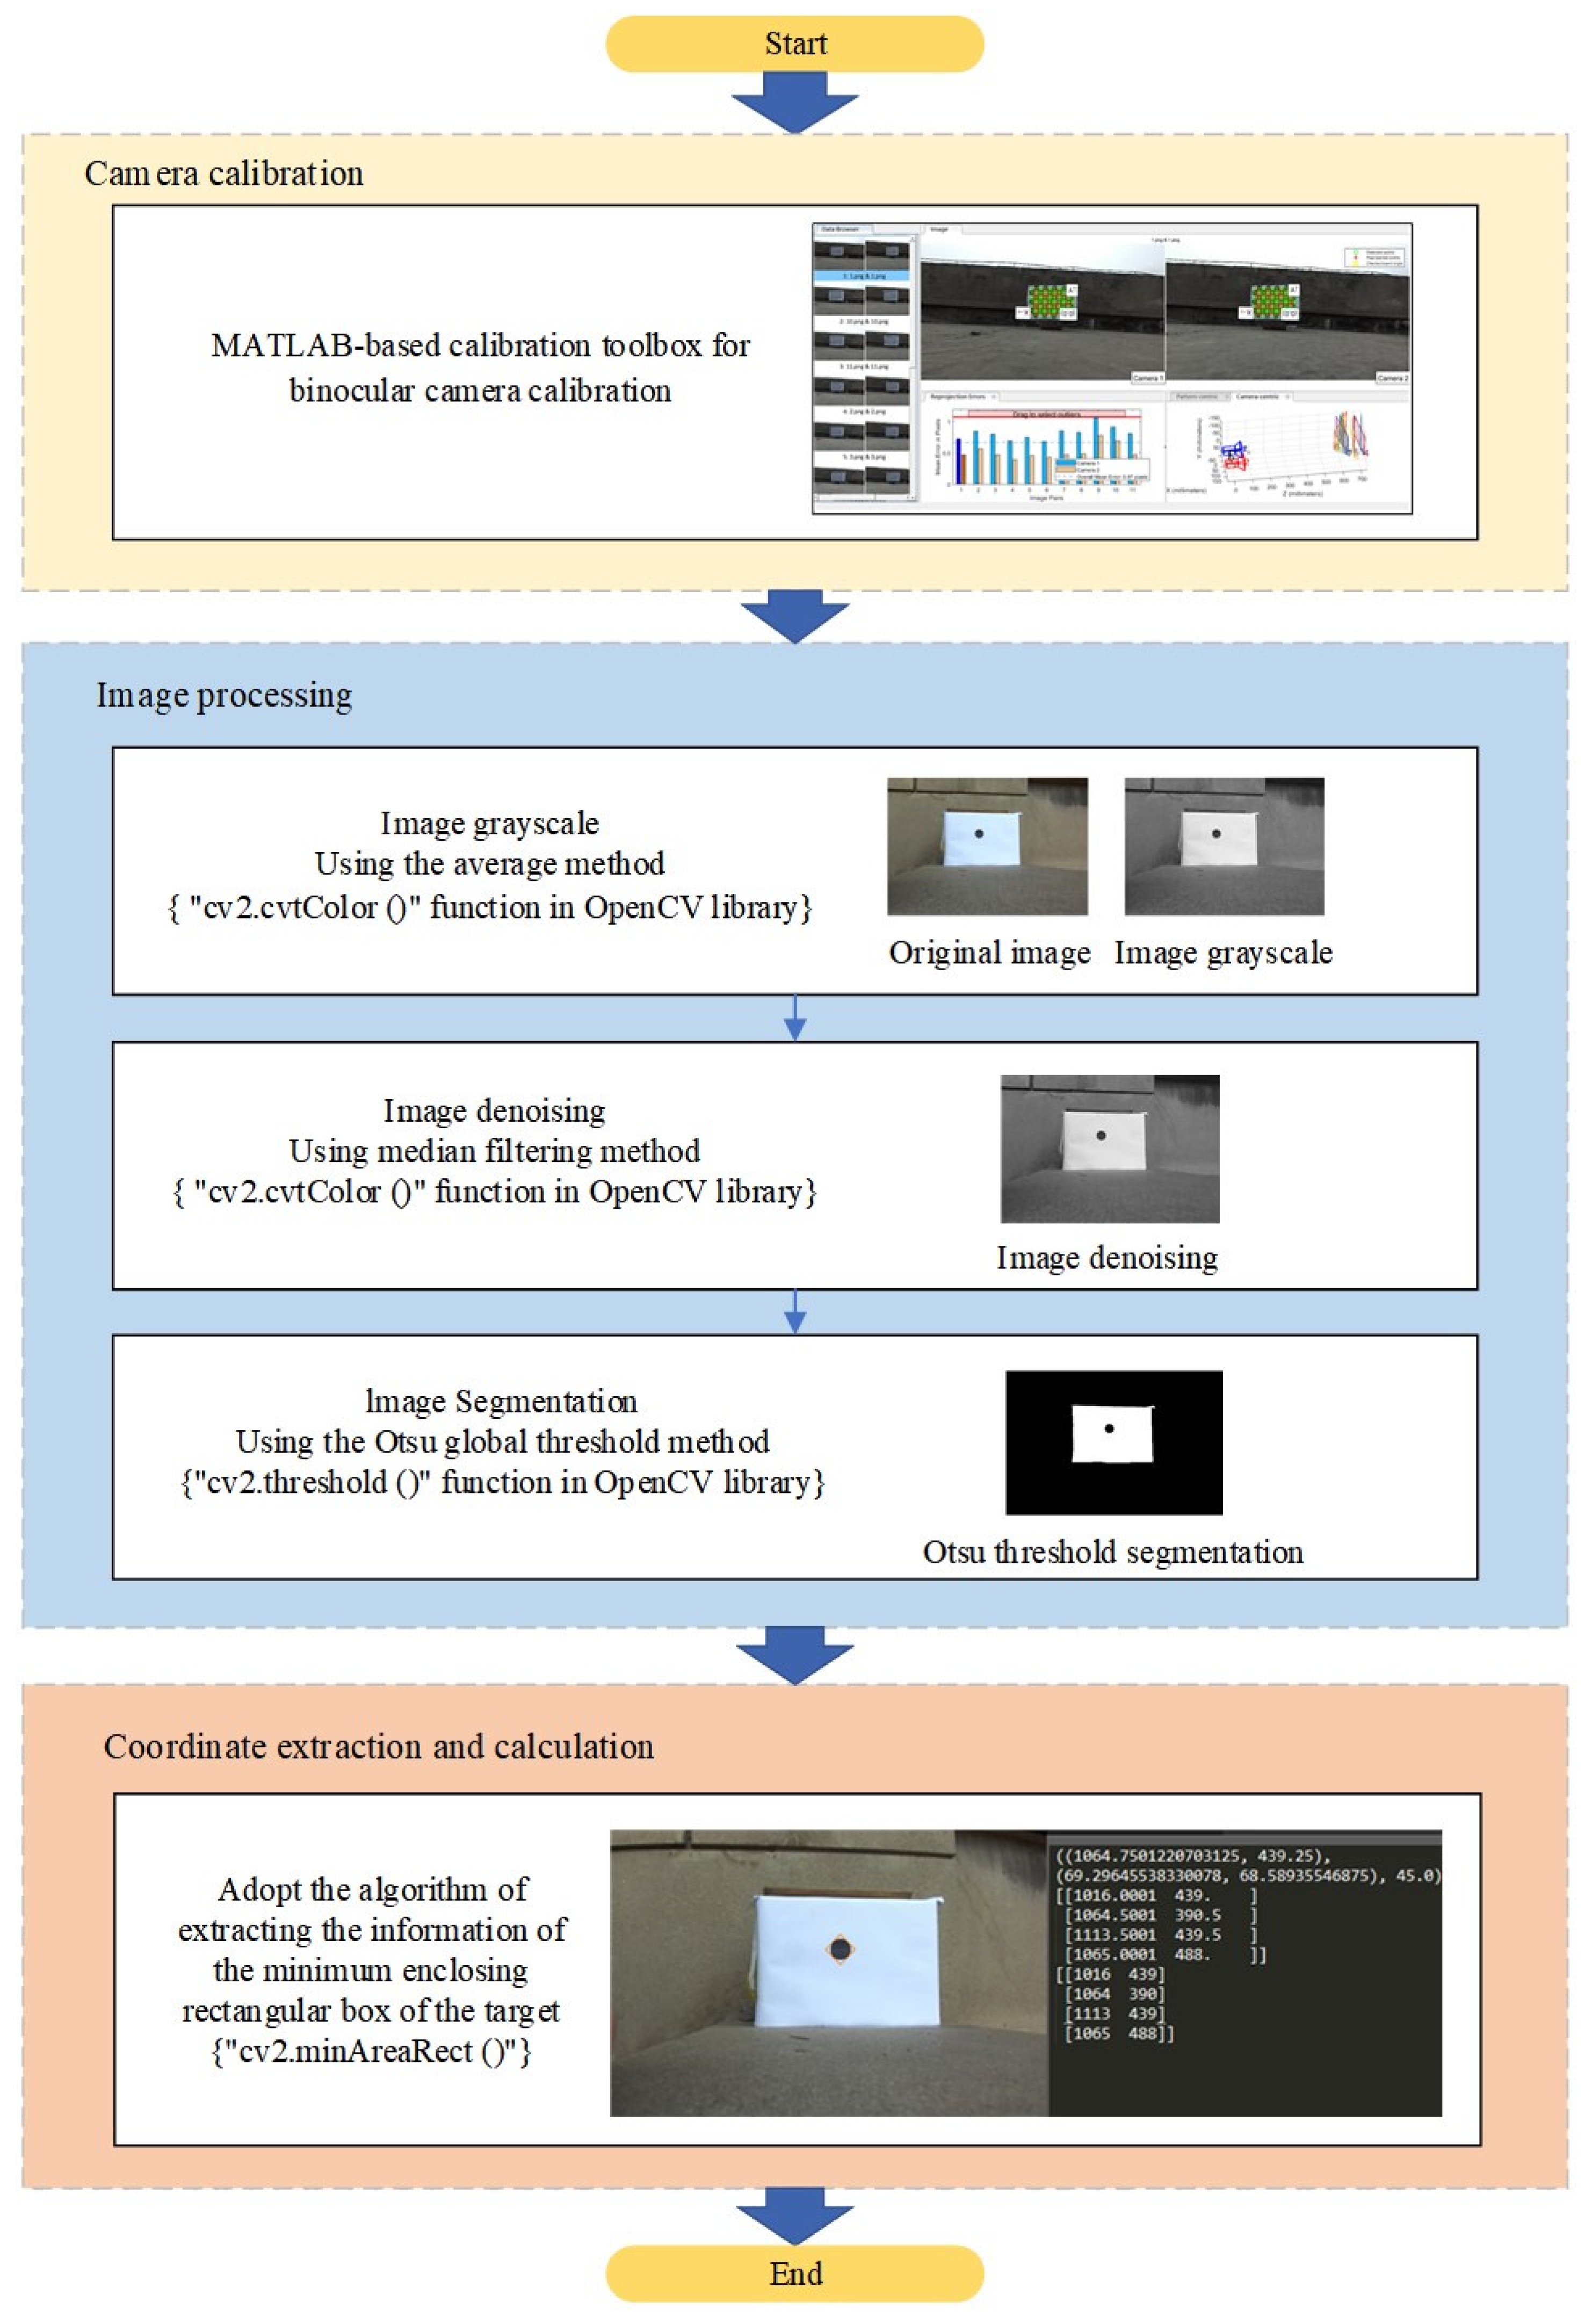
Figure 4.
Actual photo of the site of the rotating bridge.
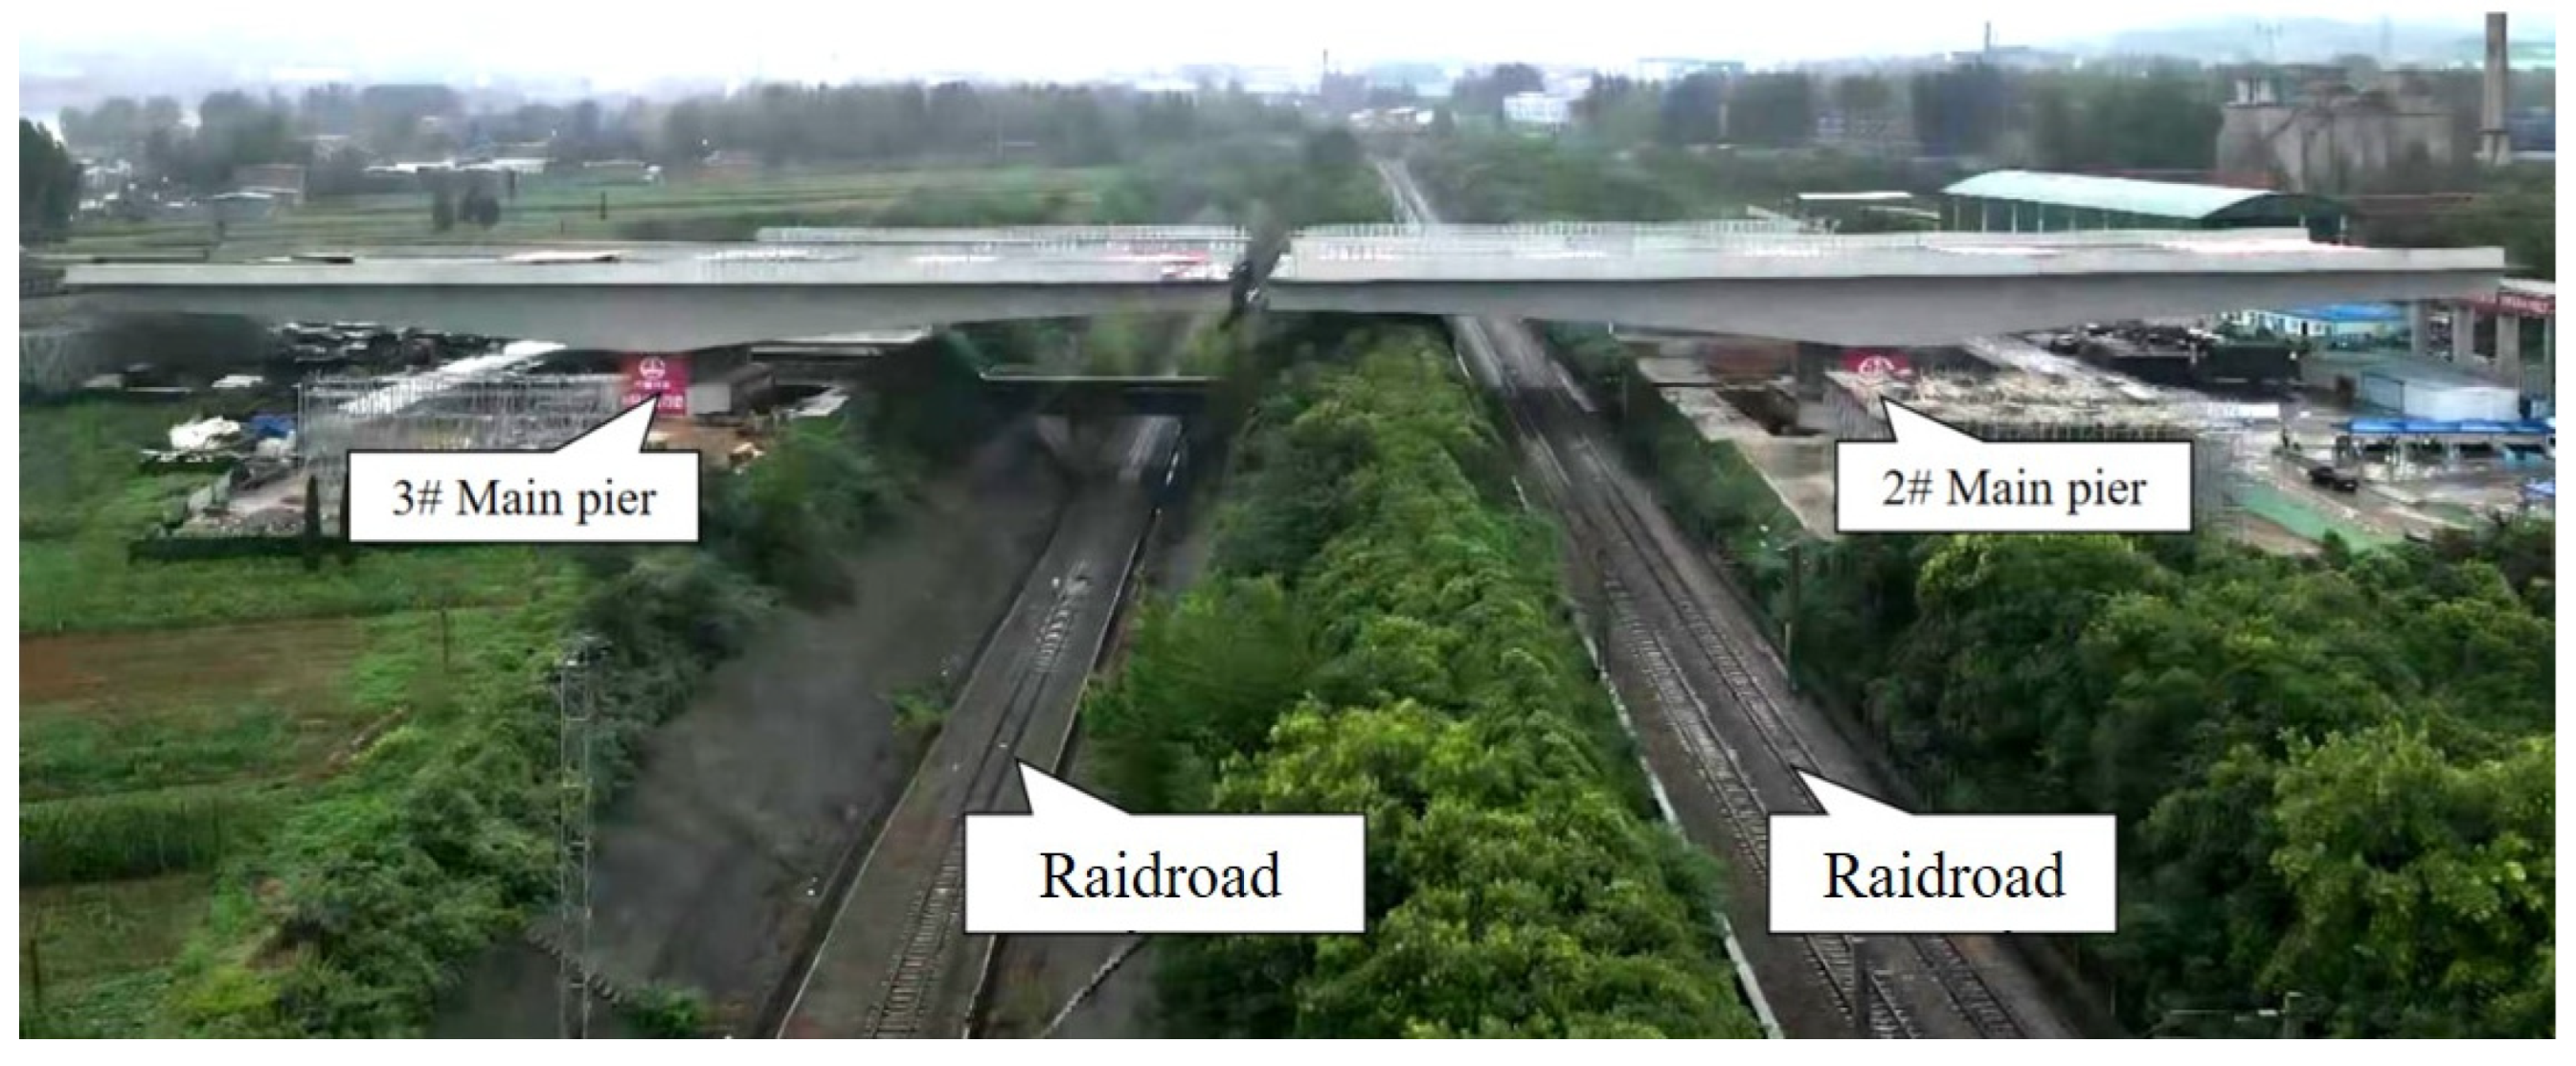
Figure 5.
Transition system deployment.
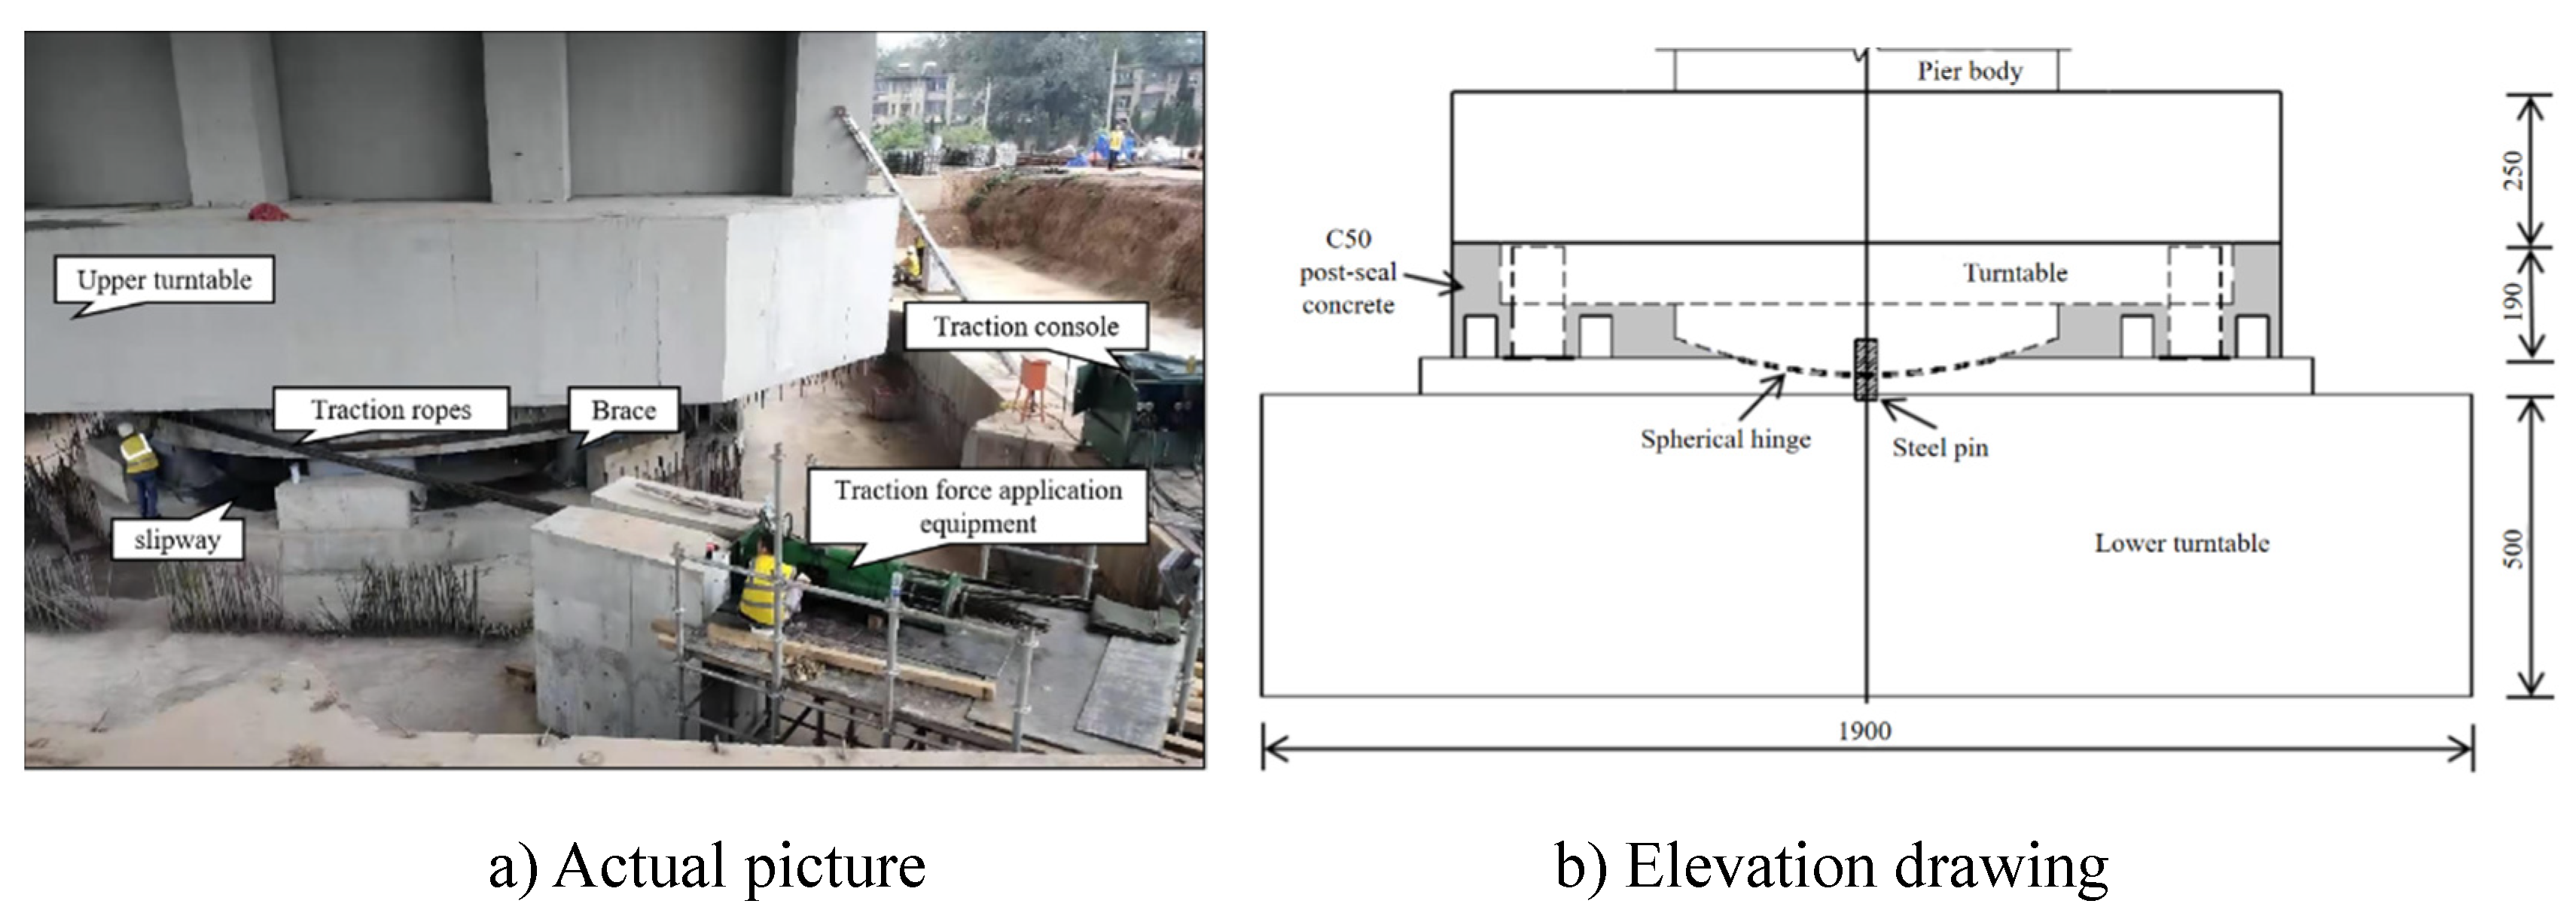
Figure 6.
System test environment deployment.
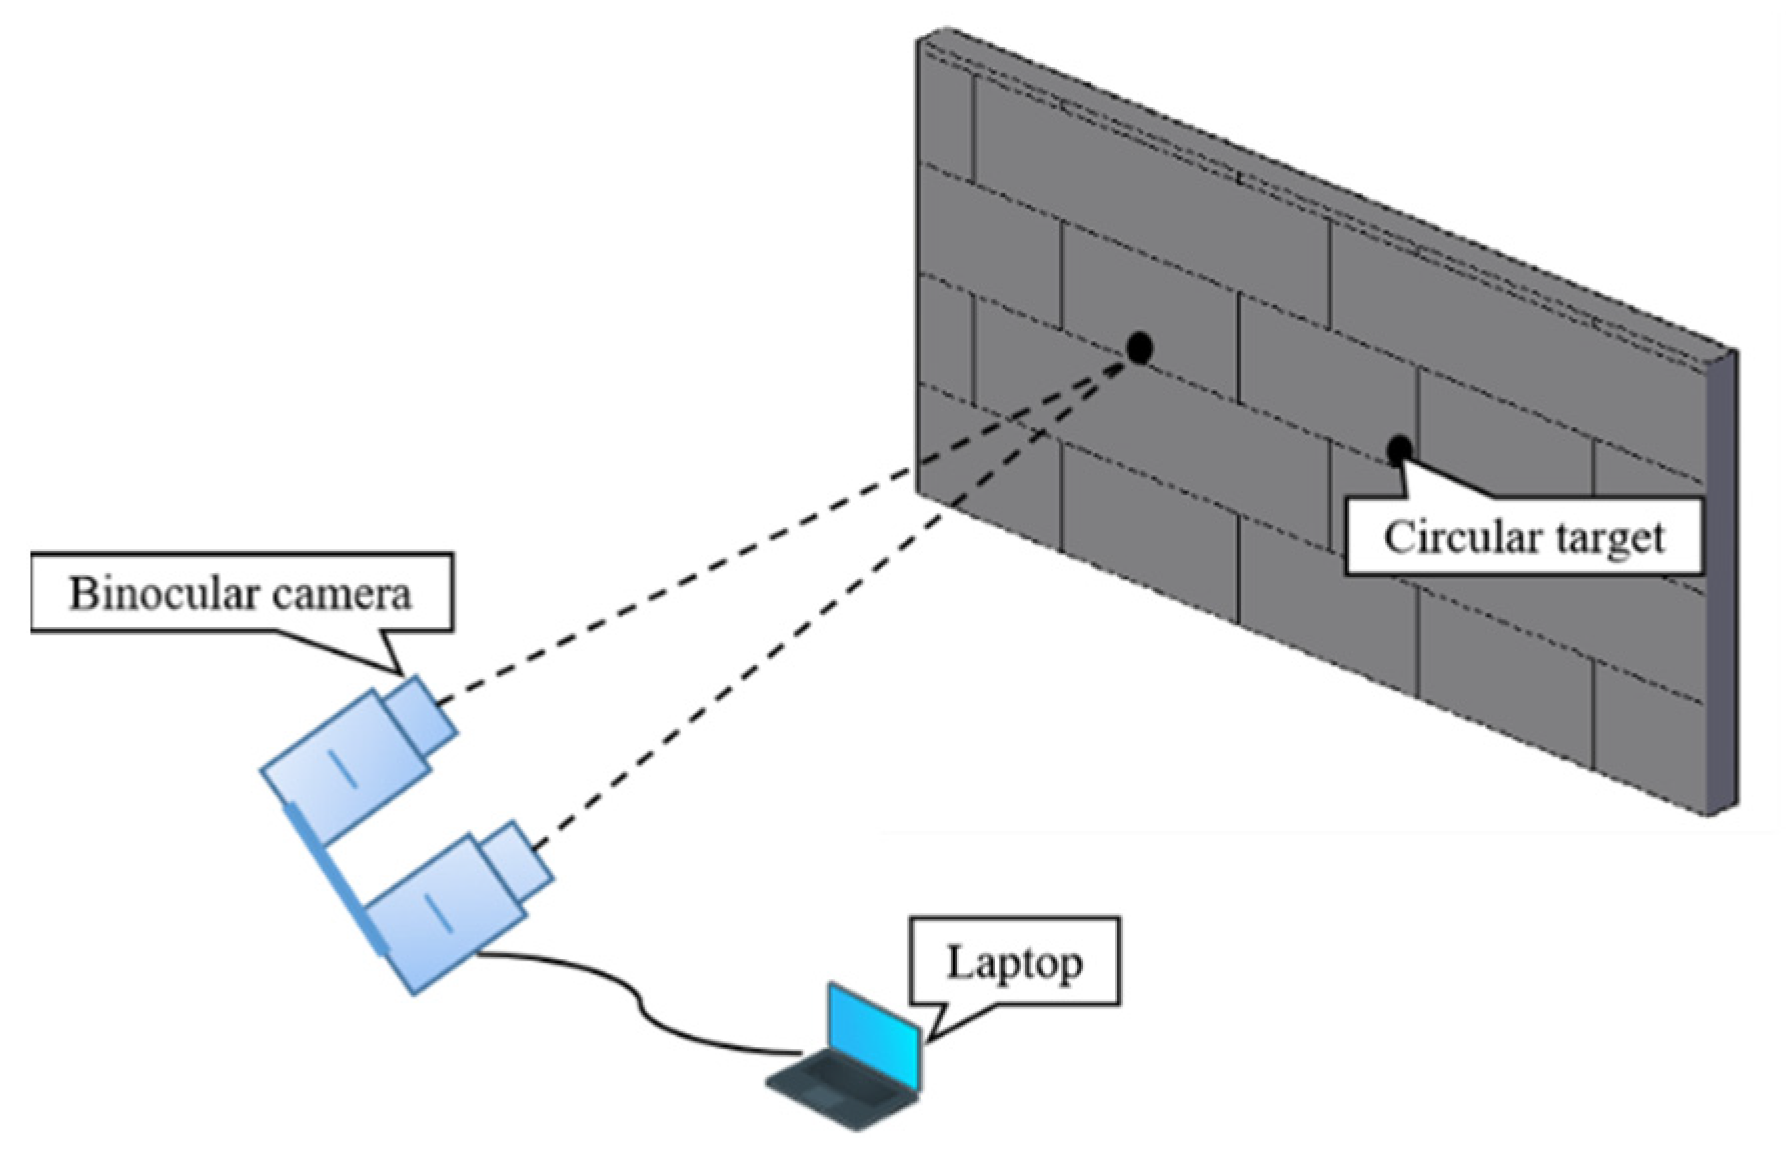
Figure 7.
Test data of binocular vision measurement procedure.
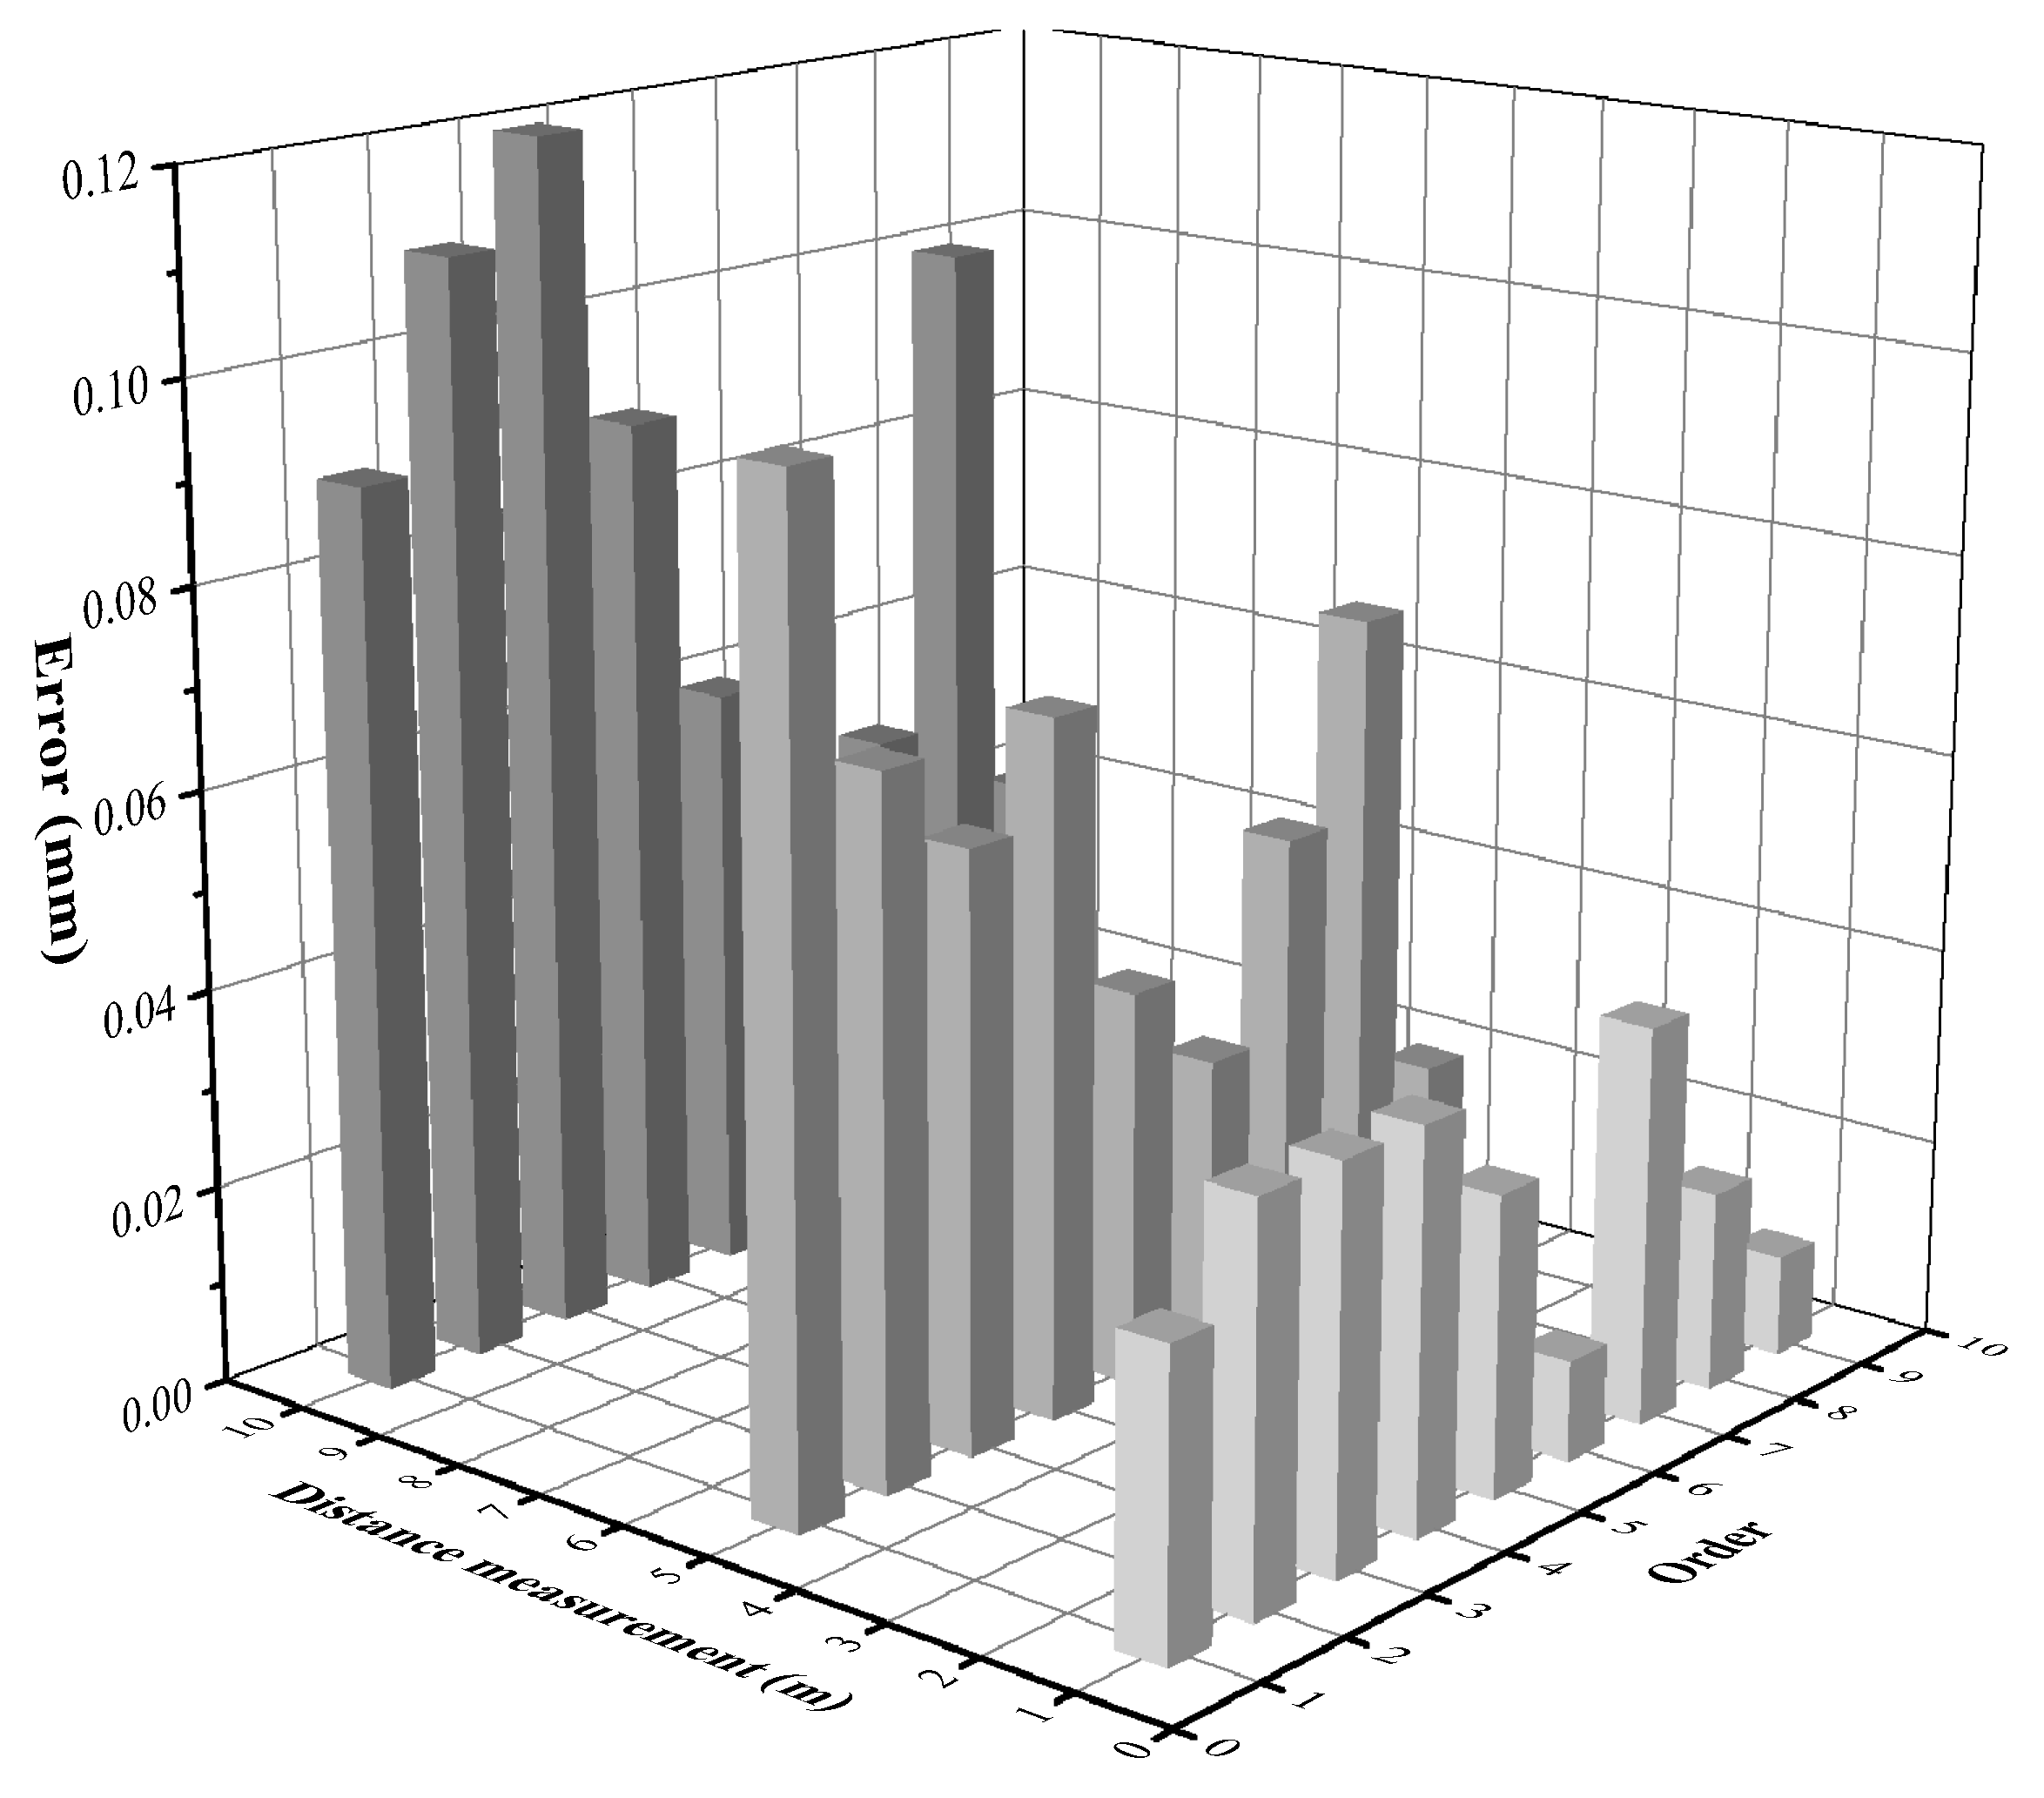
Figure 8.
Error analysis graph of test data.
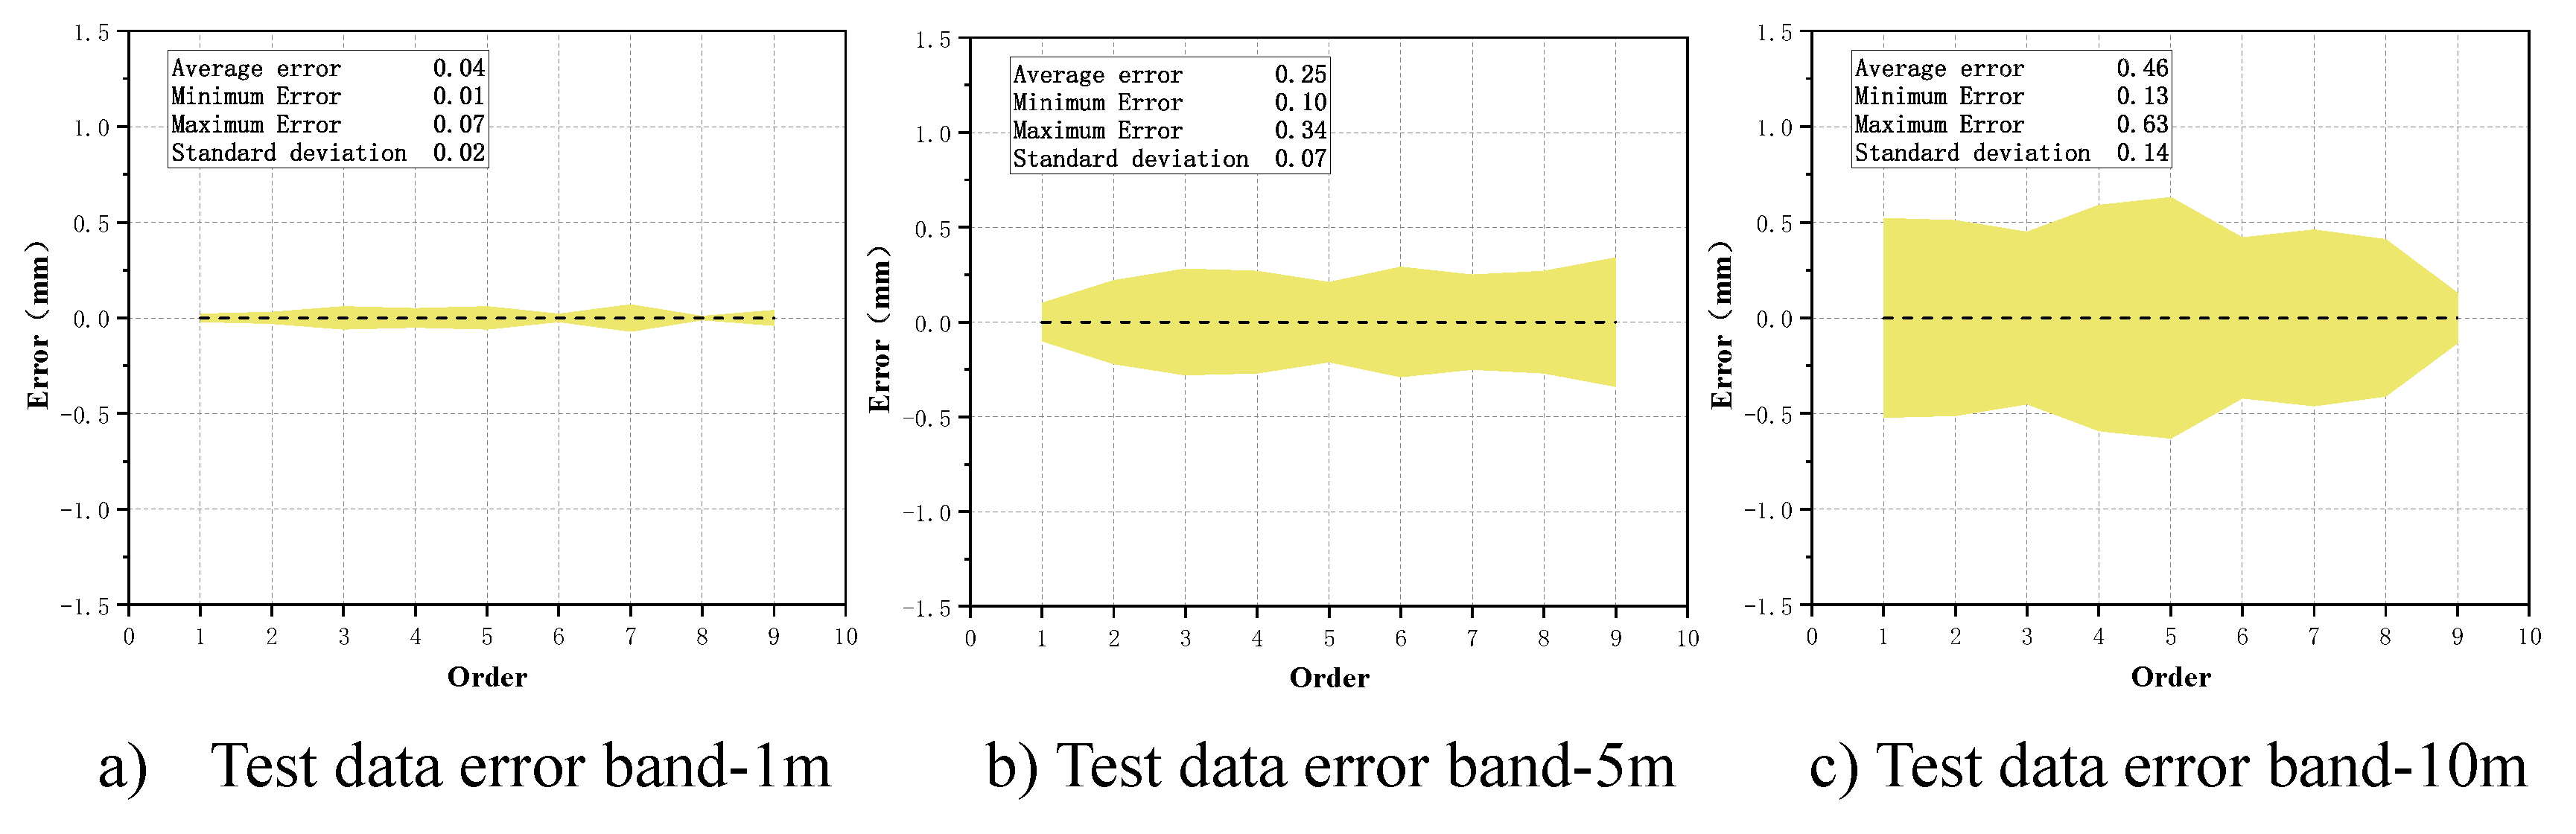
Figure 9.
Binocular vision measurement system deployment.
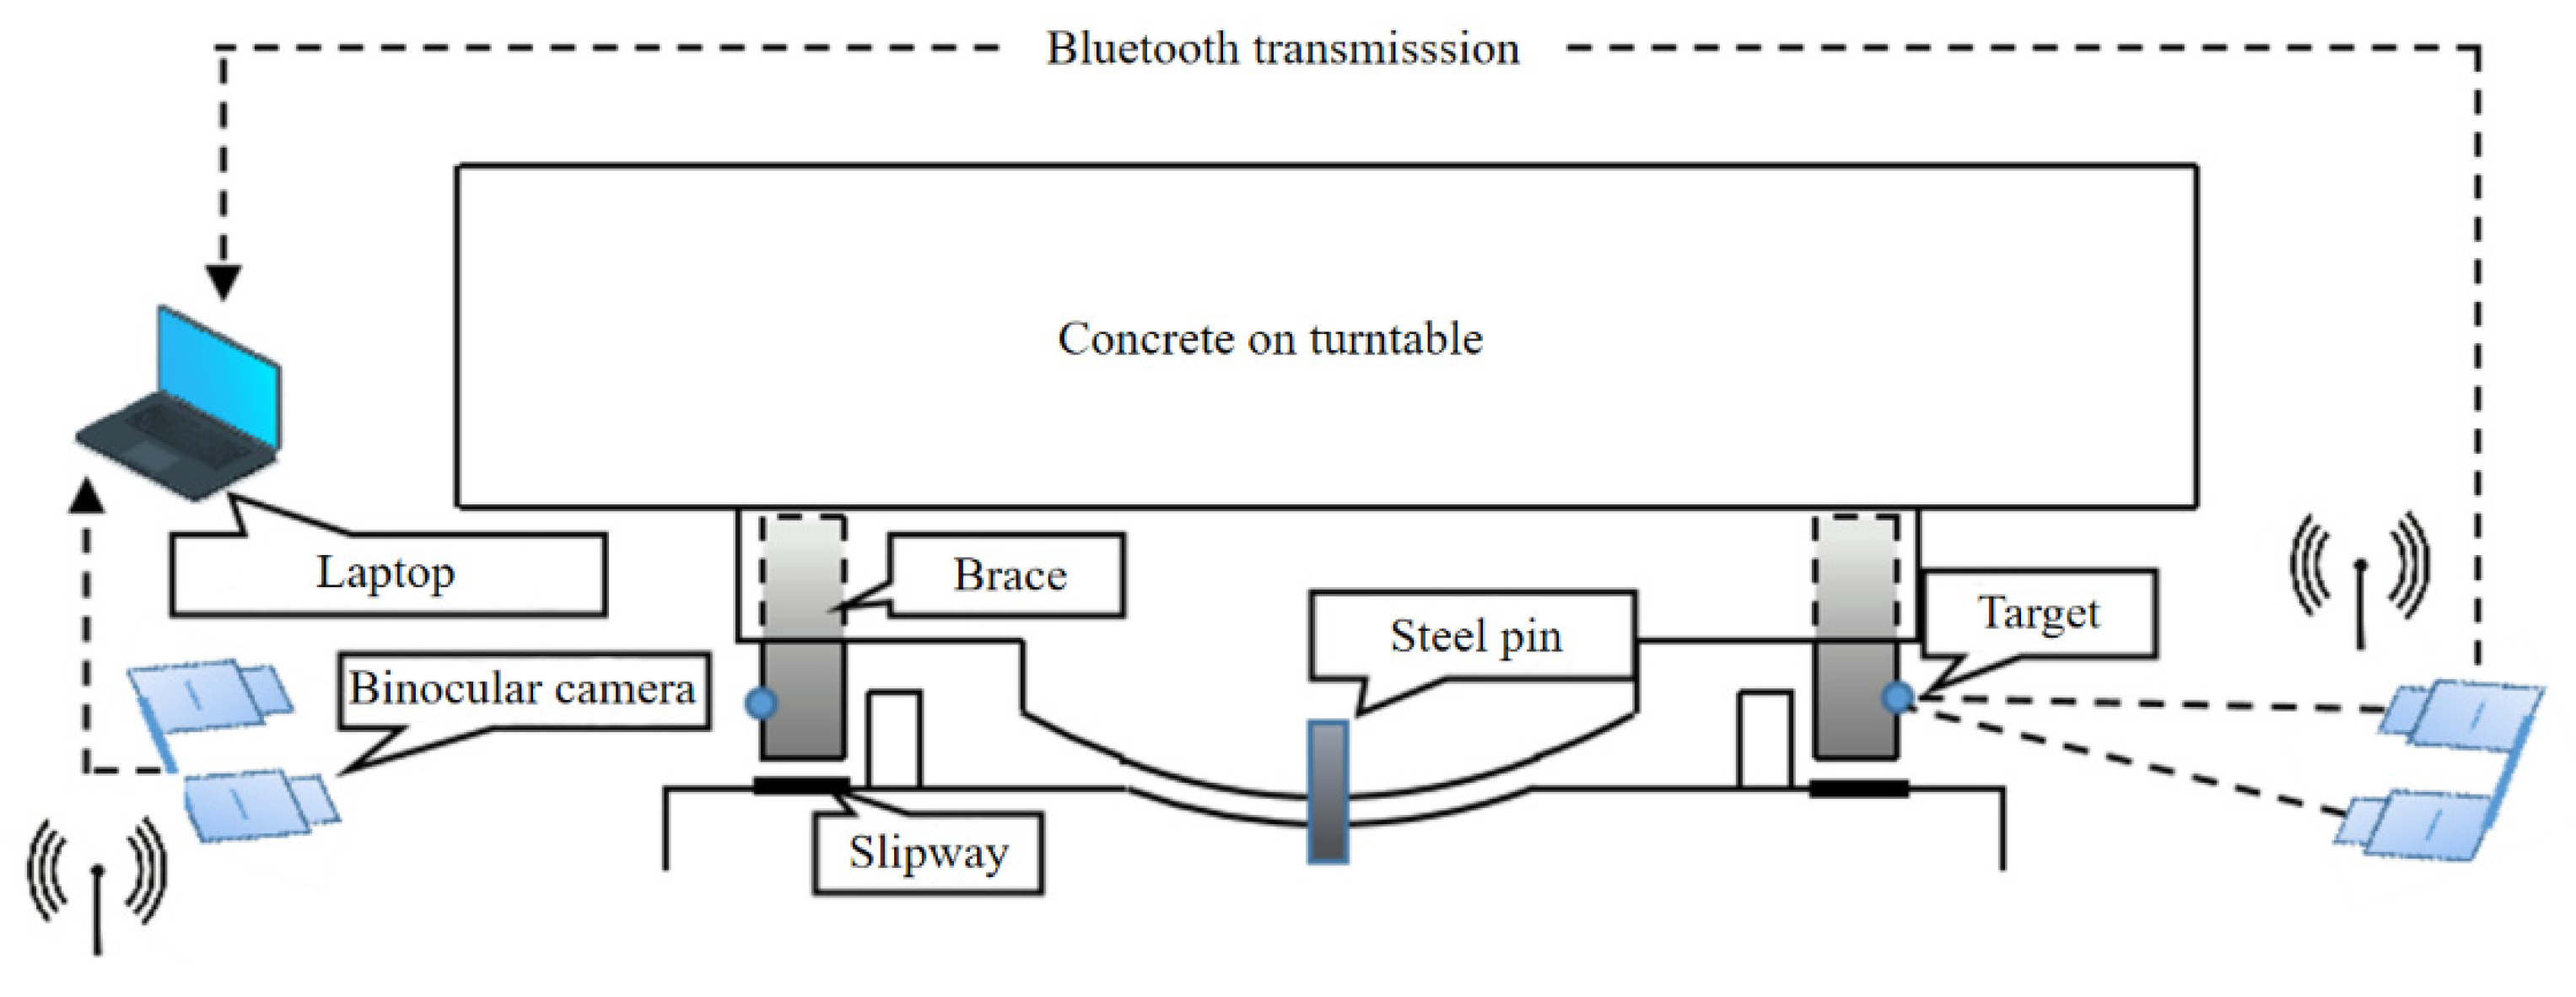
Figure 10.
Deployment plan of binocular vision measurement system.
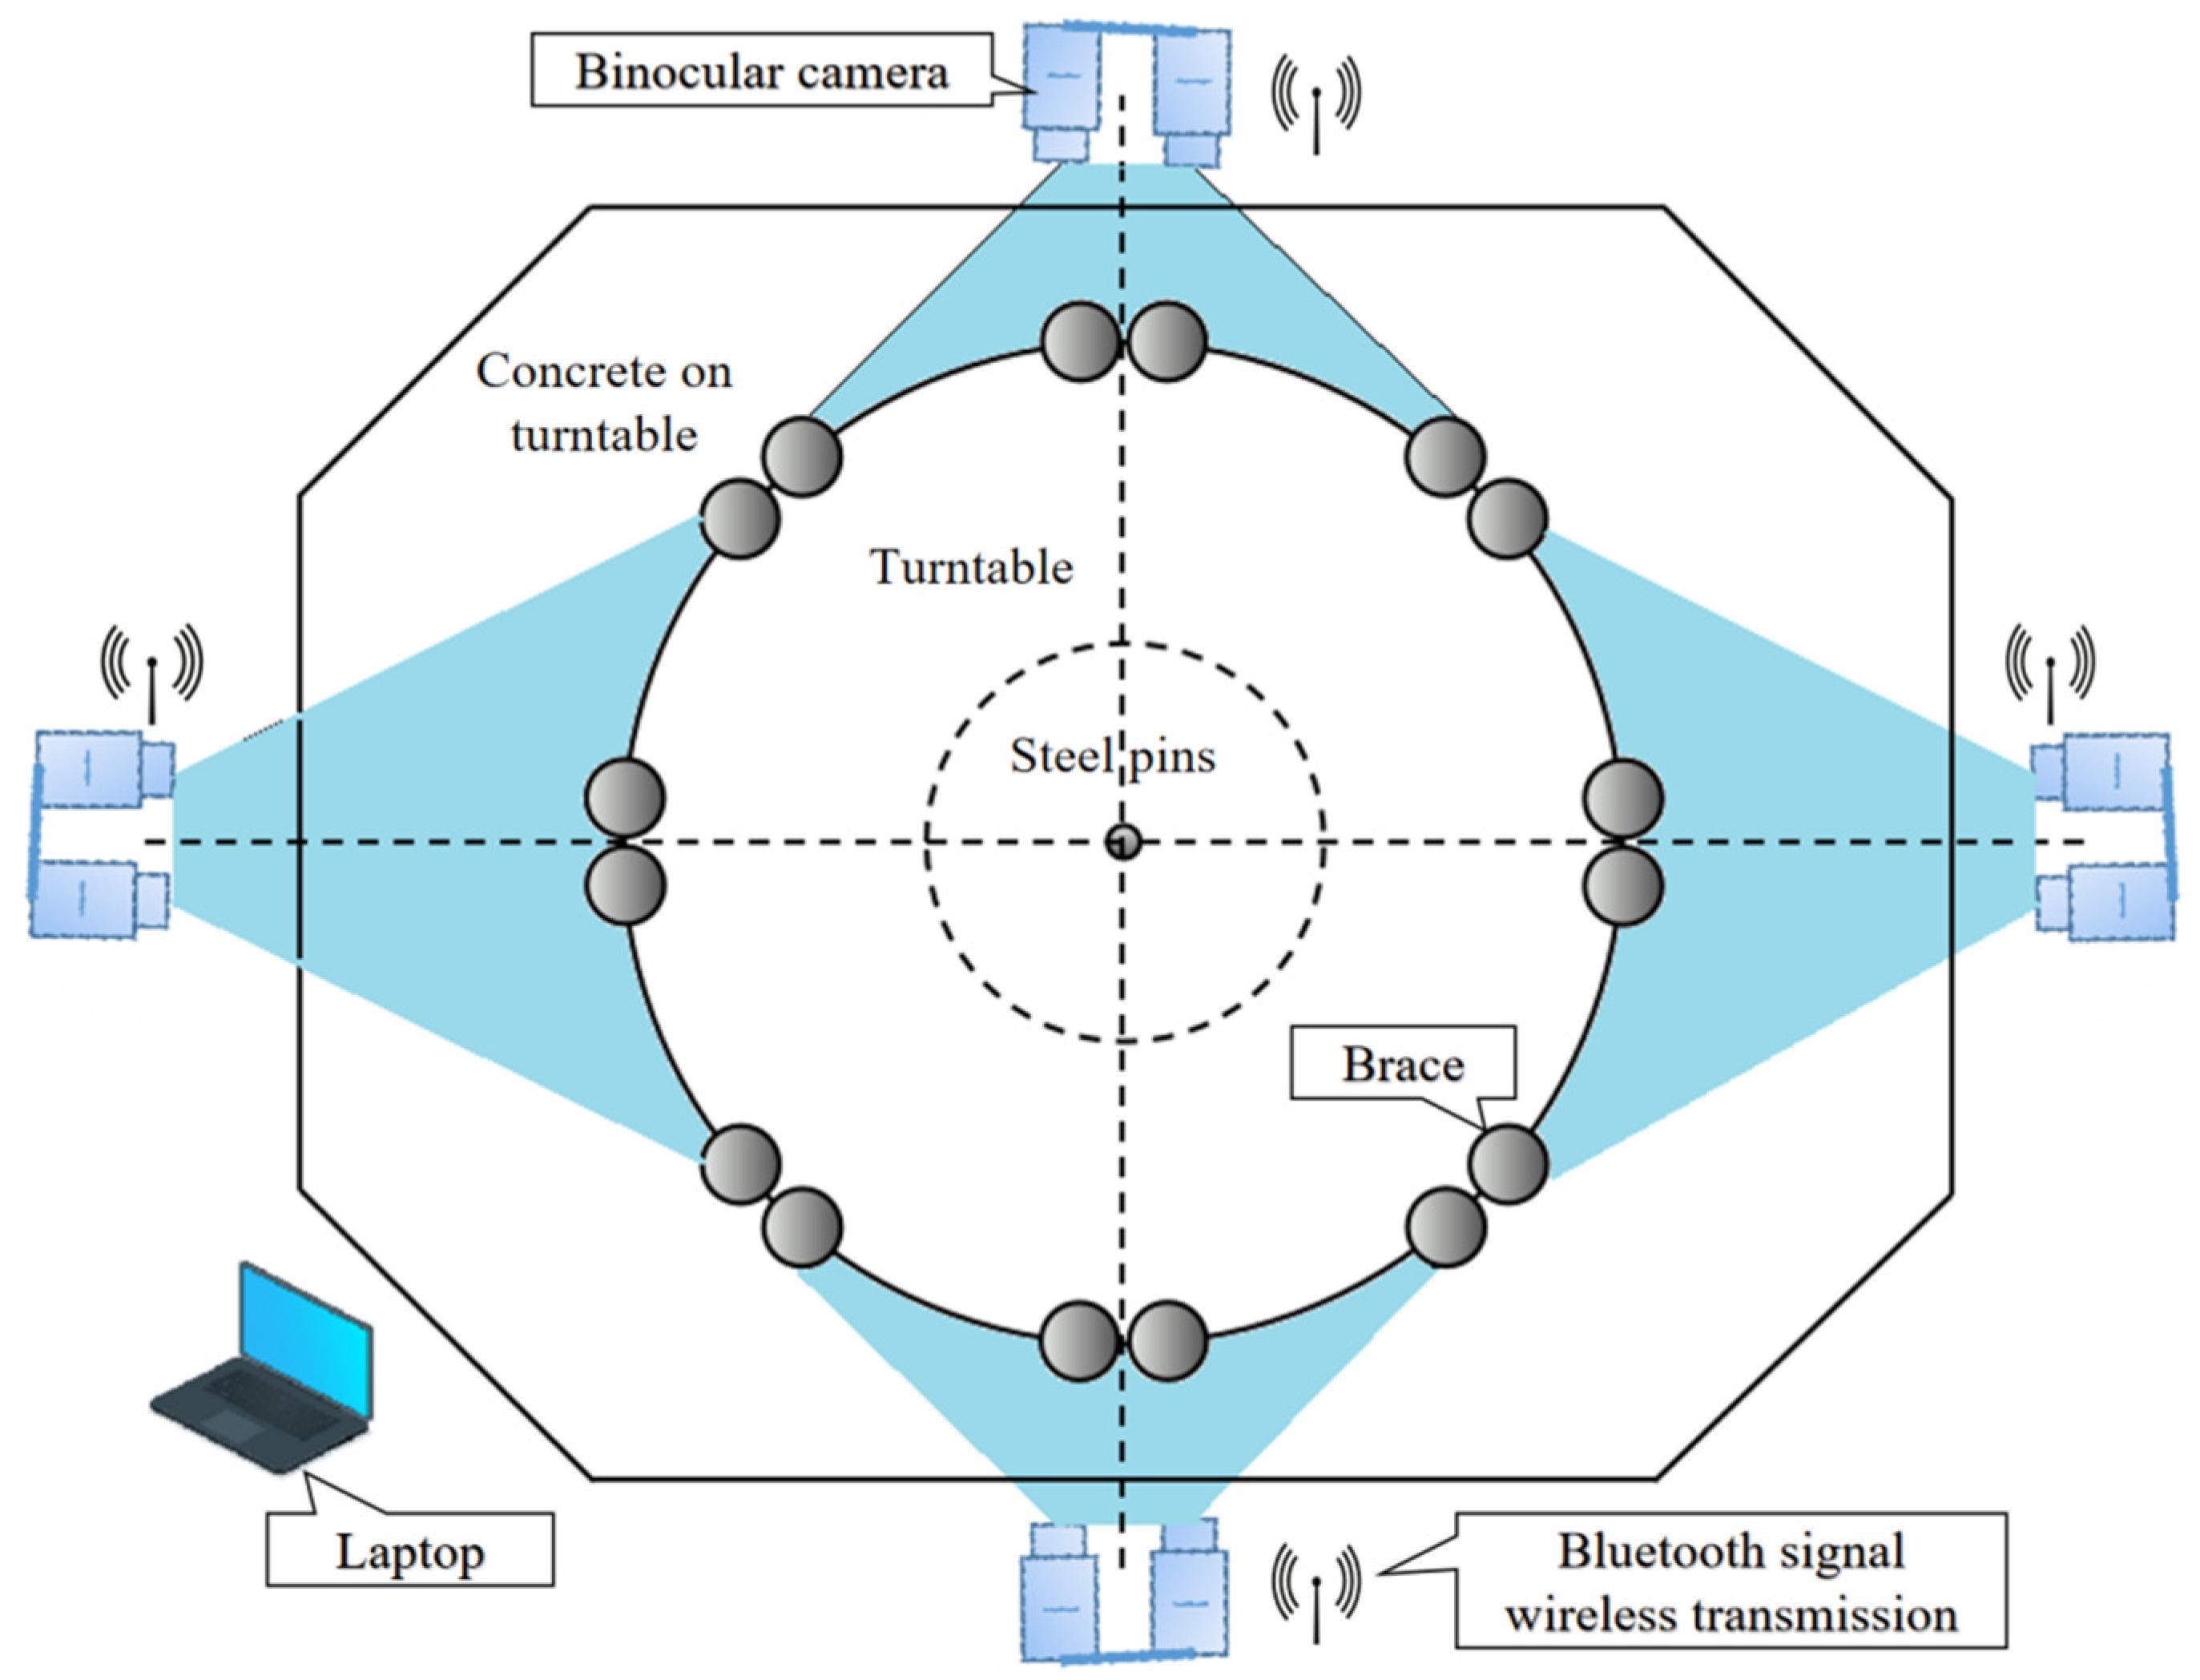
Figure 11.
Jack and displacement gauge measurement deployment.
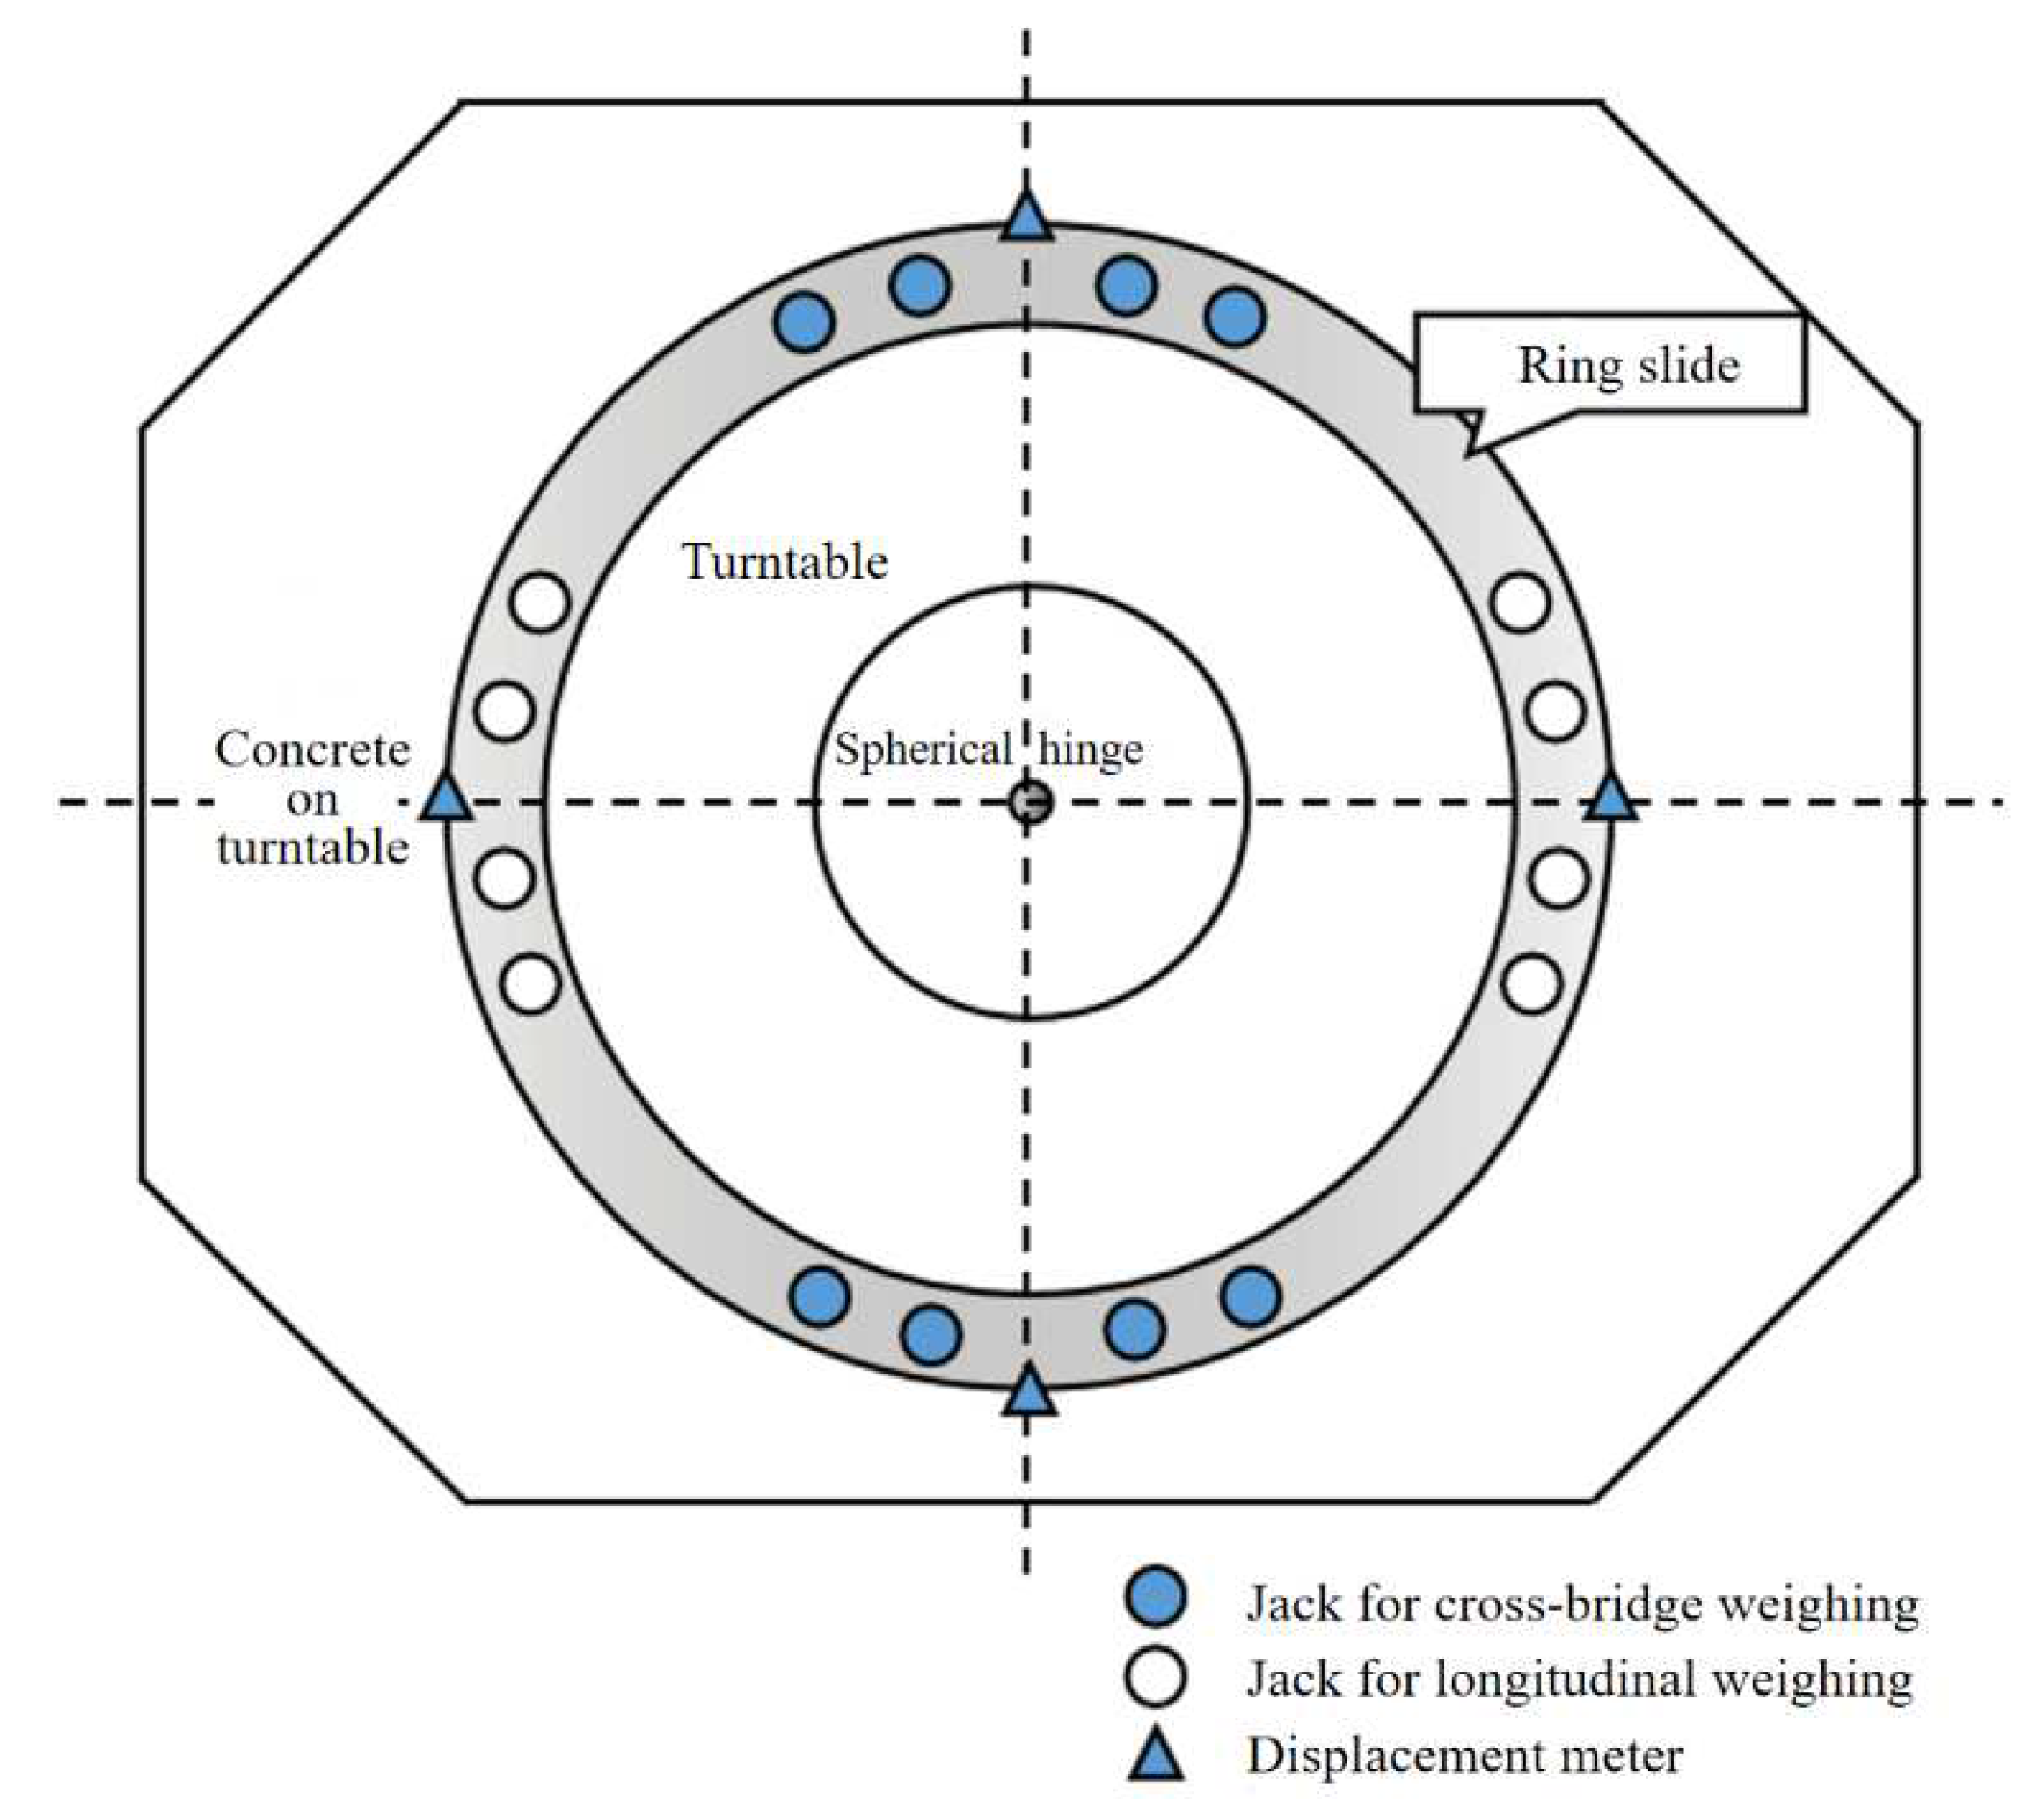
Figure 12.
2# Pier weighing test data.
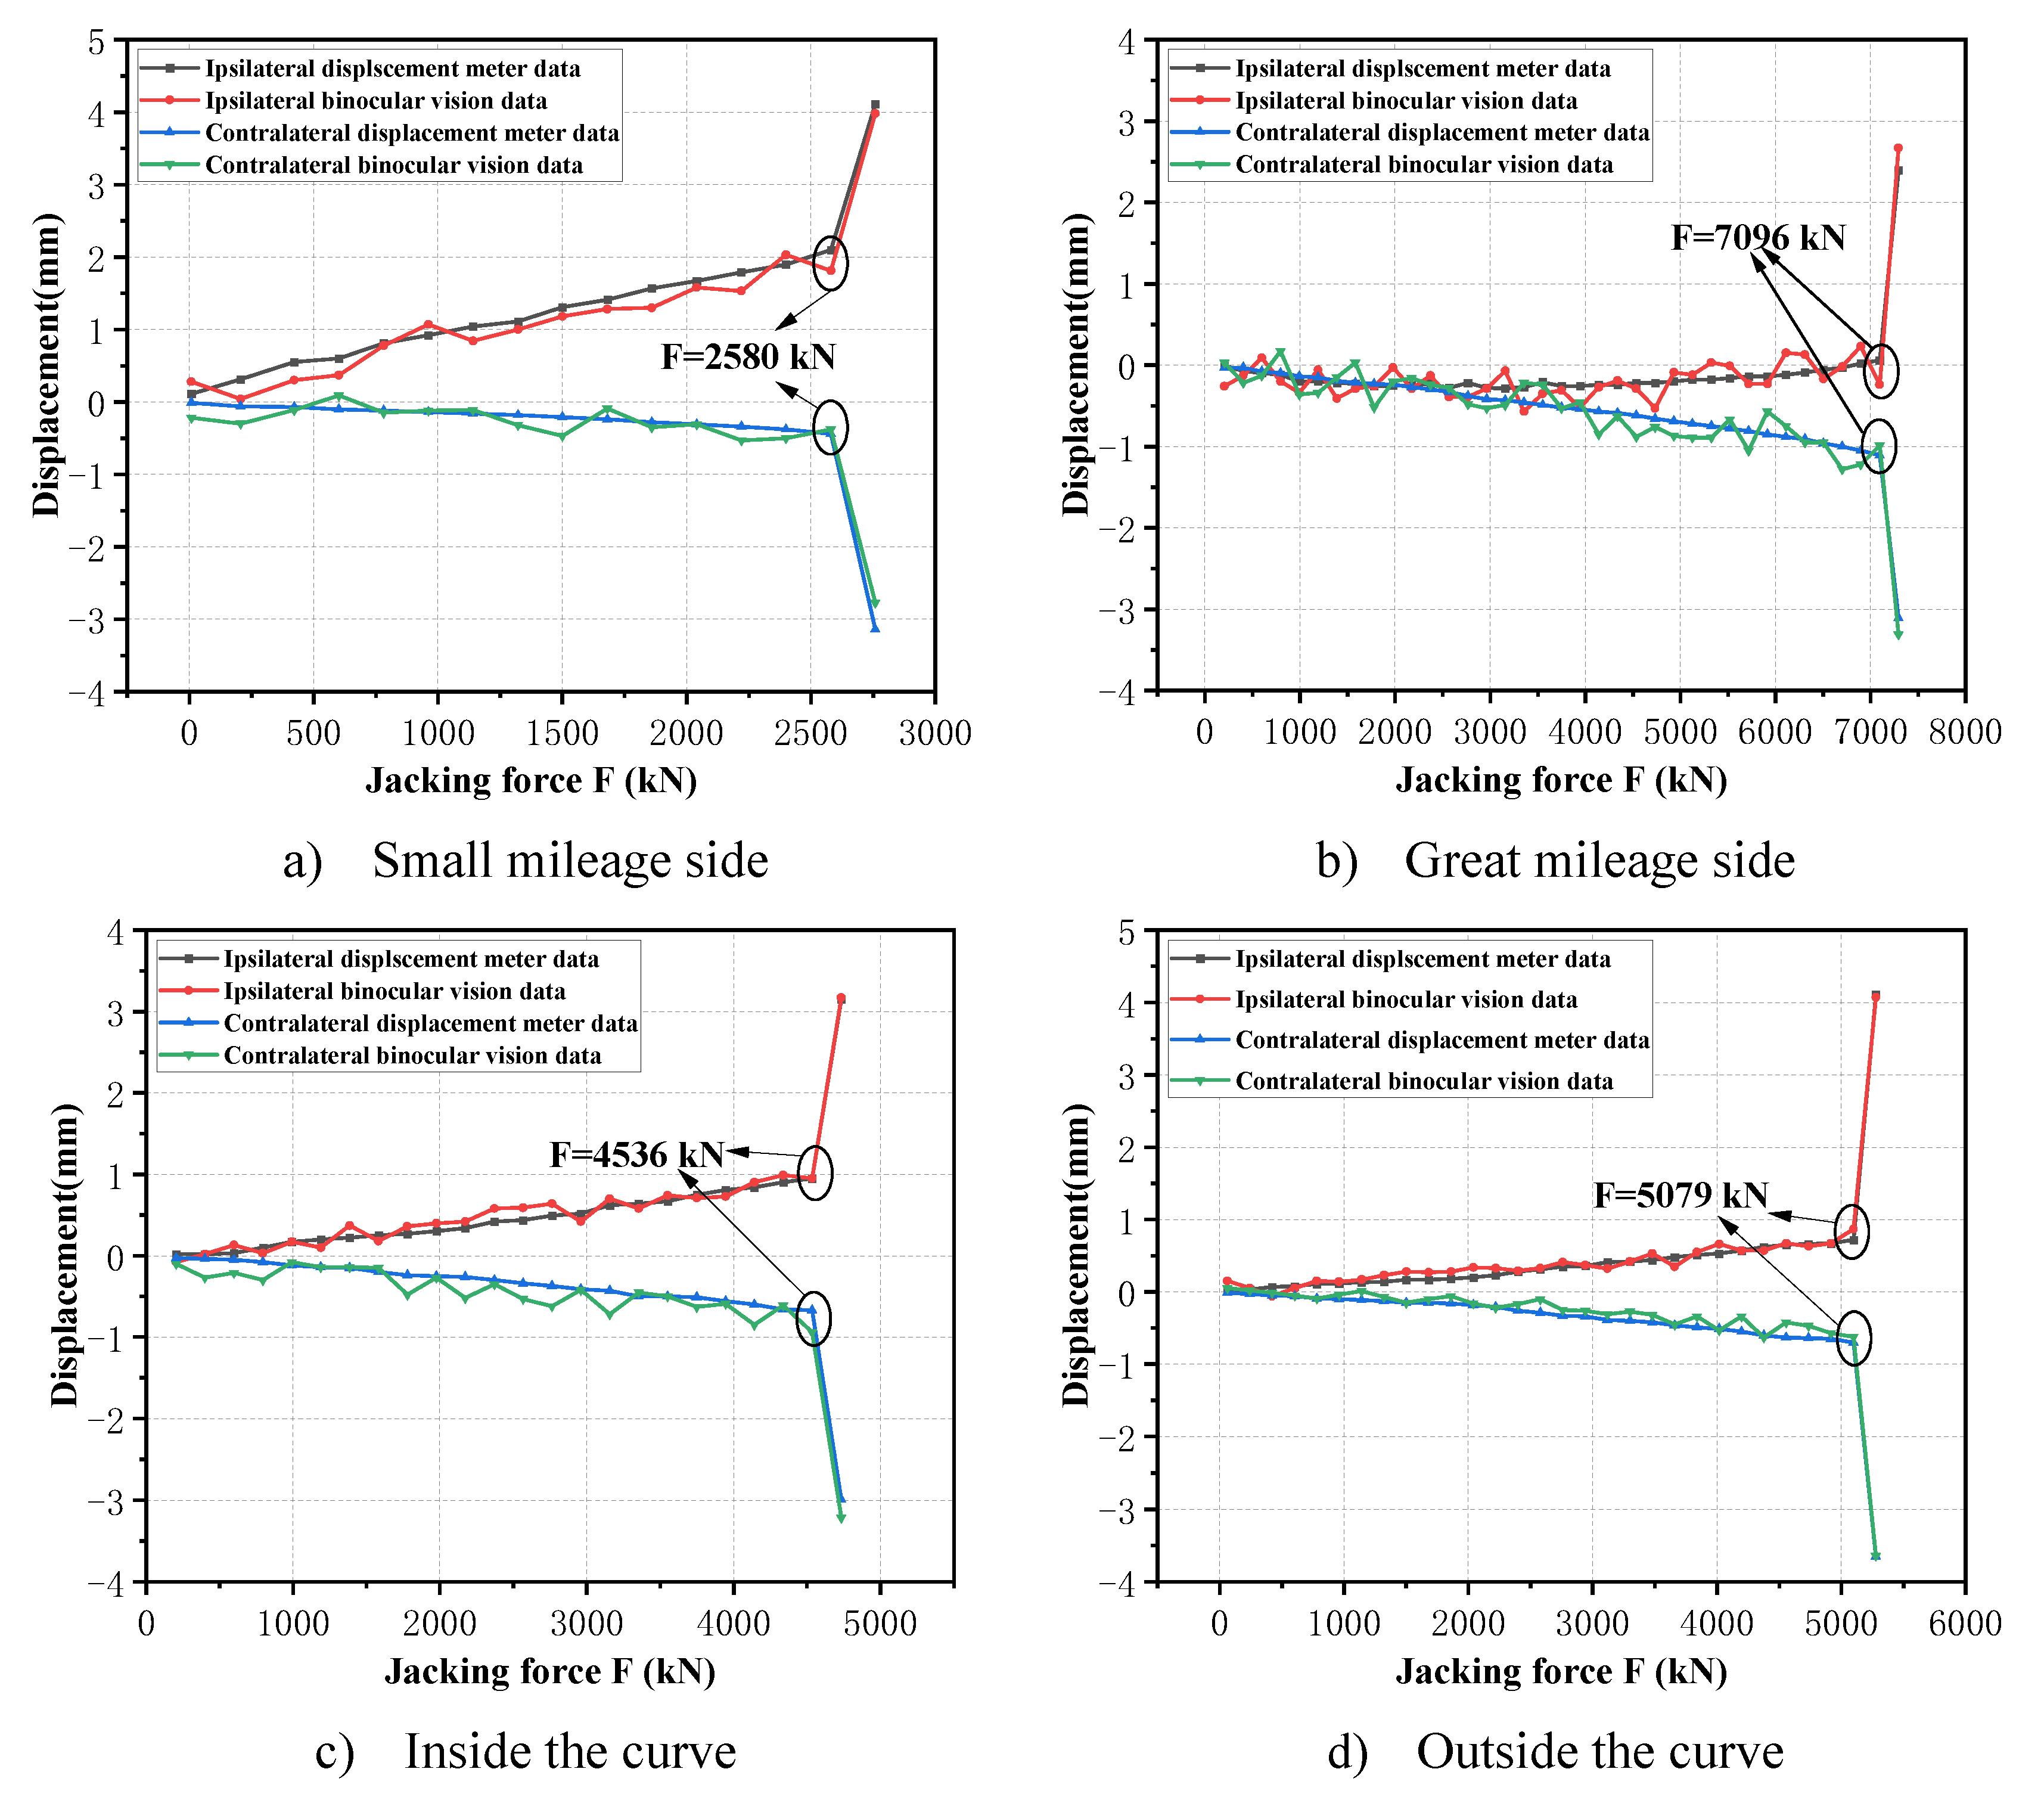
Figure 13.
Elevation of brace displacement monitoring deployment.
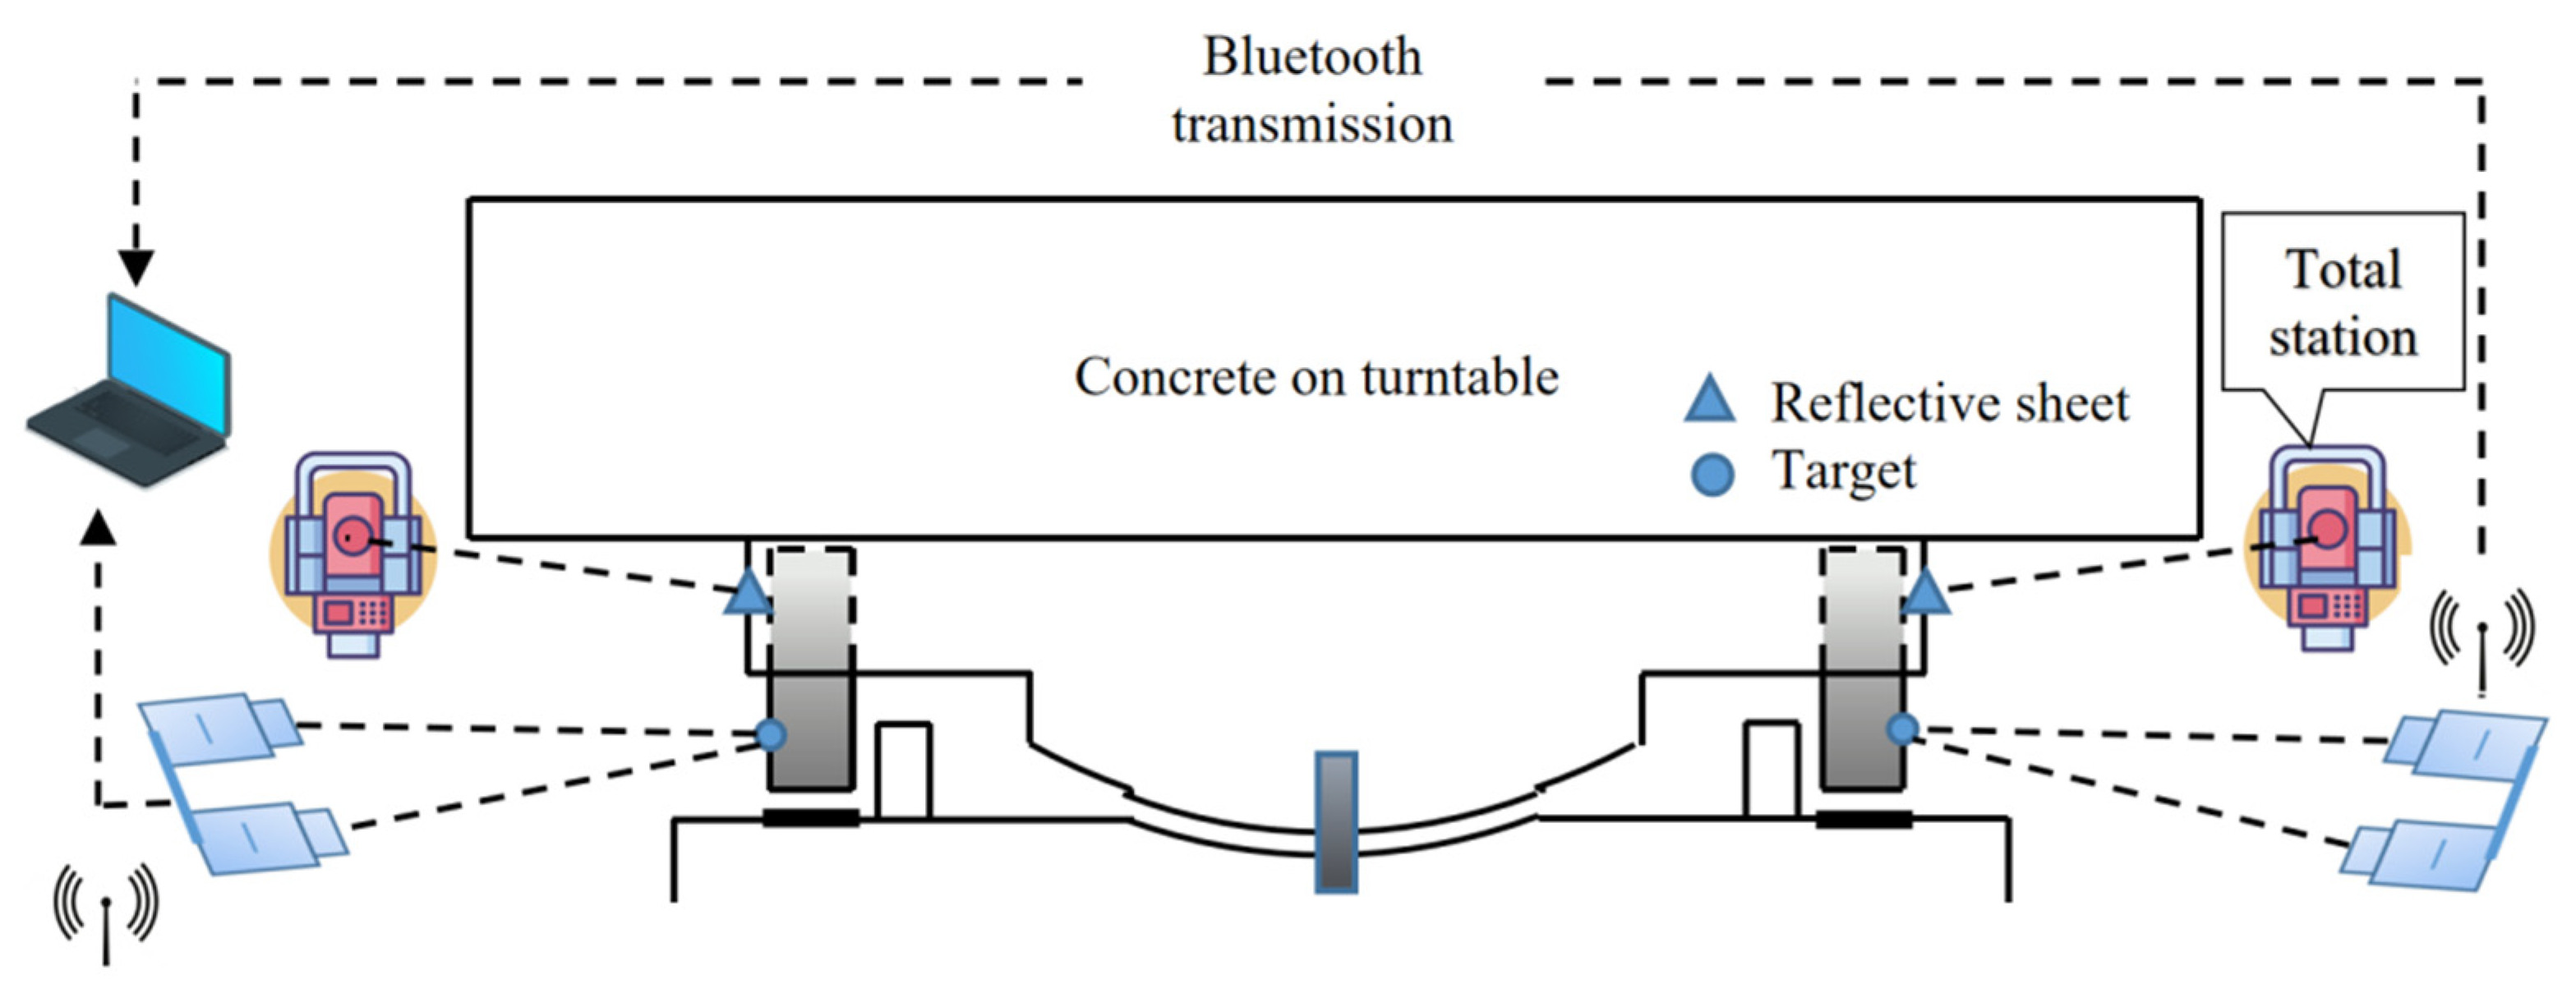
Figure 14.
Plan of footing displacement monitoring deployment.
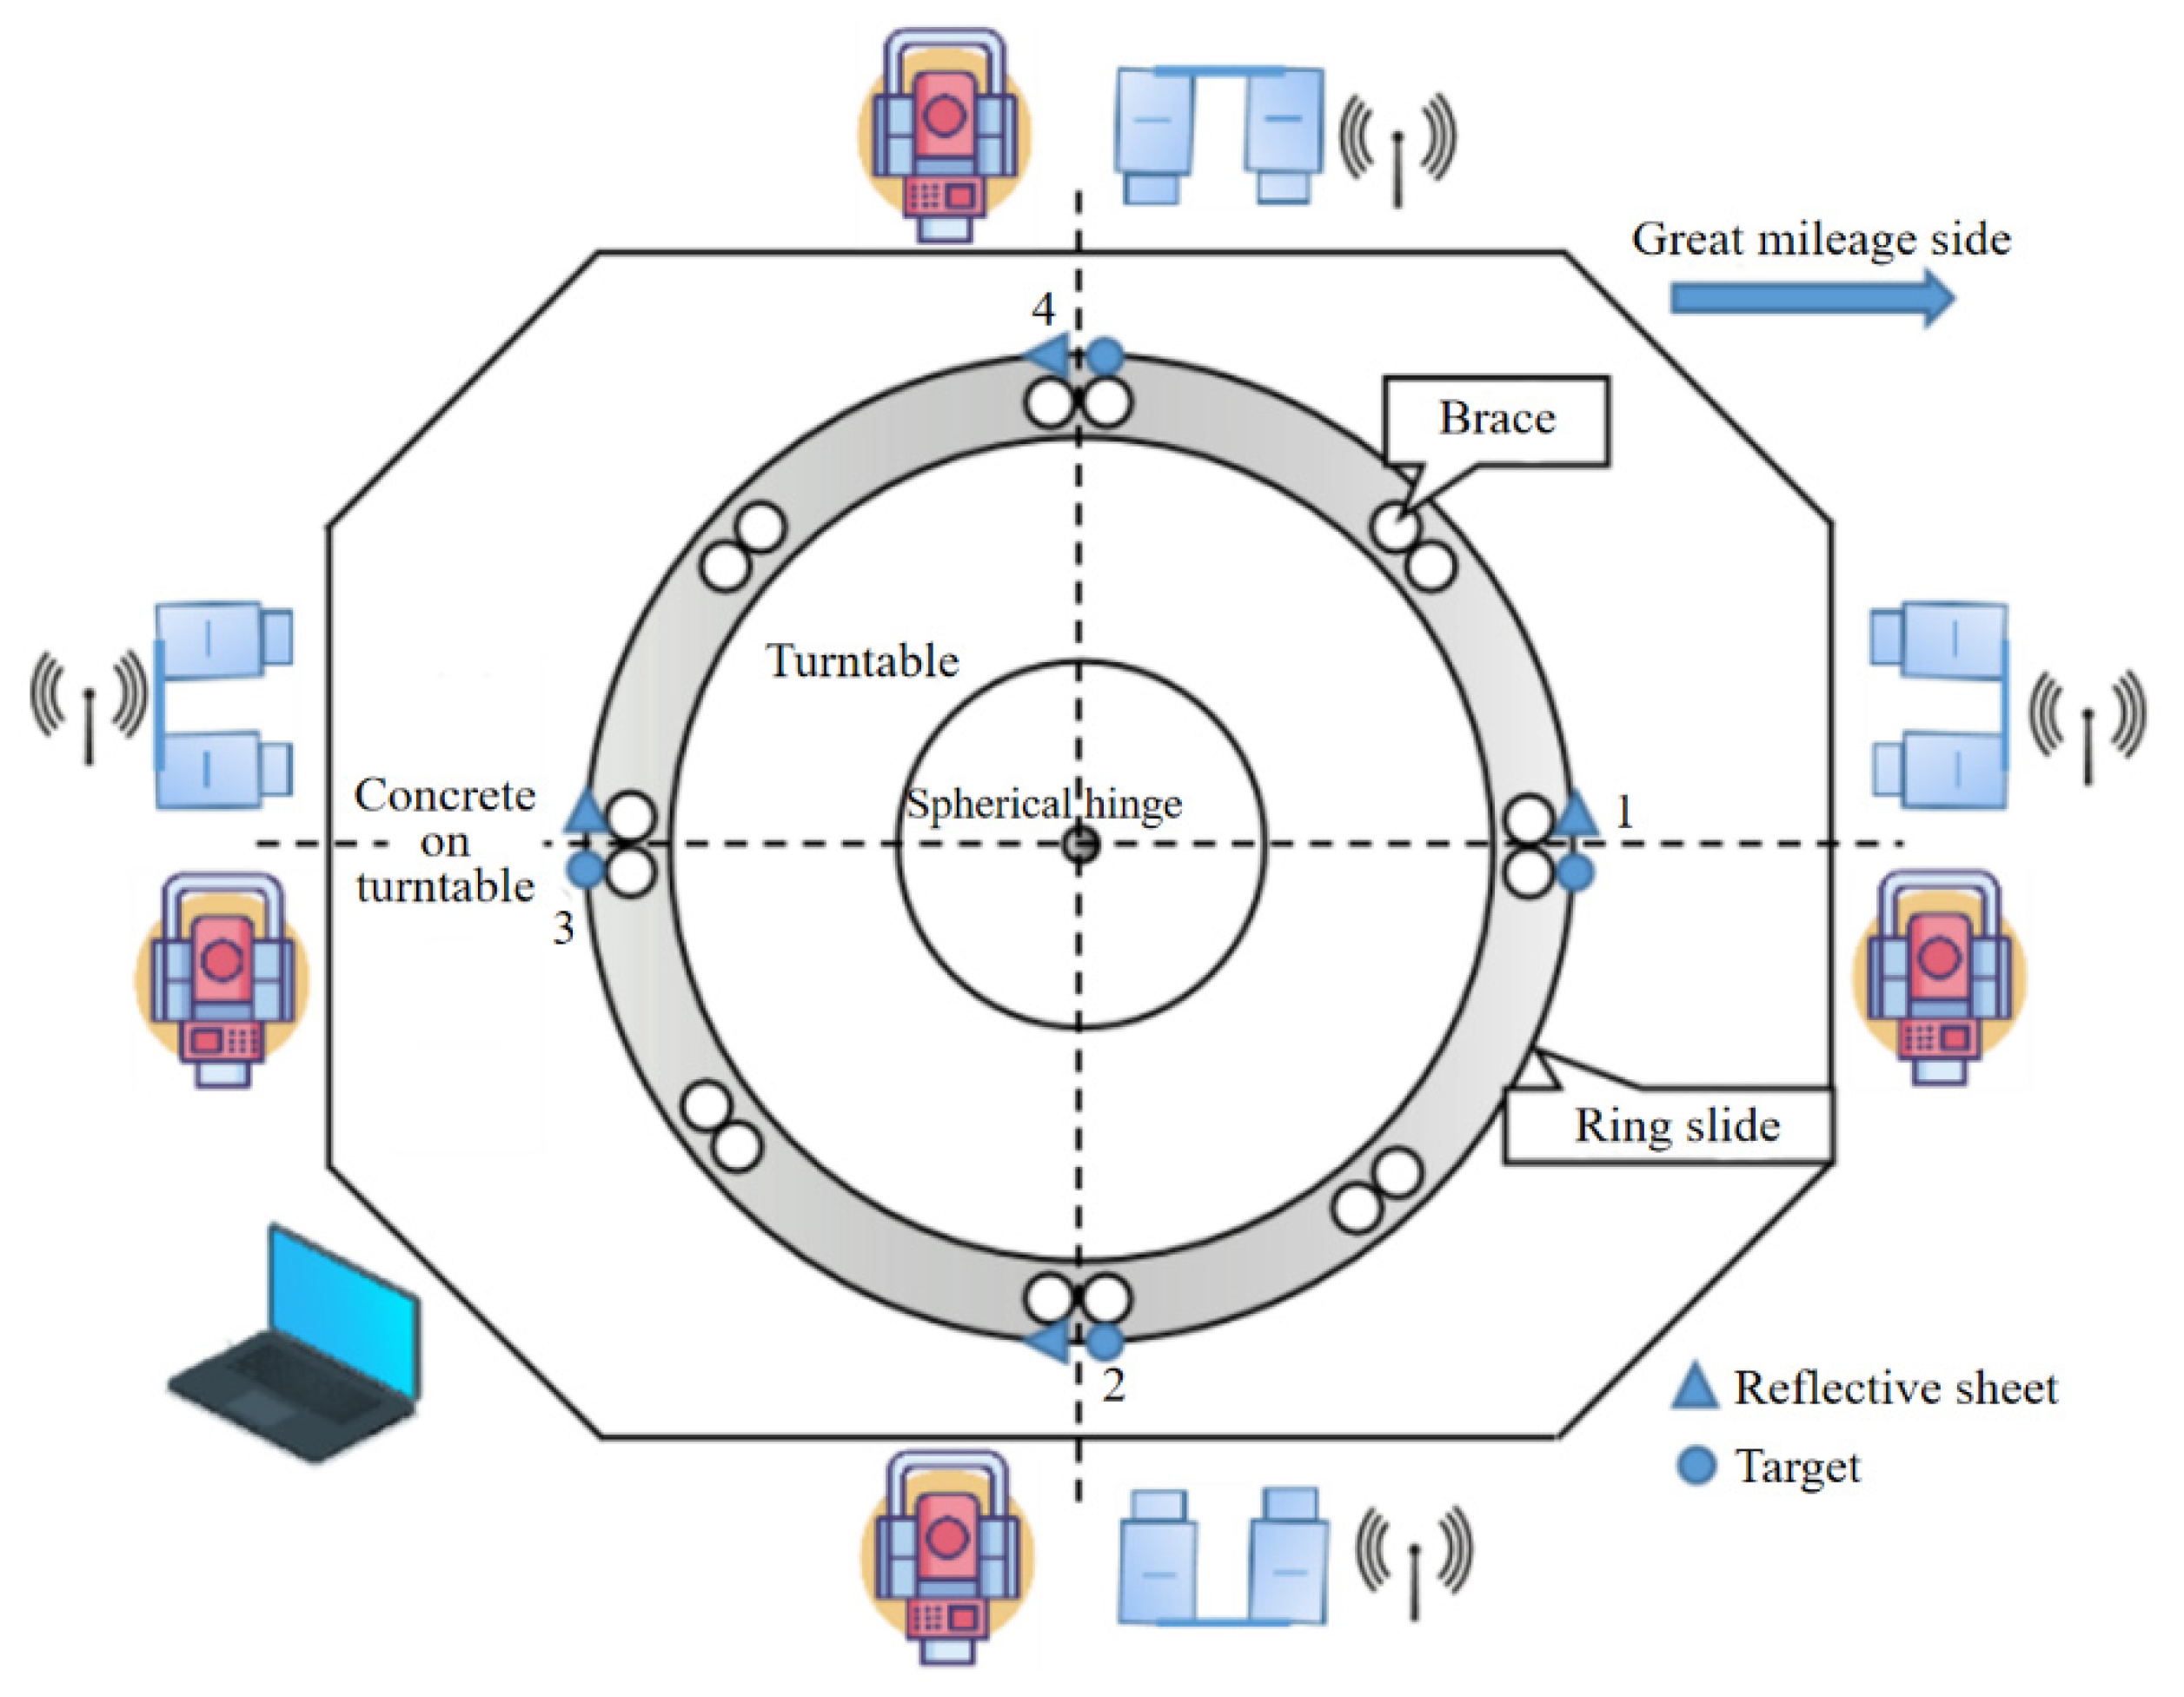
Figure 15.
Comparison of brace displacement monitoring data during rotation.
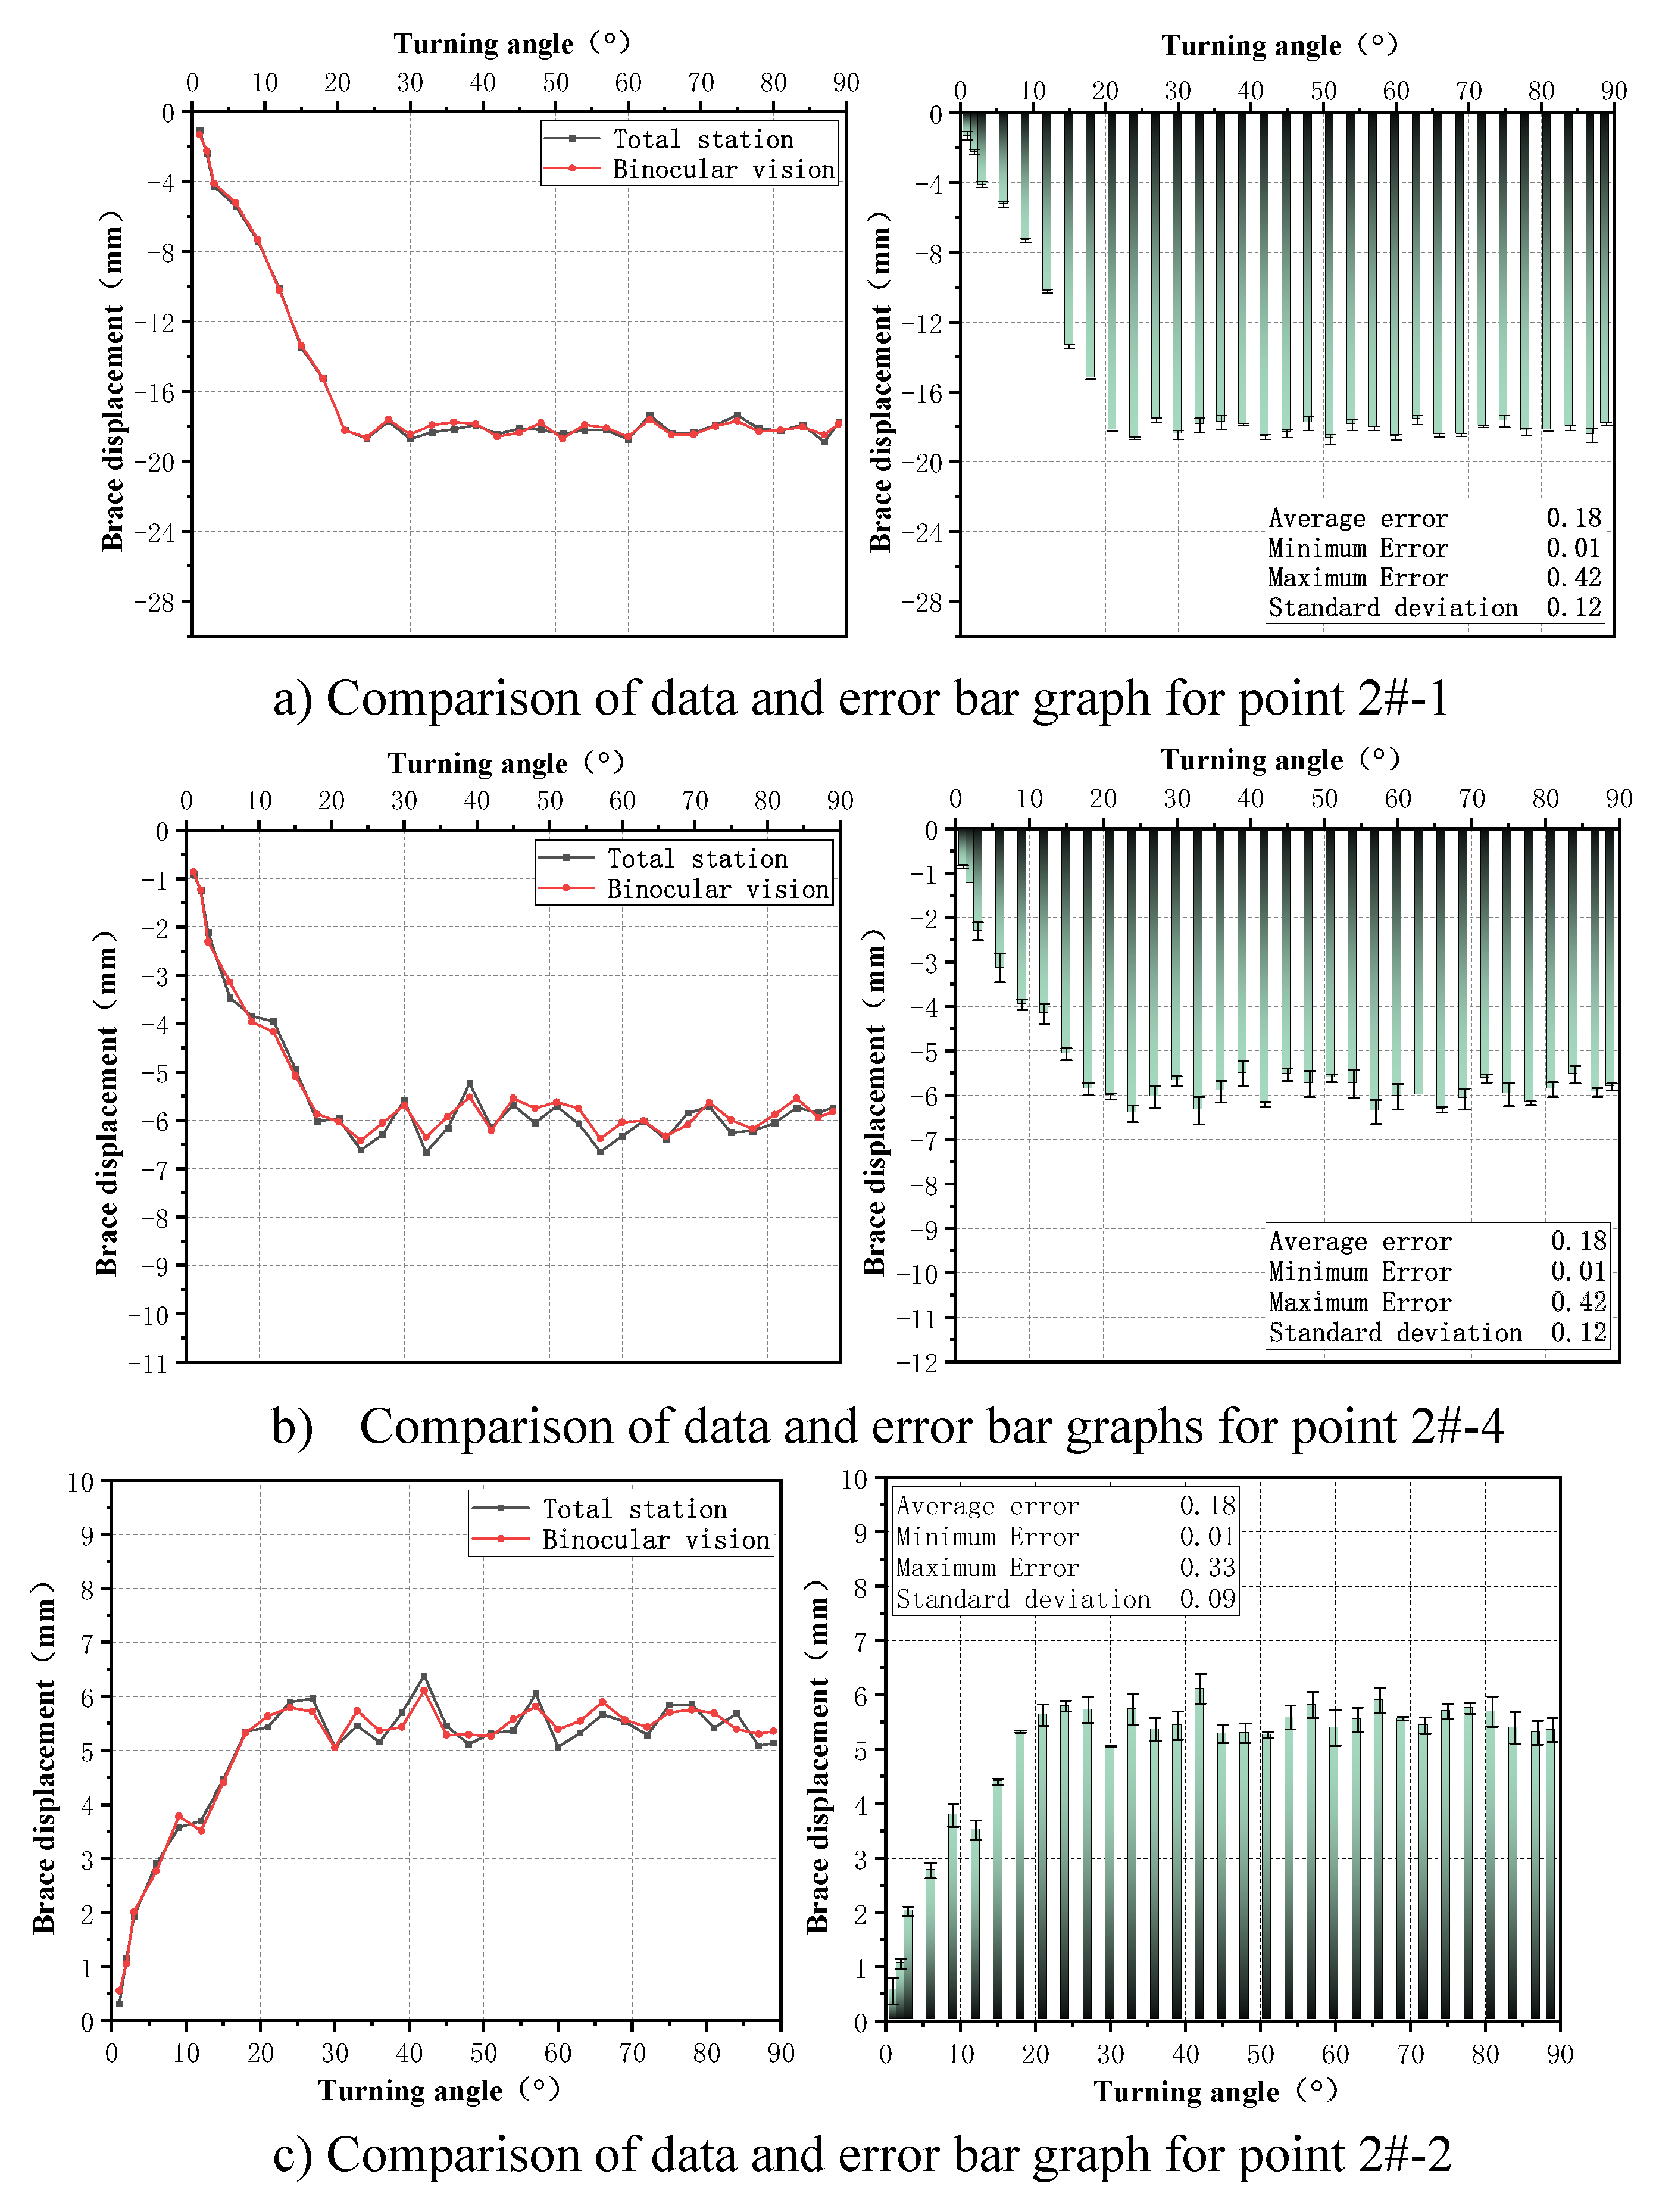
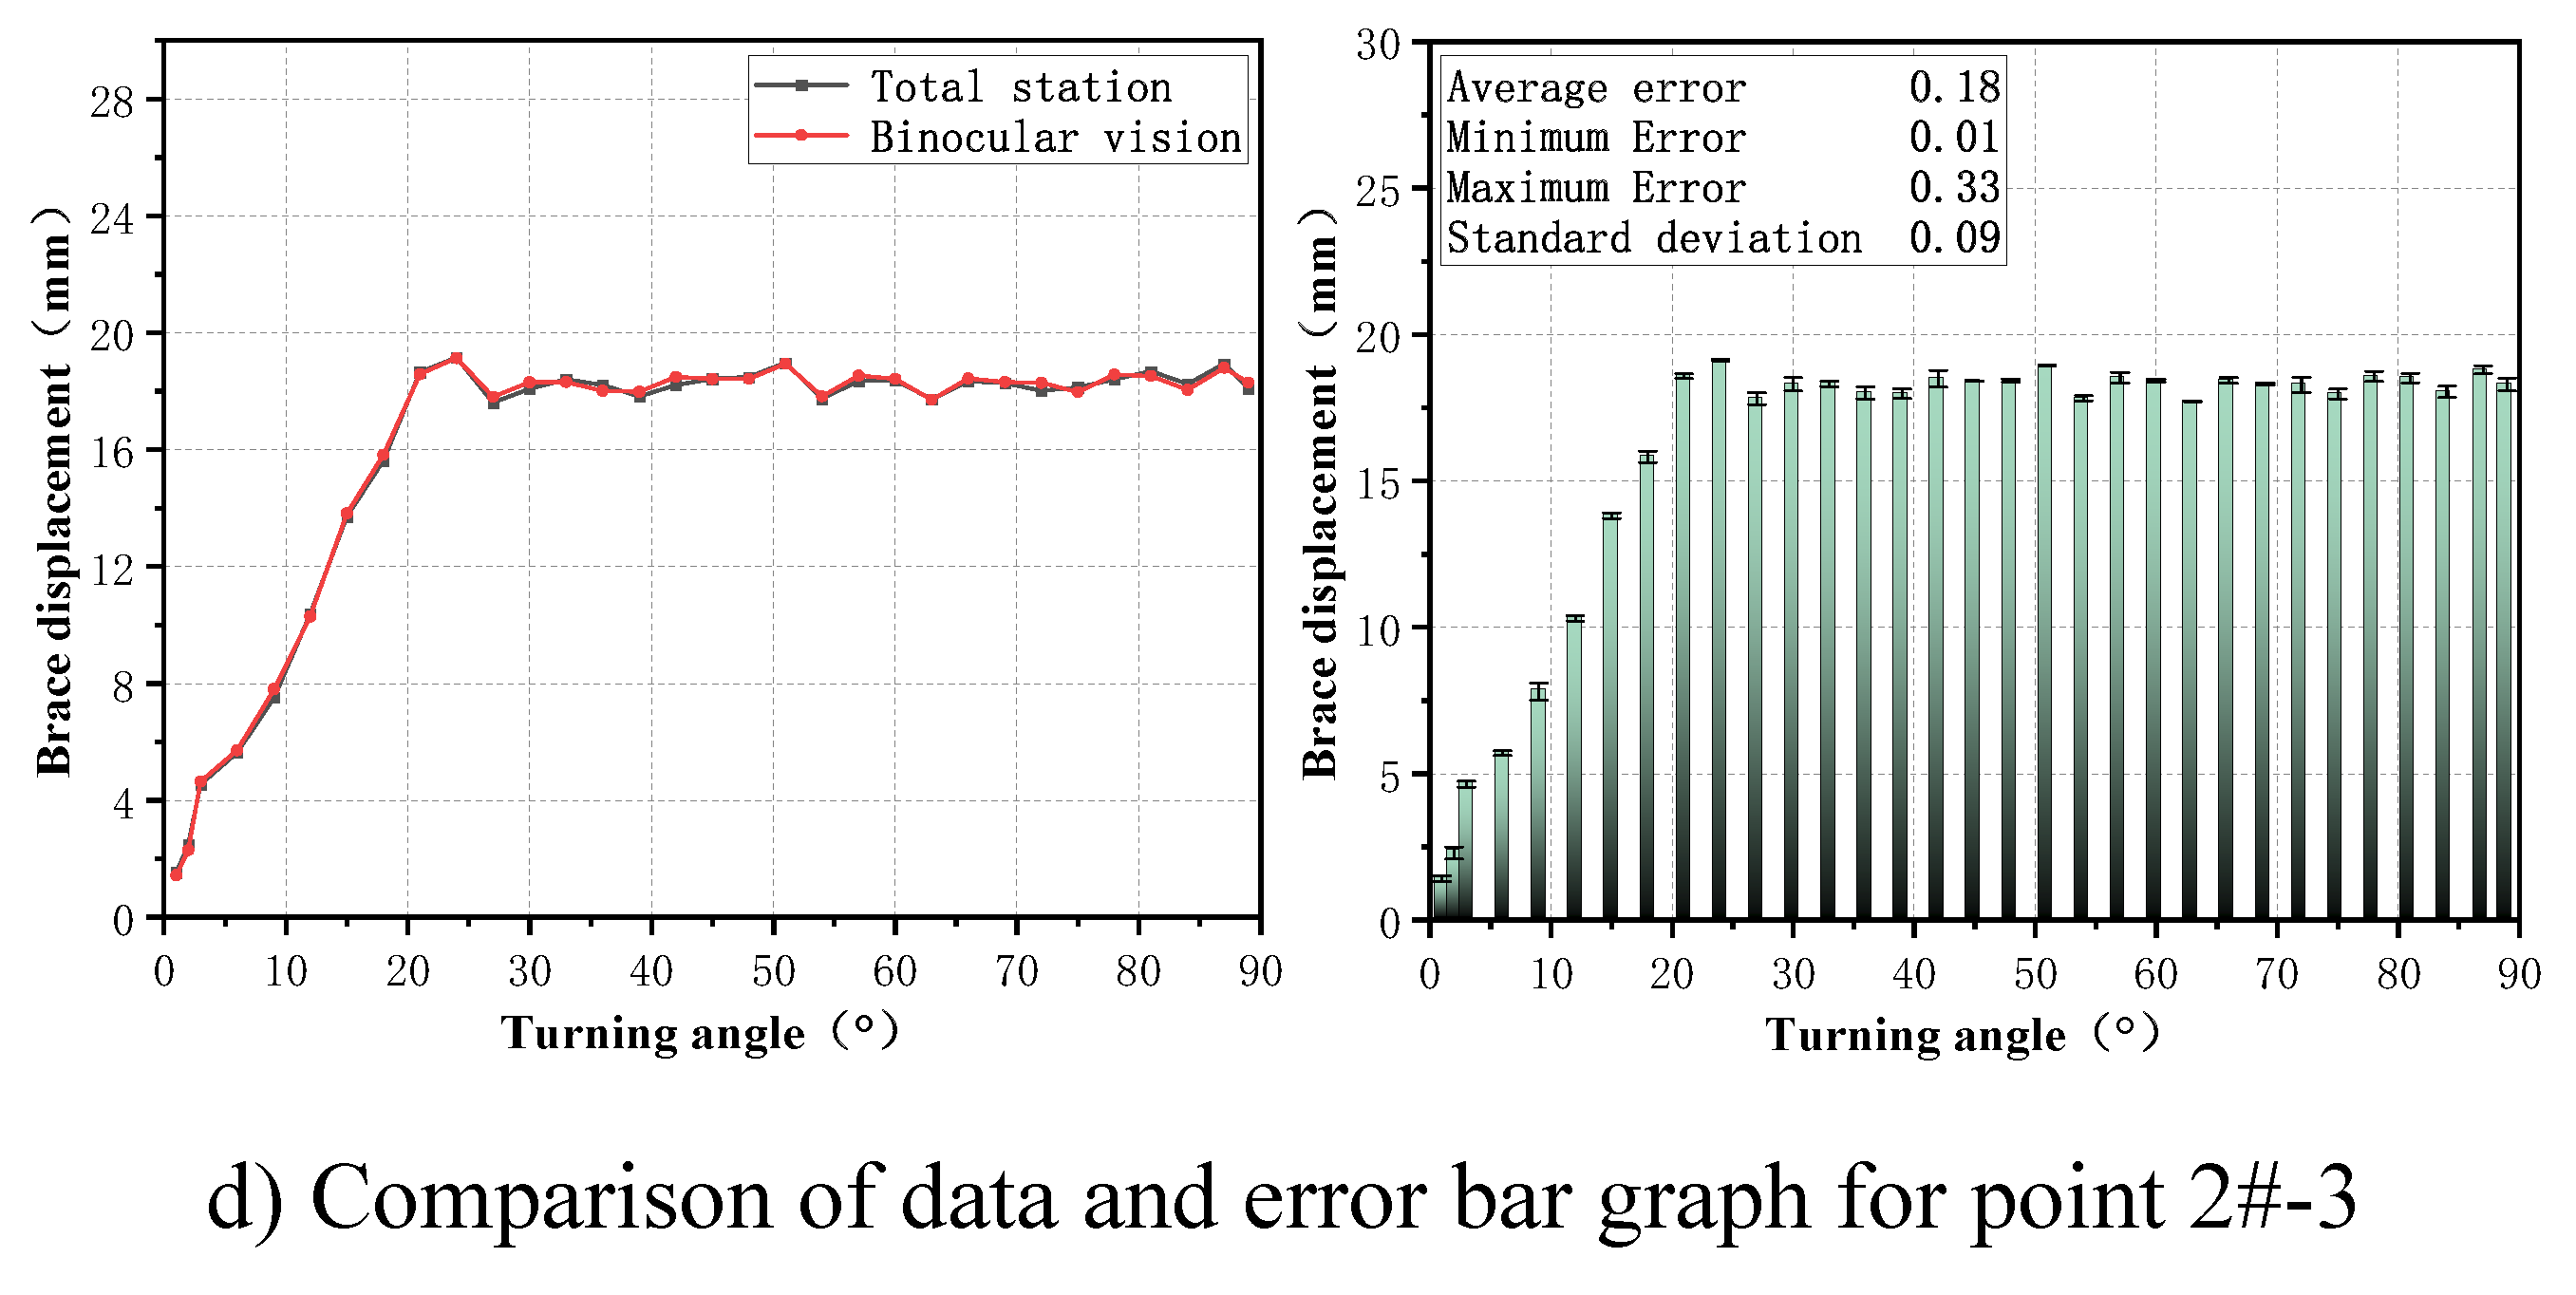
Figure 16.
Deviation of monitoring data of 2# pier turning process.
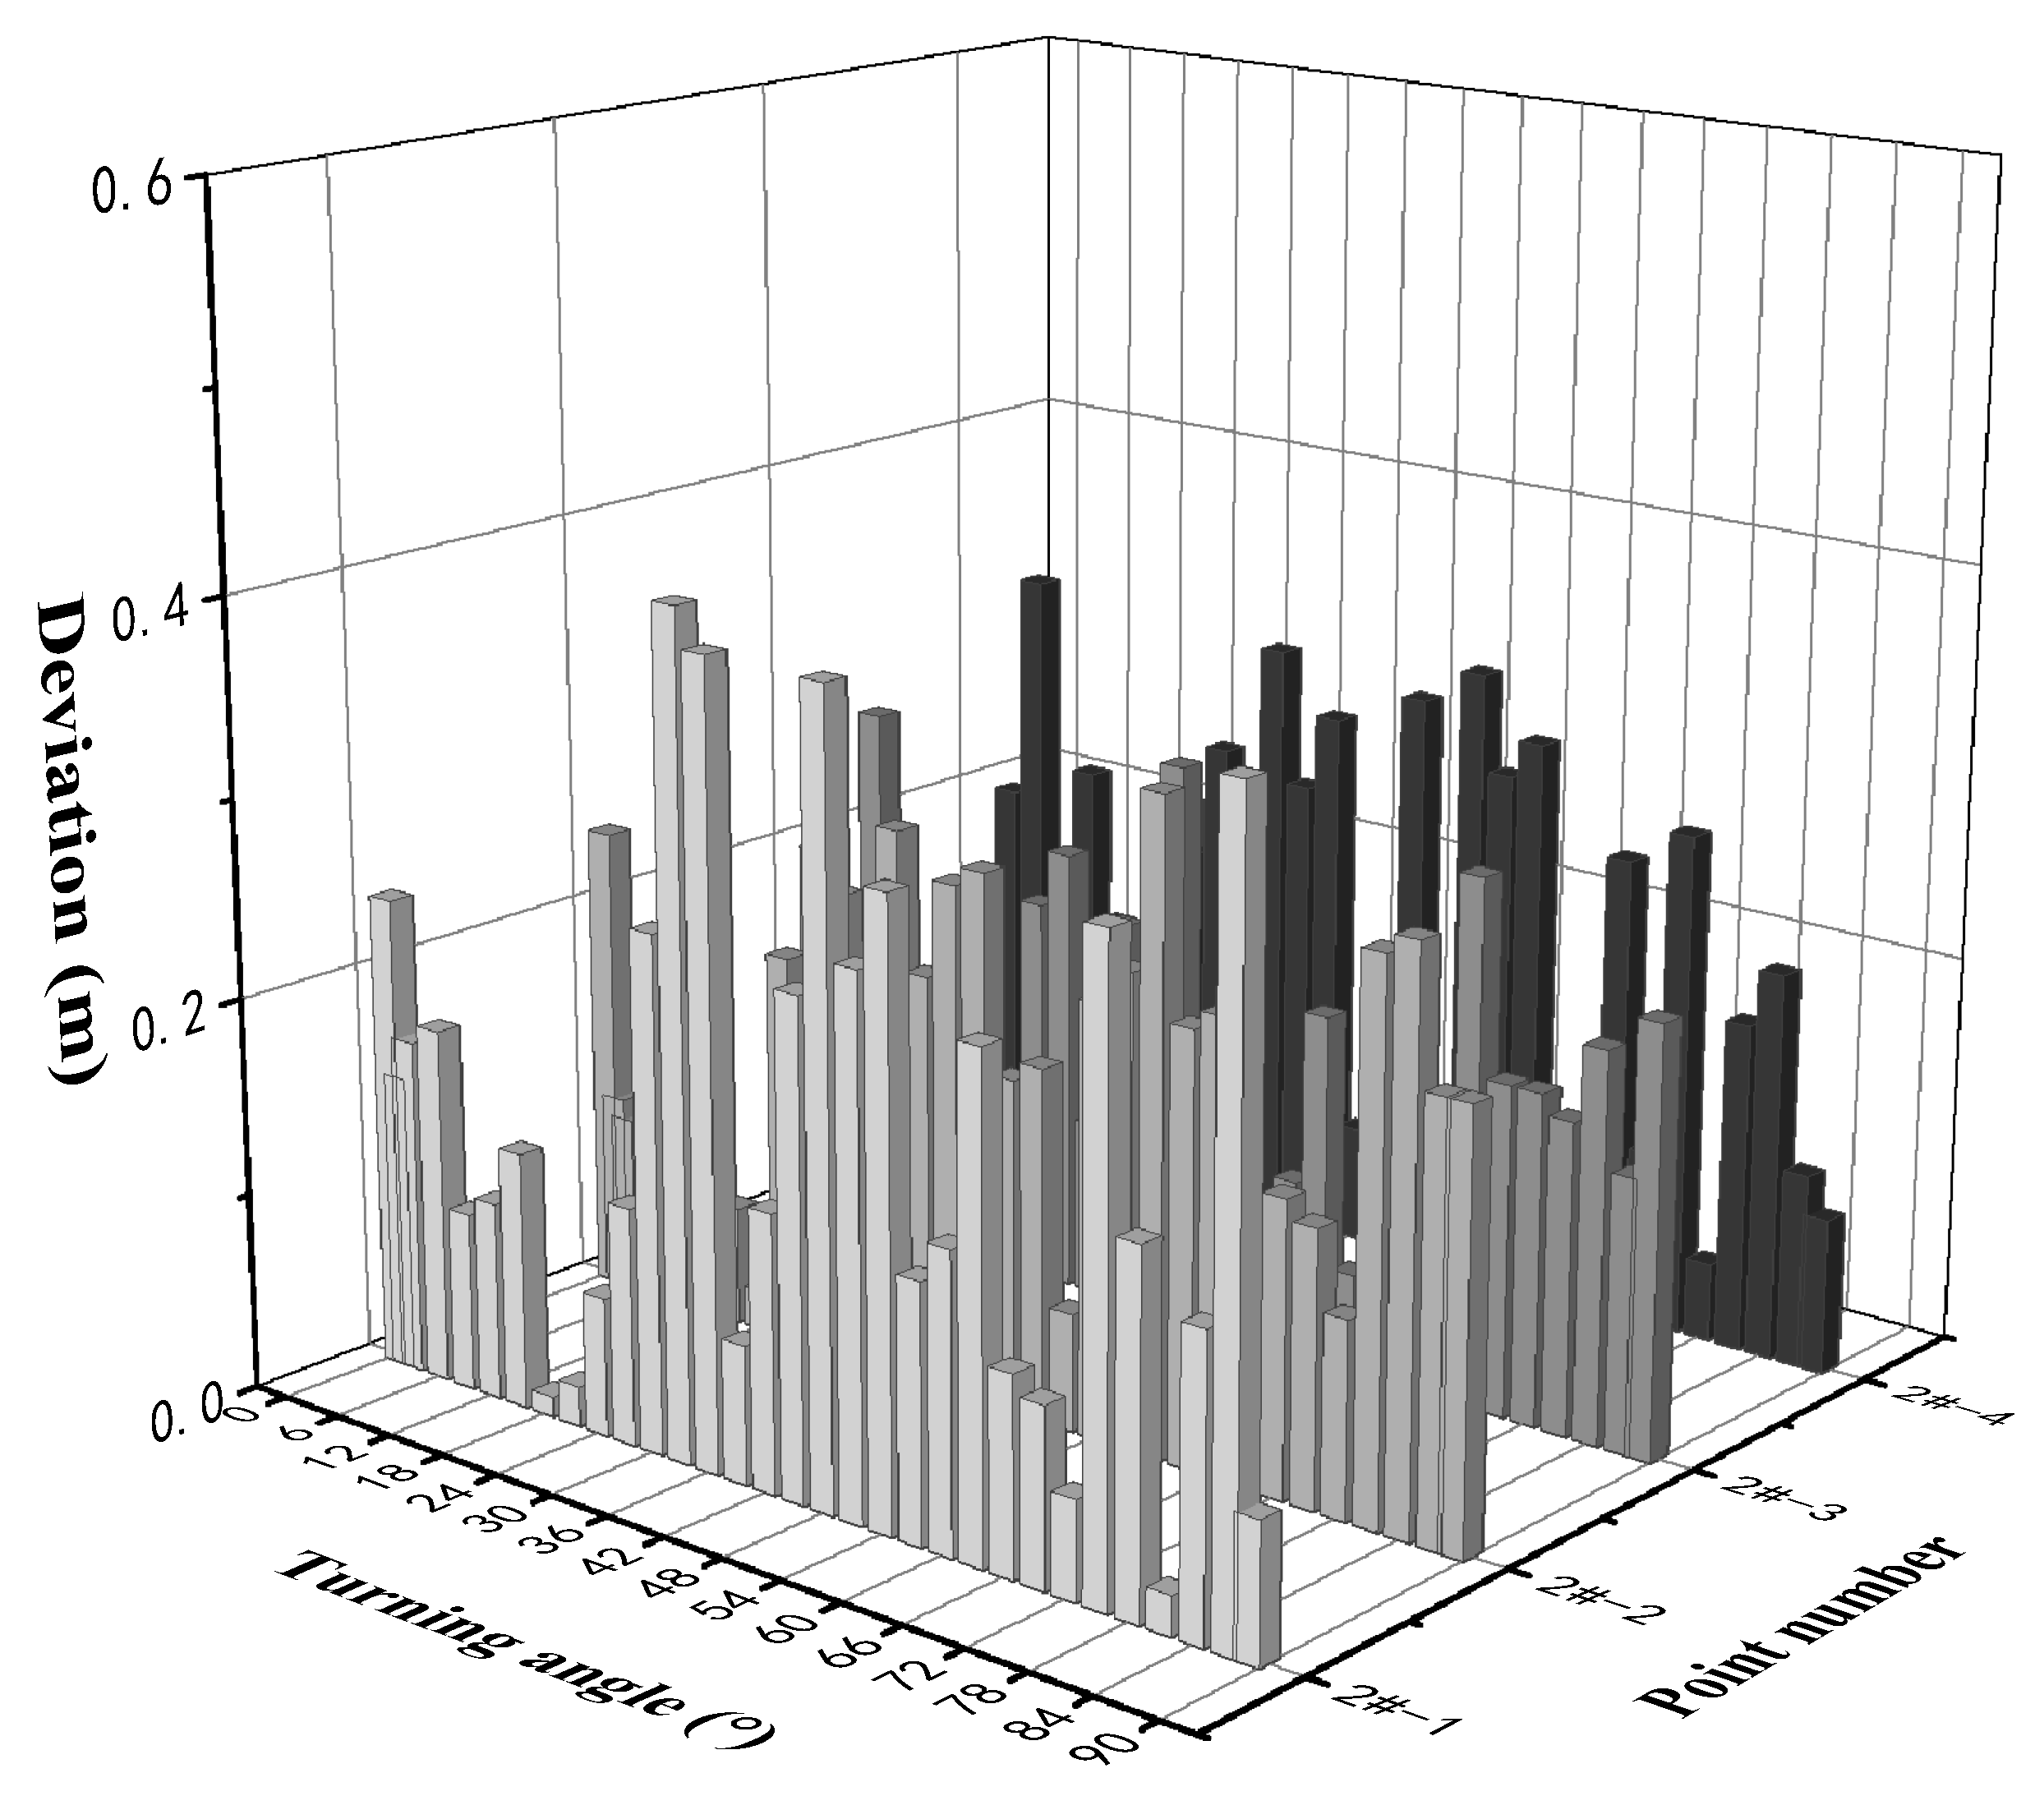

Table 1.
Binocular camera external reference matrix calibration results.
| Parameters | Matrix |
|---|---|
| Rotation matrix R (Right camera with respect to left camera) |
|
| The translation matrix T (Right camera with respect to left camera) |
Table 2.
Calibration results of binocular camera internal reference matrix.
| Parameters | Left camera | Right camera |
|---|---|---|
| Focal length (fx, fy) |
[1054.28135, 1054.59429] | [1055.49768, 1056.34748] |
| Aberrations (k1, k2, p1, p2, k3) |
[-0.12773,0.35300, -0.0001,-0.00165, 0] |
[-0.05193, 0.08342, 0.00444,0.00557, 0] |
| Main Point (u0, v0) |
[932.06466, 590.30070] | [970.14869, 575.05789] |
Table 3.
Estimation of unbalanced moments due to concrete placement.
| Beam section | Sections | Difference in pouring square volume (m³) |
Section center from bridge Distance from center (m) |
Unbalance moment (kN·m) |
Total (N·m) |
|---|---|---|---|---|---|
| Pier 2# Main beam |
A | 0 | 3 | 0 | 5517 |
| B | 6.5 | 10.5 | 1638 | ||
| C | -17 | 20.25 | -8262 | ||
| D | 12.5 | 30.75 | 9225 | ||
| E | -4.5 | 41 | -4428 | ||
| F | 6 | 51 | 7344 | ||
| Pier 3# Main beam |
A | 0 | 3 | 0 | 31404 |
| B | -3 | 10.5 | -756 | ||
| C | 19.5 | 20.25 | 9477 | ||
| D | -8.5 | 30.75 | -6273 | ||
| E | 14.5 | 41 | 14268 | ||
| F | 12 | 51 | 14688 |
Table 4.
Estimation of unbalanced moments caused by wall parapets, protective fences and hangers.
| Name | Concrete quantity per extended meter (m³) | Weight per linear meter of steel (kg) | Quantity (m) | Distance from the center of the bridge (m) | Unbalance moment (kN·m) |
Total (kN·m) |
||
|---|---|---|---|---|---|---|---|---|
| Pier 2# main beam | Wall Guardrail | 0.64 | 203.5 | 0 | — | 0 | 2753 | |
| Protective Mesh | 0 | 87.78 | 112 | — | 2753 | |||
| Hanger | 0 | 87.49 | 0 | — | 0 | |||
| Pier 3# main beam | Wall Guardrail | 0.64 | 203.5 | 5.05 | 53.48 | -4697.94 | 4326.28 | |
| Protective Mesh | 0 | 87.78 | 112 | — | 2753 | |||
| Hanger | 0 | 87.49 | 128 | 56 | 6271.28 | |||
Table 5.
Eccentric distance estimation table.
| Name | Self-weight (kN) |
Unbalance moment (kN·m) |
Eccentricity distance (m) |
Eccentric position |
|---|---|---|---|---|
| Pier 2# main beam | 165000 | 8270 | 0.05 | Offset to the southeast of the bridge center |
| Pier 3# main beam | 165000 | 35730 | 0.22 | Offset to the southeast of the bridge center |
Table 6.
Pre-weighting estimation table.
| Name | Pre-assigned weight (t) | Pre-assigned position | Unbalance moment after pre-weighting (kN·m) | Eccentric distance after pre-weighting (m) | Eccentric position |
|---|---|---|---|---|---|
| Pier 2# main beam | — | — | 8270 | 0.05 | Offset to the southeast of the bridge center |
| Pier 3# main beam | 55 | Located 45 m northwest of the bridge center | 10980 | 0.07 | Offset to the southeast of the bridge center |
Table 7.
Maximum jacking force estimation table.
| Beam section | Frictional moment (kN·m) |
Unbalance moment after pre-weighting (kN·m) |
Jack force arm L (m) |
Maximum jacking force (kN) | Maximum jacking force (kN) | Number of jacks |
|---|---|---|---|---|---|---|
| Pier 2# main beam | 38808 | 8270 | 5.15 | 9141 | 5930 | 4 x 400 t |
| Pier 3# main beam | 38808 | 10980 | 5.15 | 9668 | 5403 | 4 x 400 t |
Table 8.
Maximum jacking force estimation table.
| Name | Unit | Longitudinal bridge directionWeighing test value | Cross-bridge directionWeighing test value | |
|---|---|---|---|---|
| Unbalanced moment | MG | kN·m | 11019 | 1369 |
| Frictional moment | MZ | kN·m | 23609 | 23505 |
| Static friction coefficient | μ | — | 0.0183 | 0.0182 |
| Eccentricity | e | m | 0.067 | 0.008 |
| Eccentric direction | — | — | Bias to the high mileage side | Bias to the outside of the curve |
Disclaimer/Publisher’s Note: The statements, opinions and data contained in all publications are solely those of the individual author(s) and contributor(s) and not of MDPI and/or the editor(s). MDPI and/or the editor(s) disclaim responsibility for any injury to people or property resulting from any ideas, methods, instructions or products referred to in the content. |
© 2023 by the authors. Licensee MDPI, Basel, Switzerland. This article is an open access article distributed under the terms and conditions of the Creative Commons Attribution (CC BY) license (http://creativecommons.org/licenses/by/4.0/).
Copyright: This open access article is published under a Creative Commons CC BY 4.0 license, which permit the free download, distribution, and reuse, provided that the author and preprint are cited in any reuse.


