
Submitted:
24 October 2023
Posted:
25 October 2023
You are already at the latest version
Abstract
Recreational and leisure areas play a special role. These areas mitigate or eliminate the disadvantages of living in large cities, and they enhance the quality of life in small towns. The aim of this study was to analyze the share of recreational and leisure areas in Polish counties in 2022. In Poland, recreational and leisure areas constitute a separate land-use category in cadastral registers. Annual cadastral data from the Land and Building Register at county level (in tabular form) were the main source of data for the study. The analysis revealed that the share of recreational and leisure areas was higher in counties situated in western and south-western Poland, as well as in cities. The spatially varied influence of socioeconomic factors on the share of recreational and leisure areas in Polish counties in 2002 was determined with the use of local Moran's I statistic and geographically weighted regression (GWR). The study confirmed that population density was significantly related to the share of recreational and leisure areas in Polish counties. The impact of the remaining socioeconomic factors associated with spatial and economic development varied across regions. The study also revealed that in addition to the current socioeconomic determinants, the share of recreational and leisure areas in Polish counties was also influenced by historical factors and the counties' development since their establishment.
Keywords:
recreational and leisure areas
; land and building register
; GWR
; Poland
; GIS
1. Introduction
Recreation and leisure have many definitions. Leisure is usually associated with time that is free from the demands of work, household duties, and other responsibilities of daily life. In turn, recreation denotes activities that are undertaken voluntarily in free time [1,2,3]. Research has shown that leisure and recreation can deliver physical, mental, and social benefits. Outdoor recreational activities improve physical health, exert therapeutic effects, alleviate stress, help individuals cope with negative life events, overcome disease and disability, and contribute to the management and prevention of obesity [4,5,6,7,8,9,10,11,12].
Areas dedicated to recreation and leisure promote daily relaxation, improve physical and mental health, and alleviate or eliminate daily stress. These areas play a particularly important role in large cities, where high-density development has a negative impact on the quality of life [13,14,15,16,17].
Recreational and leisure areas contribute to spatial order, and they are responsible for the unique character and ambience of cities, towns, and residential districts. These areas include both public spaces and private property, in particular those that have been designed for sightseeing and touring natural and historical monuments. Recreational and leisure areas also include allotment gardens in cities, where residents can relax after work and reduce stress from daily life [18,19,20].
The significance of recreational and leisure areas was particularly recognized during the COVID-19 pandemic. These areas attracted considerable public interest because they promoted relaxation during this period of restricted social mobility and delivered economic benefits by enabling residents to grow their own food in allotment gardens. Recreational and leisure areas provided important ecosystem services, delivered health benefits, promoted physical activity, and enabled users to overcome the psychological and physical burden of the pandemic [12,19,21,22,23,24,25,26,27].
Rapid urbanization and the associated changes in land cover and land use pose a significant threat to biodiversity. Industrialization decreases the size of agricultural land and forests which are transformed to densely developed areas. These changes are monitored by many research teams [28,29,30,31], and various risks associated with changes in land cover have been identified. Above all, these processes decrease biodiversity, lead to changes in groundwater levels, the quality of surface water, terrain, and microclimate, contribute to soil erosion, and pose a threat to human health [32,33,34,35,36,37,38,39,40].
Research into changes in land cover and land use generates information that gives serious cause for concern, but it also increases the public's awareness about the potential risks associated with these processes and increases public support for measures aiming to preserve the ecological balance and promote sustainable development. Stakeholders play an important role in preventing adverse changes in land use [41,42,43,44,45].
Due to the rise in environmental and social awareness, degraded areas are increasingly often reclaimed and converted to recreational sites. In the literature, there are numerous examples of defunct mines, industrial sites, and landfills that have been reclaimed or scheduled for reclamation to restore their biological diversity and multifunctional landscapes. Abandoned mines and industrial sites are converted to water reservoirs, parks, and industrial tourism zones. The unique features of former industrial sites are often preserved in the architectural design of the newly created recreational areas that provide artistic, cultural, and educational services [45,46,47,48,49,50,51,52,53,54,55].
Similar processes can be observed in Eastern Europe, including in Poland, where new land management options became available after Poland had joined the European Union (EU) in 2004. These processes were accelerated by changes in construction and spatial planning laws, the introduction of social and civic projects, and, above all, the acquisition of EU funds. For example, the Infrastructure and Environment Program was implemented to promote the development of technical infrastructure, to protect and restore the natural environment, to protect public health, to preserve cultural identity, and to promote territorial cohesion [18,56,57,58,59,60]. Rising income levels increased the demand for recreational and leisure areas and prompted Polish citizens to invest in their health. These processes induced changes in land use, and abandoned land, including farmland, was converted to recreational use [61,62,63,64].
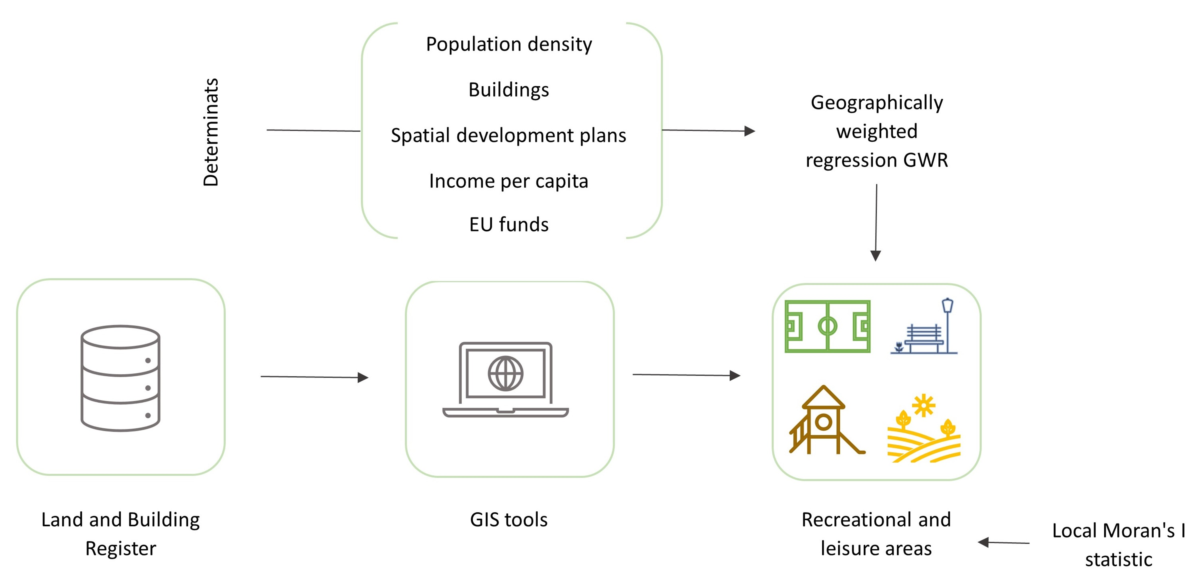
Geographic Information System (GIS) tools play an important role in research on recreational and leisure areas. These tools can be used to obtain information about the spatial distribution, structure, and availability of recreational areas [65,66,67,68,69]. This category of tools includes participatory GIS (PGIS) systems which provide access to information about land planned for recreational use and the needs of its users [70,71,72].
Geographically weighted regression (GWR) is one of the methods that are used in research studies examining the spatial attributes of recreational and leisure areas [73]. Kim and Nicholls [74,75] relied on GWR to examine social and demographic factors that are linked with access to public beaches in the Detroit metropolitan area. This method was also used to identify factors that affect roadside campgrounds in the Adirondack Park in New York, USA [76]. Wei et al. [77] analyzed factors that influence the distribution of green spaces in the Nanjing metropolitan area in China. In turn, Xu et al. [78] evaluated the impact of various socioeconomic factors on the distribution of green spaces in the Munich region in southern Germany. Lin et al. [79] relied on GWR to determine the influence of spatially diverse socioeconomic factors on access to parks in Fuzhou, China. Li and Liu [80] analyzed the effects of socioeconomic disadvantage on the availability of recreational and leisure areas in cities on the example of Shanghai (China). Shen et al. [81] used the GWR approach to assess spatial variation in the socioeconomic factors that affect the availability and spatial distribution of sports facilities in Nanning City in China.
Recreational and leisure areas significantly influence the quality of life, in particular in cities, and they are a highly interesting topic of study. Therefore, the main aim of this study was to determine the influence of various socioeconomic factors on the share and spatial distribution of recreational and leisure areas in Polish counties in 2022. The variables that determine the share of recreational and leisure areas in Polish counties were identified based on a review of the literature, and they are presented in Table 1.
2. Materials and Methods
2.1. Study area
The study was conducted in Poland, a country in Central-Eastern Europe with an area of 322,000 km2 and a population of 37.6 million (based on 2022 data). Poland joined the EU in 2004, and it is the fifth most populous country in the EU [95]. The neighboring countries are Germany in the west, Czechia and Slovakia in the south, Ukraine and Belarus in the east, and Lithuania in the north-east. Poland also shares a border with Russia (Kaliningrad Oblast) in the north. Norther Poland has access to the Baltic Sea (Figure 1). A three-tier system of territorial administration was introduced in Poland in 1999. Poland is divided into 16 voivodeships, 380 counties, including 66 cities and 2477 municipalities. The present study was conducted at the level of counties (Polish: powiat, second-level unit of administration in Poland) due to the availability of Land and Building Register data and socioeconomic indicators [97].
2.2. Data sources
Land cover data for research purposes are generally acquired with the use of remote sensing methods. Remote sensing data are not highly useful for analyzing changes in land use, in particular in recreational and leisure areas which are characterized by diverse land-use types and include a large number of areas with a small size.
The main source of data for this study were annual data from the Land and Building Register (Polish cadastral data) which are published by Statistics Poland and the Head Office of Geodesy and Cartography (GUGiK) on the national geoportal [98]. These data are compiled at every level of territorial administration, including municipalities, counties, voivodeships, as well as at country level. Land is classified into various land-use categories in the Land and Building Register. Recreational and leisure areas were defined as a separate land-use category in the Regulation of the Minister of Economic Development and Technology of 27 July 2021 on the Land and Building Register. Recreational and leisure areas include the following categories of non-built-up land:
Holiday resorts, playgrounds for children, beaches, managed parks, green squares, and pocket parks (physically separated from roads);
Historical areas such as castle ruins, fortified settlements, burial mounds, and natural monuments;
Sports grounds such as stadiums, playing fields, ski jumping hills, toboggan runs, shooting ranges, bathing areas, and golf courses;
Attraction parks such as funfairs and amusement parks;
Zoological and botanical gardens;
Unmanaged green spaces that are not classified as forests, woodland, or shrubland;
Allotment gardens on land that is not suitable for agricultural production, including forests, woodland, and shrubland [99].
Annual data for 2022, including information about the area of various land-use types (in ha) in Polish counties (separately for urban and rural areas) and land ownership, were obtained from the national geoportal in xls format with the use of a Python script. This tool was used to automatically extract information about recreational and leisure areas in Polish counties without opening the downloaded files. In addition, changes in the size of recreational and leisure areas in Polish voivodeships were determined between 2002 and 2022.
Socioeconomic data were obtained in the form of MS Excel spreadsheets from the Local Data Bank kept by Statistics Poland [97]. Statistics Poland publishes data for all three levels of territorial administration, but comprehensive information is not always provided at county level, which limited the availability of data for the study. Five variables were used in the analysis:
Population density (Pop_Density),
Number of residential buildings and residential-commercial buildings with at least one apartment (Buildings),
Area covered by local spatial development plans (Local_sp_dev _plan),
Income per capita (Income),
EU funds for financing EU programs and projects in 2011-2021 (EU_Funds).
Descriptive statistics were calculated for all variables (Table 2).
The variables were used in detailed analyses.
2.3 Methods
Spatial variation in the share of recreational and leisure areas in Polish counties was analyzed using GIS tools available in ArcGIS 10.8 software. Clusters of counties with a high and low concentration of recreational and leisure areas in 2022 were identified with the use of local Moran's I statistic.
Local Moran's I is a local spatial autocorrelation statistic that is applied to identify clusters of high and low values in the analyzed spatial units and the neighborhood [100,101]. Local Moran's I was calculated in each county from the following equations:
where: xi is an attribute of feature i; is the mean value of the corresponding attribute; w i j is the spatial weight between features i and j;
and:
where n is the total number of features. The tool calculates local Moran's I, the z-score, the pseudo p-value, and a code representing the type of cluster for each statistically significant feature. Z-scores and pseudo p-values denote the statistical significance of the computed indices.
The values of local Moran's I range from -1 to 1. The closer the value of local Moran's I is to 1, the greater the significance of positive clustering (hot spot when a high value is surrounded by high values, or cold spot when a low value is surrounded by low values). The closer the value of local Moran's I is to -1, the greater the significance of negative clustering (a high value surrounded by low values, or a low value surrounded by high values) [102].
Global ordinary least squares (OLS) regression was used to determine the global and spatially stationary influence of demographic, social, and economic factors on the share of recreational and leisure areas in Polish counties [103,104]. The global OLS regression model was calculated from the following equation:
where: yi is the ith observation of the dependent variable; β0 is a constant term; βj is the relationship between independent variables xij and y for the set of i locations, and εi is the error associated with location i.
The influence of demographic, social, and economic factors on the spatial distribution of recreational and leisure areas in Polish countries was also assessed with the use of GWR. This technique is used to detect local variations in the spatial distribution of variables that affect the analyzed phenomenon. GWR is an extension of the global regression model, and it was applied to estimate the local influence of demographic, social, and economic factors on the share of recreational and leisure areas in Polish countries. This method can be used to examine the spatial relationships between the modeled variables and to identify patterns. The GWR model was expressed by the following equation:
where: yi is the dependent variable; i is the analyzed voivodeship; β0 (ui, vi) is the location of the ith voivodeship; βj(ui, vi) is the regression parameter j of the ith observation which is a function of geographical location; xij is the independent variable, and εi is the random error of the ith voivodeship [105–107].
The data processing procedure is presented in a flowchart in Figure 2.
3. Results
3.1. Changes in the share of recreational and leisure areas in Polish voivodeships in 2002-2022
Recreational and leisure areas have a small share of Poland's total area and the area of Polish voivodeships. In 2022, these areas occupied 39,396 ha and accounted for only 0.22% of Poland's total area. The share of recreational and leisure areas was highest in the voivodeship of Silesia which was also characterized by the greatest increase in the above parameter in the last 20 years. The share of recreational and leisure areas was also high in the voivodeships of Lower Silesia and Opole. In the remaining voivodeships, the examined parameter did not exceed 0.3% of their area. With the exception of Silesia, no significant changes in the share of recreational and leisure areas in Polish voivodeships were noted between 2002 and 2022, although a growth trend was observed (Figure 3).
An analysis of recreational and leisure areas in the urban and rural areas of Polish voivodeships revealed that in 2019-2022, the studied parameter was highest in cities in the voivodeships of Silesia, Łódź, and Mazovia (Figure 4). Similar observations were made in the voivodeships of Lower Silesia, Kuyavia-Pomerania, Lublin, and Małopolska. In the remaining voivodeships, the share of recreational and leisure areas was higher in rural areas, in particular in the voivodeships of Opole, Wielkopolska, and Lubusz. A reverse trend was noted in two voivodeships, where the share of recreational and leisure areas increased in urban areas in Świętokrzyskie and in rural areas in Podkarpacie.
3.3 Clusters of recreational and leisure areas in Polish counties in 2022
Local Moran's I statistic was used to identify the spatial concentration of recreational and leisure areas in Polish counties in 2022. The results of the spatial autocorrelation analysis are presented in Figure 6. A cluster of counties with a high share of recreational and leisure areas was identified in the Upper Silesian Metropolitan Area in Silesian voivodeship. A somewhat smaller cluster was noted in the Tricity metropolitan area (Gdańsk-Sopot-Gdynia) in Pomeranian voivodeship. Larger clusters of counties with a small share of recreational and leisure areas were observed in central and eastern Poland in the voivodeships of Mazovia, Kuyavia-Pomerania, Warmia and Mazury, and Podlasie. Clusters of counties with a small share of recreational and leisure areas were also identified in the voivodeships of Łódź, Świętokrzyskie, and Lublin. Counties with high, statistically significant, values of the analyzed parameter surrounded by counties with a low share of recreational and leisure areas were also determined in urban counties in central Poland, including Częstochowa, Radom, Białystok, Suwałki, Siedlce, and Zamość.
3.4. Global and local models of the share of recreational and leisure areas in Polish counties in 2022
The global OLS regression model explaining the influence of selected variables on the share of recreational and leisure areas in Polish counties in 2022 was estimated (Table 3). In the global model, the coefficient of determination (R2) reached 0.6329, adjusted R2 reached 0.6280, and the Akaike Information Criterion (AIC) reached 1110.115. These results are satisfactory, and they point to significant relationships between socioeconomic variables and the share of recreational and leisure areas in counties. Four of the six analyzed variables were statistically significant (p < 0.01). Positive relationships were observed for population density (Pop_Density) and local zoning plans (Local_sp_dev _plan), which could be attributed to the fact that the demand for recreational areas tends to be higher in regions with high population density, as well as the fact that this demand is taken into consideration in local zoning plans. A negative relationship was noted between the share of recreational and leisure areas in counties and the number of buildings (Buildings).
The results of the analysis involving the GWR model are presented in a map in Figure 7. The local models' fit to empirical data was determined based on the coefficient of determination. The influence of local independent variables on the share of recreational and leisure areas in Polish counties and the effect size of the identified relationships are presented in Figure 8, Figure 9, Figure 10, Figure 11 and Figure 12. [111,112]. In the GWR model, R2 was determined at 0.8004, adjusted R2 reached 0.7702, and AIC reached 954.0272, which suggests that local models based on the GWR technique are characterized by a higher goodness of fit. Higher values of R2 point to a greater explanatory power of the regression model, and lower values of AIC indicate that the model better fits the observed data. A GWR model with an adaptive kernel function was used due to changes in the density of observations. The resulting AIC was lower than that noted in a GWR model with a fixed kernel function (957.4852).
The accuracy of the GWR model in estimating the influence of local socioeconomic factors on the share of recreational and leisure areas in Polish counties was characterized by spatial variation (Figure 6). The analyzed parameters were most accurately estimated in western Poland, in particular in the voivodeships of Lubusz, Wielkopolska, in some counties of Kuyavia-Pomerania, Western Pomerania, and Lower Silesia, as well as in the counties along the borders of the voivodeships of Mazovia, Lublin, and Świętokrzyskie.
GWR coefficients describing spatial variation in the relationships between the share of recreational and leisure areas in Polish counties in 2022 and socioeconomic variables (Table 4) point to positive relationships with population density and the area covered by local zoning plans. In most cases, the number of residential and residential-commercial buildings, EU funds for financing EU programs and projects in 2011-2021, and the distance from regional capitals were negatively associated with the analyzed parameter. Income per capita had a varied influence on the share of recreational and leisure areas in Polish counties, and this variable assumed both positive and negative values.
Population density (Pop_Density) exerted the strongest influence on the share of recreational and leisure areas in Polish counties in 2022. The higher the population density, the greater the share of recreational and leisure areas (Figure 7). A significant relationship between the share of recreational and leisure areas and population density was noted in the vast majority of counties, excluding in the voivodeships of Warmia and Mazury, and Podlasie in northern Poland. The above relationship was strongest in the voivodeships of Opole, Silesia and Małopolska in southern Poland, in the southern parts of Łódź and Świętokrzyskie voivodeships, in the eastern part of Lower Silesian voivodeship, and in Western Pomeranian voivodeship in north-western Poland.
In Silesian voivodeship, the strong relationship between the above parameters is consistent with the presence of a cluster of counties with a high share of recreational and leisure areas in the Upper Silesian conurbation. The weakest relationship was noted in north-eastern Poland, where a cluster of counties with a low share of recreational and leisure areas was identified. This relationship can be explained by the fact that Warmia and Mazury, and Podlasie are Polish voivodeships with the lowest population density. Population density is highest in the voivodeships of Silesia and Małopolska.
The number of residential and residential-commercial buildings (Buildings) had a negative influence on the share of recreational and leisure areas in Polish counties in 2022. The lower the number of buildings, the greater the share of recreational and leisure areas, which is an expected result because recreational and leisure areas occupy non-built-up areas. This variable exerted a significant effect in the voivodeships of Opole, Silesia, and Małopolska in southern Poland, in some counties in Podkarpacie voivodeship, in the voivodeships of Łódź, Świętokrzyskie, Mazovia, and Kuyavia-Pomerania, and in northern Poland in the voivodeships of Pomerania and Warmia and Mazury, and in the eastern part of the West Pomeranian voivodeship (Figure 9). The analyzed relationship was strongest in the voivodeships of Silesia and Małopolska in southern Poland, in the neighboring voivodeships of Świętokrzyskie, Łódź, and Opole, as well as in several counties located on the Baltic coast in northern Poland.
Another variable, the area covered by local spatial development plans (Local_sp_dev _plan), was significantly related to the share of recreational and leisure areas in Polish counties situated in the voivodeships of Opole, Silesia, and Małopolska in southern Poland, and in some counties situated in the voivodeships of Łódź, Świętokrzyskie, Podkarpacie, and Lower Silesia (Figure 10). The strongest positive influence of this variable was also observed in this region. The above implies that the greater the area covered by local zoning plans, the higher the share of recreational and leisure areas in a given county. Local zoning plans introduce spatial order by promoting cohesive architecture and landscape, including in recreational and leisure areas which exert a positive effect on the residents' physical and mental health.
Income per capita (Income) was significantly related to the share of recreational and leisure areas in Polish counties, and both positive and negative relationships were observed in different parts of the country (Figure 11). A negative influence of this variable was noted in southern Poland in the voivodeships of Silesia and Małopolska, and in selected counties in the voivodeships of Opole, Łódź, Świętokrzyskie, Podkarpacie, and Lower Silesia. In these counties, the lower the income per capita, the higher the share of recreational and leisure areas. In turn, a positive influence was observed in northern Poland in the voivodeships of Warmia and Mazury, Pomerania, and Kuyavia-Pomerania, and in the northern parts of the voivodeships of Podlasie, Mazovia, and Wielkopolska. In these counties, the higher the income per capita, the higher the share of recreational and leisure areas. These seemingly contradictory trends can be linked with population density which is significantly higher in the voivodeships of Silesia, Małopolska, and Lower Silesia in southern Poland. These voivodeships are also the most developed Polish regions (after the Warsaw region), and most land is zoned for non-recreational use. A positive influence of income per capita on the analyzed parameter in northern Poland implies that higher-income counties can afford to implement solutions that improve the quality of life, including recreational and leisure areas.
A significant negative relationship between EU funds for financing EU programs and projects in 2011-2021 (EU_Funds) and the share of recreational and leisure areas was observed in a small number of counties in the voivodeships of Opole and Silesia, and in the southern parts of Łódź and Świętokrzyskie voivodeships (Figure 12). This variable exerted a negative effect, which implies that the lower the value of EU funds, the higher the share of recreational and leisure areas in those counties. The purpose of EU funds is to reduce socioeconomic differences between European countries and regions, and to increase the competitiveness of the EU Member States and the EU on the global market. Therefore, regions with a less developed economy or infrastructure and a lower share of recreational and leisure areas, such as Lublin voivodeship, receive more funding for projects and investments than, for example, Silesian voivodeship which ranks second in terms of economic development and GDP in Poland. However, some less developed and less populated regions that receive less funding for EU programs and projects, such as Opole voivodeship, are characterized by a high share of recreational and leisure areas in counties.
4. Discussion and Conclusions
The aim of this study was to empirically verify the influence of selected socioeconomic variables on the share of recreational and leisure areas in Polish counties in 2022. The analysis was conducted with the use of the GWR method and local Moran's I statistic. These methods have been validated by other researchers [13,78–81] who reported that local models are more effective than the global OLS regression model in explaining non-stationary spatial phenomena, including factors that affect the share of recreational and leisure areas.
The study demonstrated that recreational and leisure areas play a vital role in local development. These areas not only contribute to human health [7,9,10], but also promote economic growth and spatial planning, which is why they constitute a separate land-use category in public registers, including the Land and Building Register [99]. The statistical analysis revealed that the share of recreational and leisure areas in Polish counties remained fairly stable in the last 20 years, with a certain growth trend. Despite the fact that Poland experienced profound socioeconomic changes in recent decades, in particular after joining the EU in 2004, recreational and leisure areas have not been considerably reduced. However, these areas experience strong urbanization pressure in rapidly developing regions [113–115].
The present findings indicate the share of recreational and leisure areas is much higher in cities than in the surrounding counties (Figure 4). This observation confirms that these areas play a very important social role by improving the quality of life [14,50,63,80]. In some counties, such as Chorzów, the share of recreational and leisure areas was as high as 19%. Chorzów is situated in Silesian voivodeship which is the second most rapidly developing Polish region (after the Warsaw region) that contributes nearly 12% to the GDP and has a very high population density in excess of 352 people per km2 [97]. The high share of recreational and leisure areas in Silesia, which is manifested by a cluster of counties with a high share of recreational and leisure areas (Figure 5), should also be analyzed in the historical context. Silesia has been a hub of mining and metallurgical industries for many centuries, and the resulting pollution significantly decreases the quality of life in the region. To address this problem, attempts have been made to increase the local residents' access to recreational and leisure areas by protecting the existing sites and designating new areas in local zoning plans [116]. The Culture and Leisure Park in Chorzów is one of such initiatives. The park was created in the 1950s by reclaiming degraded mining areas, and it occupies more than 16% of the city's area [109,110]. A number of industrial programs aiming to reclaim and revitalize industrial areas have been implemented in the region in recent years, which could also explain the high share of recreational and leisure areas in Silesian counties [49,51,117,118].
The presence of cause-and-effect relationships cannot be inferred from the results of this study, but significant relationships were noted between the analyzed variables and the share of recreational and leisure areas in Polish counties. The studied parameter was positively related to population density (Pop_Density) (Figure 8) and the area covered by local spatial development plans (Local_sp_dev _plan) (Figure 10). It should also be noted that population density exerted a significant influence on the share of recreational and leisure areas in the vast majority of Polish counties. The analyzed parameter was negatively related to the number of residential and residential-commercial buildings (Buildings) (Figure 11) and EU funds for financing EU programs and projects in 2011-2021 (EU_Funds) (Figure 12). Interestingly, income per capita (Income) was both positively and negatively related to the share of recreational and leisure areas in Polish counties (Figure 11).
The results of this study corroborate the findings of other authors. Liu et al. [77] observed that socioeconomic factors influence the spatial distribution of recreational and leisure areas. The cited authors found that income levels exert a varied influence on the availability of green spaces, depending on the economic model in a given area, and that urbanization affects green spaces. According to Lewandowicz [119], recreational sites in highly developed areas contribute to recreational and tourist activity and improve the economic performance of these areas. The availability of recreational and leisure areas and the development of businesses providing recreational services are influenced by population rather than landscape attractiveness. Similar observations were made by Shen et al. and Xu et al. [78,81] who found that population density affects the distribution of recreational and leisure areas. Liu et al. [120] also attempted to identify factors that affect the spatial distribution of recreational areas. They found that in addition to environmental conditions, demand, consumer preferences, and land prices, the distribution of recreational areas was also influenced by spatial development policies and spatial management. Effective spatial planning can contribute to the uniform distribution of recreational and leisure areas. The impact of spatial planning on the distribution of urban green spaces was also confirmed by Li and Liu [80]. In the present study, the impact of EU funds was the most controversial variable. According to Biegańska et al. [92], EU funds have significantly contributed to the development of sports and recreational infrastructure in Poland. However, in the current study, this variable exerted a generally negative effect on the share of recreational and leisure areas, and it was significant in a very small number of counties (Figure 12). Further research is needed to address this topic because EU funds have been found to have a limited impact on changes in land cover [121]. A more detailed classification of recreational and leisure areas should also be adopted in future research to determine whether the analyzed variables exert varied effects on various types of recreational areas. The influence of other factors, such as qualitative variables or environmental variables, could also be investigated in the future.
From the methodological point of view, annual cadastral data from the Land and Building register at county level is a valuable source of data which can be used to analyze the influence of socioeconomic factors on the share of recreational and leisure areas in Polish counties. The present study confirmed that local models estimated with the GWR method effectively explain non-stationary spatial phenomena.
Author Contributions
Conceptualization E.L and M.N.; methodology M.N and E.L.; software, M.N.; validation E.L..; formal analysis, M.N. and E.L; investigation, M.N. and E.L.; resources, M.N; data curation, M.N; writing—original draft preparation, M.N. and E.L; writing—review and editing, E.L and M.N.; visualization, M.N; supervision, E.L.; project administration, E.L; funding acquisition, E.L. All authors have read and agreed to the published version of the manuscript.
Funding
This research was financed as part of a statutory research project of the Faculty of Geoengineering of the University of Warmia and Mazury in Olsztyn, Poland, entitled “Geoinformation from the Theoretical, Analytical and Practical perspective” (No. 29.610.008-110_timeline: 2023–2025).
Institutional Review Board Statement
Not applicable.
Informed Consent Statement
Not applicable.
Data Availability Statement
The public datasets analyzed in this study are available at: https://mapy.geoportal.gov.pl/imap/Imgp_2.html (accessed on 15 November 2022) and https://bdl.stat.gov.pl/bdl/start (accessed on 10 May 2023).
Acknowledgments
This work has been supported by the Faculty of Geographical Sciences of the University of Lodz.
Conflicts of Interest
The authors declare no conflict of interest.
References
- Williams, S. Tourism and Recreation; Pearson Education, 2003; ISBN 0582320267. [Google Scholar]
- Torkildsen, G. Leisure and Recreation Management; Routledge, 2012; ISBN 020347757X. [Google Scholar]
- Tribe, J. The Economics of Recreation, Leisure and Tourism; Routledge, 2020; ISBN 1000041433. [Google Scholar]
- Siyahtas, A.; Çakir, V.O. The Effect of Benefits Gained from Leisure Activities on Entrepreneurship and Academic Hopelessness. J. Educ. Issues 2021, 7, 87–108. [Google Scholar] [CrossRef]
- Henderson, K.A.; Bialeschki, M.D. Leisure and Active Lifestyles: Research Reflections. Leis. Sci. 2005, 27, 355–365. [Google Scholar] [CrossRef]
- Caldwell, L.L. Leisure and Health: Why Is Leisure Therapeutic? Br. J. Guid. Counc. 2005, 33, 7–26. [Google Scholar] [CrossRef]
- Godbey, G. Outdoor Recreation, Health, and Wellness: Understanding and Enhancing the Relationship. 2009.
- Siegenthaler, K.L. Health Benefits of Leisure. Research Update. Park. Recreat. 1997, 32. [Google Scholar]
- van der Pas, S.; Koopman-Boyden, P. Leisure and Recreation Activities and Wellbeing among Older New Zealanders. Enhancing wellbeing an ageing Soc. 2009, 65–84. [Google Scholar]
- Henderson, K.A. The Contributions of Leisure and Active Recreation to Health and Well-Being. African J. Phys. Heal. Educ. Recreat. Danc. 2012, 18, 52–63. [Google Scholar]
- Litwiller, F.; White, C.; Gallant, K.; Hutchinson, S.; Hamilton-Hinch, B. Recreation for Mental Health Recovery. Leisure/Loisir 2016, 40, 345–365. [Google Scholar] [CrossRef]
- Afiyah, R.K.; Wardani, E.M.; Kamariyah, N.; Wijayanti, L.; Zuwariah, N.; Putri, D.I.T.P.; Yhusnain, J.R. Exercises and Recreation Are Important to Improve the Health of Pregnant Women in the Covid-19 Pandemic. In Proceedings of the AIP Conference Proceedings; AIP Publishing, 2023; Vol. 2679.
- Lee, K.H. Mental Health and Recreation Opportunities. Int. J. Environ. Res. Public Health 2020, 17. [Google Scholar] [CrossRef] [PubMed]
- Chiesura, A. The Role of Urban Parks for the Sustainable City. Landsc. Urban Plan. 2004, 68, 129–138. [Google Scholar] [CrossRef]
- Ketova, E.; Lesotova, J. Recreational Areas as a Basis of the Municipal and Urban Territories’ Ecological Framework. In Proceedings of the MATEC Web of Conferences; EDP Sciences, 2018; Vol. 170, p. 4009.
- Seifu, S.; Stellmacher, T. Accessibility of Public Recreational Parks in Addis Ababa, Ethiopia: A GIS Based Analysis at Sub-City Level. Urban For. Urban Green. 2021, 57, 126916. [Google Scholar] [CrossRef]
- Kara, F.; Demirci, A. Spatial Analysis and Facility Characteristics of Outdoor Recreational Areas in Istanbul. Environ. Monit. Assess. 2010, 164, 593–603. [Google Scholar] [CrossRef]
- Mokras-Grabowska, J. Allotment Gardening in Poland – New Practices and Changes in Recreational Space. Misc. Geogr. 2020, 24, 245–252. [Google Scholar] [CrossRef]
- Schoen, V.; Blythe, C.; Caputo, S.; Fox-Kämper, R.; Specht, K.; Fargue-Lelièvre, A.; Cohen, N.; Poniży, L.; Fedeńczak, K. “We Have Been Part of the Response”: The Effects of COVID-19 on Community and Allotment Gardens in the Global North. Front. Sustain. Food Syst. 2021, 5, 732641. [Google Scholar] [CrossRef]
- Moskalonek, Ż.; Połom, M.; Puzdrakiewicz, K. Changes in the Function of Allotment Gardens in an Attractive Location Based on the Example of Tri-City in Poland. Land 2020, 9. [Google Scholar] [CrossRef]
- Cattivelli, V. Review and Analysis of the Motivations Associated with Urban Gardening in the Pandemic Period. Sustainability 2023, 15. [Google Scholar] [CrossRef]
- Venter, Z.S.; Barton, D.N.; Gundersen, V.; Figari, H.; Nowell, M. Urban Nature in a Time of Crisis: Recreational Use of Green Space Increases during the COVID-19 Outbreak in Oslo, Norway. Environ. Res. Lett. 2020, 15, 104075. [Google Scholar] [CrossRef]
- Venter, Z.S.; Barton, D.N.; Gundersen, V.; Figari, H.; Nowell, M.S. Back to Nature: Norwegians Sustain Increased Recreational Use of Urban Green Space Months after the COVID-19 Outbreak. Landsc. Urban Plan. 2021, 214, 104175. [Google Scholar] [CrossRef]
- Bamwesigye, D.; Fialová, J.; Kupec, P.; Łukaszkiewicz, J.; Fortuna-Antoszkiewicz, B. Forest Recreational Services in the Face of COVID-19 Pandemic Stress. Land 2021, 10. [Google Scholar] [CrossRef]
- Derks, J.; Giessen, L.; Winkel, G. COVID-19-Induced Visitor Boom Reveals the Importance of Forests as Critical Infrastructure. For. Policy Econ. 2020, 118, 102253. [Google Scholar] [CrossRef] [PubMed]
- Noszczyk, T.; Gorzelany, J.; Kukulska-Kozieł, A.; Hernik, J. The Impact of the COVID-19 Pandemic on the Importance of Urban Green Spaces to the Public. Land use policy 2022, 113, 105925. [Google Scholar] [CrossRef]
- Jūrmalis, E.; Lībiete, Z.; Bārdule, A. Outdoor Recreation Habits of People in Latvia: General Trends, and Changes during the COVID-19 Pandemic. Sustainability 2022, 14. [Google Scholar] [CrossRef]
- Seto, K.C.; Güneralp, B.; Hutyra, L.R. Global Forecasts of Urban Expansion to 2030 and Direct Impacts on Biodiversity and Carbon Pools. Proc. Natl. Acad. Sci. 2012, 109, 16083–16088. [Google Scholar] [CrossRef]
- Szumacher, I.; Pabjanek, P. Temporal Changes in Ecosystem Services in European Cities in the Continental Biogeographical Region in the Period from 1990–2012. Sustainability 2017, 9. [Google Scholar] [CrossRef]
- Hyka, I.; Hysa, A.; Dervishi, S.; Solomun, M.K.; Kuriqi, A.; Vishwakarma, D.K.; Sestras, P. Spatiotemporal Dynamics of Landscape Transformation in Western Balkan’s Metropolitan Areas. Land 2022, 11. [Google Scholar] [CrossRef]
- Kumari, A.; Upadhyaya, A.; Nagarkar, S.S.; Reddy, N.M.; Kumar, R.; Singh, A.K. Decadal Land Use Land Cover Change Analysis Using Remote Sensing and GIS in Nagpur City of Maharashtra, India: Decadal Land Use Land Cover Change Analysis of Nagpur. J. AgriSearch 2022, 9, 265–269. [Google Scholar] [CrossRef]
- Baldwin, R.F. Identifying Keystone Threats to Biological Diversity BT - Landscape-Scale Conservation Planning. In; Trombulak, S.C., Baldwin, R.F., Eds.; Springer Netherlands: Dordrecht, 2010; pp. 17–32. ISBN 978-90-481-9575-6. [Google Scholar]
- Krasowska, K.; Paszkowski, Z.W. The Need to Maintain Sustainability in the Dynamic Anthropogenic Changes in the Natural Landscape of the Bay of Pomerania in Poland. Sustainability 2023, 15. [Google Scholar] [CrossRef]
- Alkharabsheh, M.M.; Alexandridis, T.K.; Bilas, G.; Misopolinos, N.; Silleos, N. Impact of Land Cover Change on Soil Erosion Hazard in Northern Jordan Using Remote Sensing and GIS. Procedia Environ. Sci. 2013, 19, 912–921. [Google Scholar] [CrossRef]
- Jetz, W.; Wilcove, D.S.; Dobson, A.P. Projected Impacts of Climate and Land-Use Change on the Global Diversity of Birds. PLoS Biol. 2007, 5, e157. [Google Scholar] [CrossRef]
- Yuan, L.; Fei, W.; Jia, F.; Junping, L.; Qi, L.; Fangru, N.; Xudong, L.; Lan, X.; Shulian, X. Increased Health Threats from Land Use Change Caused by Anthropogenic Activity in an Endemic Fluorosis and Arsenicosis Area. Environ. Pollut. 2020, 261, 114130. [Google Scholar] [CrossRef]
- Hanif, M.; Putra, B.G.; Nizam, K.; Rahman, H.; Nofrizal, A.Y. Multi Spectral Satellite Data to Investigate Land Expansion and Related Micro Climate Change as Threats to the Environment. In Proceedings of the IOP Conference Series: Earth and Environmental Science. IOP Publishing, 2019; Vol. 303, p. 12030.
- Khan, I.; Lei, H.; Muhammad, I.; Khan, A.; Lei, M. Do Changes in Land Use, Water Bodies, and Grazing Pastures Have a Detrimental Influence on Environmental Quality? Opportunities and Threats to Long-Term Growth. J. Environ. Manage. 2023, 325, 116609. [Google Scholar] [CrossRef]
- Falcucci, A.; Maiorano, L.; Boitani, L. Changes in Land-Use/Land-Cover Patterns in Italy and Their Implications for Biodiversity Conservation. Landsc. Ecol. 2007, 22, 617–631. [Google Scholar] [CrossRef]
- Cole, J.R.; Kross, A.; Jaeger, J.A.G. Monitoring Changes in Landscape Structure in the Adirondack-to-Laurentians (A2L) Transboundary Wildlife Linkage between 1992 and 2018: Identifying Priority Areas for Conservation and Restoration. Landsc. Ecol. 2023, 38, 383–408. [Google Scholar] [CrossRef]
- Asay, G.L.; Hendricks, H.Z.; Long-Meek, E.; Cope, M.R. Charting Sustainable Land Management Futures by Looking to the Past: The Case of Bears Ears National Monument. Land 2023, 12. [Google Scholar] [CrossRef]
- Eadens, L.M.; Jacobson, S.K.; Stein, T.V.; Confer, J.J.; Gape, L.; Sweeting, M. Stakeholder Mapping for Recreation Planning of a Bahamian National Park. Soc. Nat. Resour. 2009, 22, 111–127. [Google Scholar] [CrossRef]
- Fitzsimons, J.; Pearson, C.J.; Lawson, C.; Hill, M.J. Evaluation of Land-Use Planning in Greenbelts Based on Intrinsic Characteristics and Stakeholder Values. Landsc. Urban Plan. 2012, 106, 23–34. [Google Scholar] [CrossRef]
- Wesley, J.M.; Ainsworth, E.L. Creating Communities of Choice: Stakeholder Participation in Community Planning. Societies 2018, 8. [Google Scholar] [CrossRef]
- Kantor-Pietraga, I.; Krzysztofik, R.; Solarski, M. Planning Recreation around Water Bodies in Two Hard Coal Post-Mining Areas in Southern Poland. Sustainability 2023, 15. [Google Scholar] [CrossRef]
- Jia, Q.; Zhang, T.; Cheng, L.; Cheng, G.; Jin, M. The Impact of the Neighborhood Built Environment on the Walking Activity of Older Adults: A Multi-Scale Spatial Heterogeneity Analysis. Sustainability 2022, 14. [Google Scholar] [CrossRef]
- Napierała, T.; Leśniewska-Napierała, K.; Nalej, M.; Pielesiak, I. Co-Evolution of Tourism and Industrial Sectors: The Case of the Bełchatów Industrial District. Eur. Spat. Res. Policy 2022. [Google Scholar] [CrossRef]
- Bielecka, M.; Król-Korczak, J. Hybrid Expert System Aiding Design of Post-Mining Regions Restoration. Ecol. Eng. 2010, 36, 1232–1241. [Google Scholar] [CrossRef]
- Kivinen, S. Sustainable Post-Mining Land Use: Are Closed Metal Mines Abandoned or Re-Used Space? Sustainability 2017, 9. [Google Scholar] [CrossRef]
- Mokras-Grabowska, J. New Urban Recreational Spaces. Attractiveness, Infrastructure Arrangements, Identity. The Example of the City of Łódź. Misc. Geogr. Reg. Stud. Dev. 2018, 22, 219–224. [Google Scholar] [CrossRef]
- Dormidontova, V.; Belkin, A. The Use of Post-Industrial Areas in the Formation of the Recreational Environment of the City. IOP Conf. Ser. Mater. Sci. Eng. 2018, 463, 32091. [Google Scholar] [CrossRef]
- Kalybekov, T.; Sandibekov, M.; Rysbekov, K.; Zhakypbek, Y. Substantiation of Ways to Reclaim the Space of the Previously Mined-out Quarries for the Recreational Purposes. In Proceedings of the E3S Web of Conferences. EDP Sciences, 2019; Vol. 123, p. 1004.
- Długoński, A. Recreational Development of Old Landfill: The Case Study of Górka Rogowska Landfill in Łódź City, Poland. Detritus 2018, 2, 155–162. [Google Scholar] [CrossRef]
- Chylińska, D.; Kołodziejczyk, K. Krajobrazy Zdegradowane Jako Atrakcja Turystyczna Oraz Miejsce Wypoczynku i Rekreacji. Turyzm 2017, 27, 23–33. [Google Scholar] [CrossRef]
- Pactwa, K.; Woźniak, J.; Dudek, M. Sustainable Social and Environmental Evaluation of Post-Industrial Facilities in a Closed Loop Perspective in Coal-Mining Areas in Poland. Sustainability 2021, 13. [Google Scholar] [CrossRef]
- Niesyto, J.; Lovasova, R. The EU Funds as a Chance of the Regional Development in Reference to the Sport Infrastructure in Years 2007-2013. Polish J. Manag. Stud. 2015, 11, 100–112. [Google Scholar]
- Ministerstwo Funduszy i Polityki Regionalnej Portal Funduszy Europejskich Available online: https://www.funduszeeuropejskie.gov.pl/.
- Biczkowski, M. LEADER as a Mechanism of Neo-Endogenous Development of Rural Areas: The Case of Poland. Misc. Geogr. 2020, 24, 232–244. [Google Scholar] [CrossRef]
- Sobczyk, K.; Grajek, M.; Rozmiarek, M.; Sas-Nowosielski, K. Local Governments Spending on Promoting Physical Activity during 2015–2020: Financial Data and the Opinion of Residents in Poland. Int. J. Environ. Res. Public Health 2022, 19. [Google Scholar] [CrossRef]
- Zielińska-Szczepkowska, J.; Jaszczak, A.; Žukovskis, J. Overcoming Socio-Economic Problems in Crisis Areas through Revitalization of Cittaslow Towns. Evidence from North-East Poland. Sustainability 2021, 13. [Google Scholar] [CrossRef]
- Leśniewska-Napierała, K.; Nalej, M.; Napierała, T. The Impact of EU Grants Absorption on Land Cover Changes—The Case of Poland. Remote Sens. 2019, 11, 2359. [Google Scholar] [CrossRef]
- Szczepańska, A.; Zagroba, M.; Pietrzyk, K. Participatory Budgeting as a Method for Improving Public Spaces in Major Polish Cities. Soc. Indic. Res. 2022, 162, 231–252. [Google Scholar] [CrossRef]
- Puciato, D.; Rozpara, M.; Borysiuk, Z. Physical Activity as a Determinant of Quality of Life in Working-Age People in Wrocław, Poland. Int. J. Environ. Res. Public Health 2018, 15, 623. [Google Scholar] [CrossRef] [PubMed]
- Urbaniak-Brekke, A.M.; Solbraa, T. Factors Influencing Physical Activity Level of the Inhabitants in Norway and Poland-the Case of Sports and Recreation Infrastructure. Phys. Act. Rev. 2019, 96–106. [Google Scholar] [CrossRef]
- Jing, Y.; Liu, Y.; Cai, E.; Liu, Y.; Zhang, Y. Quantifying the Spatiality of Urban Leisure Venues in Wuhan, Central China – GIS-Based Spatial Pattern Metrics. Sustain. Cities Soc. 2018, 40, 638–647. [Google Scholar] [CrossRef]
- Nicholls, S. Measuring the Accessibility and Equity of Public Parks: A Case Study Using GIS. Manag. Leis. 2001, 6, 201–219. [Google Scholar] [CrossRef]
- Higgs, G.; Langford, M.; Norman, P. Accessibility to Sport Facilities in Wales: A GIS-Based Analysis of Socio-Economic Variations in Provision. Geoforum 2015, 62, 105–120. [Google Scholar] [CrossRef]
- Pearce, J.; Witten, K.; Bartie, P. Neighbourhoods and Health: A GIS Approach to Measuring Community Resource Accessibility. J. Epidemiol. Community Health 2006, 60, 389 LP – 395. [Google Scholar] [CrossRef]
- Morar, T.; Radoslav, R.; Spiridon, L.C.; PĂCURAR, L. Assessing Pedestrian Accessibility to Green Space Using GIS. Transylvanian Rev. Adm. Sci. 2014, 10, 116–139. [Google Scholar]
- Brown, G.; Schebella, M.F.; Weber, D. Using Participatory GIS to Measure Physical Activity and Urban Park Benefits. Landsc. Urban Plan. 2014, 121, 34–44. [Google Scholar] [CrossRef]
- Hansen, A.S.; Glette, V.; Arce, J.F. Mapping Recreational Activities in Coastal and Marine Areas–PPGIS Findings from Western Sweden. Ocean Coast. Manag. 2021, 205, 105567. [Google Scholar] [CrossRef]
- Hedenborg, S.; Fredman, P.; Hansen, A.S.; Wolf-Watz, D. Outdoorification of Sports and Recreation: A Leisure Transformation under the COVID-19 Pandemic in Sweden. Ann. Leis. Res. 2022, 1–19. [Google Scholar] [CrossRef]
- Nicholls, S.; Kim, J. Spatial Is Special: The Need to Consider Spatial Effects in Leisure Research. Leis. Sci. 2022, 44, 476–496. [Google Scholar] [CrossRef]
- Kim, J.; Nicholls, S. Access for All? Beach Access and Equity in the Detroit Metropolitan Area. J. Environ. Plan. Manag. 2018, 61, 1137–1161. [Google Scholar] [CrossRef]
- Kim, J.; Nicholls, S. Using Geographically Weighted Regression to Explore the Equity of Public Open Space Distributions. J. Leis. Res. 2016, 48, 105–133. [Google Scholar] [CrossRef]
- Kima, Min-Kook; Graefe, D. Geographically Weighted Regression to Explore Spatially Varying Relationships of Recreation Resource Impacts: A Case Study from Adirondack Park, New York, USA. J. Park Recreat. Adm. 2021, 39, 43–63. [Google Scholar] [CrossRef]
- Liu, W.; Li, H.; Xu, H.; Zhang, X.; Xie, Y. Spatiotemporal Distribution and Driving Factors of Regional Green Spaces during Rapid Urbanization in Nanjing Metropolitan Area, China. Ecol. Indic. 2023, 148, 110058. [Google Scholar] [CrossRef]
- Xu, C.; Haase, D.; Pribadi, D.O.; Pauleit, S. Spatial Variation of Green Space Equity and Its Relation with Urban Dynamics: A Case Study in the Region of Munich. Ecol. Indic. 2018, 93, 512–523. [Google Scholar] [CrossRef]
- Lin, Y.; Zhou, Y.; Lin, M.; Wu, S.; Li, B. Exploring the Disparities in Park Accessibility through Mobile Phone Data: Evidence from Fuzhou of China. J. Environ. Manage. 2021, 281, 111849. [Google Scholar] [CrossRef] [PubMed]
- Li, H.; Liu, Y. Neighborhood Socioeconomic Disadvantage and Urban Public Green Spaces Availability: A Localized Modeling Approach to Inform Land Use Policy. Land use policy 2016, 57, 470–478. [Google Scholar] [CrossRef]
- Shen, J.; Cheng, J.; Huang, W.; Zeng, F. An Exploration of Spatial and Social Inequalities of Urban Sports Facilities in Nanning City, China. Sustainability 2020, 12. [Google Scholar] [CrossRef]
- Kochel, L.; Zieliński, M. Tereny Zieleni a Potencjał Rekreacyjno-Wypoczynkowy Na Przykładzie Krakowa. Teka Kom. Urban. i Archit. Oddziału Pol. Akad. Nauk w Krakowie 2021, XLIX, 47–78. [Google Scholar] [CrossRef]
- Caspersen, O.H.; Konijnendijk, C.C.; Olafsson, A.S. Green Space Planning and Land Use: An Assessment of Urban Regional and Green Structure Planning in Greater Copenhagen. Geogr. Tidsskr. J. Geogr. 2006, 106, 7–20. [Google Scholar] [CrossRef]
- Kim, J.; Lyu, S.O.; Song, H. Environmental Justice and Public Beach Access. City Community 2019, 18, 49–70. [Google Scholar] [CrossRef]
- Zhang, R.; Zhang, C.-Q.; Cheng, W.; Lai, P.C.; Schüz, B. The Neighborhood Socioeconomic Inequalities in Urban Parks in a High-Density City: An Environmental Justice Perspective. Landsc. Urban Plan. 2021, 211, 104099. [Google Scholar] [CrossRef]
- Roemmich, J.N.; Epstein, L.H.; Raja, S.; Yin, L.; Robinson, J.; Winiewicz, D. Association of Access to Parks and Recreational Facilities with the Physical Activity of Young Children. Prev. Med. (Baltim). 2006, 43, 437–441. [Google Scholar] [CrossRef] [PubMed]
- de Aranzabal, I.; Schmitz, M.F.; Pineda, F.D. Integrating Landscape Analysis and Planning: A Multi-Scale Approach for Oriented Management of Tourist Recreation. Environ. Manage. 2009, 44, 938–951. [Google Scholar] [CrossRef] [PubMed]
- Rees, S.E.; Mangi, S.C.; Hattam, C.; Gall, S.C.; Rodwell, L.D.; Peckett, F.J.; Attrill, M.J. The Socio-Economic Effects of a Marine Protected Area on the Ecosystem Service of Leisure and Recreation. Mar. Policy 2015, 62, 144–152. [Google Scholar] [CrossRef]
- Curry, N. Community Participation in Outdoor Recreation and the Development of Millennium Greens in England. Leis. Stud. 2000, 19, 17–35. [Google Scholar] [CrossRef]
- Moore, L.V.; Diez Roux, A.V.; Evenson, K.R.; McGinn, A.P.; Brines, S.J. Availability of Recreational Resources in Minority and Low Socioeconomic Status Areas. Am. J. Prev. Med. 2008, 34, 16–22. [Google Scholar] [CrossRef] [PubMed]
- Tarrant, M.A.; Cordell, H.K. Environmental Justice and the Spatial Distribution of Outdoor Recreation Sites: An Application of Geographic Information Systems. J. Leis. Res. 1999, 31, 18–34. [Google Scholar] [CrossRef]
- Biegańska, J.; Środa-Murawska, S.; Grzelak-Kostulska, E. Significance of EU Funds in the Creation of Sport and Recreation Infrastructure in Poland in the Context of the Cohesion Policy.; November 27 2014; pp. 409–416. 27 November.
- Hadzik, A.; Grabara, M. Investments in Recreational and Sports Infrastructure aS A Basis for the Development of Sports Tourism On the Example of Spa Municipalities. Polish J. Sport Tour. 3914, 21, 97–101. [Google Scholar] [CrossRef]
- Nash, R.; Koyabe, D.; Stansbie, P. Impact of European Union Funding on Tourism in the Grampian Region. Int. J. Tour. Res. 2006, 8, 247–261. [Google Scholar] [CrossRef]
- Eurostat Population Change - Demographic Balance and Crude Rates at National Level Available online: https://ec.europa.eu/eurostat/en/.
- Ustawa z Dnia 24 Lipca 1998 r. o Wprowadzeniu Zasadniczego Trójstopniowego Podziału Terytorialnego Państwa; Sejm RP, 1998.
- Statistics Poland Local Data Bank Available online:. Available online: https://bdl.stat.gov.pl/BDL (accessed on 28 August 2023).
- GUGiK Geoportal Krajowy Available online: https://mapy.geoportal.gov.pl.
- Rozporządzenie Ministra Rozwoju, Pracy i Technologii z Dnia 27 Lipca 2021 r. w Sprawie Ewidencji Gruntów i Budynków; Dz.U. 2021 poz. 1390, 2021.
- Anselin, L. Spatial Econometrics: Methods and Models; Springer Science & Business Media, 1988; Vol. 4; ISBN 9024737354.
- Anselin, L. Local Indicators of Spatial Association—LISA. Geogr. Anal. 1995, 27, 93–115. [Google Scholar] [CrossRef]
- Tsai, P.-J.; Perng, C.-H. Spatial Autocorrelation Analysis of 13 Leading Malignant Neoplasms in Taiwan: A Comparison between the 1995-1998 and 2005-2008 Periods. Health (Irvine. Calif). 2011, 3, 712. [Google Scholar] [CrossRef]
- Zhao, F.; Tang, L.; Qiu, Q.; Wu, G. The Compactness of Spatial Structure in Chinese Cities: Measurement, Clustering Patterns and Influencing Factors. Ecosyst. Heal. Sustain. 2020, 6, 1743763. [Google Scholar] [CrossRef]
- Brown, D.G.; Duh, J.-D. Spatial Simulation for Translating from Land Use to Land Cover. Int. J. Geogr. Inf. Sci. 2004, 18, 35–60. [Google Scholar] [CrossRef]
- Brunsdon, C.; Fotheringham, S.; Charlton, M. Geographically Weighted Regression as a Statistical Model; University of Newcastle-upon-Tyne, 2000.
- Fotheringham, A.S.; Charlton, M.; Brunsdon, C. Two Techniques for Exploring Non-Stationarity in Geographical Data. Geogr. Syst. 1997, 4, 59–82. [Google Scholar]
- Brunsdon, C.; Fotheringham, A.S.; Charlton, M.E. Geographically Weighted Regression: A Method for Exploring Spatial Nonstationarity. Geogr. Anal. 1996, 28, 281–298. [Google Scholar] [CrossRef]
- Szajnowska-Wysocka, A.; Zuzańska-Żyśko, E. Metropolizacja w Konurbacji Górnośląskiej. 2013, 35, 69–90.
- Strzałkowski, P.; Ścigała, R.; Chudek, M.D. Rekultywacja Zdegradowanego Terenu Pogórniczego Na Przykładzie Wojewódzkiego Parku Kultury i Wypoczynku w Chorzowie. Inżynieria Miner. 2017, 18. [Google Scholar] [CrossRef]
- Borowik, A. Park Śląski w Chorzowie. Projekty i Realizacje z Lat 1950–1989; Warszawa, 2020; ISBN 978-83-66018-71-6.
- Matthews, S.A.; Yang, T.C. Mapping the Results of Local Statistics: Using Geographically Weighted Regression. Demogr. Res. 2012, 26, 151–166. [Google Scholar] [CrossRef] [PubMed]
- Mennis, J. Mapping the Results of Geographically Weighted Regression. Cartogr. J. 2006, 43, 171–179. [Google Scholar] [CrossRef]
- Wiśniewska, M. Ekspansja Zabudowy Na Tereny Wiejskie. Acta Sci. Pol. Archit. 2008, 7. [Google Scholar]
- Mrozik, K.; Wiśniewska, A. Miejscowe Plany Zagospodarowania Przestrzennego Jako Instrument Zarządzania Procesem Suburbanizacji Na Terenach Wiejskich Na Przykładzie Obrębu Geodezyjnego Skórzewo. Rocz. Ochr. Środowiska 2013, 15. [Google Scholar]
- Matuszko, A.; Mikołajczyk, D.; Nowak, K.; Bąk, A. Bilans i Chłonność Demograficzna Terenów Mieszkaniowych Górnośląsko-Zagłębiowskiej Metropolii; Instytut Rozwoju Miast i Regionów: Kraków–Warszawa, 2022; ISBN 978-83-65105-94-3. [Google Scholar]
- Piszczek, A. Systemy Przyrodnicze w Planowaniu Przestrzennym Aglomeracji Górnośląskiej. Przestrz. Ekon. Społeczeństwo 2017, 9–32. [Google Scholar]
- Zięba, A.; Stangel, M. Rewitalizacja Kluczowych Przestrzeni Publicznych w Centrach Miast Obszaru Funkcjonalnego Chorzowa, Rudy Śląskiej i Świętochłowic/Revitalization of Key Public Spaces in the Center of the Cities of Functional Area of Chorzów, Ruda Śląska and Świętochłowice. Stud. KPZK 2016. [Google Scholar]
- Pancewicz, A. Poszukiwanie Nowego Krajobrazu Obszarów Poprzemysłowych. Archit. Kraj. 2012, 1, 41–49. [Google Scholar]
- Lewandowicz, E. Indicators of Geographic Potential and Business Opportunities for the Development of Active Tourism: Kayaking in Poland. Sustainability 2022, 14. [Google Scholar] [CrossRef]
- Liu, J.; Wang, R.; Chen, T. Factors of Spatial Distribution of Recreation Areas in Peri-Urban Beijing. J. Geogr. Sci. 2010, 20, 741–756. [Google Scholar] [CrossRef]
- Leśniewska-Napierała, K.; Nalej, M.; Napierała, T. The Impact of EU Grants Absorption on Land Cover Changes-The Case of Poland. Remote Sens. 2019, 11. [Google Scholar] [CrossRef]
Figure 1.
Location and administrative division of Poland based on the Register of Administrative Boundaries kept by the Head Office of Geodesy and Cartography (GUGiK) and Statistics Poland data.
Figure 1.
Location and administrative division of Poland based on the Register of Administrative Boundaries kept by the Head Office of Geodesy and Cartography (GUGiK) and Statistics Poland data.
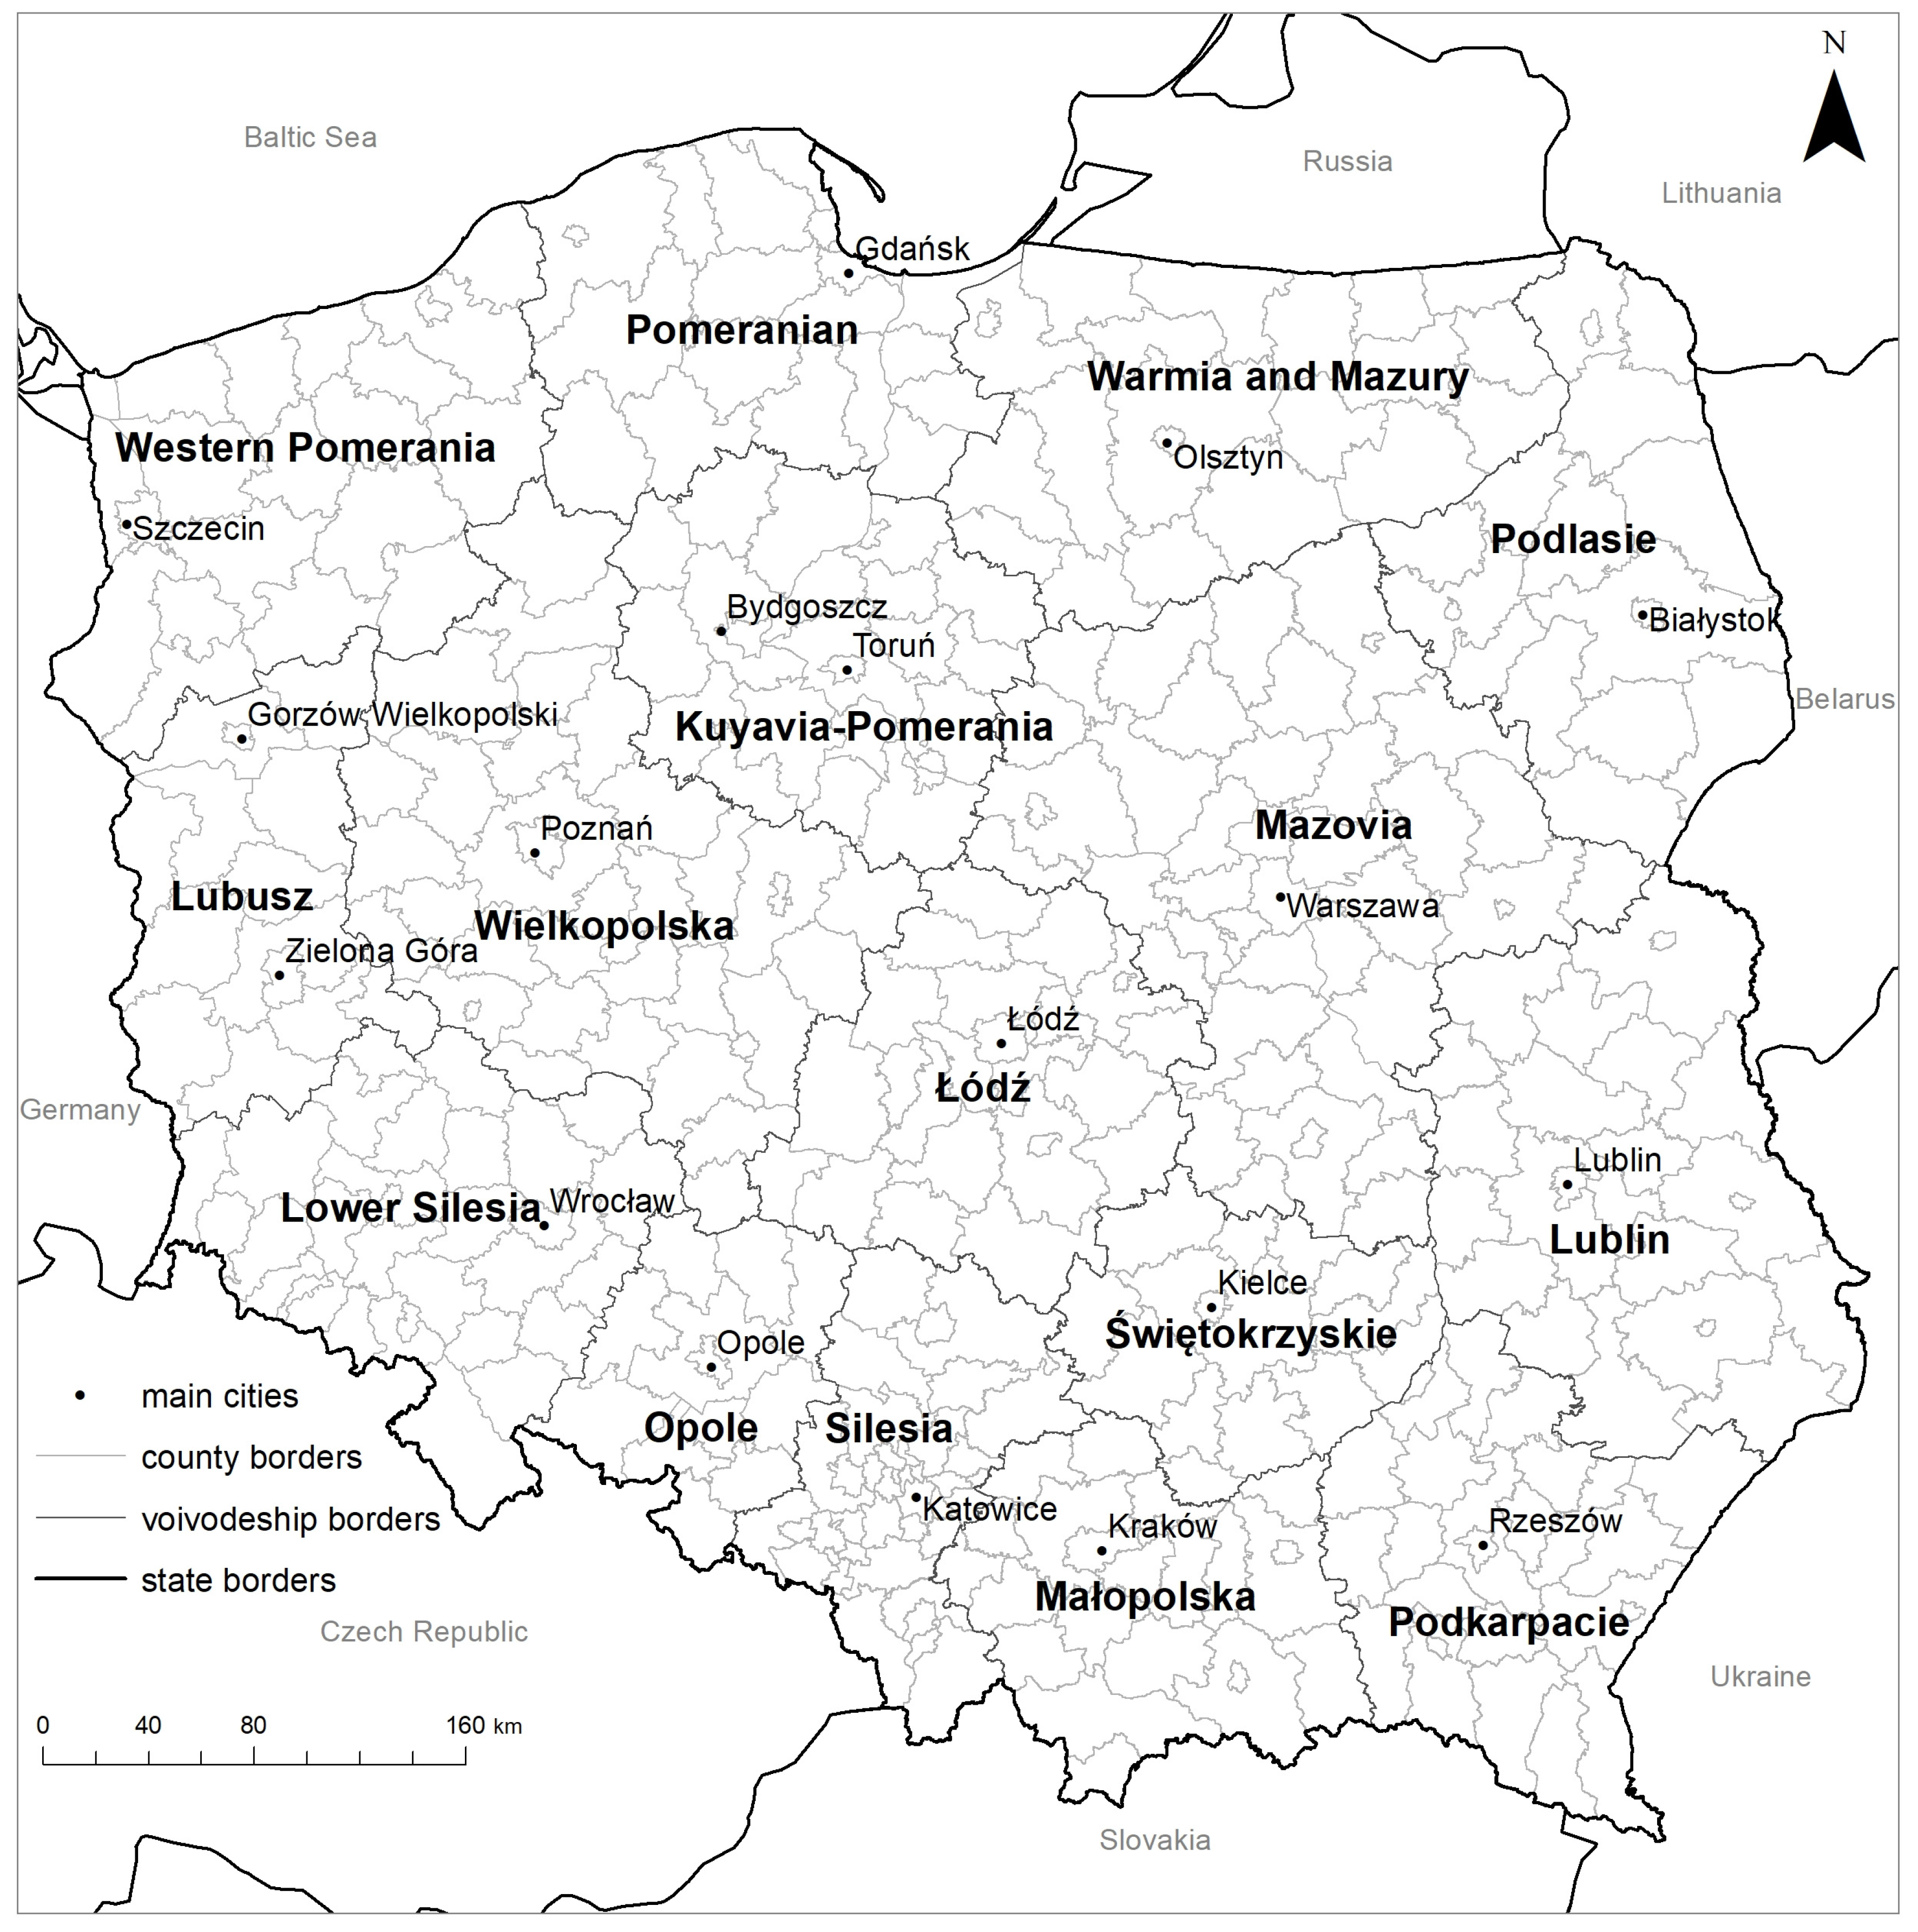
Figure 2.
Flowchart of the analysis of the share of recreational and leisure areas in Polish counties in 2022.
Figure 2.
Flowchart of the analysis of the share of recreational and leisure areas in Polish counties in 2022.
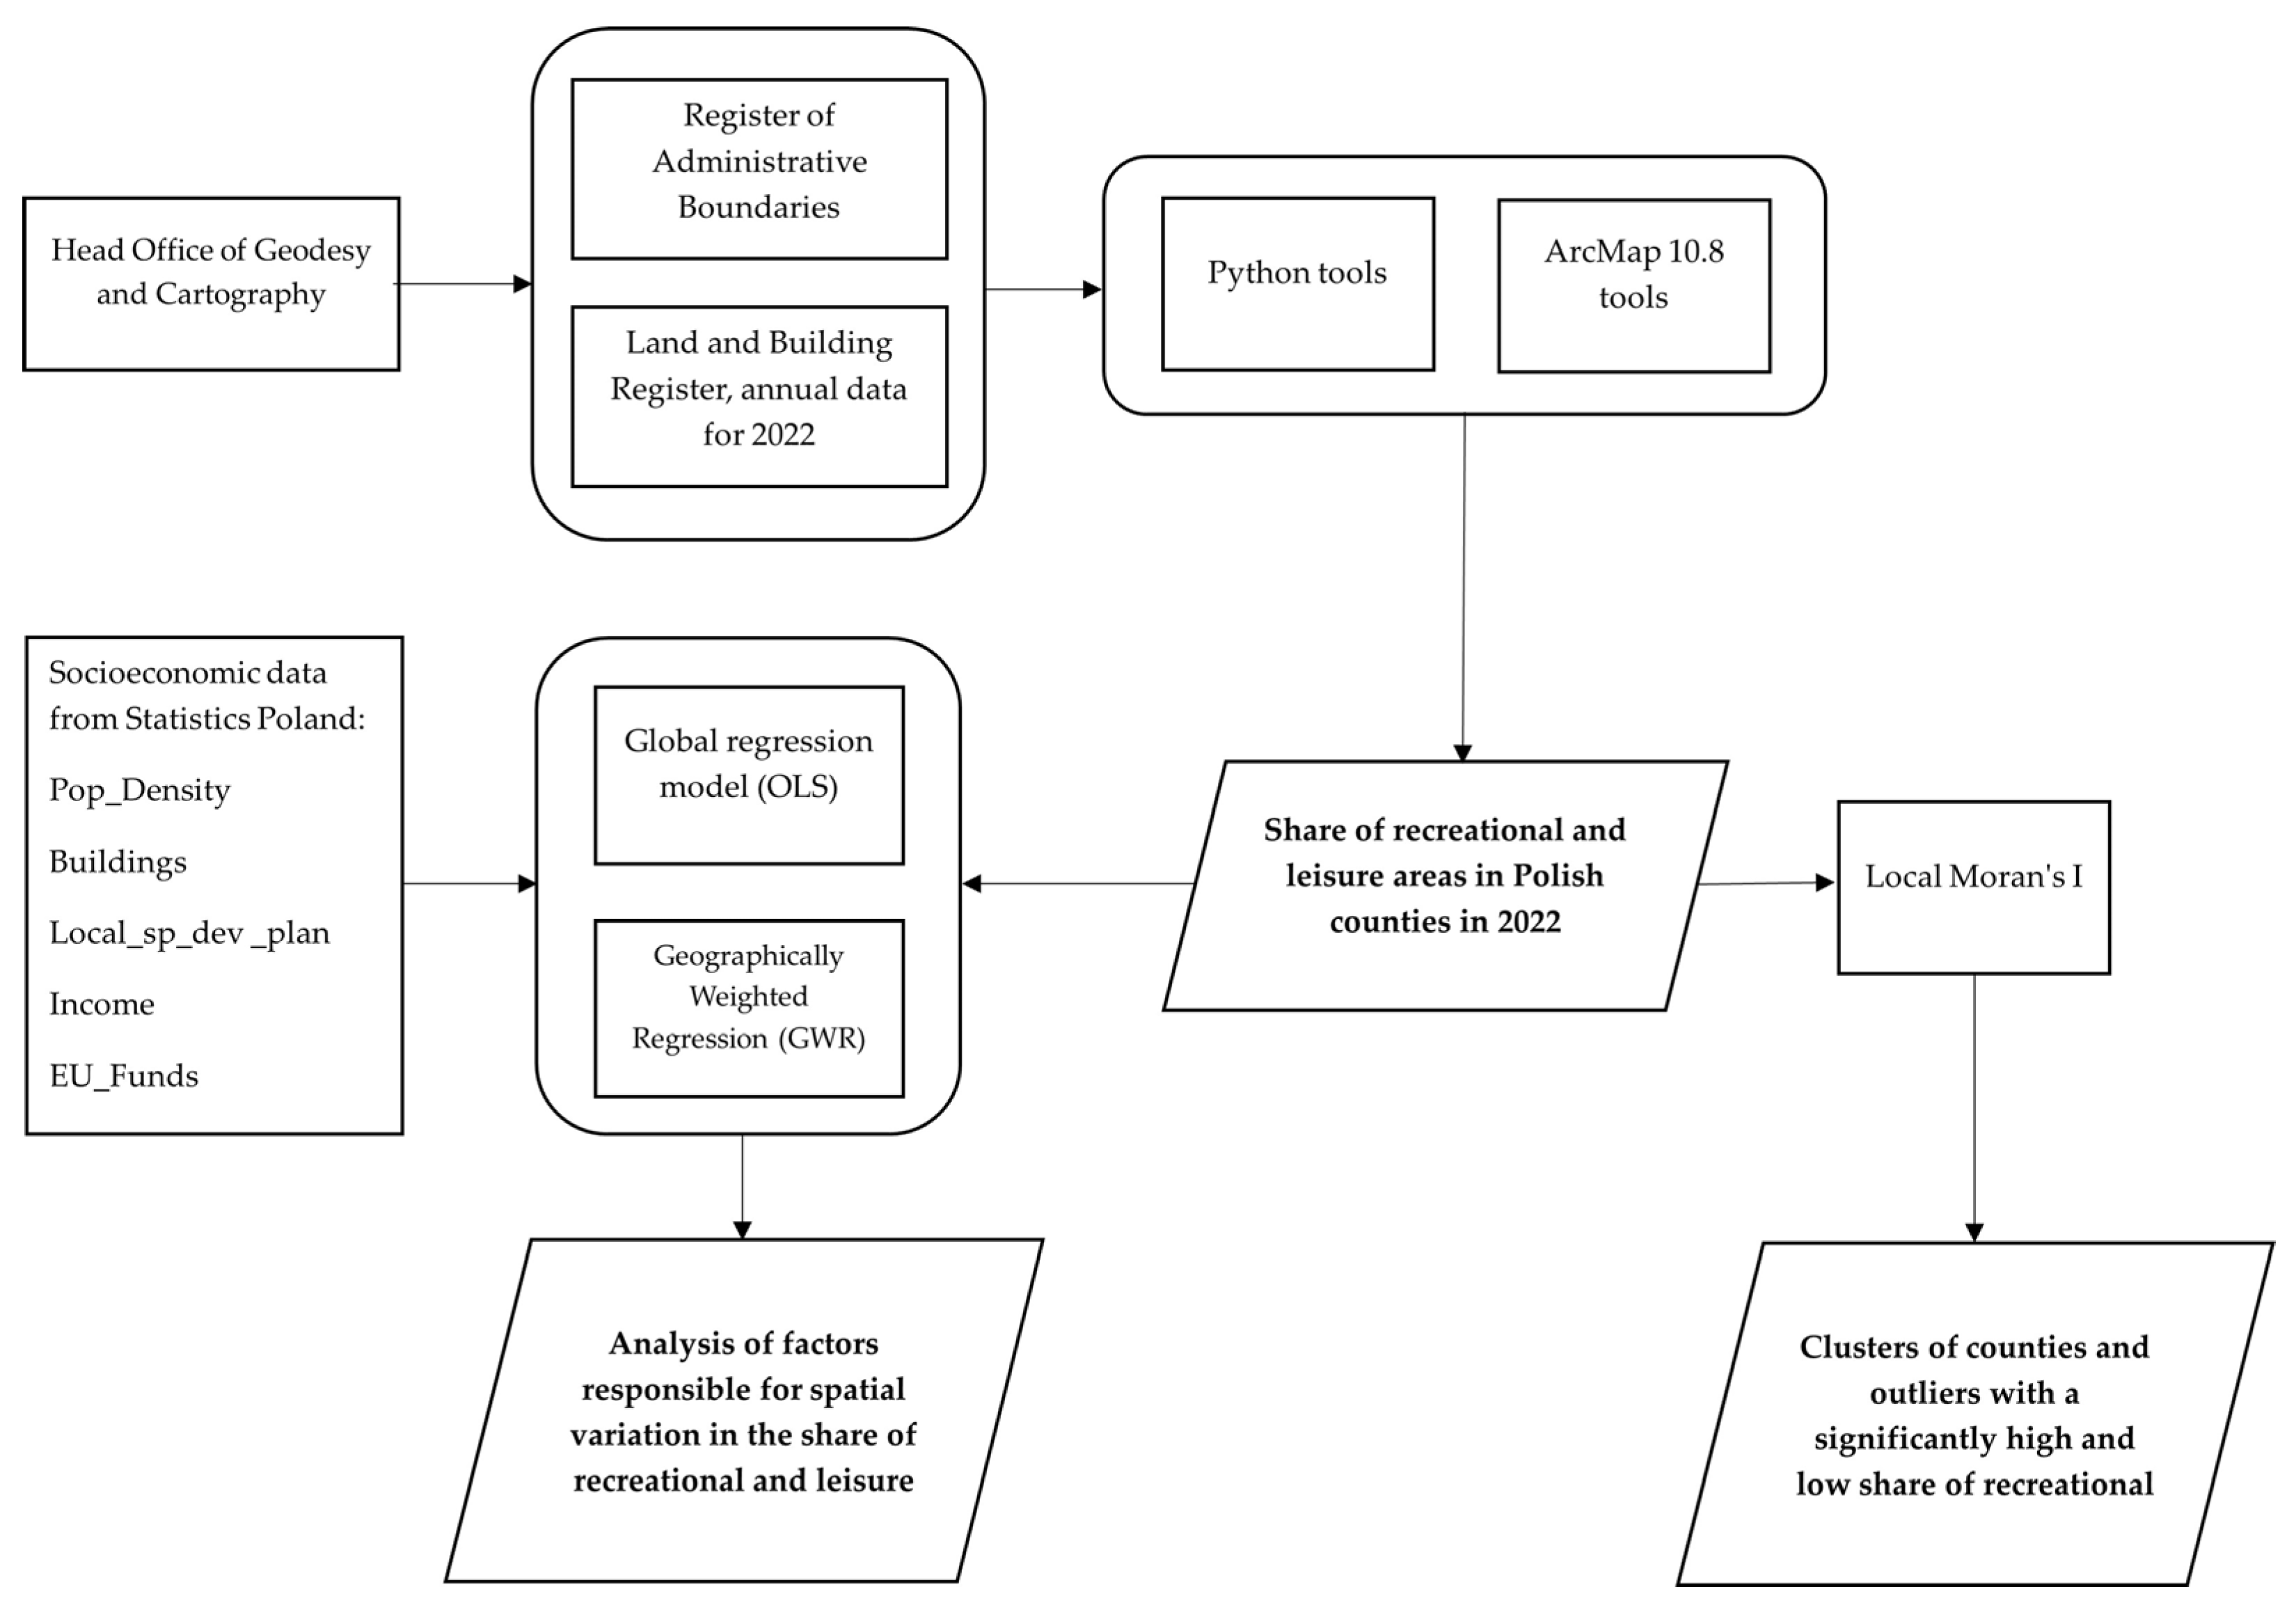
Figure 3.
The share of recreational and leisure areas in Polish voivodeships in 2002-2022 based on Statistics Poland data.
Figure 3.
The share of recreational and leisure areas in Polish voivodeships in 2002-2022 based on Statistics Poland data.
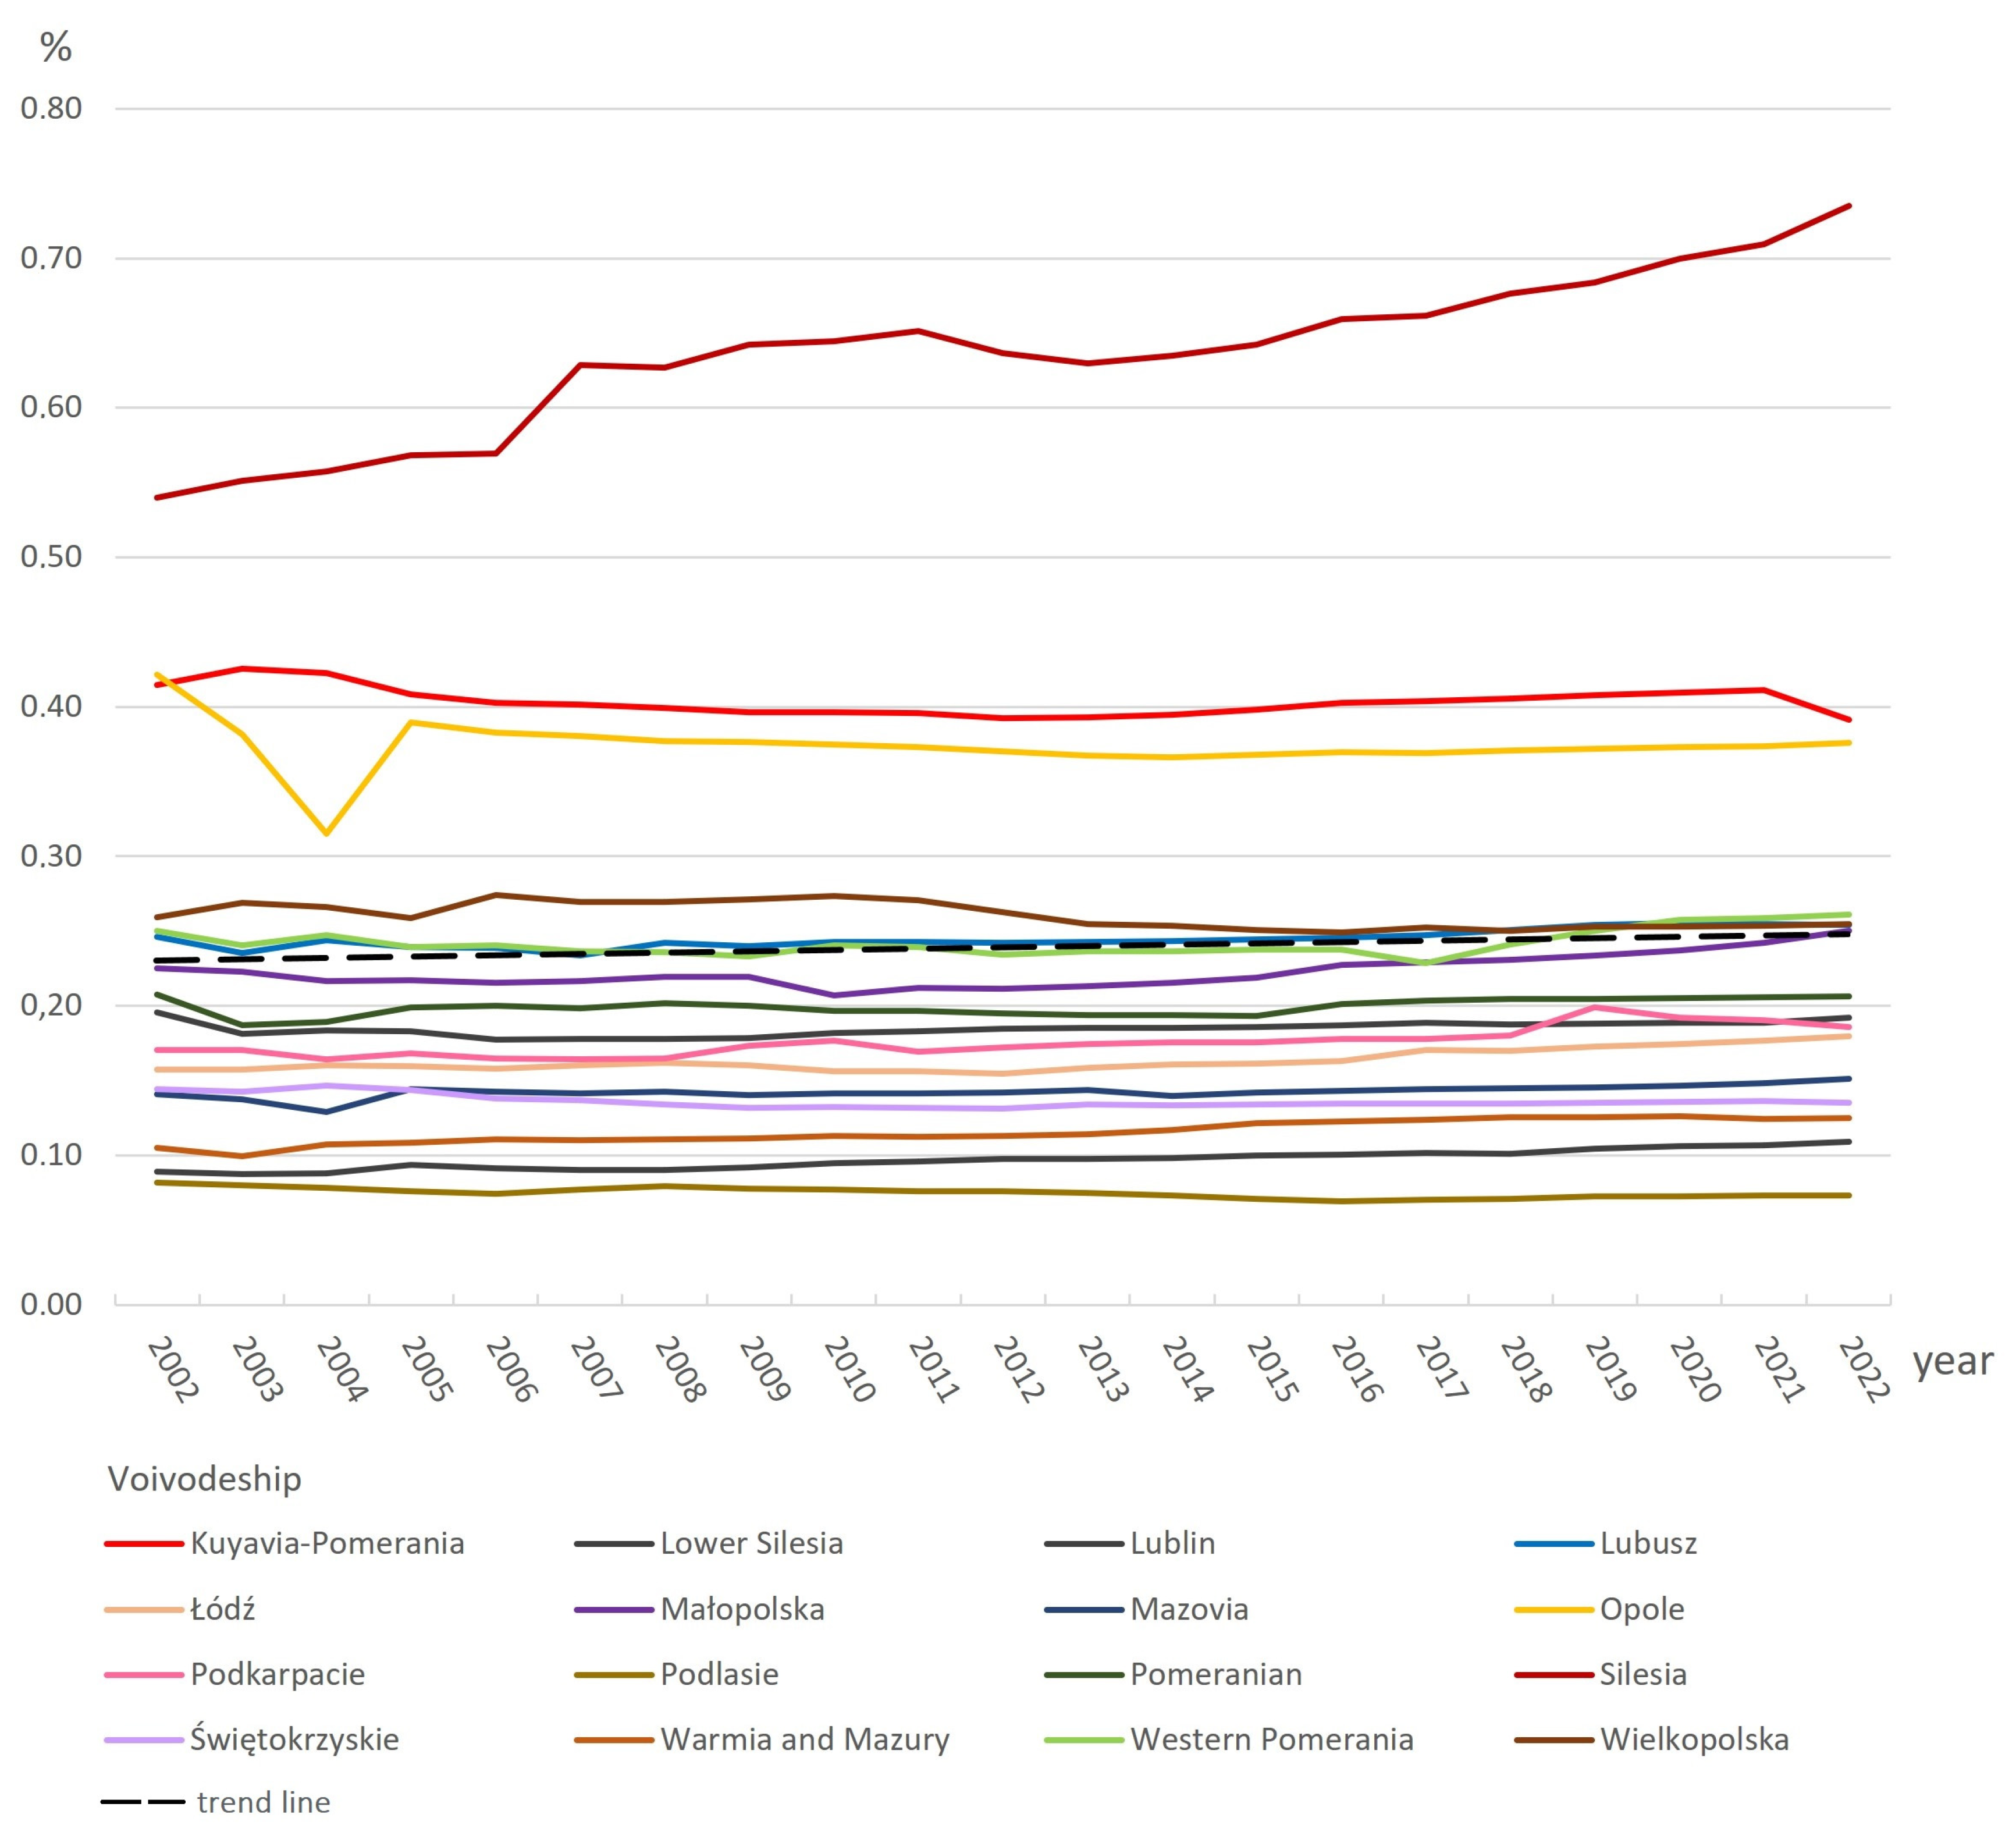
Figure 4.
Structure of recreational and leisure areas in the urban and rural areas of Polish voivodeships in 2019-2022 based on Statistics Poland data.
Figure 4.
Structure of recreational and leisure areas in the urban and rural areas of Polish voivodeships in 2019-2022 based on Statistics Poland data.
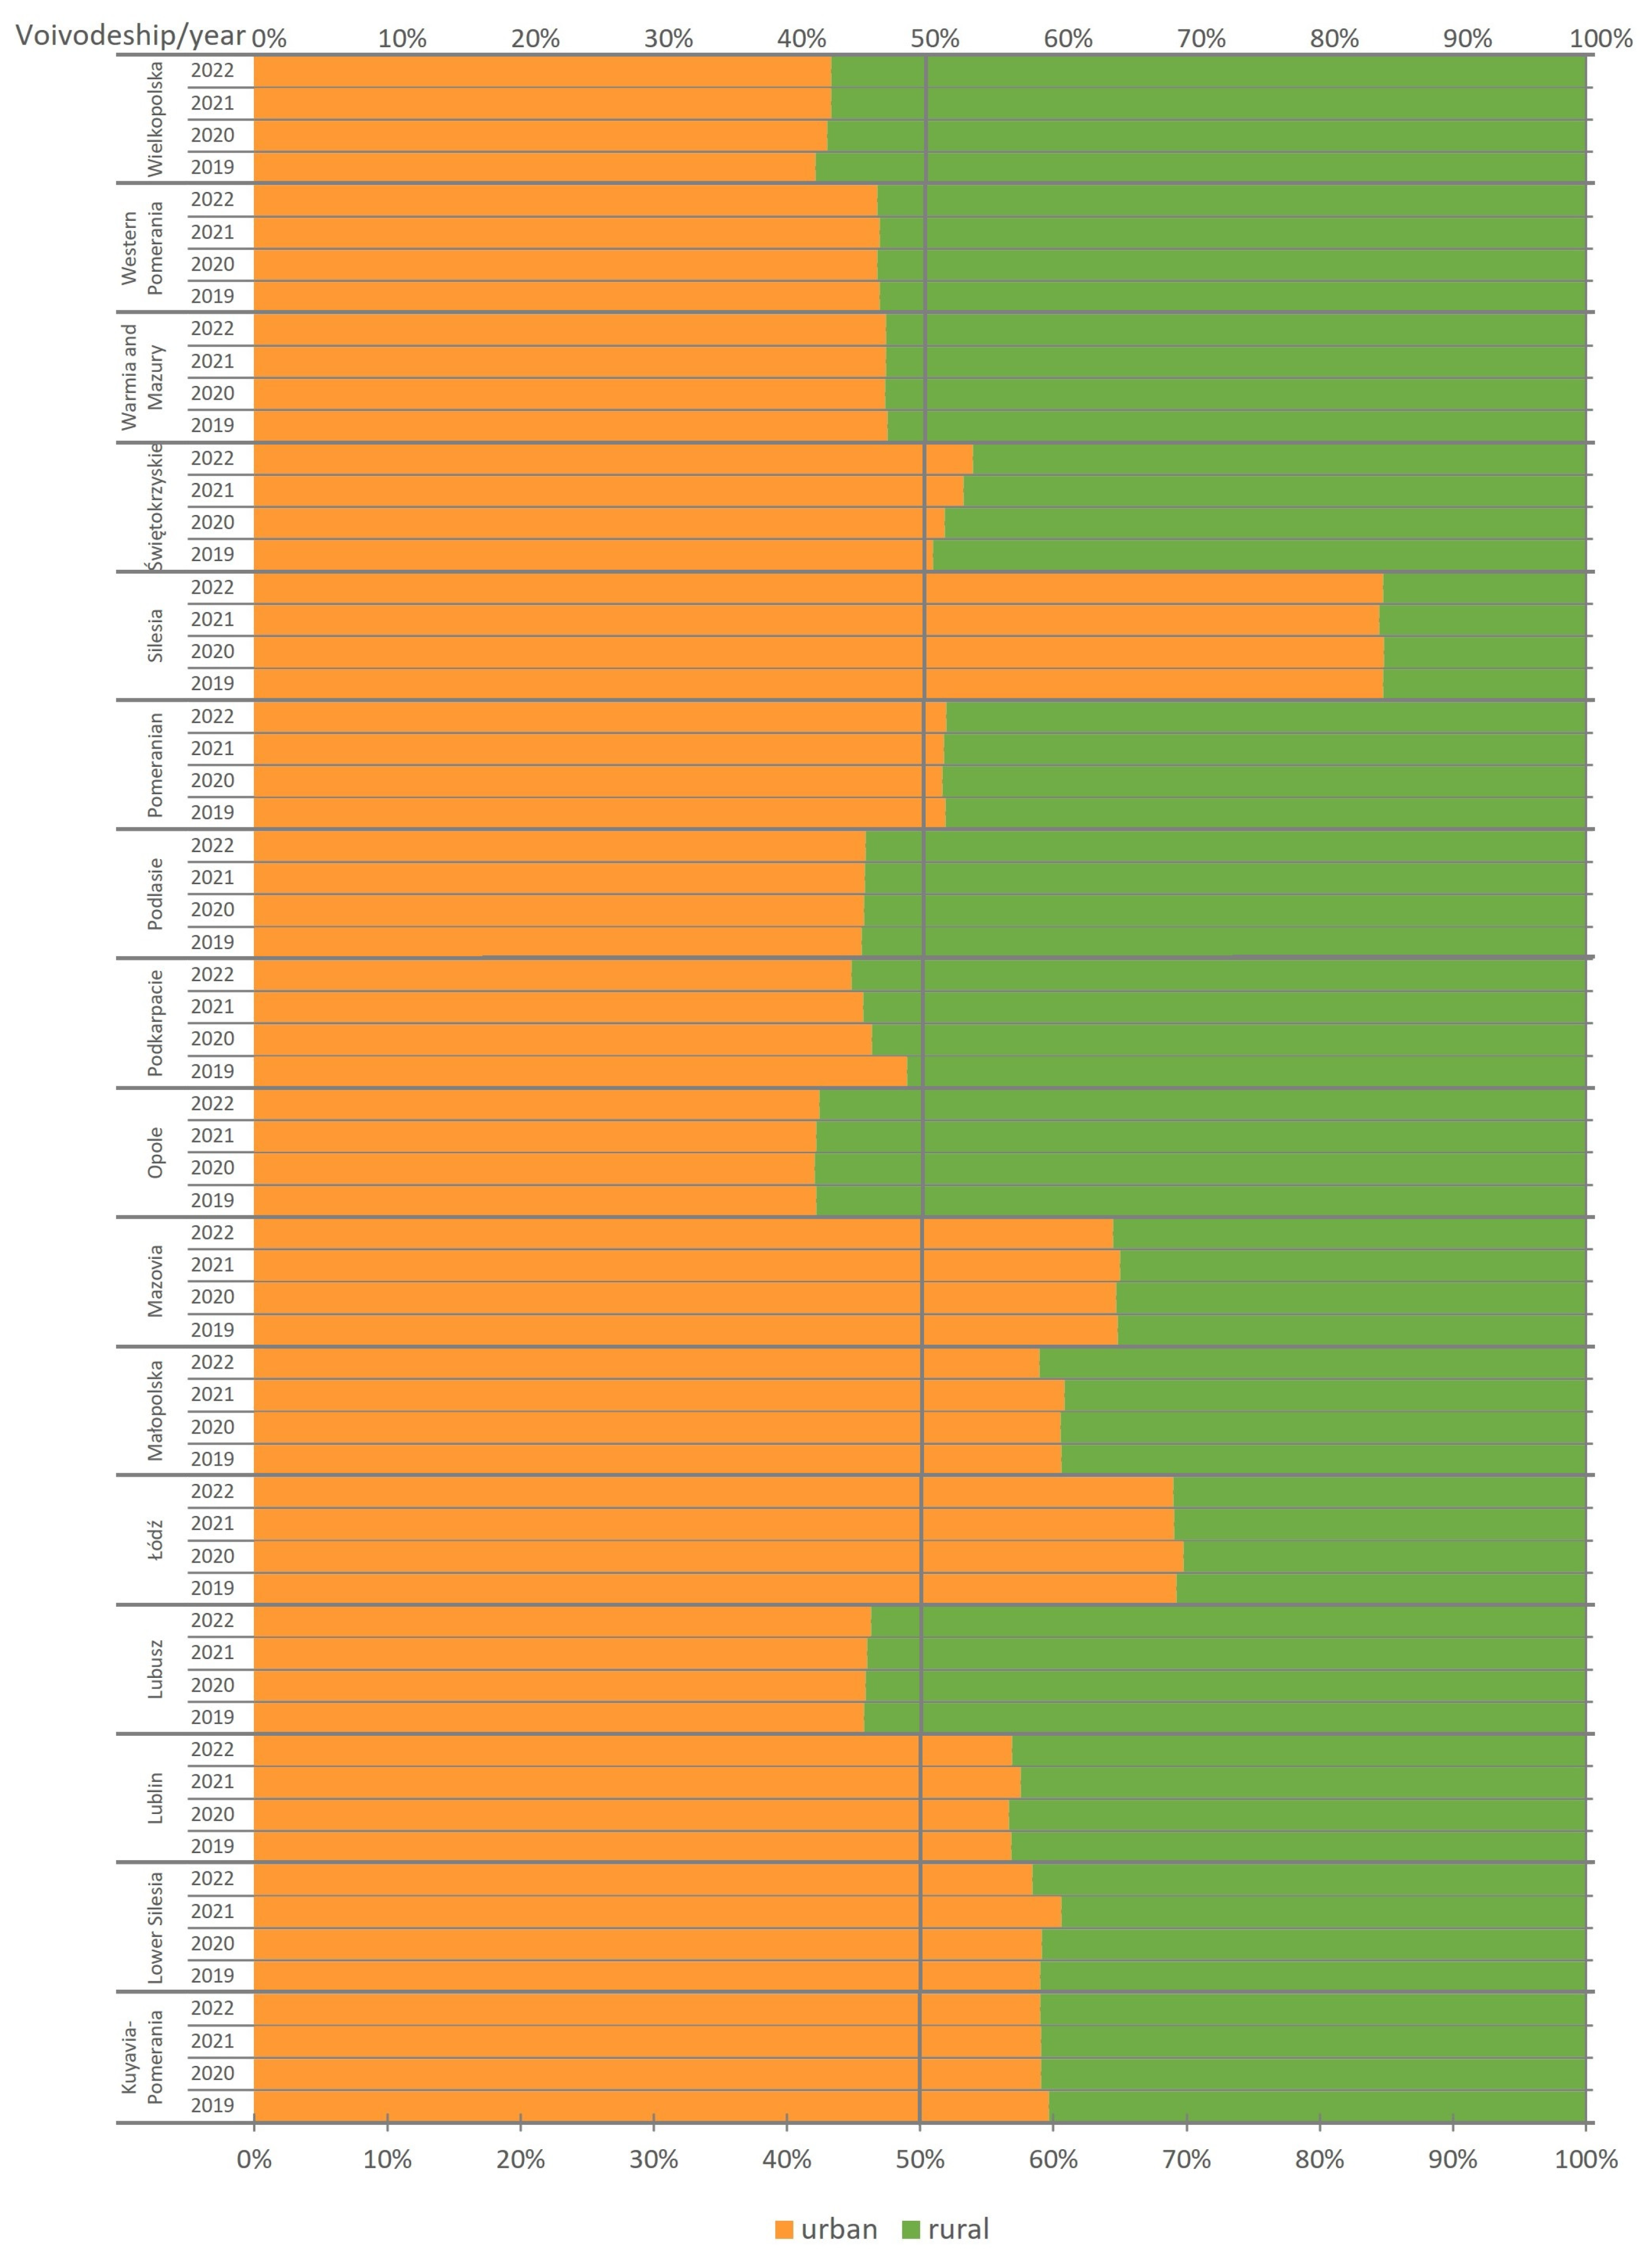
Figure 5.
Share of recreational and leisure areas in Polish counties in 2022 based on Land and Building Register data.
Figure 5.
Share of recreational and leisure areas in Polish counties in 2022 based on Land and Building Register data.
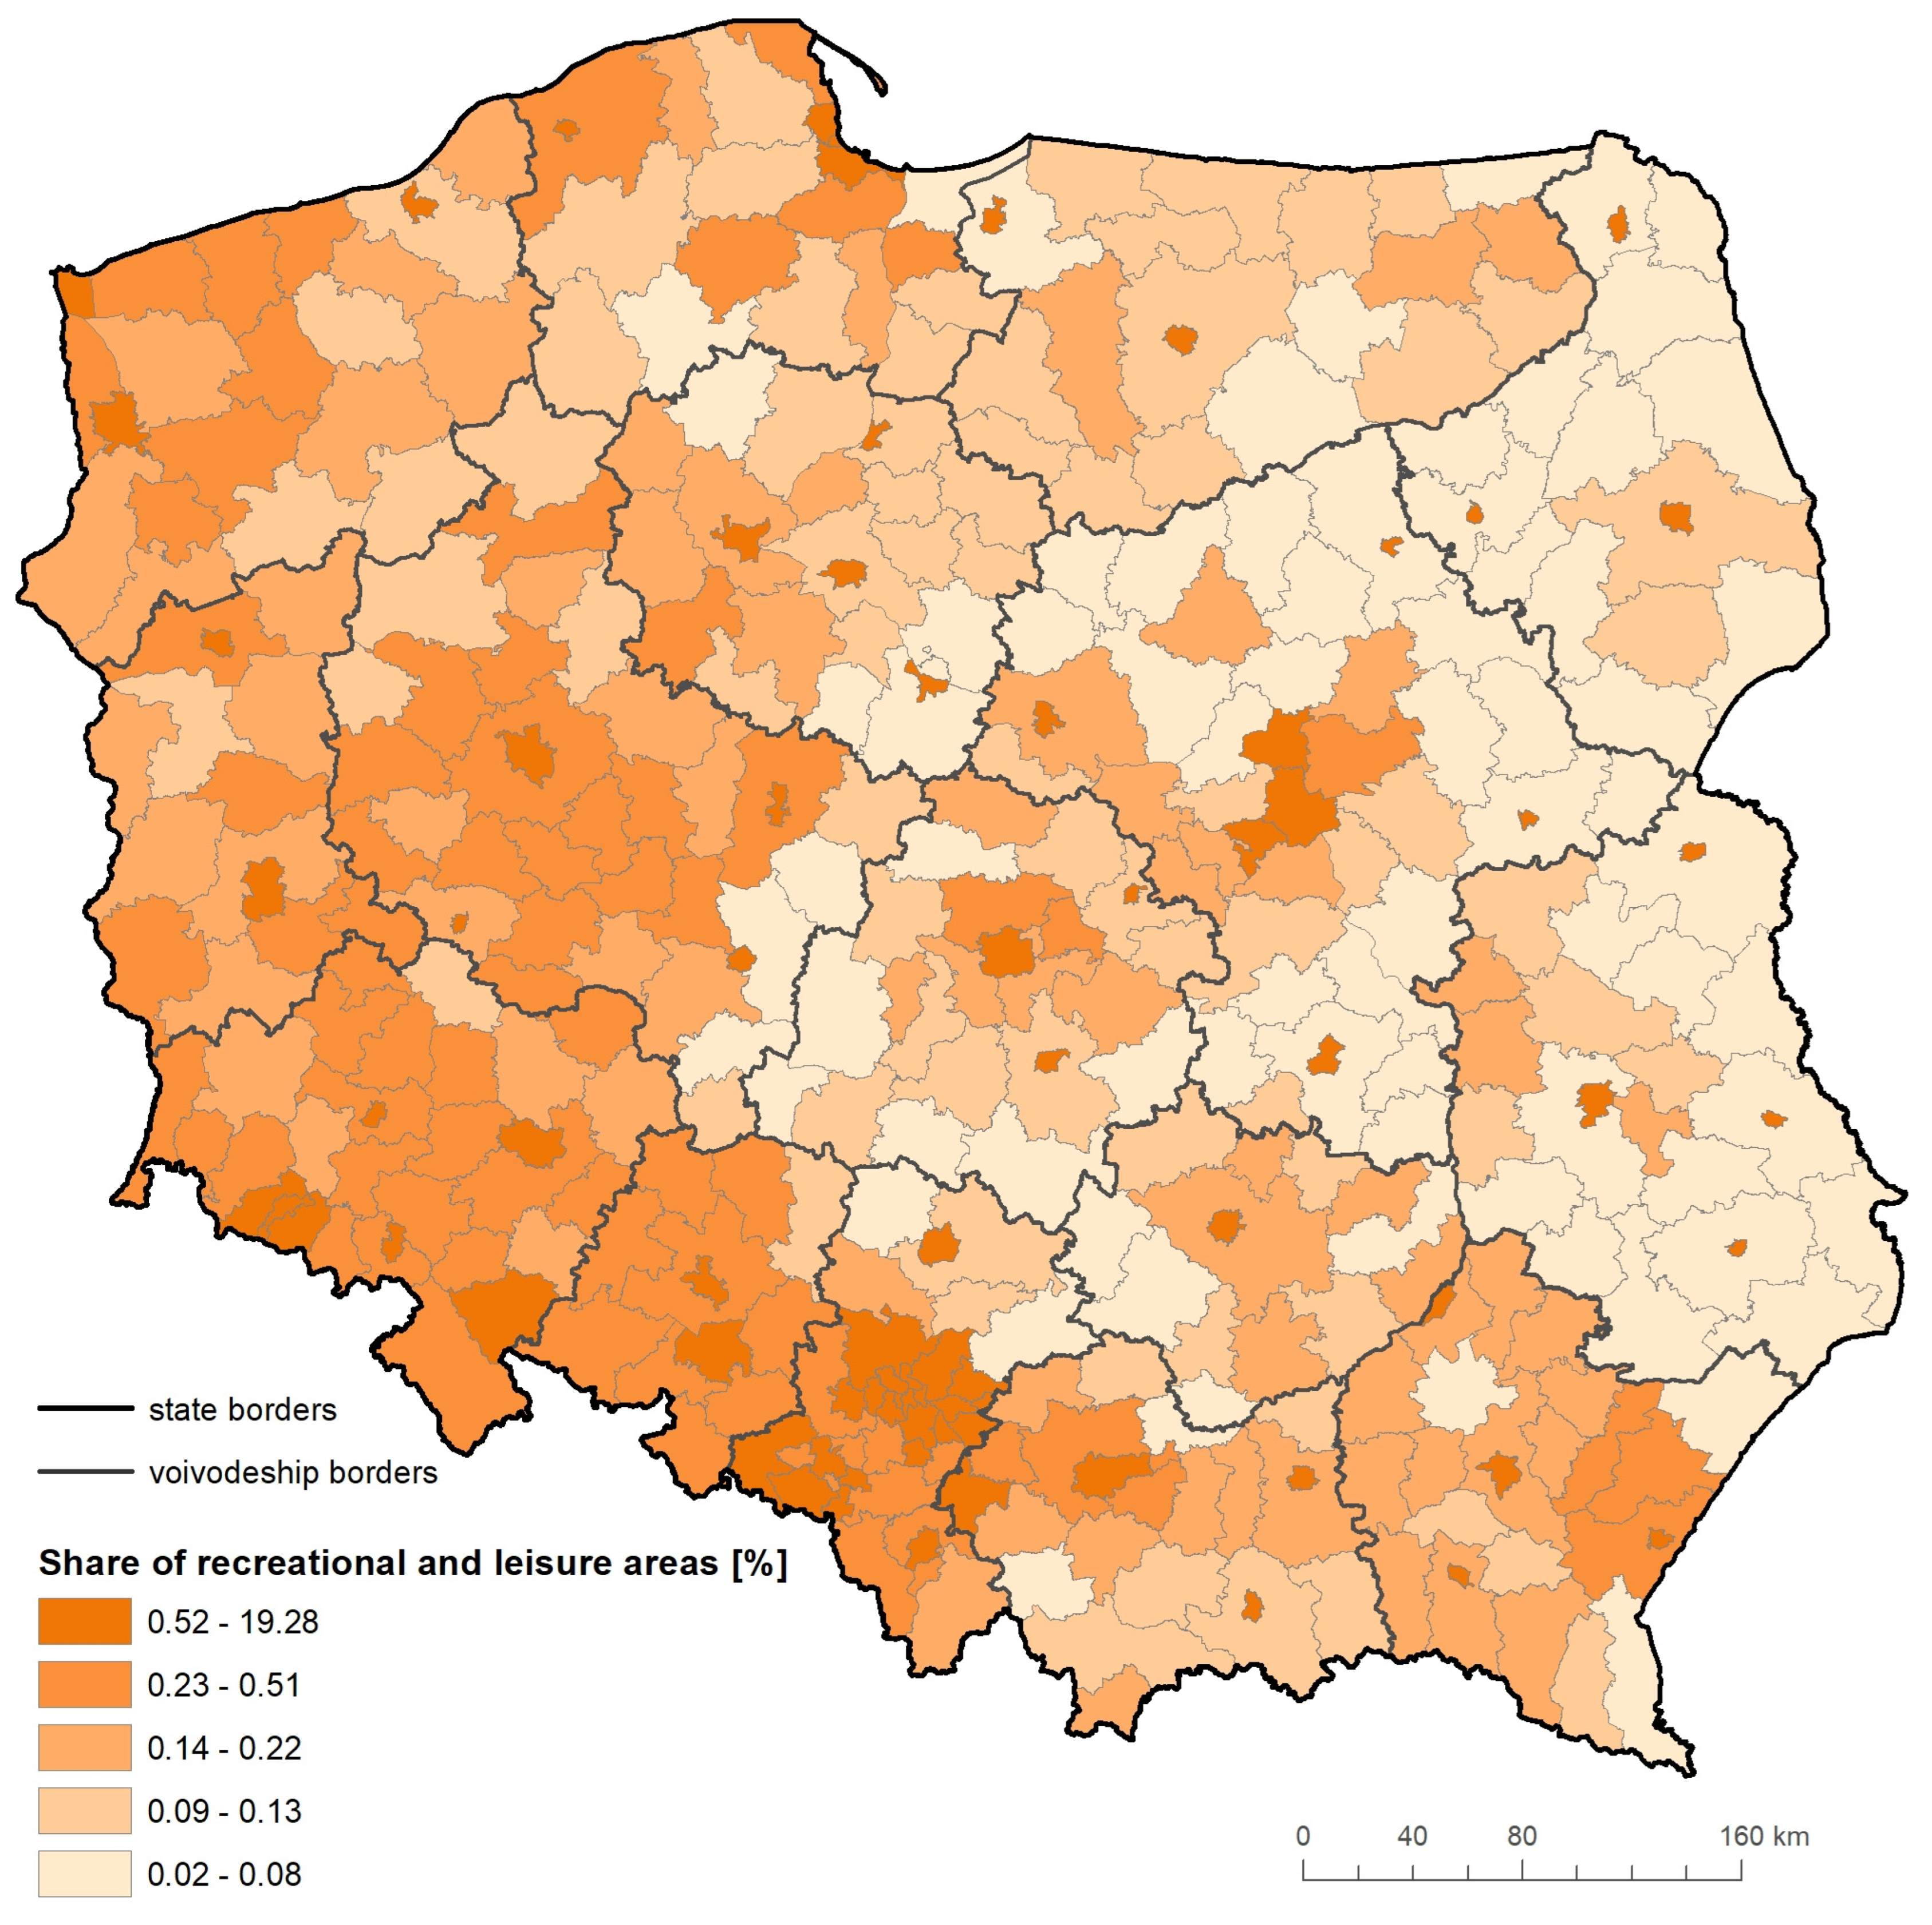
Figure 6.
Clusters of Polish counties with a high and low share of recreational and leisure areas in 2022.
Figure 6.
Clusters of Polish counties with a high and low share of recreational and leisure areas in 2022.
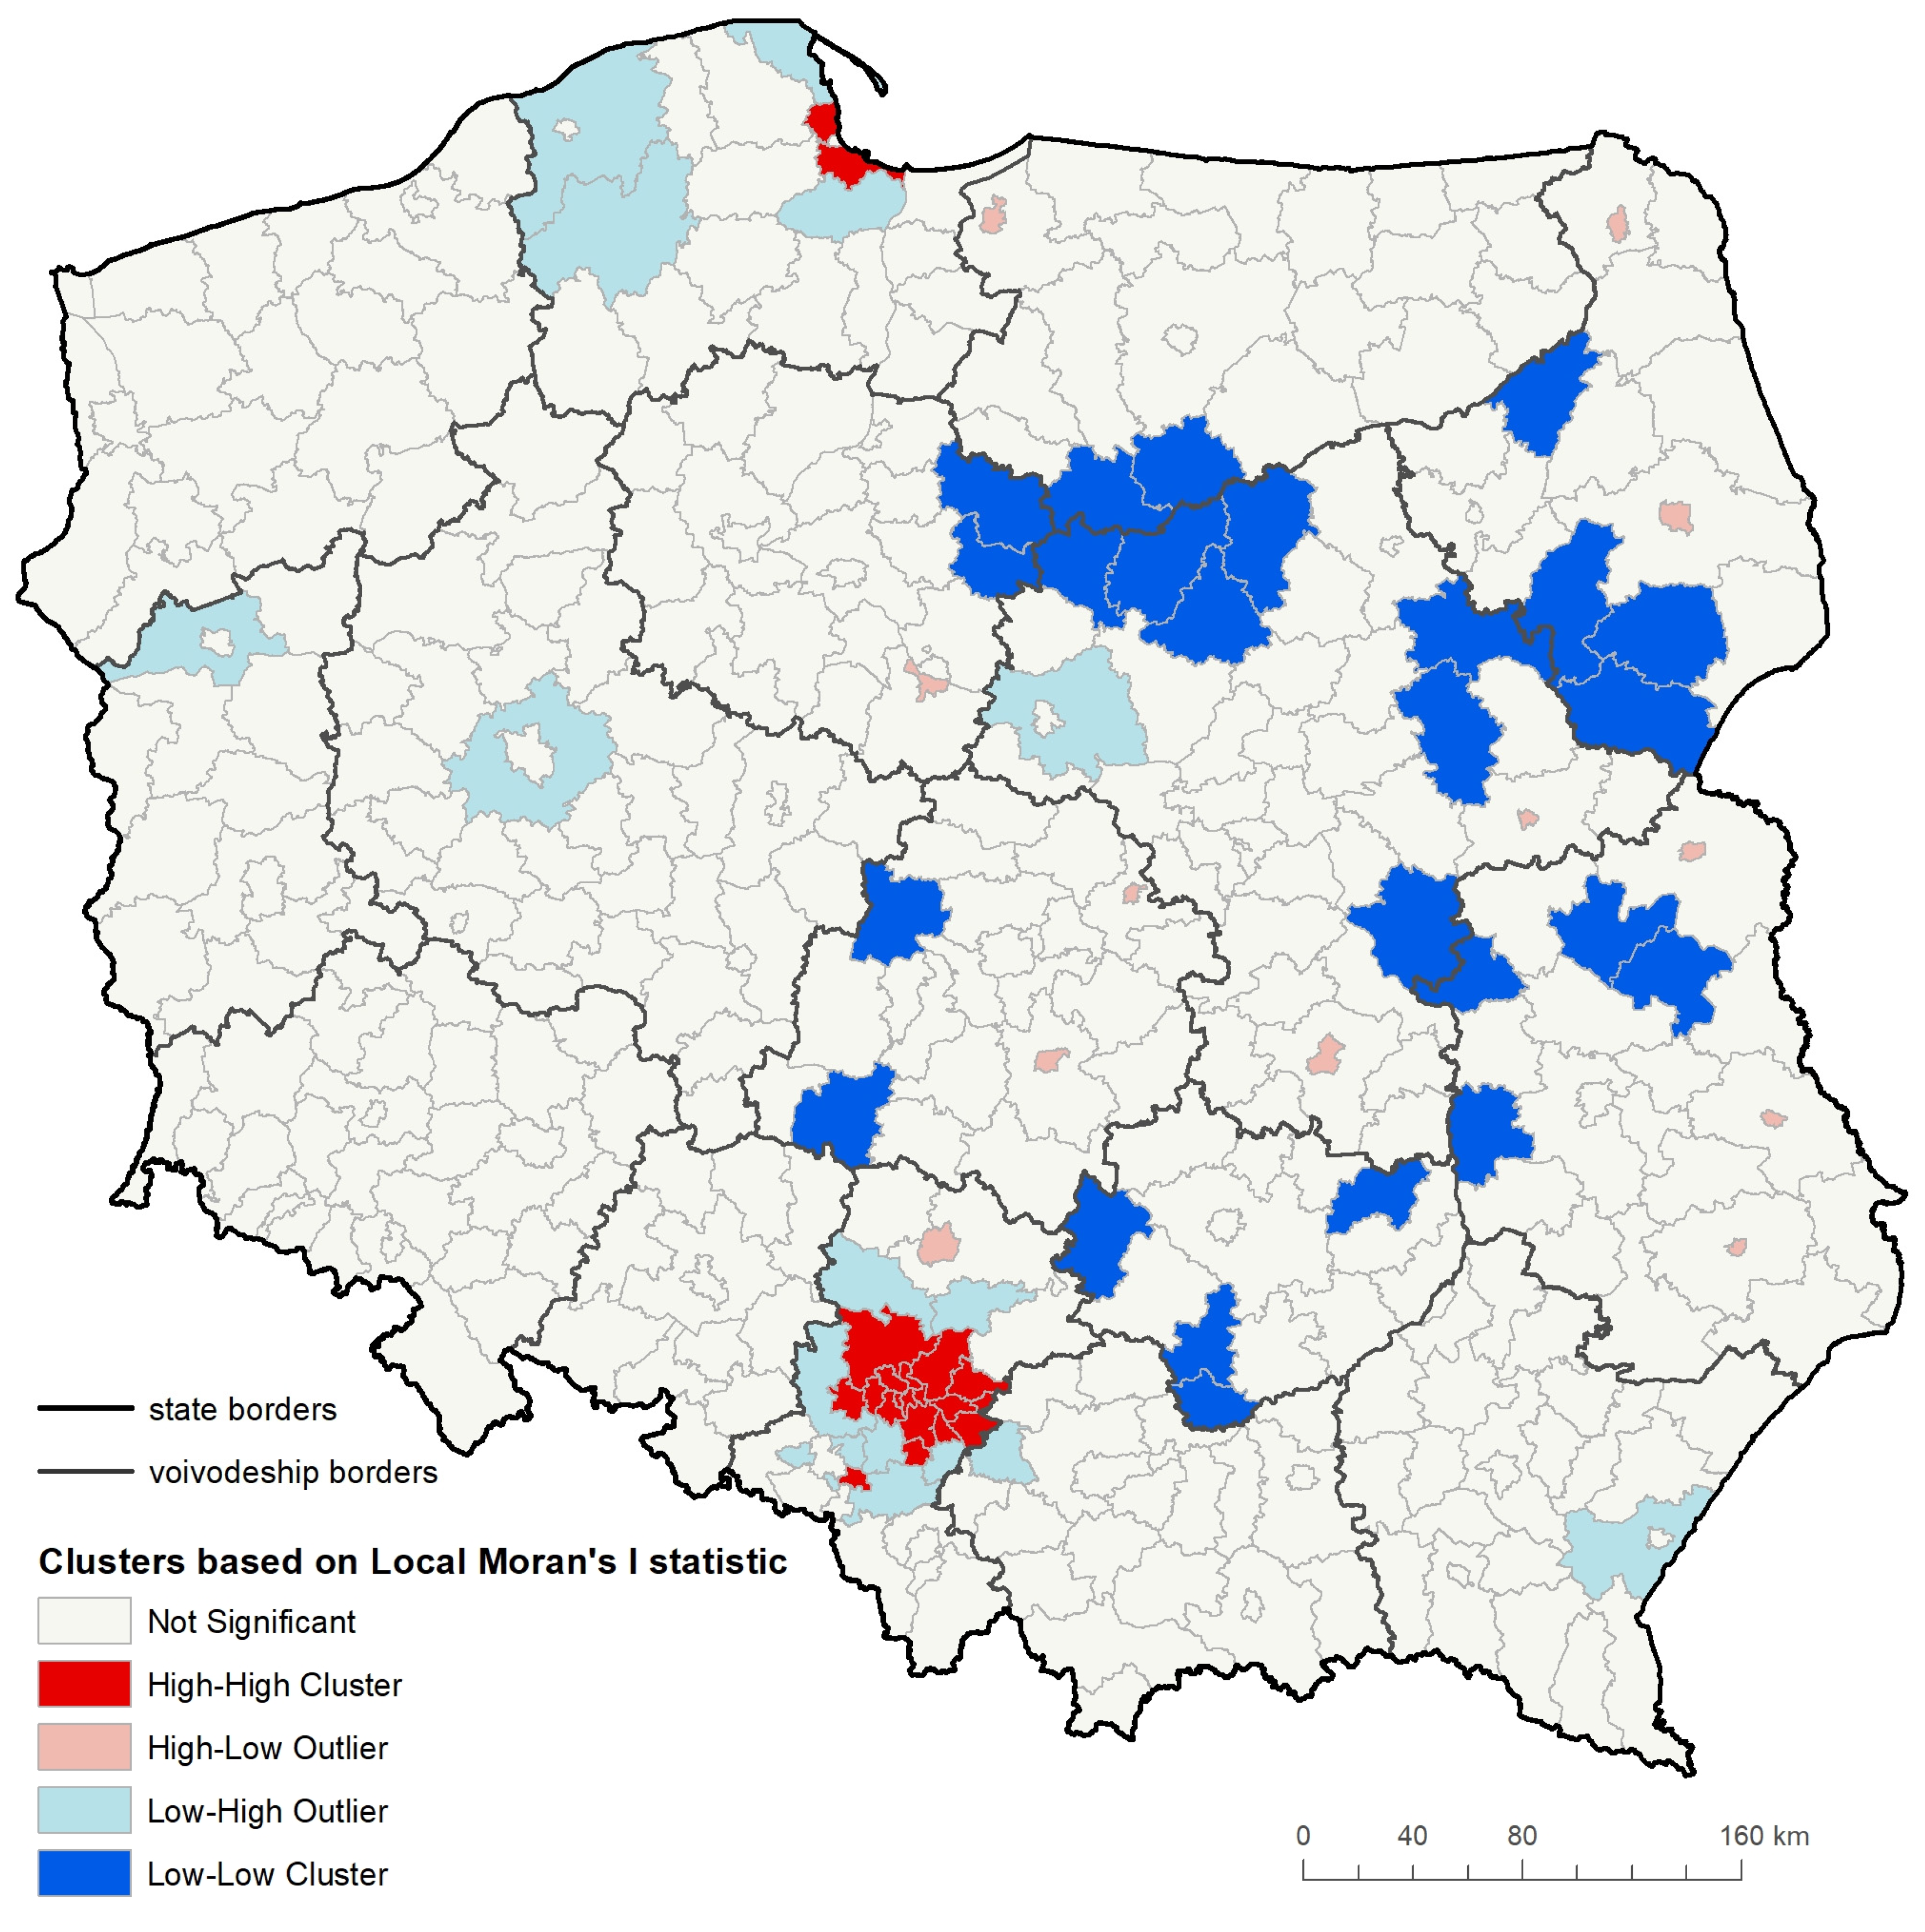
Figure 7.
Coefficients of determination in local models estimating the share of recreational and leisure areas in Polish counties in 2022.
Figure 7.
Coefficients of determination in local models estimating the share of recreational and leisure areas in Polish counties in 2022.
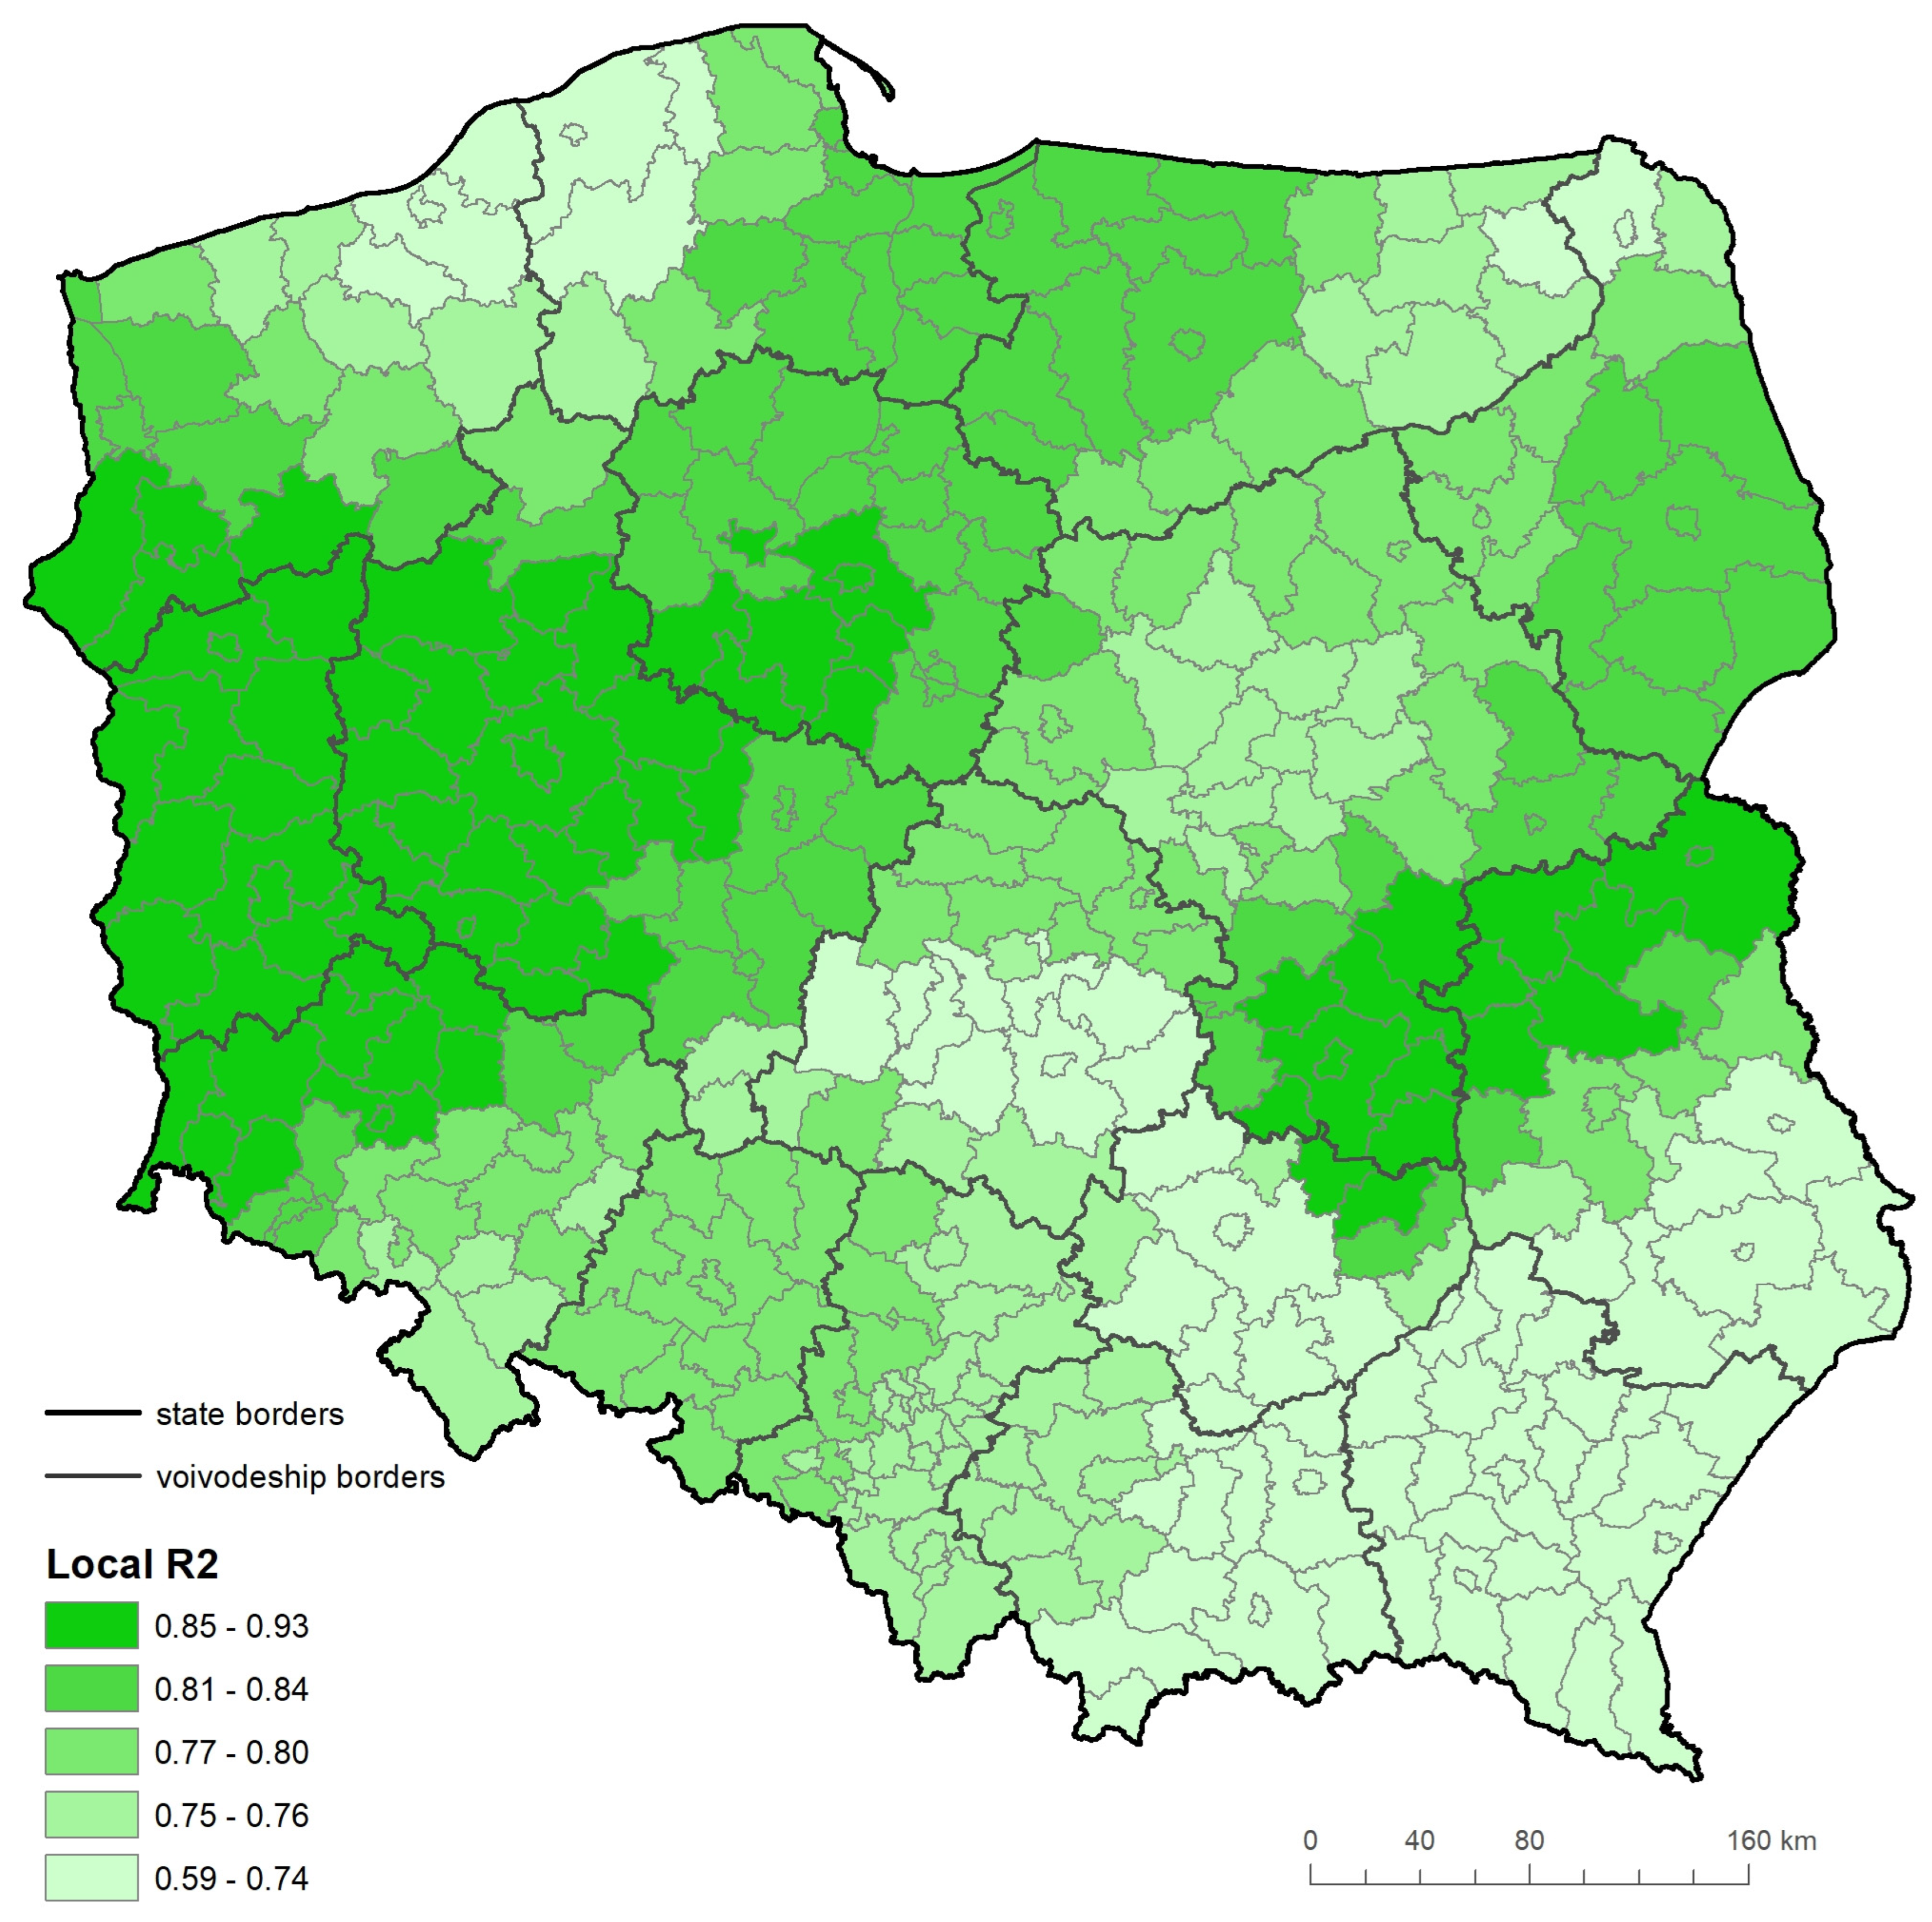
Figure 8.
Value (a) and significance (b) of the effect size of the relationship between population density (Pop_Density) and the share of recreational and leisure areas in Polish counties in 2022.
Figure 8.
Value (a) and significance (b) of the effect size of the relationship between population density (Pop_Density) and the share of recreational and leisure areas in Polish counties in 2022.
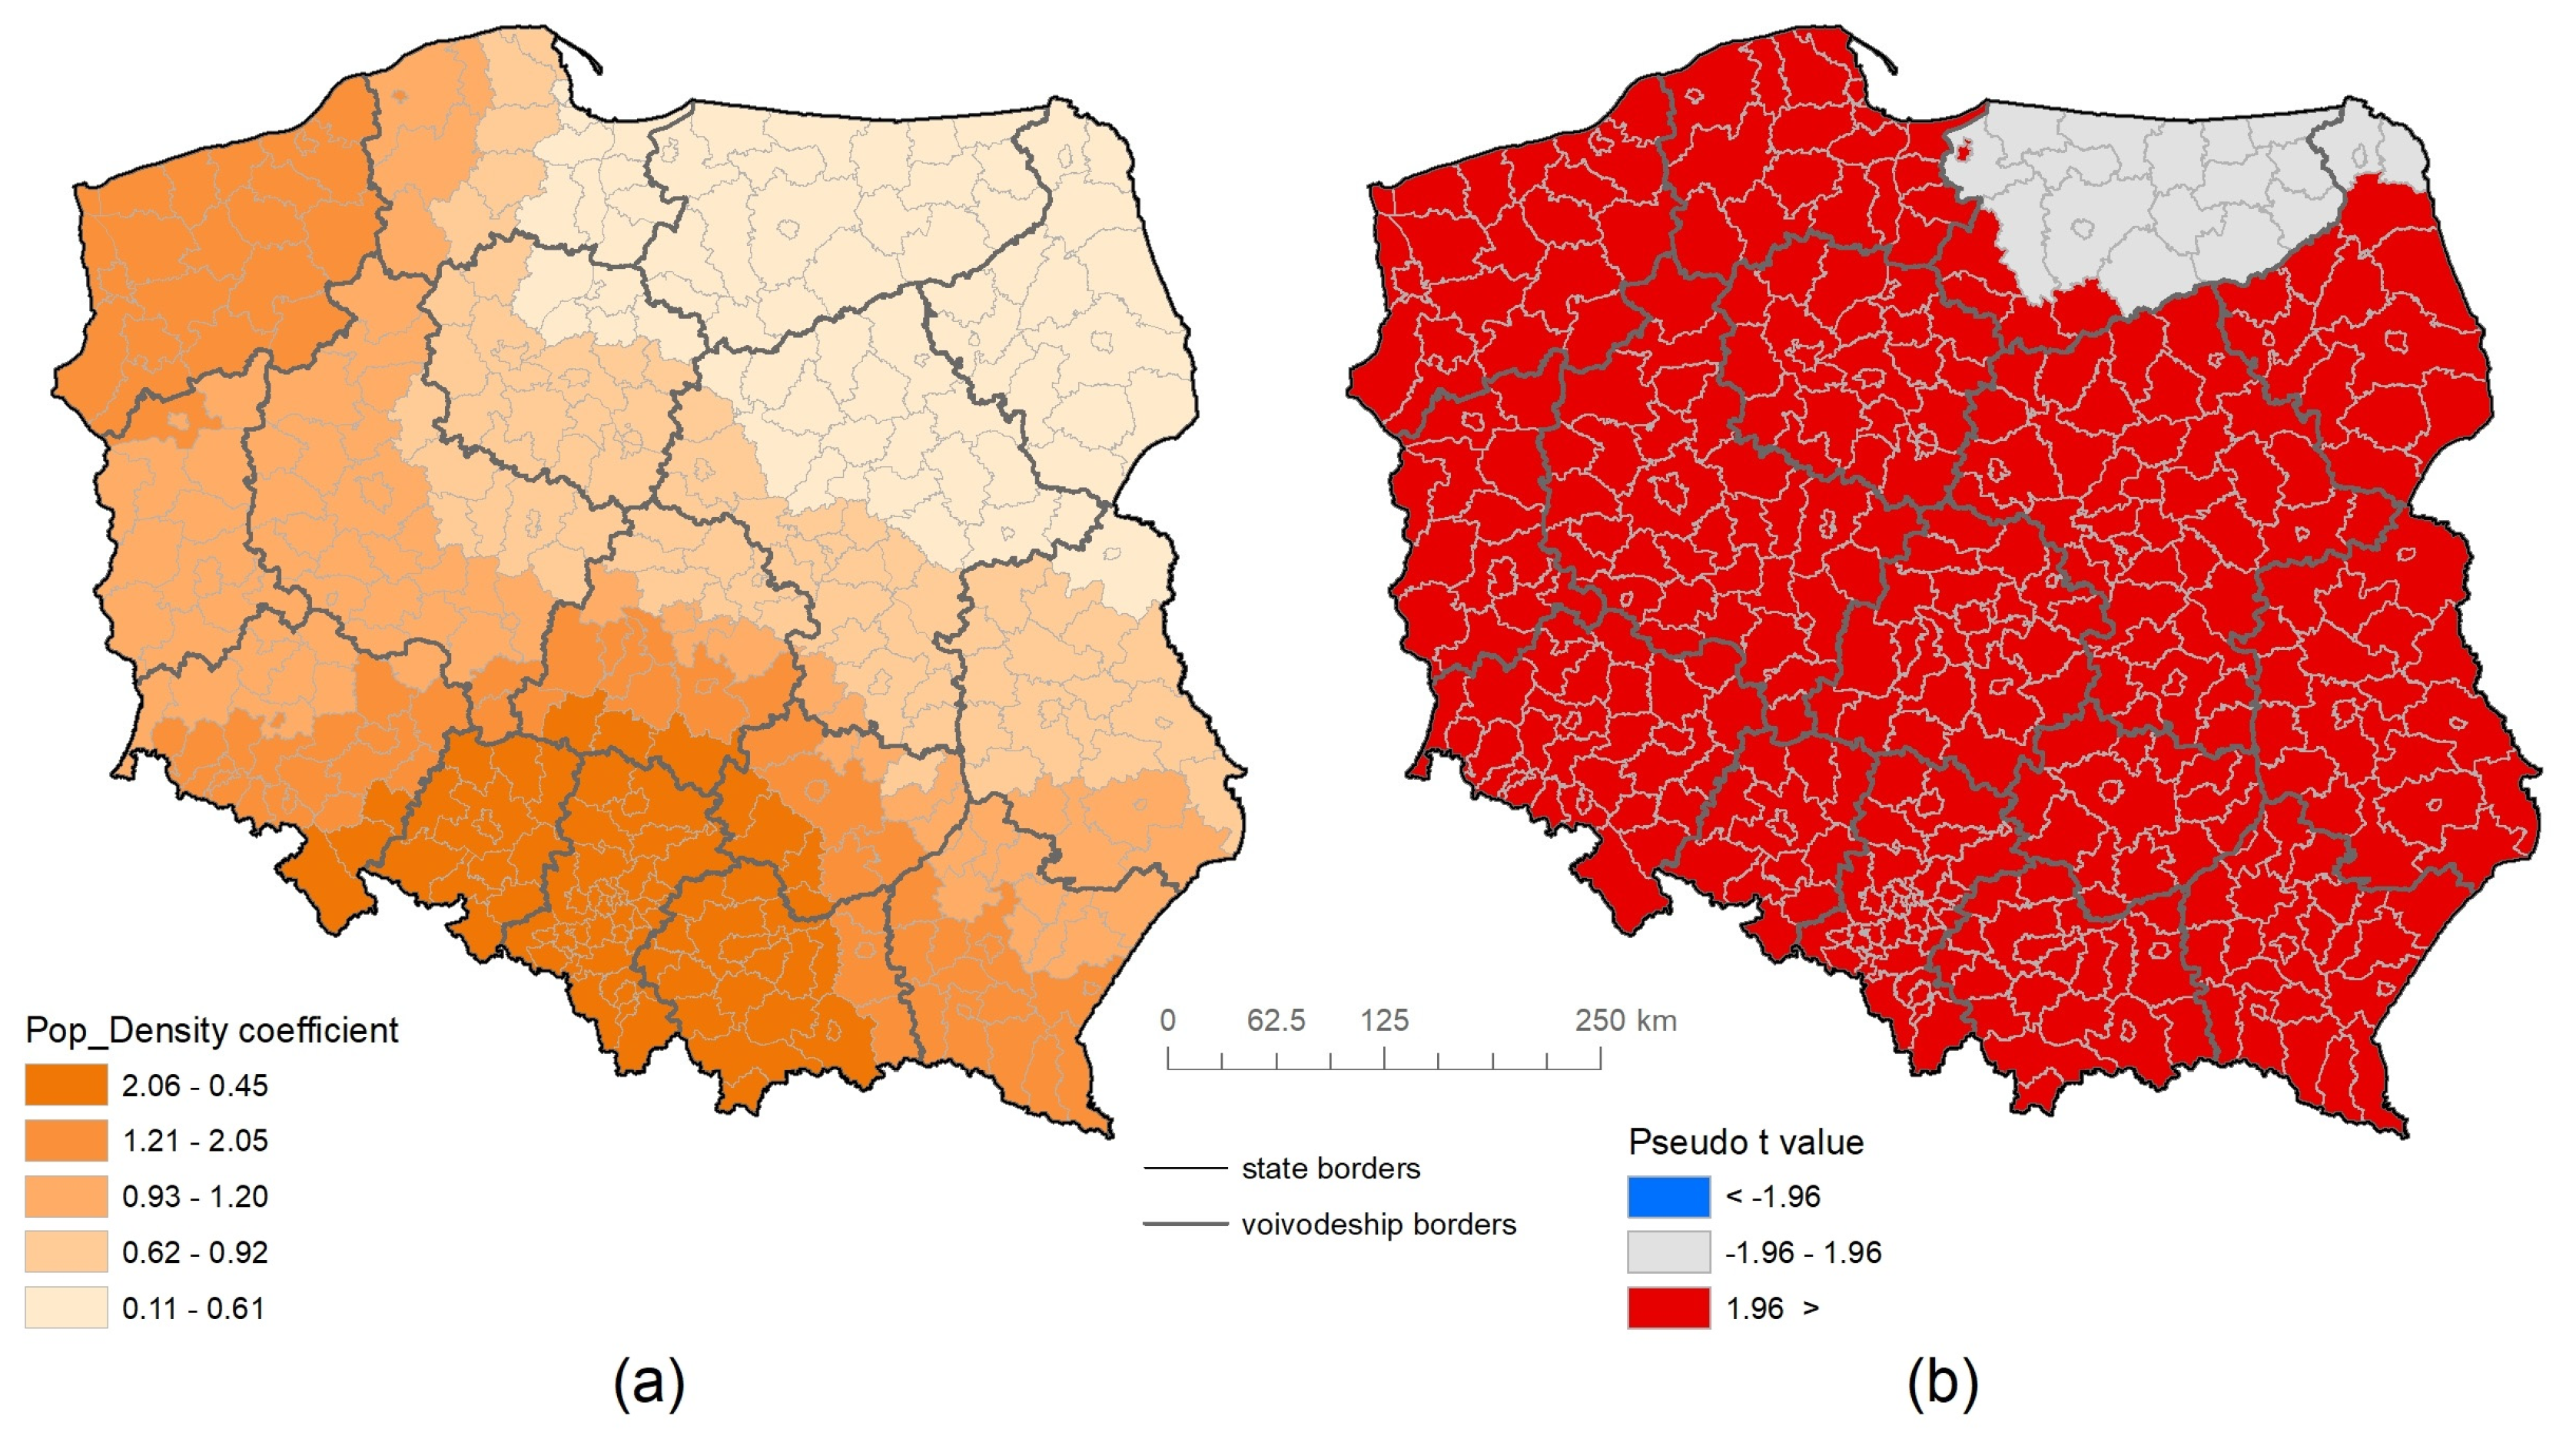
Figure 9.
Value (a) and significance (b) of the effect size of the relationship between the number of residential and residential-commercial buildings (Buildings) and the share of recreational and leisure areas in Polish counties in 2022.
Figure 9.
Value (a) and significance (b) of the effect size of the relationship between the number of residential and residential-commercial buildings (Buildings) and the share of recreational and leisure areas in Polish counties in 2022.
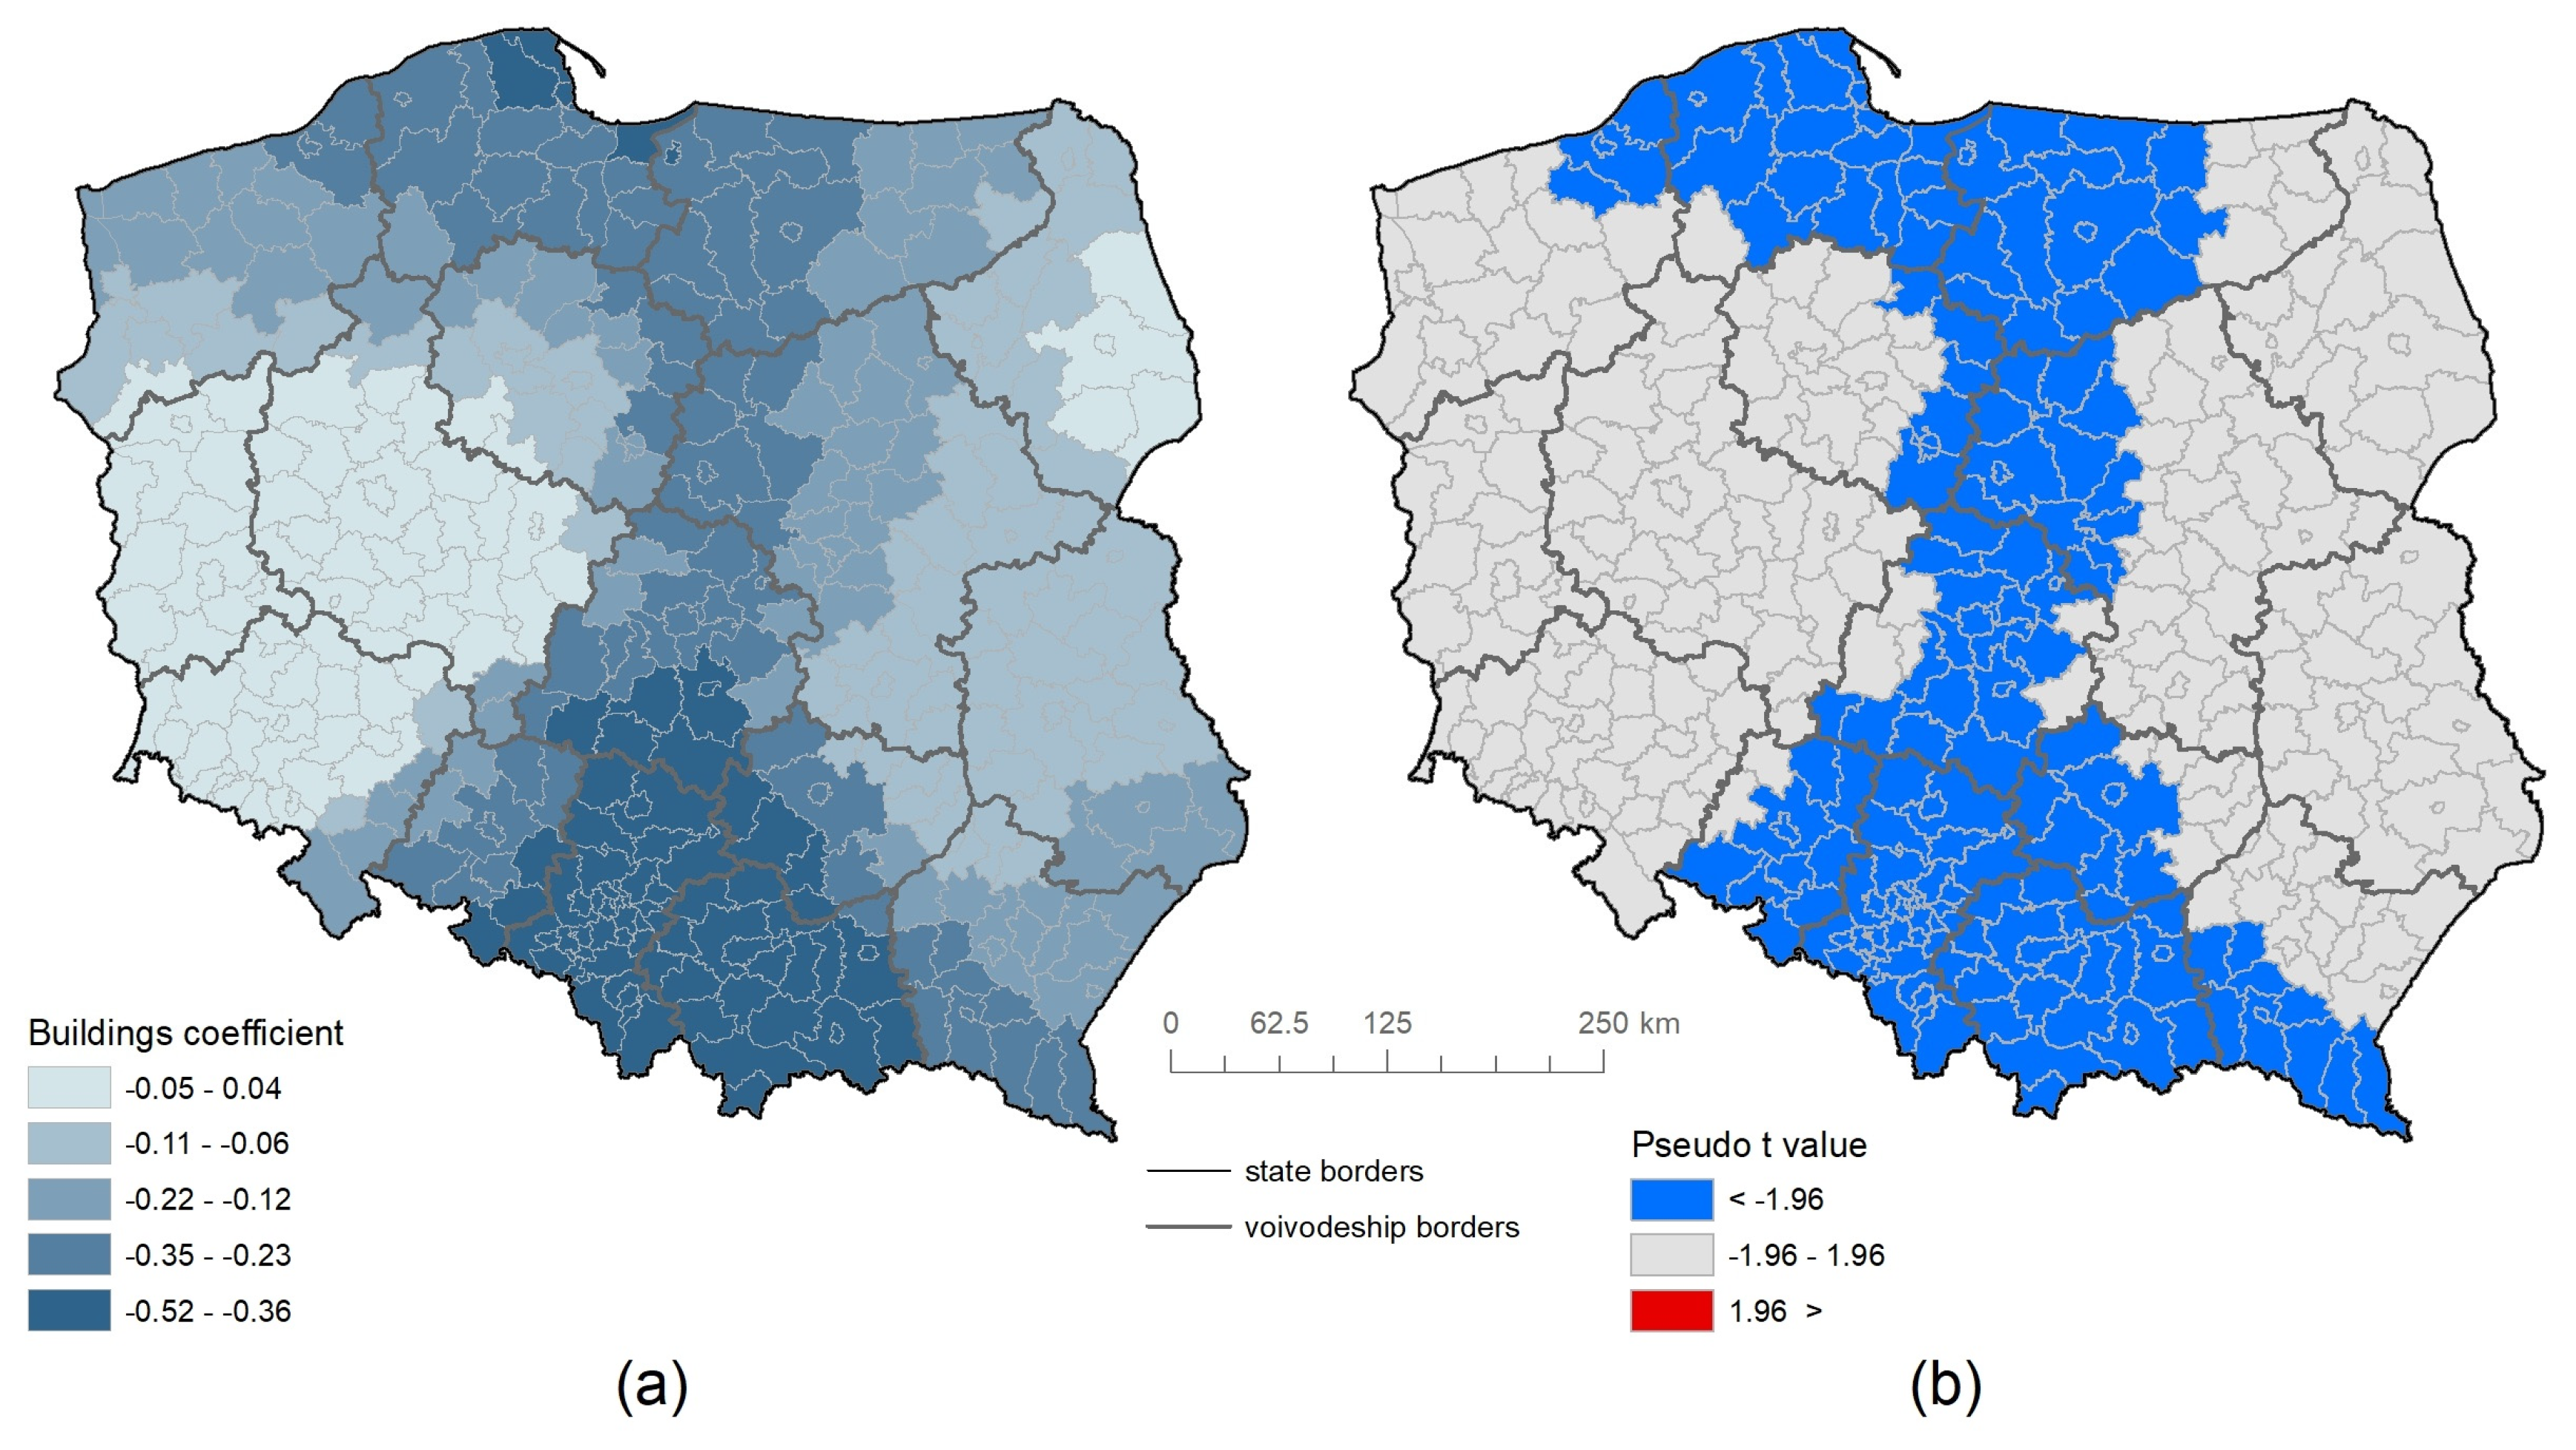
Figure 10.
Value (a) and significance (b) of the effect size of the relationship between local spatial development plans (Local_sp_dev _plan) and the share of recreational and leisure areas in Polish counties in 2022.
Figure 10.
Value (a) and significance (b) of the effect size of the relationship between local spatial development plans (Local_sp_dev _plan) and the share of recreational and leisure areas in Polish counties in 2022.
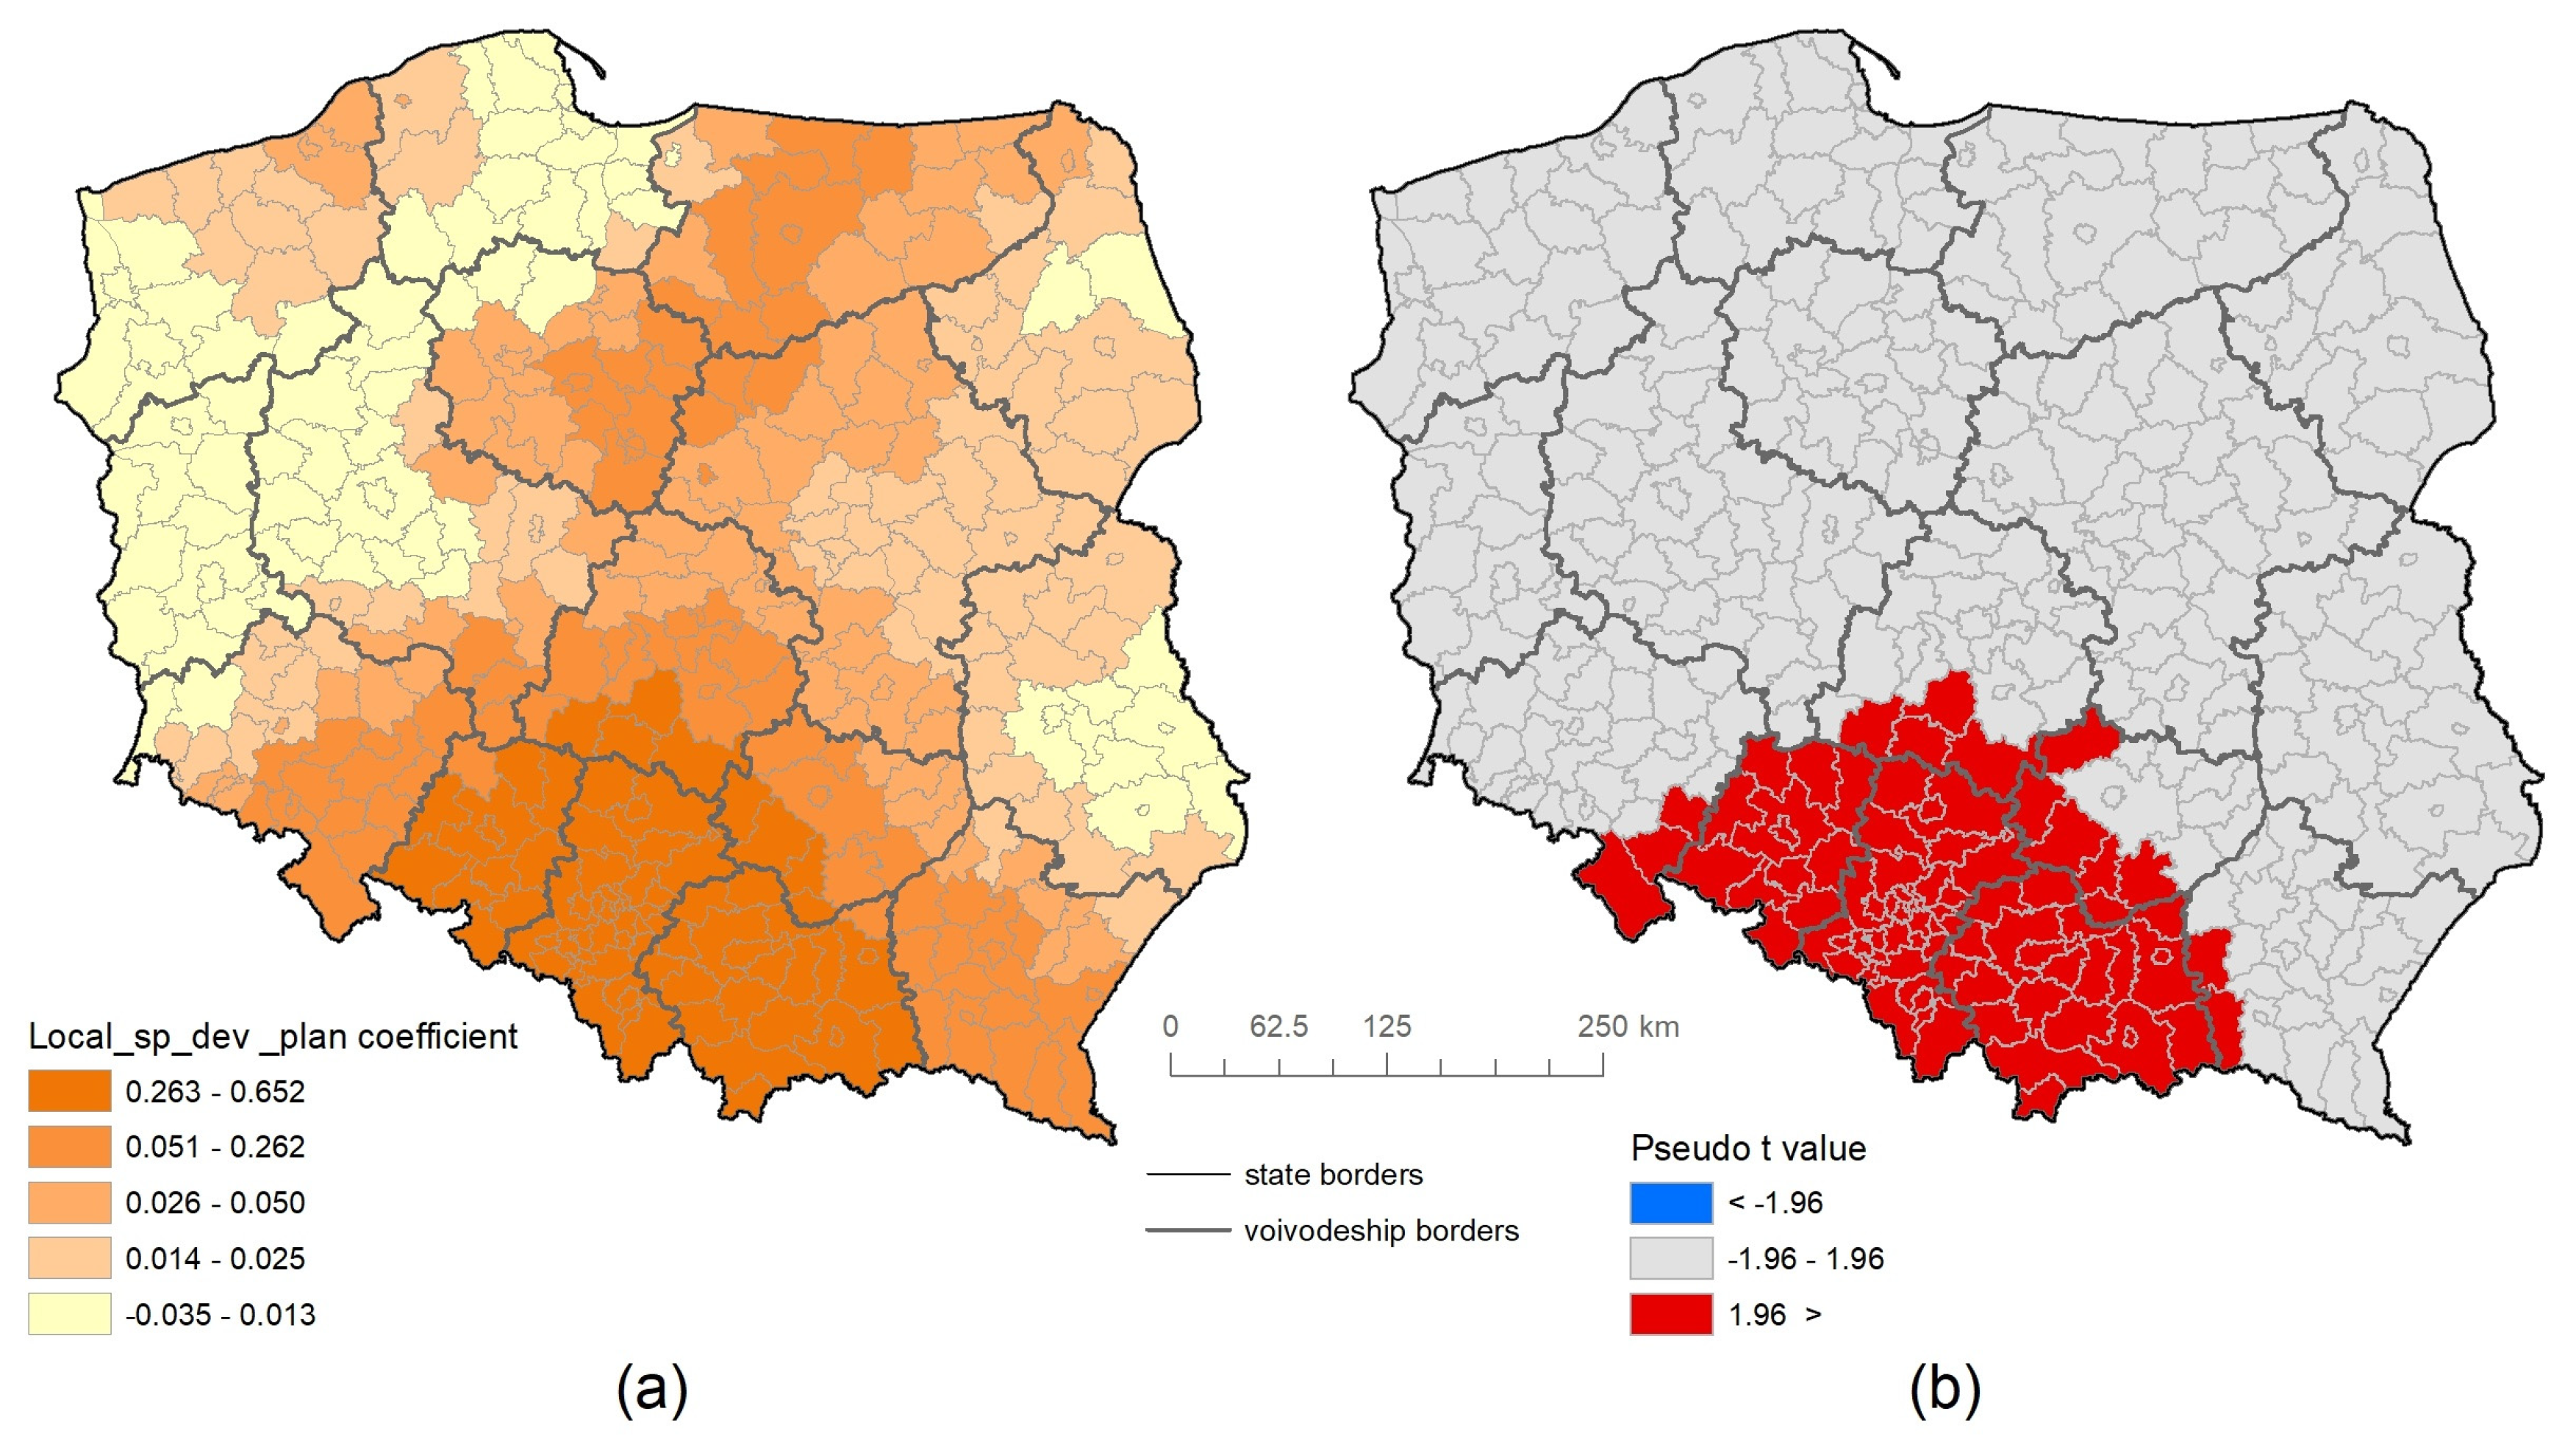
Figure 11.
Value (a) and significance (b) of the effect size of the relationship between income per capita (Income) and the share of recreational and leisure areas in Polish counties in 2022.
Figure 11.
Value (a) and significance (b) of the effect size of the relationship between income per capita (Income) and the share of recreational and leisure areas in Polish counties in 2022.
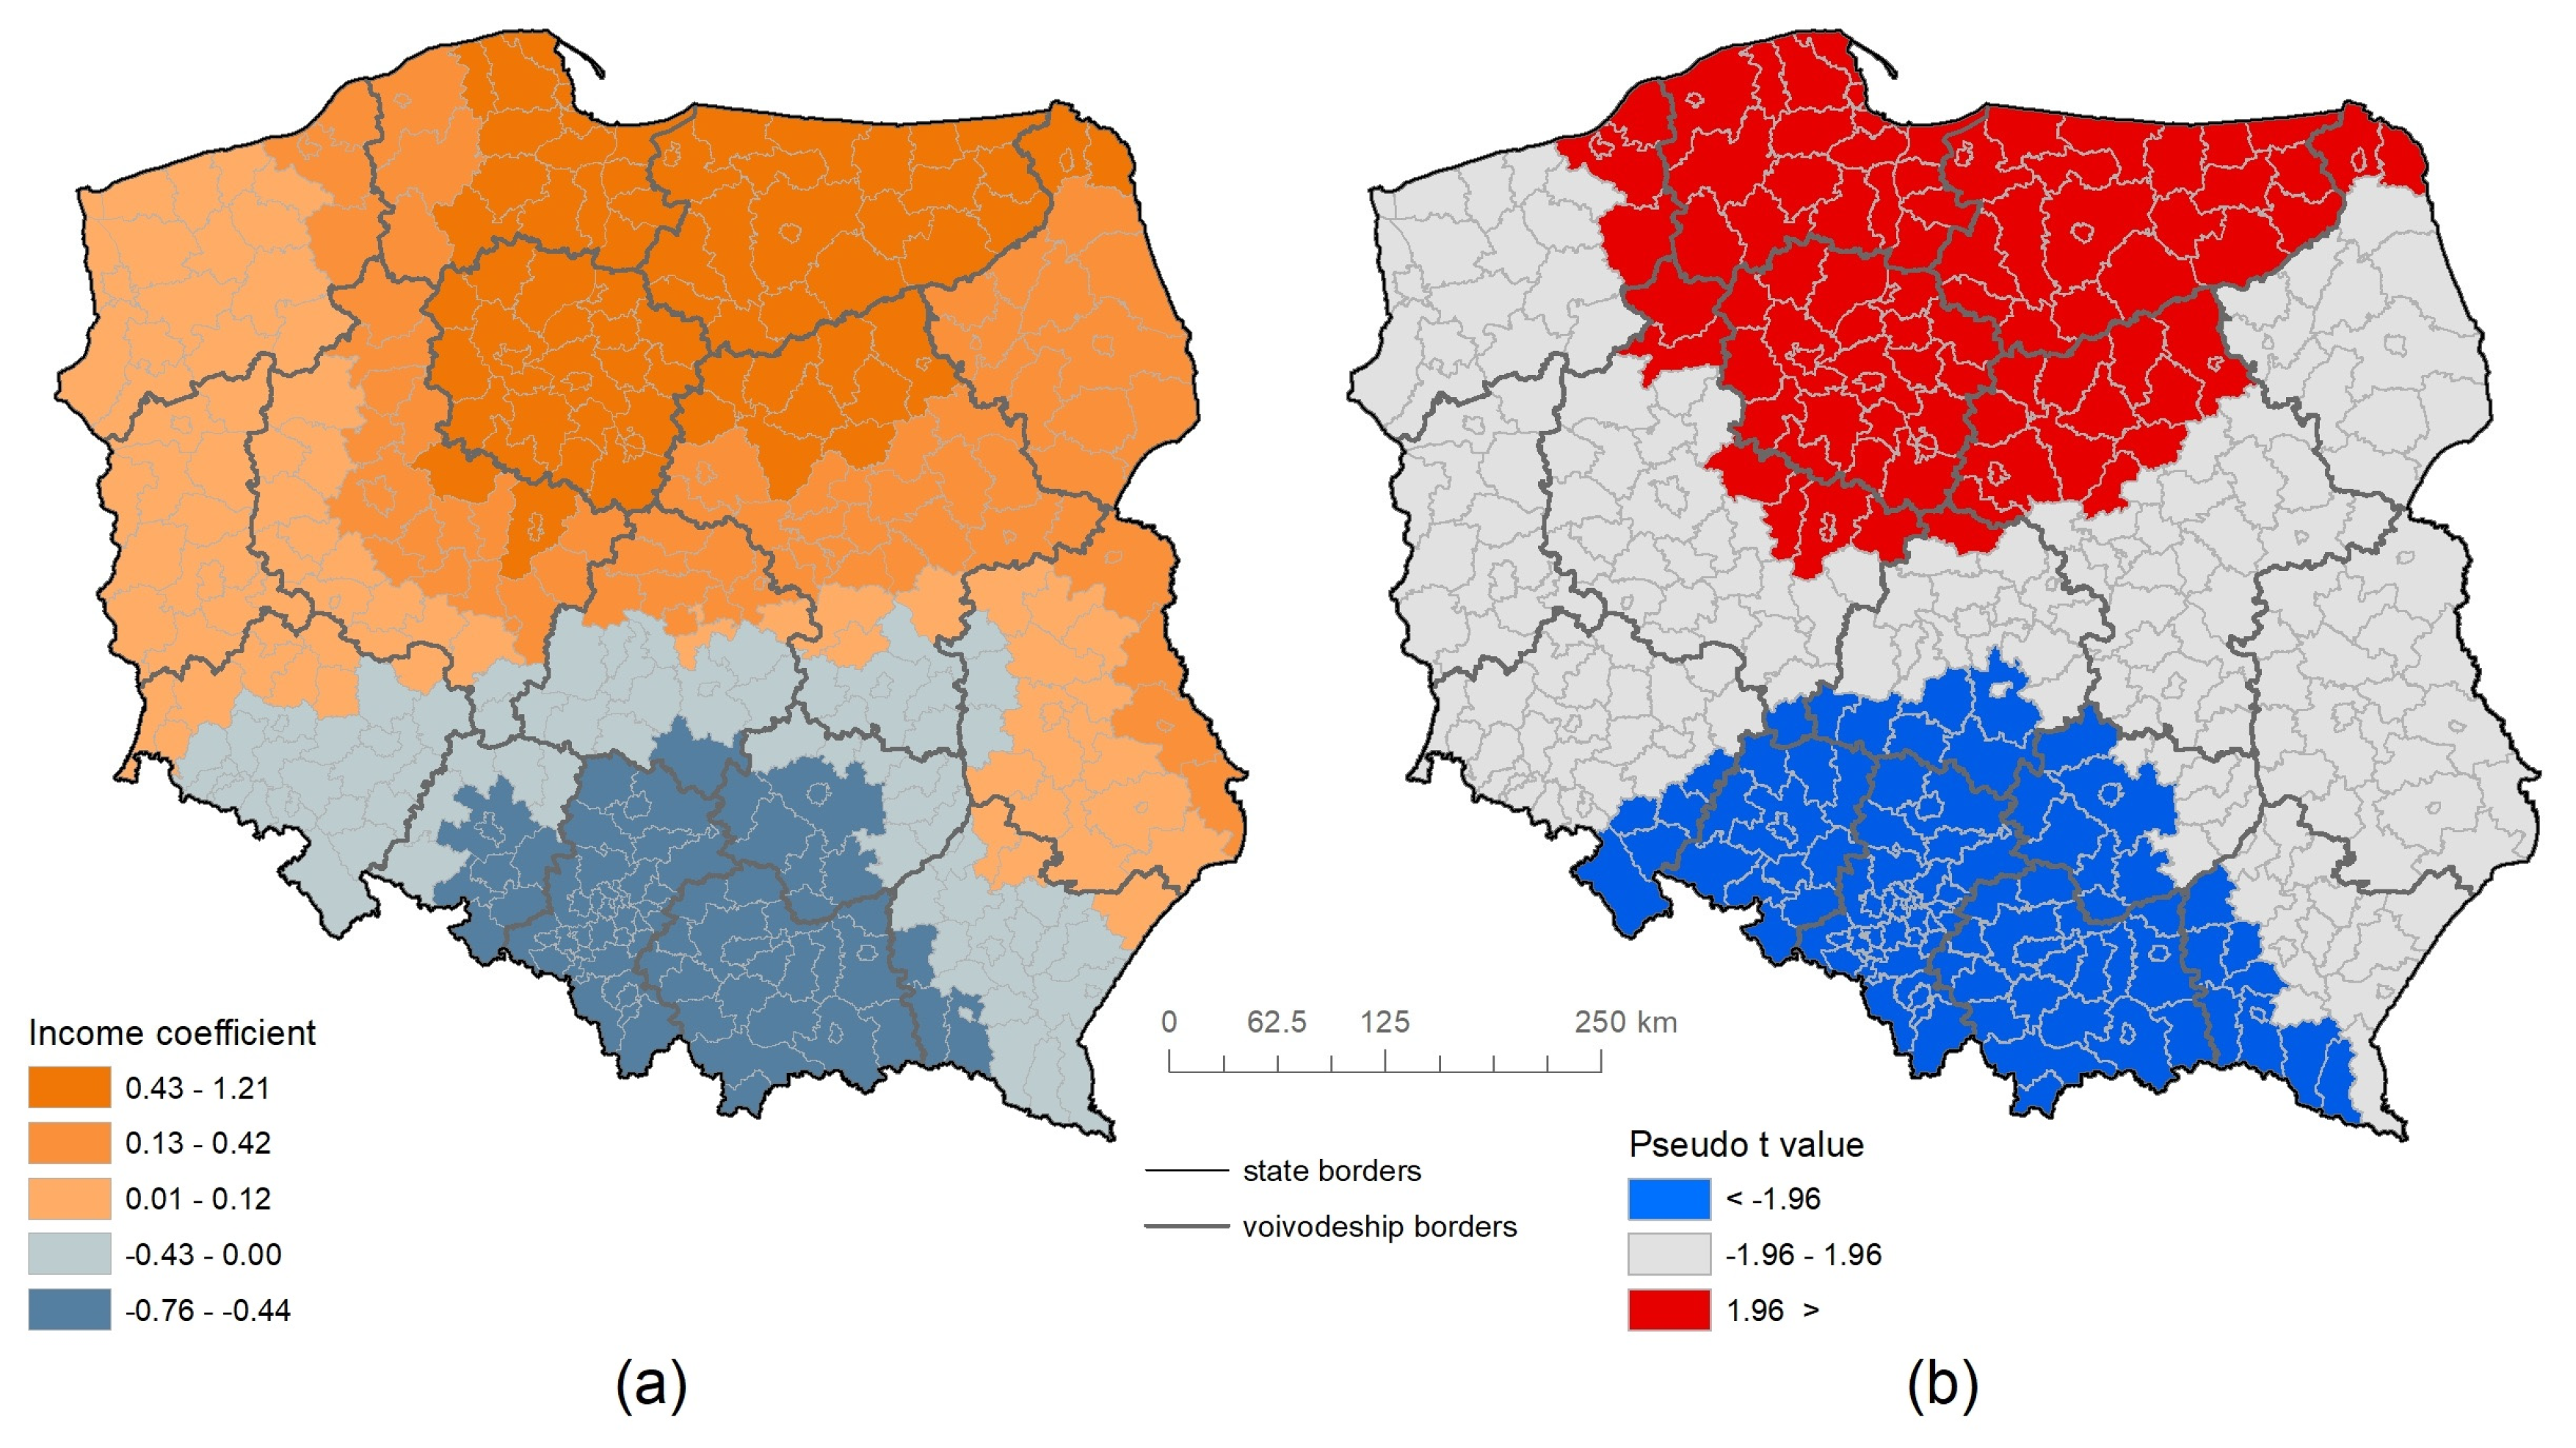
Figure 12.
Value (a) and significance (b) of the effect size of the relationship between EU funds for financing EU programs and projects in 2011-2021 (EU_Funds) and the share of recreational and leisure areas in Polish counties in 2022.
Figure 12.
Value (a) and significance (b) of the effect size of the relationship between EU funds for financing EU programs and projects in 2011-2021 (EU_Funds) and the share of recreational and leisure areas in Polish counties in 2022.
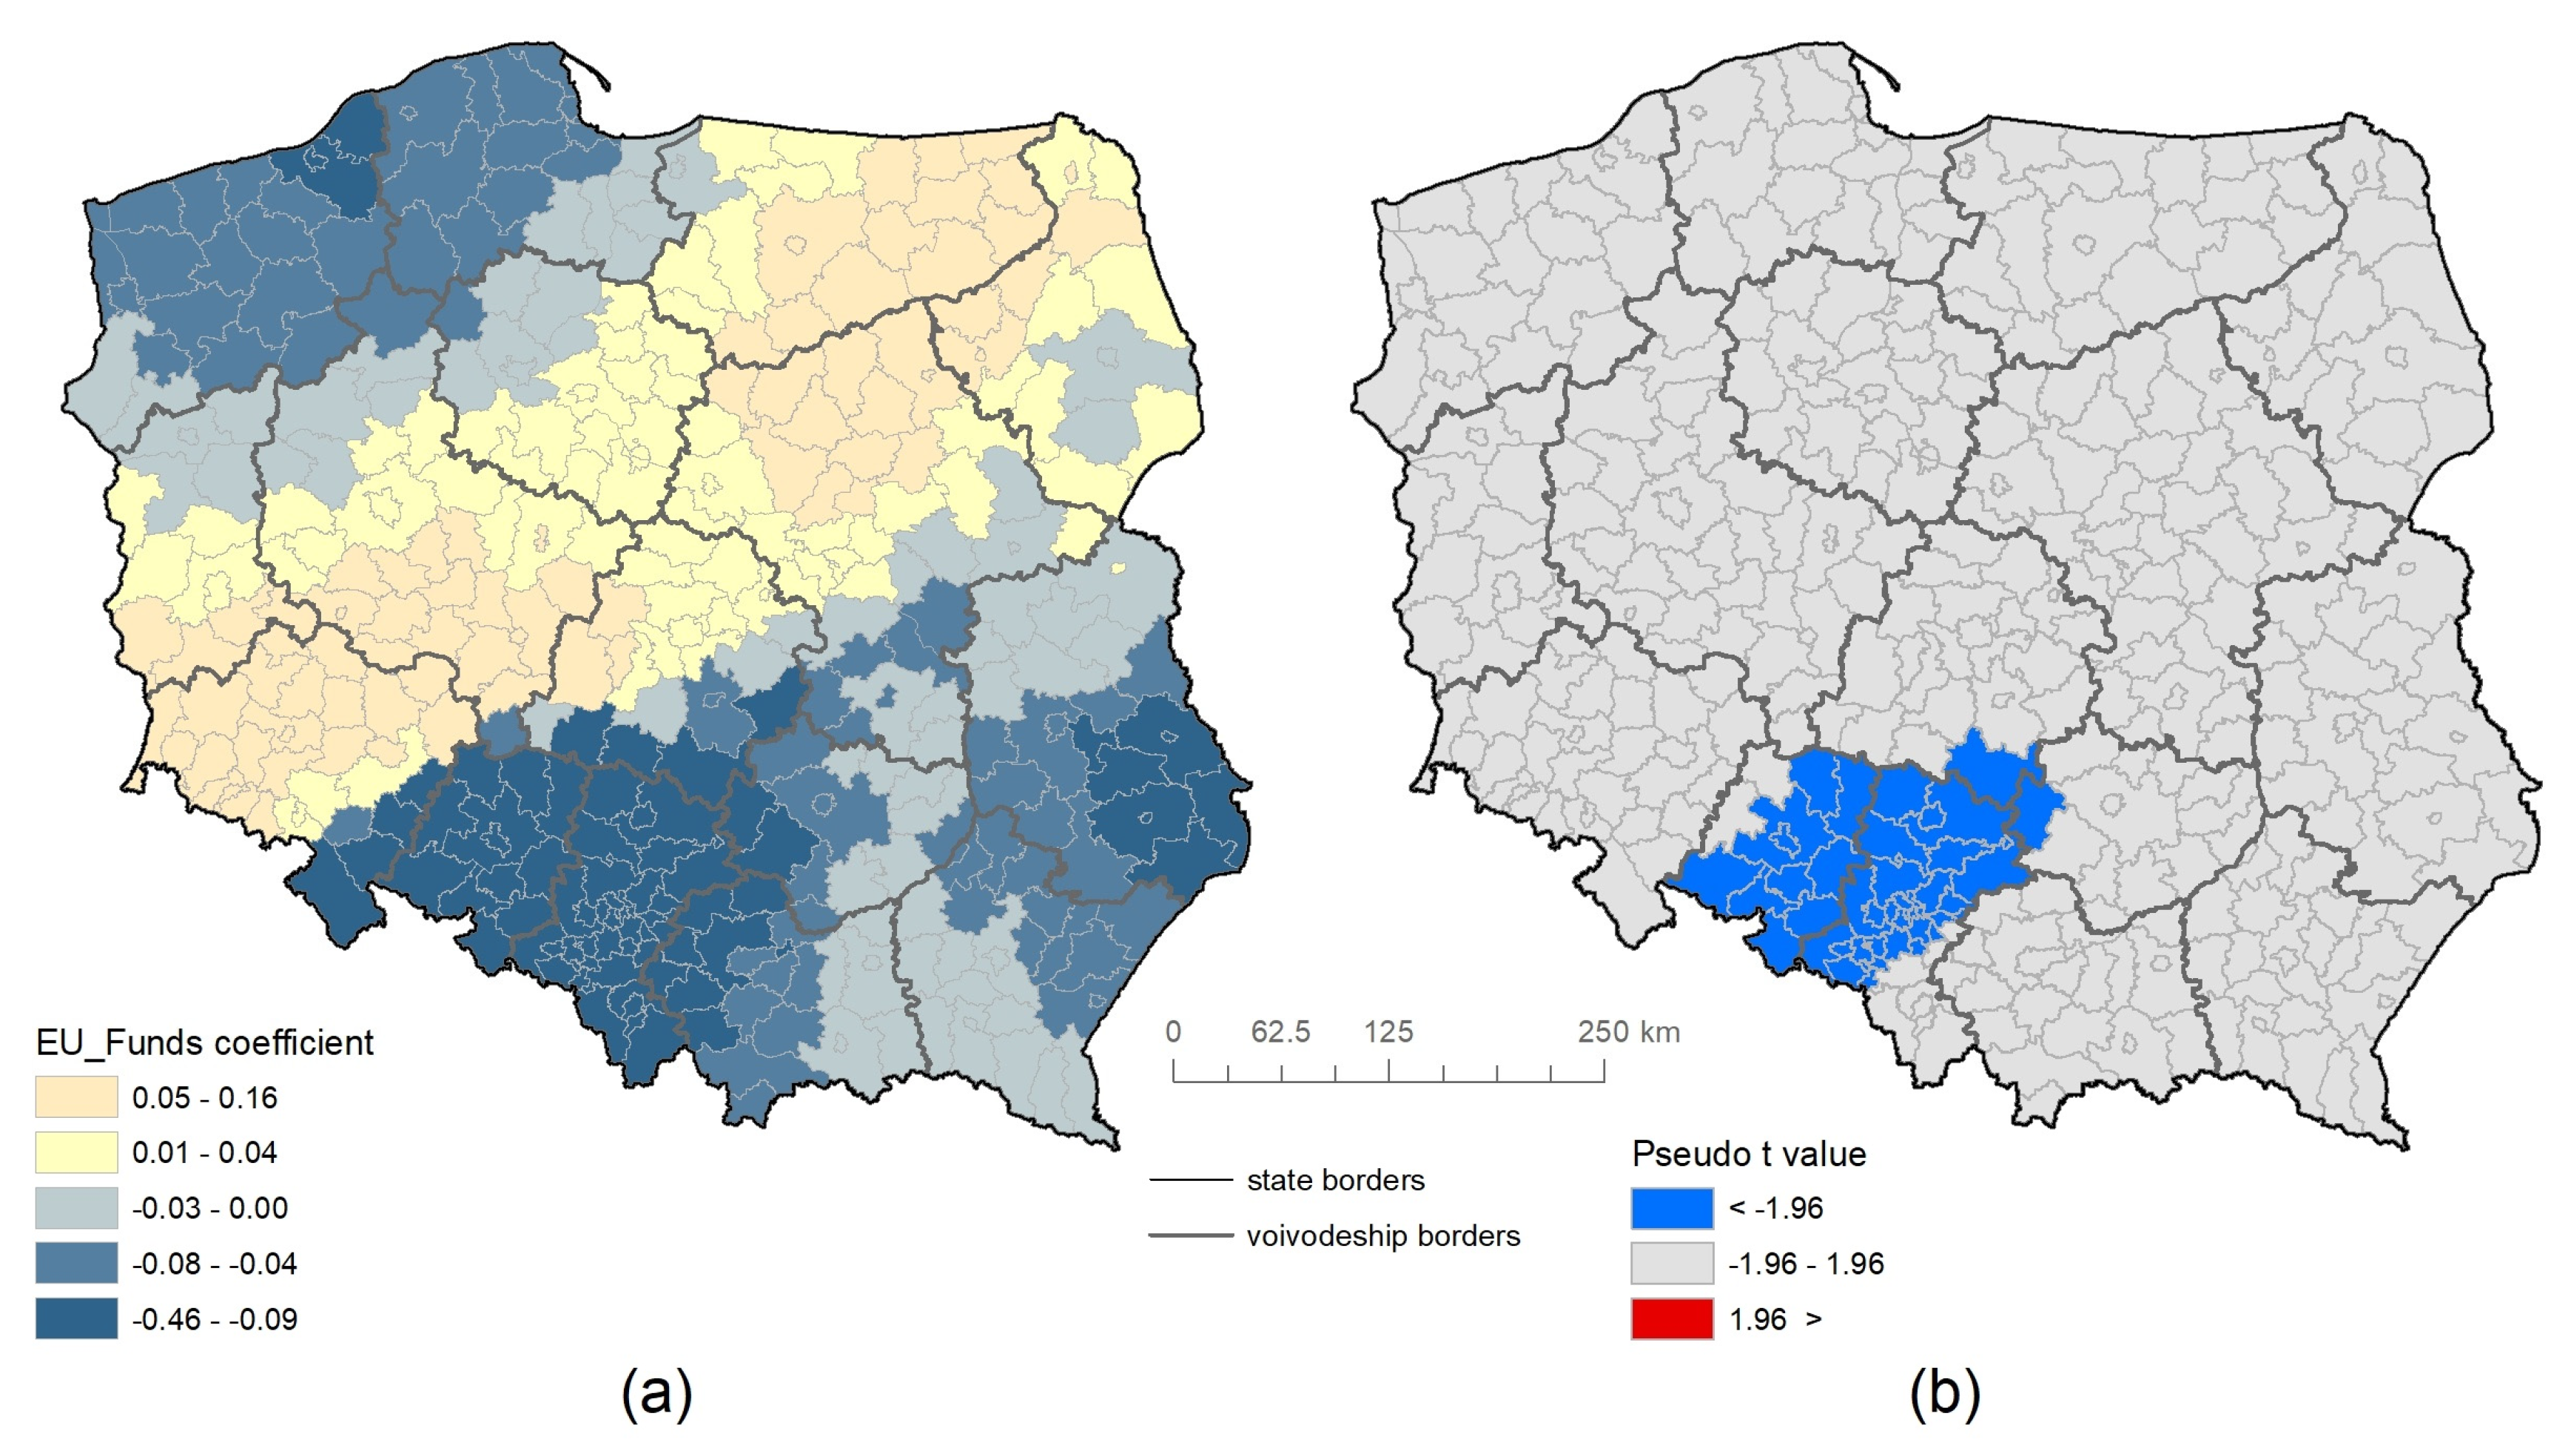

Table 1.
Variables determining the share of recreational and leisure areas in Polish counties in 2022.
Table 1.
Variables determining the share of recreational and leisure areas in Polish counties in 2022.
| Variable | Abbreviation | Unit | References |
|---|---|---|---|
| Population density | Pop_Density | Persons/km2 | [18,74,82,83,84] |
| Residential buildings and residential-commercial buildings with at least one apartment | Buildings | Number of buildings | [82,83,85,86] |
| Local spatial development plans* | Local_sp_dev _plan | Area in ha | [18,83,87,88,89] |
| Income per capita | Income | PLN | [77,89,90,91] |
| EU funds for financing EU programs and projects in 2011-2021 | EU_Funds | Total in PLN | [92,93,94] |
* Based on the Spatial Management Act of 7 July 1994 and the Act of 27 March 2003 on Spatial Planning and Management.
Table 2.
Descriptive statistics for socioeconomic factors
| Socioeconomic factors | Statistics | |||
|---|---|---|---|---|
| Minimum | Median | Average | Maximum | |
| Pop_Density | 18 | 90 | 358 | 3602 |
| Buildings | 2439 | 14497 | 17846.2 | 99190 |
| Local_sp_dev _plan | 299 | 14 819 | 26 056 | 136 113 |
| Income | 5273 | 6399 | 6760 | 19462 |
| EU_Funds | 0 | 10921795.215 | 18694684.2 | 268898723.5 |
Table 3.
Estimation of the global model
| Variable | Coefficient | Standard Error | t-Value | p-Value |
|---|---|---|---|---|
| Pop_Density | 1.4006 | 0.0679 | 20.6021 | p-value < 0.01 |
| Buildings | -0.2749 | 0.0620 | -4.4309 | p-value < 0.01 |
| Local_sp_dev _plan | 0.1346 | 0.0629 | 2.1383 | p-value < 0.01 |
| Income | -0.0306 | 0.0654 | -0.4384 | 0.8136 |
| EU_Funds | -0.0441 | 0,0560 | -0.7880 | 0.2544 |
Table 4.
Summary of GWR coefficients describing spatial variation in the relationships between the share of recreational and leisure areas in Polish counties [%] and socioeconomic factors
Table 4.
Summary of GWR coefficients describing spatial variation in the relationships between the share of recreational and leisure areas in Polish counties [%] and socioeconomic factors
| Socioeconomic factors | Minimum | Median | Average | Maximum |
|---|---|---|---|---|
| Pop_Density | 0.1093 | 1.0965 | 1.2167 | 2.4514 |
| Buildings | -0.5213 | -0.1736 | -0.2021 | 0.0443 |
| Local_sp_dev _plan | -0.0352 | 0.0341 | 0.1382 | 0.6522 |
| Income | -0.7624 | 0.0448 | 0.0691 | 1.2134 |
| EU_Funds | -0.4580 | -0.0130 | -0.0397 | 0.1614 |
Disclaimer/Publisher’s Note: The statements, opinions and data contained in all publications are solely those of the individual author(s) and contributor(s) and not of MDPI and/or the editor(s). MDPI and/or the editor(s) disclaim responsibility for any injury to people or property resulting from any ideas, methods, instructions or products referred to in the content. |
© 2023 by the authors. Licensee MDPI, Basel, Switzerland. This article is an open access article distributed under the terms and conditions of the Creative Commons Attribution (CC BY) license (http://creativecommons.org/licenses/by/4.0/).
Copyright: This open access article is published under a Creative Commons CC BY 4.0 license, which permit the free download, distribution, and reuse, provided that the author and preprint are cited in any reuse.


