
Submitted:
23 October 2023
Posted:
25 October 2023
You are already at the latest version
Preprints on COVID-19 and SARS-CoV-2
Abstract
Angiotensin-converting enzyme 2 (ACE2) and the transmembrane serine protease 2 (TMPRSS2) are recognized as entry proteins of the severe acute respiratory syndrome coronavirus 2 (SARS-CoV-2), and recently their Single Nucleotide Polymorphisms (SNP) have been studied in different populations to elucidate the impact on disease. The aim of this study was to evaluate the genetic SNP of ACE2 (rs35803318) and TMPRSS2 (rs2070788) genes in COVID-19 patients from Northeast Brazil compared with global populations, as well as the expression quantitative trait locus (eQTL). For ACE2 (rs35803318), we found 92.6% CC, 3.4% CT, and 4.0% TT genotype carriers in SARS-CoV-2-positive patients. Surprisingly, only the genotype frequencies of ACE2 SNP were not in Hardy-Weinberg equilibrium. For TMPRSS2 rs2070788, we found 22.3% GG, 50.7% AG, and 27% AA genotype carriers in SARS-CoV-2-positive patients. The expression quantitative trait loci (eQTLs) revealed that rs35803318 was associated with an altered PIR gene expression, and rs2070788 was found eQTLs association only with lung tissue. No significant association was identified between the genotype distribution of SNPs and the 'patient's outcome. In conclusion, our results suggest that ACE2 and TMPRSS2 may not be protective factors for global populations, including the Brazilian population, since the presence of SNPs does not affect the 'patient's outcome as described by other studies.
Keywords:
COVID-19
; ACE2
; TMPRSS2
; polymorphisms
; coronaviruses
1. Introduction
The first coronavirus disease 2019 (COVID-19) case was reported in Wuhan, China [1] almost two years ago. Since then, COVID-19 has afflicted 281,808,270 patients in 210 nations and territories worldwide and resulted in 5,411,759 cumulative deaths until January 03, 2022. In Brazil, the number of COVID-19 cases is among the high-ranking countries in terms of incidence and mortality over these two years, with 22,246,276 positive cases and 618.534 total fatalities through January 03, 2022.
As the literature describes, coronaviruses' spike (S) protein promotes viral entrance into human target cells. The binding of the S protein to a cellular receptor, which allows viral attachment to the surface of target cells, is required for entry. Furthermore, the viral entry involves S protein priming by cellular proteases, which requires S protein cleavage at the S1/S2 and S2' sites enabling the fusing of viral and cellular membranes, a process mediated by the S2 subunit [2,3,4].
In this context, angiotensin-converting enzyme 2 (ACE2) and the transmembrane serine protease 2 (TMPRSS2) are recognized as human entry proteins of the severe acute respiratory syndrome coronavirus 2 (SARS-CoV-2) [3]. Recently, single nucleotide polymorphisms (SNP) on ACE2 and TMPRSS2 genes have been studied in different populations to elucidate the impact on coronavirus disease (COVID-19) establishment. Two SNPs are constantly described in the literature with clinical significance in infectious diseases. The rs35803318 is a synonymous variant (C>T) in the exon 18 of the ACE2 gene, whereas the rs2070788 is an intro variant (G>A) which does not impact the protein [5,6,7,8].
Therefore, in this study, it was investigated the single nucleotide polymorphisms of ACE2 (rs35803318) and TMPRSS2 (rs2070788) genes in COVID-19 patients from Brazil, their association with clinical parameters, and the Expression Quantitative Trait Locus (eQTL) for these SNPs.
2. Materials and Methods
2.1. Study Population and Sample Collection
COVID-19-positive patients from two hospitals: José Frota Institute and São José Hospital, Ceará state (Brazil), were selected. The samples were collected with a nasopharyngeal swab, and SARS-CoV-2 was confirmed by a real-time reverse transcription-polymerase chain reaction (rRT-PCR). RNA was extracted for detection with the 2019-nCoV qPCR Diagnostic Panel from The Centers for Disease Control and Prevention (CDC) following the protocol's instructions. Then, hospitalized COVID-19 patients in the Intensive Care Unit (ICU) with an rRT-PCR quantification cycle below 25 had their blood samples collected for genomic DNA extraction. Therefore, the population-based study was conducted on 56 ICU-admitted patients. Clinical characteristics were also collected, such as blood pressure, heart rate, respiratory rate, Glasgow scale, leukocyte count, platelets count, creatinine, Simplified Acute Physiology Score III (SAPS3), patient's outcome, sepsis occurrence, and necessity of mechanic ventilation.
2.2. Population study
A total of 56 COVID-19 patients admitted to ICU from Brazil were included in the Hardy and Weinberg equilibrium analysis. Moreover, 3,115 samples from 26 different populations concentrated in five continent groups: African, Americas, East Asian, European, and South Asia, were obtained from the 1000 Genomes Phase 3 database (1000G) (www.internationalgenome.org) for comparison purposes.
2.3. Ethics Approvals
The ethical approvals were obtained from the local ethical committee of the Federal University of Ceará (Ref. No. 4.024.941) following human subjects and complied with the principles of the Helsinki Declaration. Informed consent was obtained before collecting samples from all patients.
2.4. SARS-CoV-2 detection
The samples were collected with a nasopharyngeal swab and placed in a 3 mL tube of viral transportation solution. SARS-CoV-2 RNA was extracted using the QIAamp® Viral RNA kit (Qiagen) according to the manufacturer's protocol for one-step SARS-CoV-2 detection. A 2019-nCoV qPCR Diagnostic Panel from The Centers for Disease Control and Prevention (CDC) with specific primers was used to confirm the presence of SARS-CoV-2 in all samples collected. The primer-probe mixes in this kit target two sections of the Nucleocapsid gene (N1 and N2), as well as the human endogenous control (RNase P gene), which serves as a sample integrity control.
2.5. Genomic DNA Extraction
All COVID-19 patients had a 3 mL peripheral blood sample taken in an EDTA tube. Blood samples were promptly kept at temperatures ranging from 20 Cº to 25 Cº. Only patients with positivity for SARS-CoV-2 detection were considered COVID-19 patients and therefore enrolled in this study. DNeasy Blood K (Qiagen, Hilden, Germany) extracted genomic DNA according to the manufacturer's instructions. The isolated DNA was dissolved in nuclease-free water and kept at 4 degrees Celsius until needed. NanoDropTM was used to verify the quality and integrity of DNA (Thermo Scientific, Waltham, MA, USA). By measuring optical density (OD) at 260 nm (OD260) and 280 nm (OD280), all COVID-19 and control DNA samples were checked for purity (OD280). The 260/280 ratios varied from 1.83 to 1.99, suggesting that the DNA was acceptable.
2.6. ACE2 and TMPRSS2 Genotyping
Genotyping was performed using TaqMan SNP (Single Nucleotide Polymorphism) genotyping assays (ThermoFisher Scientific) using ACE2 SNP probe (SNP ID: rs35803318) and TMPRSS2 SNP probe (SNP ID: rs2070788) also obtained from ThermoFisher® Scientific. Real-time TaqMan PCR and genotyping analyses were performed on an Applied Biosystems Quant Studio 5 system (Applied Biosystems, Foster City, CA, USA) according to the manufacturer's standard PCR protocol.
2.7. Expression quantitative trait locus (eQTL)
We used the Genotype-Tissue Expression v7 (GTEx) tool to explore accessible data for expression quantitative trait loci (eQTL) analysis further to understand the potential functions of the strongly related loci. The GTEx was designed to define human transcriptomes and has generated a reference library of non-diseased tissue gene expression levels, including genotype and gene expression. The multi-tissue eQTL and expression level data were obtained from the GTEx Portal V8 (https://gtexportal.org/home) with 49 different tissues from 15,201 samples. The adaptive permutations mode was used with the setting permutation of 1000, and a false discovery rate (FDR) threshold of ≤0.05 was applied to identify genes with a significant eQTL.
2.8. Statistical analysis
Deviations from Hardy–Weinberg disequilibrium (HWD) were calculated by the chi-square (χ2) goodness-of-fit test. Differences in the ACE2 rs35803318 and TMPRSS2 rs2070788 allele frequencies between population groups were evaluated using Fisher's Exact test. Clinical characteristics and genotype association were assessed using chi-square test and Kruskal-Wallis's test. A p-value < 0.05 was considered significant
Results
General characteristics of the study subjects
Fifty-six patients with documented COVID-19-positive PCR admitted to the Intensive Care Unit (ICU) were first analyzed by their clinical characteristics (Table 1). Patients were grouped into a discharged group (patients dismissed from ICU) corresponding to 45 individuals and a deaths group (patients who died at ICU) corresponding to 11 individuals. There were significant differences between discharged and death groups in the following variables: systolic blood pressure, respiratory rate, Glasgow scale, SAPS3, sepsis occurrence, and mechanical ventilation support (Table 1). The prediction power of the prognostic system, SAPS3, was the most exciting result for the death group, in which the score median was 71 against 57 of the discharged group (p<0.0003).
ACE2 and TMPRSS2 SNP distribution in the Brazilian population
Fifty-six ICU-admitted patients from Brazil were enrolled in this study and compared with 3,115 samples from 26 populations concentrated in five continent groups: African, Americas, East Asian, European, and South Asian. Table 2 and Table 3 display the genotypes and allele frequency distribution for human TMPRSS2 (rs2070788) and ACE2 (rs35803318) polymorphisms that varied significantly among the continental populations and our Brazilian cohort.
It was evidenced that the SNP present in the sequences of ACE2 and TMPRSS2 was in agreeance with the Hardy-Weinberg Equilibrium (HWE) in most all populations (p-value>0.05), except for the ACE2 SNP rs35803318 in the Brazilian population (p-value<0.05) (Table 3). For ACE2 rs35803318, we found 92.6% CC, 3.4% CT, and 4.0% TT genotype carriers in SARS-CoV-2-positive patients, with an altered allele frequency of 5.7% for the T-allele. For TMPRSS2 rs2070788, we found 22.3% GG, 50.7% AG, and 27% AA genotype carriers in SARS-CoV-2-positive patients, with an altered allele frequency of 52.4% for the A-allele (Table 2 and Table 3).
Comparing the allelic frequencies of TMPRSS2 (rs2070788) polymorphism, it was found no significant differences when the Brazilian population was compared with Americas, South Asian, or European populations (p>0.05) (Table 2). Comparing the allelic frequencies of ACE2 (rs35803318) polymorphism, no differences, only between Brazil and the Americas or Europe (p>0.05), were observed. On the other hand, the comparison analysis showed that the Brazilian population had distinct frequencies from African and East Asian populations (p<0.05) (Table 3).
2.9. Expression quantitative trait locus (eQTL)
We further evaluated the eQTL profile of TMPRSS2 and ACE2 using the Genotype-Tissue Expression (GTEx) database. We found only one eQTLs associated with TMPRSS2 SNP (rs2070788) expression in the lung tissue (p = 8.9 x 10⁻⁹) (Figure 1). Interestingly, there were 28 specific tissues associated with SNP of ACE2 (rs35803318), and PIR gene expression was the most significant alteration observed, including in testis (NES=-0.321, p-value=3.9x10⁻⁷), as well as esophagus, skin, heart, lung, and pituitary (Figure 2). Moreover, several system nervous tissues (hypothalamus, cerebellum, amygdala, tibial nerve) had significant eQTL with negative normalized effect size (NES<-0.310, p-value<3.9x10⁻⁴).
ACE2 and TMPRSS2 SNPs were not associated with COVID-19 severity and mortality
This paper section presents the genotype and allele distributions of different SNPs considering the clinical variables. Table 4 and Table 5 show the association of the SNPs (ACE2 and TMPRSS2) with a categorial variable such as outcome, sepsis occurrence, and mechanical ventilation requirement. Figure 3 and Figure 4 presented the comparison among SNPs genotypes based on interval variables, such as the Glasgow scale, respiratory rate, heart rate, diastolic and systolic pressure, leukocyte and platelets count, and creatinine levels. No association between the clinical variables presented and the SNPs was demonstrated (P>0.05).
3. Discussion
Since COVID-19 was declared a pandemic by the World Health Organization (WHO) on March 11, 2020, the SARS-CoV-2 interaction with human target cells has been studied to comprehend and provide a method for preventing these interactions [9,10]. The first case in Brazil occurred in February from a man who arrived from Italy and presented the characteristic symptoms of the disease. Two days later, around 182 suspect cases occurred in 16 Brazilian states. From April, the contagion was widely distributed. In May, Brazil had already trespassed the number of cases in China, with Ceara State being the third state out of 26 with more cases and the first in the Northeast with 48,489 cases, according to the Ministry of Health [11].
As we already know, SARS-CoV-2 enters the targeted cells using the viral spike (S) protein to interact with a cellular receptor. The virus entry depends on the binding of the S protein to the TMPRSS2 for S protein priming and engages ACE2 as the entrance receptor [2,3]. Furthermore, distinct variations in the genes ACE2 and TMPRSS2 have been observed in various populations worldwide, indicating that differences in COVID-19 infection and severity may be influenced by host genetic backgrounds [6,12,13].
The genetic background of the Brazilian population is quite complex to analyze, given the significant admixture between European, African, and indigenous individuals and the history of invasions, migrations, and forced slavery [14]. Moreover, Ceará state was the first state that freed slaves in Brazil, with a new flow of migration and interaction. This genetic complexity can be an advantage in mapping genes for diseases, as it allows the observation of clinical and biological effects resulting from such an expansive admixture.
Among several SNPs analyses gaining attention in the literature [15,16,17], two SNPs studied, rs2070788 (TMPRSS2) and rs35803318 (ACE2), have been studied in the European population, Peruvian native American and Amazon native American [6,7]. This study aims to describe the distribution of these SNPs in the Brazilian population compared to other continental populations and the impact of these variants on gene expression and clinical parameters. It is worth noticing that our study is the first to discuss these SNPs in the northeast region of Brazil, a populational background with strong African and European ancestry [18].
Our results revealed that rs35803318 (ACE2) was the only SNP in Hardy-Weinberg (HWE) disequilibrium for the Brazilian population. Several factors cause deviations of HWE in a population, such as mutation, natural selection, non-random mating, genetic drift, and gene flow [19]. In a vast population with multiple ethnicities, as in Brazil, non-random mating related to geographical location may be a prevalent source of departures from HWE due to heterozygous deficiency [20]. An Italian study with rs35803318 (ACE2) also revealed significant differences in the frequency distribution in the Italian cohort compared to the American population [5]. Additionally, one of the most important aspects for consideration about ACE2 SNP is its absence in Asian and African Populations (Table 3) which indicates the European contribution for Brazilian polymorphism distribution in this case, same results observed by another study [7].
Moreover, regarding rs35803318 (ACE2) polymorphism, there were no significant differences between Brazil, the Americas, and European populations, which can be explained by the highly heterogeneous and inter-ethnic admixture in the Brazilian population [21]. In contrast, the comparison analysis showed that the Brazilian population had distinct frequencies from the African and Asian populations even though the Africans extensively arrived in Brazil between the 17th and 19th centuries [22]. We also hypothesized that the comparison differences of ACE2 (rs35803318) SNP's allelic frequencies might occur due to the H-W disequilibrium observed [23].
The estimated effect size of an eQTL allele on gene expression is recorded in the GTEx database, which enables the identification of genes whose expression is influenced by genetic variation [24]. Previously, a study found that the presence of the rs2070788 GG genotype, which corresponds to higher TMPRSS2 expression in human lung tissues, increased the risk of severe H1N1 influenza [25]. Then, we first hypothesized that the genotype AA, which corresponds to lower TMPRSS2 expression in the lung, can protect against COVID-19 for populations such as East Asia and Africa based on the eQTL results and the genotype frequencies. In this sense, we also suggested that Brazil and the Americas might be the most susceptible population to SARS-CoV-2 infections since the AA genotype is low frequency.
The trans-regulatory role of SNP rs35803318 (ACE2) was another key finding of our investigation. The presence of the altered allele (T) reduces the expression of the PIR gene, which encodes for the Pirin protein [26]. Pirin causes a significant activation of the NF-B/p65 pathway, which is linked to various chronic inflammatory illnesses [27]. As a result, NF-B p65 pathway hyperactivation causes cytokine storm syndrome and enhances COVID-19 severity [28]. Shoily et al. [29] had already reported another SNP rs4646156 (ACE2) as an eQTL locus that can modify the expression of the PIR gene in various tissues, including the esophagus, thyroid, adipose, and artery. Interestingly, the highest frequency of the TT genotype was found in the Brazilian population analyzed.
Our preliminary results and a few studies have hypothesized that rs2070788 (TMPRSS2) and rs35803318 (ACE2) SNPs are statistically associated with severe illness and poor prognosis in different populations [6,7,30,31]. However, despite it, there was no significant association between clinical parameters and SNPs’ genotype distribution in the Brazilian population. Therefore, on the opposite side of other countries' studies, the Brazilian patient's outcome or severity was not affected by the presence or absence of ACE2 and TMPRSS2 SNPs.
In conclusion, this study showed the genotype and allele frequencies of rs2070788 (TMPRSS2) and rs35803318 (ACE2) SNPs in different populations. Since the presence of polymorphisms with a protective feature against SARS-CoV-2, the Hardy-Weinberg imbalance of polymorphisms in the studied population may have a relevant impact on disease behavior for the Brazilian northeast population. However, in contrast to other studies, there was no significant association between genotype distribution and patient’ outcome and severity.
Author Contributions
FPM, JBSS, LLB, CFAM, MEAM and RCM designed the study. JBSS, SPB, LAGMF, CMMP, MHCGC and LLAC implemented the study and collected data. JBSS, LLB, LBL and CFAM were responsible for the laboratory analysis. FPM and PFNS analyzed and interpreted the data. FPM and PFNS wrote the first draft of the manuscript. All authors revised the manuscript and approved the final version.
Funding
This work was supported by CAPES (nº 88881.505364/2020-01) and FUNCAP (nº 3195011/2020).
Acknowledgments
We are thankful for the Federal University of Ceará, CAPES and FUNCAP.
Conflicts of Interest
The authors declare no potential conflict of interest.
References
- Huang C, Wang Y, Li X et al. Clinical features of patients infected with 2019 novel coronavirus in Wuhan, China. Lancet 395(10223), 497–506 (2020). [CrossRef]
- Souza PFN, Mesquita FP, Amaral JL et al. The human pandemic coronaviruses on the show: The spike glycoprotein as the main actor in the coronaviruses play, Elsevier B.V., (2021). [CrossRef]
- Hoffmann M, Kleine-Weber H, Schroeder S et al. SARS-CoV-2 Cell Entry Depends on ACE2 and TMPRSS2 and Is Blocked by a Clinically Proven Protease Inhibitor. Cell 181(2), 271-280.e8 (2020). [CrossRef]
- Yan R, Zhang Y, Li Y, Xia L, Guo Y, Zhou Q. Structural basis for the recognition of SARS-CoV-2 by full-length human ACE2. Science (80-. ). 367(6485), 1444–1448 (2020).
- Strafella C, Caputo V, Termine A et al. Analysis of ACE2 Genetic Variability among Populations Highlights a Possible Link with COVID-19-Related Neurological Complications. Genes 2020, Vol. 11, Page 741 11(7), 741 (2020). [CrossRef]
- Kehdy FSG, Pita-Oliveira M, Scudeler MM et al. Human-SARS-CoV-2 interactome and human genetic diversity: TMPRSS2-rs2070788, associated with severe influenza, and its population genetics caveats in Native Americans. Genet. Mol. Biol. 44(1 Suppl 1) (2021). [CrossRef]
- Khayat AS, De Assumpção PP, Khayat BCM et al. ACE2 polymorphisms as potential players in COVID-19 outcome. PLoS One 15(12) (2020). [CrossRef]
- Irham LM, Chou WH, Calkins MJ, Adikusuma W, Hsieh SL, Chang WC. Genetic variants that influence SARS-CoV-2 receptor TMPRSS2 expression among population cohorts from multiple continents. Biochem. Biophys. Res. Commun. 529(2), 263–269 (2020). [CrossRef]
- Wang C, Horby PW, Hayden FG, Gao GF. A novel coronavirus outbreak of global health concern. Lancet (London, England) 395(10223), 470–473 (2020). [CrossRef]
- Phan T. Novel coronavirus: From discovery to clinical diagnostics. Infect. Genet. Evol. 79 (2020). [CrossRef]
- de Melo CML, Silva GAS, Melo ARS, de Freitas AC. COVID-19 pandemic outbreak: the Brazilian reality from the first case to the collapse of health services. An. Acad. Bras. Cienc. 92(4), 1–14 (2020). [CrossRef]
- Cao Y, Li L, Feng Z et al. Comparative genetic analysis of the novel coronavirus (2019-nCoV/SARS-CoV-2) receptor ACE2 in different populations. Cell Discov. 6(1) (2020). [CrossRef]
- Islam KU, Iqbal J. An Update on Molecular Diagnostics for COVID-19. Front. Cell. Infect. Microbiol. 10 (2020). [CrossRef]
- Calvo-González E. On slaves and genes: ‘origins’ and ‘processes’ in genetic studies of the Brazilian population. Hist. Cienc. Saude. Manguinhos. 21(4), 1–16 (2014). [CrossRef]
- Suryamohan K, Diwanji D, Stawiski EW et al. Human ACE2 receptor polymorphisms and altered susceptibility to SARS-CoV-2. Commun. Biol. 2021 41 4(1), 1–11 (2021). [CrossRef]
- Ng JW, Chong ETJ, Lee P-C. An Updated Review on the Role of Single Nucleotide Polymorphisms in COVID-19 Disease Severity: A Global Aspect. Curr. Pharm. Biotechnol. 23(13), 1596–1611 (2022). [CrossRef]
- Suh S, Lee S, Gym H et al. A systematic review on papers that study on Single Nucleotide Polymorphism that affects coronavirus 2019 severity. BMC Infect. Dis. 22(1) (2022). [CrossRef]
- Pena SDJ, Santos FR, Tarazona-Santos E. Genetic admixture in Brazil. Am. J. Med. Genet. C. Semin. Med. Genet. 184(4), 928–938 (2020). [CrossRef]
- Graffelman J, Jain D, Weir B. A genome-wide study of Hardy-Weinberg equilibrium with next generation sequence data. Hum. Genet. 136(6), 727–741 (2017). [CrossRef]
- Abramovs N, Brass A, Tassabehji M. Hardy-Weinberg Equilibrium in the Large Scale Genomic Sequencing Era. Front. Genet. 11 (2020). [CrossRef]
- Mychaleckyj JC, Havt A, Nayak U et al. Genome-Wide Analysis in Brazilians Reveals Highly Differentiated Native American Genome Regions. Mol. Biol. Evol. 34(3), 559–574 (2017). [CrossRef]
- Manta FSN, Pereira R, Caiafa A, Silva DA, Gusmão L, Carvalho EF. Analysis of genetic ancestry in the admixed Brazilian population from Rio de Janeiro using 46 autosomal ancestry-informative indel markers. Ann. Hum. Biol. 40(1), 94–98 (2013). [CrossRef]
- Grover VK, Cole DEC, Hamilton DC. Attributing Hardy-Weinberg disequilibrium to population stratification and genetic association in case-control studies. Ann. Hum. Genet. 74(1), 77–87 (2010). [CrossRef]
- Aguet F, Barbeira AN, Bonazzola R et al. The GTEx Consortium atlas of genetic regulatory effects across human tissues. Science 369(6509), 1318–1330 (2020). [CrossRef]
- Cheng Z, Zhou J, To KKW et al. Identification of TMPRSS2 as a Susceptibility Gene for Severe 2009 Pandemic A(H1N1) Influenza and A(H7N9) Influenza. J. Infect. Dis. 212(8), 1214–1221 (2015). [CrossRef]
- Shovlin CL, Vizcaychipi MP. Vascular inflammation and endothelial injury in SARS-CoV-2 infection: The overlooked regulatory cascades implicated by the ACE2 gene cluster. QJM (2020). [CrossRef]
- Giridharan S, Srinivasan M. Mechanisms of NF-κB p65 and strategies for therapeutic manipulation. J. Inflamm. Res. 11, 407–419 (2018).
- Hariharan A, Hakeem AR, Radhakrishnan S, Reddy MS, Rela M. The Role and Therapeutic Potential of NF-kappa-B Pathway in Severe COVID-19 Patients. Inflammopharmacology 29(1), 91–100 (2021). [CrossRef]
- Shoily SS, Ahsan T, Fatema K, Sajib AA. Disparities in COVID-19 severities and casualties across ethnic groups around the globe and patterns of ACE2 and PIR variants. Infect. Genet. Evol. 92 (2021). [CrossRef]
- Pandey RK, Srivastava A, Singh PP, Chaubey G. Genetic association of TMPRSS2 rs2070788 polymorphism with COVID-19 case fatality rate among Indian populations. Infect. Genet. Evol. 98, 105206 (2022). [CrossRef]
- Shikov AE, Barbitoff YA, Glotov AS et al. Analysis of the Spectrum of ACE2 Variation Suggests a Possible Influence of Rare and Common Variants on Susceptibility to COVID-19 and Severity of Outcome. Front. Genet. 11, 1129 (2020). [CrossRef]
Figure 1.
Multi-tissue expression quantitative trait loci (eQTLs) association of TMPRSS2 polymorphism (rs35803318) and TMPRSS2 gene expression. Significant normalized effect size (NES) values were assumed with a p-value<0.05. Data analyzed from Gtex database https://gtexportal.org/home/.
Figure 1.
Multi-tissue expression quantitative trait loci (eQTLs) association of TMPRSS2 polymorphism (rs35803318) and TMPRSS2 gene expression. Significant normalized effect size (NES) values were assumed with a p-value<0.05. Data analyzed from Gtex database https://gtexportal.org/home/.
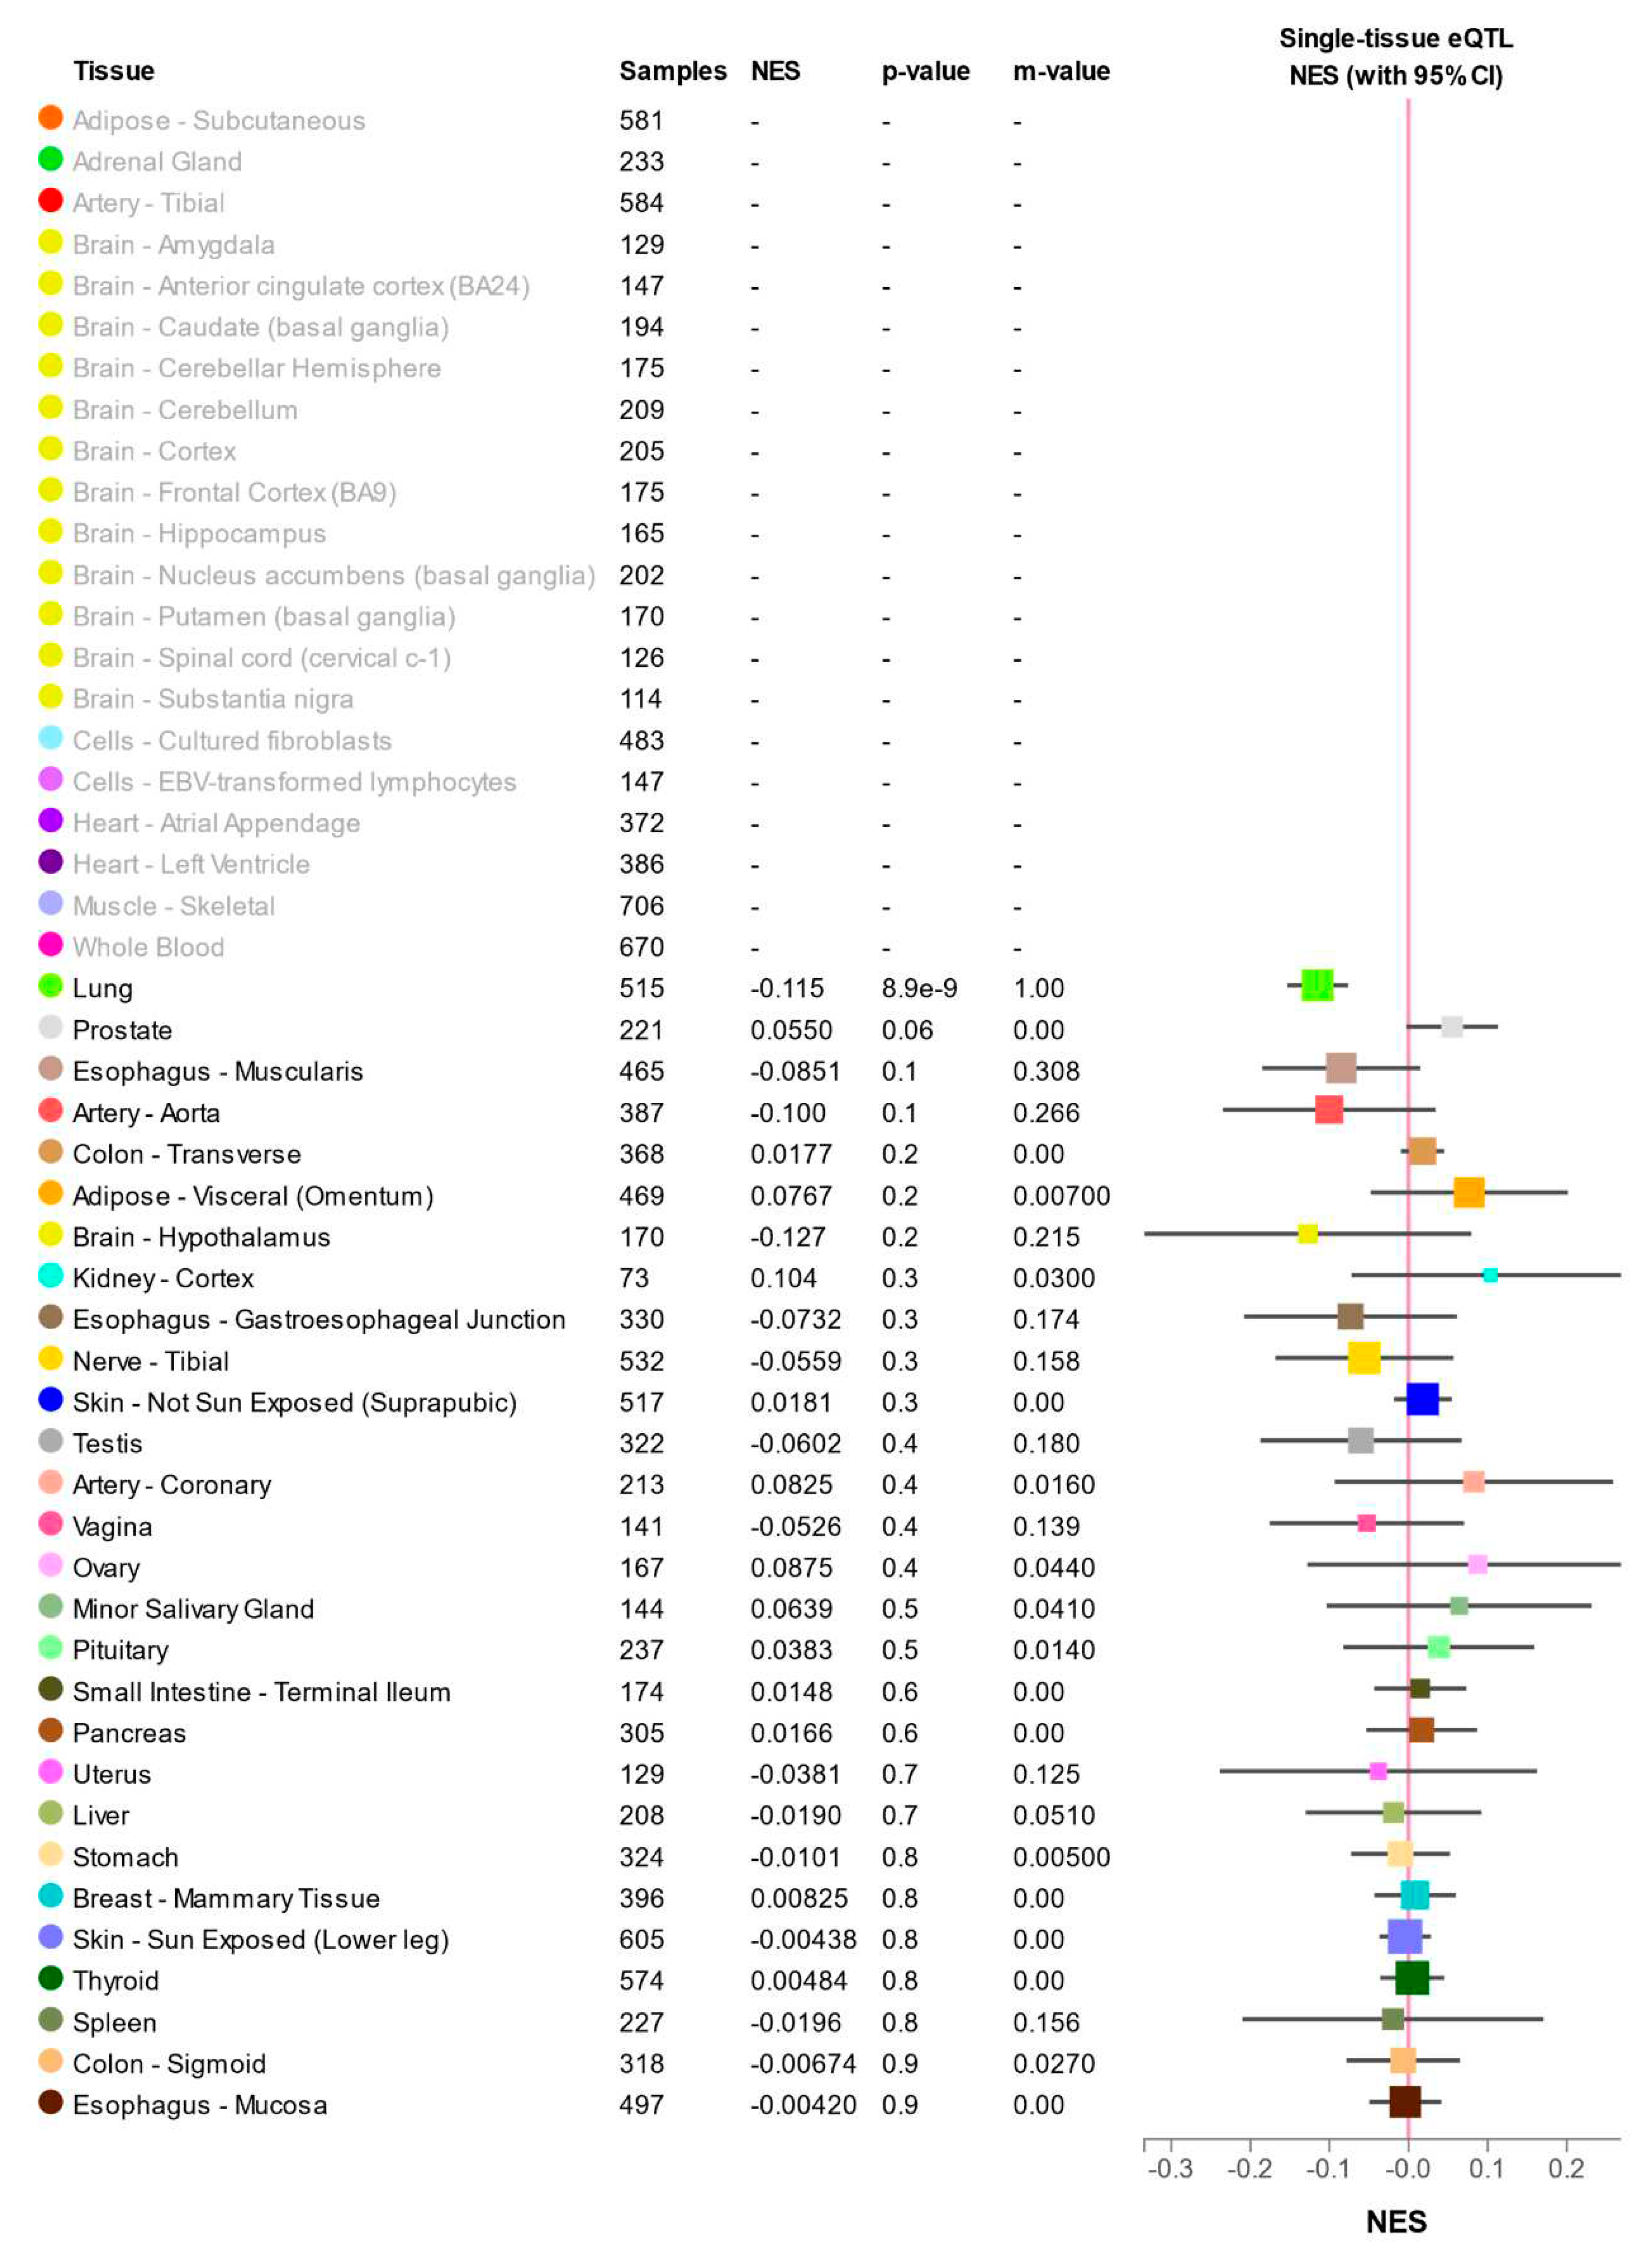
Figure 2.
Multi-tissue expression quantitative trait loci (eQTLs) association of ACE2 polymorphism (rs35803318) and PIR gene expression. Significant normalized effect size (NES) values were assumed with a p-value<0.05. Data analyzed from Gtex database https://gtexportal.org/home/.
Figure 2.
Multi-tissue expression quantitative trait loci (eQTLs) association of ACE2 polymorphism (rs35803318) and PIR gene expression. Significant normalized effect size (NES) values were assumed with a p-value<0.05. Data analyzed from Gtex database https://gtexportal.org/home/.
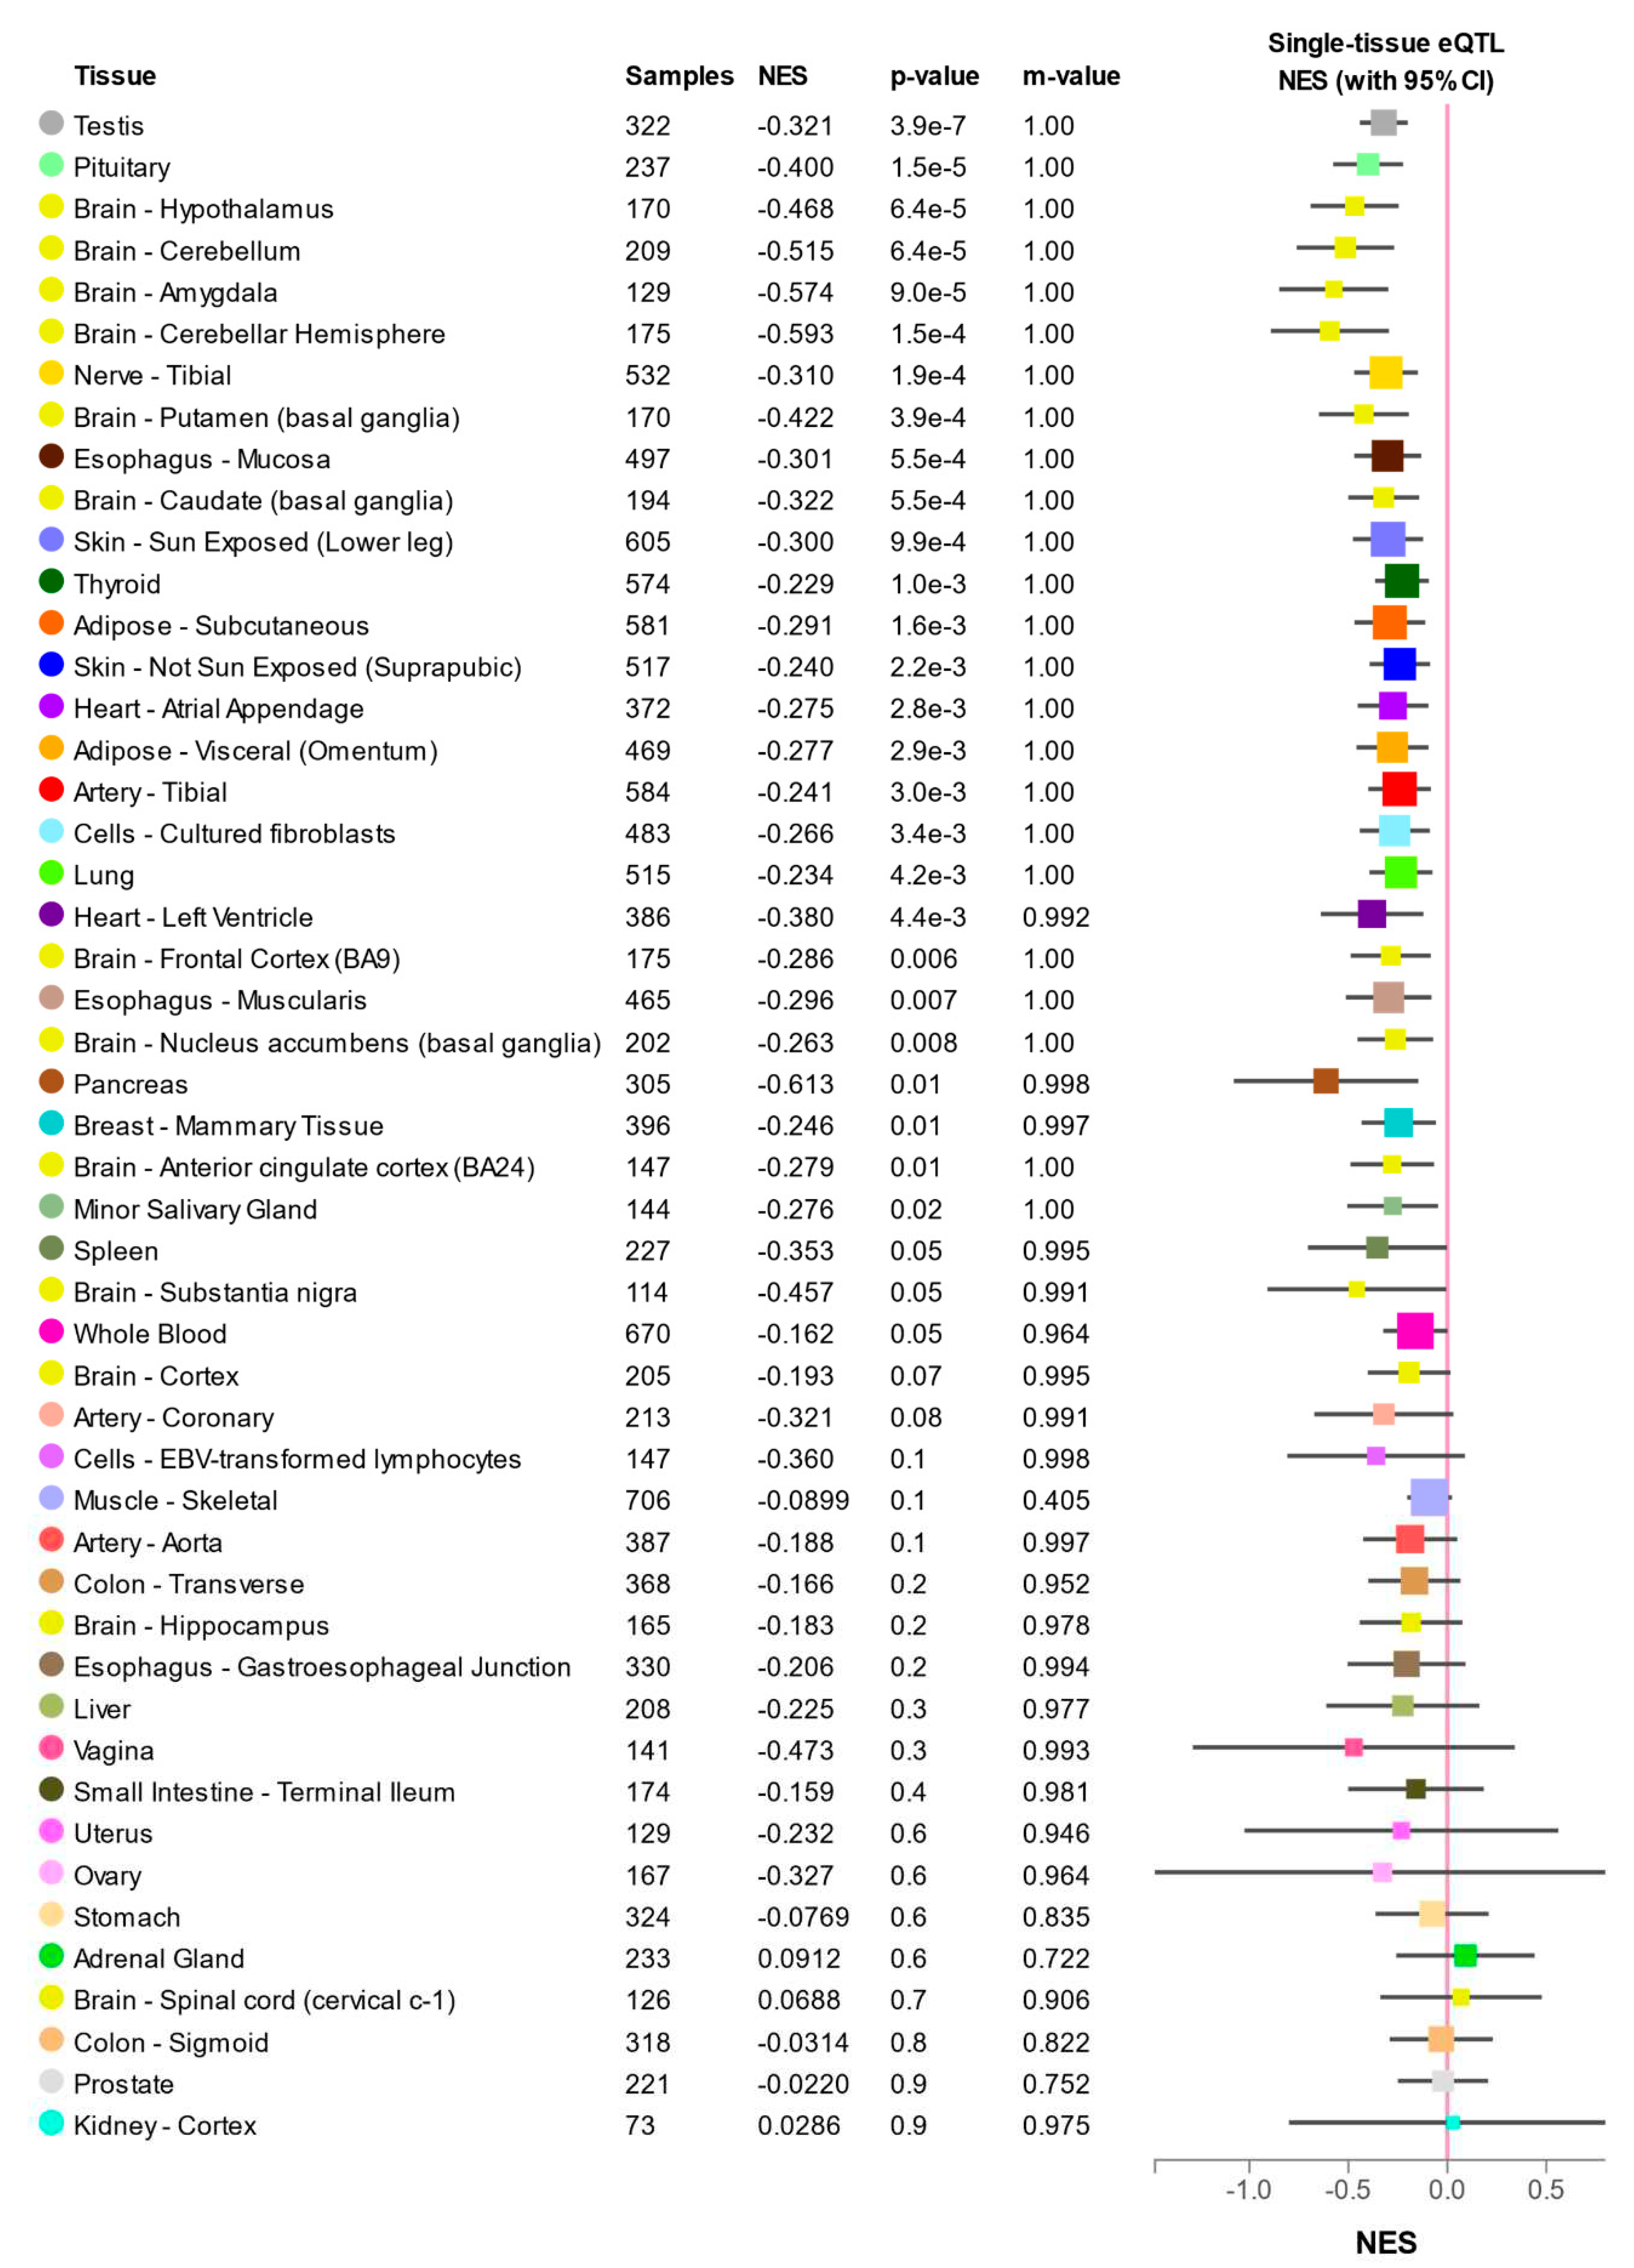
Figure 3.
Genotype distribution of polymorphism rs2070788 (TMPRSS2) was not associated with any clinical characteristics as well as the SAPS3 score. Data are presented as the median and significant differences were tested with Kruskal-'Wallis's test. Significant differences: p<0.05.
Figure 3.
Genotype distribution of polymorphism rs2070788 (TMPRSS2) was not associated with any clinical characteristics as well as the SAPS3 score. Data are presented as the median and significant differences were tested with Kruskal-'Wallis's test. Significant differences: p<0.05.
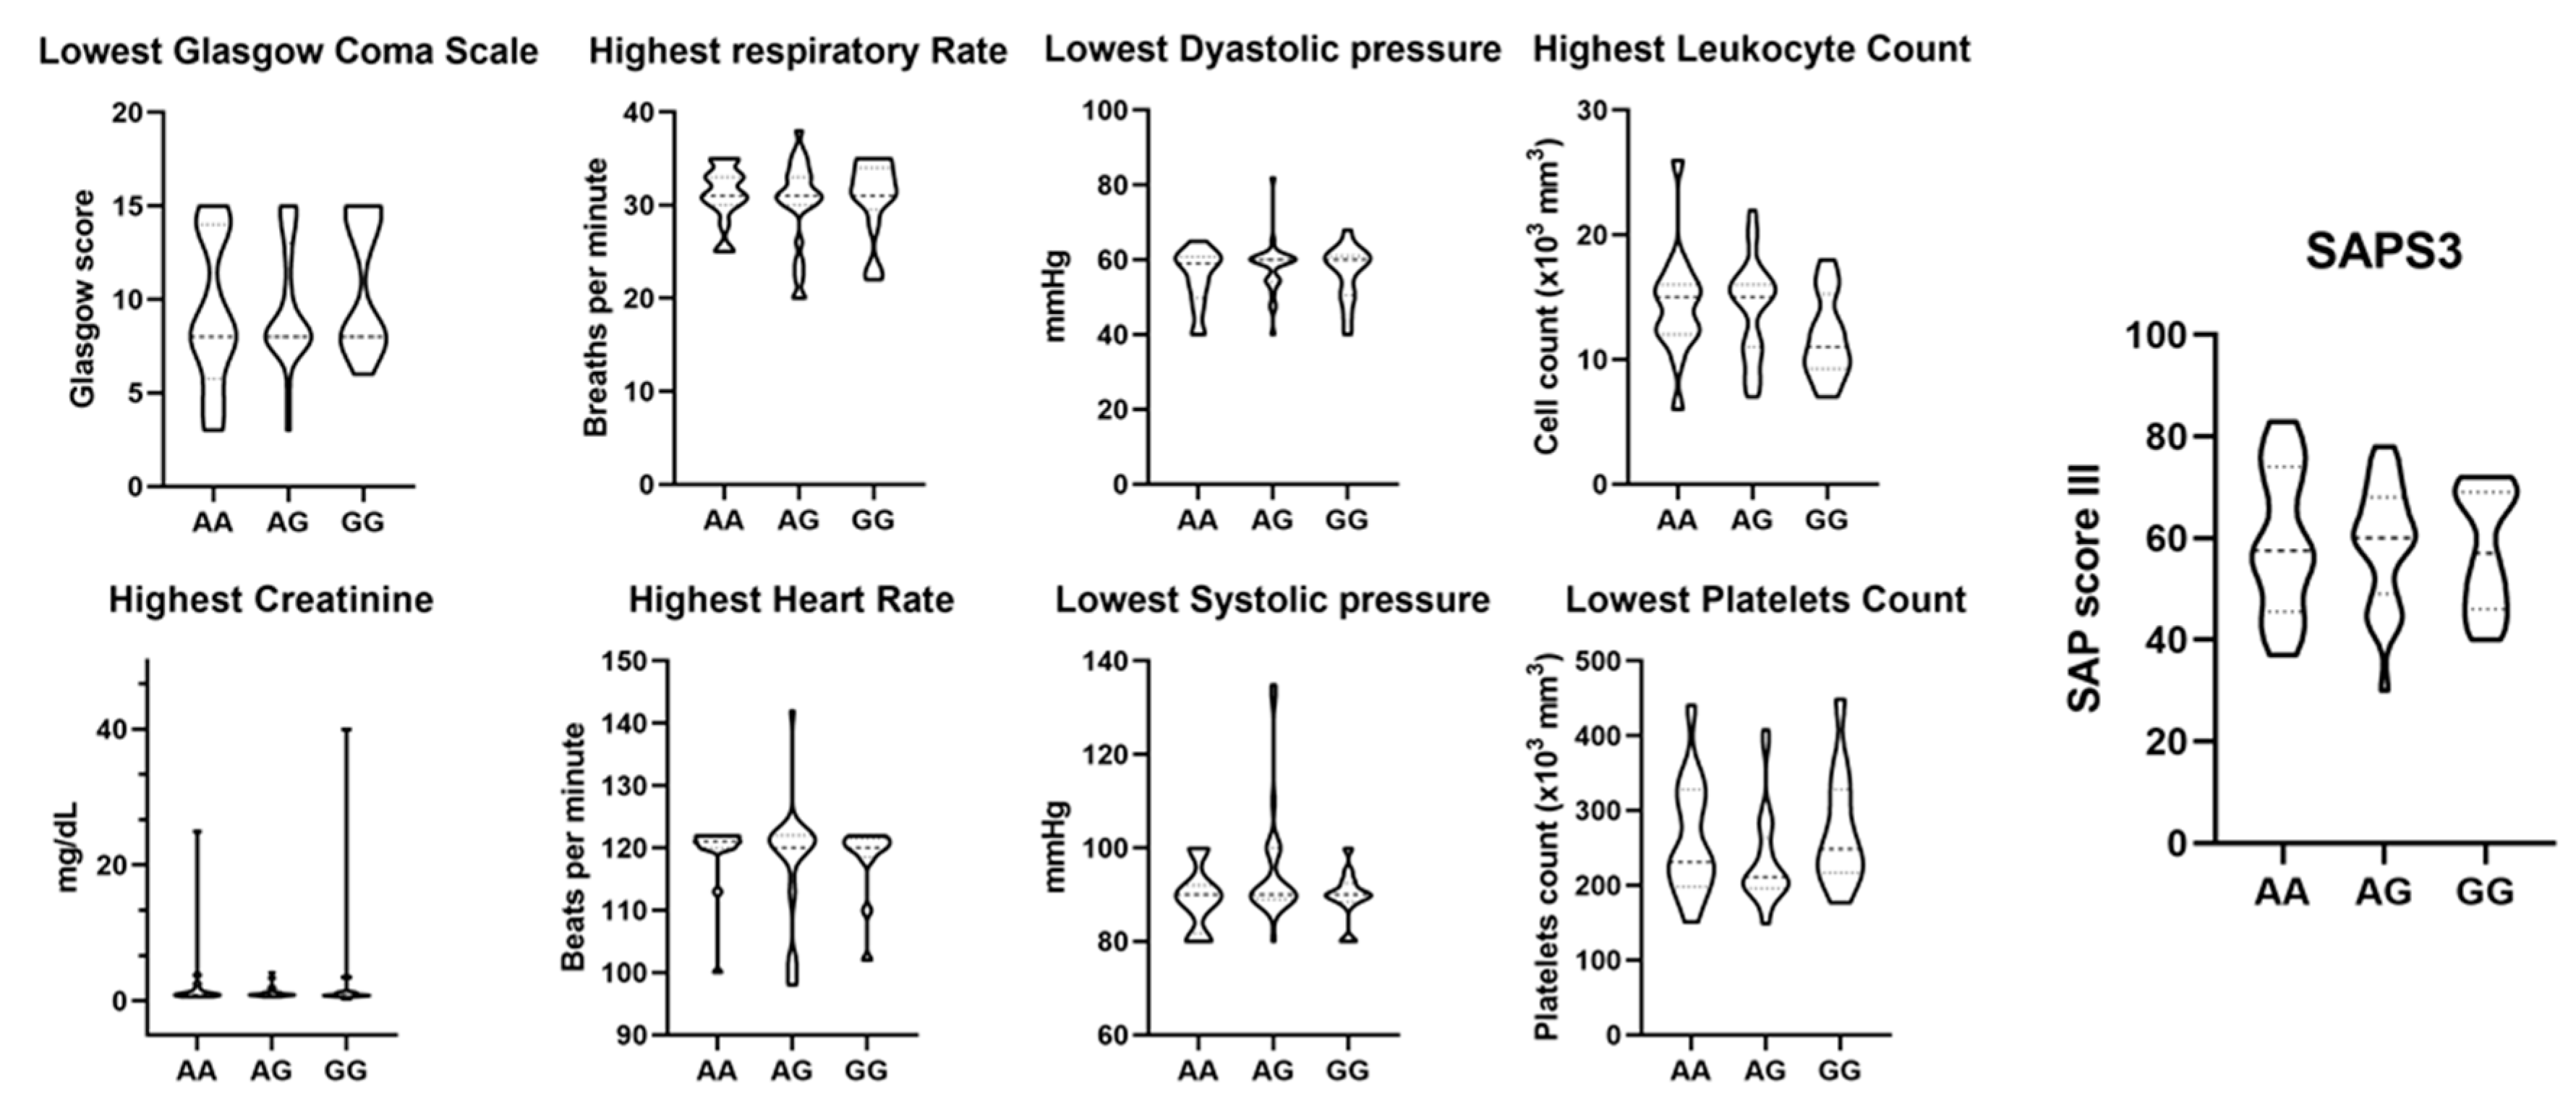
Figure 4.
Genotype distribution of polymorphism rs35803318 (ACE2) was not associated with any clinical characteristics as well as the SAPS3 score. Data are presented as the median and significant differences were tested with Kruskal-'Wallis's test. Significant differences: p<0.05.
Figure 4.
Genotype distribution of polymorphism rs35803318 (ACE2) was not associated with any clinical characteristics as well as the SAPS3 score. Data are presented as the median and significant differences were tested with Kruskal-'Wallis's test. Significant differences: p<0.05.
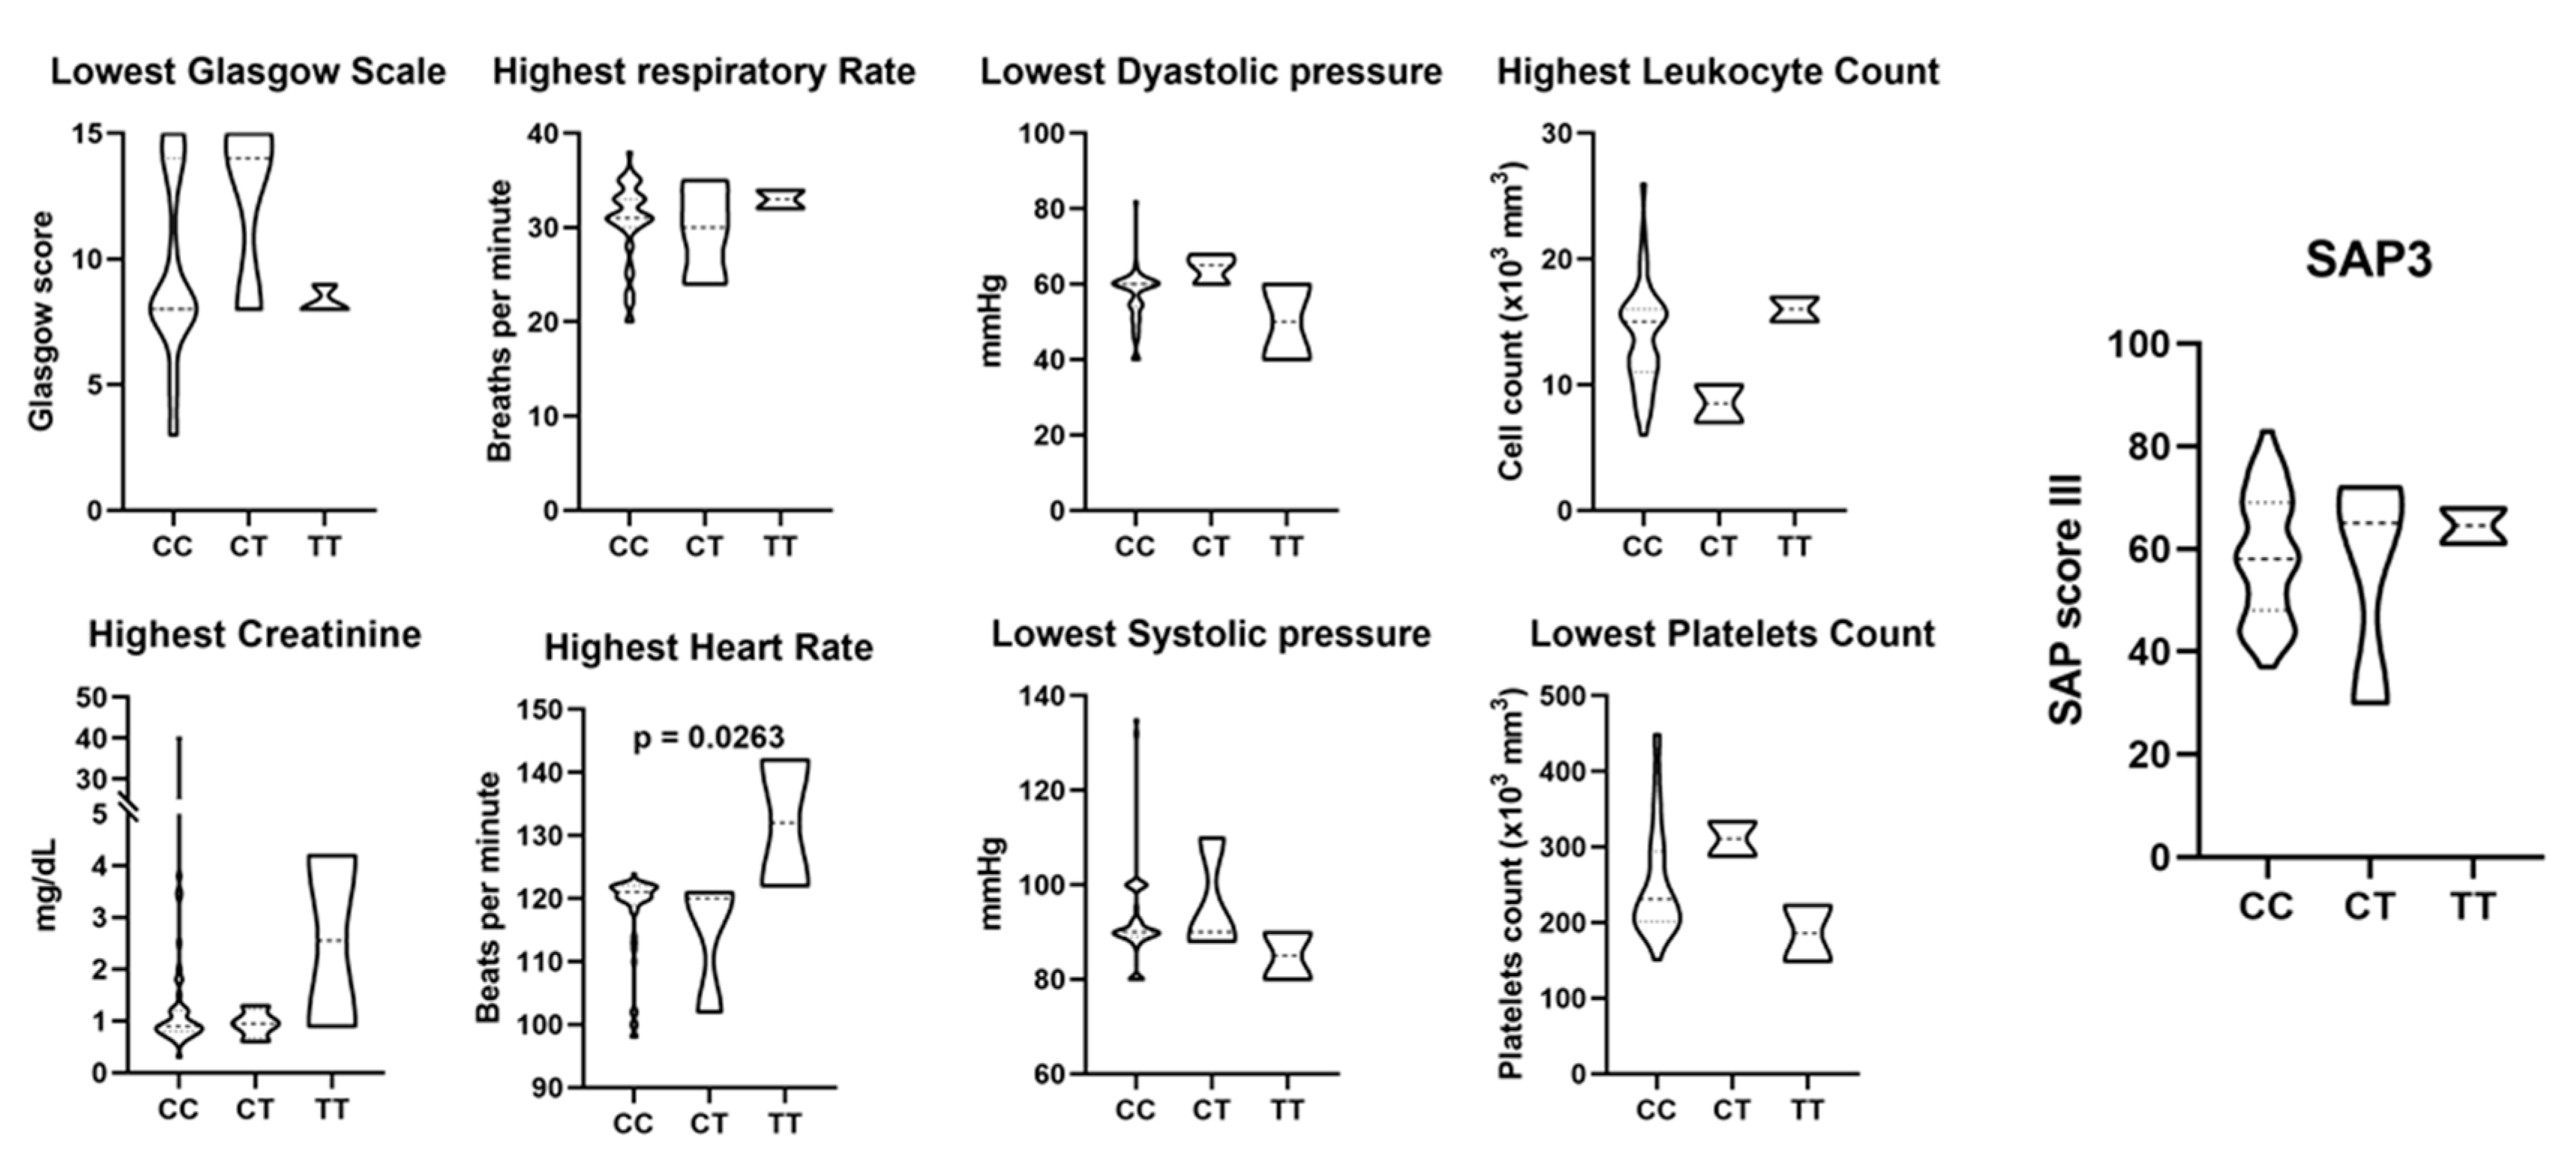

Table 1.
Clinical characteristics of COVID-19-positive patients admitted in ICU hospitals enrolled in this study.
Table 1.
Clinical characteristics of COVID-19-positive patients admitted in ICU hospitals enrolled in this study.
| Variable | Outcome | p-value | ||
|---|---|---|---|---|
| Discharged | Death | All patients | ||
| aAge (Mean ± Std. Dev.) | 48.7 ± 21.5 | 60.5 ± 17.1 | 51 ± 21.10 | 0.094 |
| bGender (%) | ||||
| Male | 25 (78.1%) | 7 (21.9%) | 32 (57.1) | 0.741 |
| Female | 20 (83.3%) | 4 (16.7%) | 24 (42.9) | |
| cClinical-laboratorial measurements [Median (IQR)] | ||||
| Lowest Systolic Blood Pressure | 90 (10) | 89 (2) | 90 (3.75) | 0.001 |
| Lowest Diastolic Blood Pressure | 60 (6) | 55 (11) | 60 (6) | 0.185 |
| Highest Heart Rate | 120 (6) | 121 (2) | 121 (3) | 0.116 |
| Highest Respiratory Rate | 31 (6) | 33 (3) | 31 (3) | 0.001 |
| Lowest Glasgow Scale | 8 (6) | 8 (3) | 8 (6) | 0.021 |
| Highest Leukocyte Count | 14 (6) | 15 (4.5) | 15 (5.75) | 0.295 |
| Lowest Platelets Count | 229.5 (81.8) | 231.0 (138.3) | 231 (94) | 0.602 |
| Highest Creatinine | 0.90 (0.40) | 1.25 (0.97) | 0.90 (0.47) | 0.150 |
| SAPS3 | 57 (21.5) | 71 (15) | 59.5 (20.5) | 0.0003 |
| bSepsis N (%) | ||||
| Yes | 12 (63.2%) | 7 (36.8%) | 19 (33.9) | 0.0325 |
| No | 33 (89.2%) | 4 (10.8%) | 37 (66.1) | |
| bMechanical Ventilation N (%) | ||||
| Yes | 22 (68.75%) | 10 (31.25%) | 32 (57.1) | 0.0161 |
| No | 23 (95.8%) | 1 (4.2%) | 24 (42.9) | |
at-test comparison, bFisher's exact test, cMann-Whitney test.
Table 2.
The Hardy-Weinberg equilibrium and comparison of allelic frequencies of TMPRSS2 SNP rs2070788 in the Brazilian population and other continental populations (AFR, AMR, EAS, EUR, SAS).
Table 2.
The Hardy-Weinberg equilibrium and comparison of allelic frequencies of TMPRSS2 SNP rs2070788 in the Brazilian population and other continental populations (AFR, AMR, EAS, EUR, SAS).
| TMPRSS2 (rs2070788) | Genotype frequency (N) | HWE | Allele frequency (N) | 'Fisher's exact test# | ||||
|---|---|---|---|---|---|---|---|---|
| GG | AA | AG | χ² | p-value | G | A | p-value | |
| All | 0.166 (416) | 0.373 (933) | 0.461 (1155) | 3.317 | >0.05 | 0.397 (1987) | 0.603 (3021) | 0.0072 |
| AFR | 0.070 (46) | 0.522 (345) | 0.408 (270) | 0.486 | >0.05 | 0.274 (362) | 0.726 (960) | <0.0001 |
| AMR | 0.245 (85) | 0.256 (89) | 0.499 (173) | 0.003 | >0.05 | 0.494 (343) | 0.506 (351) | 0.6272 |
| EAS | 0.123 (62) | 0.411 (207) | 0.466 (235) | 0.140 | >0.05 | 0.356 (359) | 0.644 (649) | 0.0002 |
| SAS | 0.227 (111) | 0.294 (144) | 0.479 (234) | 0.728 | >0.05 | 0.466 (456) | 0.534 (522) | 0.7904 |
| EUR | 0.223 (112) | 0.294 (148) | 0.483 (243) | 0.418 | >0.05 | 0.464 (467) | 0.536 (539) | 0.7405 |
| BRAZIL | 0.223 (33) | 0.270 (40) | 0.507 (75) | 0.037 | >0.05 | 0.476 (141) | 0.524 (155) | - |
Hardy-Weinberg Equilibrium (HWE) for selected genetic variants; χ²: Chi-square; All: all continents; AFR: Africa; AMR: Americas; EAS: East Asia; SAS: South Asia; EUR: Europe. #Frequencies comparison between Ceará and other continents.
Table 3.
The Hardy-Weinberg equilibrium and comparison of allelic frequencies of ACE2 SNP rs35803318 in the Brazilian population (FOR) and other continental populations (AFR, AMR, EAS, EUR, SAS).
Table 3.
The Hardy-Weinberg equilibrium and comparison of allelic frequencies of ACE2 SNP rs35803318 in the Brazilian population (FOR) and other continental populations (AFR, AMR, EAS, EUR, SAS).
| ACE2 (rs35803318) | Genotype frequencies (N) | HWE | Allele frequencies (N) | Fisher's exact test# | ||||
|---|---|---|---|---|---|---|---|---|
| CC | TT | CT | χ² | P-value | C | T | p-value | |
| All | 0.486 (1218) | 0.00039 (1) | 0.021 (52) | 0.347 | >0.05 | 0.979 (3696) | 0.021 (79) | 0.0004 |
| AFR | 0.516 (341) | 0 | 0.002 (1) | 0.151 | >0.05 | 0.999 (1002) | 0.001 (1) | <0.0001 |
| AMR | 0.447 (155) | 0 | 0.063 (22) | 1.001 | >0.05 | 0.929 (487) | 0.071 (37) | 0.5581 |
| EAS | 0.516 (260) | 0 | 0 | 0.000 | >0.05 | 1.000 (764) | 0 | <0.0001 |
| SAS | 0.468 (229) | 0 | 0 | 0.000 | >0.05 | 1.000 (718) | 0 | <0.0001 |
| EUR | 0.463 (233) | 0.002 (1) | 0.058 (29) | 0.261 | >0.05 | 0.946 (725) | 0.054 (41) | 0.7656 |
| BRAZIL | 0.926 (137) | 0.040 (6) | 0.034 (5) | 71.182 | <0.05 | 0.943 (279) | 0.057 (17) | - |
Hardy-Weinberg Equilibrium (HWE) for selected genetic variants; χ²: Chi-square; All: all continents; AFR: Africa; AMR: Americas; EAS: East Asia; SAS: South Asia; EUR: Europe. #Frequencies comparison between Ceará and other continents.
Table 4.
Association of clinical characteristics with genotype and allele distribution of polymorphism rs2070788 (TMPRSS2).
Table 4.
Association of clinical characteristics with genotype and allele distribution of polymorphism rs2070788 (TMPRSS2).
| Variable | Genotype % | Allele % | ||||||
|---|---|---|---|---|---|---|---|---|
| N | AA | AG | GG | p-value | G | A | p-value | |
| Outcome | ||||||||
| Hospital discharge | 45 | 24.4 | 48.9 | 26.7 | 0.2776 | 51.1 | 48.9 | 0.2731 |
| Death | 11 | 45.5 | 45.5 | 9.1 | 31.8 | 68.2 | ||
| Sepsis | ||||||||
| Yes | 19 | 26.3 | 42.1 | 31.6 | 0.5654 | 52.6 | 47.4 | 0.5736 |
| No | 37 | 29.7 | 51.4 | 18.9 | 44.6 | 55.4 | ||
| Mechanical Ventilation | ||||||||
| Yes | 32 | 25.0 | 50.0 | 25.0 | 0.7846 | 50.0 | 50.0 | 0.6526 |
| No | 24 | 33.3 | 45.8 | 20.8 | 43.8 | 56.3 | ||
Chi-square test. Significant differences: p<0.05.
Table 5.
Association of clinical characteristics with genotype and allele distribution of polymorphism rs35803318 (ACE2).
Table 5.
Association of clinical characteristics with genotype and allele distribution of polymorphism rs35803318 (ACE2).
| Variable | Genotype % | Allele % | ||||||
|---|---|---|---|---|---|---|---|---|
| N | CC | CT | TT | p-value | C | T | p-value | |
| Outcome | ||||||||
| Hospital discharge | 45 | 93.3 | 4.4 | 2.2 | 0.4377 | 95.6 | 4.4 | 0.1408 |
| Death | 11 | 81.8 | 9.1 | 9.1 | 86.4 | 13.6 | ||
| Sepsis | ||||||||
| Yes | 19 | 94.7 | 5.3 | 0.0 | 0.5857 | 97.4 | 2.6 | 0.6611 |
| No | 37 | 58.9 | 3.6 | 3.6 | 91.9 | 8.1 | ||
| Mechanical Ventilation | ||||||||
| Yes | 32 | 90.6 | 3.1 | 6.3 | 0.3335 | 92.2 | 7.8 | 0.4724 |
| No | 24 | 91.7 | 8.3 | 0.0 | 95.8 | 4.2 | ||
Chi-square test. Significant differences: p<0.05.
Disclaimer/Publisher’s Note: The statements, opinions and data contained in all publications are solely those of the individual author(s) and contributor(s) and not of MDPI and/or the editor(s). MDPI and/or the editor(s) disclaim responsibility for any injury to people or property resulting from any ideas, methods, instructions or products referred to in the content. |
© 2023 by the authors. Licensee MDPI, Basel, Switzerland. This article is an open access article distributed under the terms and conditions of the Creative Commons Attribution (CC BY) license (http://creativecommons.org/licenses/by/4.0/).
Copyright: This open access article is published under a Creative Commons CC BY 4.0 license, which permit the free download, distribution, and reuse, provided that the author and preprint are cited in any reuse.


