Submitted:
19 October 2023
Posted:
23 October 2023
You are already at the latest version
Abstract
In the FCC conversion of heavy petroleum fractions as atmospheric residues, the main challenge for refiners to achieve the quantity and quality of various commercial products depends essentially on the catalyst used in the process. A deep characterization of the catalyst at different steps of the process (fresh, regenerated, and spent catalyst) was investigated to study the catalyst's behavior including the physicochemical evolution, the deactivation factor, and kinetic-thermodynamic parameters. All samples have been characterized by various spectroscopy methods such as N2 adsorption-desorption, UV-visible spectroscopy, Raman spectroscopy, LECO carbon analysis, Scanning electron microscopy (SEM), X-ray diffraction (XRD), X‐ray fluorescence (XRF), nuclear magnetic resonance spectroscopy (NMR13C) analysis, and Thermogravimetric analysis.
The results of N2 adsorption-desorption, UV-vis, Raman, LECO carbon, and SEM images showed that the main causes of catalyst deactivation and coking were the deposition of carbon species that covered the active sites and clogged the pores, and the attrition factor due to thermal conditions and poisonous metals. The XRD and XRF results showed the catalyst’s physicochemical evolution during the process and the different interlinks between catalyst and feedstock (Nickel, Vanadium, Sulfur, and Iron) elements which should be responsible for the coking and catalyst attrition factor. It has been found that, in addition to the temperature, the residence time of the catalyst in the process also has an influence on catalyst structure transformation. NMR13C analysis revealed that polyaromatic hydrocarbon is the main component in the deposited coke of the spent catalyst. Thermogravimetric analysis showed that the order of catalyst mass loss was fresh > regenerated > spent catalyst due to the progressive losses of the hydroxyl bonds (OH) and the structure change along the catalyst thermal treatment. Moreover, the kinetic and thermodynamic parameters showed that all zones are non-spontaneous endothermic reactions.
Keywords:
fluidized catalytic cracking
; catalyst characterization
; catalyst deactivation
; coking mechanism
; mass loss
; catalyst kinetic
; thermodynamic parameters
Highlight
- Catalyst deactivation evolution was studied from fresh, regenerated to spent using different spectroscopy methods (BET, XRF, XRD, and UV-RAMAN).
- The catalyst residence time has an influence on the Catalysts’ physicochemical properties changing
- NMR13C study shows that the polyaromatic hydrocarbon is the main component in the deposited coke of the spent catalyst
- Thermogravimetric analysis result indicated that the catalyst mass loss order is fresh>regenerated>spent catalyst due to the progressive hydroxyl losses during the thermal treatment
- Kinetic and thermodynamic parameters revealed that all zones are non-spontaneous endothermic reactions.
1. Introduction
Fluid Catalytic Cracking (FCC) is a conversion process in petroleum refining that can be applied to various feedstock ranging from gas oil to heavy crude oil [1,2]. The concept of catalytic cracking is similar to thermal cracking but differs in using a catalyst that is (theoretically) not consumed in the process to improve process efficiency and product quality [3]. Currently, catalytic cracking is the most important conversion process in the refinery regarding the amount of feedstock treated and the type of zeolite catalysts used [3,4,5,6,7,8].
The conversion efficiency of the process depends on the physicochemical properties, deactivation factor, and coking mechanism of the catalyst used to crack a particular feedstock to achieve good conversion with more usable and environmentally friendly final products [9]. Moreover, the deactivation factor mainly depends on the coke deposited on the catalyst and the physical degradation of the catalyst [10,11], which are caused by metal compounds of the feedstock, the nature of the catalyst, and the process thermal conditions [12], including temperature, particle velocity, and catalyst-to-oil weight ratio [1,13,14,15,16,17].
Therefore, the perfect understanding of the physicochemical behavior of the catalyst, the deactivation factor, and the coking mechanism during the process are of great interest to refiners and catalyst manufacturers [18,19,20,21,22]. And we noted that it should be interesting to study the current behavior of the catalyst towards atmospheric residues derived from crude oil of the Agadem bloc in Niger. This case has not yet been the subject of an in-depth study considering the feedstock characteristics including the catalyst time residence in the process as a new factor that can influence the catalyst transformation and interlinkage during the thermal treatment.
To carry out this work, the operating conditions of industrial reaction and regeneration were used to study the mechanism of catalyst deactivation, crystallography, and coke deposition. The tested fresh catalyst is compared with the regenerated and spent catalysts taken during the process, using different spectroscopy methods known as powerful tools for catalyst characterization and a powerful mathematical model for calculating the kinetic and thermodynamic parameters of the catalyst at different stages of thermal treatment.
The main objective of this work is to provide a clear understanding of the physicochemical behavior of the catalyst and the evolution of catalyst deactivation during the industrial FCC process by characterizing and comparing the results of fresh, regenerated and spent catalysts. Demonstrate the catalyst residence time as one of the key parameters that influence the catalyst structure change during the FCC process. Moreover, this work provides in-depth studies on the thermal decomposition, and kinetic and thermodynamic parameters of the catalysts during the FCC process with atmospheric residues to understand well the catalyst behavior [23,24,25].
2. Material and methods
2.1. Sampling of catalyst
An atmospheric residue derived from Niger’s crude oil of Agadem bloc was cracked over an equilibrium catalyst in an industrial fluidized bed reactor unit of Zinder Oil refining company in Niger. The spent and regenerated catalysts were sampled to conduct experiments included in this paper.
2.2. Cracking Reaction and regeneration conditions
This study has been conducted on the fluidized bed Catalytic cracking unit of Zinder Oil Refining Company Limited in Niger, where the samples for this work were collected. The cracking reaction was carried out continuously using an atmospheric residue as feedstock with properties listed in Table 1. The reaction was carried out at 500°C in a range of 5-9 as a catalyst to oil weight ratio and 3.3 seconds of Oil gas residence time in the riser. The catalyst regeneration was performed at 700°C as a regenerator bed temperature under 0.26 MPa of Regenerator top pressure and 1411 Nm3/min (wet) of the main air blower outlet flow.
2.3. Catalyst characterization
Various measurements were taken on all samples to determine catalyst morphology, structural properties, mass losses, chemical elements, and deposited coke.
N2 adsorption-desorption isotherms at -195.781°C were recorded using Micromeritics ASAP 2020 V4.02 (V4.02 J). The specific area (SBET), pore volume (PV), and pore size for both samples were performed using the Brunauer-Emmett-Teller (BET) method, depending on the isotherms of nitrogen adsorption/desorption. In contrast, the Barrett-Joyner- Halenda (BJH) method was used to determine the pore volume.
The crystal structures and phase compositions evolution for all samples were investigated using a powder X-ray diffraction (XRD) Empyrean Malvenpanako Sharp X-ray diffractometer (40kV, 40mA) using Cu Kα (λ = 1.54 Å) radiation, an angle range (10-90°), and a rate of 10°/min. The diffraction reflections were assigned with the help of the International Centre for Diffraction Data (ICDD-PDF+2023 – database). A model ZSX Primusll X-ray fluorescence (XRF) spectrometer (50kV, 50mA) was used to complete the XRD analysis and determine the samples' chemical elements and oxide components.
UV-visible near-infrared spectra were obtained on the Shimadzu UV 3600 Plus Spectrophotometer with Barium Sulfate Integrator configuration (ISR-603), scanning parameters for absorbance/transmittance in the range of 200-800nm. Raman spectra were recorded on a DXR Raman spectrometer (Thermo Scientific, DXR2xi Micro-Raman) in the beam range of 50-3400 cm-1 with scanning 900 times. The laser wavelength was 532 nm and the power was 2.4 MW.
Moreover, a LECO carbon analyzer with a solid-state infrared detector (IR) was used to confirm the presence and estimate the concentration of carbon in regenerated and spent catalysts in the oxygen environment.
The coke deposited on the spent catalyst’s carbon type was determined by nuclear magnetic resonance (NMR13C) spectroscopy. The spectra were recorded in a Bruker AVANCE III HD 600 MHz Solid-state nuclear magnetic resonance spectrometer model operating at a frequency of 150 MHz using a 4 mm double resonance solid probe at a rotor spinning rate of 10 kHz, high power decoupling sequence 13C detection resonance, cycle delay time of 5s, acquisition time of 32ms, and scanning times of 1024 times.
The crystal morphology of all samples was observed using the field emission Scanning electron microscopy (SEM) model Regulus 8100.
Thermogravimetric analysis (TGA) for all samples was performed via a model Japan Seiko TG/DTA7300 to determine the weight losses of the samples. This characterization was conducted in flowing air (100-150 ml/min) at a heating rate of 10°C/min up to 900°C.
The model of Coats and Redfern was developed to calculate the kinetic and thermodynamic parameters for each thermal event zone of all tested catalysts using the constants of Plank and Boltzmann.
3. Results and discussion
3.1. N2 isotherm and pore size distribution analysis
Figure 1 displays N2 adsorption-desorption isotherms of the samples at -195.781°C and the corresponding Barrett-Joyner- Halenda (BJH) pore size distribution based on the adsorption branch. Figure 2(I) shows that all the curves of the tested samples have similar features and represent a combination of type I and IV isotherms [27,28]. The adsorption branch of the curves, which has a type I isotherm, is related to the microporous structures of the catalyst [29,30]. The hysteresis loop appears above p/p0 = 0.4, for the fresh catalyst, which can be attributed to IUPAC H4-type, indicating a complex structure with mesopores and micropores[28,31]. The hysteresis loops for regenerated and spent catalysts above p/p0 = 0.43 can be attributed to the IUPAC H3-type, which at p/p0 > 0.7 indicates the absence of limiting adsorption due to the accumulation of coke over the mesopores of the catalyst [32,33].
At the relative pressure p/p0 of about 0, the sharp jump in the amount of N2 adsorption, located on the fresh catalyst (curve (a)), gradually decreases on the regenerated catalyst (curve (b)) and finally disappears from the spent catalyst (curve (c)), indicating a progressive plugging of the micropore by the deposition of carbon species, as confirmed in Table 2. The gradual decrease in pore volume from fresh to spent catalyst is also evidence of pore plugging resulting from the deposition of carbon on the catalyst surface. The parallel features of the adsorption-desorption curves in the range of 0.55-0.75 and 0.53-75 for regenerated and spent catalysts, respectively, indicate that these large mesopores are open and may correspond to the catalyst particles seen in the SEM images shown in Figure 4 [33].
Figure 1(II) displays the distribution of fresh, regenerated, and spent catalyst pore sizes. It can be observed that the fresh catalyst sample has one peak at 46.98 Å, while the regenerated and spent catalyst samples have two peaks at 43.25 Å-318.66 Å and 46.93 Å-317.44 Å, respectively. These second peaks at 318.66 Å and 317.44 Å indicate the presence of mesopores in the samples due to the thermal conditions of reaction and regeneration [1]. As can be seen in Figure 1 (II), the uniform structure of the pore distribution of the fresh catalyst is significantly changed during the process. This process can be seen in the curves of the regenerated and spent samples, indicating a relatively large pore blockage in the pore diameter range from 159.98 Å to 318.66 Å.
Table 2 shows that the BET surface area is greatly reduced during the process. The BET surface area of the fresh catalyst of 158.13 m2g-1 decreased by more than 50% compared to the regenerated catalyst of 76.78 m2g-1 and by more than 60% compared to the spent catalyst of 57.45 m2g-1. This event can be referred to the coke deposits on the catalyst surface and metal poisoning or the regeneration temperature above 690°C, which changes the catalyst structure and porosity [34]
The calculated values of microporosity show that the microporosity of the regenerated catalyst (49.79%) is higher than that of the fresh and spent catalyst (40.39%) and (49.73%), respectively, which is due to the presence of a large mesopore peak of 318.66 Å created by the effect of regeneration gas flow [1,35,36]. However, based on the values for the surface area and porosity of the regenerated catalyst compared to the values of the spent catalyst, it is found that there is a limit to the inverse relationship between surface area and porosity (the surface area of the catalyst decreases while its porosity increases) [37].
3.2. Crystallography analysis
The XRD patterns of all samples are shown in Figure 2. The XRD patterns of the fresh sample were compared with those of the regenerated and spent samples to better understand the evolution of catalyst structure due to thermal conditions during the process.
The alumina was present in the fresh sample in the form of Al2Si2O5(OH)4, kaolinite with a monoclinic system (ICDD: 04-026-7575) [39]. The characteristic peaks were found at 2θ ≈ 12.40°, 21.23°, 23.13°, 24.96°, 26.51°, 38.36°, and 45.40°, corresponding to the reflections of the (001), (-1-11), (0-21), (002), (111), (-202), and (-203) planes. Other background peaks are associated with the crystalline phase of quartz (ICDD: 98-000-0369, [40]) with diffraction features at 2θ values of 20.85° and 26.64° corresponding to the reflections of the (100) and (011) planes. In addition, the fresh XRD result confirms the presence of staurolite (ICDD: 98-000-0410) [41] appearing at 2θ≈10.63°, 31.59°, 35.13, and 37.47°, corresponding to the reflections of planes (020), (002), (-241), and (132).
However, the XRD patterns of the regenerated catalyst showed that the peak intensities of kaolinite(kaolinite-1A) decreased due dealumination process regardless of the regeneration conditions. Kaolinite-1A (ICDD: 01-083-4643) [42] appeared essentially at 2θ≈12.19°, 20.04°, and 24.53°corresponding to the reflections of the (001), (110), and (002)-planes, respectively. The silica amorph is also observed as one of the main crystalline phases in the regenerated sample, appearing at 2θ≈ 10.13° and 19.81°, corresponding to the reflections of the (010) and (013) (ICDD: 04-011-9355) [43] planes of SiO2 species. The elements Vanadium and nickel were clearly detected in the regenerated sample. The element vanadium is present in the form of lanthanum vanadium oxide hydrate with diffraction peaks at 2θ≈ 12.10°and 13.83° (ICDD: 04-011-1951) [44], while the element nickel oxidized (NiO) with a diffraction peak at 2θ ≈ 37.76°and 54.48° (ICDD: 04-006-6545) [45]. These diffraction peaks correspond to the reflections of the (-111), (102) and (200), (220)-planes of LaV5014(H2O)13 and NiO, respectively. It was also found that the sulfur reacts with the iron and other components to form iron-sulfur carbonyl. This Fe5S4(CO)15 (ICDD: 04-010-2192) [46] appeared at 2θ≈11.90°, 15.98°, and 20.89°, corresponding to the reflections of the (102), (020), and (220) planes.
The XRD results show that the kaolinite-1A diffraction peaks become very weak and harder to detect in the spent catalyst. This may be related to the loss of the hydroxyl function OH, regardless of the process conditions and residence time of the spent catalyst. It appears that the kaolinite-1A was converted to amorphous y-Al2.144O3.2(ICDD: 98-000-0059) [47], silica (ICDD: 01-073-3406) [48], and residual kaolinite (kaolin serpentine, 1A) due to dihydroxylation and the presence of metal oxide species reacting with the kaolinite during the process [32,49,50]. Qijun Hu et al. conducted a similar study on the evolution of kaolinite structure and suggested that the temperature range 700-800°C corresponds to the transition of meta-kaolinite into γ-alumina and silica spinel [51]. The y-Al2.144O3.2 diffraction peaks appeared at 2θ ≈ 31.97°, 37.68°, 45.84°, and 66.84°, while the silica peaks appeared at 2θ ≈ 10.32° and 11.92°. These peaks correspond to the reflections of the (220), (311), (440), (400), 440)-planes and (-113), (400), (-113)-planes of y-Al2.144O3.2 and silica, respectively. The remains of the kaolin-serpentine (ICDD: 04-025-7033) [52] appeared essentially at 2θ ≈ 12.36°, 20.48°, 21°, and 24.87°, corresponding to the reflections of the (010), (-101), (111), and (020)-planes. This is due to the fact that certain closed particles require a lot of energy to be dehydroxylated during thermal treatment at high temperatures. A large dispersion of Vanadium, Nickel, and Sulfur is observed in the spent catalyst. In particular, the dispersion of vanadium peaks becomes more intense along the XRD curve. However, due to the reaction with nickel and sulfur, the peaks are more visible than others and can be identified at 2θ ≈ 15.66, 31.26, 34.86°, 45.50°, and 54.81°, corresponding to the reflections of (002), (110), (-112), (114), and (310) planes of V2NiS4 species (ICDD: 04-001-6617) [53]. In addition, the nickel was also associated with sodium to form sodium-nickel oxide with diffraction reflections at 2θ ≈ 15.68° and 37.35°, corresponding to the reflections of the (001) and (110) planes of Na0.2NiO1.8 species (ICDD: 04-009-2679 BITYUTSK. PN, et al. (1969)). Three copper sulfide peaks were identified at 2θ ≈ 27.56°, 31.93°, and 66.78°, corresponding to reflections of the (111), (1200), and (400) planes of Cu2S (ICDD: 03-065-2980 Barth, T. et al. (1926)). A diffraction peak that appeared at 2θ ≈ 45.62° is the characteristic peak of the iron silicon corresponding to the (110) plane of the Fe0.07Si0.33 species (ICDD: 04-002-3903) [54].
The crystalline phases of GeO2 (ICDD: 04-021-5362 Li Y.F., et al. (2014)) and TiO2 (ICDD: 98-000-0375) [55] are also detected at 2θ ≈ 11.76°and 27.44°, 54.32°, respectively. These peaks correspond to the reflections of the (211) and (110), (211) planes of GeO2 and TiO2, respectively.
The crystalline phases of Quartz stay unchanging at all steps of the process (regenerated and spent catalysts) and keep their diffraction peaks at 2θ of 20.85° and 26.64°.
According to the XRD analysis, during the thermal treatment of the catalyst, it was clearly observed that the texture changed due to the intermolecular reaction. This clearly indicates that some components lose their crystallinity and crosslink to form new structures, as shown in Figure 3 [1,31]. Under the same thermal conditions, there are no significant peaks of gamma alumina on the regeneration XRD curve in contrast to the spent catalyst. This occurrence of gamma alumina peaks in the spent catalyst shows that the residence time of the catalyst in the process has an important influence on the kaolinite transformation process. Furthermore, this means that at a constant thermal condition, the linkage and interaction of catalyst components depend on the residence time of the catalyst in the process. The longer the residence time, the deeper the reaction between the components.
The presence of various forms of nickel, sulfur, and vanadium as major impurities in the regenerated and spent catalysts contributes to catalyst deactivation and attrition factors [10,11,56,57,58,59,60,61]. These poisons occur naturally in the atmospheric residue (feedstock) and are associated with various structures during the process. Marris D. et al. studied the effect of sulfur in catalyst reaction and showed that sulfur on the catalyst surface affects the performance of catalyst activity[17]. U.J. Etim et al. concluded that vanadium and nickel have an important influence on the FCC catalyst behavior. The first one has an influence on the catalyst activity, while the second one favors the coke formation through the mechanism of dehydrogenation reaction [11].
Table 3 presents the main tested sample’s chemical oxide components, which were determined using a nondestructive analytical X-ray fluorescence technique to complete the XRD study. The XRF results show a gradual increase of iron content in catalyst samples during the catalytic cracking process of the atmospheric residual oil as feedstock (3.2 ppm of Iron)[26], which may have some important implications, including a direct poisoning effect on the catalyst active sites, an effect on the selectivity of some reactions, a physical effect of iron deposition (pore plugging), and physical deconstruction [57]. The presence of lanthanum in the form of lanthanum oxide (La2O3) in the catalyst sample is related to improving catalyst resistance, assisting in the degradation of heavy molecular chains, and promoting good product stability [62,63,64,65,66]. In addition, the amount of alumina and silica, which are the main components of all tested samples, increased from fresh to regenerated catalyst, which can be attributed to the dealumination process [22].
3.3. UV-visible near-infrared spectra and Raman spectra analysis
Figure 4 shows the Raman spectra of fresh(I), regenerated (II), and spent (III) catalysts. The fresh catalyst exhibited Raman bands of 339.14, 1363.69,1594.94, and 2915.96 cm-1, while the regenerated catalyst showed bands of 143.93, 394.55, 508.68, 633.35, 1368.14, 1568.47, 2473.42, and 3104.40 cm-1. The spectra bands of 215.37, 267.81, 655.64, 1093.30, 2513.65, and 3102.48 cm-1 were identified from the spent catalyst.
The fresh Raman bands of 1363.69 and 2915.96 cm-1 were identified and corresponded to the stretching vibration of bond P=0 (P205) and bond OH, respectively, while the band of 339.14 cm-1 is assigned to the bending mode of a 6-membered ring in the aluminosilicate zeolite structure [67].
The bands of the regenerated Raman spectrum of 143.93, 394.55, 508.68, and 636.35 cm-1 can be assigned to the lattice vibrations in crystals (LA modes), the Si-O-Si bond, the asymmetric stretching vibration of GeS2 and the stretching vibration of TiO2 bond, respectively. The bands of 1368.47 cm-1 and 1568.47 cm-1 refer to the ring stretches of polyaromatic species and the ring stretches of Aliphatic azo respectively. It is important to note that the regenerated Raman bands of 1368.47 and 1568.47 cm-1, indicative of the carbon structures, are located near the overlapping peaks of the D1 and G bands, which are disordered graphite lattice (graphene layer edges) and ideal graphite lattice [31,68,69].
The bands of 2473.47 cm-1 and 3104.40 cm-1 of the regenerated catalyst correspond to P-H and 0-H bonds, respectively. Interestingly, all the bands disappear in the fresh and regenerated catalyst or become very weak in the spent catalysts due to the higher carbon content. However, the Raman spectrum of the spent catalyst shows a very low-frequency vibration that can be associated with the final stages of the crystallization process, such as the bonds at 215.37 and 267.81cm-1. The stretching vibration of the P=S bond at 655.64 cm-1 was also identified as the main peak in the Raman spectra of the spent catalyst.
Figure 4 IV displays the UV-visible near-infrared spectra of fresh, regenerated, and spent catalysts. All curves have similar features and exhibit two important peaks between 214 nm and 297 nm. The UV-vis band of 214 nm is presented on both curves of the tested samples with low absorbance in the spent catalyst, which is due to the reduction of Al content during the process and is assigned to the πp-πd transition between O2- and Al3+ [49,70]. The band of the fresh UV-Vis spectrum of 297 λmax (nm) is related to the band of the regenerated and spent catalyst of 267 λmax (nm) and can be attributed to the C=O bond (π→π*).
3.4. Solid-state LECO carbon analyzer and NMR 13C studies
A LECO carbon analyzer with a solid-state infrared detector (IR) was used to confirm and complete the N2 adsorption-desorption, Raman, and UV-Vis results [71]. The test results indicated a carbon content of 0.5 wt.% in the regenerated sample and 1.26 wt% in the spent catalyst. These values confirmed that the main cause of the catalyst deactivation factor is related to the carbon species deposited during the process.
Figure 5 shows the nuclear magnetic resonance spectroscopy (NMR13C) spectra in the solid state to learn the status of the deposited coke in the spent catalyst and to complete the above spectroscopy results. Only one strong resonance peak was observed at 125.24 ppm, which can be attributed to aromatic (100-150 ppm) carbons, indicating polyaromatic hydrocarbons in particular, regardless of the reaction-regeneration operating conditions [72].
3.5. Catalyst morphology changes during the FCC Process.
The images of crystal morphology of the tested fresh, regenerated, and spent catalyst samples with sizes of 200 μm and 50μm are shown in Figure 6 using field emission scanning electron microscopy (SEM). The images of the fresh catalyst SEM shown in Figure 5a indicate that the particles are uniformly spherically charged and have a clean surface and boundaries. It is found that there are smaller spherical particles attached to the largest particle surfaces of the fresh catalyst, which may happen during the preparation of the catalyst. As can be seen in the images of the fresh catalyst, the lightest area of the particles has crystallites, while the darkest area is support.
The regenerated SEM images (Figure 6b) show a significant physical texture change, the mesoporous structure almost disappears, and the particles become dark. This could be related to the metal poison [38,56] and coke deposited on the catalyst (0.04-0.05 wt.%), which was confirmed by using the LECO carbon analysis. It can also be observed that the small particles attached to the large particles of the fresh sample were broken during the process and the shape of the particles became more surrounded due to process temperature and running time as reported by Xinzhuang Zhang et al [73,74].
Figure 6c shows the images of the spent catalyst SEM after deactivation with a carbon content of 1.26 wt% on the catalyst. These images show a complete disappearance of the mesopores, physical abrasion of the particles, and fragmentation into smaller pieces. These phenomena may relate to collisions between particles or particles against the tube [6,11,75], lateral cracks on the particle surface, and surface attrition due to stresses caused by fluid dynamics [12], as well as poisonous metals such as iron, nickel, vanadium, and sulfur, or the reaction between iron and calcium [57,60]. The catalyst’s attrition such as catalyst abrasion and fragmentation, is an important factor affecting particle properties [10,74,76,77,78,79,80,81].
The profiles of the weight percentages of the main chemical elements confirm the thermal behavior of the catalyst components during the catalytic fluidized bed cracking and give a clear picture of it. From the Si/Al ratio shown in the figures of SEM (a, b, and c), it can be observed that the regenerated catalyst cannot be recovered as fresh, and the more the catalyst is treated, the more the Si/Al ratio approaches 1, which is characteristic of spent catalyst [82].
3.6. Thermal Analysis
The sample’s thermal events were analyzed through a thermo-gravimetric (TGA) profile along with a derivative thermo-gravimetric (DTG). Figure 7 shows the behavior of uncalcined catalysts from fresh, regenerated, and spent catalysts as presented in Table 3. The TGA results show that five main thermal events were identified as mass loss zones across all curves. For all samples, the temperature range RT (room temperature) to 100°C was not considered because of the influence of moisture.
The first mass loss (zone 1) was measured in the temperature range of 100-300 °C. In this range, it is observed that the main mass losses for fresh, regenerated, and spent catalyst samples are estimated to be 4.06 wt.%, 2.73 wt.%, and 1.03 wt.%, respectively. This first event can be attributed to the release of water bonds from the tested catalysts as a dehydration phase on the surface of SiO2 in the tested samples. In this step, it is interesting to note that the mass loss values indicate a gradual decrease from fresh to spent catalyst, which is due to the chemical change of the catalyst during the process. This process can be explained by the fact that the density of hydroxyl groups (OH) is higher in the fresh catalyst and decreases during the thermal treatment [74,83].
For all zones, the mass losses of the fresh catalyst are associated with the progressive removal of its components, including the removal of co-precipitated nitrate, NiO, GeO2, Rb2O, and ZrO2 over the temperature zone ranges. However, in the process reaction that occurred at a temperature of 500°C, the mass loss profiles and the endothermic DTG peak at 499°C showed that the fresh catalyst lost significant weight before the reaction took place in the riser-reactor.
The second and third mass loss in the regenerated and spent samples occurred between 300 °C and 550 °C and was the most important phase due to the combustion of coke on the catalyst surfaces.
In the third zone, the DTG curves of the fresh and spent catalysts exhibited strong endothermic peaks at 499 °C and 540 °C, respectively. These peaks can be attributed to the decomposition phase, i.e., the penetration of heat between the layers of decomposed materials, which led to the decomposition of hydrocarbons.
The fourth zone was particularly characterized by the fine and small exothermic peak at 609.90 °C from the regenerated DTG curve. Possibly, this peak is related to the inert carbon or graphitic carbon in the catalysts, as confirmed in the first part of the Raman spectra analysis.
The mass loss in zone 4 (600-700 °C) and above for all samples may be related to the oxidation of the metallic components and crystalline alteration of the catalyst supports, as reported in several studies in the literature [84,85,86].
The equilibrium catalyst behavior at different stages of the FCC process (fresh, regenerated, and spent catalyst) shows a significant change in its composition, which can be seen from the mass loss profiles presented in Table 3.
Accordingly, in the fifth mass loss zone 1.87 wt.%, 1.78 wt.%, and 0.32 wt.% for fresh, regenerated, and spent catalysts, respectively, there are no other significant weight losses up to 850 °C. This event could be referred to the final hydrocarbon oxidation and the conversion of the trapped metal into metal oxides [84].
3.7. Kinetics and Thermodynamics Parameters calculation using TGA
Assuming that all zone conversions are first-order reactions, the model of Coats and Redfern was developed to calculate the kinetic and thermodynamic parameters for each zone using the following equation and the constants of Plank and Boltzmann[87,88,89,90]: Where
wi: initial weight, wt: weight of sample at particular temperature T, wf: final weight.
A: pre-exponential factor, : heating rate (10 °C/min), R: gas constant (8.3143 Jmol-1K-1), Ea: activation energy, T: temperature (K) at the peak of the DTG curves.
The slope and intercept values of each zone were obtained by plotting versus 1000/T, then we used these values to calculate apparent activation energy and other thermodynamic parameters listed in Table 4, such as pre-exponential factor (A), Gibbs free energy , Entropy Changes , and Enthalpy changes [23,90,91,92].
Where K is Boltzmann's constant (1.381 × 10⁻²³ J.K−1), and h is Planck's constant (6.626 × 10⁻³⁴ J s).
The obtained positive values of entropy Changes , enthalpy changes , and negative values of proved that all zones are non-spontaneous endothermic reactions [93,94,95,96,97]. In zone 1, lower enthalpy values are observed in all the samples studied, which is due to physical adsorption due to hydrogen bonding and other complex reactions. The high enthalpy and energy values of zone 5 in the regenerated and spent catalysts imply that all the deposited coke on the catalysts in these temperature ranges has been removed and the remaining structural bonds of the catalyst require more energy to be broken.
According to this work, it was demonstrated that activation energies calculated from slope values gradually increase with the thermal treatment of the catalyst. This is because of the progressive degradation of the catalyst structure, such as the removal of components like Nitrogen, H2O, and others in the respective temperature ranges. It seems that the deeper the catalyst is treated, the more the catalyst loses the hydroxyl bonds (OH) and other degradation products, and the more energy is required [83].
As shown in Table 4, all R2 values are close to 1, indicating good agreement between the model and the experimental data used to estimate the kinetic parameters [24]. The variation of activation energies in different zones is sometimes related to the H/C ratio in the sample [98]. For example, the lower activation energy observed in zone 5 (134.56.102 Jmol-1) of the spent catalyst compared to zone 4 (190.16.102 Jmol-1) may relate to the temperature range of 700-850°C to remove the hard coke in the sample with a significant mass loss (1.78 wt.%)[99].
Conclusion
In this work, different spectroscopy methods were investigated to characterize the equilibrium catalyst. During the cracking process in the fluidized catalyst, three major steps of the catalyst were performed including the fresh state of the catalyst, after regeneration, and the spent state of the catalyst. According to the results of N2 adsorption-desorption, Raman spectra, and UV-visible near-infrared spectra, as well as LECO carbon analysis, the catalyst deactivation and coking are attributed to the fact that the active sites of the catalyst are covered and the pores are blocked by the deposition of carbonaceous species during the process. However, the XRD analysis, supplemented by the XRF result, and the results from SEM show that the catalyst deactivation, coking, and attrition (particle abrasion and fragmentation) were caused by metal poisons (Vanadium, Nickel, and Sulphur) of the feedstock, which reacted under the thermal conditions (500-700°C) and under the influence of the catalyst residence time. It is also shown that the temperature of 700°C is not sufficient for the initial decomposition of the kaolinite or meta-kaolinite to gamma alumina and amorphous silica, but that the reaction also requires time (residence time) to reach this transformation state. As already mentioned in the XRD analysis, the decomposition of the kaolinite under the same thermal conditions did not take place until the catalyst was spent. The crystallographic analysis shows that the deeper the catalyst is treated, the more the physicochemical properties change, and the crystal phase peaks decrease due to the reaction and linkage between the phases, which consequently reduces the catalyst performance. The nuclear magnetic resonance spectroscopy (NMR13C) analysis revealed that polyaromatic hydrocarbon is the main element as a coke compound in the spent catalyst, while Raman spectra indicated polyaromatic species, the ring stretches of Aliphatic azo, graphitic lattices, and ideal graphite lattices as carbon structures in the regenerated catalyst. The thermogravimetric analysis showed that the catalyst mass loss order is fresh catalyst > regenerated catalyst > spent catalyst due to the process’s reaction regeneration, which affects the adsorption performance. Besides, the kinetic and thermodynamic parameters revealed that all zones are non-spontaneous endothermic reactions, and it was shown that the deeper the catalyst is treated, the more hydroxyl bonds (OH) are lost and the more activation energy is required.
References
- Y.S. Zhang, X. Lu, R.E. Owen, G. Manos, R. Xu, F.R. Wang, W.C. Maskell, P.R. Shearing, D.J.L. Brett, Fine structural changes of fluid catalytic catalysts and characterization of coke formed resulting from heavy oil devolatilization, Appl Catal B. 263 (2020). [CrossRef]
- G. Jiménez-García, R. Aguilar-López, R. Maya-Yescas, The fluidized-bed catalytic cracking unit building its future environment, Fuel. 90 (2011) 3531–3541. [CrossRef]
- A. Corma, A. Martínez, Zeolites in refining and petrochemistry, Stud Surf Sci Catal. 157 (2005) 337–366. [CrossRef]
- F. Krumeich, J. Ihli, Y. Shu, W.C. Cheng, J.A. Van Bokhoven, Structural Changes in Deactivated Fluid Catalytic Cracking Catalysts Determined by Electron Microscopy, ACS Catal. 8 (2018) 4591–4599. [CrossRef]
- M.E.Z. Velthoen, A. Lucini Paioni, I.E. Teune, M. Baldus, B.M. Weckhuysen, Matrix Effects in a Fluid Catalytic Cracking Catalyst Particle: Influence on Structure, Acidity, and Accessibility, Chemistry - A European Journal. 26 (2020) 11995–12009. [CrossRef]
- F. Krumeich, J. Ihli, Y. Shu, W.C. Cheng, J.A. Van Bokhoven, Structural Changes in Deactivated Fluid Catalytic Cracking Catalysts Determined by Electron Microscopy, ACS Catal. 8 (2018) 4591–4599. [CrossRef]
- A. Palčić, V. Valtchev, Synthesis and application of (nano) zeolites, Comprehensive Inorganic Chemistry III, Third Edition. 1–10 (2023) 18–40. [CrossRef]
- A. Palčić, V. Valtchev, Synthesis and application of (nano) zeolites, Comprehensive Inorganic Chemistry III, Third Edition. 1–10 (2023) 18–40. [CrossRef]
- Q. Almas, M.A. Naeem, M.A.S. Baldanza, J. Solomon, J.C. Kenvin, C.R. Müller, V. Teixeira Da Silva, C.W. Jones, C. Sievers, Transformations of FCC catalysts and carbonaceous deposits during repeated reaction-regeneration cycles, Catal Sci Technol. 9 (2019) 6977–6992. [CrossRef]
- Y. Xie, Y. Zhang, L. He, C.Q. Jia, Q. Yao, M. Sun, X. Ma, Anti-deactivation of zeolite catalysts for residue fluid catalytic cracking, Appl Catal A Gen. 657 (2023). [CrossRef]
- U.J. Etim, P. Bai, X. Liu, F. Subhan, R. Ullah, Z. Yan, Vanadium and nickel deposition on FCC catalyst: Influence of residual catalyst acidity on catalytic products, Microporous and Mesoporous Materials. 273 (2019) 276–285. [CrossRef]
- Z. Yan, Y. Fan, X. Bi, C. Lu, Dynamic behaviors of feed jets and catalyst particles in FCC feed injection zone, Chem Eng Sci. 189 (2018) 380–393. [CrossRef]
- Y. Liu, F. Meirer, C.M. Krest, S. Webb, B.M. Weckhuysen, Relating structure and composition with accessibility of a single catalyst particle using correlative 3-dimensional micro-spectroscopy, Nat Commun. 7 (2016). [CrossRef]
- F. Meirer, D.T. Morris, S. Kalirai, Y. Liu, J.C. Andrews, B.M. Weckhuysen, Mapping metals incorporation of a whole single catalyst particle using element specific X-ray nanotomography, J Am Chem Soc. 137 (2015) 102–105. [CrossRef]
- F. Krumeich, J. Ihli, Y. Shu, W.C. Cheng, J.A. Van Bokhoven, Structural Changes in Deactivated Fluid Catalytic Cracking Catalysts Determined by Electron Microscopy, ACS Catal. 8 (2018) 4591–4599. [CrossRef]
- J. Ihli, R.R. Jacob, M. Holler, M. Guizar-Sicairos, A. Diaz, J.C. Da Silva, D. Ferreira Sanchez, F. Krumeich, D. Grolimund, M. Taddei, W.C. Cheng, Y. Shu, A. Menzel, J.A. Van Bokhoven, A three-dimensional view of structural changes caused by deactivation of fluid catalytic cracking catalysts, Nat Commun. 8 (2017). [CrossRef]
- M.D. Argyle, C.H. Bartholomew, Heterogeneous catalyst deactivation and regeneration: A review, Catalysts. 5 (2015) 145–269. [CrossRef]
- F. Krumeich, J. Ihli, Y. Shu, W.C. Cheng, J.A. Van Bokhoven, Structural Changes in Deactivated Fluid Catalytic Cracking Catalysts Determined by Electron Microscopy, ACS Catal. 8 (2018) 4591–4599. [CrossRef]
- L. Duarte, L. Garzón, V.G. Baldovino-Medrano, An analysis of the physicochemical properties of spent catalysts from an industrial hydrotreating unit, Catal Today. 338 (2019) 100–107. [CrossRef]
- E.T.C. Vogt, D. Fu, B.M. Weckhuysen, Carbon Deposit Analysis in Catalyst Deactivation, Regeneration, and Rejuvenation, Angewandte Chemie - International Edition. (2023). [CrossRef]
- B. Wang, N. Li, Q. Zhang, C. Li, C. Yang, H. Shan, Studies on the preliminary cracking: The reasons why matrix catalytic function is indispensable for the catalytic cracking of feed with large molecular size, Journal of Energy Chemistry. 25 (2016) 641–653. [CrossRef]
- F. Hernández-Beltrán, E. López-Salinas, R. García-de-León, E. Mogica-Martínez, J.C. Moreno-Mayorga, R. González-Serrano, Study on the deactivation-aging patterns of fluid cracking catalysts in industrial units, Stud Surf Sci Catal. 134 (2001) 87–106. [CrossRef]
- J. Manuel Rêgo Silva, A. Mabel de Morais Araújo, J. Paulo da Costa Evangelista, D. Ribeiro da Silva, A. Duarte Gondim, A. Souza de Araujo, Evaluation of the kinetic and thermodynamic parameters in catalytic pyrolysis process of sunflower oil using Al-MCM-41 and zeolite H-ZSM-5, Fuel. 333 (2023) 126225. [CrossRef]
- K. Patidar, A. Singathia, M. Vashishtha, V. Kumar Sangal, S. Upadhyaya, Investigation of kinetic and thermodynamic parameters approaches to non-isothermal pyrolysis of mustard stalk using model-free and master plots methods, Mater Sci Energy Technol. 5 (2022) 6–14. [CrossRef]
- V. Vasudev, X. Ku, J. Lin, Kinetic study and pyrolysis characteristics of algal and lignocellulosic biomasses, Bioresour Technol. 288 (2019). [CrossRef]
- Mr.S.Y. Zakariyaou(薄亚冲), Y. Hua(叶华), O.A.D. Makaou, A Four-Lump Kinetic Model for Atmospheric Residue Conversion in the Fluid Catalytic Cracking Unit: Effect of the Inlet Gas Oil Temperature and Catalyst-Oil Weight Ratio on the Catalytic Reaction Behavior, East African Scholars Journal of Engineering and Computer Sciences. 6 (2023) 39–42. [CrossRef]
- W. Cui, D. Zhu, J. Tan, N. Chen, D. Fan, J. Wang, J. Han, L. Wang, P. Tian, Z. Liu, Synthesis of mesoporous high-silica zeolite Y and their catalytic cracking performance, Chinese Journal of Catalysis. 43 (2022) 1945–1954. [CrossRef]
- M. Thommes, K. Kaneko, A. V. Neimark, J.P. Olivier, F. Rodriguez-Reinoso, J. Rouquerol, K.S.W. Sing, Physisorption of gases, with special reference to the evaluation of surface area and pore size distribution (IUPAC Technical Report), Pure and Applied Chemistry. 87 (2015) 1051–1069. [CrossRef]
- INTERNATIONAL UNION OF PURE AND APPLIED CHEMISTRY PHYSICAL CHEMISTRY DIVISION COMMISSION ON COLLOID AND SURFACE CHEMISTRY INCLUDING CATALYSIS* REPORTING PHYSISORPTION DATA FOR GAS/SOLID SYSTEMS with Special Reference to the Determination of Surface Area and Porosity Reporting physisorption data for gas/solid systems-with special reference to the determination of surface area and porosity, 1985.
- Z.A. Alothman, A review: Fundamental aspects of silicate mesoporous materials, Materials. 5 (2012) 2874–2902. [CrossRef]
- H. Zhang, Z. Shen, J. Gong, H. Liu, Influences of regeneration atmospheres on structural transformation and renderability of FCC catalyst, Chin J Chem Eng. (2023). [CrossRef]
- L. Haiyan, C. Liyuan, W. Baoying, F. Yu, S. Gang, B. Xaojun, In-situ Synthesis and Catalytic Properties of ZSM-5/Rectorite Composites as Propylene Boosting Additive in Fluid Catalytic Cracking Process *, 2012.
- D. Hua, Z. Zhou, Deactivation of Mesoporous Titanosilicate-supported WO3 Catalyst for Metathesis of Butene to Propene by Coke, Journal of Thermodynamics & Catalysis. 07 (2016). [CrossRef]
- M.A. Alabdullah, T. Shoinkhorova, A. Dikhtiarenko, S. Ould-Chikh, A. Rodriguez-Gomez, S.H. Chung, A.O. Alahmadi, I. Hita, S. Pairis, J.L. Hazemann, P. Castaño, J. Ruiz-Martinez, I. Morales Osorio, K. Almajnouni, W. Xu, J. Gascon, Understanding catalyst deactivation during the direct cracking of crude oil, Catal Sci Technol. 12 (2022) 5657–5670. [CrossRef]
- V.G. Baldovino-Medrano, V. Niño-Celis, R. Isaacs-Giraldo, E. Refugio, Systematic analysis of the nitrogen adsorption-desorption isotherms recorded for a series of microporous-mesoporous amorphous aluminosilicates using classical methods, n.d.
- G. Lu, X. Lu, P. Liu, Reactivation of spent FCC catalyst by mixed acid leaching for efficient catalytic cracking, Journal of Industrial and Engineering Chemistry. 92 (2020) 236–242. [CrossRef]
- P. Palmay, C. Medina, C. Donoso, D. Barzallo, J.C. Bruno, Catalytic pyrolysis of recycled polypropylene using a regenerated FCC catalyst, Clean Technol Environ Policy. (2022). [CrossRef]
- Y. Mathieu, A. Corma, M. Echard, M. Bories, Single and combined Fluidized Catalytic Cracking (FCC) catalyst deactivation by iron and calcium metal–organic contaminants, Appl Catal A Gen. 469 (2014) 451–465. [CrossRef]
- I. Cora, I. Dódony, P. Pekker, Electron crystallographic study of a kaolinite single crystal, Appl Clay Sci. 90 (2014) 6–10. [CrossRef]
- A.F. Wright, M.S. Lehmann, The structure of quartz at 25 and 590°C determined by neutron diffraction, J Solid State Chem. 36 (1981) 371–380. [CrossRef]
- F. Caucia, Structural aspects of oxidation-dehydrogenation in staurolite The Crystal Chemistry of Mercury Minerals View project Gems and gem minerals View project, n.d. https://www.researchgate.net/publication/299446509.
- I. Cora, I. Dódony, P. Pekker, Electron crystallographic study of a kaolinite single crystal, Appl Clay Sci. 90 (2014) 6–10. [CrossRef]
- Y.X. Wang, H. Gies, B. Marler, U. Müller, Synthesis and crystal structure of zeolite RUB-41 obtained as calcination product of a layered precursor: A systematic approach to a new synthesis route, Chemistry of Materials. 17 (2005) 43–49. [CrossRef]
- X.-H. Peng, Y.-Z. Li, L.-X. Cai, L.-F. Wang, J.-G. Wu, A novel polyoxometalate supramolecular compound: [La(H 2 O) 9 ] 2 [V 10 O 28 ]·8H 2 O, Acta Crystallogr Sect E Struct Rep Online. 58 (2002) i111–i113. [CrossRef]
- S. Koide, Electrical Properties of LixNi(1−x)O Single Crystals, J Physical Soc Japan. 20 (1965) 123–132. [CrossRef]
- C.H. Wei, L.F. Dahl, The Molecular Structure of a Tricyclic Complex, [SFe(CO)3]2, Inorg Chem. 4 (1965) 1–11. [CrossRef]
- R. -S Zhou, R.L. Snyder, Structures and transformation mechanisms of the η, γ and θ transition aluminas, Urn:Issn:0108-7681. 47 (1991) 617–630. [CrossRef]
- M.D. Foster, O.D. Friedrichs, R.G. Bell, F.A.A. Paz, J. Klinowski, Chemical evaluation of hypothetical uninodal zeolites, J Am Chem Soc. 126 (2004) 9769–9775. [CrossRef]
- S. Komarneni, H. Katsuki, S. Furuta, Novel honeycomb structure: a microporous ZSM-5 and macroporous mullite composite, J Mater Chem. 8 (1998) 2327–2329. [CrossRef]
- F.J. Wicks, Status of the reference X-ray powder-diffraction patterns for the serpentine minerals in the PDF database—1997, Powder Diffr. 15 (2000) 42–50. [CrossRef]
- Q. Hu, Q. Yong, L. He, Y. Gu, J. Zeng, Structural evolution of kaolinite in muddy intercalation under microwave heating, Mater Res Express. 8 (2021). [CrossRef]
- L. Nong, X. Yang, L. Zeng, J. Liu, Qualitative and quantitative phase analyses of Pingguo bauxite mineral using X-ray powder diffraction and the Rietveld method, Powder Diffr. 22 (2007) 300–302. [CrossRef]
- T. Murugesan, S. Ramesh, J. Gopalakrishnan, C.N.R. Rao, Ternary vanadium sulfides, J Solid State Chem. 44 (1982) 119–125. [CrossRef]
- A.A. Frolov, R.P. Krentsis, F.A. Sidorenko, P. V. Gel’d, Some physical properties of Co2Si and Ni2Si in the 10-350 °k temperature range, Soviet Physics Journal. 15 (1972) 418–420. [CrossRef]
- Polyhedral thermal expansion in the TiO 2 polymorphs; refinement of the crystal structures of rutile and brookite at high temperature | The Canadian Mineralogist | GeoScienceWorld, (n.d.). https://pubs.geoscienceworld.org/canmin/article-abstract/17/1/77/11318/Polyhedral-thermal-expansion-in-the-TiO-2?redirectedFrom=fulltext (accessed October 4, 2023).
- U.J. Etim, B. Xu, P. Bai, R. Ullah, F. Subhan, Z. Yan, Role of nickel on vanadium poisoned FCC catalyst: A study of physiochemical properties, Journal of Energy Chemistry. 25 (2016) 667–676. [CrossRef]
- Y. Mathieu, A. Corma, M. Echard, M. Bories, Single and combined Fluidized Catalytic Cracking (FCC) catalyst deactivation by iron and calcium metal-organic contaminants, Appl Catal A Gen. 469 (2014) 451–465. [CrossRef]
- B. Behera, S.S. Ray, Structural changes of FCC catalyst from fresh to regeneration stages and associated coke in a FCC refining unit: A multinuclear solid state NMR approach, Catal Today. 141 (2009) 195–204. [CrossRef]
- Y. jie Wang, C. Wang, L. ling Li, Y. Chen, C. hong He, L. Zheng, Assessment of ecotoxicity of spent fluid catalytic cracking (FCC) refinery catalysts on Raphidocelis subcapitata and predictive models for toxicity, Ecotoxicol Environ Saf. 222 (2021). [CrossRef]
- M. Xu, X. Liu, R.J. Madon, Pathways for Y zeolite destruction: The role of sodium and vanadium, J Catal. 207 (2002) 237–246. [CrossRef]
- K. Wijayanti, K. Leistner, S. Chand, A. Kumar, K. Kamasamudram, N.W. Currier, A. Yezerets, L. Olsson, Deactivation of Cu-SSZ-13 by SO2 exposure under SCR conditions, Catal Sci Technol. 6 (2016) 2565–2579. [CrossRef]
- R. Jonsson, P.H. Ho, A. Wang, M. Skoglundh, L. Olsson, The impact of lanthanum and zeolite structure on hydrocarbon storage, Catalysts. 11 (2021). [CrossRef]
- B.B. Hallac, J.C. Brown, E. Stavitski, R.G. Harrison, M.D. Argyle, In situ UV-visible assessment of iron-based high-temperature water-gas shift catalysts promoted with Lanthana: An extent of reduction study, Catalysts. 8 (2018). [CrossRef]
- L. Alcaraz, O. Rodríguez-Largo, M. Álvarez-Montes, F.A. López, C. Baudín, Effect of lanthanum content on physicochemical properties and thermal evolution of spent and beneficiated spent FCC catalysts, Ceram Int. 48 (2022) 17691–17702. [CrossRef]
- M.N. Haddadnezhad, A. Babaei, M.J. Molaei, A. Ataie, Synthesis and characterization of lanthanum nickelate nanoparticles with Rudllesden-Popper crystal structure for cathode materials of solid oxide fuel cells, Journal of Ultrafine Grained and Nanostructured Materials. 53 (2020) 98–109. [CrossRef]
- J. Zhou, J. Zhao, J. Zhang, T. Zhang, M. Ye, Z. Liu, Regeneration of catalysts deactivated by coke deposition: A review, Chinese Journal of Catalysis. 41 (2020) 1048–1061. [CrossRef]
- Y.L. Tsai, E. Huang, Y.H. Li, H.T. Hung, J.H. Jiang, T.C. Liu, J.N. Fang, H.F. Chen, Raman spectroscopic characteristics of zeolite group minerals, Minerals. 11 (2021) 1–14. [CrossRef]
- J. Yu, Q. Guo, L. Ding, Y. Gong, G. Yu, Studying effects of solid structure evolution on gasification reactivity of coal chars by in-situ Raman spectroscopy, Fuel. 270 (2020) 117603. [CrossRef]
- A. Sadezky, H. Muckenhuber, H. Grothe, R. Niessner, U. Pöschl, Raman microspectroscopy of soot and related carbonaceous materials: Spectral analysis and structural information, Carbon N Y. 43 (2005) 1731–1742. [CrossRef]
- I. Pala-Rosas, J.L. Contreras, J. Salmones, R. López-Medina, D. Angeles-Beltrán, B. Zeifert, J. Navarrete-Bolaños, N.N. González-Hernández, Effects of the Acidic and Textural Properties of Y-Type Zeolites on the Synthesis of Pyridine and 3-Picoline from Acrolein and Ammonia, Catalysts. 13 (2023). [CrossRef]
- A.F. Wright, J.S. Bailey, Organic carbon, total carbon, and total nitrogen determinations in soils of variable calcium carbonate contents using a Leco CN-2000 dry combustion analyzer, Http://Dx.Doi.Org/10.1081/CSS-120001118. 32 (2011) 3243–3258. [CrossRef]
- Y. Ruiz-Morales, A.D. Miranda-Olvera, B. Portales-Martínez, J.M. Domínguez, Determination of13C NMR Chemical Shift Structural Ranges for Polycyclic Aromatic Hydrocarbons (PAHs) and PAHs in Asphaltenes: An Experimental and Theoretical Density Functional Theory Study, Energy and Fuels. 33 (2019) 7950–7970. [CrossRef]
- S. Kukade, P. Kumar, P.V.C. Rao, N. V. Choudary, Comparative study of attrition measurements of commercial FCC catalysts by ASTM fluidized bed and jet cup test methods, Powder Technol. 301 (2016) 472–477. [CrossRef]
- X. Zhang, Y. Han, D. Li, Z. Zhang, X. Ma, Study on attrition of spherical-shaped Mo/HZSM-5 catalyst for methane dehydro-aromatization in a gas–solid fluidized bed, Chin J Chem Eng. 38 (2021) 172–183. [CrossRef]
- F. Meirer, D.T. Morris, S. Kalirai, Y. Liu, J.C. Andrews, B.M. Weckhuysen, Mapping metals incorporation of a whole single catalyst particle using element specific X-ray nanotomography, J Am Chem Soc. 137 (2015) 102–105. [CrossRef]
- S. Kukade, P. Kumar, P.V.C. Rao, N. V. Choudary, Comparative study of attrition measurements of commercial FCC catalysts by ASTM fluidized bed and jet cup test methods, Powder Technol. 301 (2016) 472–477. [CrossRef]
- C.R. Bemrose, J. Bridgwater, A review of attrition and attrition test methods, Powder Technol. 49 (1987) 97–126. [CrossRef]
- W.L. Forsythe, W.R. Hertwig, Attrition Characteristics of Fluid Cracking Catalysts, Ind Eng Chem. 41 (1949) 1200–1206. [CrossRef]
- J. Werther, J. Reppenhagen, Catalyst attrition in fluidized-bed systems, AIChE Journal. 45 (1999) 2001–2010. [CrossRef]
- J.M. Whitcombe, I.E. Agranovski, R.D. Braddock, Attrition due to mixing of hot and cold FCC catalyst particles, Powder Technol. 137 (2003) 120–130. [CrossRef]
- J. Hao, Y. Zhao, M. Ye, Z. Liu, Influence of Temperature on Fluidized-Bed Catalyst Attrition Behavior, Chem Eng Technol. 39 (2016) 927–934. [CrossRef]
- R. Miandad, M.A. Barakat, M. Rehan, A.S. Aburiazaiza, I.M.I. Ismail, A.S. Nizami, Plastic waste to liquid oil through catalytic pyrolysis using natural and synthetic zeolite catalysts, Waste Management. 69 (2017) 66–78. [CrossRef]
- A.W. Chester, Studies on the Metal Poisoning and Metal Resistance of Zeolitic Cracking Catalysts, Ind Eng Chem Res. 26 (1987) 863–869. [CrossRef]
- J. Xu, W. Zhou, J. Wang, Z. Li, J. Ma, Characterization and analysis of carbon deposited during the dry reforming of methane over Ni/La2O3/Al2O3 catalysts, Cuihua Xuebao/Chinese Journal of Catalysis. 30 (2009) 1076–1084. [CrossRef]
- J.Z. Luo, Z.L. Yu, C.F. Ng, C.T. Au, CO2/CH4 reforming over Ni-La2O3/5A: An investigation on carbon deposition and reaction steps, J Catal. 194 (2000) 198–210. [CrossRef]
- Z. Zhang, X.E. Verykios, ~ APPLI ED CATALYSI S Carbon dioxide reforming of methane to synthesis gas over Ni/La203 catalysts, 1996.
- S. Ramukutty, E. Ramachandran, Reaction Rate Models for the Thermal Decomposition of Ibuprofen Crystals, Journal of Crystallization Process and Technology. 04 (2014) 71–78. [CrossRef]
- R. Arjmandi, A. Hassan, M.K.M. Haafiz, Z. Zakaria, M.S. Islam, Effect of hydrolysed cellulose nanowhiskers on properties of montmorillonite/polylactic acid nanocomposites, Int J Biol Macromol. 82 (2016) 998–1010. [CrossRef]
- D. Trache, Comments on “thermal degradation behavior of hypochlorite-oxidized starch nanocrystals under different oxidized levels,” Carbohydr Polym. 151 (2016) 535–537. [CrossRef]
- M.A. Farrukh, K.M. Butt, K.K. Chong, W.S. Chang, Photoluminescence emission behavior on the reduced band gap of Fe doping in CeO2-SiO2 nanocomposite and photophysical properties, Journal of Saudi Chemical Society. 23 (2019) 561–575. [CrossRef]
- M. Del Mar Graciani, A. Rodríguez, M. Muñoz, M.L. Moyá, Micellar solutions of sulfobetaine surfactants in water-ethylene glycol mixtures: Surface tension, fluorescence, spectroscopic, conductometric, kinetic studies, Langmuir. 21 (2005) 7161–7169. [CrossRef]
- G. Bhardwaj, M. Kumar, P.K. Mishra, S.N. Upadhyay, Kinetic analysis of the slow pyrolysis of paper wastes, Biomass Convers Biorefin. 13 (2023) 3087–3100. [CrossRef]
- O. Verdeş, A. Popa, S. Borcănescu, M. Suba, V. Sasca, Thermogravimetry Applied for Investigation of Coke Formation in Ethanol Conversion over Heteropoly Tungstate Catalysts, Catalysts. 12 (2022). [CrossRef]
- N. Saadatkhah, A. Carillo Garcia, S. Ackermann, P. Leclerc, M. Latifi, S. Samih, G.S. Patience, J. Chaouki, Experimental methods in chemical engineering: Thermogravimetric analysis—TGA, Canadian Journal of Chemical Engineering. 98 (2020) 34–43. [CrossRef]
- J. Taynara, B. Cunha, V.M. Castro, D. Santana Da Silva, D. De Aguiar Pontes, V. Lima Da Silva, L. Antônio, M. Pontes, R.C. Santos, Coke Deposition on Cracking Catalysts Study by Thermogravimetric Analysis, International Journal of Engineering Research and Applications Www.Ijera.Com. 10 (2020) 43–47. [CrossRef]
- A. Marcilla, A. Gómez-Siurana, A.O. Odjo, R. Navarro, D. Berenguer, Characterization of vacuum gas oil-low density polyethylene blends by thermogravimetric analysis, Polym Degrad Stab. 93 (2008) 723–730. [CrossRef]
- Ochoa, Á. Ibarra, J. Bilbao, J.M. Arandes, P. Castaño, Assessment of thermogravimetric methods for calculating coke combustion-regeneration kinetics of deactivated catalyst, Chem Eng Sci. 171 (2017) 459–470. [CrossRef]
- A.T. Aguayo, A.G. Gayubo, A. Atutxa, B. Valle, J. Bilbao, Regeneration of a HZSM-5 zeolite catalyst deactivated in the transformation of aqueous ethanol into hydrocarbons, Catal Today. 107–108 (2005) 410–416. [CrossRef]
- C. Ran, Y. Liu, A.R. Siddiqui, A.A. Siyal, X. Mao, Q. Kang, J. Fu, W. Ao, J. Dai, Pyrolysis of textile dyeing sludge in fluidized bed: Analysis of products, and migration and distribution of heavy metals, J Clean Prod. 241 (2019). [CrossRef]
Figure 1.
Brunauer-Emmett-Teller (BET) nitrogen adsorption and desorption isotherms(I) and BJH pore size distribution curves of tested samples (II): (a) fresh catalyst, (b) regenerated catalyst, and (c) spent catalyst.
Figure 1.
Brunauer-Emmett-Teller (BET) nitrogen adsorption and desorption isotherms(I) and BJH pore size distribution curves of tested samples (II): (a) fresh catalyst, (b) regenerated catalyst, and (c) spent catalyst.
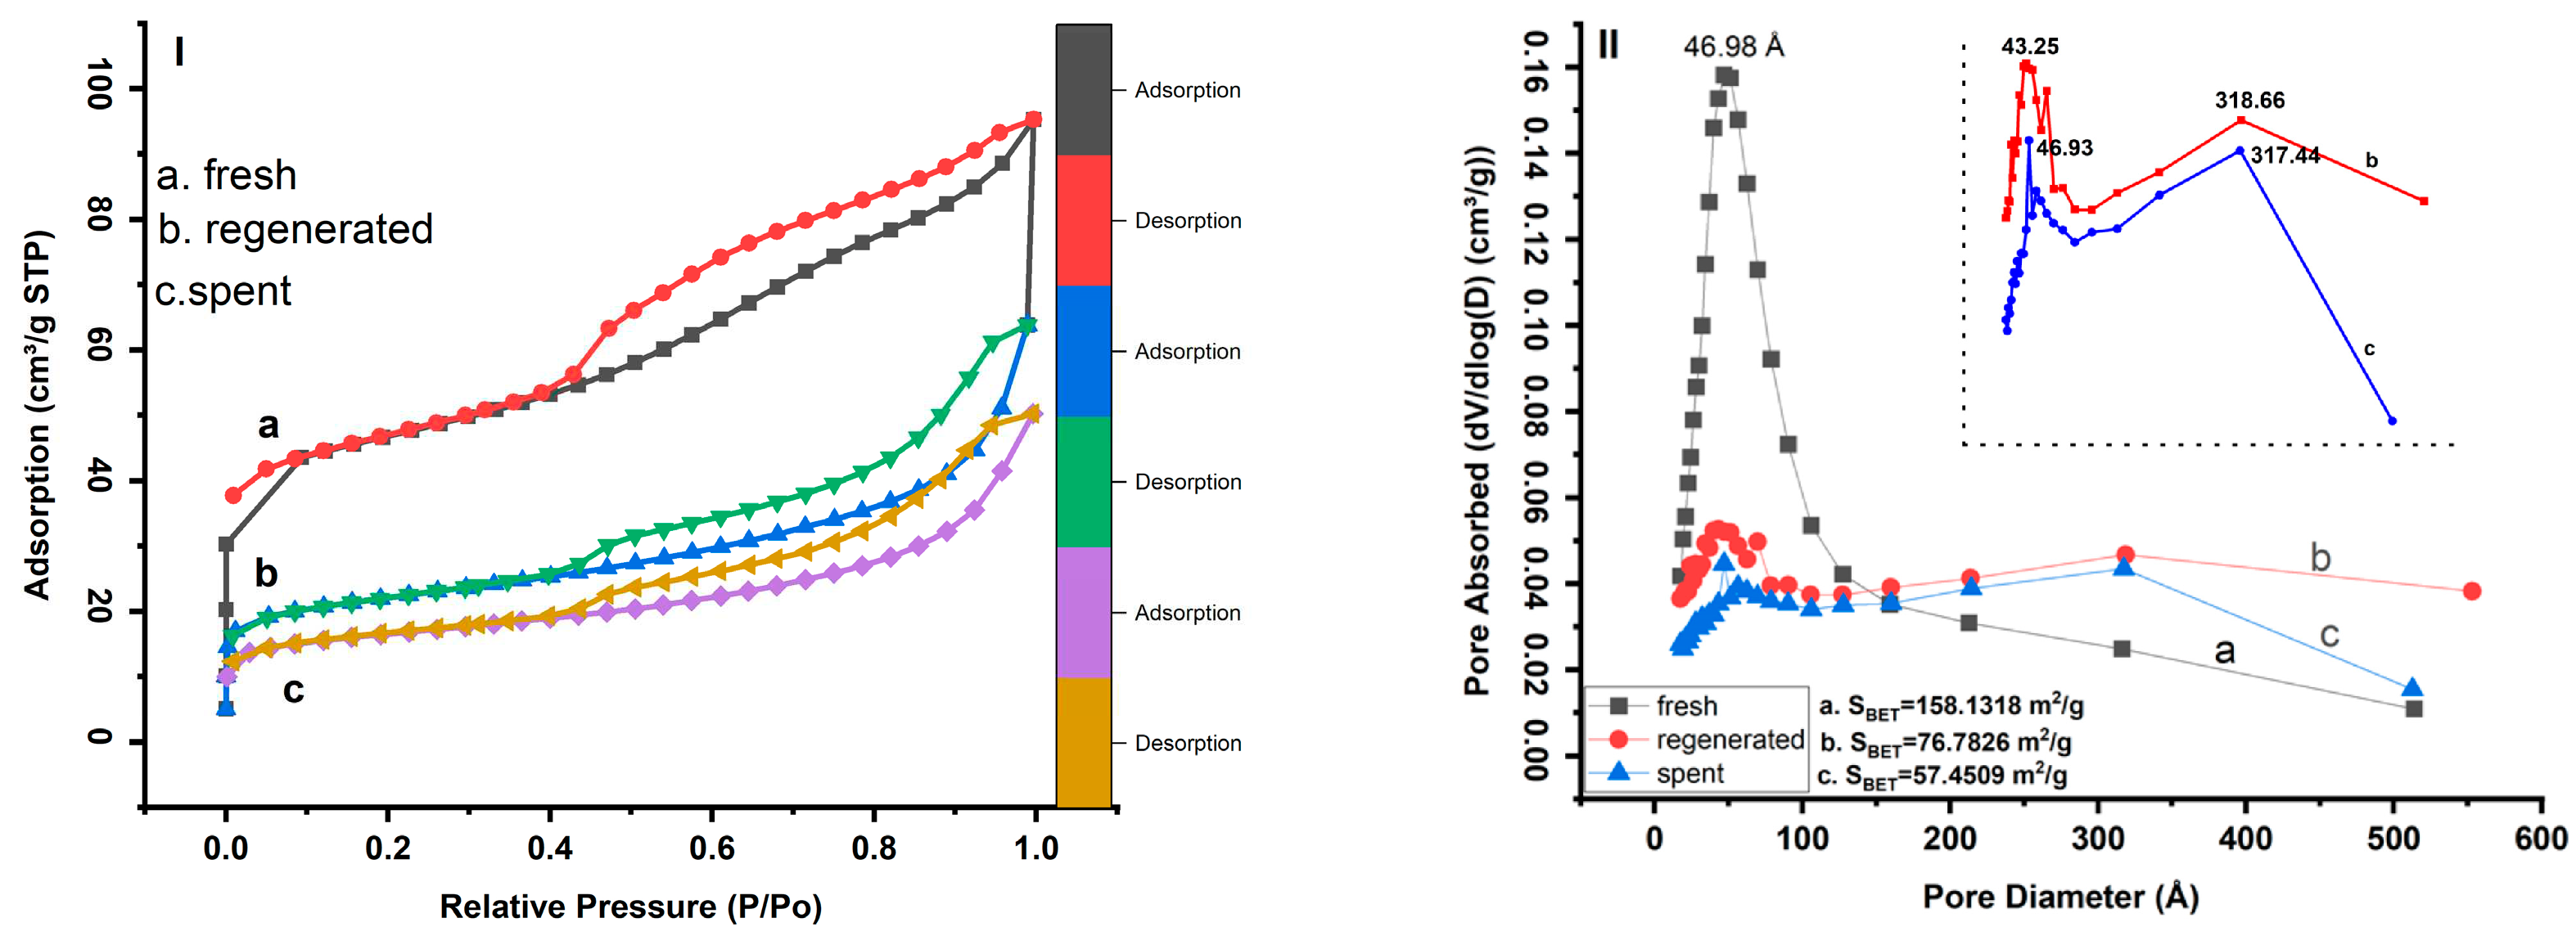
Figure 2.
X-ray diffraction patterns of fresh, regenerated, and spent catalysts.
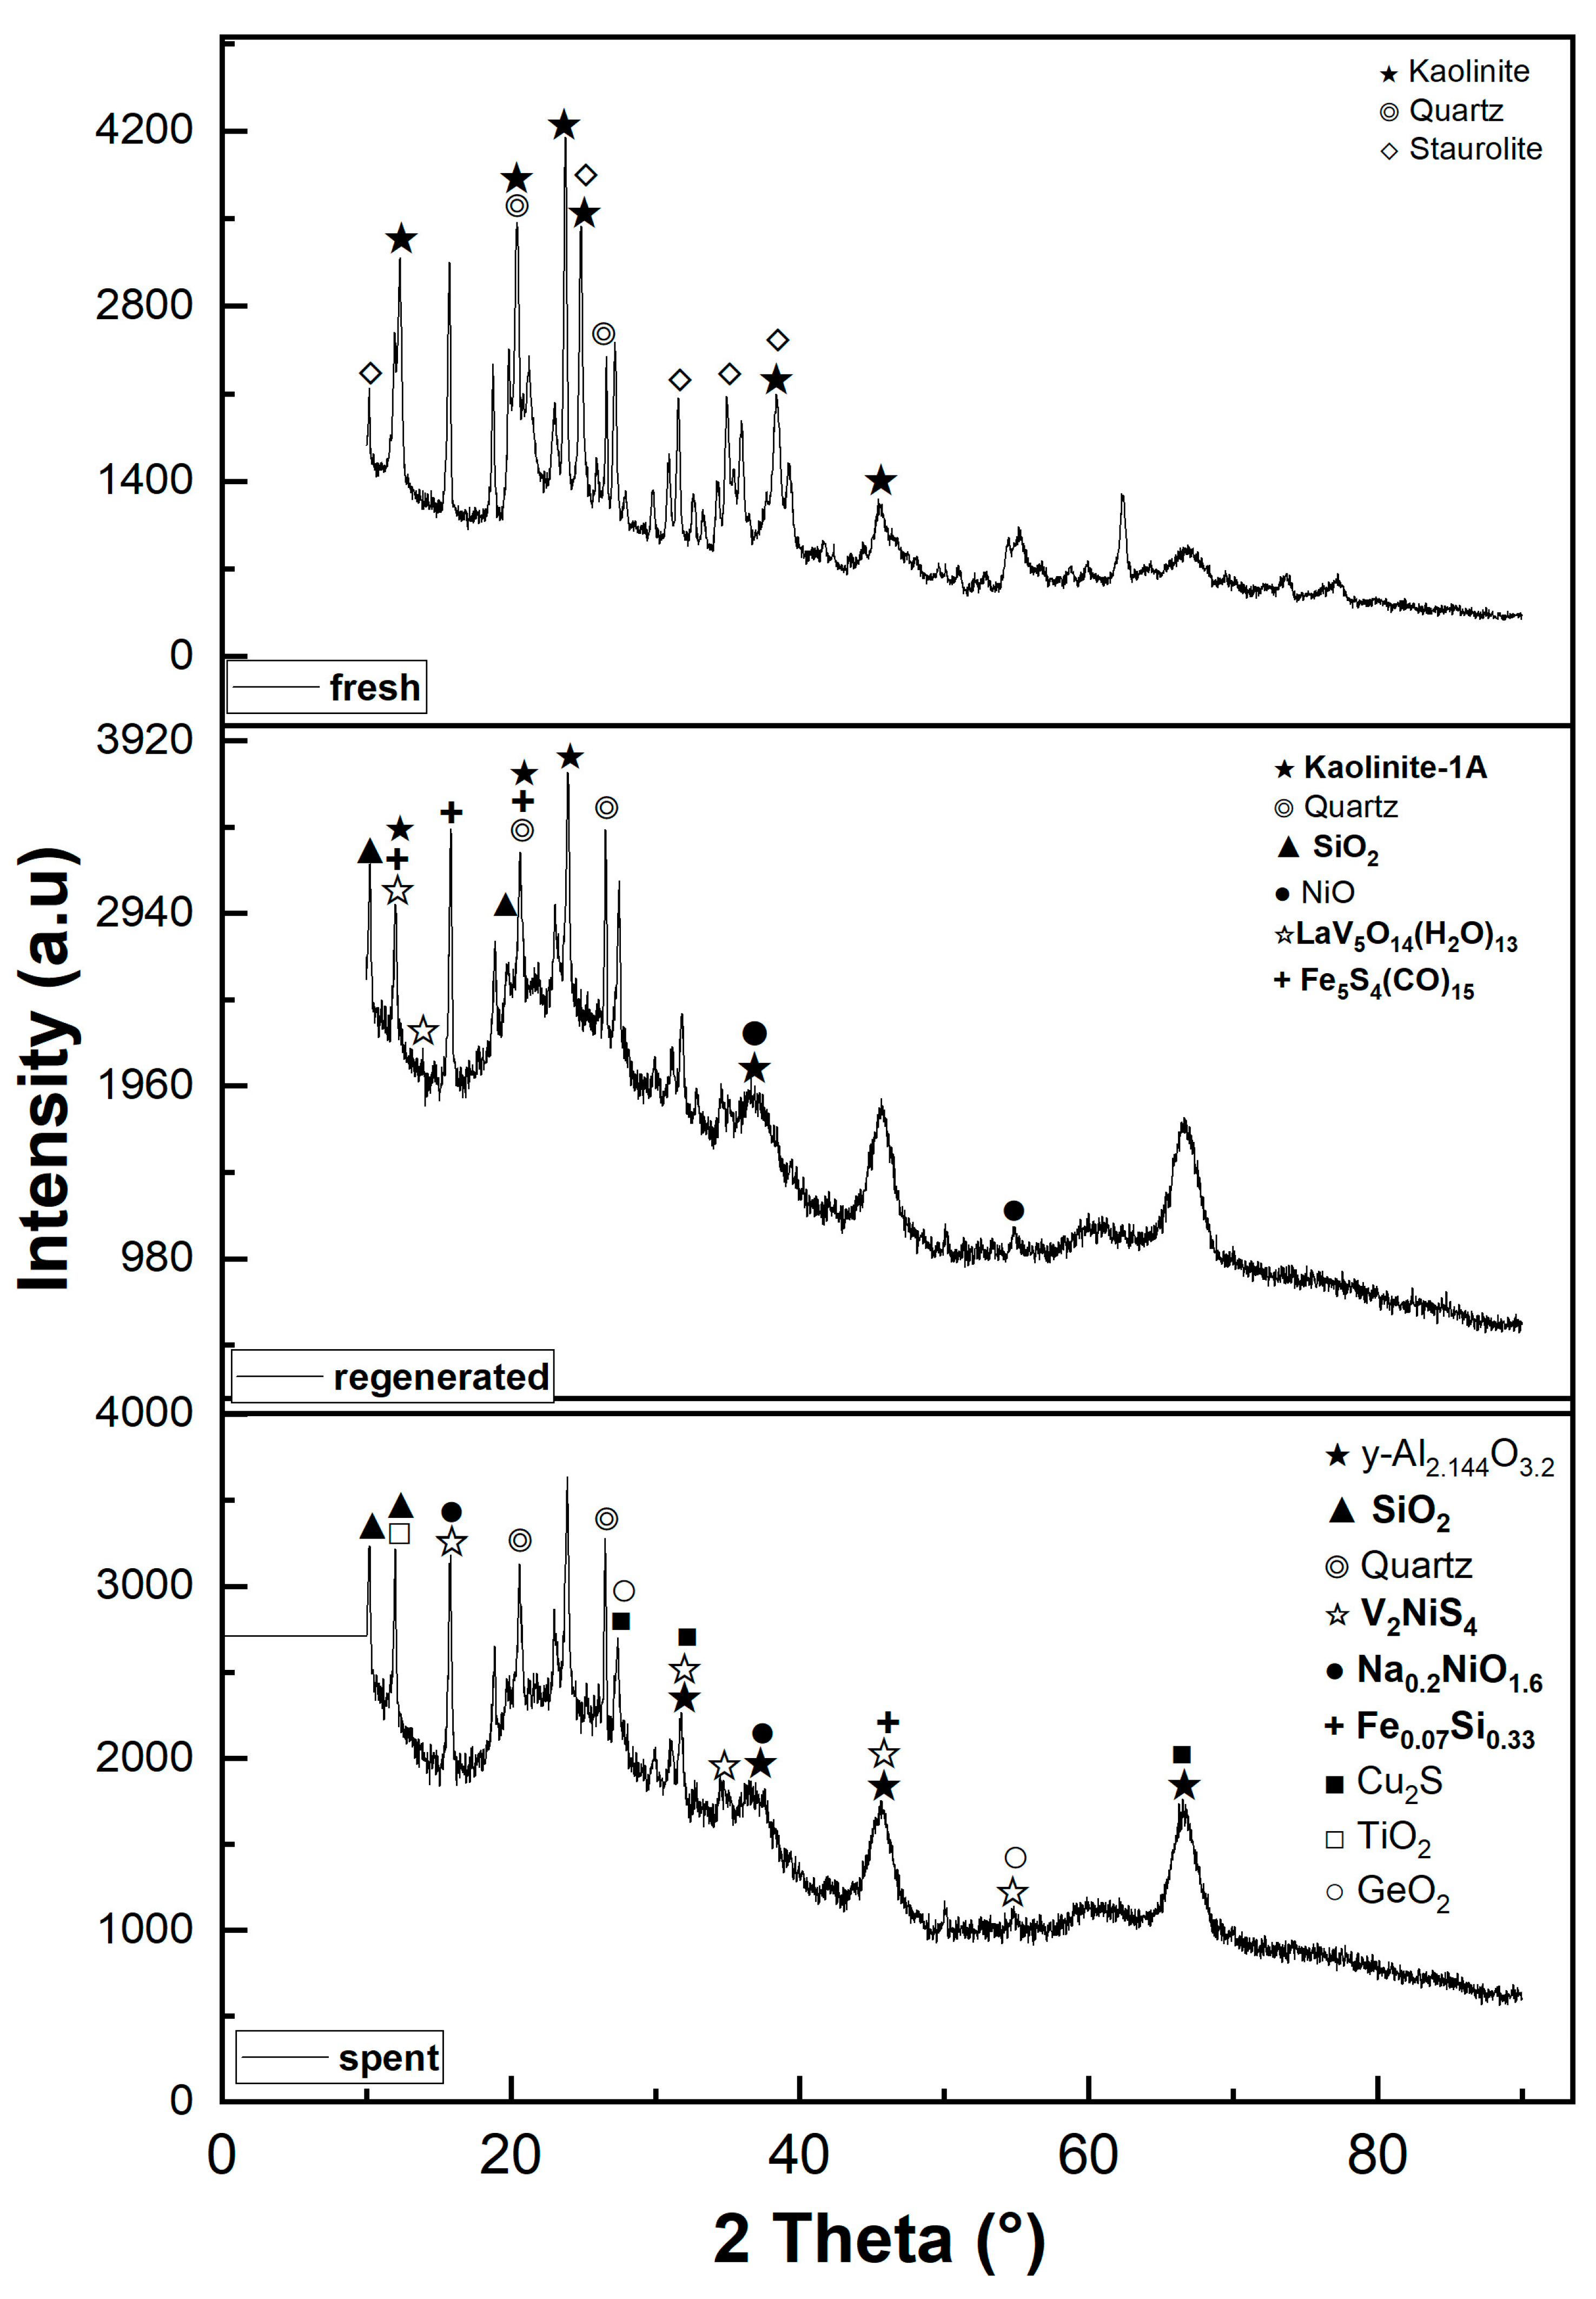
Figure 3.
Scheme of catalyst components crosslinked and phases evolution during the FCC process.
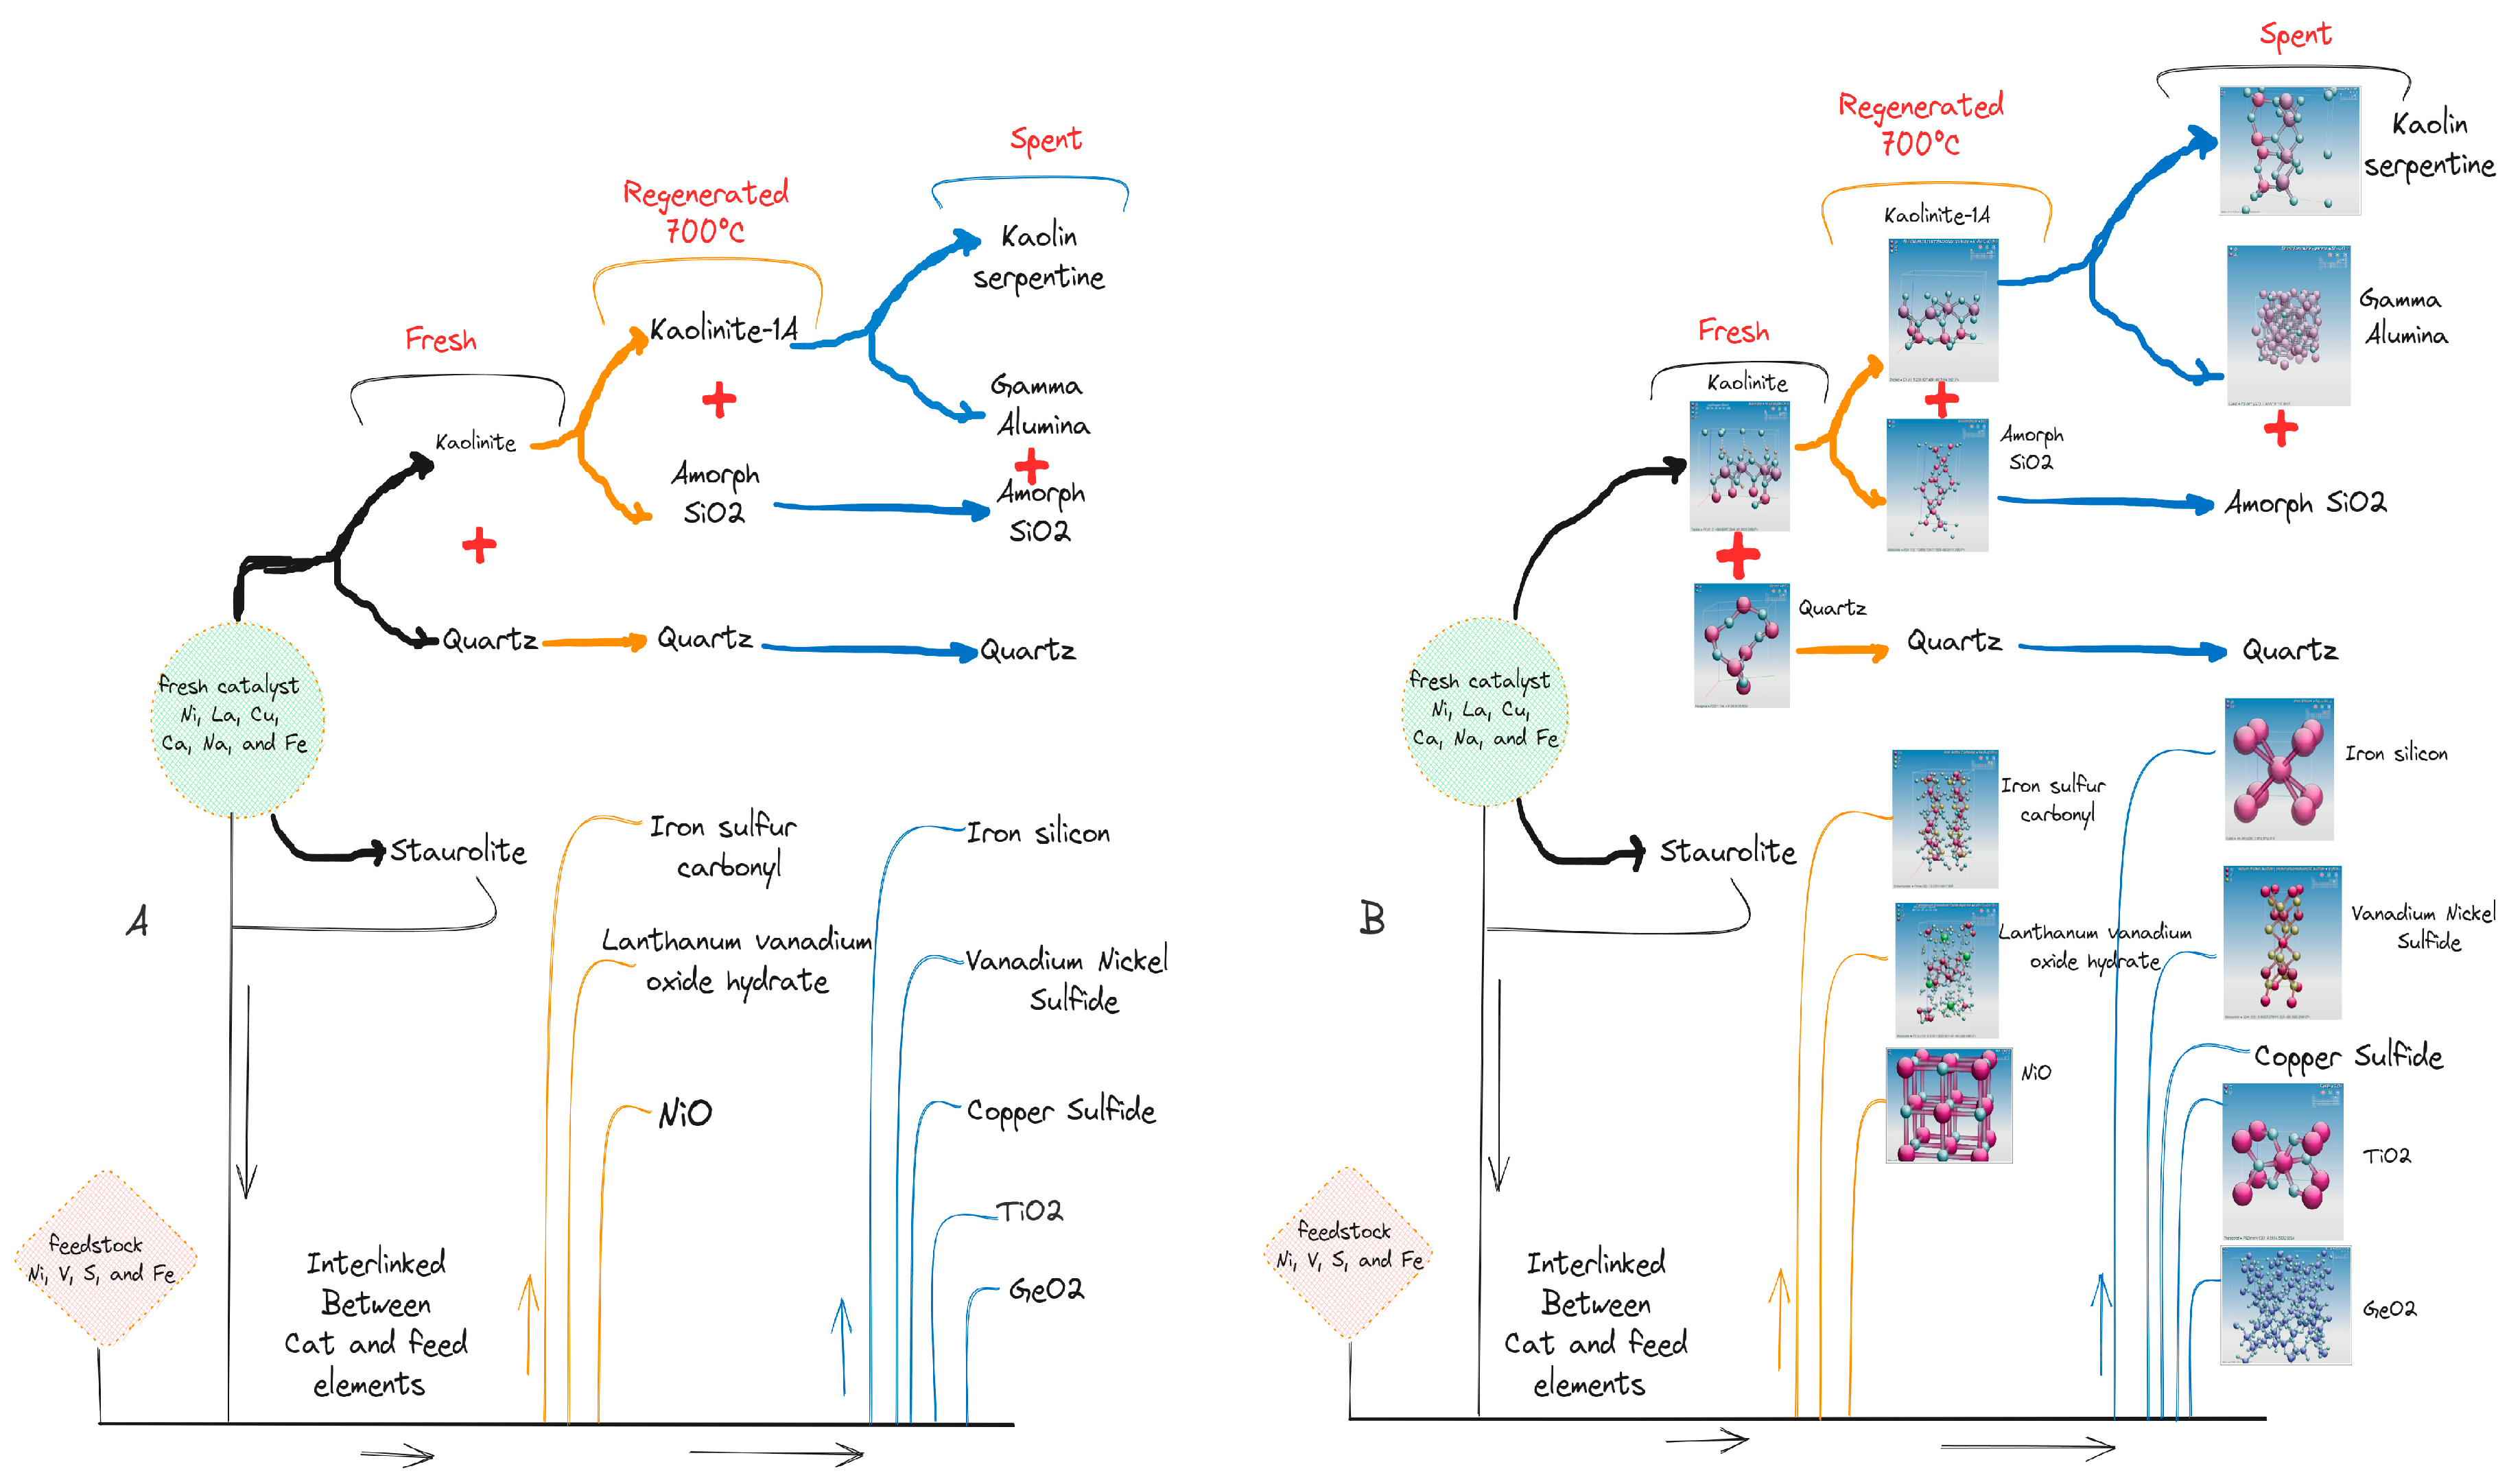
Figure 4.
Raman spectra [fresh (I), regenerated (II), and spent catalyst (III)], and UV-Vis curves IV [fresh (a), regenerated (b), spent (c)].
Figure 4.
Raman spectra [fresh (I), regenerated (II), and spent catalyst (III)], and UV-Vis curves IV [fresh (a), regenerated (b), spent (c)].
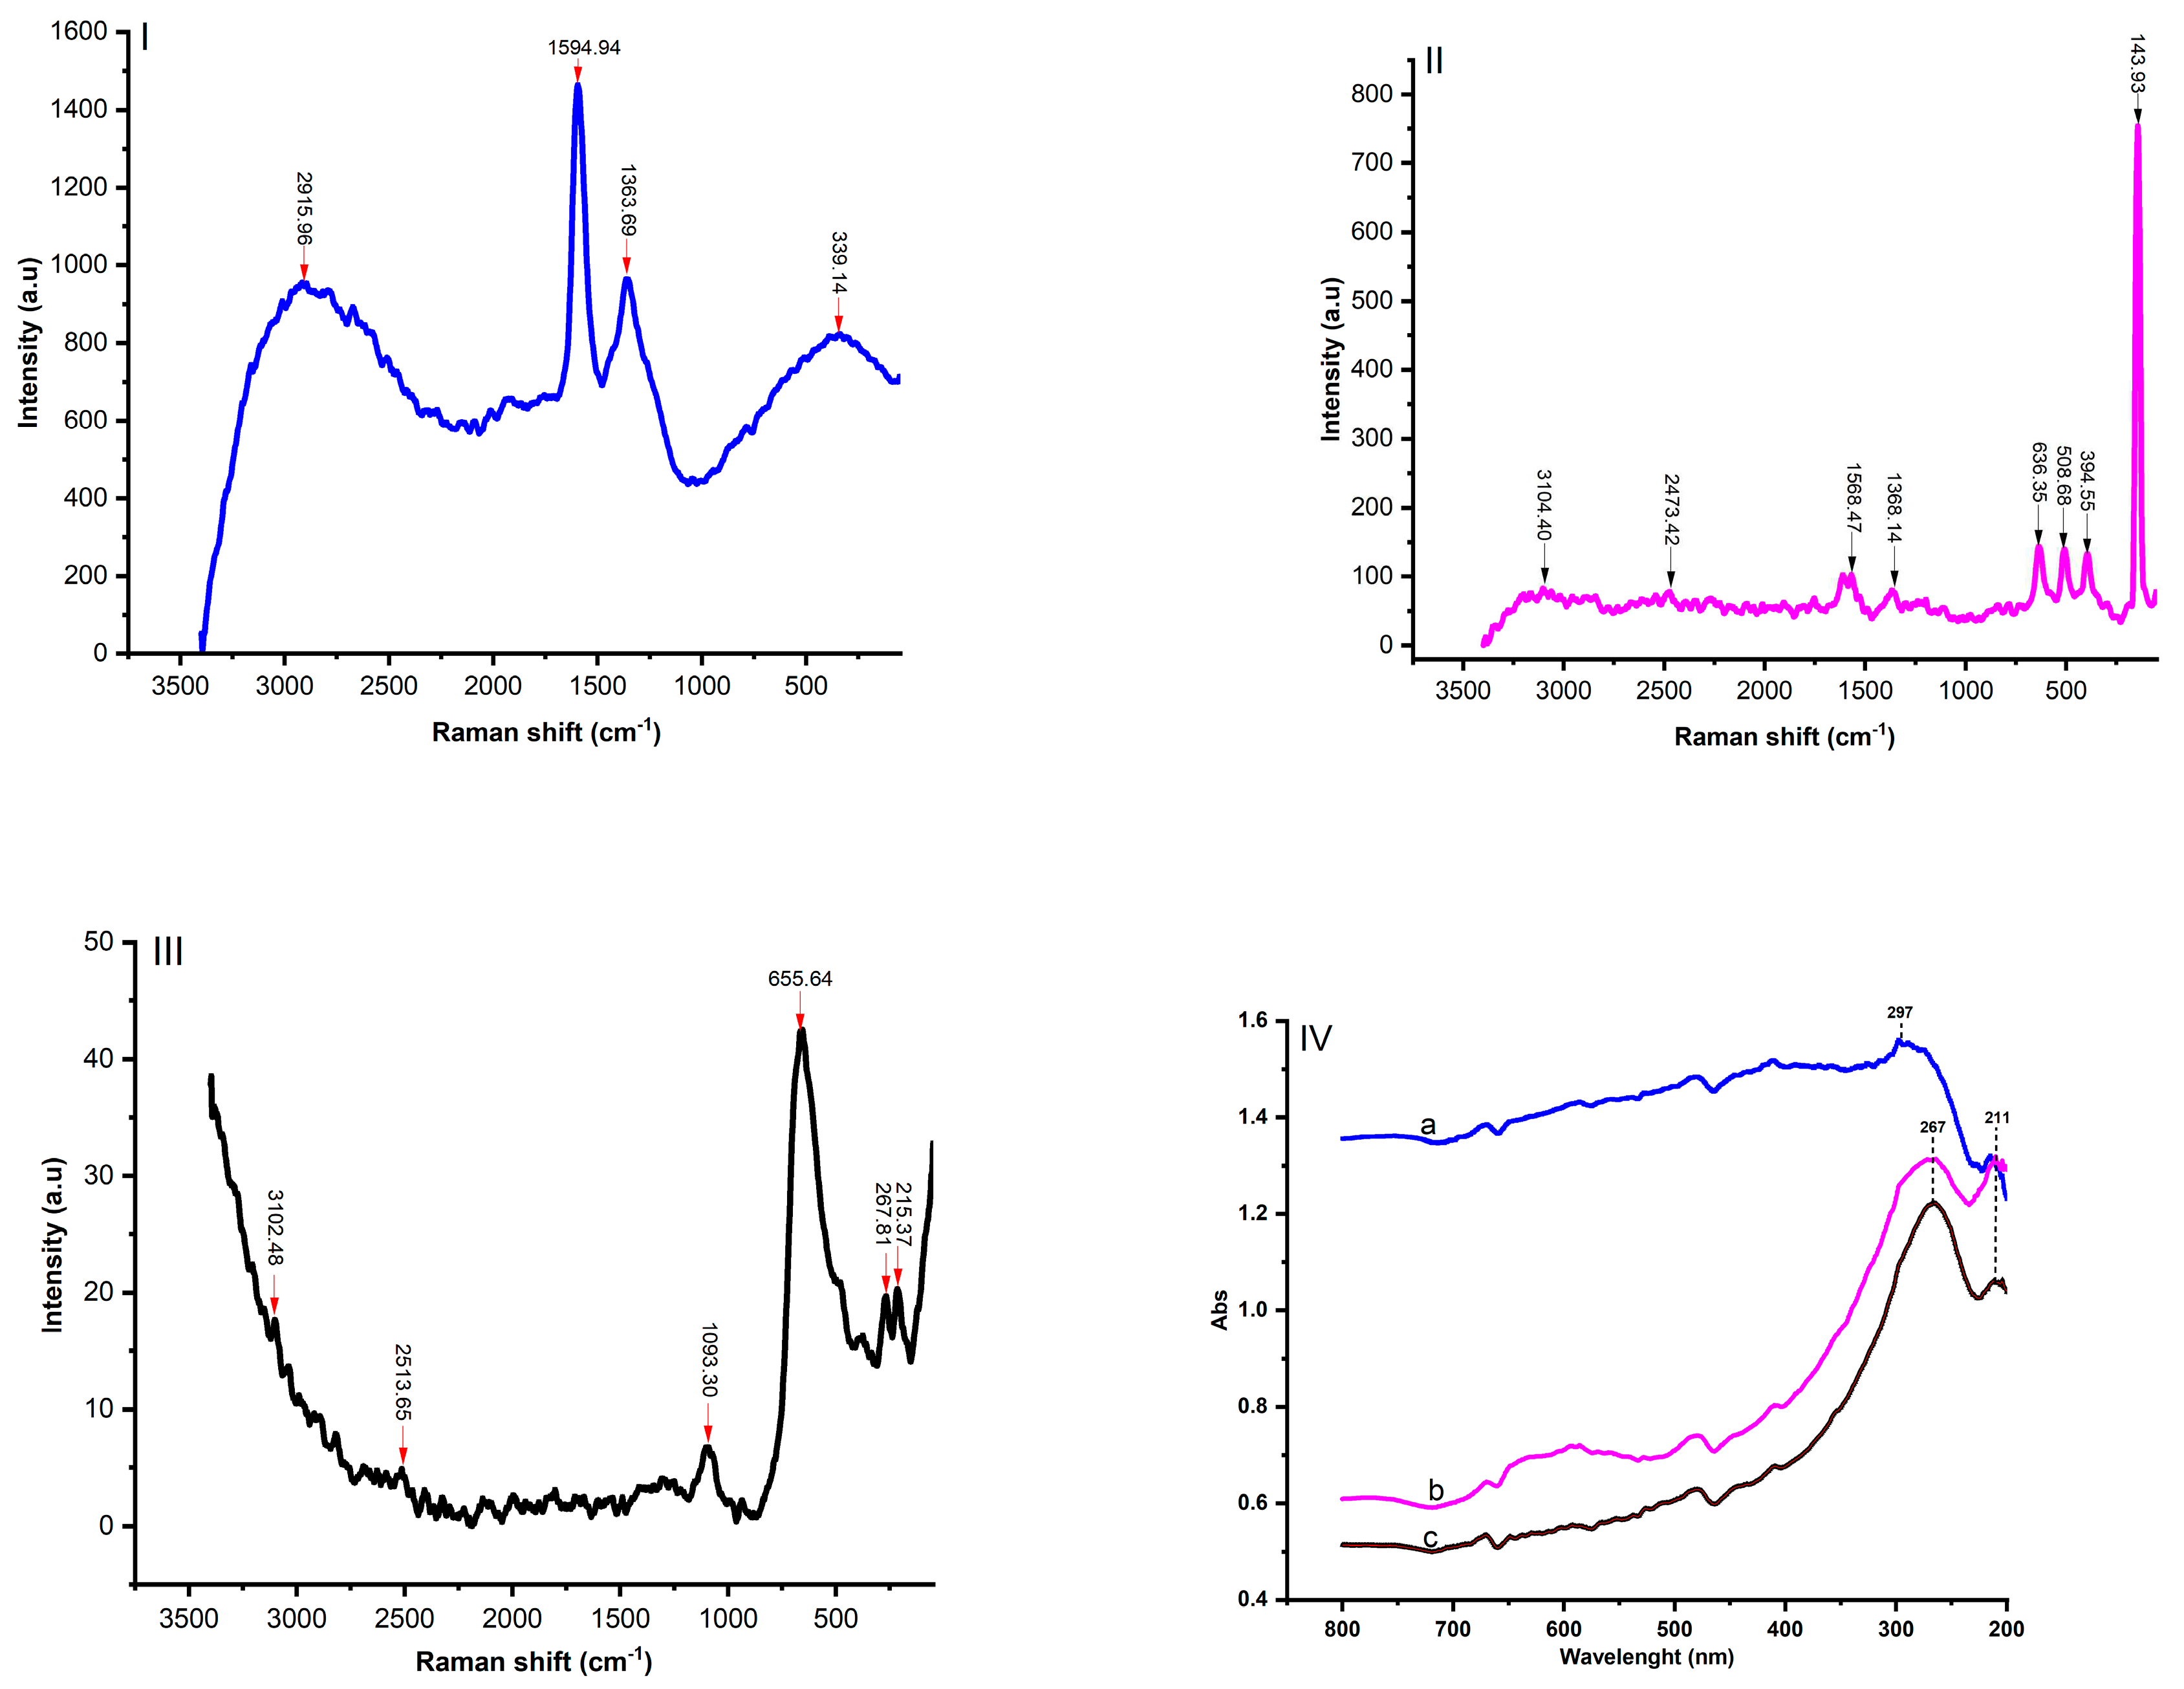
Figure 5.
The NMR 13C spectra of spent catalysts.
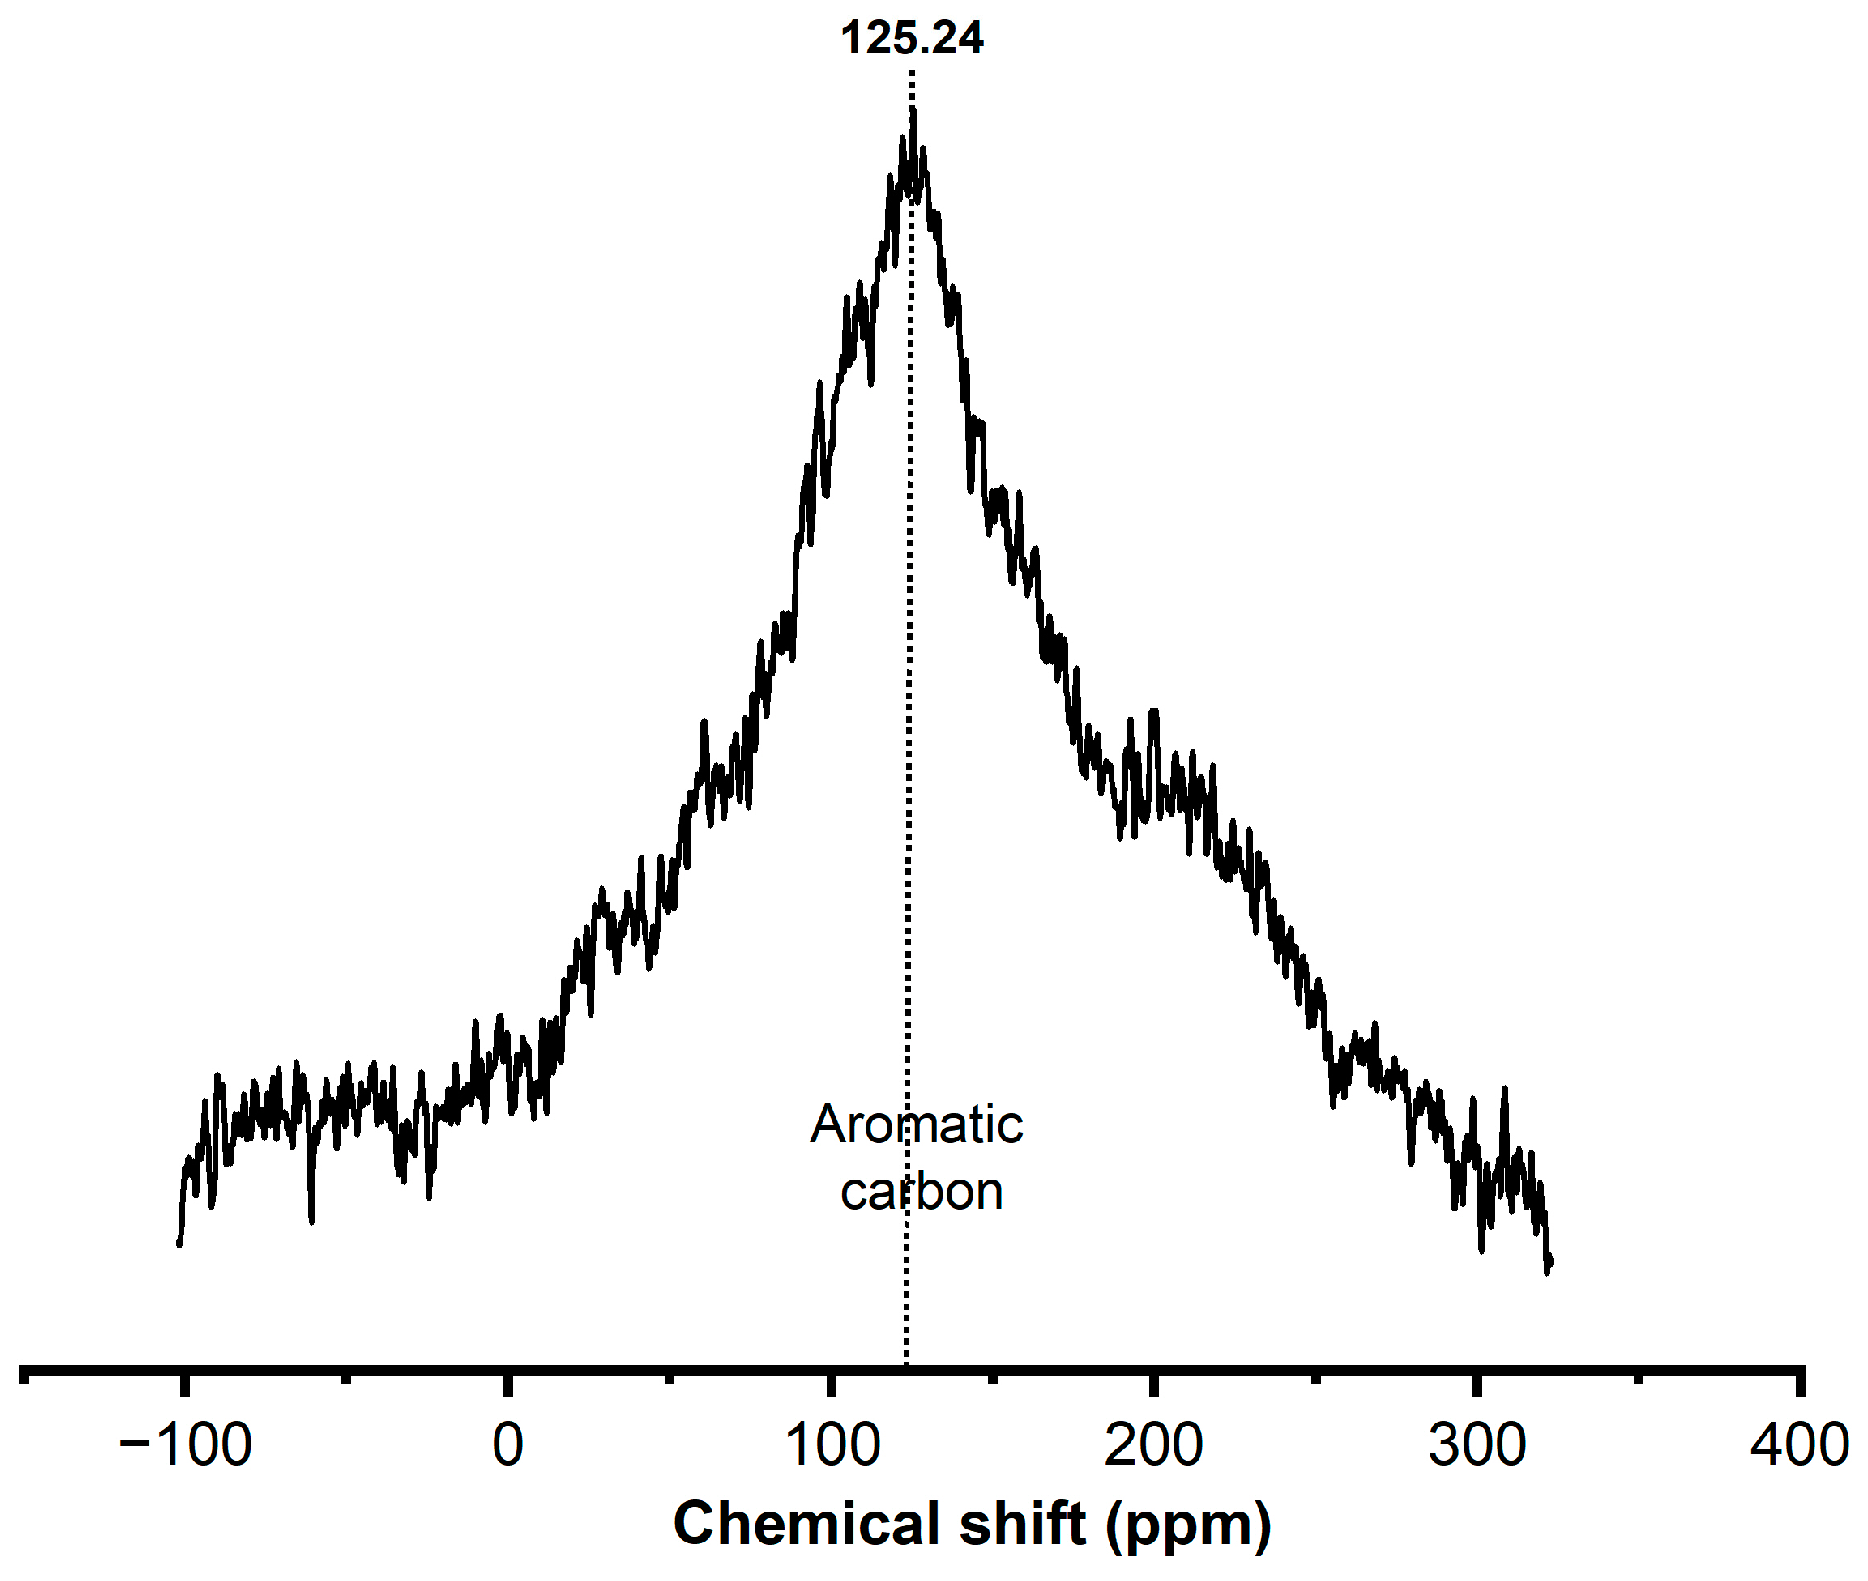
Figure 6.
SEM images of the samples of fresh(a), regenerated(b), and spent(c) catalysts.
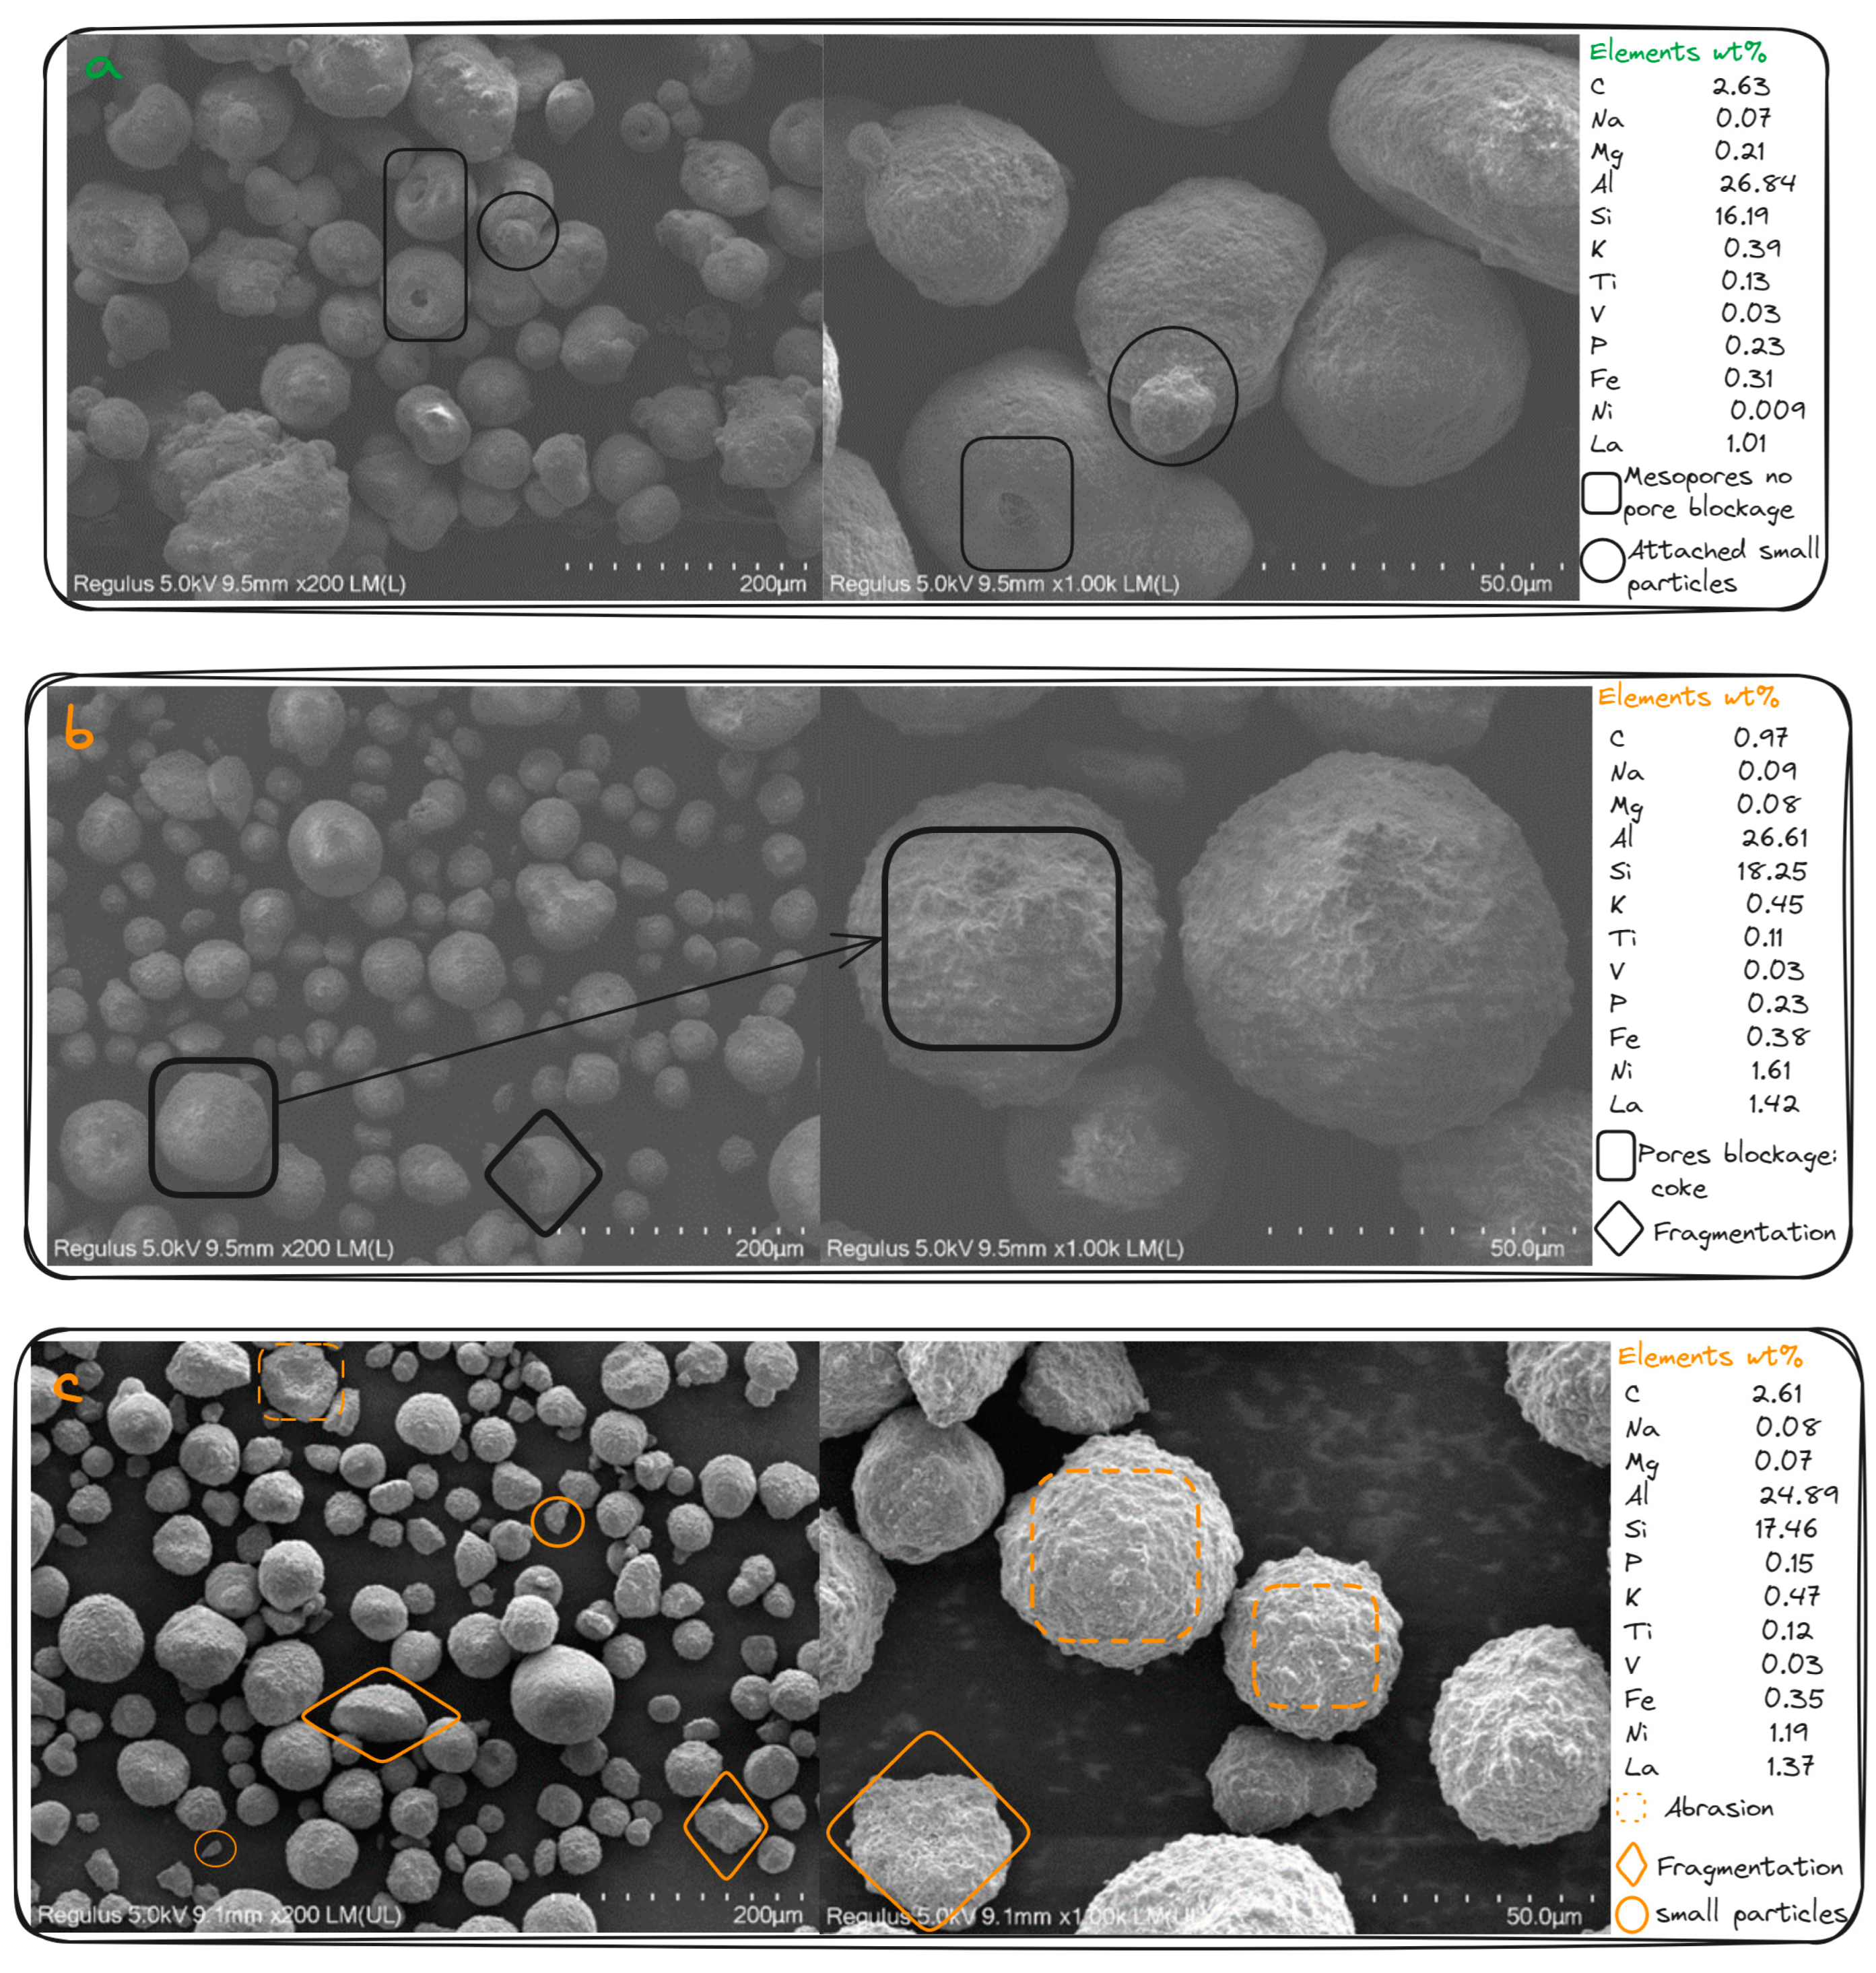
Figure 7.
Mass loss for each zone: (I) fresh catalyst, (II) regenerated catalyst, (III) spent catalyst, and (IV) Plot of over 1000/T.
Figure 7.
Mass loss for each zone: (I) fresh catalyst, (II) regenerated catalyst, (III) spent catalyst, and (IV) Plot of over 1000/T.
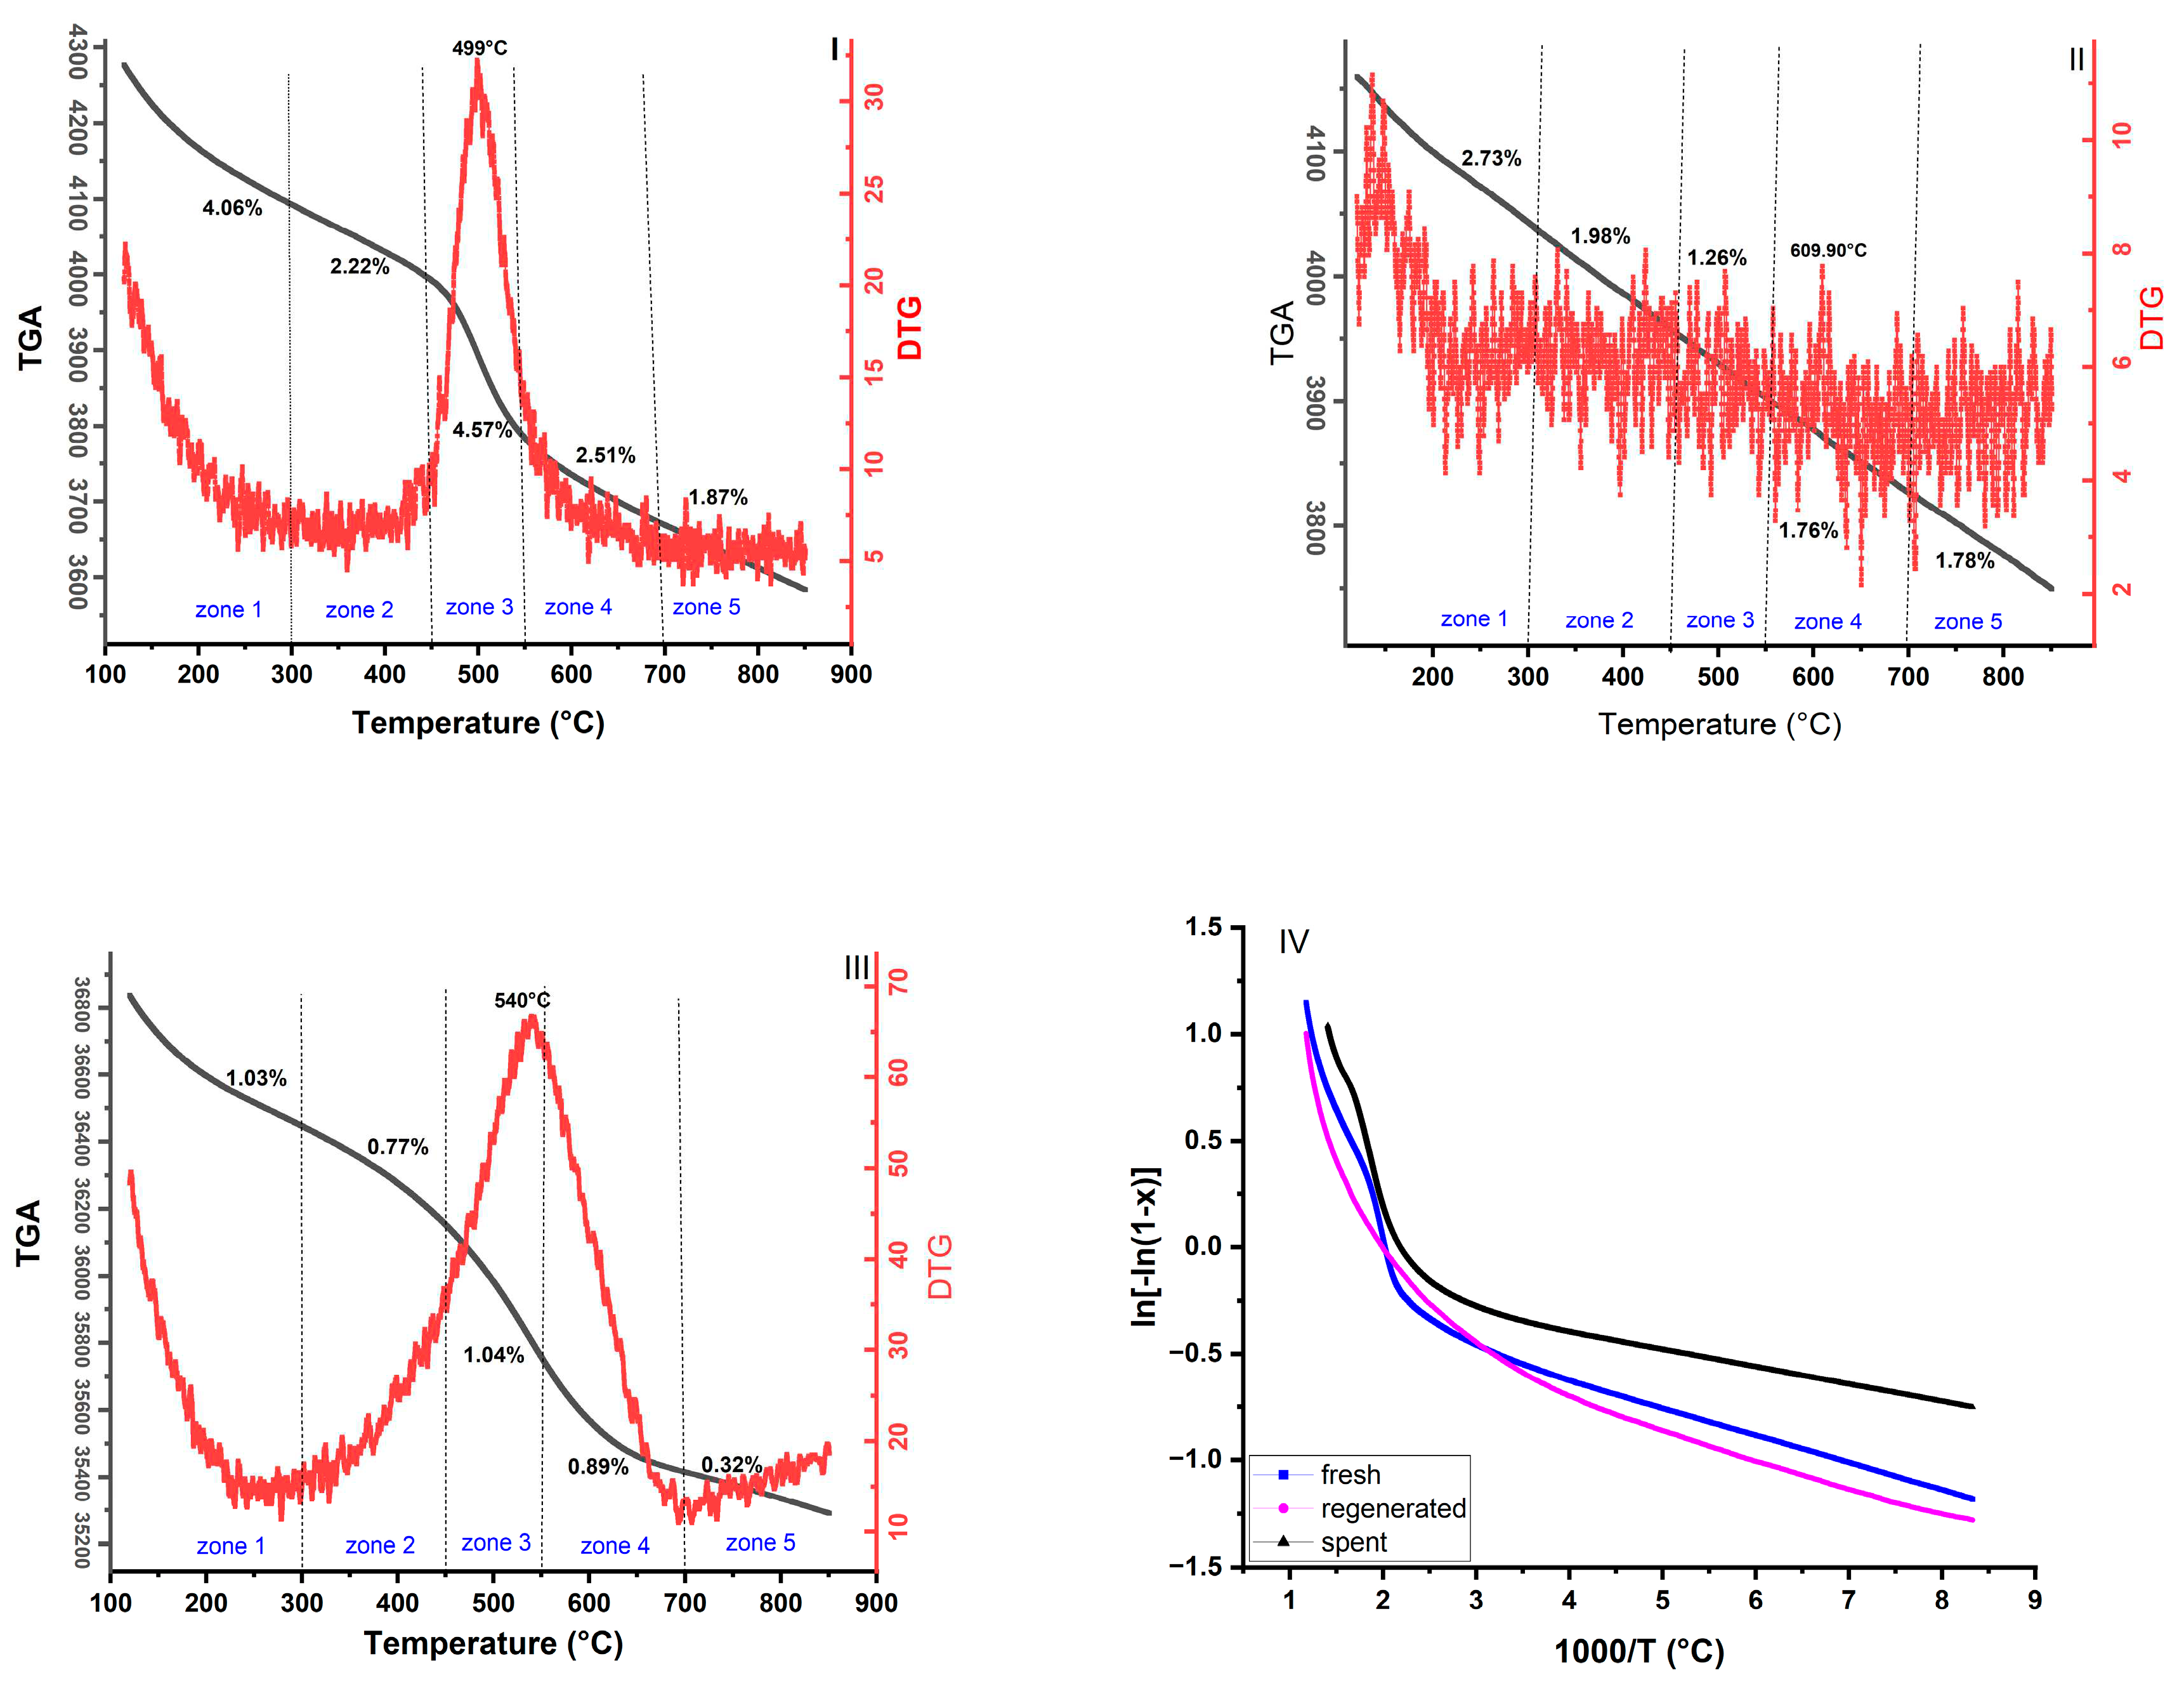

Table 1.
Feedstock properties [26].
Table 1.
Feedstock properties [26].
| Item | value |
|---|---|
| Density (20°C) | 0.9215 g/cm3 |
| API | 22.054 |
| Aniline point | 52.9 °C |
| Residual carbon | 5.5% |
| Ni | 22.9 ppm |
| V | 0.3 ppm |
| Fe | 3.2 ppm |
| Sulfur content | 0.24 m% |
| Nitrogen content | 0.17 m% |
| Molecular weight | 462 |
| Distillation TBP | °C |
| 50% | 343.0 |
| 90% | 378.0 |
| 95% | 385.0 |
Table 2.
Textural properties derived from N2 adsorption at 77°K of the tested catalysts.
| Samples |
SBET (m2g-1) |
Sext (m2g-1) |
Smicro (m2g-1) |
Vtotal (cm3g-1) |
Vmicro (cm3g-1) |
Microporosity (%) |
|---|---|---|---|---|---|---|
| Fresh | 158.13 | 94.24 | 63.8825 | 0.147 | 0.028 | 40.39 |
| Regenerated | 76.78 | 38.55 | 38.2327 | 0.098 | 0.017 | 49.79 |
| Spent | 57.45 | 28.87 | 28.5726 | 0.077 | 0.012 | 49.73 |
Microporosity = (Micropore Area / BET Surface Area)*100.
Table 3.
Composition of catalyst samples (mass %) from XRF analysis.
| property | Fresh | Regenerated | Spent |
|---|---|---|---|
| Metal Composition (%) | |||
| CO2 | 9.64 | 3.56 | 9.58 |
| N | 0.27 | ||
| Na2O | 0.10 | 0.12 | 0.11 |
| MgO | 0.35 | 0.14 | 0.11 |
| Al2O3 | 50.71 | 50.28 | 47.04 |
| SiO2 | 34.65 | 39.04 | 37.35 |
| P2O5 | 0.51 | 0.54 | 0.35 |
| SO3 | 0.33 | 0.2 | 0.26 |
| K2O | 0.47 | 0.54 | 0.56 |
| CaO | 0.07 | 0.12 | 0.10 |
| TiO2 | 0.22 | 0.19 | 0.20 |
| V2O5 | 0.06 | 0.05 | |
| Fe2O3 | 0.44 | 0.55 | 0.50 |
| Co2O3 | 0.12 | 0.08 | |
| NiO | 2.05 | 1.52 | |
| CuO | 0.004 | ||
| ZnO | 0.003 | 0.013 | 0.008 |
| Ga2O3 | 0.012 | 0.012 | 0.010 |
| GeO2 | 0.004 | ||
| Rb2O | 0.002 | 0.003 | |
| Y2O3 | 0.66 | 0.14 | 0.08 |
| ZrO2 | 0.003 | 0.004 | |
| Sb2O3 | 0.05 | 0.02 | |
| La2O3 | 1.18 | 1.66 | 1.61 |
| CeO2 | 0.48 | 0.32 | |
Table 4.
Kinetic and thermodynamic parameters of each zone of tested catalyst samples.
| . | . | Fresh catalyst | Regenerated catalyst | Spent catalyst | |||||||||||||||
|---|---|---|---|---|---|---|---|---|---|---|---|---|---|---|---|---|---|---|---|
| Zone | T °C | Ea Jmol-1 (*102) |
Jmol-1 (*10-2) |
Jmol-1K-1 (*105) |
Jmol-1 (*106) |
Fitting equation | R2 | Ea Jmol-1 (*102) |
Jmol-1 (*10-2) |
Jmol-1K-1 (*105) |
Jmol-1 (*106) |
Fitting equation | R2 | Ea Jmol-1 (*102) |
Jmol-1 (*10-2) |
Jmol-1K-1 (*105) |
Jmol-1 (*106) |
Fitting equation | R2 |
| 1 | 100-300 | 10.85 | -3.03 | 51.73 | 5.34 | Y= -0.13065x-0.0994 | 0.99 | 12.37 | -3.02 | 58.93 | 6.06 | Y= -0.1488x-0.0984 | 0.99 | 42.45 | -2.86 | 202.24 | 20.38 | Y= -0.5106x+0.5913 | 0.98 |
| 2 | 300-450 | 21.44 | -3.00 | 128.89 | 13.10 | Y= -0.2579x+0.318 | 0.98 | 31.01 | -2.94 | 186.42 | 18.85 | Y= -0.373x+0.6749 | 0.99 | 66.63 | -2.84 | 400.58 | 40.26 | Y= -0.8015x+1.0601 | 0.97 |
| 3 | 450-550 | 133.44 | -2.63 | 913.11 | 91.52 | Y= -1.605x+3.2677 | 0.98 | 52.08 | -2.88 | 356.37 | 35.87 | Y= -0.6264x+1.252 | 0.99 | 201.00 | -2.59 | 1380 | 138 | Y= -2.4176x+3.296 | 0.98 |
| 4 | 550-700 | 77.43 | -2.82 | 626.40 | 62.91 | Y= -0.9313x+2.0443 | 0.99 | 79.01 | -2.84 | 639.18 | 64.19 | Y= -0.9503x+1.8307 | 0.99 | 190.16 | -2.65 | 1540 | 154 | Y= -2.2872x+3.2081 | 0.97 |
| 5 | 700-850 | 137.75 | -2.72 | 1290 | 129 | Y= -1.6568x+3.0534 | 0.98 | 164.49 | -2.69 | 1540 | 154 | Y= -1.9784x+3.275 | 0.98 | 134.56 | -2.77 | 1260 | 126 | Y= -1.6185x+2.4638 | 0.98 |
Disclaimer/Publisher’s Note: The statements, opinions and data contained in all publications are solely those of the individual author(s) and contributor(s) and not of MDPI and/or the editor(s). MDPI and/or the editor(s) disclaim responsibility for any injury to people or property resulting from any ideas, methods, instructions or products referred to in the content. |
© 2023 by the authors. Licensee MDPI, Basel, Switzerland. This article is an open access article distributed under the terms and conditions of the Creative Commons Attribution (CC BY) license (http://creativecommons.org/licenses/by/4.0/).
Copyright: This open access article is published under a Creative Commons CC BY 4.0 license, which permit the free download, distribution, and reuse, provided that the author and preprint are cited in any reuse.


