
Submitted:
18 October 2023
Posted:
19 October 2023
You are already at the latest version
Abstract
Diarrhea and fever are prevalent childhood illnesses with potentially severe consequences, especially when they co-occur. This study investigates the prevalence and determinants of diarrhea, fever, and their coexistence among children under-five in Bangladesh. Data from the 2017-18 Bangladesh Demography and Health Survey (BDHS) were analyzed using multivariable stepwise logistic regression with backward selection. This study found that 5.0% for diarrhea, 34.0% for fever, and 3.0% for the coexistence of both illnesses. Common factors associated with childhood diarrhea and fever included the mother's education, her attitude toward wife-beating, and the child’s age (12-23 months). Diarrhea was associated with households with improved water sources and children in the Barisal division, while fever was linked to underweight children and those from more affluent backgrounds. The coexistence of both was significantly linked to underweight children, higher birth orders, and children from the Rajshahi division. Notably, child illnesses were associated with parental education, higher socio-economic status, and access to improved drinking water sources. Diarrhea affects one in 20 children, fever affects one in three, and the coexistence of both conditions affects one in 35 children in Bangladesh. The findings need further research and policy reviews to develop effective interventions and improve child health in Bangladesh.
Keywords:
children
; morbidity
; comorbidity
; determinants
; Bangladesh
1. Introduction
Diarrhea and fever in children are two serious public health problems in low- and middle-income countries. Worldwide diarrhea alone contributes to around 0.5 million under-five children’s death every year and is the second leading cause of death in children under five years old [1,2]. Globally, there are nearly 1.7 billion cases of childhood diarrhea are recorded every year [2,3]. According to UNICEF (2021), approximately 5 million under-five children died worldwide, of which, about 30% were attributed due to infectious diseases, many of which present with diarrhea and fever [4,5]. Fever in children occurs mostly due to an infection (such as strep throat, the flu, chickenpox, pneumonia), inflammation and trauma [6], malaria, dengue, chikungunya, typhoid, and diarrhea [7]. Developing countries often face a high burden of childhood illness due to several factors, including poor living conditions, limited access to healthcare, inadequate nutrition, and exposure to infectious diseases.[8] Diarrhea and fever are common health problems among children under-five in Bangladesh, as in many other developing countries [9].
Both the fever and diarrhea are among the top three causes of mortality among children in Bangladesh [1,7]. Although the under-five child mortality has decreased from 44/1000 live births in 2011 to 27/1000 in 2021 [10,11] and achieved the Millennium Development Goal-4 (MDG-4) target of 48/1000 LBs by the year 2015, childhood illness has not declined at the same pace [1]. Every year in Bangladesh approximately 0.5 million children's deaths occur due to diarrhea which is more than AIDS, malaria, and measles combined [7]. However, metrics with regard to under-five child deaths due to fever are yet to be revealed [12].
Factors associated with childhood diarrhea and fever are multifaceted, and both outcomes had complex interplay with maternal-child factors (e.g. mothers’ education, unemployment status of mothers, age of children, infant and child feeding practice), environmental factors (e.g. drinking water, type of toilet facilities, household waste, and hygiene) and socioeconomic status in developing countries including Bangladesh, Ghana, Senegal, and Ethiopia [1,9,13,14,15,16]. However, factors associated with the coexistence of diarrhea and fever among under-five children are still underreported in Bangladesh. An earlier study in Bangladesh reported that poor socio-economic status and untreated water supply were associated with the coexistence of diarrhea and cough [17]. Diarrhea and fever when they occur together in children can create an adverse health hazard, such as malnutrition, increased risk of infections, electrolyte imbalances, reduced cognitive function, and others [18,19,20]. To the best of our knowledge, there has been no study conducted in Bangladesh using the most recent nationally representative survey to explore the factors linked to the coexistence of diarrhea and fever. Therefore, this study aims to determine the factors associated with diarrhea, fever, and the coexistence of diarrhea and fever among under-five children in Bangladesh based on the most recent Bangladesh Demographic and Health Survey.
2. Materials and Methods
2.1. Study Design and Participants
Cross-sectional data from a nationally representative sample namely the Bangladesh Demographic and Health Survey 2017-18 (BDHS 2017-18) was used in this study. In BDHS 2017-18, the data collection was started in October 2017 and finished in March 2018.
In BDHS 2017-18, used multistage stratified sampling technique was used to collect the data. At the first stage, the BDHS selected a total of 672 primary sampling units (PSUs) (192 PSUs from urban and 480 PSUs from rural) from 293,579 PSUs (according to the national census 2011) using probability proportional to EA size. In the second stage, 20,160 households were selected for data collection with 30 households from each selected PSU using an equal probability systematic sampling technique. This multistage sampling technique, including its sampling weight, helps reduce potential sampling bias. In the BDHS data, sample weights were calculated in each sampling stage, and each cluster and stratum were considered that had been adjusted for non-response to obtain the final standard weights. In addition, all ever-married women aged 15–49 years with children aged less than 5 years from the preselected households were interviewed without replacement and change in the implementing stage to prevent selection bias. Women verbal consent for collecting children’s data, including demography, health, and nutrition. A total of 8,759 children under-five were listed, and a further 7,663 children were selected for analysis after excluding missing information (see Figure 1). Detail description was found in the BDHS 2017-18 report [7].
2.2. Outcome Variables
The outcome variables were diarrhea, fever, and the comorbid condition of diarrhea and fever among under-five children. In BDHS 2017-18, Diarrhea refers to children who had diarrhea in the 2 weeks preceding the survey and received oral rehydration solution (ORS), and advice or treatment from health facilities or qualified health providers [7]. Fever refers to children who had a fever prior to two weeks of the survey and received advice or treatment from health facilities or qualified health providers [7]. The coexistence of diarrhea and fever refers to the simultaneous presence of both illnesses in a child in the two weeks preceding the survey.
2.3. Independent Variables and Operational Definition
Variables found significantly associated with child illness in various studies were included in this study [1,9,13,14,15,16,17,18,19,21,22]. Variables including maternal characteristics were age of the mothers (in years) (15-19, 20-24, 25-29, 30-34, 34-39, ≥ 40), parents’ education (both parents uneducated, only father uneducated, only mother uneducated, both parents educated), mothers’ currently working (no, yes), underweight mother (no, yes), mothers received antenatal care (no, yes), mothers received postnatal care (no, yes), mothers attitude toward wife-beating (not justified, justified), mother’s decision-making autonomy (practiced, not practiced). Child characteristics include the age of the children (0-11 months, 12-23 months, 24-35 months, 36-47 months, 48-59 months), sex of the children (male, female), underweight children (no, yes), birth order of children (first, second, third, fourth and above), and small birth weight (no, yes, not weighted). Household characteristics include mass media exposure (no, yes), source of drinking water (improved, unimproved), type of toilet facility (improved, unimproved), and solid waste use in cooking (no, yes). Finally, contextual factors were wealth index (poorest, poorer, middle, richer, richest), place of residence (urban, rural), and region of residence (Barisal, Chattogram, Dhaka, Khulna, Mymensingh, Rajshahi, Rangpur, Sylhet). Supplementary Table S1 contains the operational definitions for reference.
2.4. Statistical Analyses
The background characteristics of the respondents were assessed using descriptive statistics. Bivariate analysis (Chi-square test) was used to explore the prevalence of diarrhea, fever, and the coexistence of diarrhea and fever. The stepwise logistic regression with backward elimination analysis was used to identify the factors associated with diarrhea, fever, and comorbid conditions of diarrhea and fever. Variables found significant at p < 0.25 in the Chi-square test were entered into the regression analysis [23,24,25]. The results of regression analysis were assessed using odds ratios (ORs) and 95% confidence interval (CI) where p<0.05. To control the effect of the complex survey design (multistage sampling stage including its sampling weight), bivariate analysis analyses of this study were performed using Stata's 'svyset' command. Variance Inflation Factor (VIF) was used to evaluate the possible collinearity, and there was no multicollinearity problem identified among the study variables (VIF<5 for all variables). All statistical analyses were performed in Stata version 17 (StataCorp LP, College Station, Texas).
3. Results
3.1. Background Characteristics
More than one-third (35.0%) of the total mothers belonged to the age group 20-24 years. Only 7.0% (3.8%+3.2%) of mothers had no formal education. Two out of five mothers (59.0%) were underweight. Furthermore, more than half (52.2%) of the children were male More than 40.0% of children belonged to poor socio-economic status. Approximately two-thirds (66.0%) of children were living in rural areas of Bangladesh (see Table 1).
3.2. Prevalence of Diarrhea, Fever, and Coexistence of Diarrhea and Fever
The overall prevalence of diarrhea, fever, and coexistence of diarrhea and fever among children under 5 were approximately 5.0%, 34.0%, and 3.0%, respectively. Children aged 12-23 months (9.1%), children of mothers with no formal education (when fathers were educated) (8.7%), children of teenaged (15-19 years) mothers (6.4%), children from the socio-economically middle class (6.1%), and children of mothers with no justified attitude towards wife-beating (5.2%) had a significantly higher prevalence of diarrhea (see Table 2).
Similarly, fever was more common among children aged 12-23 months with a prevalence of 40.0%, and those who were underweight (38.5%). It was also higher in children whose mothers had a justified attitude towards wife-beating (38.7%) and received postnatal care (38.2%). Children of fourth and higher birth order had a significantly higher prevalence of fever (37.0%) (see Table 2).
Children aged 12-23 months (4.8%) and those with a second birth order (3.4%) had a significantly higher prevalence of coexistence of fever and diarrhea. Additionally, the prevalence of this coexistence of fever and diarrhea was higher among children of underweight mothers (3.8%) and those whose mothers had a justified attitude towards wife-beating (2.9%) (see Table 2).
Children aged 12-23 months had a significantly higher likelihood of getting diarrhea with an odd of 6.46 (Adjusted odds ratio (AOR): 6.46, 95% CI: 4.12-10.13, p < 0.001) compared to children aged 48-59 months. Children of mothers with no formal education (AOR=1.87, 95% CI=1.16-3.02, p = 0.010) and children from the Barisal division (AOR = 1.69, 95% CI=1.06-2.70, p=0.027) were significantly associated with diarrhea. Contrary, children from socio-economically richer (AOR=0.62, 95% CI=0.43-0.89, p = 0.010) and household with unimproved water sources (AOR=0.66, 95% CI=0.47-0.94, p = 0.021) negatively impacted childhood diarrhea (Table 3).
For the outcome, fever, children aged 12-23 months (AOR = 1.78, 95% CI =1.53-2.08, p = <0.001), being underweight (AOR = 1.36, 95% CI=1.21-1.53, p <0.000) and fourth & above birth ordered children (AOR = 1.27, 95% CI =1.08-1.49, p = 0.005) were associated with fever. On the other hand, the children of mothers with no formal education (when fathers were educated) had 15.0% (AOR = 0.85, 95% CI =0.72-1.00, p = 0.046) lower chances of getting fever than children with educated parents (Table 3).
Similarly, children aged 12-23 months (AOR = 5.17, 95% CI =2.94-9.12, p <0.001); from the Rajshahi division (AOR = 2.21, 95% CI =1.34-3.64, p = 0.002); being underweight 1.44, 95% CI =1.04-1.99, p = 0.028) were associated with the coexistence of diarrhea and fever. On the other hand, children with educated mothers had 49.0% (AOR = 0.51, 95% CI= 0.29-0.91, p= 0.023) lower chances of having a coexistence of diarrhea and fever than children of educated parents (Table 3).
4. Discussion
The overall prevalence of diarrhea, fever, and coexistence of diarrhea and fever among children under-five were around 5.0%, 34.0%, and 3.0%, respectively in Bangladesh. The prevalence of diarrhea was higher in some neighboring countries, such as 29% in Afghanistan, 19% in Pakistan, and 10% in Myanmar, followed by 9% in India, 8% in Nepal, and 4% in Maldives [22,26]. Similarly, the prevalence of fever in Bangladesh was followed by Afghanistan (29%), Myanmar (24%) and Nepal (21%). However, the prevalence of fever was higher in Pakistan (38%) compared to Bangladesh [26]. While the reporting of the coexistence of diarrhea and fever was inadequate in Bangladesh, it is noteworthy that the prevalence of the coexistence of multiple illnesses was higher in Pakistan compared to Bangladesh, regardless of the combination of diarrhea and fever [27,28]. In addition, the prevalence of diarrhea and coexistence of diarrhea and fever was significantly higher among children aged 12-23 months and fever was highly prevalent among children born with low birth weight.
This study also found that mothers with no formal education, children less than 2 years of age, and children from the richest socioeconomic status were critical factors associated with childhood diarrhea. Most of these factors were thoroughly examined and identified previously in Bangladesh, India, Pakistan, Nepal, and other African countries [9,27]. Despite notable advancements in women's education at all levels in Bangladesh, a significant proportion of females in the country still face inadequate access to education [29]. Additionally, the combination of poor-quality education, limited coverage and implementation of health education, as well as poverty, can have an impact on children's health [30,31]. Children under two years of age is critical for the health and development of children [32]. Factors such as inappropriate and imbalanced initiation of dietary patterns, an immature immune system, lack of previous exposure to pathogens like diarrheal-causing viruses, bacteria, or parasites, and a weakened digestive system in this age interval can adversely affect children's health [32,33]. Even children from higher socioeconomic backgrounds, who may have better access to resources and living conditions, can still experience diarrhea due to various reasons, such as consumption of stored, processed, raw, or undercooked food, overuse or misuse of antibiotics, and imbalanced dietary patterns [34,35]. Furthermore, research findings indicate that children from the Barisal division (southern region) have a higher likelihood of experiencing diarrhea. This increased prevalence can be attributed to climate change, frequent natural disasters, salinity, and land degradation, which have limited dietary diversity and created a substantial burden of adverse health effects in this particular region [36]. Remarkably, it was identified that an improved source of drinking water is a significant contributing factor to diarrhea among children under-five in Bangladesh. This could be attributed to various reasons, such as contamination during storage and handling, insufficient sanitation practices, issues with piped water distribution, unsafe water treatment practices, and other related factors [37]. To mitigate the adverse health outcomes in children, it would be beneficial to design and implement effective health interventions, preventive measures, and coverage that incorporate evidence-based health education, awareness programs, maternal reproductive and child health education, as well as appropriate sanitation and hygiene practices.
Educated parents, mothers justified wife beating, moderate-to-high socio-economic status, children less than 2 years of age, underweight children, and fourth and above birth order children had significant effects on childhood fever. The findings partially concurred with the previous studies conducted in Bangladesh, India, and other African countries [5,9,17,21,38]. The educational attainment of both parents is often linked to a higher socioeconomic status, leading to both parents engaging in income-generating activities. This can result in limited availability of time for children and potentially poor parenting practices, which may have negative effects on children's health [39]. Women who feel unfairly burdened by traditional gender roles in the household can create a stressful and emotionally unstable environment for their children, which can strain the parent-child relationship and lead to adverse health outcomes for the children [40,41]. Childhood undernutrition was another key factor associated with increased illness [42]. Although there is limited research on the relationship between birth order and children's health, studies have indicated that later-born children in larger families may face an elevated risk of hospitalization for infections, respiratory diseases, and issues related to the eyes and ears, possibly due to receiving less parental attention [43]. First-born children tend to receive more parental time and attention compared to their siblings, while subsequent children may receive less quality time during their early years. This discrepancy in parental attention can contribute to adverse health outcomes such as fever in children of higher birth order [44].
The coexistence of diarrhea and fever and the factors associated with it in Bangladesh has not been well documented. The current study found that only the mother’s educational status (the father has no formal education) is a protective factor against the coexistence of diarrhea and fever rather than both parents’ educational status. In addition, mothers do not justify wife-beating, children less than two years of age, underweight children, and Rajshahi division (mid-western region) were the key factors associated with the coexistence of diarrhea and fever. Some of these results were consistent with previous studies irrespective of the outcome coexistence of diarrhea and fever [27,28]. The mid-western region (Rajshahi division) is one of the climate-vulnerable regions [45,46]. Frequent floods often record the highest temperature, contaminated groundwater, insufficient economic and social benefits, and poor access to basic needs pose a significant threat to human health resulting in poor child health outcomes [45,46,47]. Incorporating better management of climate disasters and water sources improved sanitation and hygiene, and educational intervention with poverty alleviation strategies might improve the situation of childhood illness in this region.
A remarkable finding in a recent study revealed that the educational background of both parents, their rich socioeconomic status, and improved toilet facilities were significant factors linked to childhood illness. This shift in the nature of risk factors, which now includes previously recognized protective factors, has created a challenging situation when addressing childhood illness. The lack of practical knowledge and awareness about illness, along with unhealthy lifestyles among household members, could be contributing to the relevant information gap. Further research is necessary to explore deeper into this subject area.
The main strength of this study was the utilization of a nationally representative cross-sectional sample which covers both rural and urban areas of all districts of the country as well as aids in generalizing the findings in similar settings. Additionally, BDHS 2017-2018 data was collected by using a standard questionnaire, designing a complex survey strategy, and global study model to provide credible results. Despite these advantages, we acknowledged several limitations of this study. As the data was collected based on the mother’s self-reported retrospective information, the information might be affected by recall bias. The cross-sectional nature of the data interferes with drawing causal associations between dependent and independent variables. This study might be limited to generalizing the findings only for low- and middle-income countries.
5. Conclusions
In Bangladesh, the prevalence rates for diarrhea, fever, and the coexistence of these conditions among children can be expressed based on the findings: one in every twenty children experiences diarrhea, one in every three children experiences fever, and one out of every 35 children suffer from the coexistence of these conditions. Parental education, women’s attitude towards wife beating, age of children, underweight children, birth order, wealth index, and region of residence were identified as key determinates of childhood illness. Both parents’ educational status and rich socio-economic status were exceptionally identified as risk factors for childhood illness. Designing an evidence-based health intervention focusing on the current study findings, appropriate planning for the implementation, and incorporating a wide range of community participation from all social classes in both urban and rural areas can help in reducing childhood illness. The study also suggests extensive research and review of previous studies and policies.
Supplementary Materials
The following supporting information can be downloaded at the website of this paper posted on Preprints.org.
Author Contributions
MSI and MRKC conceptualized the basic idea for the study, MRKC performed data management and statistical analysis together with MR and BB. MSI, MRKC, FAB, and HAC prepared the first draft of the manuscript. BB, MR, and MK critically revised the manuscript for intellectual content. All authors have reviewed and approved the final manuscript.
Funding
This research did not receive any funds.
Institutional Review Board Statement
Not applicable.
Informed Consent Statement
The BDHS 2017-18 dataset is publicly available data and authors do not need ethical approval for using it. Informed consent was obtained verbally from each mother of children (every married woman aged 15–49 years) before being enrolled in the study.
Data Availability Statement
The BDHS 2017-18 data is publicly available on the DHS Program's page at https://dhsprogram.com/data/.
Acknowledgments
We thank MEASURE DHS for granting us permission to use the data. We would like to acknowledge the support of the Department of Public Health, First Capital University of Bangladesh, Bangladesh, where this study was conducted. We would also like to acknowledge the support of the University of Gävle, Sweden.
Conflicts of Interest
The authors declare no conflict of interest.
References
- Mahumud, R.A.; Alam, K.; Renzaho, A.M.; Sarker, A.R.; Sultana, M.; Sheikh, N.; Rawal, L.B.; Gow, J. Changes in inequality of childhood morbidity in Bangladesh 1993-2014: A decomposition analysis. Plos one 2019, 14, e0218515. [Google Scholar] [CrossRef]
- WHO. Diarrhoeal disease. World Health Organization (WHO) 2017.
- MacGill, M. What you should know about diarrhea. [cited at March 22, 2021]. Available from: https:// www.medicalnewstoday.com/articles/158634.php 2020.
- UNICEF. Under-five mortality. United Nations Children's Fund 2023.
- Antillón, M.; Warren, J.L.; Crawford, F.W.; Weinberger, D.M.; Kürüm, E.; Pak, G.D.; Marks, F.; Pitzer, V.E. The burden of typhoid fever in low-and middle-income countries: a meta-regression approach. PLoS neglected tropical diseases 2017, 11, e0005376. [Google Scholar] [CrossRef]
- Ogoina, D. Fever, fever patterns and diseases called ‘fever’–a review. Journal of infection and public health 2011, 4, 108–124. [Google Scholar] [CrossRef] [PubMed]
- NIPORT. Bangladesh Demographic and Health Survey 2017-18. National Institute of Population Research and Training (NIPORT), and ICF. Dhaka, Bangladesh, and Rockville, Maryland, USA. 2020.
- Pinzón-Rondón, Á.M.; Zárate-Ardila, C.; Hoyos-Martínez, A.; Ruiz-Sternberg, Á.M.; Vélez-van-Meerbeke, A. Country characteristics and acute diarrhea in children from developing nations: a multilevel study. BMC Public Health 2015, 15, 1–11. [Google Scholar] [CrossRef] [PubMed]
- Rahman, A.; Hossain, M.M. Prevalence and determinants of fever, ARI and diarrhea among children aged 6–59 months in Bangladesh. BMC pediatrics 2022, 22, 1–12. [Google Scholar] [CrossRef]
- MoHFW. Success Factors for Women’s and Children’s Health: Bangladesh. Ministry of Health and Family Welfare (MoHFW), Bangladesh, Partnership for Maternal, Newborn & Child Health, WHO, World Bank and Alliance for Health Policy and Systems Research. 2015.
- WB. Mortality rate, under-5 (per 1,000 live births) - Bangladesh. World Bank 2021.
- BBS. Report on sample vital registration system-2015. Bangladesh Bureau of Statistics [BBS]. Dhaka: Statistics Division, Ministry of Planning 2016.
- Thiam, S.; Diène, A.N.; Fuhrimann, S.; Winkler, M.S.; Sy, I.; Ndione, J.A.; Schindler, C.; Vounatsou, P.; Utzinger, J.; Faye, O. Prevalence of diarrhoea and risk factors among children under five years old in Mbour, Senegal: a cross-sectional study. Infectious diseases of poverty 2017, 6, 1–12. [Google Scholar] [CrossRef]
- Woldu, W.; Bitew, B.D.; Gizaw, Z. Socioeconomic factors associated with diarrheal diseases among under-five children of the nomadic population in northeast Ethiopia. Tropical medicine and health 2016, 44, 1–8. [Google Scholar] [CrossRef]
- Amugsi, D.A.; Aborigo, R.A.; Oduro, A.R.; Asoala, V.; Awine, T.; Amenga-Etego, L. Socio-demographic and environmental determinants of infectious disease morbidity in children under 5 years in Ghana. Global health action 2015, 8, 29349. [Google Scholar] [CrossRef]
- Solomon, E.T.; Gari, S.R.; Kloos, H.; Mengistie, B. Diarrheal morbidity and predisposing factors among children under 5 years of age in rural East Ethiopia. Tropical Medicine and Health 2020, 48, 1–10. [Google Scholar] [CrossRef] [PubMed]
- Kamal, M.M.; Hasan, M.M.; Davey, R. Determinants of childhood morbidity in Bangladesh: evidence from the demographic and health survey 2011. BMJ open 2015, 5, e007538. [Google Scholar] [CrossRef] [PubMed]
- Schlaudecker, E.P.; Steinhoff, M.C.; Moore, S.R. Interactions of diarrhea, pneumonia, and malnutrition in childhood: recent evidence from developing countries. Current opinion in infectious diseases 2011, 24, 496. [Google Scholar] [CrossRef] [PubMed]
- Banga, D.; Baren, M.; Ssonko, N.V.; Sikakulya, F.K.; Tibamwenda, Y.; Banga, C.; Ssebuufu, R. Comorbidities and factors associated with mortality among children under five years admitted with severe acute malnutrition in the nutritional unit of Jinja Regional Referral Hospital, Eastern Uganda. International journal of pediatrics 2020, 2020. [Google Scholar] [CrossRef] [PubMed]
- WHO. More women and children survive today than ever before – UN report. World Health Organization (WHO) 2019.
- Adedokun, S.T.; Yaya, S. Childhood morbidity and its determinants: evidence from 31 countries in sub-Saharan Africa. BMJ Global Health 2020, 5, e003109. [Google Scholar] [CrossRef] [PubMed]
- Paul, P. Socio-demographic and environmental factors associated with diarrhoeal disease among children under five in India. BMC Public Health 2020, 20, 1–11. [Google Scholar] [CrossRef] [PubMed]
- Bursac, Z.; Gauss, C.H.; Williams, D.K.; Hosmer, D.W. Purposeful selection of variables in logistic regression. Source code for biology and medicine 2008, 3, 1–8. [Google Scholar] [CrossRef] [PubMed]
- Thiese, M.S.; Ronna, B.; Ott, U. P value interpretations and considerations. Journal of thoracic disease 2016, 8, E928. [Google Scholar] [CrossRef] [PubMed]
- Kim, J. How to choose the level of significance: A pedagogical note. 2015.
- DHS. Children with fever and diarrhoea. The Demographic and Health Surveys (DHS) Program STATcompiler ICF. Funded by USAID. [cited at November 29, 2021] Available from: http://www.statcompiler.com 2015.
- Hasan, M.M.; Richardson, A. How sustainable household environment and knowledge of healthy practices relate to childhood morbidity in South Asia: analysis of survey data from Bangladesh, Nepal and Pakistan. BMJ open 2017, 7, e015019. [Google Scholar] [CrossRef] [PubMed]
- Rashmi, R.; Paul, R. Determinants of multimorbidity of infectious diseases among under-five children in Bangladesh: role of community context. BMC pediatrics 2022, 22, 1–13. [Google Scholar] [CrossRef]
- Al-Zayed, S.R.; Talukdar, F.; Jahan, F.; Asaduzzaman, T.; Shams, F. Beyond Gender Parity: Actualization of Benefits Verses Fallacy of Promises, A Case Study of Bangladesh; World Bank: 2018.
- Zaidman, E.A.; Scott, K.M.; Hahn, D.; Bennett, P.; Caldwell, P.H. Impact of parental health literacy on the health outcomes of children with chronic disease globally: A systematic review. Journal of Paediatrics and Child Health 2023, 59, 12–31. [Google Scholar] [CrossRef] [PubMed]
- Houweling, T.A.; Kunst, A.E.; Looman, C.W.; Mackenbach, J.P. Determinants of under-5 mortality among the poor and the rich: a cross-national analysis of 43 developing countries. International journal of epidemiology 2005, 34, 1257–1265. [Google Scholar] [CrossRef] [PubMed]
- Chowdhury, M.R.K.; Rahman, M.S.; Khan, M.M.H. Levels and determinants of complementary feeding based on meal frequency among children of 6 to 23 months in Bangladesh. BMC public health 2016, 16, 1–11. [Google Scholar] [CrossRef] [PubMed]
- URMC. Viruses, Bacteria, and Parasites in the Digestive Tract. . Health Encyclopedia, University of Rochester Medical Center 2023.
- Signs, R.J.; Darcey, V.L.; Carney, T.A.; Evans, A.A.; Quinlan, J.J. Retail food safety risks for populations of different races, ethnicities, and income levels. Journal of food protection 2011, 74, 1717–1723. [Google Scholar] [CrossRef] [PubMed]
- Newman, K.; Leon, J.; Rebolledo, P.; Scallan, E. The impact of socioeconomic status on foodborne illness in high-income countries: a systematic review. Epidemiology & Infection 2015, 143, 2473–2485. [Google Scholar]
- Kabir, R.; Khan, H.T.; Ball, E.; Caldwell, K. Climate change impact: the experience of the coastal areas of Bangladesh affected by cyclones Sidr and Aila. Journal of environmental and public health 2016, 2016. [Google Scholar] [CrossRef] [PubMed]
- Hutton, G.; Chase, C. Water supply, sanitation, and hygiene. Injury Prevention and Environmental Health. 3rd edition 2017.
- John, J.; Bavdekar, A.; Rongsen-Chandola, T.; Dutta, S.; Kang, G. Estimating the incidence of enteric fever in children in India: a multi-site, active fever surveillance of pediatric cohorts. BMC public health 2018, 18, 1–6. [Google Scholar] [CrossRef]
- Friedman, S.D. How Our Careers Affect Our Children. Harvard Business Review 2018.
- Cerrato, J.; Cifre, E. Gender inequality in household chores and work-family conflict. Frontiers in psychology 2018, 9, 384557. [Google Scholar] [CrossRef]
- Children, S.t. Gender Roles Can Create Lifelong Cycle of Inequality. Save the Children 2019.
- Walson, J.L.; Berkley, J.A. The impact of malnutrition on childhood infections. Current opinion in infectious diseases 2018, 31, 231. [Google Scholar] [CrossRef] [PubMed]
- Björkegren, E.; Svaleryd, H. Birth order and child health; Working paper: 2017.
- Price, J. Parent-child quality time: Does birth order matter? Journal of human resources 2008, 43, 240–265. [Google Scholar] [CrossRef]
- Haque, A.M.; Salehin, M.A. Climate Change in Bangladesh: Effect versus Awareness of the Local People and Agencies of Rajshahi City. Social Science Journal 2019, 22. [Google Scholar]
- Global, C. Urban development must be planned and climate-resilient – Experience from Rajshahi City, Bangladesh. Climate and Development Knowledge Network 2020.
- Alam, M.Z.; Rahman, M.A.; Al Firoz, M.A. Water supply and sanitation facilities in urban slums: a case study of Rajshahi City corporation slums. American Journal of Civil Engineering and Architecture 2013, 1, 1–6. [Google Scholar] [CrossRef]
Figure 1.
Selection of the sample size.
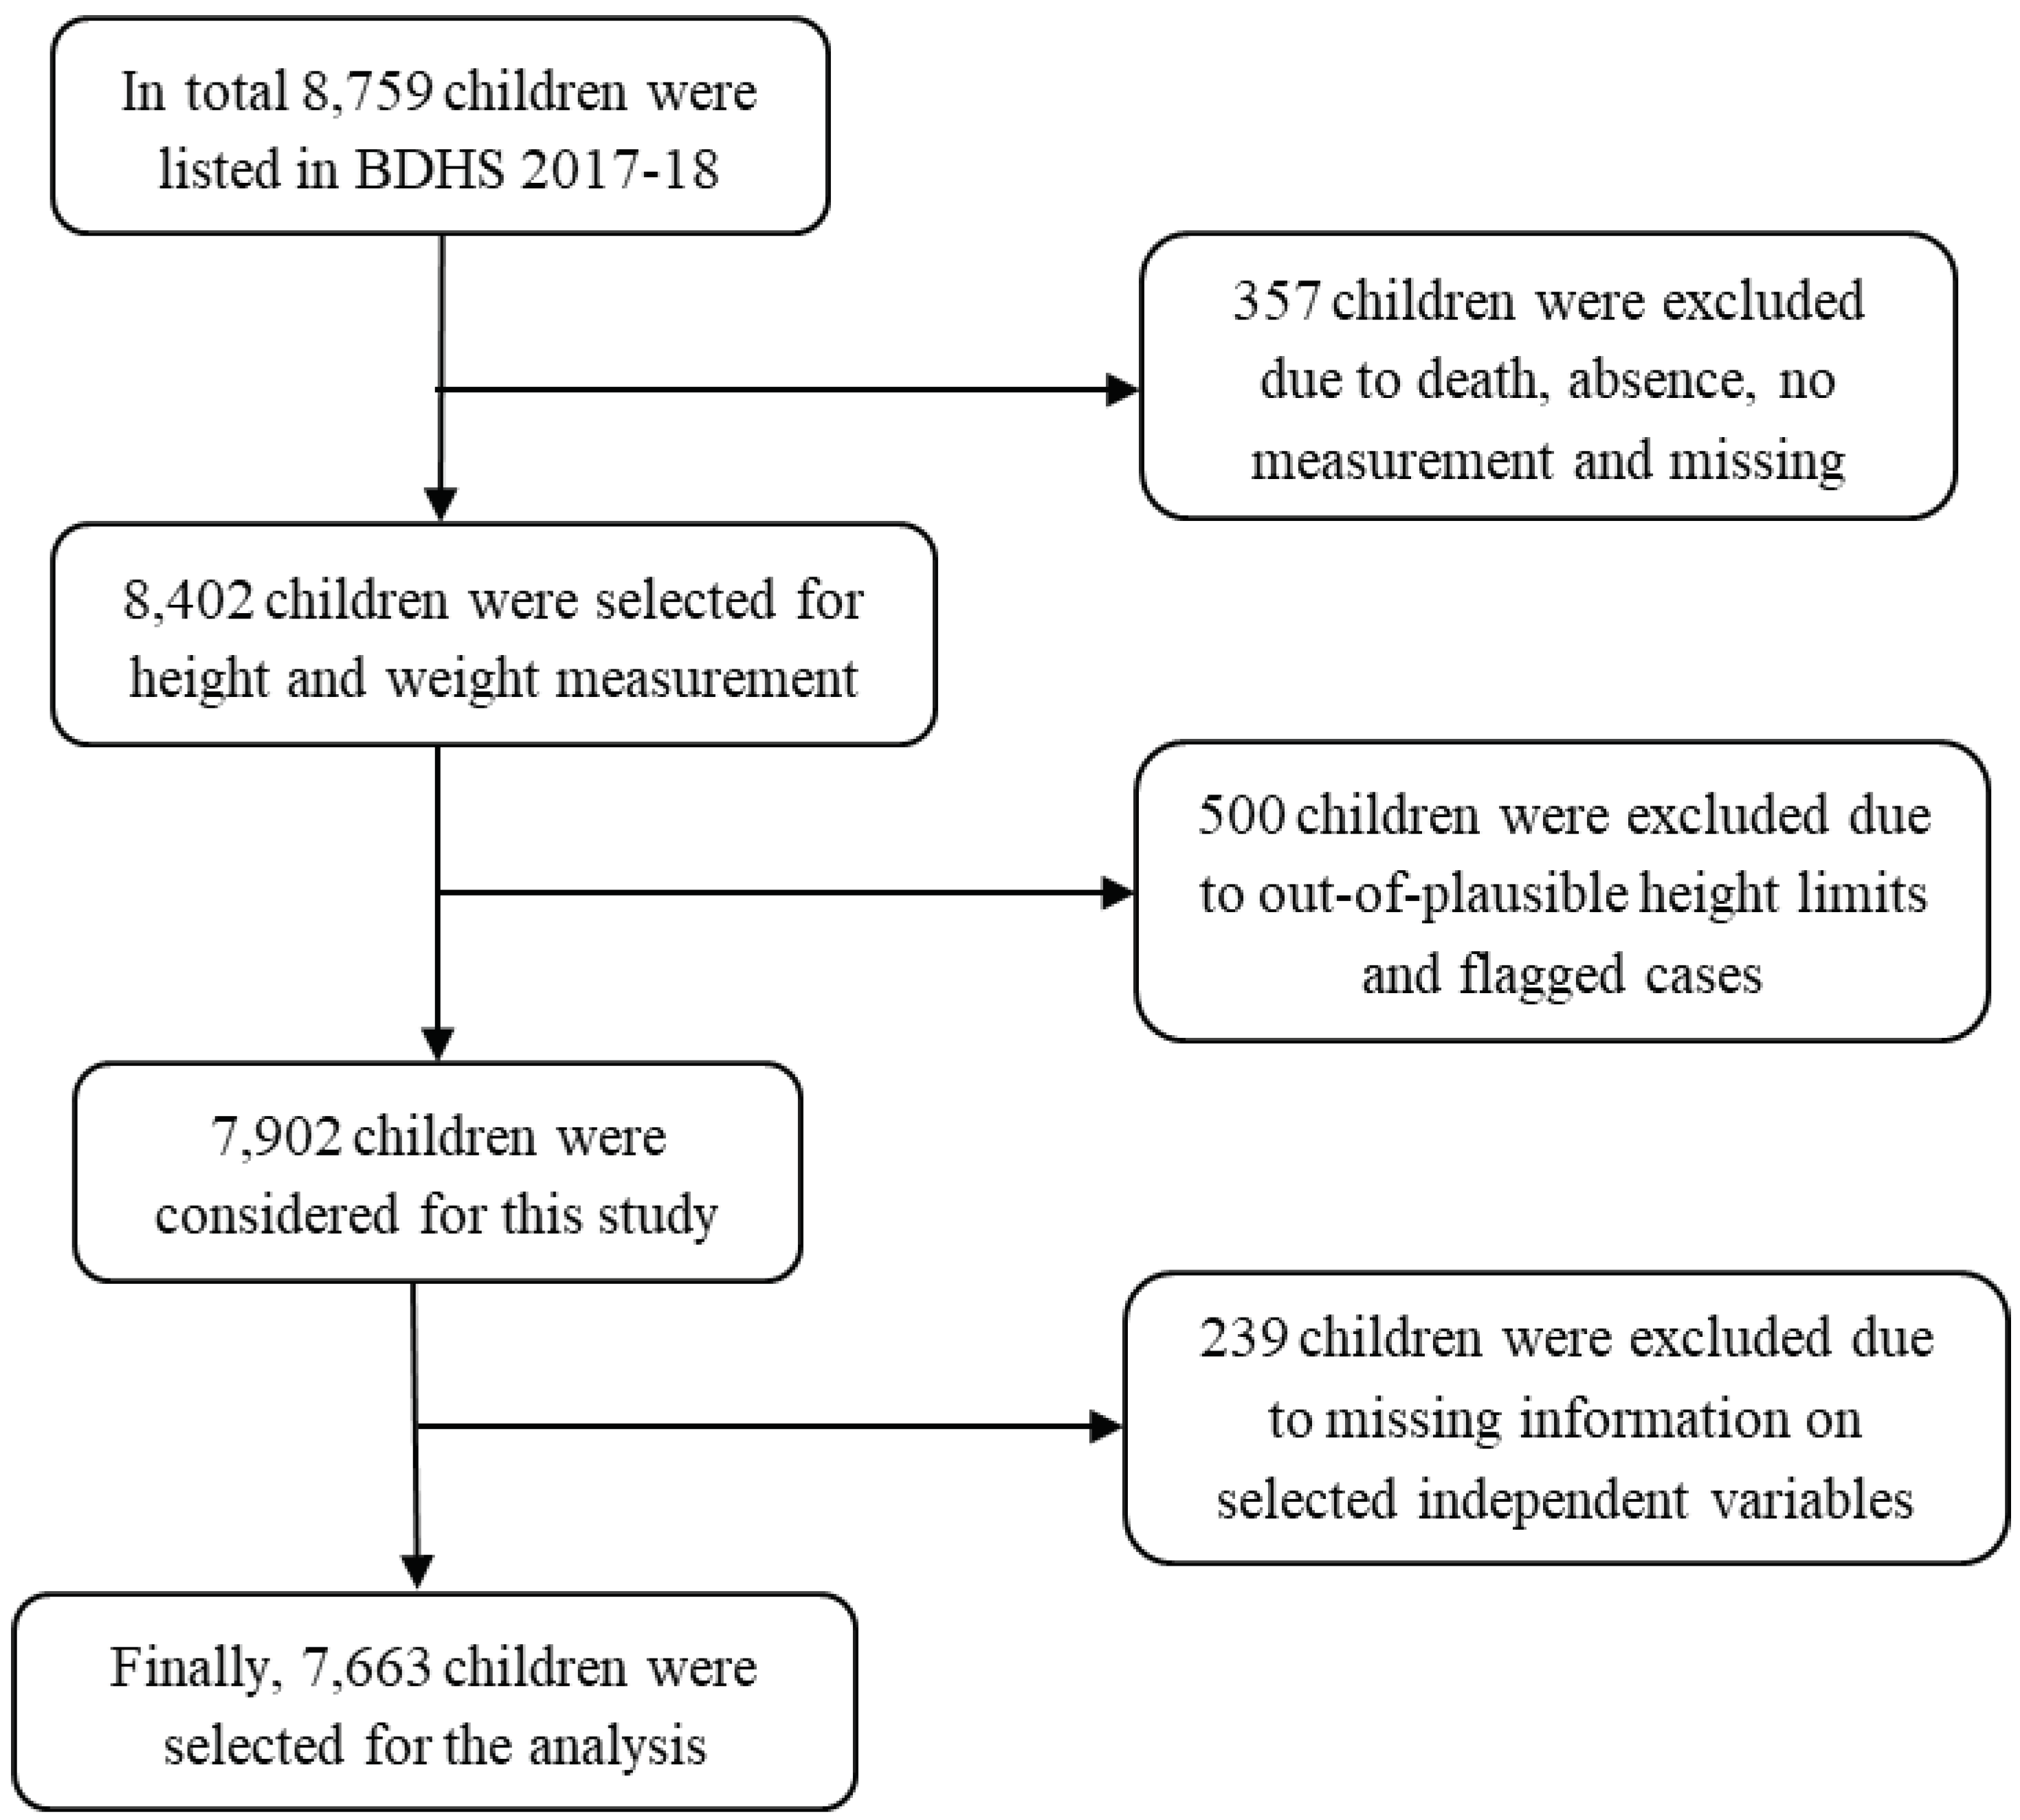

Table 1.
Background characteristics of the study variables.
| Variables | Number | (%) | No of response/ missing or excluded |
|---|---|---|---|
| Total | 7,663 | 100.0 | 8,759/1,096 |
| Dependent variables | |||
| Diarrhea | 8,759/361 | ||
| Fever | 8,759/361 | ||
| Independent variables | |||
| Age of the mothers (in years) | |||
| 15-19 | 938 | 12.2 | 8,759/0 |
| 20-24 | 2,679 | 35.0 | |
| 25-29 | 2,146 | 28.0 | |
| 30-34 | 1,295 | 16.9 | |
| 34-39 | 481 | 6.3 | |
| ≥ 40 | 124 | 1.6 | |
| Parents’ education | |||
| Both parents uneducated | 295 | 3.8 | 8,759/153 |
| Only father uneducated | 865 | 11.3 | |
| Only mother uneducated | 243 | 3.2 | |
| Both parents educated | 6,260 | 81.7 | |
| Mother currently working | |||
| No | 4,561 | 59.5 | 8,759/0 |
| Yes | 3,102 | 40.5 | |
| Underweight mother | |||
| No | 6,537 | 85.3 | 8,759/0 |
| Yes | 1,126 | 14.7 | |
| Mothers received antenatal care # | |||
| No | 364 | 8.0 | 8,759/3,747 |
| Yes | 4,175 | 92.0 | |
| Mothers received postnatal care # | |||
| No | 1,509 | 33.3 | 8,759/ 3,753 |
| Yes | 3,025 | 66.7 | |
| Mother's attitude towards wife beating | 8,759/0 | ||
| Not justified | 6,266 | 81.8 | |
| Justified | 1,397 | 18.2 | |
| Mother’s decision-making autonomy | |||
| No | 6,581 | 85.9 | 8,759/154 |
| Yes | 1,082 | 14.1 | |
| Age of the children | |||
| 0-11 months | 1,677 | 21.9 | 8,759/447 |
| 12-23 months | 1,577 | 20.6 | |
| 24-35 months | 1,481 | 19.3 | |
| 36-47 months | 1,414 | 18.4 | |
| 48-59 months | 1,514 | 19.8 | |
| Sex of the children | |||
| Male | 3,996 | 52.2 | 8,759/0 |
| Female | 3,667 | 47.8 | |
| Underweight children | |||
| No | 5,972 | 77.9 | 8,759/709 |
| Yes | 1,691 | 22.1 | |
| Birth orderof the children | |||
| First | 2,903 | 37.9 | 8,759/0 |
| Second | 2,507 | 32.7 | |
| Third | 1,298 | 16.9 | |
| Fourth and above | 955 | 12.5 | |
| Small birth weight # | |||
| No | 1,816 | 38.3 | 8,759/3,455 |
| Yes | 325 | 6.9 | |
| Not weighted | 2,594 | 54.8 | |
| Mass media exposure | |||
| No | 2,774 | 36.2 | 8,759/0 |
| Yes | 4,889 | 63.8 | |
| Source of drinking water | |||
| Improved | 6,659 | 86.9 | 8,759/0 |
| Unimproved | 1,004 | 13.1 | |
| Type of toilet facility | |||
| Improved | 4,362 | 56.9 | 8,759/0 |
| Unimproved | 3,301 | 43.1 | |
| Solid waste use in cooking | |||
| No | 2,219 | 29.0 | 8,759/6 |
| Yes | 5,444 | 71.0 | |
| Wealth index | |||
| Poorest | 1,707 | 22.3 | 8,759/0 |
| Poorer | 1,545 | 20.2 | |
| Middle | 1,382 | 18.0 | |
| Richer | 1,535 | 20.0 | |
| Richest | 1,494 | 19.5 | |
| Place of residence | |||
| Urban | 2,605 | 34.0 | 8,759/0 |
| Rural | 5,058 | 66.0 | |
| Division | |||
| Barisal | 800 | 10.4 | 8,759/0 |
| Chattogram | 1,246 | 16.2 | |
| Dhaka | 1,079 | 14.1 | |
| Khulna | 810 | 10.6 | |
| Mymensingh | 911 | 11.9 | |
| Rajshahi | 796 | 10.4 | |
| Rangpur | 879 | 11.5 | |
| Sylhet | 1,142 | 14.9 |
#, information available only for children aged 0-23 months.
Table 2.
Prevalence of under-5 child acute morbidity and co-morbidity.
| Variables | Diarrhea | Fever | Comorbidity | |||
|---|---|---|---|---|---|---|
| n | Prevalence (95% CI) | n | Prevalence (95% CI) |
n | Prevalence (95% CI) | |
| Total | 386 | 4.9 (4.3-5.5) | 2561 | 33.7 (32.3-35.2) | 218 | 2.7 (2.3-3.2) |
| Age of the mothers (in years) | ||||||
| 15-19 | 61 | 6.4 (4.9-8.3) | 352 | 37.1 (33.5-40.9) | 39 | 3.9 (2.8-5.5) |
| 20-24 | 141 | 5.2 (4.3-6.2) | 857 | 32.5 (30.4-34.7) | 69 | 2.6 (2.0-3.3) |
| 25-29 | 120 | 5.3 (4.3-6.4) | 732 | 33.8 (31.4-36.3) | 66 | 2.8 (2.1-3.6) |
| 30-34 | 46 | 3.3 (2.4-4.6) | 428 | 33.7 (30.8-36.7) | 32 | 2.5 (1.6-3.7) |
| 34-39 | 12 | 2.7 (1.5-4.8) | 153 | 33.7 (29.0-38.6) | 6 | 1.3 (0.5-3.0) |
| ≥ 40 | 6 | 3.8 (1.5-8.9) | 39 | 30.4 (22.2-40.1) | 6 | 3.8 (1.5-8.9) |
| Chi-square p values | p = 0.008 | p = 0.301 | p = 0.114 | |||
| Parents’ education | ||||||
| Both parents uneducated | 10 | 4.8 (2.5-8.9) | 105 | 34.4 (28.5-40.7) | 6 | 2.8 (1.2-6.2) |
| Only father uneducated | 34 | 3.5 (2.4-4.9) | 276 | 32.4 (28.9-36.0) | 16 | 1.5 (0.9-2.6) |
| Only mother uneducated | 20 | 8.7 (5.5-13.4) | 73 | 29.3 (23.5-35.8) | 10 | 3.7 (1.9,7.2) |
| Both parents educated | 322 | 4.9 (4.3-5.6) | 2107 | 34.0 (32.4-35.7) | 186 | 2.9 (2.4-3.4) |
| Chi-square p values | p = 0.032 | p = 0.467 | p = 0.172 | |||
| Mother currently working | ||||||
| No | 242 | 5.1 (4.5-5.9) | 1552 | 34.4 (32.6-36.2) | 139 | 3.0 (2.5-3.5) |
| Yes | 144 | 4.5 (3.7-5.4) | 1009 | 32.7 (30.7-34.8) | 79 | 2.4 (1.9-3.1) |
| Chi-square p values | p = 0.246 | p = 0.214 | p = 0.175 | |||
| Underweight mother | ||||||
| No | 67 | 6.0 (4.6-7.8) | 2163 | 33.5 (32.0-35.1) | 174 | 2.6 (2.2-3.0) |
| Yes | 319 | 4.7 (4.2-5.3) | 398 | 34.7 (31.4-38.2) | 44 | 3.8 (2.8-5.2) |
| Chi-square p values | p = 0.070 | p = 0.508 | p = 0.021 | |||
| Mothers received antenatal care | ||||||
| No | 27 | 7.5 (4.9-11.3) | 138 | 39.0 (32.8-45.4) | 13 | 3.3 (1.8-5.8) |
| Yes | 285 | 6.6 (5.8-7.5) | 1533 | 36.8 (35.0-38.7) | 163 | 3.8 (3.2-4.5) |
| Chi-square p values | p = 0.216 | p = 0.518 | p = 0.623 | |||
| Mothers received postnatal care | ||||||
| No | 100 | 6.8 (5.6-8.4) | 530 | 34.7 (32.1-37.5) | 55 | 3.7 (2.8-4.8) |
| Yes | 212 | 6.6 (5.7-7.7) | 1140 | 38.2 (36.0-40.4) | 121 | 3.8 (3.1-4.7) |
| Chi-square p values | p = 0.819 | p = 0.040 | p = 0.822 | |||
| Mothers attitude towards wife beating | ||||||
| No | 332 | 5.2 (4.6-5.9) | 2019 | 32.5 (31.0-34.1) | 187 | 2.9 (2.5-3.5) |
| Yes | 54 | 3.4 (2.5-4.6) | 542 | 38.7 (35.8-41.7) | 31 | 1.9 (1.3-2.8) |
| Chi-square p values | p = 0.012 | p = 0.0001 | p = 0.042 | |||
| Mother’s decision-making autonomy | ||||||
| No | 51 | 4.6 (3.4-6.2) | 379 | 34.7 (31.3-38.4) | 192 | 2.8 (2.3-3.2) |
| Yes | 335 | 4.9 (4.3-5.6) | 2182 | 33.5 (32.0-35.1) | 26 | 2.5 (1.7-3.8) |
| Chi-square p values | p = 0.699 | p = 0.521 | p = 0.699 | |||
| Chi-square p values | p = 0.091 | p = 0.009 | p = 0.255 | |||
| Age of the children | ||||||
| 0-11 months | 101 | 5.7 (4.5-7.2) | 608 | 36.8 (34.3-39.5) | 63 | 3.5 (2.6-4.7) |
| 12-23 months | 147 | 9.1 (7.7-10.8) | 635 | 40.0 (37.0-43.1) | 77 | 4.8 (3.8-6.1) |
| 24-35 months | 73 | 5.0 (3.9-6.3) | 488 | 33.3 (30.5-36.3) | 41 | 2.8 (2.0-3.8) |
| 36-47 months | 38 | 2.5 (1.8-3.5) | 413 | 29.4 (26.8-32.1) | 20 | 1.2 (0.8-2.0) |
| 48-59 months | 27 | 1.5 (1.0-2.3) | 417 | 27.9 (25.2-30.7) | 17 | 1.0 (0.6-1.7) |
| Chi-square p values | p<0.001 | p<0.001 | p<0.001 | |||
| Sex of the children | ||||||
| Male | 221 | 5.3 (4.5-6.2) | 1357 | 34.4 (32.7-36.3) | 123 | 3.0 (2.5-3.7) |
| Female | 165 | 4.4 (3.7-5.2) | 1204 | 32.9 (30.9-34.9) | 95 | 2.4 (1.9-3.0) |
| Chi-square p values | p = 0.116 | p = 0.200 | p = 0.130 | |||
| Underweight children | ||||||
| No | 304 | 4.8 (4.2-5.5) | 1908 | 32.4 (30.8-34.0) | 163 | 2.6 (2.2-3.1) |
| Yes | 82 | 5.1 (4.0-6.5) | 653 | 38.5 (35.8-41.3) | 55 | 3.3 (2.4-4.4) |
| Chi-square p values | p = 0.678 | p = 0.0001 | p = 0.170 | |||
| Birth orderof the children | ||||||
| First | 143 | 4.8 (4.0-5.7) | 909 | 31.8 (29.7-33.9) | 78 | 2.5 (2.0-3.2) |
| Second | 144 | 5.6 (4.7-6.8) | 850 | 33.9 (31.7-36.2) | 87 | 3.4 (2.6-4.3) |
| Third | 63 | 4.8 (3.7-6.1) | 454 | 35.2 (32.4-38.1) | 36 | 2.9 (2.0-4.0) |
| Fourth and above | 36 | 3.4 (2.3-4.9) | 348 | 37.0 (33.4-40.7) | 17 | 1.6 (0.9-2.8) |
| Chi-square p values | p = 0.088 | p = 0.036 | p = 0.057 | |||
| Small birth weight | ||||||
| No | 134 | 6.9 (5.7-8.3) | 637 | 35.1 (32.7,37.6) | 77 | 4.0 (3.1-5.0) |
| Yes | 26 | 7.7 (5.1-11.5) | 132 | 41.8 (35.6-48.2) | 12 | 4.0 (2.1-7.2) |
| Not weighted | 163 | 6.3 (5.4-7.4) | 964 | 37.4 (35.2-39.6) | 93 | 3.5 (2.8-4.4]) |
| Chi-square p values | p = 0.616 | p = 0.087 | p = 0.776 | |||
| Mass media exposure | ||||||
| No | 124 | 4.5 (3.6-5.6) | 952 | 34.2 (32.0-36.5) | 68 | 2.6 (1.9-3.5) |
| Yes | 262 | 5.1 (4.4-5.8) | 1609 | 33.4 (31.7-35.2) | 150 | 2.8 (2.3-3.4) |
| Chi-square p values | p = 0.395 | p = 0.545 | p = 0.664 | |||
| Source of water | ||||||
| Improved | 351 | 5.0 (4.5-5.7) | 2247 | 34.0 (32.5-35.5) | 195 | 2.8 (2.4-3.3) |
| Unimproved | 35 | 3.7 (2.7-5.3) | 314 | 31.6 (28.4-35.0) | 23 | 2.4 (1.5-3.7) |
| Chi-square p values | p = 0.089 | p = 0.180 | p = 0.486 | |||
| Type of toilet facility | ||||||
| Improved | 228 | 5.0 (4.3-5.8) | 1450 | 33.7 (31.9-35.5) | 129 | 2.8 (2.3-3.4) |
| Unimproved | 158 | 4.7 (3.9-5.6) | 1111 | 33.7 (31.8-35.7) | 89 | 2.6 (2.0-3.3) |
| Chi-square p values | p = 0.522 | p = 0.952 | p = 0.623 | |||
| Solid waste use in cooking | ||||||
| No | 99 | 4.2 (3.4-5.2) | 669 | 31.1 (28.8-33.6) | 56 | 2.4 (1.8-3.2) |
| Yes | 287 | 5.2 (4.5-5.9) | 1892 | 34.8 (33.1-36.5) | 162 | 2.9 (2.4-3.4) |
| Chi-square p values | p = 0.091 | p = 0.009 | p = 0.255 | |||
| Wealth index | ||||||
| Poorest | 84 | 4.9 (3.8-6.2) | 600 | 35.0 (32.5-37.5) | 47 | 2.7 (2.0-3.8) |
| Poorer | 77 | 4.8 (3.8-6.1) | 522 | 33.5 (30.7-36.5) | 42 | 2.7 (2.0-3.7) |
| Middle | 84 | 6.1 (4.7-7.9) | 471 | 35.0 (32.0-38.1) | 45 | 3.4 (2.4-4.6) |
| Richer | 58 | 3.4 (2.6-4.5) | 537 | 35.0 (32.1-38.0) | 40 | 2.2 (1.5-3.1) |
| Richest | 83 | 5.3 (4.1-6.7) | 431 | 29.6 (26.8-32.6) | 44 | 2.7 (2.0-3.7) |
| Chi-square p values | p = 044 | p = 0.034 | p = 0.484 | |||
| Place of residence | ||||||
| Urban | 132 | 4.6 (3.7-5.7) | 805 | 31.8 (29.4-34.3) | 72 | 2.7 (2.0-3.6) |
| Rural | 254 | 5.0 (4.3-5.7) | 1756 | 34.4 (32.6-36.2) | 146 | 2.8 (2.3-3.3) |
| Chi-square p values | p = 0.567 | p = 0.095 | p = 0.833 | |||
| Division | ||||||
| Barisal | 51 | 6.5 (5.0-8.3) | 296 | 38.3 (34.0-42.7) | 24 | 3.1 (2.0-4.7) |
| Chattogram | 67 | 5.3 (4.1-7.0) | 412 | 33.3 (30.0-36.7) | 43 | 3.3 (2.3-4.7) |
| Dhaka | 44 | 4.1 (3.0-5.4) | 340 | 31.8 (28.5-35.2) | 19 | 1.7 (1.1-2.7) |
| Khulna | 33 | 3.9 (2.8-5.4) | 238 | 31.2 (27.1-35.6) | 18 | 2.2 (1.4-3.5) |
| Mymensingh | 47 | 5.0 (3.7-6.7) | 301 | 33.7 (29.9-37.7) | 30 | 3.2 (2.2-4.5) |
| Rajshahi | 49 | 6.1 (4.6-8.1) | 278 | 35.5 (30.9-40.3) | 29 | 3.6 (2.4-5.4) |
| Rangpur | 37 | 4.5 (3.0-6.7) | 312 | 36.4 (32.2-40.7) | 22 | 2.7 (1.6-4.4) |
| Sylhet | 58 | 4.8 (3.5-6.6) | 384 | 34.3 (31.4-37.2) | 33 | 2.9 (2.0-4.2) |
| Chi-square p values | p = 0.239 | p = 0.297 | p = 0.124 | |||
Notes: CI, Confidence Interval; n, number of children.
Table 3.
Risk factors of under-five child diarrhea, fever, and coexistence of diarrhea and fever.
| Risk factors | Diarrhea | Fever | Coexistence of diarrhea and fever | |||
|---|---|---|---|---|---|---|
| AOR (95% CI) | p values | AOR (95% CI) | p values | AOR (95% CI) | p values | |
| Parents’ education | ||||||
| Both parents uneducated | 1.15 (0.65-2.03) | 0.626 | 0.88 (0.67-1.14) | 0.320 | 1.07 (0.52-2.21) | 0.852 |
| Only father uneducated | 0.70 (0.47-1.04) | 0.081 | 0.85 (0.72-1.00) | 0.046 | 0.51 (0.29-0.91) | 0.023 |
| Only mother uneducated | 1.87 (1.16-3.02) | 0.010 | 0.70 (0.53-0.94) | 0.016 | 1.31 (0.66-2.62) | 0.442 |
| Both parents educated® | 1.00 | 1.00 | 1.00 | |||
| Mother's attitude towards wife beating | ||||||
| No® | 1.00 | 1.00 | 1.00 | |||
| Yes | 0.63 (0.46-0.86) | 0.100 | 1.30 (1.15-1.47) | <0.001 | 0.64 (0.42-0.97) | 0.033 |
| Age of the children | ||||||
| 0-11 months | 3.97 (2.49-6.32) | <0.001 | 1.57 (1.35-1.83) | <0.001 | 3.77 (2.11-6.74) | <0.001 |
| 12-23 months | 6.46 (4.12-10.13) | <0.001 | 1.78(1.53-2.08) | <0.001 | 5.17 (2.94-9.12) | <0.001 |
| 24-35 months | 3.32 (2.06-5.34) | <0.001 | 1.32 (1.13-1.54) | 0.001 | 2.78 (1.52-5.07) | 0.001 |
| 36-47 months | 1.64 (0.96-2.80) | 0.068 | 1.08 (0.92-1.27) | 0.346 | 1.24 (0.62-2.50) | 0.542 |
| 48-59 months® | 1.00 | 1.00 | 1.00 | |||
| Underweight children | ||||||
| No® | 1.00 | 1.00 | ||||
| Yes | 1.36 (1.21-1.53) | <0.001 | 1.44 (1.04-1.99) | 0.028 | ||
| Birth order of the children | ||||||
| First® | 1.00 | |||||
| Second | 1.11 (0.99-1.24) | 0.083 | ||||
| Third | 1.17 (1.02-1.35) | 0.025 | ||||
| Fourth and above | 1.27 (1.08-1.49) | 0.005 | ||||
| Source of drinking water | ||||||
| Improved® | 1.00 | |||||
| Unimproved | 0.66 (0.47-0.94) | 0.021 | ||||
| Wealth index | ||||||
| Poorest | 0.92 (0.65-1.31) | 0.650 | 1.21 (1.03-1.43) | 0.018 | ||
| Poorer | 0.88 (0.62-1.25) | 0.484 | 1.13 (0.96-1.32) | 0.142 | ||
| Middle | 1.12 (0.81-1.56) | 0.487 | 1.22 (1.04-1.44) | 0.011 | ||
| Richer | 0.62 (0.43-0.89) | 0.010 | 1.23 (1.05-1.44) | 0.009 | ||
| Richest® | 1.00 | 1.00 | ||||
| Division | ||||||
| Dhaka® | 1.00 | 1.00 | ||||
| Barisal | 1.69 (1.06-2.70) | 0.027 | 1.80 (0.93-3.46) | 0.079 | ||
| Chattogram | 1.33 (0.96-1.83) | 0.085 | 1.93 (1.24-3.01) | 0.004 | ||
| Khulna | 1.02 (0.65-1.60) | 0.927 | 1.34 (0.73-2.45) | 0.345 | ||
| Mymensingh | 1.24 (0.80-1.91) | 0.336 | 1.85 (1.05-3.25) | 0.033 | ||
| Rajshahi | 1.66 (1.15-2.41) | 0.007 | 2.21 (1.34-3.64) | 0.002 | ||
| Rangpur | 1.08 (0.71-1.64) | 0.715 | 1.54 (0.89-2.66) | 0.121 | ||
| Sylhet | 1.22 (0.79-1.90) | 0.369 | 1.66 (0.93-2.97) | 0.089 | ||
Notes: AOR, Adjusted odds ratio; CI, Confidence Interval and ®, Reference Category.
Disclaimer/Publisher’s Note: The statements, opinions and data contained in all publications are solely those of the individual author(s) and contributor(s) and not of MDPI and/or the editor(s). MDPI and/or the editor(s) disclaim responsibility for any injury to people or property resulting from any ideas, methods, instructions or products referred to in the content. |
© 2023 by the authors. Licensee MDPI, Basel, Switzerland. This article is an open access article distributed under the terms and conditions of the Creative Commons Attribution (CC BY) license (http://creativecommons.org/licenses/by/4.0/).
Copyright: This open access article is published under a Creative Commons CC BY 4.0 license, which permit the free download, distribution, and reuse, provided that the author and preprint are cited in any reuse.


