
Submitted:
18 October 2023
Posted:
19 October 2023
Read the latest preprint version here
Abstract
Silver eel were sampled in 1981 and 1983 in River Brede, Denmark, with outlet to the North Sea. Yellow eel in River Køge-Lellinge, Denmark, with outlet to the Baltic Sea were sampled 1965-1968. Silver eel were aged by burning the otoliths. Silver male ages varied from 4 to 25 years, lengths 30.8 to 45.3 cm, and female silver eel varied from 7 to 25 years, lengths 42.3 to 77.3 cm. von Bertalanffy trajectories of length-at-age of male and female yellow eel were calculated in both rivers. Younger yellow eel had significantly higher annual growth rate compared to older age groups, and females grew significantly faster than males. Two models for natural mortality M were used to estimate number of glass eel needed to produce number of silver eel for each sex and silver age group. Annual silver eel production from River Brede Å was 49.2 kg ha-1, demanding 2,894 glass eel ha-1 and in River Køge-Lellinge, the silver eel production was 48.5 kg ha-1, demanding 5,570 glass eel ha-1. It was calculated that one (0.29 g) thousand glass eel contribute to 8.8 kg silver eel in River Køge-Lellinge, and 17.0 kg silver eel in River Brede. To fulfill the Danish EMP in rivers requires annual stocking of 33 tons or 9.4 million reared on-grown eel (3.5 g) to compensate for 183 tons lost silver eel.
Keywords:
otolith
; ageing
; natural mortality
; linear growth
; growth rate
; silver eel production
; biological production of yellow eel
; von Bertalanffy
; EMP
; stocking
1. Introduction
The European eel stock is panmictic [1] and can be regarded as one single stock throughout its entire range. The sexually mature eels are believed to spawn early in the calender year in the Sargasso Sea. The larvae (leptocephals) drift towards Europe and North Africa, including the Mediterranean Sea, in a assumed 300-day migration and reach the coasts in Europe and North Africa during the following winter and spring. Here the larvae transform into glass eels (about 7.2 cm and 0.29 g), and spread as elver along the coastlines or migrate up the freshwater systems to rivers and lakes. In this phase, which can extend over several years, they are called yellow eels. They feed on a variety of invertebrates and fish species, e.g. [2,3]. During their last summer before migration back to the Sargasso Sea, the yellow eels transform into silver eels with female lengths up to about 150 cm, male silver eels up to about 45 cm, and female silver eel are always larger than about 42 cm and the two sex might grow up to about 25 years. The migration away from freshwater takes place in the autumn months. It is assumed, that the eels only spawn once in their life. The European eel is thus catadromous and semelparous.
The European eel population has declined since the early 1960s, and the current recruitment of glass eel to North Europe is a few percentage of the 1960–1979 reference level [4]. The causes of this decline are probably multiple and complex. And may include a combination of oceanic factors [5,6], and continental factors such as reduction of grow-up habitats, fishing in fresh and saltwater, obstructions to up- and downstream migration for eel at all life stages, mortality in water turbines, pollution, diseases, parasites (e.g. Anguillicola crassus) and bird predation [7,8]. The reduction in glass eel recruitment may have directly affected the density of local eel populations and thus indirectly (through interspecific competition) the growth dynamics and sex ratios of eels, but very little is known about this. To aid recovery and conservation of the eel stock, the European Council adopted a framework regulation [9], requiring each EU Member State to issue, a country national eel management plan (EMP). The goal of this EMP is to ensure spawning escapement of at least 40% of the silver eel production relative to the best estimate of escapement before start of anthropogenic influence. One of the management options acknowledged in the EU regulation is to stock juvenile eel in order to enhance production of silver eel aiming to accomplish the management objective. In Danish freshwater (rivers 15,000 ha and lakes 45,000 ha), the pristine annual silver eel was estimated to 750 tons in rivers and 360 tons in lakes, totally 1,110 tons. Therefore, 40% corresponds to 440 tons of silver eel escapement annually of pristine condition in freshwater [10]. With the present implemented regulations in Denmark (reduced fishing effort, closed fishing periods, increased minimum size of yellow eel), the target of the 40% silver eel production without stocking and fishing in rivers, was estimated to be achieved in year 2080 [10]. To reach the goal earlier, additional eel stocking may be a useful method. To know how much to stock we need the relationship between number of glass eel and the number of produced silver eel.
Since the late 1980s, Denmark has stocked on-grown eel of various sizes in fresh- and salt water. Glass eel are imported each year from France in late winter to early spring. Thereafter, the eel are fed in aquaculture for a couple of months, and afterward stocked in fresh- and saltwater in early summer. The current used individual size of eel in the Danish stocking program is 2 to 5 g, with a mean body mass of 3.5 g. Stocking eel in freshwater in accordance with EMP is preferred to stocking in saltwater. In total in Denmark, 1.35 million on-grown eel (3.5 g) are annually stocked in freshwater and 0.15 million on-grown eel in saltwater (www.Fiskepleje.dk).
Little is known about the relationship between the numbers of glass eel to produce the number of silver eel output, but see [11] and references herein. This relationship is important when evaluating the number of stocked glass eel or on-grown eel to fulfill EMP. One way proposed in this paper could be to calculate the number of glass eel backwards from the known number of male and female silver eel using calculates of growth rates and body mass dependent natural mortality M of yellow eel. If the total number of migrating silver eels in one year is known from a river catchment area, the backward calculations from silver eel might calculate the total number of immigrating glass eel to produce the total number of observed migrating silver eel.
Measurement of biological production in fish species is an important aspect of population dynamics [12,13]. Production is the total elaboration of fish tissue (g) during any time interval ∆t, and the production amount and rate integrates changes in number and body mass. Part of the standing biomass might be able to migrate away from the production site, in this case as silver eel. Purely logically and mathematically, the migrating biomass of silver eel will always be less the total biological production.
The objective of this paper is: 1) to document annual length increment (cm) of yellow eel calculated from aged male and female silver eel respectively. And, 2) examining growth of yellow eel in relation to von Bertalanffy curve-linear growth trajectory of yellow eel and 3) the length preference of silver eel compared to the von Bertalanffy length trajectory. And, 4) from calculated annual natural mortality M of yellow eel, calculate the relationship between number of silver eel produced in a river and estimated number of glass eel needed to produce the number of silver eel. In addition, 5) calculate the biological production and silver eel production in the two rivers. Finally, 6) these relationships were used to calculate the total number of stocked eel needed to fulfil the Danish EMP in rivers.
2. Materials and Methods
2.1. Locations
River Brede
The first part of this study took place in lowland River Brede in West Jutland, Denmark (55.07768, 8.65952) with outlet into the North Sea, stem 49.4 km, catchment area of 425 km2, total wetted area of 65.1 ha and mean annual water discharge 5.4 m3 s-1 [14]. Except for a number of smaller few bogs and ponds, there are no lakes in the river system. The fish fauna in the river system, besides European eel, are brown trout (Salmo trutta) in upper small streams, smelt (Osmerus eperlanus), gudgeon (Gobio gobio), roach (Rutilus rutilus), dace (Leuciscus leuciscus), bream (Abramis brama), rudd (Scardinius erythopthalmus), perch (Perca fluviatilis), pike (Esox lucius) and sticklebacks (Gasterosteus aculeatus and Pungitius pungitius), lampreys (Lampetra fluviatilis, L. planeri and Petromyzon marinus) and plaice (Platichthyes flesus) in the lower stem. The river goes through agriculture areas, is highly regulated, sandy and riverbanks are often supported by fascines, which maybe provide good hiding opportunities for eel. Nothing detailed is known about the food basis for yellow eel in this river.
River Køge-Lellinge
Results from an earlier study in River Køge-Lellinge in Zealand, Denmark [3] were reanalyzed in this study and included in this paper. The locality that was described detailed in [3,15], is highly fertile, fast running lowland river with gravel, stones and waterweeds. Nothing detailed is known about the food basis for yellow eel in this river.
2.2. Sampling, Ageing and Growth
River Brede
The yearly downstream migration of silver eel in River Brede takes place in August, September and October. We collected silver eel in the lower part of the stream, just above the outlet into the North Sea. Upstream a landowner recreational fishing takes place with fyke nets for yellow eel and downstream migrating silver eels. Catches here amount to about 40% of the total estimated annual silver eel production [14], so about 60% of the silver eel production escaped River Brede to the North Sea.
In 1981, we used 22 fyke nets (7 – 9 m long) spread over an experimental river stretch of about 560 m. Fourteen times during the sampling period captured silver eel were marked by fin clipping left and/or right pectoral fins, and after each marking the eel were released upstream the experimental stretch. All marked and recaptured silver eel were measured (total length cm). During the experimental period in 1981, silver eel were random sampled for ageing and sex determination by visual inspecting the gonads [16]. The total number of silver eel produced in the river in 1981 was calculated from marked and recaptured silver eel by the Lincoln-index [14].
Further random sampling of silver eel was repeated in 1983 to increase the number of silver eel for ageing and sex determination and for establishing length /body mass relationship. Body mass (g) of silver eel was calculated from total length: body mass = 1.49 10-3*length3.0316, R2 = 0.95, but these results was only used to calculate biomass of silver eel.
Age and Growth
Otoliths from 498 silver males and 251 silver female eels were aged by burning the otoliths [17,18,19,20].
The mean length 7.19 (cm) and body mass 0.29 (g) of glass eel was calculated from a sample of 194 glass eel [21].
Annual growth rate (∆ cm) from glass eel to silver eel stage of individual yellow eel stage was calculated, assuming linear growth of yellow eel, as: ∆ = (lengthsilver eel - 7.19 cm)/agesilver eel. Glass eel in their first year were assigned to age group 0. Thus, for example, a silver eel in River Brede aged 4 had four growth seasons as yellow eel in freshwater. Therefore, for each single aged silver eel the back calculated length at age as yellow eel was calculated by assuming linear annual growth. Yellow eel (length/body mass relation) from a nearby small river River Vester Vedsted (55.07768, 8.67902) [22] was used to calculate body mass of yellow eel in River Brede at each back calculated length-at-age from the relationship body mass = 7.7 10-4*length3.23, R2 = 0.95.
2.3. Natural Mortality and Number of Glass eel
River Brede
Natural mortality M in River Brede was calculated for each length-at age of male and female yellow eel converted to body mass, annual mean water temperature, and sex and stock density using formulae in [23]. The annual mean water temperature (in the yellow eel growth period) since the 1960s in River Brede was calculated to about 80C and calculated from air temperatures 1960 to 1980 (Danish Meteorological Institute). Density of eel was set to high density sensu [23], because the river goes directly to the North Sea, from where the glass eel migrate to Danish freshwaters. Actually, the precise yellow eel density in River Brede was not known. But stock assessment from the same period in the nearby River Vester Vedsted [22] indicated, that in the time period, when glass eel recruited to the River Brede, the number and density of yellow eel in River Brede might be also high sensu [23].
With this model [23] for annual mortality M, for example, one yellow eel in River Brede, weighing 1 g has an annual natural mortality of 0.65 and 0.46 for females and males respectively, and a yellow eel weighing 250 g has a natural annual mortality of 0.05 and 0.04 for females and males respectively. The parameters for water temperature and density in the model are constant, so only sex and body mass are predictors in the calculation of M.
In River Brede, we used the body mass and sex dependent natural mortality M, the back-calculated length-at-age, converted to body mass g of yellow eel for the preceding ages of yellow eel, starting from length at silvering back to time age group 0, when the age group recruit as glass eel to the river. We made this calculation for both sex and for each age group of silver males and females respectively. Back calculation of number of eels to age 0 as glass eel stage gives the number of glass eel for each age group and sex. Summary for all ages and sex give the total number of glass eel to produce silver eel biomass.
The calculation of number of yellow eel at each age and number of glass eel in River Brede was made in the following way: for each silver eel age group (male and female respectively) we have starting values of number of silver eel of different ages, and length/body mass of silver eel. The number of yellow eel at age t-1 is thus calculated as Nt-1 = Nt*exp(Mi), where Nt is the number of eel at time t, and Mi is natural mortality (here positive) between time t and time t-1. We calculate mean length/body mass of yellow eel for each earlier age from silver eel stage back to the glass eel stage using the length/body mass relation from River Vester Vedsted as described above. Mean body mass = wi *(expG -1)/G, where G is ln(wi/wi-1) is calculated for the period of the year before and the year after, so from mean body mass the natural mortality M was calculated using [23]. If we for example have one silver age 10, we get 10 different values of Mi from silver eel body mass via yellow eel body mass and down to glass eel body mass. This calculation was done for 16 age groups (males, age 4 -25) and 19 age groups (females, age 7 -25), giving a total of 472 calculations and 472 different Mi. The calculation of total number of glass eel needed to produce 3,200 kg silver eel in 1981 [14] was the total sum of glass eel calculated for each sex and age group.
River Køge-Lellinge
2.4. Biological Production
River Brede
The data from calculations of growth and mortality in the eel stock in River Brede was used to calculate biological production and number of glass eel as described in paragraph 2.3.
River Køge-Lellinge
The biological production of yellow eel (not sexed) from age 1 to 20 was calculated in the high productive River Køge-Lellinge [3]. This calculation 1) did not take into account that an unknown number of yellow eels migrate as silver eels, and 2) the calculation did not take into account the number of glass eel immigration to the river, therefore number of glass eel here was calculated back from the number of age 1 yellow eel. The theoretical silver eel emigration was set to start from an age of 7 years corresponding to a length yellow eel of about 35 cm. From glass eel stage 0 (7.2 cm) and up to about 35 cm we used a natural mortality as M = 0.5 x body mass-1/3 [10,24] assuming linear annual growth of yellow eel, and these values are for males and females yellow eel combined because the yellow eel were not sexed. Natural mortality M was further calculated from age 7 to age 20 with M = 0.5 x body mass-1/3. For yellow eel (males + females aged 7 to 20) we calculated the total annual mortality Z = 0.595 from density index in [3], where Z = M + E (emigration mortality). The growth in length (cm) of yellow eel from age 7 to 20 was described by a new von Bertalanffy trajectory curve compared to the one given in [3], and body mass (g) of yellow eel from length (cm) was calculated from: body mass = 1.59*10-3*length3.02 [3].
Knowing Z and M, the theoretical number of emigration of silver eel E (male + female) from age 6 to 20 was calculated as Z – M = E multiplied by the number of surviving yellow eel in the cohort.
2.5. Data Treatment
We kept the two sex separated in the analysis of data for River Brede. There was no statistical difference (Kruskal-Wallis Test, p << 0.05) between distributions of length and age of silver eel comparing samples in 1981 & 1983, so samples were pooled to one sample for each sex respectively. The results were calculated and tested using Excel ver. 5.0 and Real Statistics Resource Pack version 6.7 and http://statpages.org/nonlin.html. Level of significance for statistical tests was 0.05.
3. Results
The total number (Table 1) of out-migrating silver eel in River Brede in 1981 was calculated to 20,660 males and 4,535 females or 387.1 ha-1 representing a total annual biomass production of silver eel of 3,200 kg (±33%) kg corresponding to 49.2 kg ha-1 [14]. The total number of glass eel to produce 3,200 kg silver eel was calculated to 188,382 glass eel or 2,893.7 ha-1 (Table1), so one kg silver eel demands 58.9 glass eel.
The annual biological production of yellow eel in River Brede was calculated to 65.7 kg ha-1 (Table 1).
The total number of out-migrating silver eel (males+females) in River Køge-Lellinge was calculated to 414.6 eel ha-1, and the total annual biomass of migrating silver eel in River Køge-Lellinge was calculated to 48.8 kg ha-1, demanding 5,570 glass eel ha-1, so one kg silver eel demands 114.1 glass eel (Table 2).
The biological production of yellow eel in River Køge-Lellinge was calculated to 109.2 kg ha-1 (Table 2).
The relationship between length-at-and age of silver males and females respectively in River Brede, and calculations of length-at-age of yellow eel in River Køge-Lellinge is shown in Figure 1a–c. In figures are calculated von Bertalanffy trajectory shown.
Female eels in River Brede start silvering at an age of 7 years and continue up to 25 years. At age 7, the smallest yellow eel is 20.5 cm and the largest is 55.8 cm, at for example at age 12 the smallest yellow eel is 29.7 cm and the largest is 76.8 cm. Therefore, there is a very high spread of observations within an age of the cohort. 86% of all the female silver eel lie above the von Bertalanffy trajectory, and from age 7 to, let say age 20 years, a total of 91% (Table 1) of the females have silvered and left the river. 90% of all the male silver eel lie above the von Bertalanffy trajectory, and from age 4 to, let say age 11 years, a total of 95% (Table 1) of the males have silvered and left the river. The conclusion is probably, that following the lengths of a cohort of yellow eel through increasing ages, the larger yellow eel of the length at age distribution become silver eel, and the slower growing yellow eel postpone silvering. This makes it possible to construct a von Bertalanffy trajectory although the prerequisite, i.e. decreasing growth ∆ from low to high age for a von Bertalanffy trajectory, is not present.
The age in River Brede of male silver eel varied from four to 25 years, and the observed lengths of males varied from 30.8 cm to 45.3 cm. The ages of female silver eel varied from 7 to 25 year, and the observed lengths of females ranged from 42.3 cm to 77.3 cm.
The median age in River Brede of males was 8.8 years and for females 13.6 years and the distributions were significantly different (Kruskal-Wallis Test, p << 0.05).
The median length in River Brede of silver males was 38.5 cm and median length of silver females 53.3 cm and significantly different (Kruskal-Wallis Test, p << 0.05).
The calculated annual growth rate ∆ cm per year in River Brede from glass eel to silver eel of male and female (Table 1 and Figure 2) showed, that the annual growth rate of female yellow eel is significantly higher p << 0.05 (Kruskal-Wallis Test) compared to male yellow eel.
For both rivers, a summary of the important quantitative results are given in Table 3.
4. Discussion
4.1. Linear Growth of Yellow eel
Bioenergetics models developed for fishes indicate that somatic growth rate scales allometrically with fish body mass: dw/dt = a1*wtm - b*wtn , where wt is somatic body mass, c1*wtm is the rate of energy acquisition, and b*wtn reflects energy losses owing to respiration (e.g. standard metabolism, SDA and activity) [24,25].
Setting m = 2/3 and n = 1, integrate dw/dt, we get the von Bertalanffy growth equation: wt = w∞[(1 – exp(-k*(t – t0))))]3.
References in the literature e.g. [25] and references herein suggests that m and n have similar values, that both lie close to 2/3, suggesting the following equation holds: dw/dt = (a - b) w2/3. Given that body mass increases with the cube of length (w = al3), and substituting w with l, then the potential growth rate for length (cm yr-1) is dl/dt = h0, where h0 = (a - b)/3a1/3. Integrating dl/dt, thus length is a simple linear function of time, lt = k + h0*lt-1, where the constant k is set to 7.19 cm (i.e. length of glass eel).
The linear growth of fish species assumes, that (a - b) does not change, and that all surplus energy is allocated to somatic growth, and does not account for the change in somatic growth, that occurs when fishes become sexually mature and some energy is allocated to reproduction [26]. Yellow eels are immature during the entire growth period up to the silver eel stage, and will therefore always grow with a linear growth trajectory. Therefore, the annual growth of yellow eel here was calculated as length at sexual maturity, minus the length as glass eel divided by the number of growth years in freshwater.
For example, [27] sampled and aged yellow eel caught in Lake Esrum, Denmark. The otoliths were age determined due to thin slip, and they all showed constant annual linear growth. [28] stocked glass eel in ponds in Denmark and aged the otoliths due to thin slip, and all showed constant annual linear growth. [29] aged yellow eel (2 – 12 years) in different rivers in UK by grinding the otoliths, and they all showed linear growth.
We therefore believe that linear growth of yellow eel is a correct and simple method to calculate annual growth rate of immature yellow eel.
In Table 1 and Figure 2 is shown annual growth rate ∆ cm against age of yellow eel in River Brede. The growth rate ∆ is significantly higher in females compared to males (p << 0.05). This is possibly a tradeoff between the need for female to reach maturity in the shortest possible number of years, and at the same time reach as high a body mass as silver eel as possible.
The observed mean ∆ in males range from 8 cm for a 4 years old silver eel and down to 1.4 cm for a 25 years old male. The observed mean ∆ female range goes from 6.9 cm for a 7 years old silver eel and down to 2.1 cm for a 25 years old female.
As far as we know, there are no published studies on annual growth rate ∆ as function of varying yellow eel ages for males and female respectively, so our results cannot be compared with others.
[30] and references herein compared age and length of male and female silver eel from 37 different localities, from latitude 37 (Lake Tunis, Africa) to latitude 70 (Skogsfjordvatn, Norway). The mean age for males was about 6 years (2 to 15) and females about 9 years (3 to 20) depending on latitude. Eel grow faster at lower latitudes compared to higher latitudes possibly because of higher water temperature, and there was significant difference between the two sexes at each location. The mean length for males was about 41 cm (range 32 to 45 cm) and females about 62 cm (range 45 to 81 cm). Thus, the ages and lengths in river Brede Å (Table 1) of both sex fit well with the results in [30]. In general, from publications it is concluded, that in general the growth rate of female eel is higher compared to male silver eel.
4.2. Mortality
Annual natural mortality (M) of fish species is most probably a function of sex, body mass, water temperature, predators and eel stock density (e.g. [21,23,24,31,32,33,34]. This means that M is decreasing with increasing body mass and increasing with water temperature, and M is increasing with increasing density of yellow eel [23]. Simulating mortality M in the range of body mass from 0.7 g to 340 g showed that the two models i.e. [10,23] are more or less similar and give the same result of M, so we believe that our calculated values of M are fair.
4.3. The Production of Silver eel and Yellow eel
Silver eel production
The total number of out-migrating male and female silver eel in River Brede in 1981 was calculated to 387 silver eel ha-1, and the annual production of silver eel in River Brede in 1981 was calculated to 49.2 kg ha-1. In River Køge-Lellinge the total number of migrating silver eel was calculated to 415 silver eel ha-1, and the annual production of silver eel was calculated to 48.8 kg ha-1. (Table 3).
The total annual production kg of silver eel in River Brede was estimated from mark-and-recapture data of caught silver eel with ± 35% variation of the mean [14]. Random samples of captured silver eel in 1981 and 1983 were aged, sexed, and enabled to distribute 3,200 kg silver eel to number of male and female eel distributed on ages/sizes and numbers (Table 1). The theoretical number of glass eel was calculated to 2,894 ha-1.
In contrast the total annual production of silver eel in River Køge-Lellinge was calculated using densities of electro fished yellow eel, these were aged and mortalities of Z, M and E was calculated and enabled to calculate annual silver eel production. The calculated number of glass eel was 5,570 ha-1. River Køge-Lellinge represents a highly fertile, fast running lowland river with gravel, stones and water weeds and a highly invertebrate food production (visual inspection), rather high number of glass eel, but lower growth rate of yellow eel compared to River Brede and with mortality for a shorter number of observed ages. Therefore, it seems natural, that the biological production of yellow eel is higher River Køge-Lellinge compared to River Brede.
[31] monitored the number of glass eel migrating up into River Imsa, Norway, they estimated the number of silver eel produced from the number of glass eel, and they were therefore able to calculate natural mortality M, which was density dependent. In river Brede Å, we know the number of silver eel distributed to sex and age groups. From calculated body mass mortality M, we calculated the number of glass eel to give the number of observed silver eel in River Brede.
[11] and references herein collected 18 estimates of silver eel production from whole Europe, and they range from 49.2 kg ha-1 (River Brede) down to less than 1 kg ha-1.
In Lough Neagh, the production of silver eel was calculated to 35-45 kg ha-1 for the same annual period as River Brede and River Køge-Lellinge. The silver eel production in River Brede and River Køge-Lellinge are surprising similar to each other and similar to silver eel production in Lough Neagh.
Yellow eel biological production
The total annual biological production in River Brede was calculated to 65.6 kg ha-1 of which about 75% (49.2 kg ha-1) survives as silver eel.
The total annual biological production in River Køge-Lellinge was calculated to 108.9 kg ha-1 of which about 45% (48.5 kg ha-1) survives as silver eel.
The two rivers are different, River Brede is not fertile and the physical habitat is of lower quality, whereas River Køge-Lellinge is fertile and with very good physical habitats. The biological production (and silver eel production) depends on size of recruitment as glass eel, annual growth rate and mortality. In River Brede the number of recruitment of glass was calculated (2,894 ha-1) backwards from the number and production of male and silver eel, whereas in the River Køge-Lellinge we have quantitative data of densities of yellow eel aged 1 to 20 years from electro fishing, and the number of recruitment of glass was calculated (5,570 ha-1). The annual linear growth rate in River Brede (Table 1) was higher compared to the linear growth rate (4.0 cm) in the River Køge-Lellinge for yellow from glass eel up age 7.
We propose that because of the lower calculated glass eel recruitment into River Brede, the yellow eel growth rate here is higher compared to the yellow eel growth rate in River Køge-Lellinge, possibly because we have an effect from density dependent growth. However, because the recruitment in River Køge-Lellinge is much higher, we have a higher total biological production here compared to River Brede biological production.
[35] calculated biological production along the course of River Esva going to the Cantabrian Sea in North Spain, mostly dominated by males, aged up to 4+ (i.e. 5 growth seasons) and up to 40 cm total length. Numbers of yellow eel were estimated from electro fishing, and the eels was aged by clearing the otoliths. The biological production depended on distance to the estuary, and values up to 352.5 kg ha-1, but with large variations, was recorded.
The biological production of yellow eel in River Køge-Lellinge is equally high, but very few publications about biological production are present to compare, e.g. [35] and references herein. Biological production results from salmonids are much more common, and here maximum biological production of brown trout (Salmo trutta) have been calculated to have a maximum limit at approximately 400-450 kg ha-1 year across stream-dwelling salmonids populations [36], so the production of yellow eel in the two Danish rivers is high but seems not unrealistic. It is all about number of recruits, survival, feeding and growth. The brown trout fry starts with a body mass of about 0.16 g and the glass eel about 0.29 g, and the two species feed more or less on the same items in rivers. Brown trout rivers are most often with plenty of food items, and the same for yellow eel in River Køge-Lellinge. Therefore, as long as food items are present in reasonable amounts, there is nothing that speaks against the fact, that the biological production of the eel population can be rather large, as in the Spanish River Esva and River Køge-Lellinge. It is probably more a matter of more coming studies and results to compare of the biological production of eel populations.
5. Conclusions
The results from River Brede and River Køge-Lellinge are in accordance with [30] and references herein) in terms of growth rate of yellow eel, and that female yellow eel grew faster compared to male yellow eel. The silver eel production in River Brede and River Køge-Lellinge are similar in size and among the biggest recorded, e.g. [11].
As long as the body mass dependent mortality is correct [10,23,24] the results in this study is a robust method to calculate number of recruiting glass eel to a river system, and the method can be used in other geographical freshwater areas, where total number of migration of silver eel is known. Knowing the relationship between number of glass eel and number of silver eel, we can for example calculate earlier and present recruitment of glass eel in other comparable river systems, where we know the annual catches of total silver eel migration. This require that the sex distribution is known either from sexing og length distribution, and that sufficient number of eel are aged to establish reliable growth rate of yellow eel for the different silver eel age and sex groups. River water temperatures are often known or may be estimated from air temperature. Density of yellow eel representing several year classes are often known from data collected from routine monitoring in the streams.
The present area of rivers in Denmark is 15,000 ha. Glass eels are not used for stocking in Denmark, but on-grown eel with a body mass of 2-5 g. The pristine silver eel production from Danish rivers was 750 tons [37]. The production today of silver eel in rivers is about 7.8 kg ha-1 or 117 tons [38]. EMP recommends that the production of silver eel shall be about 40% of pristine production. Therefore, it is necessary to increase the production in rivers of silver eel by 183 tons. If on-grown eel 3.5 g are used as stocking material, this means annually stocking of about 33 tons (9.4 million individuals) on-grown eel in rivers.
The present annual stockings in Denmark in rivers is about 1.35 million on-grown eel, equal to 4.73 tons, so 9.4 million (33 tons) on-grown eel are still needed annually to reach 40% of pristine silver eel production.
Author Contributions
Conceptualization, GR and MIP; methodology, GR; software, GR; validation, GR and MIP; formal analysis, GR; investigation, GR and MIP; resources, GR; data curation, GR and MIP; writing—GR and MIP; writing—review and editing, GR and MIP; visualization, GR and MIP; supervision, GR; project administration, GR; funding acquisition, GR. All authors have read and agreed to the published version of the manuscript.
Funding
The project was funded by the former County of South Jutland, Denmark and the Danish Technical University.
Data Availability Statement
The data used can be obtained from the corresponding author.
Acknowledgments
Thanks to technical assistance from Knud Jørgensen, Erik Hansen and Birgit Therkildsen for contribution to field work, ageing the otoliths and IT data inputs.
Conflicts of Interest
The authors certify that they have no affiliations with or involvement in any organization or entity with any financial interest (such as honoraria; educational grants; participation in speakers' bureaus; membership, employment, consultancies, stock ownership, or other equity interest; and expert testimony or patent-licensing arrangements), or non-financial interest (such as personal or professional relationships, affiliations, knowledge, or beliefs) in the subject matter or materials discussed in this manuscript.
References
- Als, T.D., Hansen, M.M., Maes, G.E., Castonguay, M., Riemann, L., Aarestrup, K., Munk, P., All roads lead to home: panmixia of European eel in the Sargasso Sea. Molecular Ecology, 20: 1333-1346. [CrossRef]
- Sinha, V., R., P. & Jones, J.W., 1967. On the food of the freshwater eels and their feeding relationship with the salmonids. Journal of Zoology, London, 153: 119-137. [CrossRef]
- Rasmussen G. & Therkildsen B., 1979. Food, Growth and Production of Anguilla anguilla L. in a small Danish stream. Rapports et Proces-Verbaux des Reunions, Conseil internationale pour l’Exploitation de la Mer, 174: 32–40.
- ICES (2018). European eel (Anguilla anguilla) throughout its natural range. ICES Advice: Recurrent Advice. Report. [CrossRef]
- Castonguay, M., Hudson, P.V., Moriarty, C., Drinkwater, K.F. & Jessop, B.M. 1994. Is there a role of ocean environment in American and European eel decline? Fisheries Oceanography 3: 197–203. [CrossRef]
- Friedland, K.D., Miller, M.J. & Knights, B. 2007. Oceanic changes in the Sargasso Sea and declines in recruitment of the European eel. ICES Journal of Marine Science 64: 519–530. [CrossRef]
- ICES. 2005. Report of the ICES ⁄ EIFAC Working Group on Eels. No. ICES CM 2005 ⁄I:01. Galway, Ireland, 184 pp.
- Pedersen, M.I., Rasmussen, G.H., 2018. Fisheries regulation on European Eel (Anguilla anguilla) for 2018: how big is the effect? Journal of Fish Research, volume 2, Issue 1, 17-18.
- EU, 2007. Council regulation (EC) No 1100/2007 of 18. September 2007 establishing measures for the recovery of the stock of European eel. Official Journal of the European Union. L 248, 17-23.
- Pedersen, M.I., Rasmussen, G.H., 2013. Background material for preparation of eel management plan in Denmark. DTU Aqua-rapport nr. 271-2013. (In Danish).
- Aprahamian, M.W., Derek, W.E, Briand, C., Walker, A.M., McElarney, Y., Allen, M., 2021. The changing times of Europe´s largest remaining commercial harvested population of Eel Anguilla anguilla L. Journal of Fish Biology; 99:1201-1221. [CrossRef]
- Ivlev VS (1966). The biological productivity of waters (English version). Journal of Fisheries Research Board of Can, 23:1727–1759. [CrossRef]
- Chapman, D.W. 1967. Production in fish populations, 3-29. The Biological Basis of Fish Production, Edited by Shelby D. Gerking. Blackwell Scientific Publications, Oxford and Edinburg.
- Nielsen. G., 1981. River Brede system, the silver eel production. DTU Aqua. (In Danish).
- Larsen, K., 1972. Studies on the biology of Danish stream fishes. III. On seasonal fluctuations in the stock density of yellow eel in shallow stream biotopes, and their causes. Meddelelser i Danmarks Fiskeri og Havundersøgelser. N. S. 7 (2): 23-46.
- Sinha, V., R., P. & Jones, J.W., 196. On the sex and distribution of the freshwater eel (Anguilla anguilla). Journal of Zoology, London, 150: 371-385. [CrossRef]
- Christensen, J.M., 1964. Burning of otoliths, a technique for age determination of soles and other fish. Journal Conseil Permanent Internationale pour l’Exploration de la Mer, 29, 73-81. [CrossRef]
- Moriarty C. & Steinmetz B, 1979. On age determination of eel. Rapport et Proces-verbaux des Reunions. Conseil international pour l’Exploration de la Mer, 174, 70-74.
- ICES. 2009. Workshop on Age Reading of European and American Eel (WKAREA). Bordeaux, France: ICES CM 2009\ACOM: 48, 66 pp.
- Durif, C.M.F., Diserud, O., Sandlund, O., Thorstad, E.B., Poole, R., Bergesen, K., Escobar-Lux, R.H., Shema S., 2020. Age of European silver eels during a period of declining abundance in Norway. Ecology and Evolution, 10, 4801-4815. [CrossRef]
- Pedersen, M.I., Rasmussen, G.H., Jepsen, N., 2023. Density-dependent growth, survival, and biomass production of stocked glass eels (Anguilla anguilla) in semi natural ponds. Fisheries and Management Ecology. [CrossRef]
- Rasmussen G., 1983. Recent investigations on the population dynamics of eel (Anguila anguilla L.) in some Danish streams. Proceeding of the 3rd British Freshwater Fish Conference, 71-77.
- Bevacqua, S., Melia, P., De Leo, G.A., Gatto, M., 2011. Intra-specific scaling of natural mortality in fish: paradigmatic case of the European eel. Oecologia (2011) 165:333–339. [CrossRef]
- Ursin, E., 1967. A mathematical model of some aspects of fish growth, respiration and mortality. Journal of Fisheries Research Board of Canada, 24, 2355–2391. [CrossRef]
- Lester, N.P., Shuter, B.J., Abrams, P.A., 2004. Interpreting the von Bertalanffy model of somatic growth in fishes: the cost of reproduction. Proceeding of the Royal Society. M 271, 1625:1631. [CrossRef]
- Day, T. & Taylor, P.D. 1997. Von Bertalanffy¨s growth equation should not be used to model age and size at maturity. The American Naturalist, vol. 149, no. 2:381-392. [CrossRef]
- Rasmussen, C.J., 1952. Size and age of the silver eel (Anguilla anguilla L) in Esrum Lake. Rep. Dansk Biolologisk Station, LIV (I).
- Dahl, J., 1967. Some recent observations on the age and growth of eel. Proceeding of the 3rd British Coarse Fish Conference, 48-52.
- Sinha, V., R., P. & Jones, J.W., 1967. On the age and growth of the freshwater eel (Anguilla anguilla). Journal of Zoolology, London, 153: 99-117. [CrossRef]
- Vøllestad, L.A., 1992. Geographic Variation in Age and Length at Metamorphosis of Maturing European Eel: Environmental Effects and Phenotypic Plasticity. Journal of Animal Ecology , Feb., 1992, Vol. 61, No. 1, 41-48. [CrossRef]
- Vøllestad, L.A., Jonsson, B., 1988. A 13-year study of the population dynamics and growth of the European eel Anguilla anguilla in a Norwegian river: evidence for density-dependent mortality, and development of a model for predicting yield. Journal of Animal Ecology, 57, 983-997. [CrossRef]
- Berg, S., Jørgensen, J., 1994. Stocking experiments with O+ eel (Anguilla anguilla L.) in Danish streams: post stocking movements, densities and mortality: In Rehabilitation of Freshwater Fisheries, 314 - 325. Edited by I.G. Cowx. Fishing News Books. University of Hull, U.K. ISBN 0-85238-195-6.
- De Leo, G. A., Gatto, M., 1996. Trends in vital rates of the European eel: Evidence for density dependence? Ecological Applications Volume: 6, 1281-1294. [CrossRef]
- Lorenzen, K., 1996. The relationship between body weight and natural mortality in juvenile and adult fish: a comparison of natural ecosystems and aquaculture. Journal of Fish Biology, 49, 627–647. [CrossRef]
- Lobon-Cervia, J., Utrilla. C.G., Rincon, P.A. 1995. Variations in the population dynamics of the Europeaneel Anguilla anguilla (L.) along course of a Catabrian river. Ecology of Freshwater Fish, 4: 17-27. [CrossRef]
- Lobon-Cervia, J., Rasmussen, G., 2023. Determinants and Dynamics of Production Rates of Stream-Dwelling Salmonids: The importance of intrinsic factors. Advances in the Ecology of Stream-Dwelling Salmonids. Springer. In press.
- Anonymous 2008. Danish Eel Management Plan. Ministry of Food, Agriculture and Fisheries.
- Anon 2021. Fourth Danish progress report (2021) on implementation of the Eel Regulation and Eel Management Plan (EMP) in Denmark.
Figure 1.
(a). Relationship between observations (blue) of back calculated lengths (cm) of yellow eel at age (0 to 25) calculated from female silver eels in River Brede. Red marks the length-at-age observations of silver eel. Length-at-age (# 251 observations) was fitted to a dome shaped von Bertalanffy trajectory lt (cm) = 74.42 (± 1.52)*(1 – exp(-0.0694 (±0.0026)*(ti + 1.1735 (± 0.0672)))), R2 = 0.86. (b). Relationship between observations (blue) of back calculated lengths (cm) of yellow eel at age (0 to 25) calculated from male silver eels in River Brede. Red marks the length-at-age observations of silver eel. Length-at-age (# 498 observations) was fitted to a dome shaped von Bertalanffy trajectory lt (cm) = 49.66 (± 0.59)*(1 – exp(-0.1209 (± 0.0028)*(ti + 1.0431 (±0.0315))), R2 = 0.90. (c). Relationship between observations (blue) of observed lengths (cm) of yellow eel at age (0 to 20) for yellow eels in River Køge-Lellinge. The linear growth from 0 to age 7 is showed, from age 7 to age 20 von Bertalanffy trajectory is showed. Length-at-age (# 19 observations) was fitted to a dome shaped von Bertalanffy trajectory lt (cm) = 62.13 (± 2.97)*(1 – exp(-0.1209 (± 0.0130)*(ti + 1.0431 (±0.2850))), R2 = 0.98.
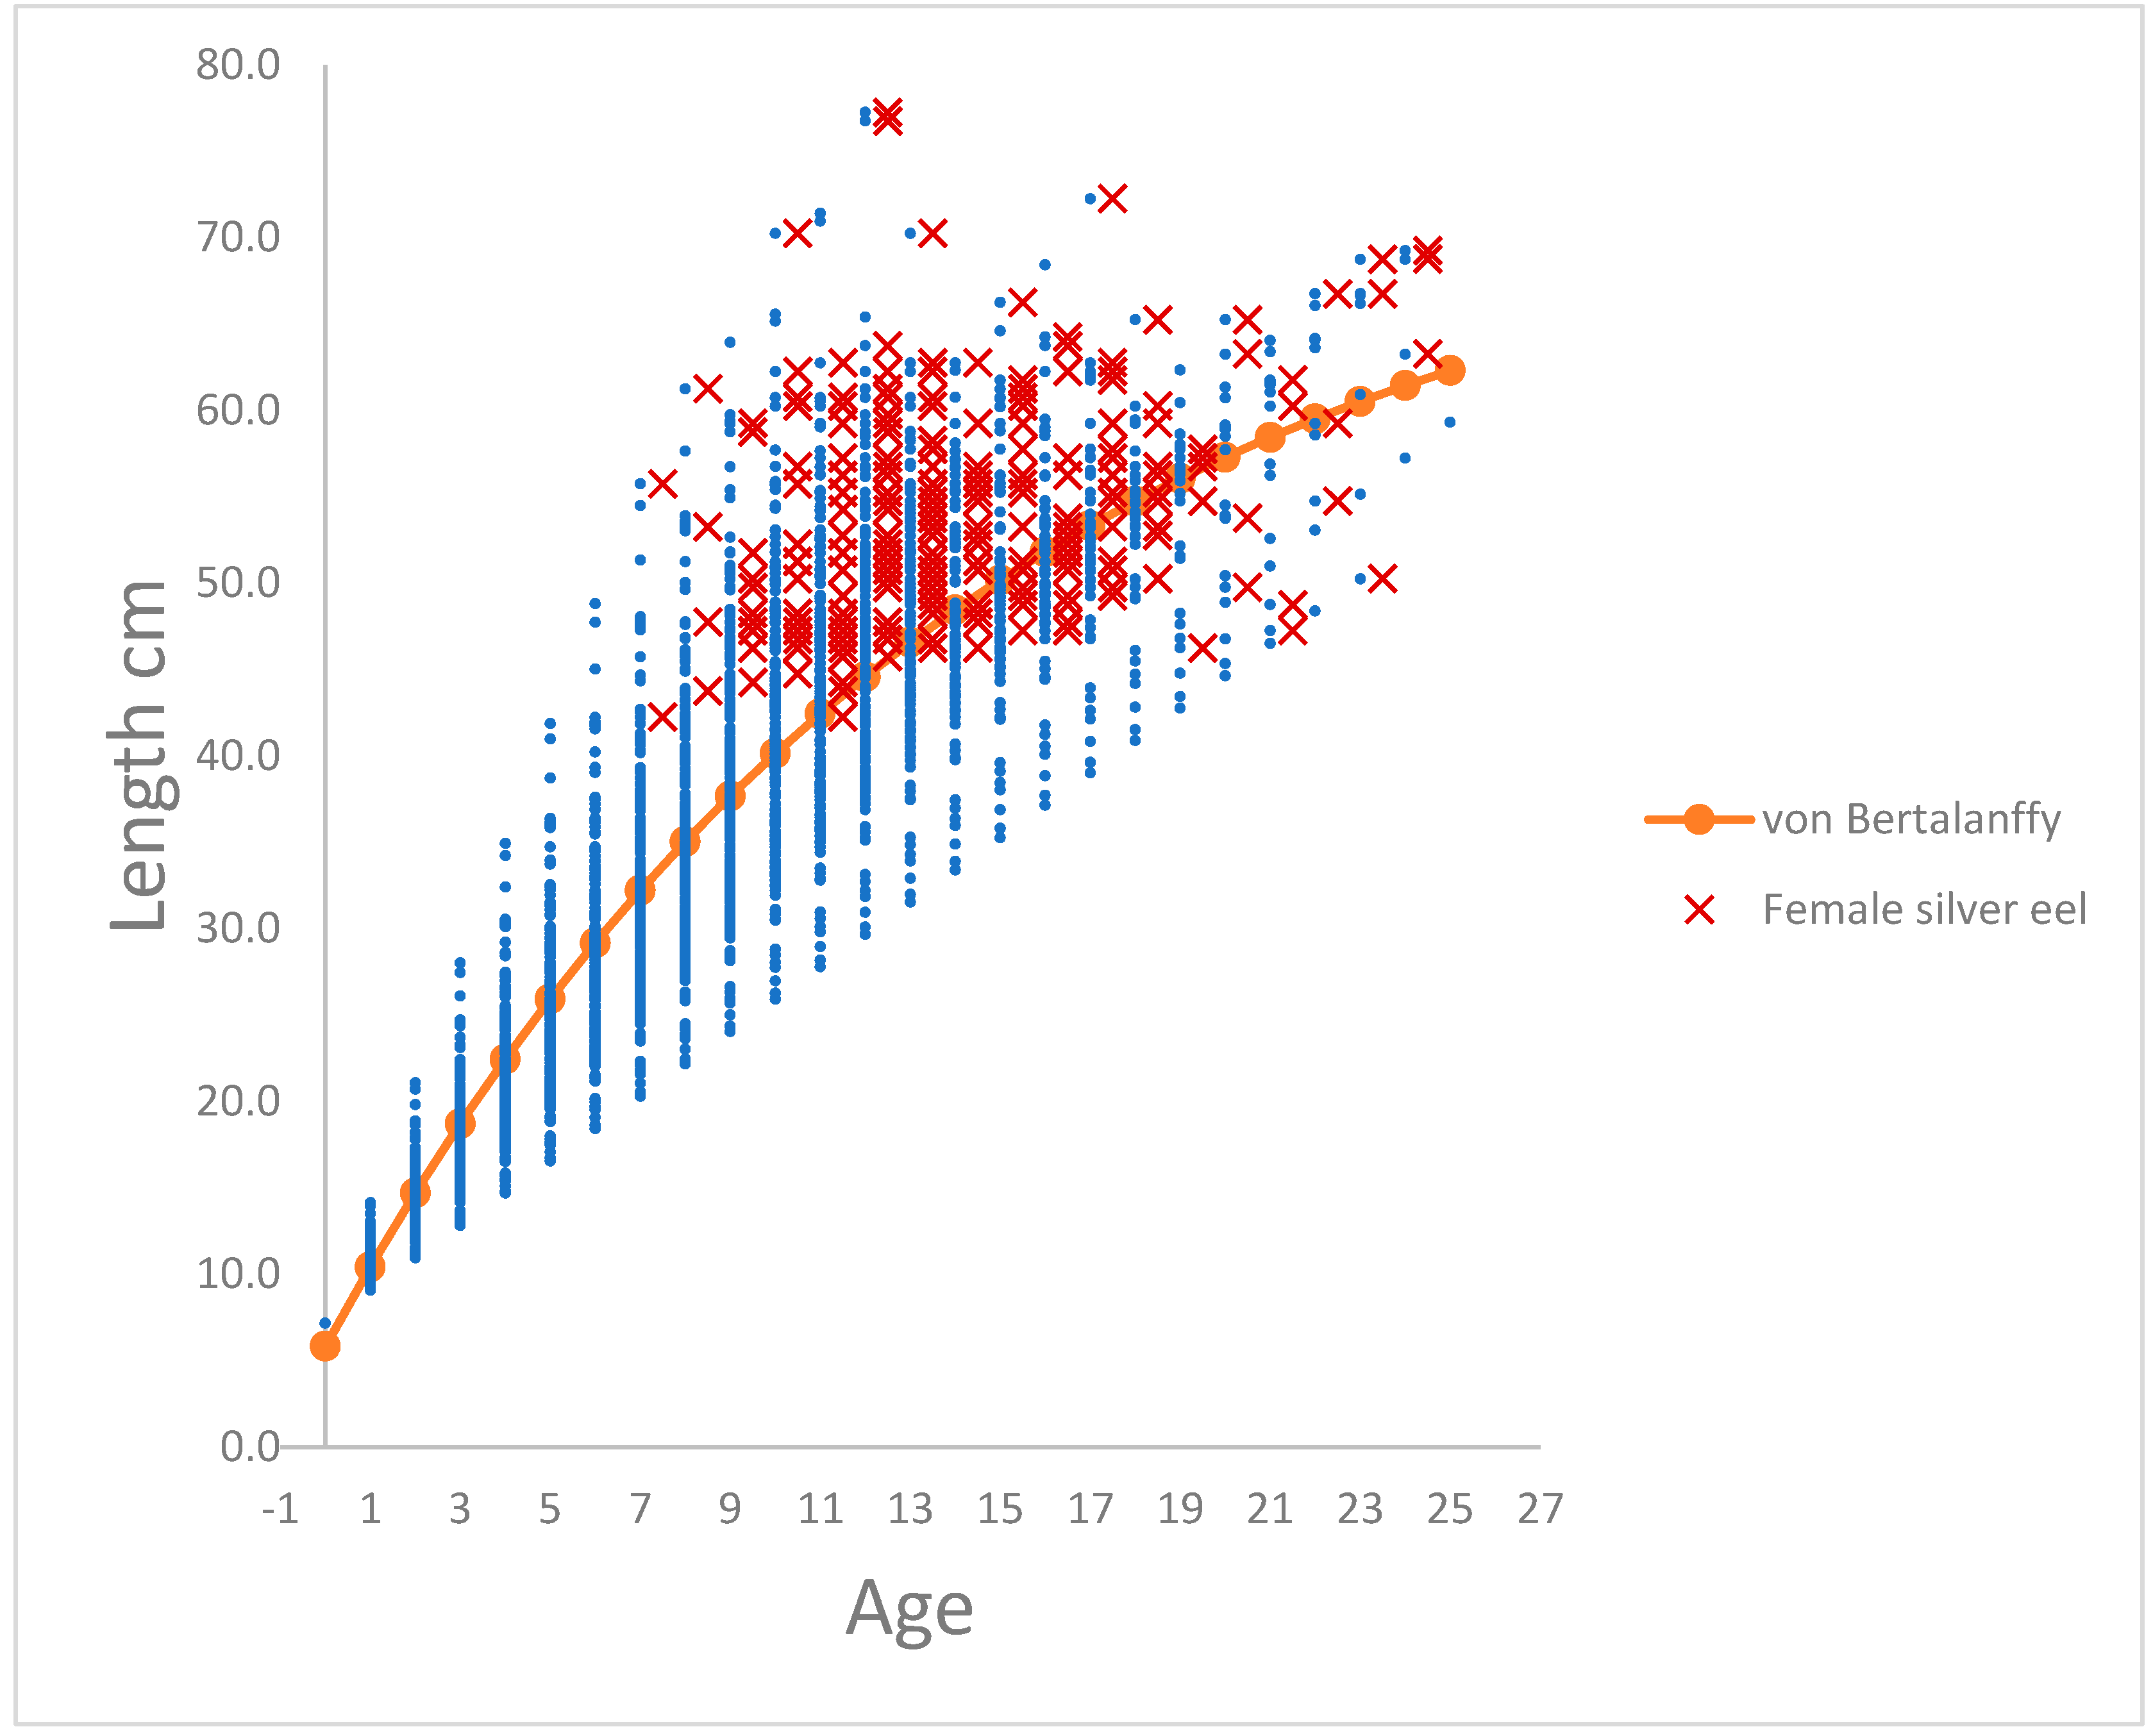
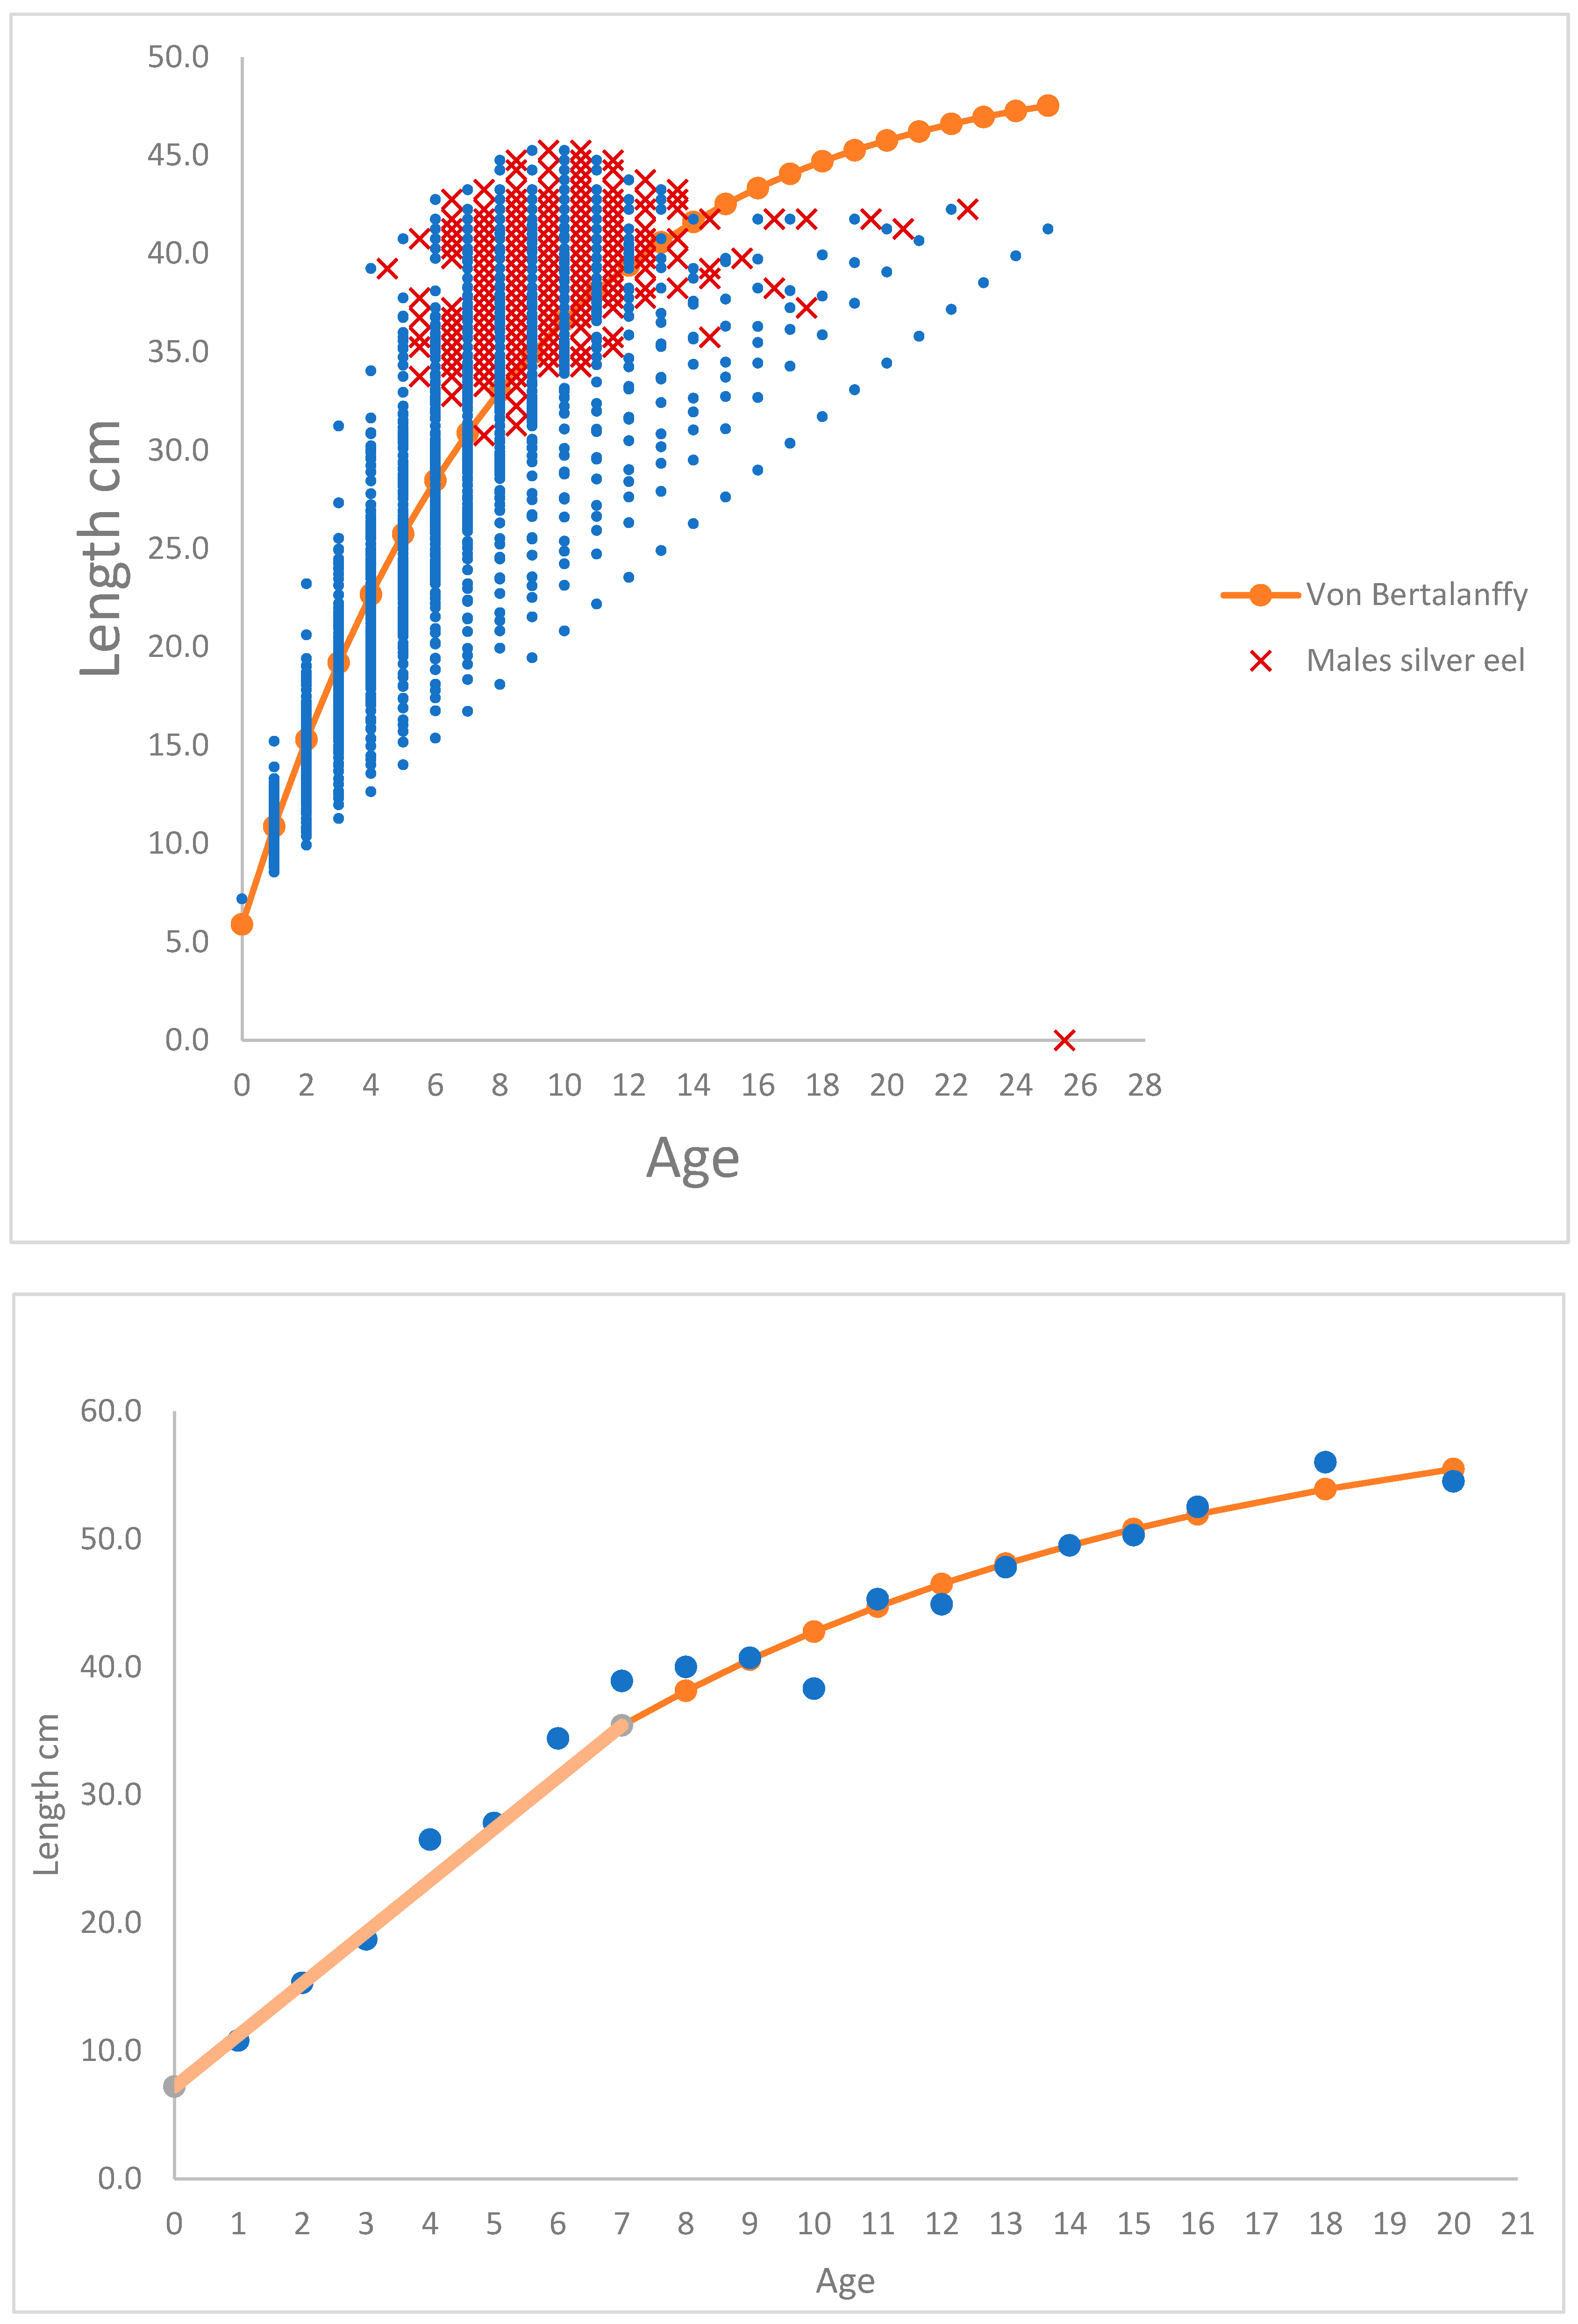
Figure 2.
Annual growth ∆ cm of yellow male and female eel calculated from aged silver eel. The growth rate of female yellow eel is higher compared to male yellow eel (Kruskal-Wallis Test, p <<0.05). Male: ∆ (cm) = 22.33*Age-0.843. Female: ∆ (cm) = 29.98* Age-0.829.
Figure 2.
Annual growth ∆ cm of yellow male and female eel calculated from aged silver eel. The growth rate of female yellow eel is higher compared to male yellow eel (Kruskal-Wallis Test, p <<0.05). Male: ∆ (cm) = 22.33*Age-0.843. Female: ∆ (cm) = 29.98* Age-0.829.
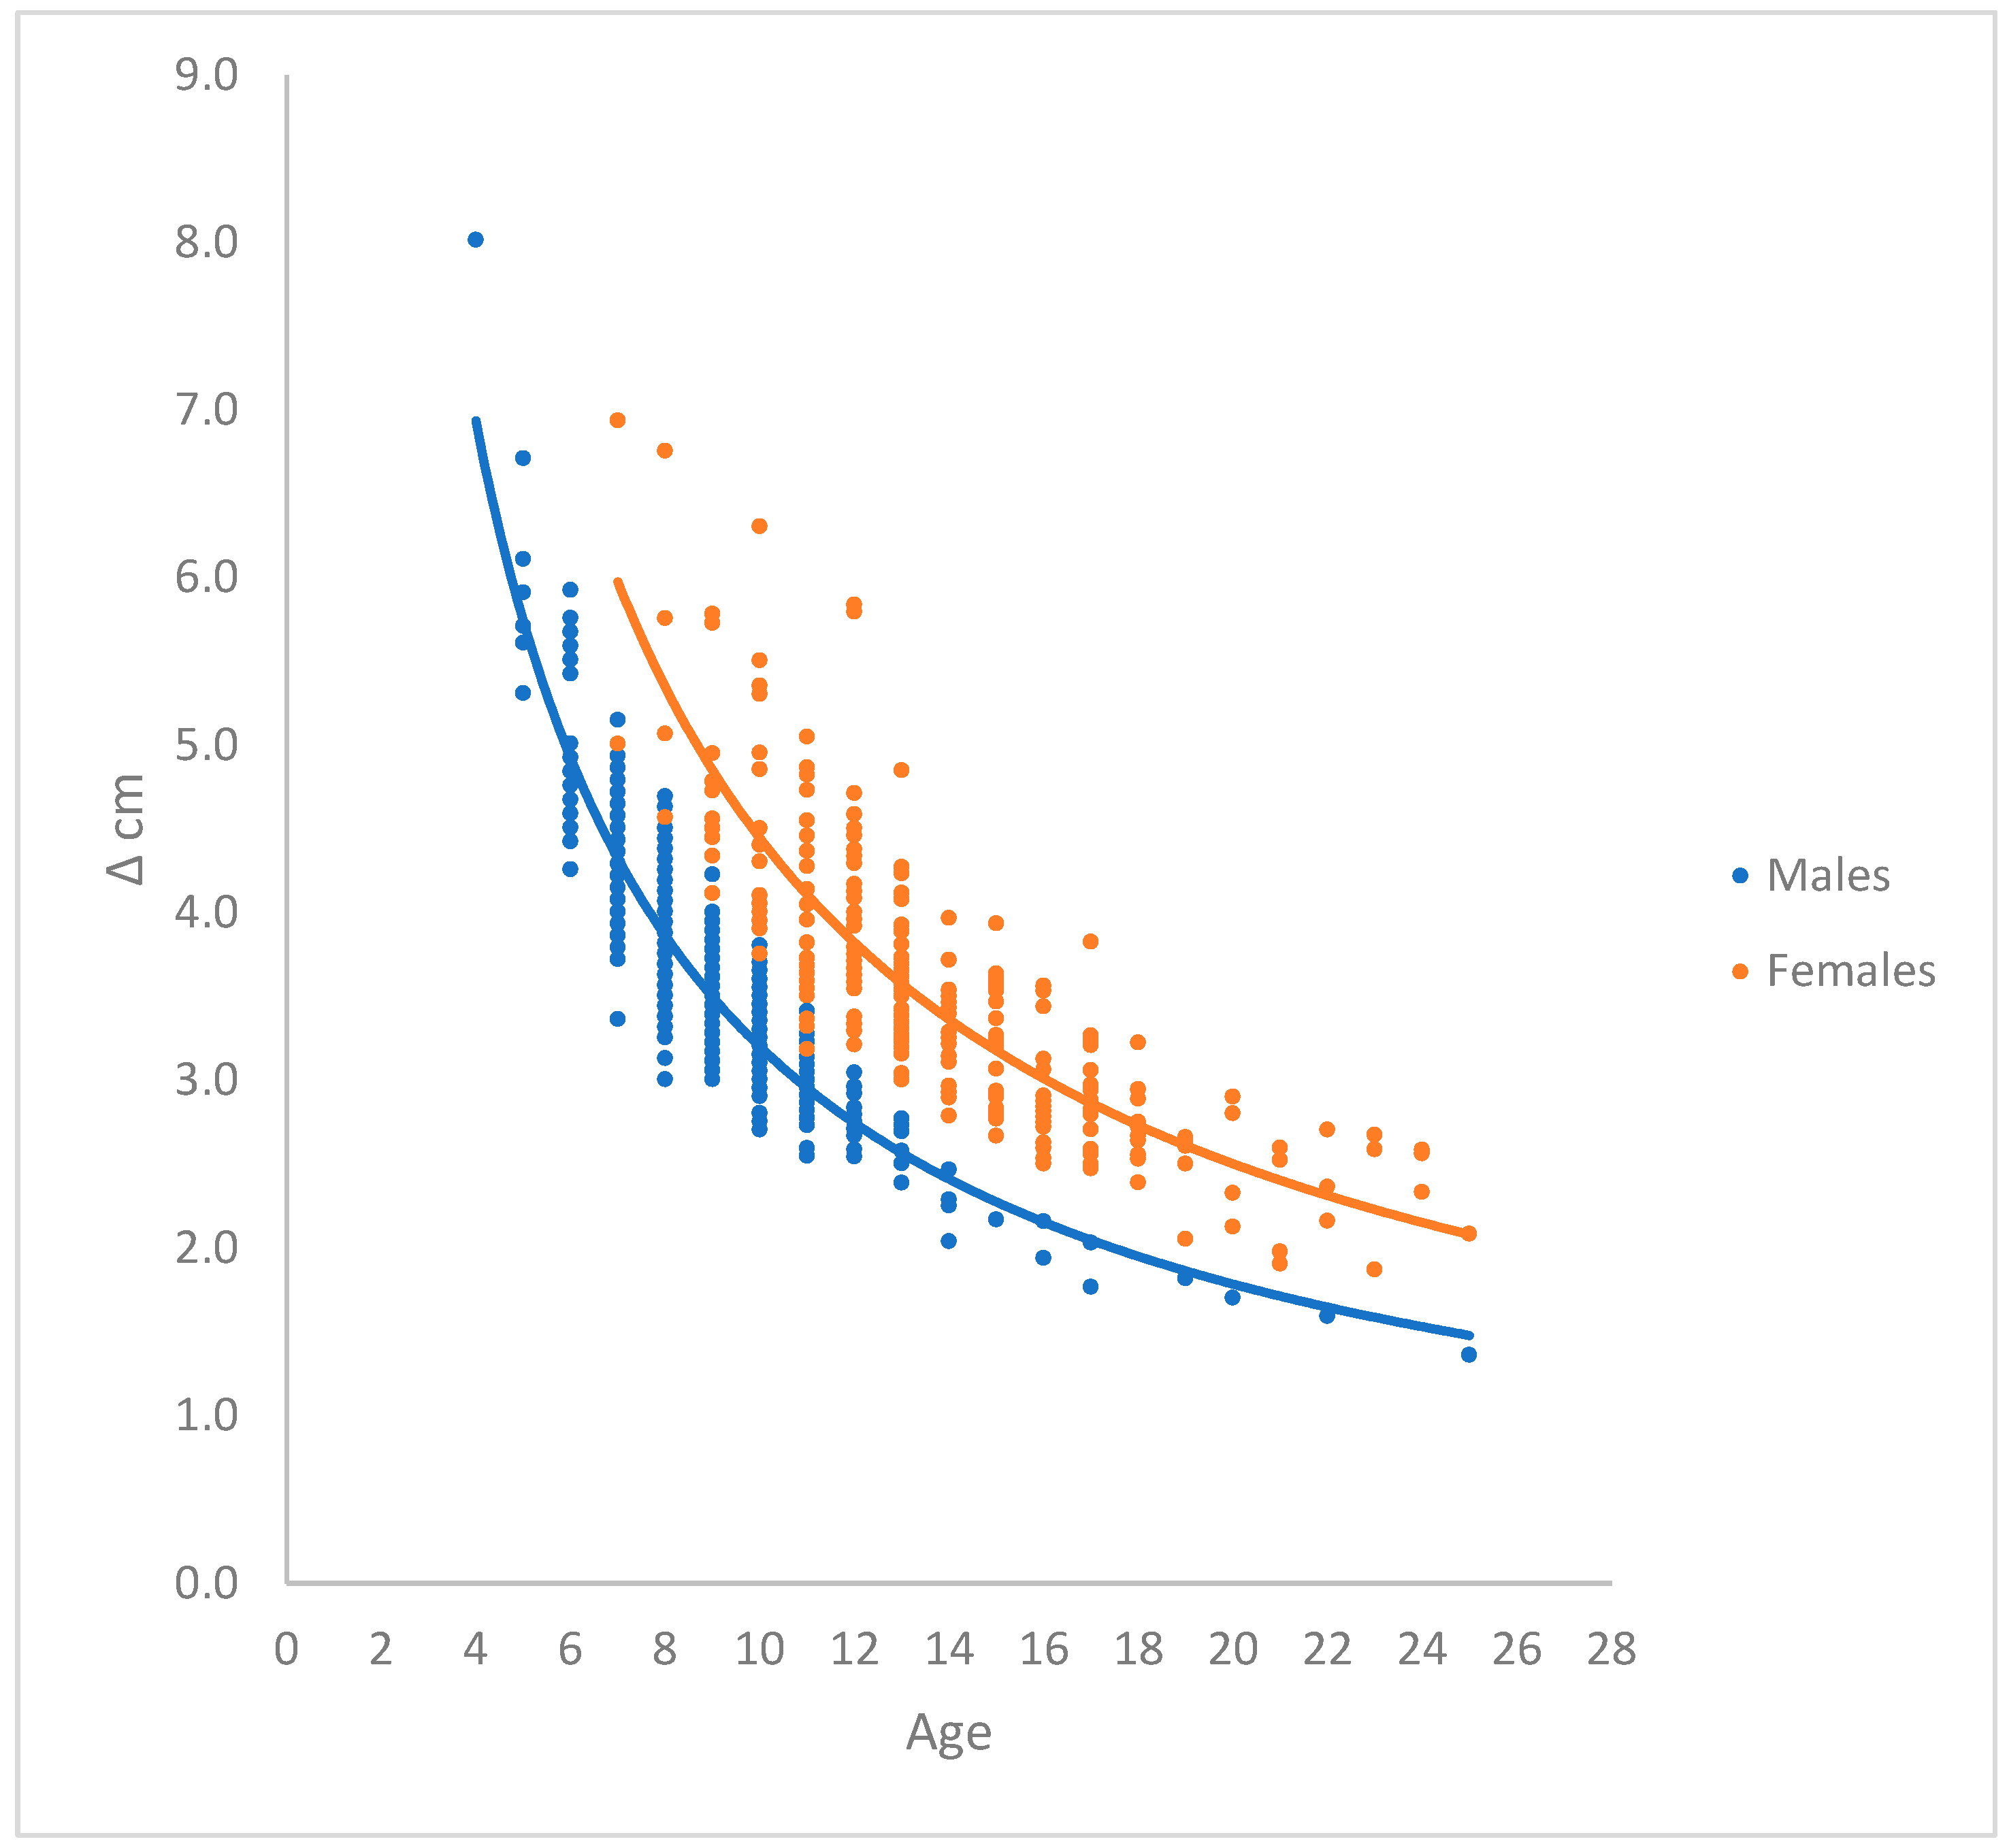

Table 1.
Distribution of male and female silver eel in River Brede. Column 2 and column 7 give the background number of silver eel for calculating the total number of glass eel given in column 8. Column 10 shows the total biological production.
Table 1.
Distribution of male and female silver eel in River Brede. Column 2 and column 7 give the background number of silver eel for calculating the total number of glass eel given in column 8. Column 10 shows the total biological production.
| Males | 1981 | Mean | Annual growth | Silver eel | Total nr. | Glass eel | Biological | ||
| Silver Age | Number | Number% | Accumulated% | Length cm | ∆ cm | Total number | Glass Eel | per Silver Eel | Production g |
| 4 | 3 | 0.2 | 0.2 | 34.6 | 6.9 | 47 | 103 | 2.2 | 3,753 |
| 5 | 18 | 1.3 | 1.6 | 35.7 | 5.7 | 277 | 722 | 2.6 | 24,795 |
| 6 | 51 | 3.9 | 5.5 | 36.6 | 4.9 | 801 | 2,487 | 3.1 | 79,309 |
| 7 | 158 | 12.1 | 17.5 | 37.3 | 4.3 | 2,497 | 9,193 | 3.7 | 269,982 |
| 8 | 325 | 24.8 | 42.3 | 38.0 | 3.8 | 5,119 | 22,292 | 4.4 | 599,607 |
| 9 | 377 | 28.8 | 71.1 | 38.6 | 3.5 | 5,946 | 30,549 | 5.1 | 749,677 |
| 10 | 226 | 17.2 | 88.3 | 39.1 | 3.2 | 3,563 | 21,548 | 6.0 | 481,155 |
| 11 | 81 | 6.2 | 94.6 | 39.5 | 2.9 | 1,284 | 9,124 | 7.1 | 185,036 |
| 12 | 29 | 2.2 | 96.8 | 40.0 | 2.7 | 459 | 3,821 | 8.3 | 70,292 |
| 13 | 13 | 1.0 | 97.8 | 40.4 | 2.6 | 208 | 2,030 | 9.8 | 33,850 |
| 14 | 10 | 0.8 | 98.6 | 40.7 | 2.4 | 163 | 1,857 | 11.4 | 28,052 |
| 15 | 3 | 0.2 | 98.8 | 41.1 | 2.3 | 47 | 652 | 13.8 | 8,610 |
| 16 | 5 | 0.4 | 99.2 | 41.4 | 2.1 | 77 | 1,199 | 15.6 | 14,868 |
| 17 | 6 | 0.4 | 99.6 | 41.7 | 2.0 | 93 | 1,679 | 18.1 | 18,859 |
| 18 | 99.6 | ||||||||
| 19 | 1 | 0.1 | 99.7 | 42.2 | 1.8 | 21 | 510 | 24.6 | 4,707 |
| 20 | 1 | 0.1 | 99.8 | 42.5 | 1.8 | 21 | 593 | 28.6 | 4,967 |
| 21 | 99.8 | ||||||||
| 22 | 1 | 0.1 | 99.9 | 42.9 | 1.6 | 17 | 544 | 31.8 | 4,559 |
| 23 | 99.9 | ||||||||
| 24 | 99.9 | ||||||||
| 25 | 1 | 0.1 | 100.0 | 43.6 | 1.5 | 21 | 1,037 | 50.0 | 6,525 |
| Total | 1,310 | 100.00 | 20,660 | 109,940 | 5.3 | 2,588,601 | |||
| Females | 1981 | Mean | Annual growth | Silver eel | Total nr. | Glass eel | Biological | ||
| Silver Age | Number | Number% | Accumulated% | Length cm | ∆ cm | Total number | Glass Eel | per Silver Eel | Production g |
| 7 | 2 | 0.8 | 0.8 | 48.9 | 6.0 | 36 | 68 | 1.9 | 4,741 |
| 8 | 4 | 1.7 | 2.5 | 50.0 | 5.3 | 76 | 342 | 4.5 | 20,320 |
| 9 | 11 | 4.7 | 7.1 | 50.9 | 4.9 | 211 | 1,120 | 5.3 | 11,520 |
| 10 | 16 | 7.0 | 14.1 | 51.8 | 4.5 | 318 | 2,213 | 7.0 | 98,104 |
| 11 | 21 | 9.0 | 23.1 | 52.5 | 4.1 | 408 | 3,370 | 8.3 | 134,899 |
| 12 | 32 | 13.7 | 36.9 | 53.2 | 3.8 | 623 | 6,093 | 9.8 | 219,829 |
| 13 | 28 | 12.1 | 49.0 | 53.8 | 3.6 | 551 | 6,361 | 11.5 | 206,582 |
| 14 | 15 | 6.7 | 55.7 | 54.4 | 3.4 | 304 | 4,142 | 13.6 | 120,970 |
| 15 | 18 | 7.9 | 63.7 | 55.0 | 3.2 | 360 | 5,782 | 16.0 | 146,996 |
| 16 | 26 | 11.2 | 74.9 | 55.5 | 3.0 | 507 | 9,569 | 18.9 | 211,796 |
| 17 | 19 | 8.3 | 83.1 | 56.0 | 2.9 | 375 | 8,306 | 22.2 | 159,375 |
| 18 | 10 | 4.2 | 87.3 | 56.4 | 2.7 | 191 | 1,937 | 10.1 | 80,429 |
| 19 | 4 | 1.8 | 89.1 | 56.9 | 2.6 | 80 | 2,358 | 29.3 | 35,421 |
| 20 | 4 | 1.9 | 91.0 | 57.3 | 2.5 | 84 | 3,001 | 35.7 | 37,522 |
| 21 | 5 | 2.2 | 93.2 | 57.7 | 2.4 | 101 | 4,229 | 41.7 | 45,570 |
| 22 | 3 | 1.2 | 94.4 | 58.0 | 2.3 | 53 | 2,483 | 46.6 | 26,624 |
| 23 | 3 | 1.2 | 95.5 | 58.4 | 2.2 | 52 | 2,982 | 56.9 | 24,834 |
| 24 | 7 | 3.2 | 98.7 | 58.7 | 2.1 | 143 | 9,524 | 66.4 | 65,223 |
| 25 | 3 | 1.3 | 100.0 | 59.1 | 2.1 | 59 | 4,563 | 77.4 | 28,507 |
| Total | 231 | 100.0 | 4,535 | 78,442 | 17.3 | 1,679,262 |
Table 2.
River Køge-Lellinge 100 m-2. Number of glass eel age 0 and yellow eel age 1 – 20, mortalities. Length and body mass, biological production and silver eel production.
Table 2.
River Køge-Lellinge 100 m-2. Number of glass eel age 0 and yellow eel age 1 – 20, mortalities. Length and body mass, biological production and silver eel production.
| Instantaneous | Biological | ||||||||||
| Age | Number | Natural M | Total Z | Mean | Mean | Growth rate | Biomass | Production | Emigration E | Silver eel | Silver eel |
| Yellow eel | Mortality | Mortality | Length cm | Body mass g | G | g | g | Mortality | Number | g | |
| 0 | 55.70 | 0.755 | 7.2 | 0.3 | |||||||
| 1 | 26.17 | 0.376 | 11.2 | 2.3 | 2.089 | 38.4 | 80.27 | ||||
| 2 | 17.96 | 0.276 | 15.3 | 5.9 | 0.926 | 84.1 | 77.96 | ||||
| 3 | 13.62 | 0.218 | 19.3 | 12.0 | 0.708 | 135.1 | 95.61 | ||||
| 4 | 10.95 | 0.180 | 23.3 | 21.3 | 0.573 | 198.4 | 113.69 | ||||
| 5 | 9.14 | 0.154 | 27.4 | 34.5 | 0.481 | 274.1 | 131.93 | ||||
| 6 | 7.84 | 0.134 | 31.4 | 52.2 | 0.415 | 362.1 | 150.25 | ||||
| 7 | 6.86 | 0.118 | 35.4 | 75.2 | 0.365 | 462.3 | 168.60 | ||||
| 8 | 3.78 | 0.110 | 0.595 | 38.1 | 93.9 | 0.222 | 544.4 | 120.91 | 0.485 | 1.83 | 172.22 |
| 9 | 2.09 | 0.103 | 0.595 | 40.6 | 113.1 | 0.187 | 369.7 | 68.95 | 0.492 | 1.03 | 116.03 |
| 10 | 1.15 | 0.098 | 0.595 | 42.8 | 132.5 | 0.158 | 243.0 | 38.46 | 0.497 | 0.57 | 75.78 |
| 11 | 0.63 | 0.094 | 0.595 | 44.7 | 151.7 | 0.135 | 155.6 | 21.08 | 0.501 | 0.32 | 48.28 |
| 12 | 0.35 | 0.090 | 0.595 | 46.5 | 170.5 | 0.117 | 97.5 | 11.39 | 0.505 | 0.18 | 30.14 |
| 13 | 0.19 | 0.087 | 0.595 | 48.1 | 188.7 | 0.101 | 60.1 | 6.08 | 0.508 | 0.10 | 18.51 |
| 14 | 0.11 | 0.085 | 0.595 | 49.5 | 206.1 | 0.088 | 36.5 | 3.22 | 0.510 | 0.05 | 11.20 |
| 15 | 0.06 | 0.083 | 0.595 | 50.8 | 222.6 | 0.077 | 21.9 | 1.69 | 0.512 | 0.03 | 6.70 |
| 16 | 0.03 | 0.081 | 0.595 | 51.9 | 238.2 | 0.068 | 13.0 | 0.88 | 0.514 | 0.02 | 3.97 |
| 17 | 0.02 | 0.079 | 0.595 | 53.0 | 252.8 | 0.059 | 7.6 | 0.45 | 0.516 | 0.01 | 2.33 |
| 18 | 0.01 | 0.078 | 0.595 | 53.9 | 266.4 | 0.052 | 4.5 | 0.23 | 0.517 | 0.01 | 1.36 |
| 19 | 0.01 | 0.077 | 0.595 | 54.7 | 279.0 | 0.046 | 2.6 | 0.12 | 0.518 | 0.00 | 0.79 |
| 20 | 0.00 | 0.075 | 0.595 | 55.5 | 290.7 | 0.041 | 1.5 | 0.06 | 0.520 | 0.00 | 0.45 |
| Total | 100.98 | 3.352 | 9.696 | 3112.3 | 1091.8 | 6.596 | 4.15 | 487.77 |
Table 3.
Summary of number of glass eel ha-1, production of silver eel and production of yellow eel ha-1.
Table 3.
Summary of number of glass eel ha-1, production of silver eel and production of yellow eel ha-1.
| River Køge-Lellinge | |
| Number of glass eel ha-1 | 5,570 |
| Number of silver eel ha-1 | 415 |
| Production Silver eel kg ha-1 | 48.8 |
| Biological production yellow eel kg ha-1 | 108.9 |
| No.glass eel pr kg produced silver eel | 114 |
| No. glass eel pr biological production yellow eel kg | 51 |
| River Brede | |
| Number of glass eel ha-1 | 2,894 |
| Number of silver eel ha-1 | 387 |
| Production Silver eel kg ha-1 | 49.2 |
| Biological production yellow eel kg ha-1 | 65.7 |
| No. glass eel pr kg produced silver eel | 59 |
| No. glass eel pr biological production yellow eel kg | 44 |
Disclaimer/Publisher’s Note: The statements, opinions and data contained in all publications are solely those of the individual author(s) and contributor(s) and not of MDPI and/or the editor(s). MDPI and/or the editor(s) disclaim responsibility for any injury to people or property resulting from any ideas, methods, instructions or products referred to in the content. |
© 2023 by the authors. Licensee MDPI, Basel, Switzerland. This article is an open access article distributed under the terms and conditions of the Creative Commons Attribution (CC BY) license (http://creativecommons.org/licenses/by/4.0/).
Copyright: This open access article is published under a Creative Commons CC BY 4.0 license, which permit the free download, distribution, and reuse, provided that the author and preprint are cited in any reuse.


