
Submitted:
16 October 2023
Posted:
18 October 2023
You are already at the latest version
Abstract
The water resources carrying capacity (WRCC) system comprises multiple complex and nonlinear interactions related to society, economy, water resources and the water environment. A full understanding of its internal mechanism is conducive to the further improvement of the regional WRCC. This article focuses on the temporal and spatial variability of WRCC to explore a method of dynamic successive assessment. Firstly, the Pressure-State-Response (PSR)framework is used to develop a systematic and causal indicator system. Then, The Variable Fuzzy Pattern Recognition (VFPR) model and an analytic hierarchy process-entropy (AHP-E) model are combined to successively and dynamically assess WRCC. The proposed method is applied to the dynamic successive assessment of WRCC in Hebei Province, and it is obtained that the poor water resources carrying capacity in Hebei Province is mainly due to the basic attribute of the decision of the water resources shortage, but Hebei Province actively adopts a variety of measures to save water and pressurize mining, which makes the province's water resources carrying capacity have a tendency to become better gradually. At the same time, the system dynamics model (SD) of water resources carrying capacity based on the analysis of the model structure was established. Moreover, three scenarios were designed, including existing continuation, high-efficiency water-saving, cross-regional water transfer and coordinated development, each scenario divided into high and low-speed economic development and population growth schemes, then total 6 schemes between 2023 and 2030 were simulated and predicted respectively. The results indicate that if the current development model is adopted, the water resource carrying capacity will continue to maintain low levels. It was concluded that the high-speed development of economy and population, the efficient water conservation and inter-basin transfer scenario (scenario 2 with high-speed) is the best choice for sustainable development of water resources and social economy in Hebei.
Keywords:
water resources carrying capacity
; temporal and spatial variability
; Variable Fuzzy Pattern Recognition model
; dynamic assessment method
; system dynamics model
; scenario simulation
1. Introduction
Water resources are an important basis to support the social and economic development of a region, and the carrying capacity of water resources is also widely used as an important indicator to measure the harmonious development of economy, society, and nature in a region (Ait-Aoudia and Berezowska-Azzag, 2016, Barati et al., 2019, Dai et al., 2020). Water resources carrying capacity (WRCC) refers to the ability of providing water resources to human social activities (Wang et al., 2021). With the rapid socioeconomic development and continuous urban expansion in many Asian countries, human activities are exerting increasing pressure on the water systems in the basins (Bayu et al., 2020). Zhou et al (2017) established an indicator system to calculate the comprehensive warning index of local water resource carrying capacity and analyzed the temporal trend of local water resource carrying capacity. Naimi Ait-Aoudia et al (2020) analyzed the current situation of water supply and demand in the capital Algiers, and evaluates the maximum population supported by water resources in different water supply conditions, which provides an important basis for the sustainable development of the city. Authors (Cui et al., 2018) analyzed the spatiotemporal changes in water resource carrying capacity in Anhui Province from three aspects: support, pressure, and regulation. In order to better study the carrying capacity of water resources, various new methods and theories have also been proposed and widely applied. Gong et al (2009) calculated the water resources carrying capacity of Lanzhou City by using the fuzzy comprehensive method considering the uncertainty in the evaluation of water resources carrying capacity. Based on the Ecological footprint method, Wang et al (2013b) introduced the ecological pressure index into the evaluation of water resources carrying capacity, and quantitatively evaluated the water resources carrying capacity of the basin. Qin et al (2016) proposed the concept of water resources design carrying capacity (WRDCC) and analyzed the maximum population that local water resources can support under different development models in the future. In contrast, the indicator evaluation methods focus on static trend analysis, while the SD method achieves system simulation via the dynamic feedback between various influencing factors of each subsystem.
Yang et al (2015) considered the coupling relationship between various indicators in the water resource carrying capacity indicator system and established a water resource carrying capacity SD model based on the SD model, quantitatively evaluating the changes in water resource carrying capacity under different development scenarios (WRCC-SDM). The biggest difference between SD method and other methods is its own negative feedback system, that is, a readjustment of constraint conditions. This kind of constraint can constantly change over time, so as to achieve a real dynamic simulation. The utilization of the system dynamics-based water resources model was paying attention to non-linear feedback processes through the dynamic expressions of subsystems after interconnection (Liu et al. 2022; Wang et al. 2022). Zhao et al. (2012) established the system dynamics water resources carrying capacity model including aspects of water resources, society, economy and eco-environment for Kunming city. Chen et al (2023) established the system dynamics model of water resources carrying capacity to analyze the interaction between society, economy and water resources of Linhai city. Sun and Yang (2023) established a system dynamics (SD) model to evaluate the regional water resources carrying capacity, for which several scenarios were designed: the original development scenario, the accelerated industrialization scenario, the environmental governance scenario, and the optimization development scenario. A few scholars tried to combine the indicator evaluation methods with the SD model and obtained good simulation results. Wang et al (2021) proposed an improved water resource carrying capacity assessment method based on combining the improved fuzzy comprehensive evaluation and the system dynamics model, enabling the quantitative and qualitative measurement of water resource carrying capacity.
According to the nature of the industry, the water resources carrying capacity of a region includes social, economic, ecological and other aspects, which determines the construction of the evaluation index system of the comprehensive; from the cause and effect relationship, the water resources carrying capacity and includes the state, the pressure, the response to the three aspects, which determines the coupling of water resources carrying capacity. In the evaluation of water resources carrying capacity, it is necessary to consider the comprehensiveness and coupling of water resources carrying capacity, but also to dig deeper into the determinants of the size of the comprehensive water resources carrying capacity. In this paper, we take the water shortage province of Hebei as an example. Firstly, we establish the water resources carrying capacity evaluation index system in Hebei province by considering the social, economic and ecological indexes from the aspects of pressure, state and response, then we analyze the structural characteristics of the water resources carrying capacity in Hebei province from the aspects of pressure, state and response. And then, using the SD method to build a composite system can reflect PSR complex internal relationship and make a more reasonable and reliable quantitative description for a water-socioeconomic composite system. Six reasonable scenarios were proposed to simulate the WRCC development trend in the study area under different scenarios.
2. Dynamic Successive Assessment and System Dynamics Simulation Method of WRCC
2.1. Developing Indicator System for WRCC Using the PSR Framework
Water resources carrying capacity characterizes the ability of a region's water resources to support integrated economic, social and environmental development. Developing an indicator system is an important step in WRCC assessment. The PSR framework shows causal relationships between pressure, state and response indicators (OECD, 1998), and because it systematically represents important indicators of sustainable development in a causal manner (Wang et al., 2013a), it has been widely used in various types of assessments, e.g., of water resources carrying capacity, environmental impact and sustainable development. The PSR model has been widely used in the construction of the indicator system because it can clearly show the causal relationship in the indicator system. As mentioned before, according to the nature of the industry, the water resources carrying capacity includes social, economic, ecological and other aspects, and from the perspective of causality, the water resources carrying capacity includes the state, pressure and response.
As a whole, the total water resources of a region include surface water, groundwater, rainwater, reclaimed water and other non-conventional water, the modulus of water production reflects the natural differences in water resources endowment of different regions, and the per capita water resources can visually characterize the abundance of water resources in a region. Annual precipitation is a determining factor for the amount of water resources in a given year, while the water resources utilization rate characterizes the current situation of water resources development and utilization in a region and its potential for future use. Other water sources include rainwater, recycled water, seawater, etc., the effective utilization of which can alleviate the problem of shortage of conventional water resources such as surface water and groundwater. All these indicators constitute the state (S) of water resources carrying capacity.
Living, production, agriculture and ecology are the main water-using industries, and the increase of population, industry and agriculture will increase the demand for water resources, and the ecological and environmental problems accompanying the rapid economic development will also increase the pressure on the carrying capacity of water resources. Therefore, five indicators, including population density, per capita comprehensive water consumption, water consumption of 10,000 yuan of industrial added value, water consumption of 10,000 yuan of agricultural GDP and per capita water consumption of the ecological environment, were selected to represent the pressure on water resources carrying capacity (P).
In order to improve the shortage of water resources and the deterioration of the water environment, regions have invested in the construction of urban environmental infrastructure, the treatment of industrial pollution sources and the environmental protection construction of projects, etc., and have taken measures to increase the rate of sewage treatment and the utilization rate of sewage recycling, so as to make limited water resources more effective; at the same time, they have also carried out vegetation planting to improve the rate of forest cover and to increase the amount of water resources. These indicators constitute the response measures for water resources carrying capacity (R) .
By investigating China Statistical Yearbook, Environmental Statistical Yearbook, Hebei Province Water Resources Bulletin, Economic Yearbook and each city's Statistical Yearbook, the data and information of Hebei Province from 2005 to 2015 were collected, and the evaluation index system of water resources carrying capacity of Hebei Province was constructed. At the same time, based on the literature and the national water resources development and utilization, the indicators were divided into five levels and the standard value of each level was determined, as shown in Table 1.
2.2. Assessment Method Based on VFPR and AHP Model
Based on the classical concept of fuzzy set theory founded by Zadeh, a scholar Chen Shouyu proposes a variable fuzzy set theory for the dynamic variability of fuzzy sets in the aspects of optimization, evaluation, and classification of objective things. In this theory, a series of variable fuzzy theory method systems, such as variable fuzzy optimization model, variable fuzzy evaluation model, variable fuzzy recognition model, and variable fuzzy clustering model, are extended(Chen and Guo, 2006, Wang and Xu, 2015, Fotovatikhah et al., 2018). The variable fuzzy evaluation model forms four evaluation models of a fuzzy comprehensive evaluation, ideal point TOPSIS, neural excitation function and classical fuzzy optimization by transforming the model optimization criterion parameters and distance parameters (Gebrehiwet & Luo, 2018). It overcomes the shortcomings of a single traditional evaluation method, unstable results and poor robustness.
The assessment of WRCC can be regarded as the problem of grading each sample with respect to every indicator. The process of comparing the sample indicators with indicator standards has an imprecise character, so the Variable Fuzzy Pattern Recognition(VFPR) model is a better choice for the dynamic successive assessment of WRCC.VFPR has been successfully and widely applied to many different problems, such as water resources evaluation (Duan et al., 2009), water renewal assessment (Chen and Guo, 2006), and groundwater evaluation (Zhou et al., 2009). This paper explores a dynamic successive assessment method of the WRCC based on VFPR model and AHP-E model.
In the first step, Eqs. (1) and (2) are used to normalize (rij, shj)the indicators (xij) and standards (yhj) so as to remove the influence of inverse indices and different dimensions respectively.
where xij is the value of indicator j of the sample i, i is the number of samples and j is the number of indicators; yhj is the value that defines standard h of indicator j, where h = 1, 2 ..., c, c representing the highest grade of standard; rij and shj are the results of normalization of the indicators (xij) and standards (yhj), respectively; the positive indices (X3, X7, X8, X9, X12, X13, X14, X15 and X16) are those that are positively correlated with carrying capacity; the inverse indices (X1, X2, X4, X5, X6, X10 and X11) are those that are negatively correlated with carrying capacity.
The weighting method that combines the subjective weighting method and the objective weighting method is commonly used. This weighting method is based on calculating the objective weights of various indicators, combined with the subjective weights given by the decision-makers, and using the relevant formulas to calculate the comprehensive weights of the indicators (Kuosmanen & Kortelainen, 2005).
In the second step, the judgment matrices used in the AHP-E are defined in accordance with the relative importance of the different indicators.This study uses the AHP to determine the objective weight of each index. Taking WRCC as the target layer, and WRPCC, WRSCC, WRRCC as the criterion-level indicators to build an evaluation index system (Table 1). At the same time, experts were invited to score the relative importance of each index through the 1-9 scale method, construct a pairwise comparison judgment matrix, and conduct consistency tests to determine W1i ( subjective weights of indicators).
Entropy was originally derived from the concept of thermodynamics in physics, mainly reflecting the degree of chaos in the system, and has now been used in many fields (Qiao, 2004). N. Weiner and C. E. Shannon founded information theory in 1948 (Rioul & Magossi, 2014). The entropy value theory in information theory reflects the degree of disorder of information and can be used to evaluate the amount of information. If the information entropy of the index is smaller, the more information the index provides, the greater the role in the evaluation, and the greater the weight. The entropy weight method is an objective weighting method. The greater the difference of an index, the smaller the entropy weight, the greater the amount of information provided by the index, and the greater the weight of the index (Shuai et al., 2022).
With m evaluation objects and n evaluation indicators, the original data matrix R=(rij)m×n is formed. The entropy for the ith index is defined as:
where m is the number of evaluation objects. is the entropy of the i-th index.
where Pij is the proportion of the index value of the j-th index from the i-th item. When Pij=0, the calculated entropy value is meaningless. Therefore, let PijlnPij= 0.
Calculate the entropy weight (W2i) of the j index:
In the third step, Eq.(8) is used to calculate the synthetic relative membership degree for sample i. Eq.(8) has four variants, corresponding to choices of a and p, therefore, four results are calculated for each sample.
where uhi is the synthetic relative membership degree for sample i belonging to standard h; k is the interval (ai, bi) to which sample i belongs; the ai and bi are obtained by comparing rij with shj, with ai being the minimum level of sample i, and bi being the maximum level of sample i; m is the total number of indicators; ωj is the weight of the indicator j, which is determined by the judgment matrices in the AHP-E model; a is the model optimization criterion parameter. p is the distance parameter. a and p can take the value 1 or 2 respectively. Therefore the model can be transformed into four model combinations.
When a=1, p=1, Eq.(8) is changed into a fuzzy comprehensive evaluation model:
When a=1, p=2, Eq.(8) is changed into the TOPSIS model:
When a=2, p=1, Eq.(8) is changed into the excitation function model of neurons of neural networks:
When a=2, p=2, Eq.(8) is changed into a classical fuzzy optimal model:
In the fourth step, Eq. (12) is used to calculate the characteristic value H of the sample i based on the third step, then use the average value as the assessment result.
where h is the grade of standard, with h = 1, 2... c, and c is the highest grade of standard; H is the carrying capacity of the sample i. In this way, the WRPCC, WRRCC, WRSCC can be dynamically and successively calculated by the proposed method, after that this paper uses weighting method to obtain the WRCC.
2.3. The Framework of WRCC System Dynamics of Hebei
SD is a computer-aided approach based on an analytical information and feedback system. SD understands a problem based on the close relationship between the system behavior and the internal mechanism, obtained through the established mathematical model and dynamic feedback process. The distinct advantage of SD is that it can handle highorder, non-linear, multi-feedback and complex time variant system problems (Sterman, 1994).
In the first step, analysis of the model structure of water resources carrying capacity system in Hebei Province.The water resources carrying capacity in this research is defined as the development states of the population, economy and society that can be supported by local water resources. According to the above requirements, the subsystems of the water resources carrying capacity system are the social subsystem, economic subsystem, water resources subsystem and environmental subsystem.
In the second step, based on the analysis of each subsystem and their correlation, the causal relationship diagram of the dynamic model of water resources carrying capacity in Hebei Province was drawn using Vensim software, referring to Figure 1. The casual diagram generalized the logical relations of the system. On the one hand, along with the population growth and economic speed-up in Hebei Province,a change would occur to the gap between water supply and demand. Moreover, the amount of water resources could affect the development of the regional society, economy and ecology. The model time boundary is 2005-2030, the simulation step is 1 year, the historical testing period is 2005-2022, and the simulation prediction period is 2023-2030. The model contains 4 state variables, 4 rate variables, 1 constant and 47 auxiliary variables and table functions as well as many system dynamics equations, and 19 table functions are selected as decision variables to analyze the water resources carrying capacity of Hebei under different scenarios. Force simulation. In the current situation continuation scenario, variable parameters such as total population, urbanization rate, groundwater supply, agricultural added value, industrial added value, and service industry added value are estimated using regression prediction analysis methods. Surface water supply, reclaimed water reuse, agriculture The sewage discharge coefficient, industrial wastewater discharge coefficient, service industry sewage discharge coefficient, industrial wastewater COD discharge coefficient and domestic sewage COD discharge coefficient are estimated using the arithmetic mean method.
In the third step, determine simulation scenarios.There are several different scenarios to promote the coordinated development of water resources, economy, and the environment in Hebei, and improve its WRCC. These scenarios are:
1) The status-quo scenario, maintaining the status quo social development model, and only considering the self-produced water resources in this area. This scenario was used as a reference scenario for others.
2) Efficient water conservation, according to the Opinions on the Implementation of the Strictest Water Resource Management System issued by the State Council, which determines that the total water supply of Hebei in 2015, 2020, and 2030 will be controlled at 21.7 billion m3 , 22.1 billion m3 , and 24.6 billion m3 , respectively, and for this reason, this paper selects the minimum of the groundwater and surface water supply for the period of 18 a in the period of 2005-2022.The file also determines that the water consumption of 10,000 yuan of industrial added value in 2015 is 25% less than that of 2010, and the paper sets the water use for 10,000 yuan of agricultural value added by analogy, water consumption of 10,000 yuan of value added in industry, and water consumption of 10,000 yuan of value added in services every 5 years is 25% less than that of the previous year. Also this paper sets 2025 and 2030 to increase the sewage treatment to 50% and 80%, respectively, and select the lowest value of each sewage discharge coefficient and sewage COD discharge coefficient.
3) Interregional water transfer, increasing water availability under a status quo continuation scenario. Since the official opening of the first phase of the South-to-North Water Diversion Mainline Project in December 2014, Hebei has diverted a cumulative total of 16.7 billion cubic meters of water from the river.In 2030, it is expected that 3 billion m3 of water will be transferred annually from outside through the South-to-North Water Diversion Project.
The above scenarios are taken into account and combined with the actual situation of Hebei to choose a more reasonable economic and population growth mode, so as to realize the sustainable development of Hebei's water resources and economy and society. On this basis, we further simulate the high speed, medium speed and low speed development mode of economy and population for each scenario. According to the growth law of economy and population, and combining with the actual situation of Hebei, we set the high-speed and low-speed growth of economy to 9% and 3% respectively. The high-speed and low-speed growth of population is set as 4% and 0.5% respectively, and nine scenarios are simulated.
3. Method Application
3.1. Study Site and Data
Hebei Province, located in the southeast of North China, is one of the provinces in China with a shortage of water resources, and at the same time, it is one of the provinces with the highest degree of water resources development and utilization. The total water resources of Hebei Province for many years (1956-2000) is 20.496 billion m3, and the precipitation is 531.7mm. the average water resources per capita for many years is 306.69m3, which is about 1/7 of the national average, and is far lower than the internationally recognized standard of 1,000m3 per capita, so the contradiction between water resources and water resources supply and demand is serious. The over-exploitation and utilization of water resources to support economic development has led to social, economic and environmental problems. For example, in Hebei Province, the average rate of groundwater exploitation in the past ten years has been 130%, and the problem of groundwater leakage is becoming more and more negligible. The scarcity of water resources and the deterioration of the water environment have become serious obstacles to the sustainable economic development of Hebei Province.
3.2. The WRCC Evaluation Results of Hebei Province
Considering the strong subjectivity of experts' assignment, in order to avoid too one-sided results, this paper invited three types of people as the experts in constructing judgment matrix.Separately, they are experts in agriculture, economy and environment, rural government personnel and residents.The weight of each index calculated by the AHP and entropy weight method is shown in Table 3. The comprehensive weight of each index can be obtained by adding and multiplying the two weight values.
Substituting the results of the previous calculations into the level eigenvalue formula (Eqs. (13)), the comprehensive evaluation level of the evaluation samples can be solved H. The following figure shows the comprehensive state of water resources carrying capacity in Hebei Province and the evaluation results of pressure, state and response, respectively. The evaluation results show that the water resources carrying capacity of Hebei province is always between grade 3 and 4 and close to grade 4 (the average value of many years is 3.7), which indicates that the water resources carrying capacity of Hebei province belongs to the middle-lower level. Meanwhile, the time series also shows that from 2005 to 2022, the water resources carrying capacity of Hebei Province has a trend of getting better gradually.
The results of the evaluation of pressure, state and response also show that the pressure of water resources carrying capacity in Hebei Province is between rank 1.5 and 3.5, the state is between rank 4 and 5, and the response fluctuates more obviously, from close to rank 4 to close to rank 2.5 in 2022.In addition, this paper also adopts the fuzzy synthesis method to carry out the calculation, and the evaluation results obtained are more consistent with the calculation results of variable fuzzy identification method, which are all in line with the actual situation. The validity of the method used in this paper is verified.
The same method was used to collect the national water resources carrying capacity indicator system from 2005 to 2022, and the evaluation was divided into items, and the calculation results were shown in the figure below. The comprehensive evaluation results show that from 2005 to 2022, the water resources carrying capacity of Hebei Province and the whole country have shown a trend of getting better gradually, but the water resources carrying capacity of Hebei Province is always lower than the national average, i.e., the water resources carrying capacity of Hebei Province is always lower than the level 3 and close to the level 4, while the national average level of water resources carrying capacity is 3.2, which is basically in the level of just exceeding the level 3.
According to the evaluation results of pressure, status and response, the pressure status of water resources carrying capacity in Hebei Province is good, between grade 2 and 3, but the status is very bad, between grade 4 and 5, and close to grade 5, which is consistent with the status quo of water resources shortage in Hebei Province. The response indicator has a trend of getting better gradually, from close to rank 4 to rank 3, and was close to rank 2 in 2011, which indicates that Hebei Province has taken various effective measures to alleviate the water shortage, such as groundwater pressure mining, agricultural water-saving irrigation, water-saving city creation, etc., and these initiatives have achieved initial results, making the province's water resources carrying capacity increase year by year.
Compared with the national average, the pressure indicators of Hebei Province as a whole are comparable to the national average, and all of them show a small improvement. From the perspective of specific indicators, Hebei Province is a plain area, the province's average population density (300~400) is larger, and the demand for water resources is correspondingly larger; at the same time, the per capita ecological water consumption is smaller than the national average, which is consistent with the current situation that the proportion of ecological water use in the water environment of Hebei Province is small, and the situation of the water environment is poor; however, the water consumption of 10,000 yuan of value added by industry and 10,000 yuan of GDP water consumption by agriculture in Hebei Province is smaller than the national average. However, the water consumption of 10,000 yuan of industrial added value and the water consumption of 10,000 yuan of agricultural GDP in Hebei Province are both smaller than the national average, indicating that the water consumption efficiency of Hebei Province is high, and the water resources carrying capacity pressure level is still acceptable, and is in the middle of the country.
Figure 3.
Dynamic changes of the WRPCC, WRSCC, WRRCC and WRCC in Hebei Province and China.
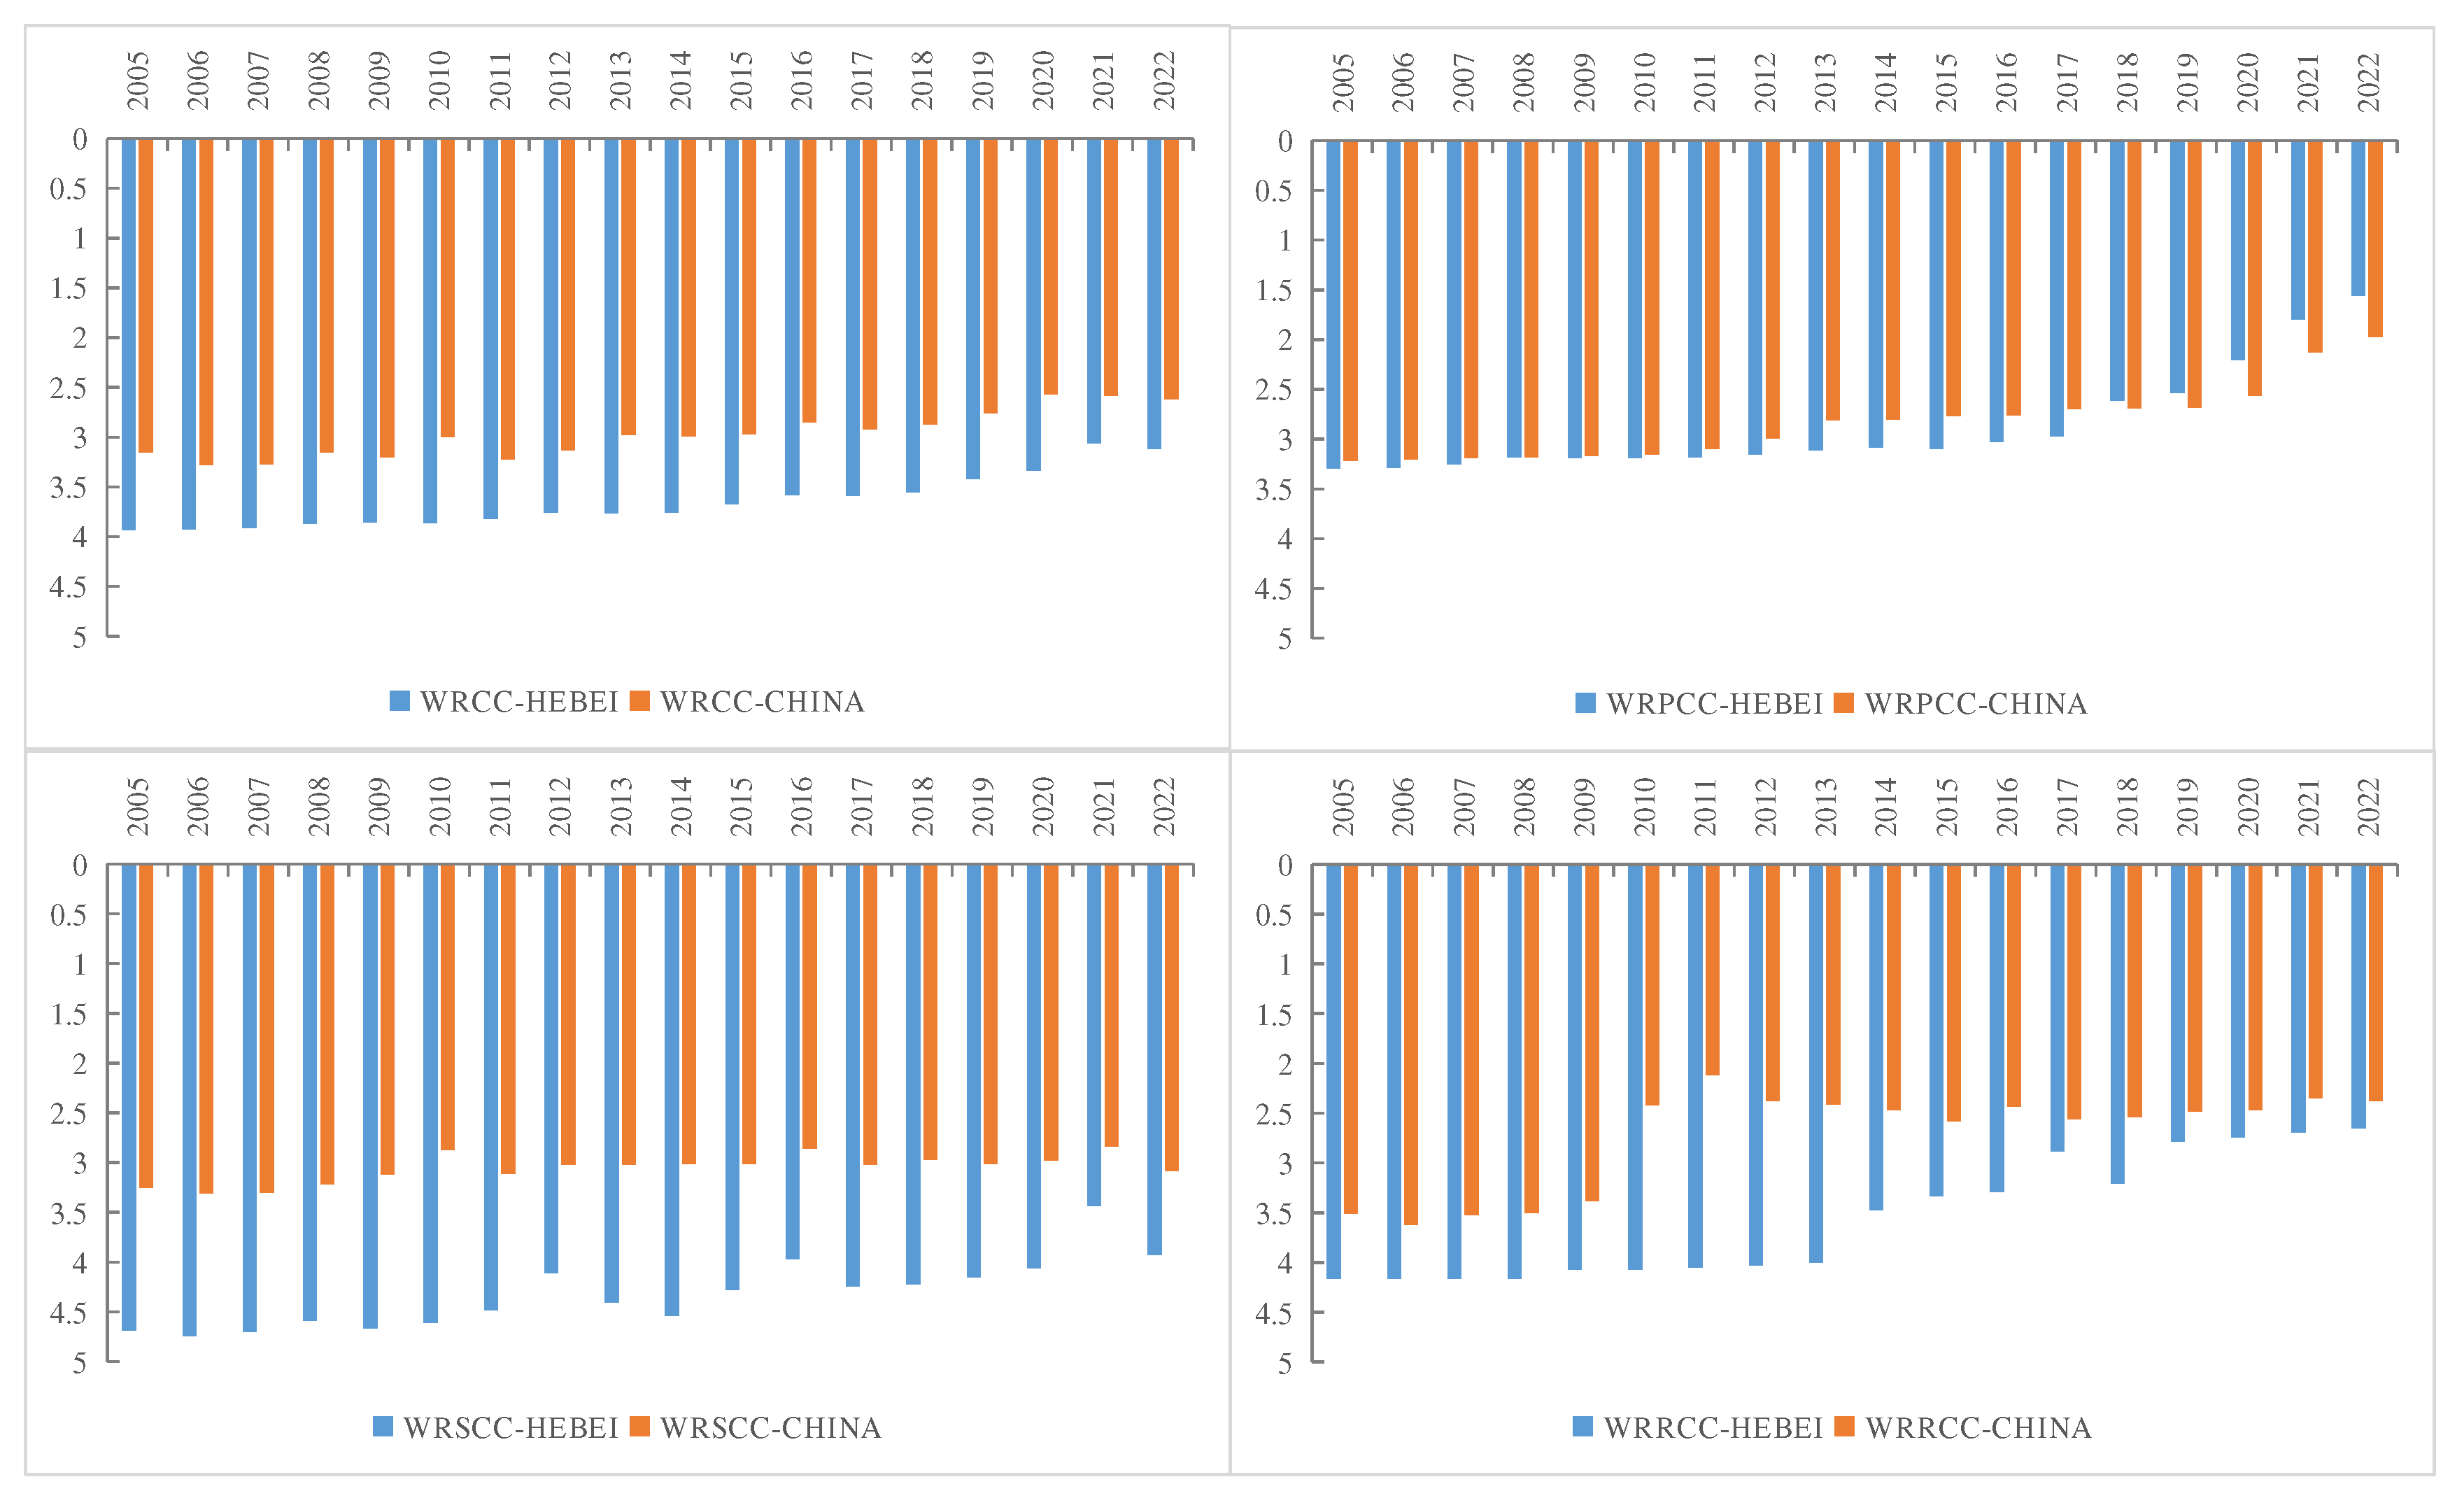
The water resources carrying capacity status indicator of Hebei Province has a low rank, between rank 4 and 5, while the national average water resources carrying capacity status fluctuates around rank 3, and the water resources status of Hebei Province is one rank lower than the national average, which also confirms the severe status of water resources scarcity in Hebei Province. The amount of self-produced water resources in Hebei Province is relatively small, with a multi-year average (2005~2022) water production modulus of only 87,200 m3/km2, which is less than 1/3 of the national average (28.1); per capita water resources is 224 m3, which is only about 1/10 of the national average (2014 m3), and is also less than 1/2 of the internationally recognized standard of 500 m3 for extreme water scarcity; the average national The national average utilization rate of water resources development is 22%, but 140% in Hebei Province, far exceeding the internationally recognized 40% ecological warning line for water resources development, seriously crowding out the ecological flow, and the self-purification capacity of the water environment has been sharply reduced. The water resources carrying capacity indicator of Hebei Province had a fluctuation of improvement in 2012 and 2021 because the precipitation (606.4mm and 790.3mm) in 2012 and 2021 was large (117% and 153% of the multi-year average), which directly led to an increase in the amount of water resources in Hebei Province in that year, and the water resources carrying capacity status also improved as a result.
In order to cope with the fact that the carrying capacity of Hebei Province's water resources is relatively poor, in recent years Hebei Province has been taking various measures to improve the efficiency of water resource allocation. For example, it has been carrying out water conservation and pressure mining in groundwater over-exploitation zones, promoting water-saving irrigation in agriculture, and actively creating water-saving cities, etc. Especially after the No.1 Document of the Central Water Conservancy of the beginning of 2010, the investment in environmental pollution control in Hebei Province has been significantly increased, and the rate of urban sewage treatment and the rate of sewage recycling utilization have been respectively higher than the national average of 10% and 80%, so that the result of the water resources carrying capacity response assessment of Hebei Province has rapidly increased from about 3.5 to about 2.5 before 2009, and from close to grade 4 to good. Therefore, the evaluation result of water resources carrying capacity of Hebei Province has increased rapidly from about 3.5 before 2009 to about 2.5, and from close to grade 4 to better than grade 3, and the growth rate and evaluation result are higher than the national average level. Correspondingly, the comprehensive water resources carrying capacity of Hebei Province also shows a small peak in 2010, indicating that these response measures have played an important role in improving the carrying capacity of water resources. In summary, the current situation of resource-based water shortage in Hebei Province has led to the low carrying capacity of water resources in Hebei Province. However, the positive response measures in recent years have led to a trend of steady improvement in the carrying capacity of water resources in Hebei Province. This reveals that the various water conservation and pressure mining measures taken by Hebei Province in recent years have achieved remarkable results, and also provides a theoretical basis for the development of Hebei Province in the future.
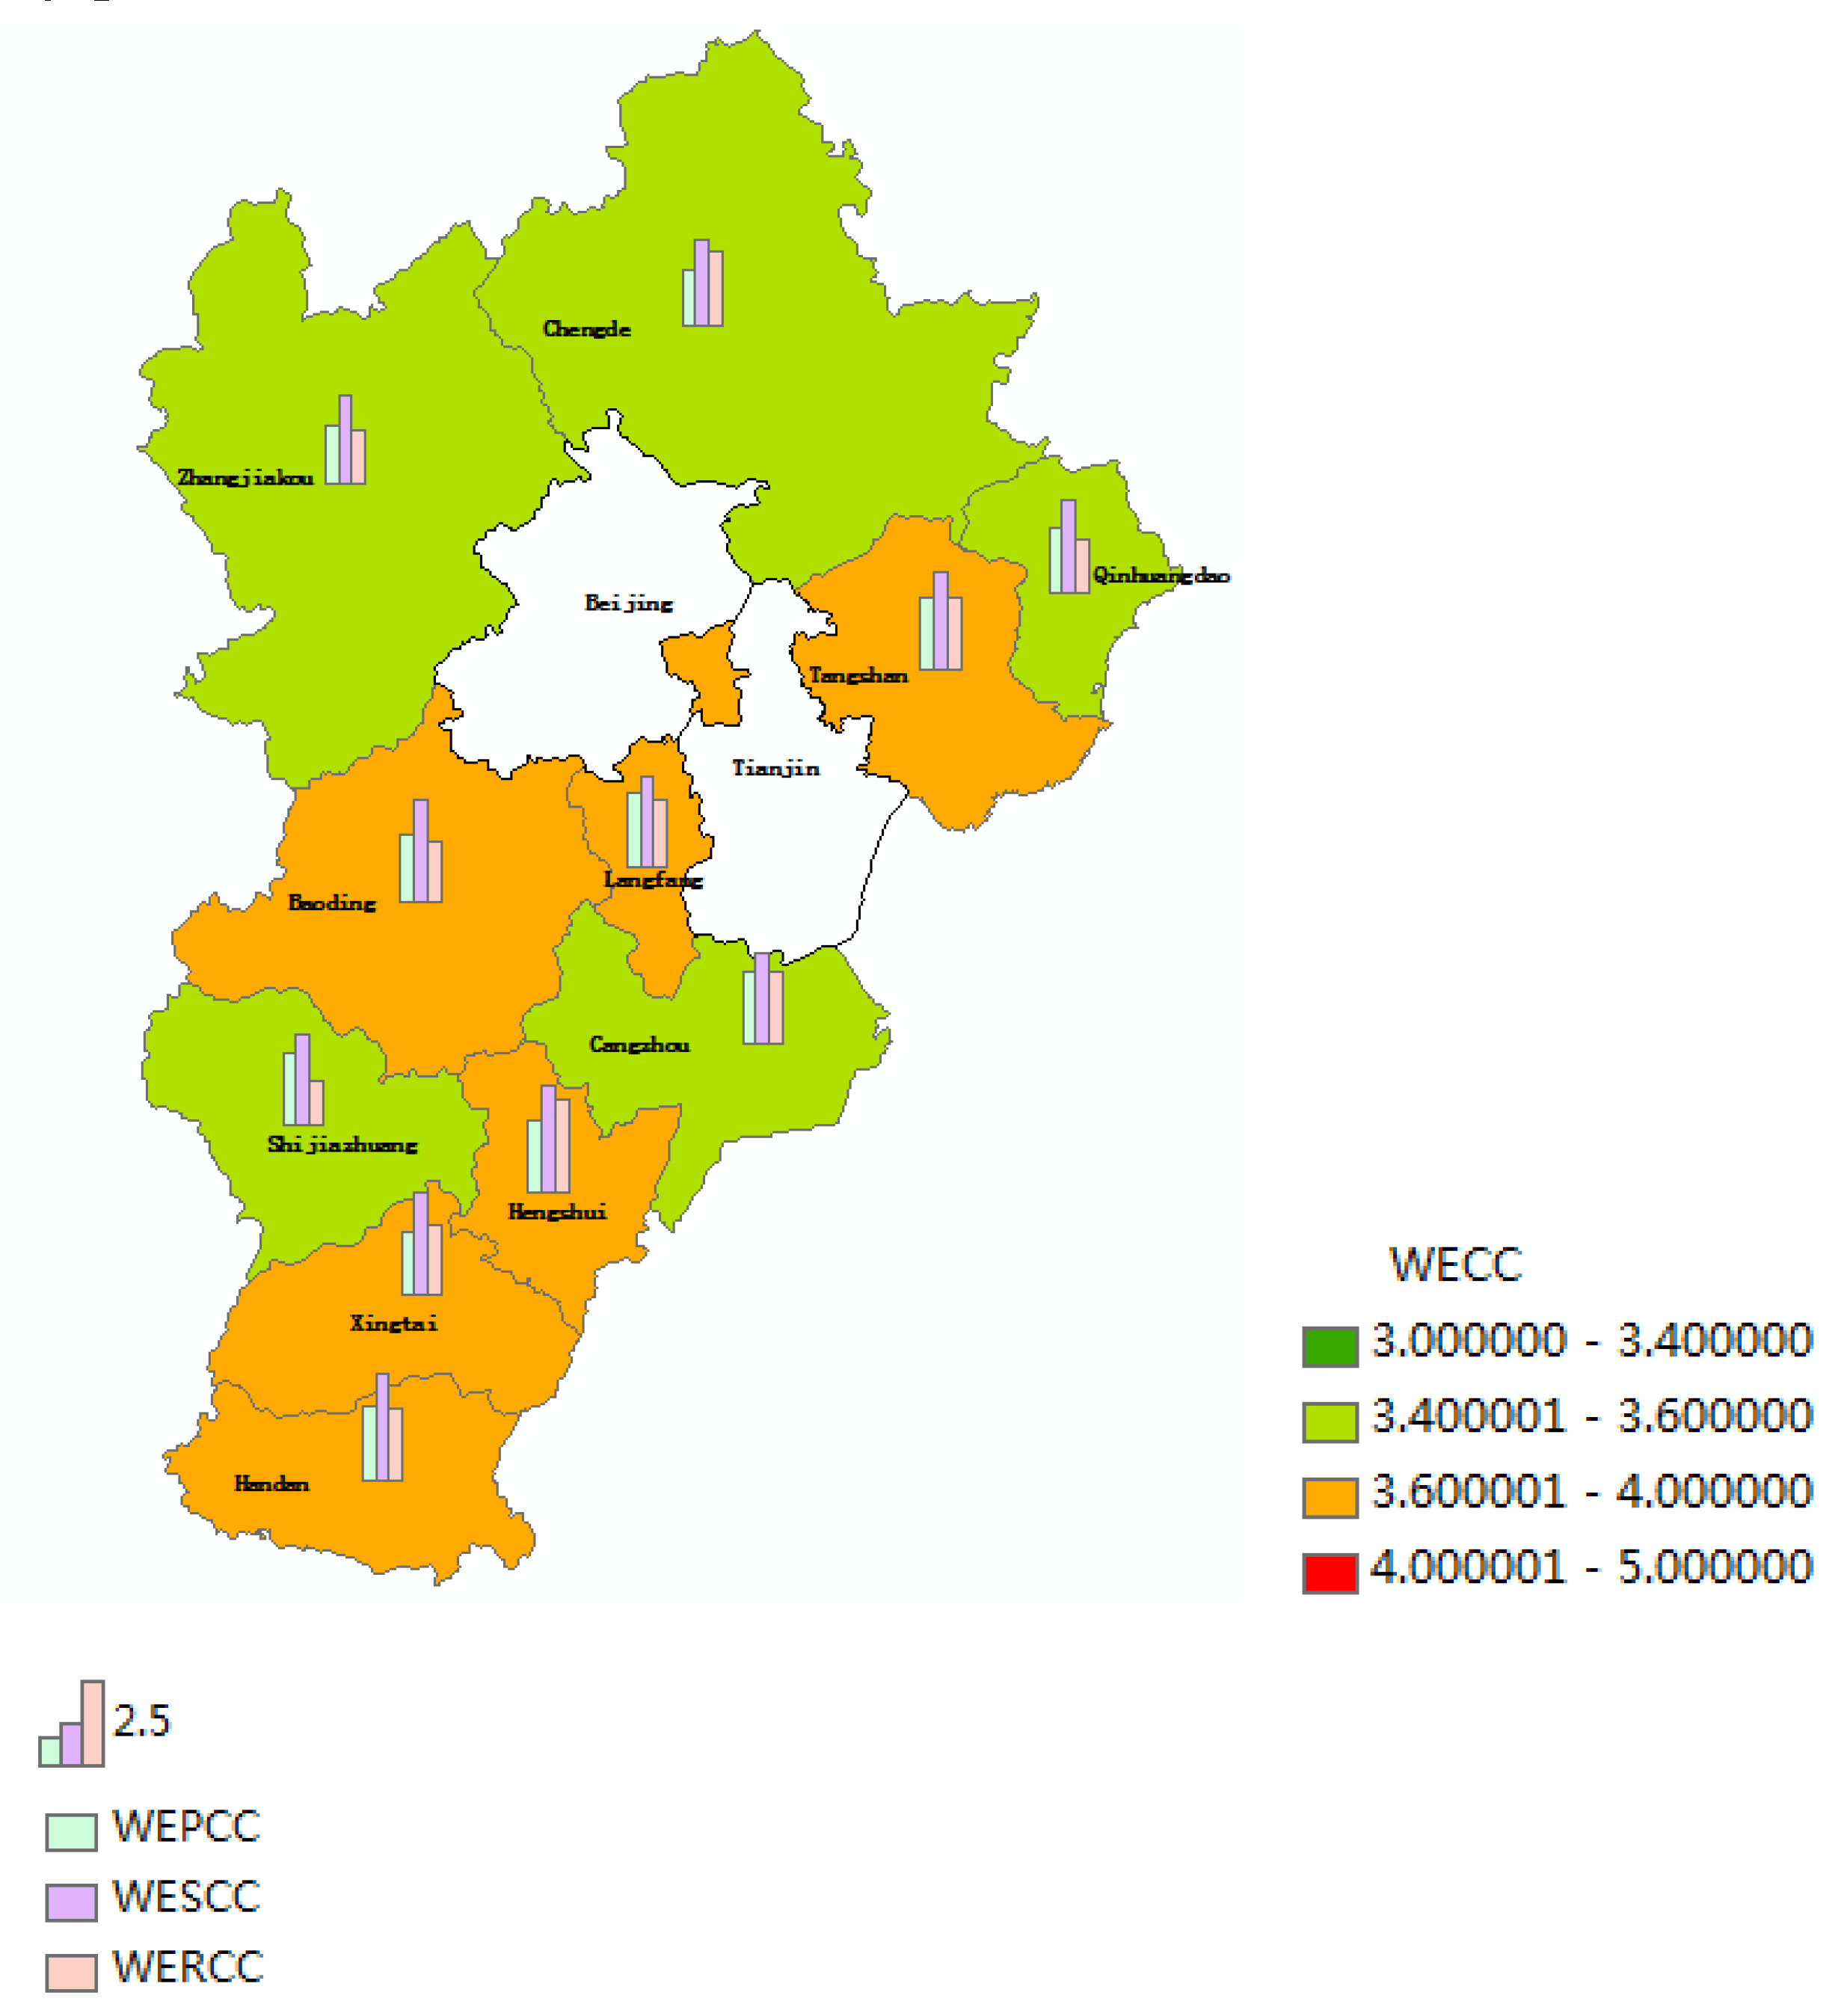
Meanwhile, in order to deeply study the spatial changes of water resources carrying capacity in Hebei Province, the water resources carrying capacity of each city in Hebei Province in 2015 was evaluated, and the distribution map of water resources carrying capacity status of each city in Hebei Province was obtained. As shown in the figure, the water resources carrying capacity of each city does not differ much, and they are also all between rank 3 and 4. Among them, the state indicator system is still the worst, the cities are in the rank 4~5, of which Handan and Hengshui cities are close to 5, indicating that the water shortage situation in these two cities is more serious; pressure indicators of the municipalities are better, are in the rank 3 or so, of which Zhangjiakou and Chengde cities have the smallest pressure indicators for about 2.5, because these two cities are sparsely populated, Zhangjiakou population density of 120 people/km2, Chengde 89 people/km2, and the population density is about 2.5. The population density of Zhangjiakou is 120 people/km2 and Chengde is 89 people/km2, which are far lower than the average population density of 396 people/km2 in Hebei Province, while Shijiazhuang (715) and Tangshan (583) are significantly higher than the provincial average, so the water resources carrying pressure in these two cities is worse; the water resources carrying capacity status indicators of the municipalities do not have a big difference, they are all in the rank of 4 or so, which indicates that the water shortage status is a serious situation faced by the municipalities; the response indicator of the municipalities There are some differences in the response indicators, from 2.0 to 4.2 are distributed, such as Shijiazhuang City, the best response status value of 2.0, is a medium level; Tangshan City, 3.3, in the province's average level; and Hengshui City, 4.2, the response measures are relatively poor.
Figure 4.
The WRPCC, WRSCC, WRRCC and WRCC of each city in Hebei Province in 2015.
3.3. The WRCC Simulation Results of Hebei Province
Selected 2005-2022 Hebei total population, GDP, water demand and sewage discharge total four key variables, the historical test, and 2005-2022, the system simulation results and the actual social economy in Hebei, the relative error of the four variables within 5%, the model is effective, see Table 4.
The status-quo scenario maintained the status quo social development model, and there was a downward trend in the regional WRCC each year. Figure 5, shows that the WRCC in the base year 2023-2030 was slowly rising and was projecting toward the poor carrying range by 2030. The current development model restricts the balance of water supply and demand, and cannot support large-scale economic and social development in the future. In addition, the study area was maintained at a poor carrying level by 2030. Although the values of various indicators were slightly lower, the basic development of Changchun in terms of economics, society, water resources and water environment is barely able to be maintained.
As can be seen from Figure 5, in terms of the development trend of the economic scale that can be carried by water resources, the economic scale that can be carried by efficient water conservation and coordinated development scenarios shows an increasing trend. And the status quo continuation and inter-region transfer scenarios water resources can carry the economic scale does not significantly increase the development trend.In terms of the development trend of the population size that can be carried by water resources, the three scenarios with high economic development show a significant increase in the population size that can be carried, and the three scenarios with low economic development show a lower increase in the population size that can be carried.
In the status quo continuation scenario, there is no significant increase in the size of the economy that can be carried by water resources, the water supply/demand ratio decreases significantly, and wastewater discharges continue to increase. In the high-efficiency water conservation scenario(scenario 1) , the scenario can significantly increase the size of the economy that can be carried by water resources, improve the efficiency of water resource utilization, can effectively reduce the total water demand while maintaining economic development, and can effectively reduce sewage discharges. While efficient water conservation scenarios(scenario 1) can increase the carrying capacity of water resources, they do not bring supply and demand into balance, while the water utilization rate in 2030 reaches a maximum of 113%, seriously exceeding the 40% international warning line, which may further deteriorate the already fragile ecological environment. For this reason this paper proposes a coordinated development combining efficient water conservation and inter-regional water transfer scenario.
Compared to the status quo continuation scenario(high-speed), the water resources carrying capacity of the efficient water conservation and inter-basin transfer scenario(scenario 2 with high-speed) increases from 5,571.27 billion yuan to 6,909.45 billion yuan, and the water resources carrying capacity of the population increases from 161,274,000 to 202,418,000 people. The carrying capacity of water resources increases only slightly from 2.76 to 2.79.
Whether Optimal Option 3 is feasible, whether it can be realized, and how to realize it is a realistic question. The strategies and feasibility of realizing efficient water conservation and expansion of water transfer on the basis of medium-rate economic and population development are analyzed as follows: In terms of efficient water conservation, since agriculture is an important pillar of Hebei's national economy, it is possible to reduce agricultural water use by adjusting the structure of the agricultural industry, reducing the cultivation of high water-consuming crops, introducing water-saving irrigation technology, changing traditional irrigation methods, and reducing water use in agriculture through management and other measures. At the same time, a water-saving society can be created by raising residents' awareness of water conservation and strengthening the capacity of domestic sewage treatment. The introduction of water-saving industries and the elimination of high water-consuming and low-capacity industries will improve industrial water-saving capacity.
In the area of inter-regional water transfers, more than 5 million people in Cangzhou, Hengshui, Handan and other areas in Hebei Province have said goodbye to their long history of drinking highly fluoridated and bitterly salted water. The first phase of the South-to-North Water Diversion Project has promoted the high-quality development of the areas along the route, and provided strong water resources support and water safety guarantee for Chinese-style modernization.
To realize harmonious development between water resources and social economy, Hebei should develop circular economy, and establish a green development view. It should vigorously carry out an urbanization development pattern of water supply via water gaging and water supply via borrowing, combination of agricultural modernization, water saving industry and service industry, and urban-rural harmonious development. Besides, urbanization development countermeasures should be adopted on such basis. Besides, Selecting the development mode according to local conditions, water resource management measures should be taken to increase the early warning ability of water resource carrying capacity, to scientifically adjust the water utilization structure, to control over development of water resources, to strengthen multi-channel opening, to intensify virtual water trade, to realize cyclic utilization of water resources, to clarify the water rights, to strengthen the national awareness of water conservation, to implement the strictest water resources management system and environmental economic policies.
4. Discussion
Many uncertainties exist in the assessment of WREE. This paper analyzes the uncertainty of the assessment results attributable to two types of choices made during model construction, i.e., different weights and random values of indicators. First, the versions with equal weights, objective weights (Entropy and PCA weights), subjective weights (AHP weights) and combination weights (AHP-E weights) were both calculated.
Figure 7 and Appendix A, show that the WREE results of five versions show the same change trends but are numerically different.The evaluation results show that the calculation results obtained by entropy weighting method and PCA weighting method are closer to each other, and equal weighting method evaluation results are better, showing that the water resources carrying capacity of Hebei Province is basically between class 3.5 and class 3, which indicates the objectivity of PCA weighting method. The results obtained by AHP and AHP-E weighting methods are closer and show that the water resources carrying capacity of Hebei Province is basically in the range of grade 4 to grade 3.5, which is lower than that obtained by the objective weighting method alone. The objective weighting method considers that the importance of these indicators in the process of determining the regional water resources carrying capacity is similar, but in fact, the amount of water resources in a region directly determines the size of the water resources carrying capacity, so the state indicator of water resources carrying capacity (S) should account for a larger weight, which is more consistent with the AHP weighting method. Therefore, this paper comprehensively considers the objective and subjective weights and adopts the AHP-E weighting method, which is also more consistent with the actual state. However, the length of time period for weight change are different, which should be researched in future.
In addition, the values of indicators inevitably have some random errors from the processes of monitoring and quantification(Wang, & Xu, 2015).The Monte Carlo method is used for a sensitivity analysis and the model parameters are as follows: the average μ is Xij; standard deviations σ are 0.1 Xij, 0.3 Xij, 0.5 Xij respectively to analyze influence of different degree of deviation; running times N is 1000. Then, the mean and 95% confidence interval of the Xij from Monte Carlo simulation are obtained. The results of assessment can be seen in Figure 8 and Appendix B. It is easy to find that the actual and the simulated results are similar and both located in the 95% confidence interval.
The WREE is a complex system, and each evaluation dimension plays a different role in the development level of the WREE. This study uses Water Resources Bulletin, Statistical Yearbook and other census data to construct panel data, and uses variable fuzzy theory to comprehensively evaluate the development of water carrying capacity in Hebei province. Compared with the previous evaluation methods, the variable fuzziness theory profoundly reveals and describes that fuzziness is the "Both A and B" characteristic of the difference between objective things and phenomena under the condition of co-dimensionality in the transition of mediation. In addition, the influence of different weights and random values of indicators were considered. On the whole, the method can reasonably quantify WRCC and sensitively reflects the changing of weights and values of indicators.
5. Conclusions
In this paper, the PSR model is used to construct the water resources carrying capacity evaluation index system, and then the structural characteristics of water resources carrying capacity in Hebei Province are analyzed from the three aspects of pressure, state, and response, and it is obtained that the poor water resources carrying capacity in Hebei Province is mainly due to the basic attribute of the decision of the water resources shortage, but Hebei Province actively adopts a variety of measures to save water and pressurize mining, which makes the province's water resources carrying capacity have a tendency to become better gradually.
At the same time, based on the status quo of poor water resources carrying capacity in Hebei Province, the study proposes six scenarios for the reference of decision makers. The simulations show that if there are no changes to the existing development model, the WRCC of Hebei will be no significant improvement before 2030, maintaining a lower normal carrying range.Through the comparative analysis of 6 schemes of 3 scenarios, it is found that the rapid growth of water resources and population, or at the expense of the growth of economy and population, regardless of the affordability of water resources, cannot guarantee the sustainable development of water resources and economic society. In the high-efficiency water conservation scenario, the scenario can significantly increase the size of the economy that can be carried by water resources, improve the efficiency of water resource utilization, can effectively reduce the total water demand while maintaining economic development, and can effectively reduce sewage discharges. However, this scenario still does not change the problem of over exploitation of water resources. Compared to the status quo continuation scenario(high-speed), the water resources carrying capacity of the efficient water conservation and inter-basin transfer scenario(scenario 2 with high-speed) can realize the healthy development of Hebei's economy and society under the premise of effectively improving the water resources carrying capacity.
This paper mainly carries out dynamic assessment and system dynamics simulation from the level of the overall water resources carrying capacity, which can provide a scientific basis for the development mode of water resources and economy and society. The research direction for the future can focus on the coupling of dynamic models and mathematical models, rather than a staged combination. Establish a coupling model based on the indicator evaluation methods and the SD model to realize the real dynamic feedback assessment between the water resources subsystems.
Author Contributions
All authors contributed to the study conception and design. Data curation, data collection and Formal analysis were performed by X.S., S.H.and A.P.;The first draft of the manuscript was written by S.H.; Writing-review & editing were performed by Y.S., A.B. and L.L.; All authors commented on previous versions of the manuscript and all authors read and approved the final manuscript.
Funding
The study is supported by the Ministry of education of Humanities and Social Science project(Grant no. 23YJC049007), the Jiangsu Provincial Basic Research Program (Natural Science Fund) (Grant no. BK2023045464), Natural Science Research Project of Jiangsu Province Colleges and Universities (Grant no. 23KJB560002), Philosophy and Social Science Project of Jiangsu Province Colleges and Universities(Grant no. 2019SJA1659).
Data Availability Statement
Data has been cited inside the manuscript and also can be provided on specific request.
Acknowledgments
Thanks to reviewers and editors for their valuable suggestions.
Conflicts of Interest
The authors declare no conflict of interest.
Appendix

Table A1.
Detail results of assessment of WREE in Hebei Province.
| Year | Weighting methods | ||||
|---|---|---|---|---|---|
| Equal weighting | Entropy weighting | AHP | AHP-E | PCA | |
| 2005 | 3.490 | 3.610 | 3.816 | 3.931 | 3.709 |
| 2006 | 3.474 | 3.606 | 3.801 | 3.927 | 3.690 |
| 2007 | 3.428 | 3.587 | 3.764 | 3.913 | 3.627 |
| 2008 | 3.368 | 3.534 | 3.713 | 3.870 | 3.555 |
| 2009 | 3.336 | 3.529 | 3.688 | 3.858 | 3.521 |
| 2010 | 3.328 | 3.529 | 3.686 | 3.861 | 3.501 |
| 2011 | 3.296 | 3.496 | 3.650 | 3.822 | 3.461 |
| 2012 | 3.244 | 3.443 | 3.556 | 3.757 | 3.390 |
| 2013 | 3.251 | 3.436 | 3.608 | 3.767 | 3.408 |
| 2014 | 3.225 | 3.435 | 3.587 | 3.759 | 3.378 |
| 2015 | 3.155 | 3.378 | 3.452 | 3.675 | 3.294 |
| 2016 | 3.084 | 3.296 | 3.355 | 3.583 | 3.202 |
| 2017 | 3.087 | 3.289 | 3.381 | 3.590 | 3.211 |
| 2018 | 3.064 | 3.221 | 3.363 | 3.556 | 3.183 |
| 2019 | 2.999 | 3.094 | 3.276 | 3.423 | 3.100 |
| 2020 | 2.947 | 2.989 | 3.220 | 3.333 | 3.035 |
| 2021 | 2.768 | 2.783 | 2.905 | 3.063 | 2.816 |
| 2022 | 2.832 | 2.830 | 3.060 | 3.115 | 2.932 |
Appendix
Table A2.
Detail results of assessment of Monte Carlo simulation ( average μ is Xij; standard deviations σ are 0.1 Xij).
Table A2.
Detail results of assessment of Monte Carlo simulation ( average μ is Xij; standard deviations σ are 0.1 Xij).
| Year | σ are 0.1 Xij | σ are 0.3 Xij | σ are 0.5 Xij | ||||||
|---|---|---|---|---|---|---|---|---|---|
| Mean | Confidence interval | Mean | Confidence interval | Mean | Confidence interval | ||||
| 2005 | 3.927 | 3.771 | 4.083 | 3.925 | 3.549 | 4.301 | 3.928 | 3.134 | 4.723 |
| 2006 | 3.927 | 3.774 | 4.080 | 3.935 | 3.547 | 4.322 | 3.916 | 3.167 | 4.665 |
| 2007 | 3.910 | 3.761 | 4.060 | 3.912 | 3.511 | 4.314 | 3.919 | 3.112 | 4.726 |
| 2008 | 3.874 | 3.725 | 4.023 | 3.878 | 3.495 | 4.260 | 3.877 | 3.115 | 4.639 |
| 2009 | 3.859 | 3.706 | 4.012 | 3.856 | 3.469 | 4.242 | 3.847 | 3.090 | 4.603 |
| 2010 | 3.864 | 3.713 | 4.014 | 3.850 | 3.472 | 4.228 | 3.853 | 3.101 | 4.604 |
| 2011 | 3.821 | 3.679 | 3.963 | 3.826 | 3.459 | 4.193 | 3.809 | 3.064 | 4.554 |
| 2012 | 3.756 | 3.607 | 3.904 | 3.746 | 3.380 | 4.111 | 3.754 | 3.037 | 4.471 |
| 2013 | 3.770 | 3.629 | 3.911 | 3.773 | 3.388 | 4.157 | 3.765 | 3.046 | 4.484 |
| 2014 | 3.754 | 3.607 | 3.900 | 3.751 | 3.388 | 4.115 | 3.748 | 3.014 | 4.482 |
| 2015 | 3.674 | 3.526 | 3.821 | 3.676 | 3.319 | 4.033 | 3.675 | 2.950 | 4.399 |
| 2016 | 3.580 | 3.441 | 3.719 | 3.588 | 3.230 | 3.947 | 3.603 | 2.902 | 4.305 |
| 2017 | 3.585 | 3.450 | 3.720 | 3.587 | 3.239 | 3.934 | 3.597 | 2.918 | 4.277 |
| 2018 | 3.557 | 3.423 | 3.691 | 3.562 | 3.211 | 3.913 | 3.562 | 2.851 | 4.274 |
| 2019 | 3.423 | 3.292 | 3.554 | 3.419 | 3.083 | 3.755 | 3.428 | 2.775 | 4.080 |
| 2020 | 3.333 | 3.197 | 3.470 | 3.336 | 2.997 | 3.674 | 3.334 | 2.691 | 3.977 |
| 2021 | 3.064 | 2.946 | 3.181 | 3.064 | 2.761 | 3.367 | 3.050 | 2.487 | 3.613 |
| 2022 | 3.114 | 2.991 | 3.237 | 3.115 | 2.809 | 3.420 | 3.124 | 2.536 | 3.712 |
References
- Ait-Aoudia, M. N., & Berezowska-Azzag, E. (2016). Water resources carrying capacity assessment: the case of Algeria's capital city. Habitat International, 58, 51-58. [CrossRef]
- Barati, A. A., Azadi, H., & Scheffran, J. (2019). A system dynamics model of smart groundwater governance. Agricultural Water Management, 221, 502-518. [CrossRef]
- Bayu, T., Kim, H., & Oki, T. (2020). Water governance contribution to water and sanitation access equality in developing countries. Water Resources Research, 56(4), e2019WR025330. [CrossRef]
- Chen, S., & Guo, Y. (2006). Variable fuzzy sets and its application in comprehensive risk evaluation for flood-control engineering system. Fuzzy Optimization and Decision Making, 5, 153-162.
- Chen, X., Xu, Q., & Cai, J. (2023). Research on the urban water resources carrying capacity by using system dynamics simulation. Hydrology Research, 54(3), 418-434. [CrossRef]
- Cui, Y., Feng, P., Jin, J., & Liu, L. (2018). Water resources carrying capacity evaluation and diagnosis based on set pair analysis and improved the entropy weight method. Entropy, 20(5), 359. [CrossRef]
- Dai, D., Sun, M., Lv, X., & Lei, K. (2020). Evaluating water resource sustainability from the perspective of water resource carrying capacity, a case study of the Yongding River watershed in Beijing-Tianjin-Hebei region, China. Environmental Science and Pollution Research, 27, 21590-21603. [CrossRef]
- Duan, C.Q., Liu, C.M., Cao, L.L., Chen, X.N., Qiu, L., 2009. Evaluation of water resources carrying capacity by a variable fuzzy set method. J. Beijing Norm. Univ. (Nat. Sci.)45, 582–584 (in Chinese).
- Fotovatikhah, F., Herrera, M., Shamshirband, S., Chau, K. W., Faizollahzadeh Ardabili, S., & Piran, M. J. (2018). Survey of computational intelligence as basis to big flood management: Challenges, research directions and future work. Engineering Applications of Computational Fluid Mechanics, 12(1), 411-437. [CrossRef]
- Gebrehiwet, T., & Luo, H. (2018). Risk level evaluation on construction project lifecycle using fuzzy comprehensive evaluation and TOPSIS. Symmetry, 11(1), 12. [CrossRef]
- Gong, L., & Jin, C. (2009). Fuzzy comprehensive evaluation for carrying capacity of regional water resources. Water resources management, 23, 2505-2513. [CrossRef]
- Huicheng, Z., Guoli, W., & Qing, Y. (1999). A multi-objective fuzzy pattern recognition model for assessing groundwater vulnerability based on the DRASTIC system. Hydrological Sciences Journal, 44(4), 611-618. [CrossRef]
- Liu, P., Lü, S., Han, Y., Wang, F., & Tang, L. (2022). Comprehensive evaluation on water resources carrying capacity based on water-economy-ecology concept framework and EFAST-cloud model: A case study of Henan Province, China. Ecological Indicators, 143, 109392. [CrossRef]
- OECD, 1998. Towards Sustainable Development Environmental Indicators: Environmental Indicators. OECD Publishing.
- Qiao, J. J. (2004). Application of improved entropy method in Henan sustainable development evaluation. Resources science, 26(1), 113-118.
- Qin, G., Li, H., Wang, X., & Ding, J. (2016). Research on water resources design carrying capacity. Water, 8(4), 157. [CrossRef]
- Rioul, O., & Magossi, J. C. (2014). On Shannon’s formula and Hartley’s rule: Beyond the mathematical coincidence. Entropy, 16(9), 4892-4910. [CrossRef]
- Shuai, L., Hong, W., Xi-lu, N. I., Yan-wen, G. U., & Chang-xiao, L. I. (2014). Evaluation of urban human settlement quality in Ningxia based on AHP and the entropy method. Yingyong Shengtai Xuebao, 25(9).
- Sun, B., & Yang, X. (2019). Simulation of water resources carrying capacity in Xiong’an New Area based on system dynamics model. Water, 11(5), 1085. [CrossRef]
- Wang, G., Xiao, C., Qi, Z., Meng, F., & Liang, X. (2021). Development tendency analysis for the water resource carrying capacity based on system dynamics model and the improved fuzzy comprehensive evaluation method in the Changchun city, China. Ecological Indicators, 122, 107232. [CrossRef]
- Wang, X., Liu, L., Zhang, S., & Gao, C. (2022). Dynamic simulation and comprehensive evaluation of the water resources carrying capacity in Guangzhou city, China. Ecological Indicators, 135, 108528.
- Wang, Q., Yuan, X., Zhang, J., Mu, R., Yang, H., & Ma, C. (2013a). Key evaluation framework for the impacts of urbanization on air environment–A case study. Ecological Indicators, 24, 266-272. [CrossRef]
- Wang, S., Yang, F. L., Xu, L., & Du, J. (2013b). Multi-scale analysis of the water resources carrying capacity of the Liaohe Basin based on ecological footprints. Journal of cleaner production, 53, 158-166. [CrossRef]
- Wang, T., & Xu, S. (2015). Dynamic successive assessment method of water environment carrying capacity and its application. Ecological Indicators, 52, 134-146. [CrossRef]
- Yang, J., Lei, K., Khu, S., & Meng, W. (2015). Assessment of water resources carrying capacity for sustainable development based on a system dynamics model: a case study of Tieling City, China. Water Resources Management, 29, 885-899. [CrossRef]
- Zhou, R., Pan, Z., Jin, J., Li, C., & Ning, S. (2017). Forewarning model of regional water resources carrying capacity based on combination weights and entropy principles. Entropy, 19(11), 574. [CrossRef]
- Zhao, X., Rao, H., Yi, Q., He, C. & Yang, H. (2012). Scenarios simulation on carrying capacity of water resources in Kunming City. Procedia Earth and Planetary Science 5, 107-112.
- Zhang, Z., Lu, W. X., Zhao, Y., & Song, W. B. (2014). Development tendency analysis and evaluation of the water ecological carrying capacity in the Siping area of Jilin Province in China based on system dynamics and analytic hierarchy process. Ecological modelling, 275, 9-21. [CrossRef]
Figure 1.
The causal relationship diagram of water resource carrying capacity in Hebei Province.
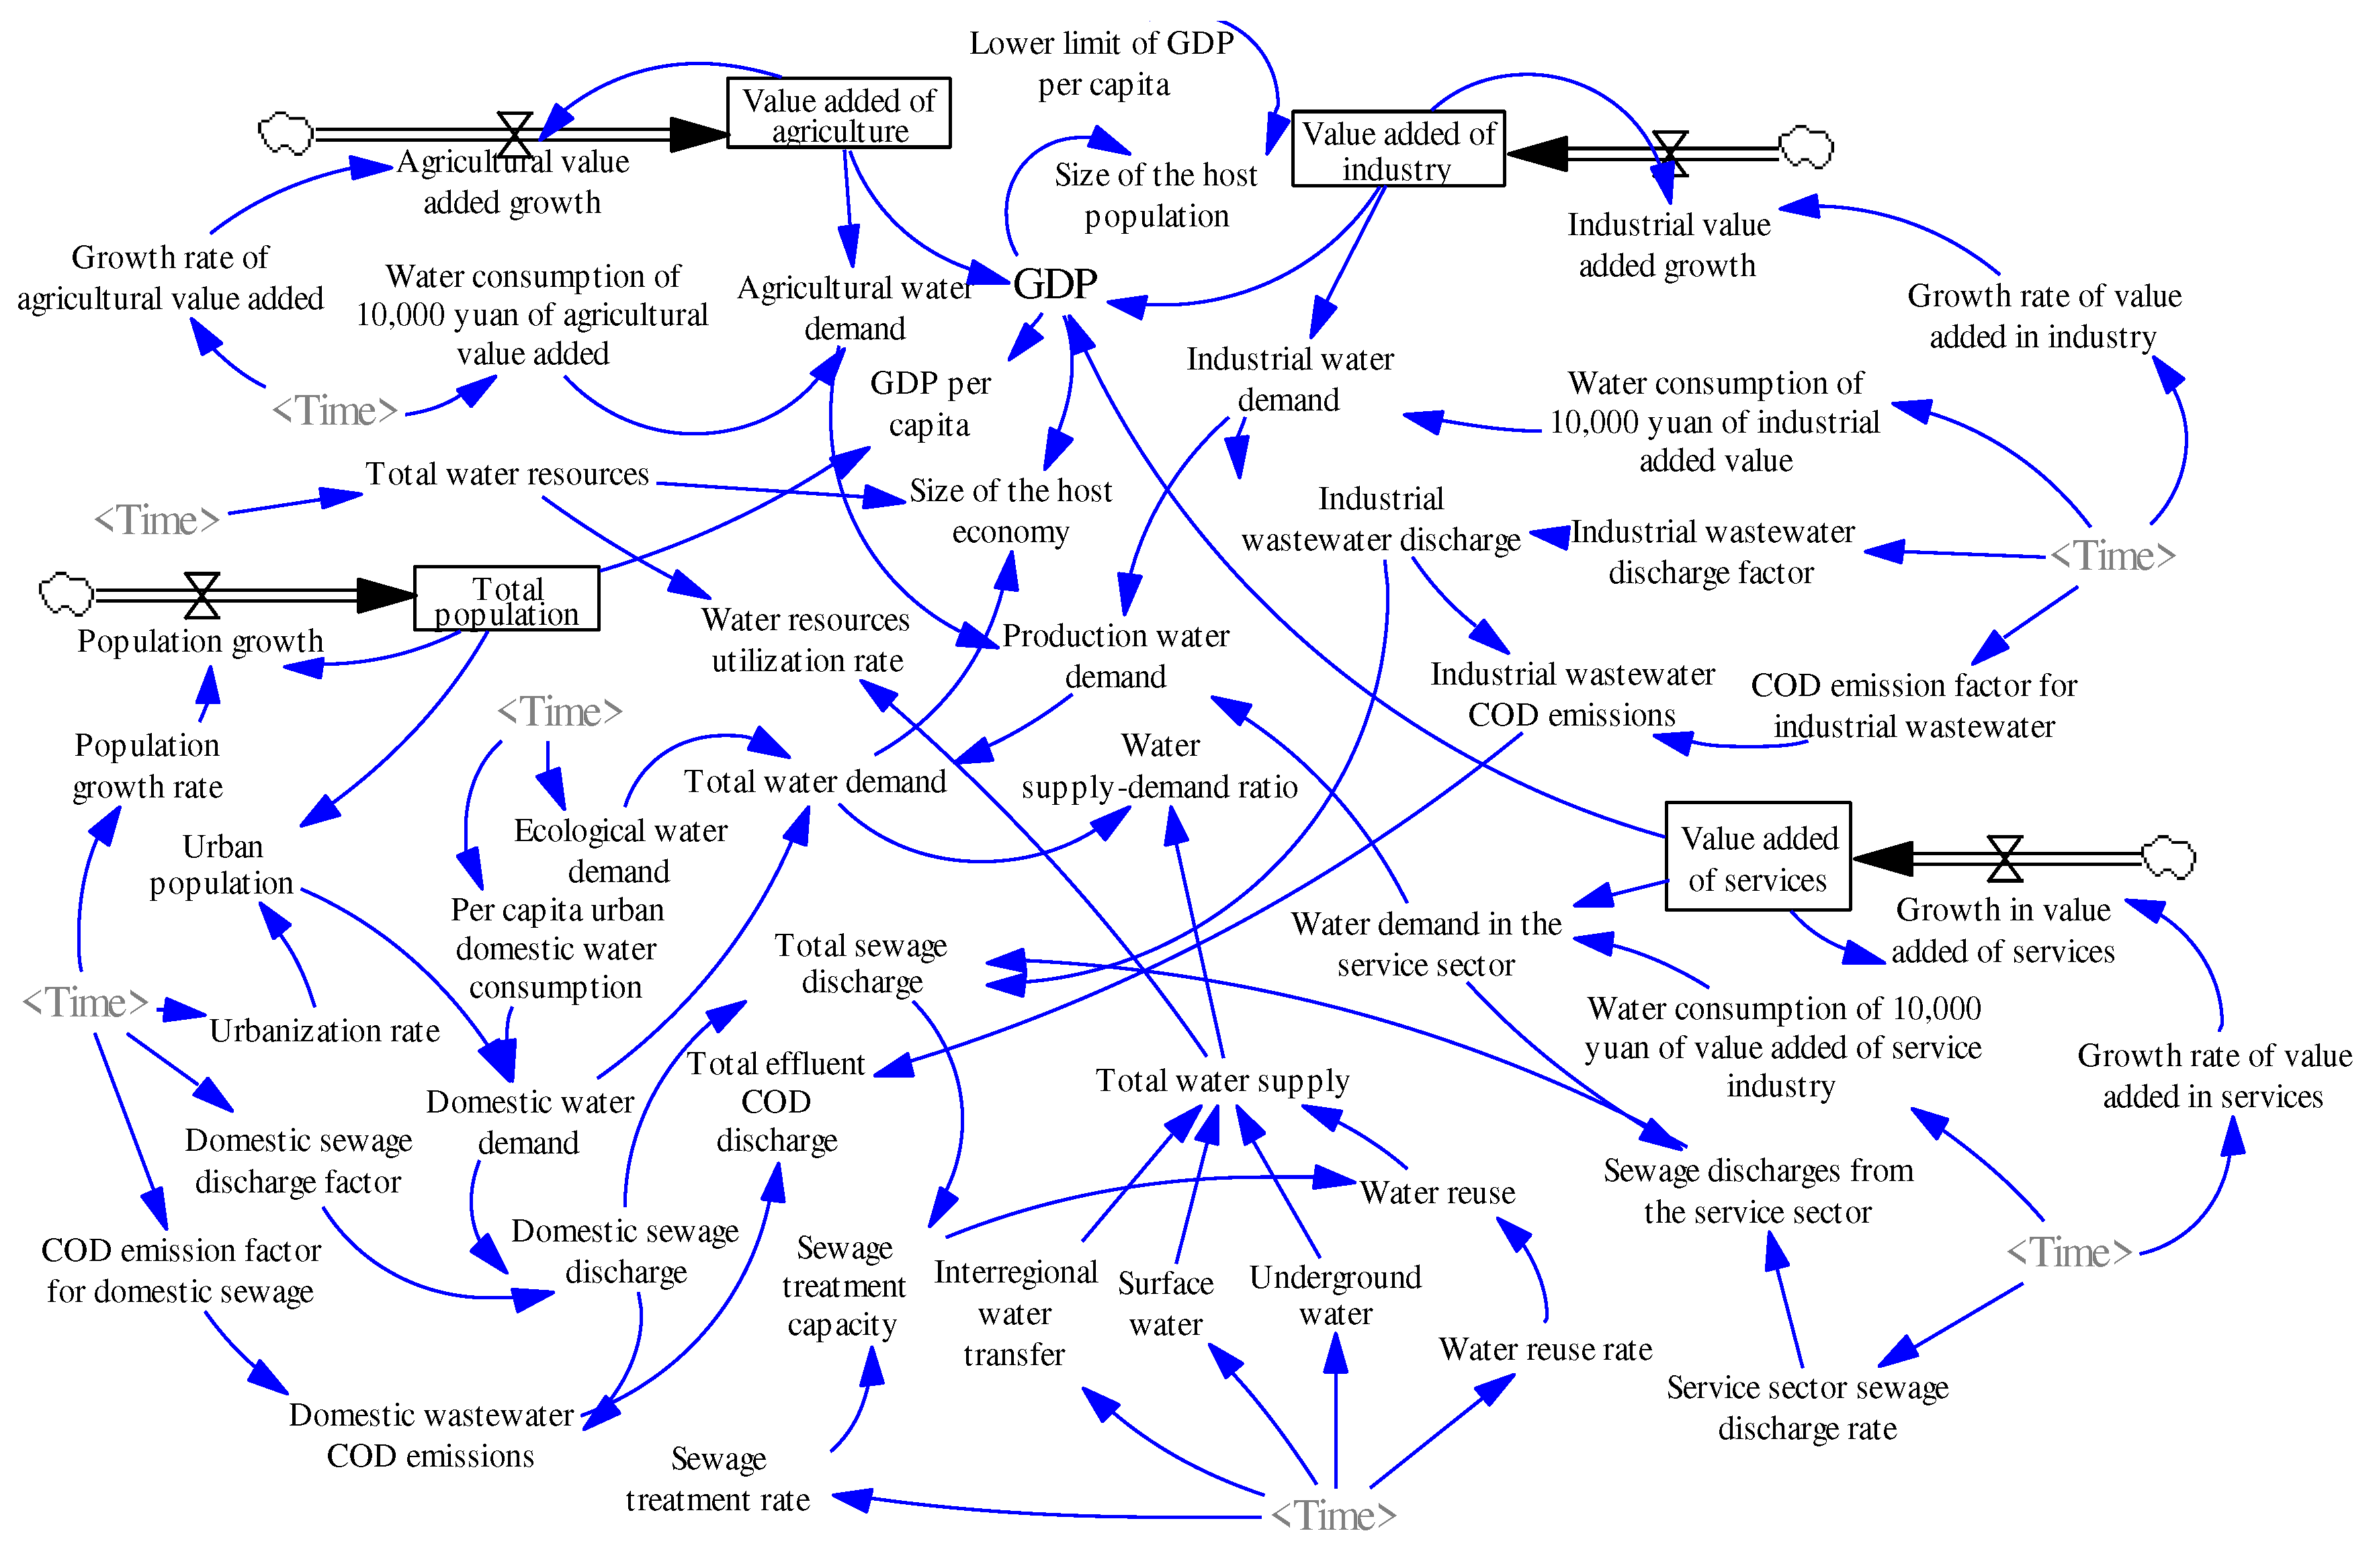
Figure 2.
Dynamic changes of the WRPCC, WRSCC, WRRCC and WRCC in Hebei Province (WRCC-FCA is obtained by the FCA method, the others are obtained by the proposed method).
Figure 2.
Dynamic changes of the WRPCC, WRSCC, WRRCC and WRCC in Hebei Province (WRCC-FCA is obtained by the FCA method, the others are obtained by the proposed method).
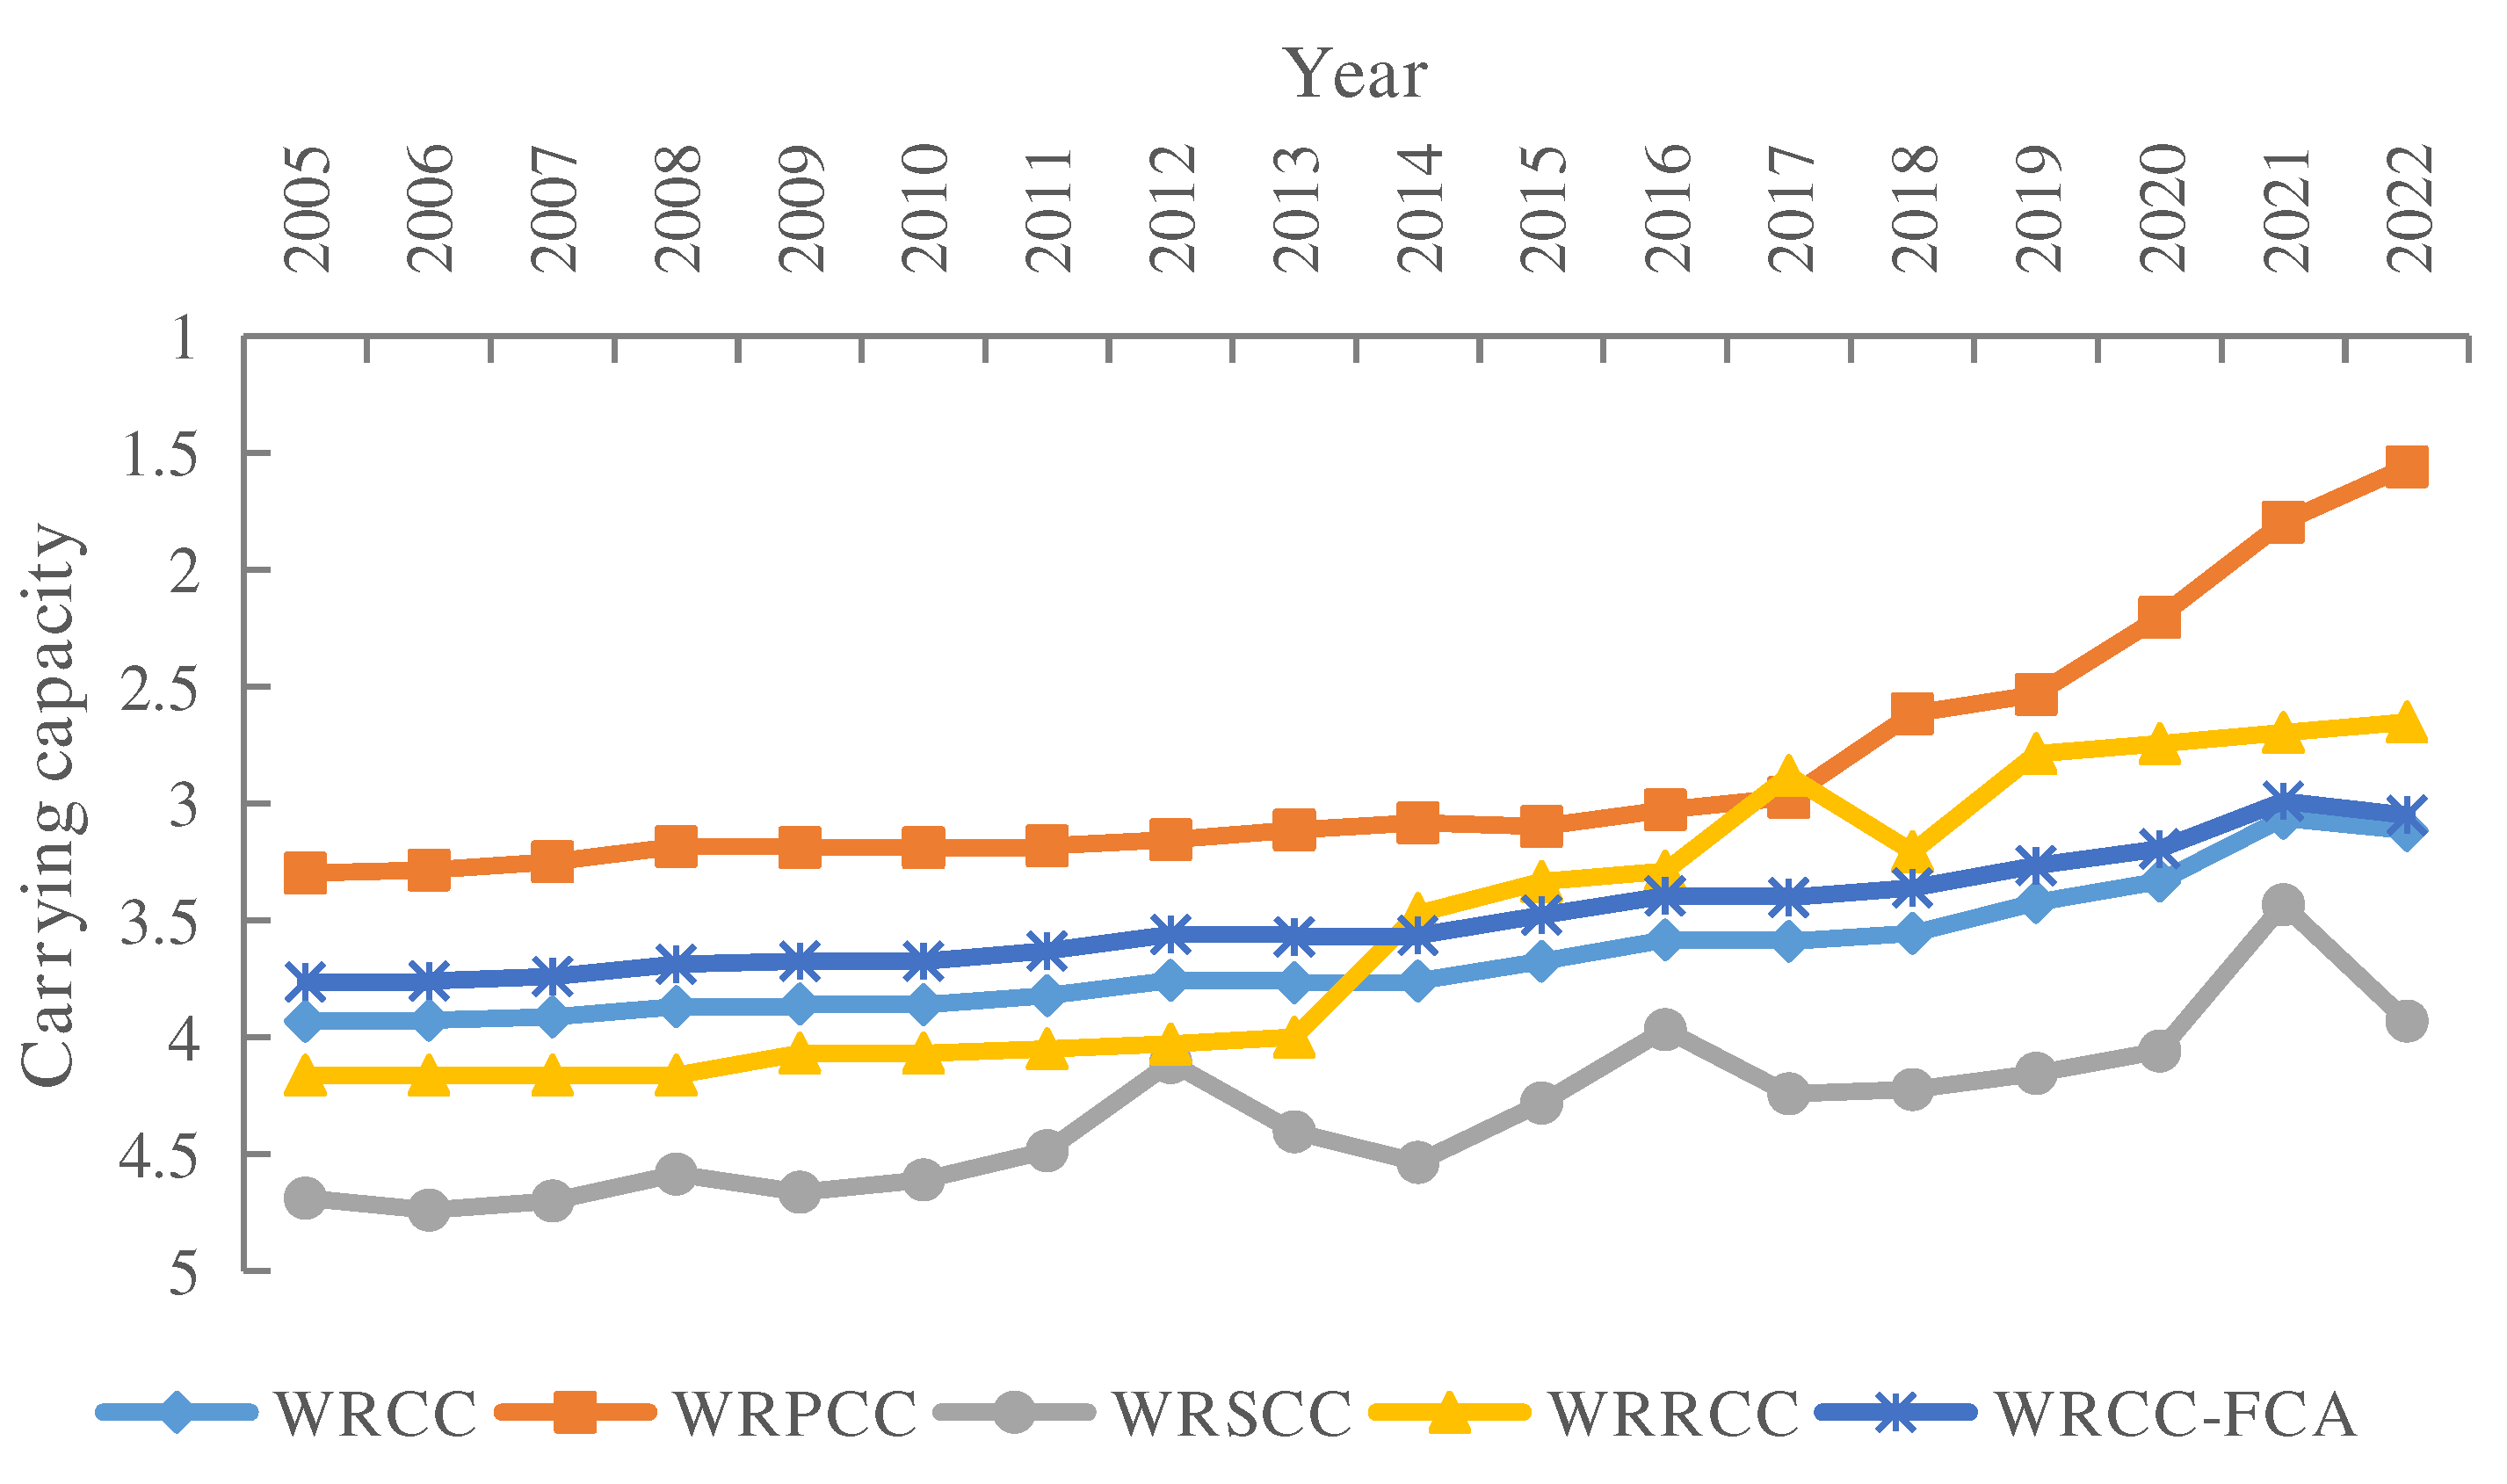
Figure 5.
The dynamic trends of the representative indicators in different scenarios.
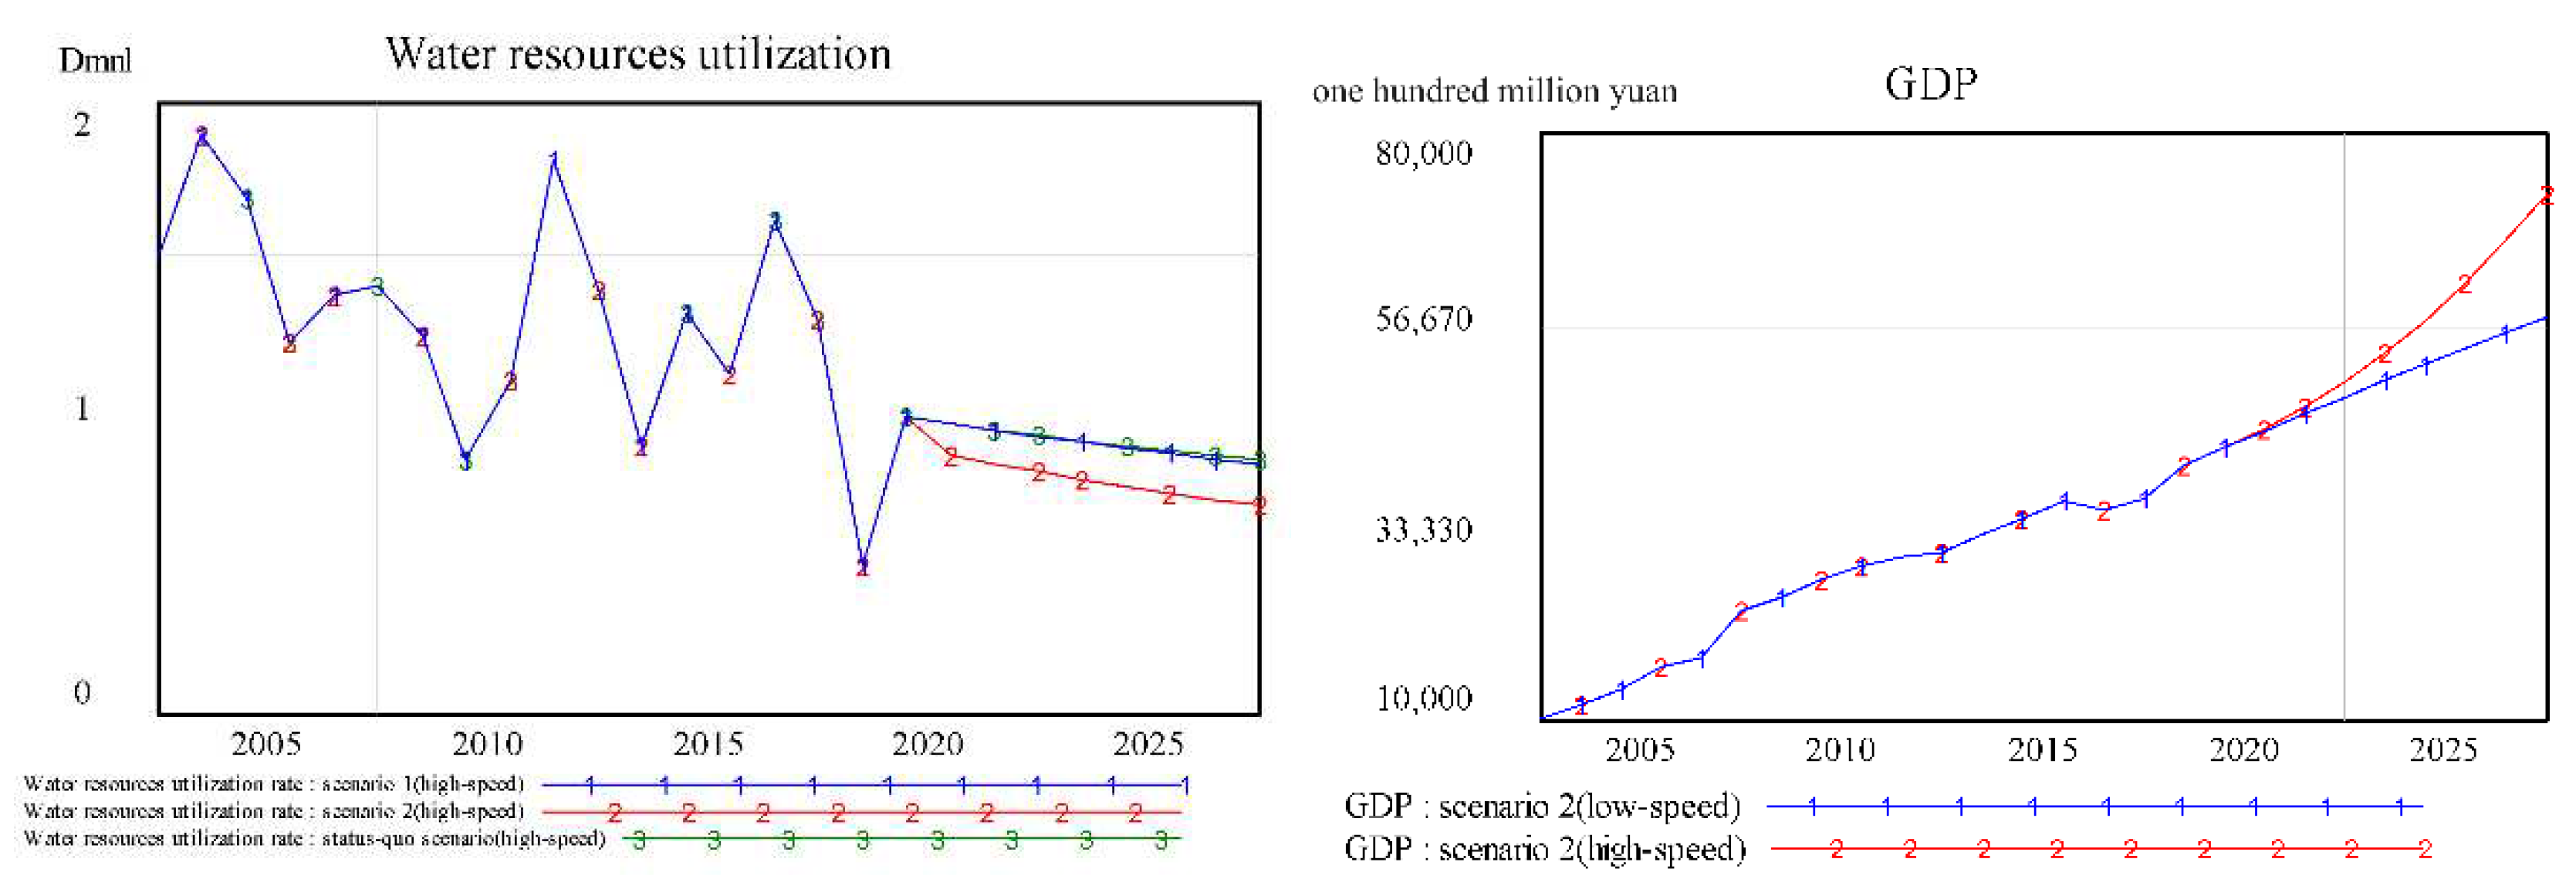
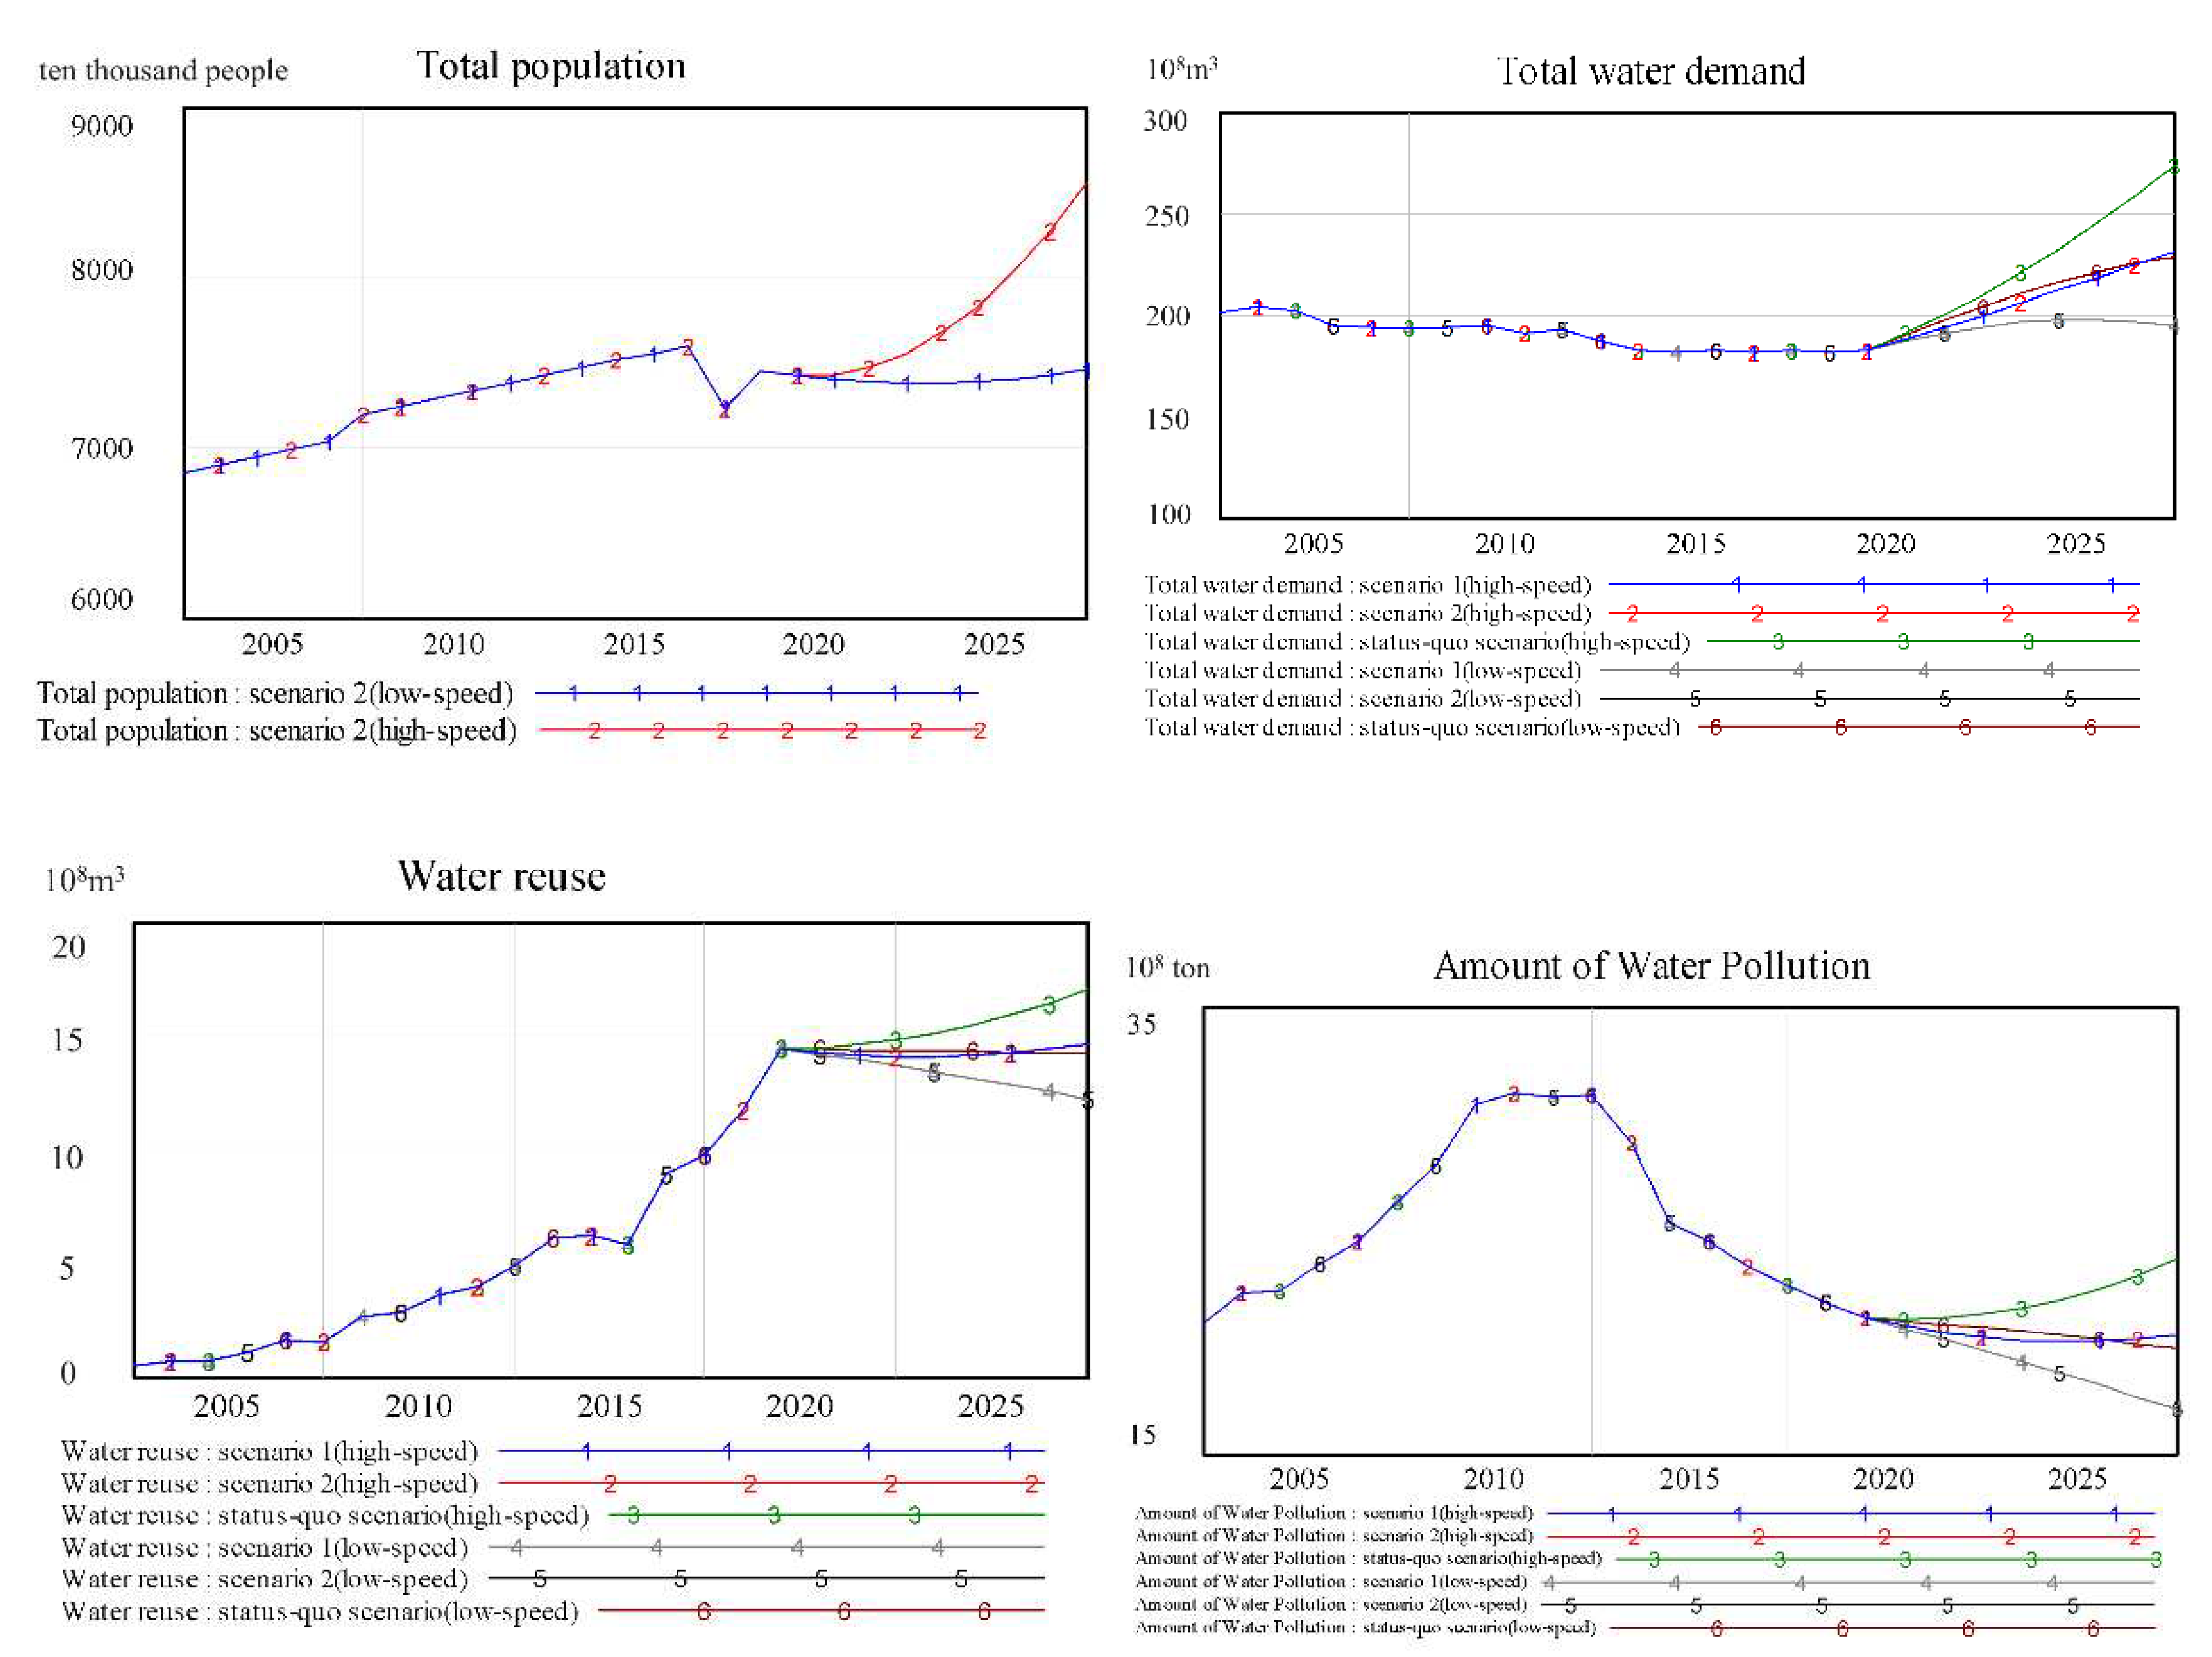
Figure 6.
The dynamic trends of the WRCC index in different scenarios.
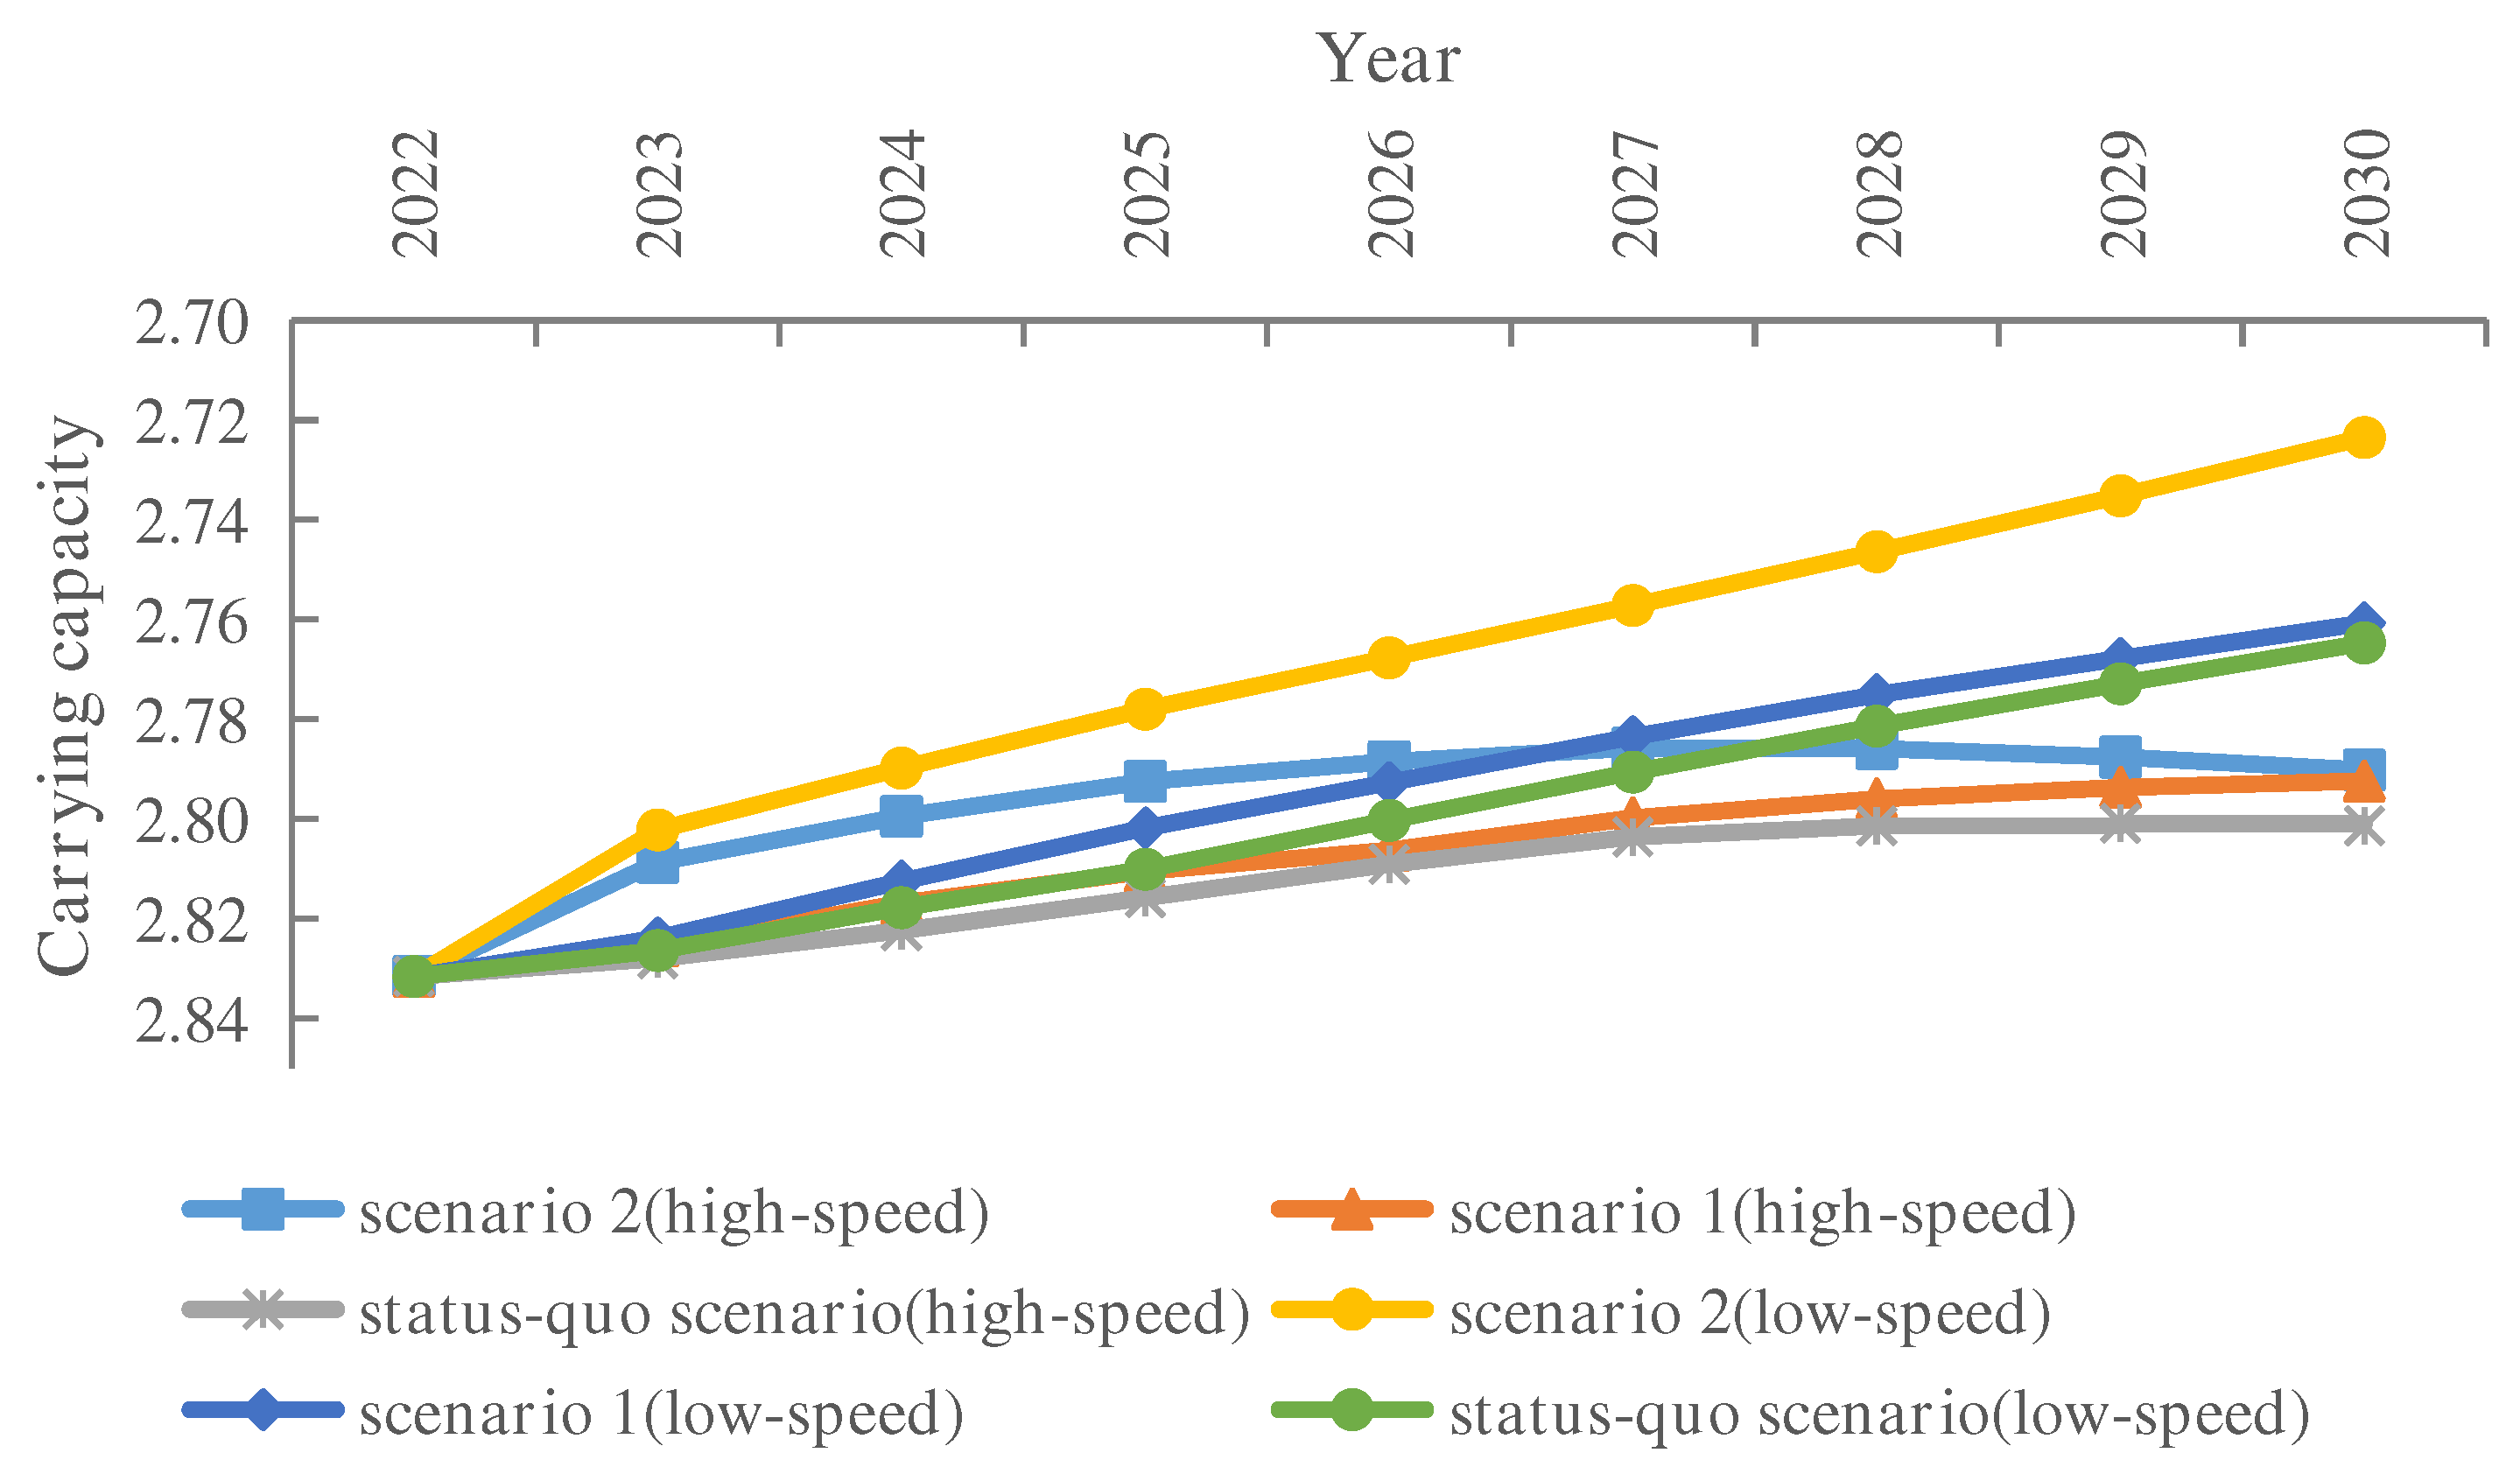
Figure 7.
Dynamic changes of the WRPCC, WRSCC, WRRCC and WRCC in Hebei Province (WRCCFCA is obtained by the FCA method, the others are obtained by the proposed method).
Figure 7.
Dynamic changes of the WRPCC, WRSCC, WRRCC and WRCC in Hebei Province (WRCCFCA is obtained by the FCA method, the others are obtained by the proposed method).
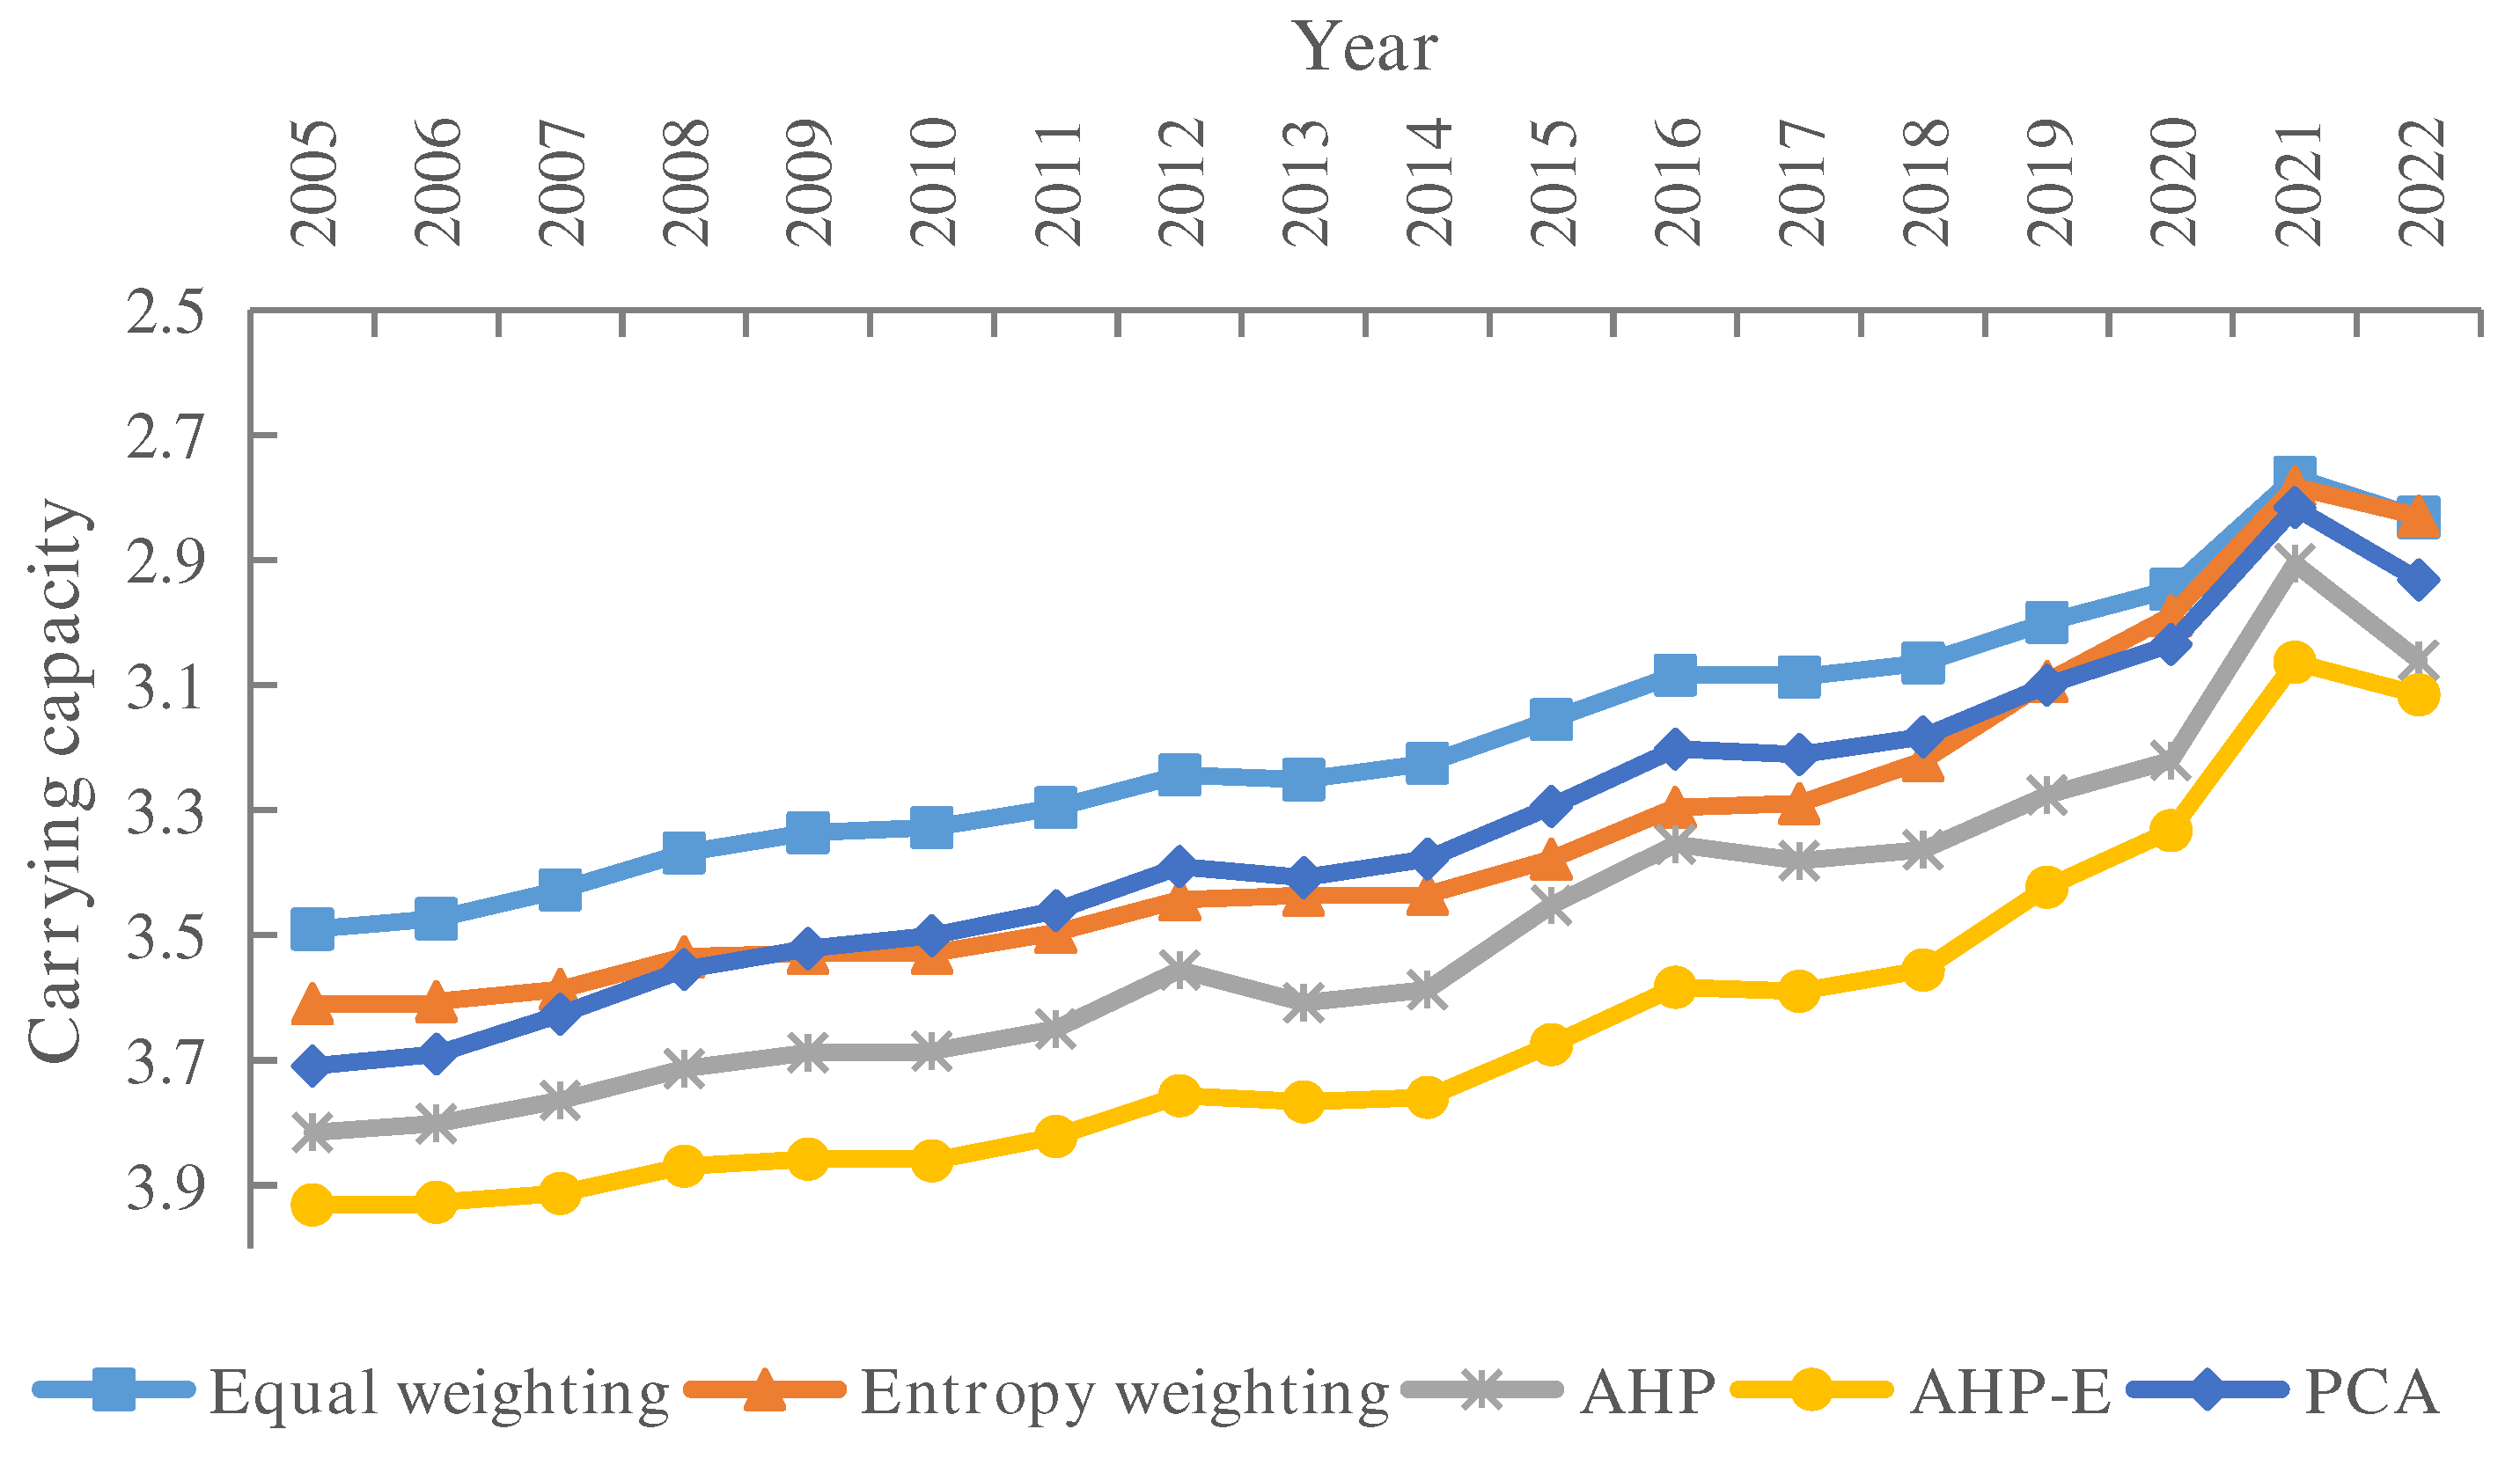
Figure 8.
Uncertainty analysis showing the method results calculated using the proposed method (gray bars, AHP-E weights), the mean from the Monte Carlo simulation (square black dot), 95% confidence interval (error bars). μ, σ and N are parameters of Monte Carlo model.
Figure 8.
Uncertainty analysis showing the method results calculated using the proposed method (gray bars, AHP-E weights), the mean from the Monte Carlo simulation (square black dot), 95% confidence interval (error bars). μ, σ and N are parameters of Monte Carlo model.
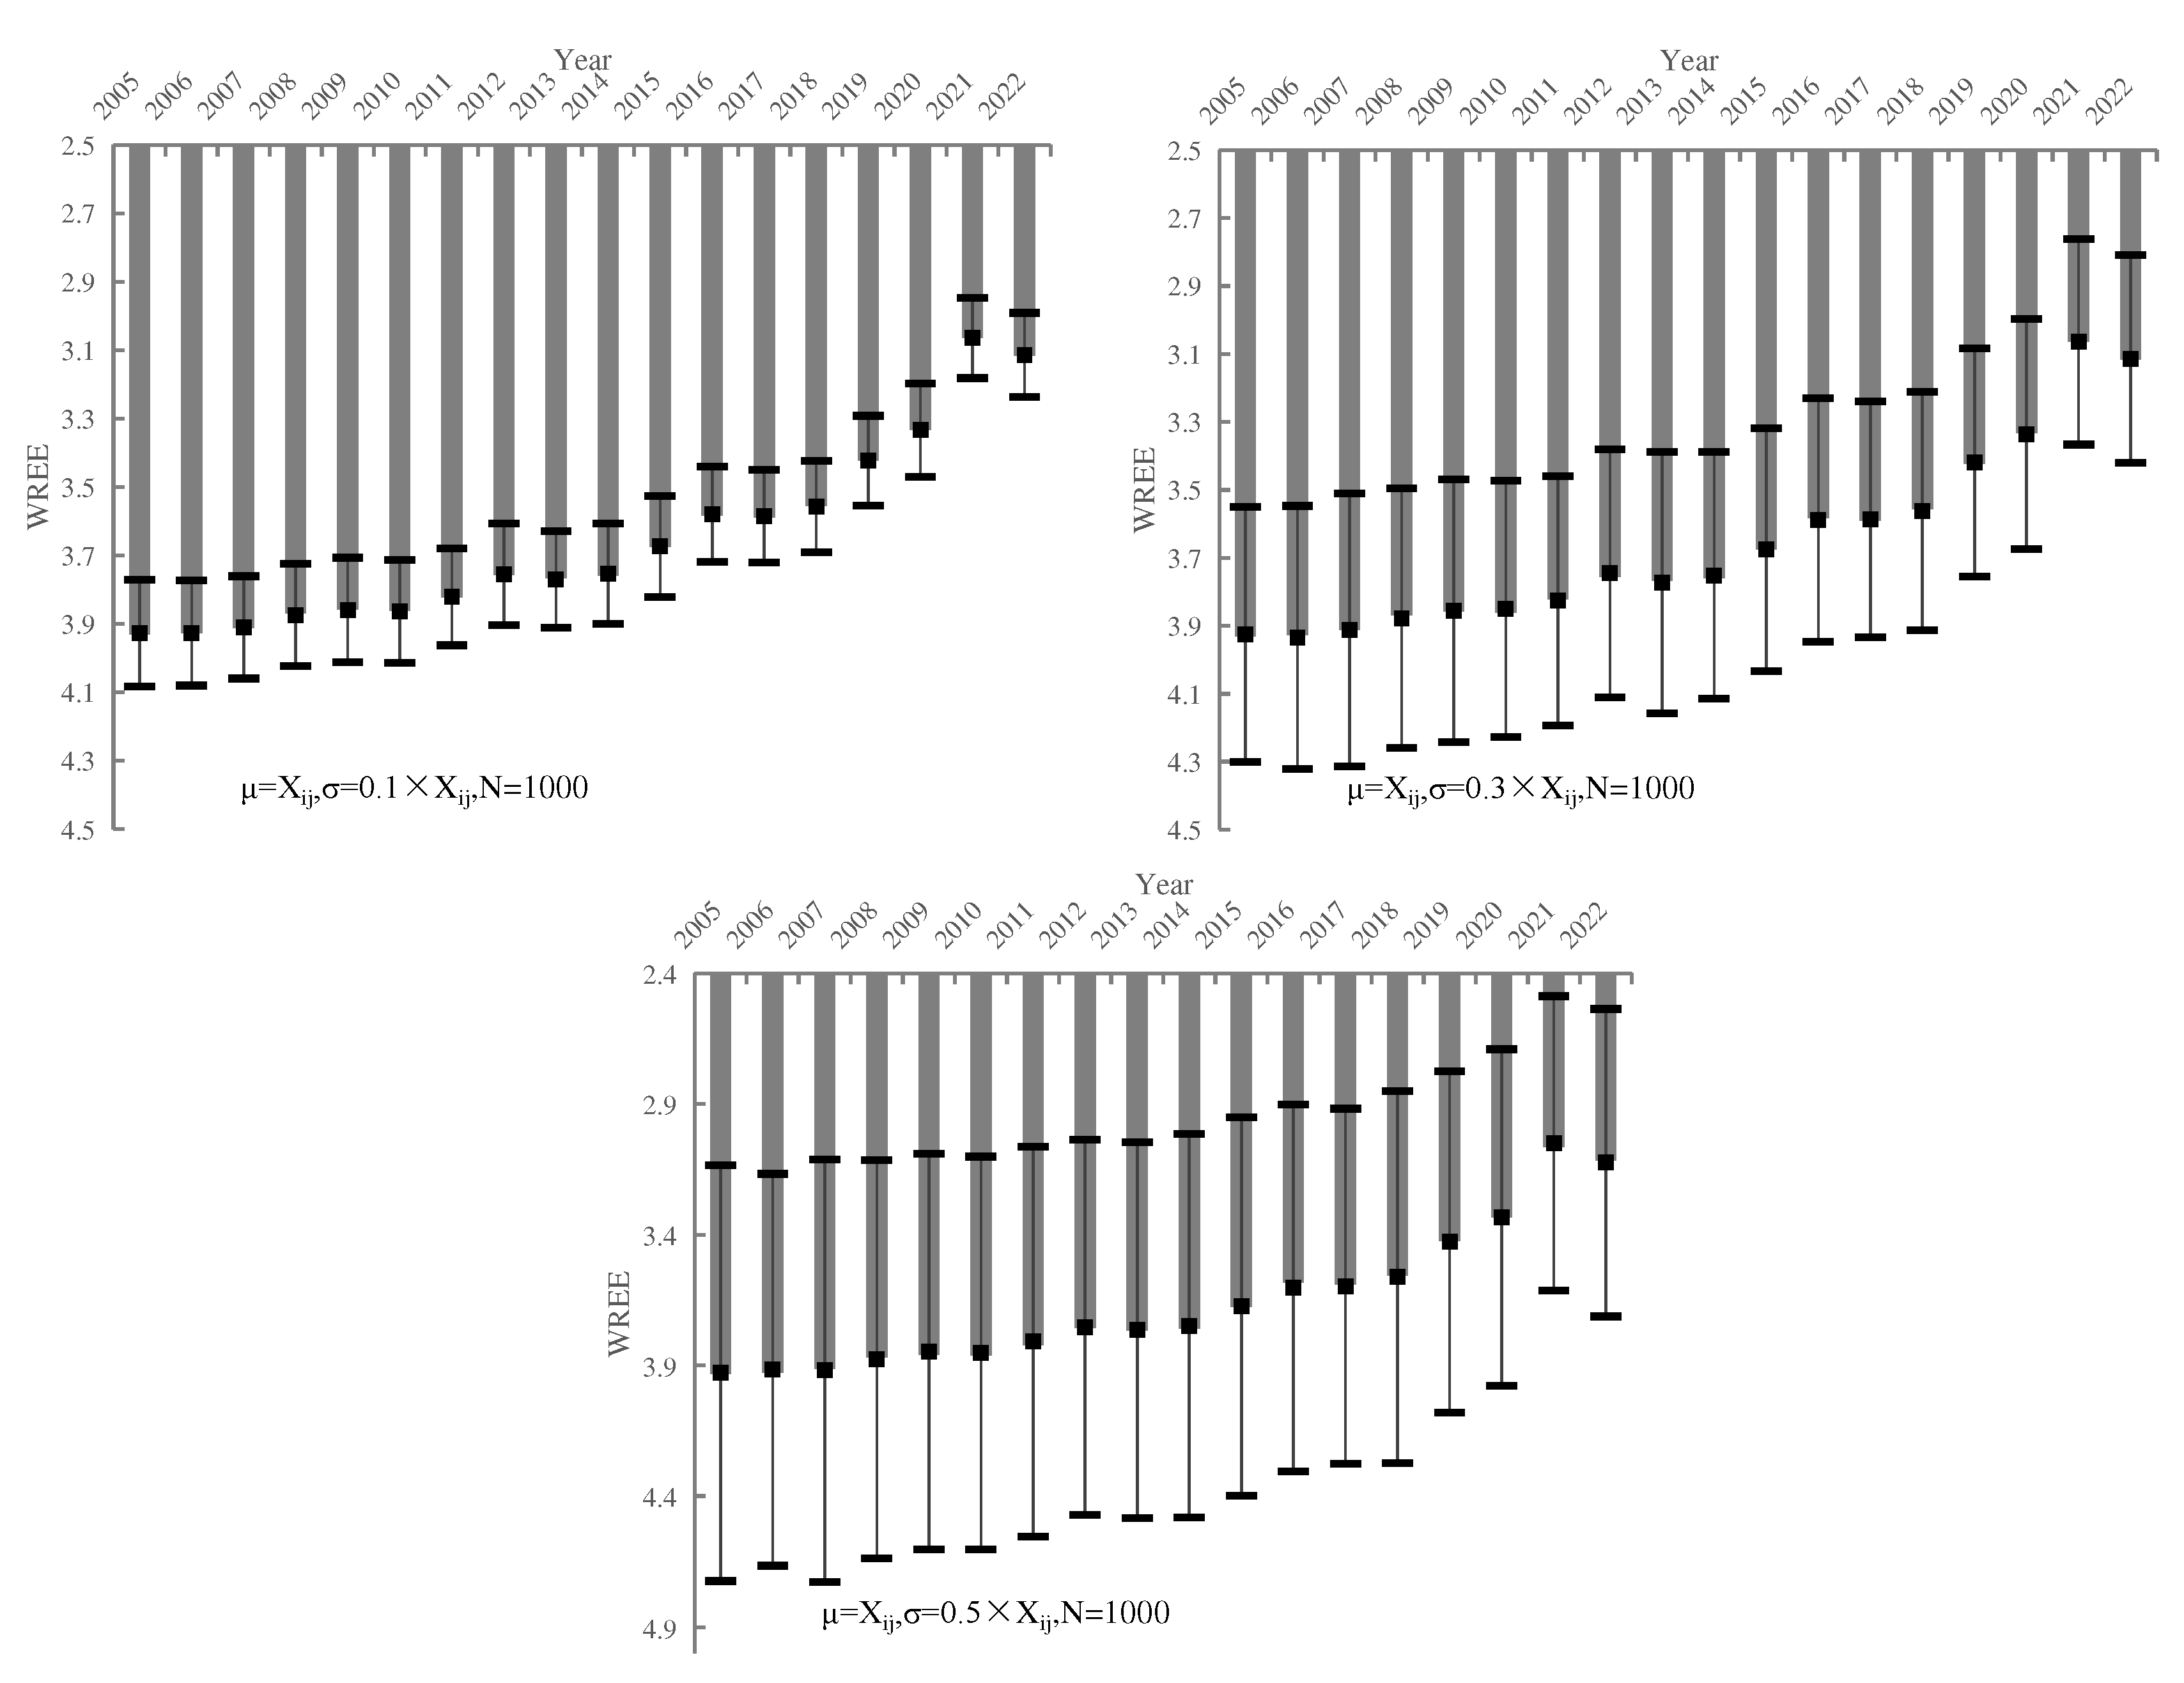
Table 1.
Indicator system and standard for WRCC.
| Indicator system | Grades | |||||
|---|---|---|---|---|---|---|
| Subsystems | Indicators | 1 | 2 | 3 | 4 | 5 |
| WRPCC (Pressure) | Population density (PER/km2 , X1) | 10 | 100 | 300 | 600 | 1000 |
| Water consumption per capita (m3/PER, X2) | 200 | 300 | 400 | 600 | 900 | |
| Per capita ecosystem water use(m3/PER, X3) | 50 | 20 | 10 | 5 | 3 | |
| Water consumption intensity of GDP (m3/104 Yuan, X4) | 80 | 110 | 250 | 600 | 700 | |
| Ratio of water consumption(%, X5) | 50 | 60 | 65 | 70 | 80 | |
| Wastewater discharge of GDP (m3/104 Yuan, X6) | 7 | 10 | 15 | 20 | 30 | |
| WRSCC(State) | Modulus of water production (104 m³/km2) | 120 | 90 | 50 | 10 | 5 |
| Water resources per capita (m3/PER, X8) | 5000 | 3000 | 2000 | 1000 | 500 | |
| Annual precipitation (mm, X9) | 1600 | 800 | 600 | 400 | 200 | |
| Exploitation and utilization ratio of water resources (%, X10) | 10 | 20 | 40 | 60 | 100 | |
| Ratio of groundwater to water supply(%, X11) | 5 | 20 | 30 | 40 | 50 | |
| Ratio of water supply from other water resources(%, X12) | 5 | 2.5 | 1 | 0.5 | 0.1 | |
| WRRCC (Response) | Ratio of Wastewater treatment (%, X13) | 90 | 80 | 70 | 65 | 60 |
| Ratio of investment in environmental pollution control to GDP (%, X14) | 3 | 2 | 1 | 0.75 | 5 | |
| Ratio of municipal wastewater treatment reuse (%, X15) | 30 | 20 | 15 | 10 | 5 | |
| Forest coverage (%, X16) | 40 | 30 | 25 | 20 | 10 | |
Table 2.
This is a table. Tables should be placed in the main text near to the first time they are cited.
Table 2.
This is a table. Tables should be placed in the main text near to the first time they are cited.
| Name | Unit | Equations |
|---|---|---|
| GDP | 108 yuan | = Value added of agriculture+Value added of industry+Value added of services |
| Value added in agriculture | 108 yuan | = INTEG(Value added of agriculture×Growth rate of agricultural value added,Initial value of agricultural value added) |
| Agricultural water demand | 108 m3 | =Water consumption of 10,000 yuan of agricultural value added×Value added in agriculture/10000 |
| Value added of industry | 108 yuan | = INTEG(Value added of industry×Growth rate of value added in industry,Initial value of industry value added) |
| Industrial water demand | 108 m3 | =Water consumption of 10,000 yuan of industrial added value×Value added of industry/10000 |
| Industrial wastewater discharge | 108 ton | =Industrial wastewater discharge factor×Industrial water demand |
| Industrial wastewater COD emissions | 104 ton | =COD emission factor for industrial wastewater×Industrial wastewater discharge |
| Value added of services | 108 yuan | = INTEG(Value added of services×Growth rate of value added in services,Initial value of services value added) |
| Total population | 104 people | = INTEG(Total population×Population growth rate,Initial value of population) |
| Urban population | 104 people | =Total population×Urbanization rate |
| Domestic water demand | 108 m3 | =Urban population×Per capita urban domestic water consumption/10000 |
| Domestic sewage discharge | 108 ton | =Domestic sewage discharge factor×Domestic water demand |
| Domestic wastewater COD emissions | 104 ton | =COD emission factor for domestic sewage×Domestic sewage discharge |
| Total water demand | 108 m3 | =Production water demand+Ecological water demand+Domestic water demand |
| Production water demand | 108 m3 | =Agricultural water demand+Industrial water demand+Water demand in the service sector |
| Total water supply | 108 m3 | =Surface water+Underground water+Water reuse+Interregional water transfer |
| Water supply-demand ratio | dmnl | =Total water supply/Total water demand |
| GDP per capita | 104 yuan | =GDP/Total population |
| Amount of Water Pollution | 108 ton | =Industrial wastewater discharge+Domestic sewage discharge+Sewage discharges from the service sector |
| Sewage treatment capacity | 108 ton | =Amount of water pollution×Sewage treatment rate |
| Water reuse | 108 m3 | =Sewage treatment capacity*Water reuse rate |
| Total effluent COD discharge | 104 ton | =Industrial wastewater COD emissions+Domestic wastewater COD emissions |
Table 3.
Weight of each indicator.
| Weight of indicators | ||||||||||||||||
|---|---|---|---|---|---|---|---|---|---|---|---|---|---|---|---|---|
| Weighting methodology | X1 | X2 | X3 | X4 | X5 | X6 | X7 | X8 | X9 | X10 | X11 | X12 | X13 | X14 | X15 | X16 |
| Entropy weight | 0.069 | 0.044 | 0.140 | 0.024 | 0.036 | 0.027 | 0.091 | 0.082 | 0.054 | 0.036 | 0.121 | 0.091 | 0.033 | 0.093 | 0.058 | 0.069 |
| AHP | 0.045 | 0.045 | 0.045 | 0.045 | 0.023 | 0.045 | 0.061 | 0.061 | 0.035 | 0.123 | 0.146 | 0.073 | 0.106 | 0.057 | 0.057 | 0.045 |
| AHP-E | 0.046 | 0.029 | 0.093 | 0.016 | 0.012 | 0.018 | 0.081 | 0.073 | 0.028 | 0.065 | 0.261 | 0.098 | 0.052 | 0.078 | 0.048 | 0.046 |
| Equal weighting | 0.063 | 0.063 | 0.063 | 0.063 | 0.063 | 0.063 | 0.063 | 0.063 | 0.063 | 0.063 | 0.063 | 0.063 | 0.063 | 0.063 | 0.063 | 0.063 |
| PCA | 0.067 | 0.042 | 0.073 | 0.072 | 0.015 | 0.071 | 0.074 | 0.071 | 0.072 | 0.079 | 0.074 | 0.075 | 0.072 | 0.001 | 0.077 | 0.064 |
Table 4.
Results of SD model error validation.
| Time | Total Population (10,000 Capita) | GDP (100 million) | Total Water demand (108 m3) | Amount of Water Pollution (104 ton) | ||||||||
|---|---|---|---|---|---|---|---|---|---|---|---|---|
| Historical Data | Simulated Data | Error (%) | Historical Data | Simulated Data | Error (%) | Historical Data | Simulated Data | Error (%) | Historical Data | Simulated Data | Error (%) | |
| 2005 | 6851 | 6851 | 0.000 | 10096 | 10096 | 0.000 | 202 | 202 | -0.058 | 20.8 | 20.9 | -0.189 |
| 2006 | 6898 | 6898 | 0.000 | 11661 | 11660 | 0.001 | 204 | 204 | -0.036 | 22.1 | 22.2 | -0.398 |
| 2007 | 6943 | 6943 | 0.000 | 13710 | 13710 | 0.001 | 202 | 203 | -0.060 | 22.2 | 22.3 | -0.224 |
| 2008 | 6989 | 6989 | 0.000 | 16189 | 16189 | 0.001 | 195 | 195 | -0.124 | 23.4 | 23.5 | -0.288 |
| 2009 | 7034 | 7034 | 0.000 | 17236 | 17235 | 0.000 | 194 | 194 | -0.075 | 24.4 | 24.5 | -0.348 |
| 2010 | 7194 | 7194 | 0.001 | 22825 | 22825 | 0.000 | 194 | 194 | -0.038 | 26.2 | 26.3 | -0.357 |
| 2011 | 7241 | 7241 | 0.000 | 24516 | 24516 | 0.001 | 194 | 194 | -0.023 | 27.8 | 27.9 | -0.283 |
| 2012 | 7288 | 7288 | 0.000 | 26575 | 26575 | 0.001 | 195 | 195 | -0.122 | 30.5 | 30.6 | -0.346 |
| 2013 | 7333 | 7333 | 0.000 | 28302 | 28301 | 0.001 | 191 | 191 | -0.078 | 31.0 | 31.1 | -0.346 |
| 2014 | 7384 | 7384 | -0.001 | 29422 | 29421 | 0.001 | 193 | 193 | -0.081 | 30.9 | 31.0 | -0.405 |
| 2015 | 7425 | 7425 | -0.001 | 29806 | 29806 | 0.001 | 187 | 187 | -0.085 | 31.0 | 31.1 | -0.344 |
| 2016 | 7470 | 7470 | -0.001 | 32071 | 32070 | 0.001 | 182 | 183 | -0.095 | 28.8 | 28.9 | -0.352 |
| 2017 | 7520 | 7520 | -0.001 | 34017 | 34016 | 0.001 | 181 | 182 | -0.091 | 25.3 | 25.4 | -0.303 |
| 2018 | 7556 | 7556 | -0.001 | 36011 | 36010 | 0.001 | 182 | 182 | 0.009 | 24.4 | 24.5 | -0.375 |
| 2019 | 7592 | 7592 | -0.002 | 35105 | 35105 | 0.001 | 182 | 182 | -0.091 | 23.3 | 23.4 | -0.334 |
| 2020 | 7232 | 7232 | -0.002 | 36208 | 36207 | 0.002 | 183 | 183 | -0.079 | 22.4 | 22.5 | -0.318 |
| 2021 | 7448 | 7448 | -0.001 | 40392 | 40391 | 0.002 | 182 | 182 | -0.102 | 21.7 | 21.7 | -0.329 |
| 2022 | 7420 | 7420 | -0.002 | 42371 | 42370 | 0.002 | 182 | 182 | -0.086 | 21.0 | 21.1 | -0.360 |
Disclaimer/Publisher’s Note: The statements, opinions and data contained in all publications are solely those of the individual author(s) and contributor(s) and not of MDPI and/or the editor(s). MDPI and/or the editor(s) disclaim responsibility for any injury to people or property resulting from any ideas, methods, instructions or products referred to in the content. |
© 2023 by the authors. Licensee MDPI, Basel, Switzerland. This article is an open access article distributed under the terms and conditions of the Creative Commons Attribution (CC BY) license (http://creativecommons.org/licenses/by/4.0/).
Copyright: This open access article is published under a Creative Commons CC BY 4.0 license, which permit the free download, distribution, and reuse, provided that the author and preprint are cited in any reuse.


