
Submitted:
12 October 2023
Posted:
13 October 2023
You are already at the latest version
Abstract
Background and Objectives: Treatment for antineutrophil cytoplasmic antibody-associated vasculitis (AAV) must deal with immunosuppression as well as infections associated with compromised immune system, such as tuberculosis (TB). Our aim was to overcome the gap in the literature concerning the risk of incidental TB after diagnosis of AAV.
Materials and Methods: This retrospective population-based cohort study was based on the data from the National Health Insurance Research Database in Taiwan. We used a novel algorithm to identify patients with newly diagnosed granulomatous polyangiitis (GPA) or microscopic polyangiitis (MPA) between January 1, 2000 and December 31, 2012. The primary outcome was risk of incidental TB. Cox proportional hazard models were used to evaluate the association between AAV and incidental TB.
Results: A total of 2,257 patients with AAV and a propensity-score matched cohort of 9,028 patients were studied. Overall, patients with AAV were at a 1.48x higher risk of contracting incidental TB than were patients in the matched cohort (adjusted HR 1.48; 95% confidence interval [CI], 1.02-2.15). Note that the highest risk of contracting incidental TB was in the first two years following a diagnosis of AAV, with a nearly 1-fold increase in risk (adjusted HR, 1.91; 95% CI, 1.01-3.60). Female AAV patients were 3.24x more likely than females without AAV to develop TB (adjusted HR 3.24; 95%CI, 1.85-5.67).
Conclusion: Patients with AAV face an elevated risk of contracting incidental TB, particularly within the first two years after AAV diagnosis. The risk of contracting TB is higher among female AAV patients than among females without AAV.
Keywords:
antineutrophil cytoplasmic antibody-associated vasculitis
; tuberculosis
; population-based study
1. Introduction
Immunosuppressive treatment for antineutrophil cytoplasmic antibody (ANCA)-associated vasculitides (AAV) must deal infection associated with a compromised immune system, such as tuberculosis (TB) in TB endemic areas. TB is a major health threat worldwide [1], with roughly 9 million diagnoses and 1.5 million deaths annually, based on estimates by the World Health Organization (WHO) [2]. TB is endemic in Taiwan. In 2019, the annual incidence was 37 per 100,000 persons and the annual mortality was 2.3 per 100,000 [3].
AAV patients face a high risk of infection. In four EUVAS trials, infection led to the hospitalization of 30% of the AAV patients and was the leading cause of death [4]. Another report on 489 AAV patients determined that 42% of the instances of infection were pulmonary in nature [5]. Nonetheless, due to the relative low prevalence of AAV and TB, specific knowledge related to the incidence of tuberculosis infection following diagnosis with AAV is limited. There has also been a lack of population-based studies pertaining to this issue, due to the fact that most relevant databases use the Ninth Revision of the International Classification of Diseases (ICD-9) for disease registry, in which an ICD-9 code was available only for granulomatosis with polyangiitis (GPA); data related to the incidence of microscopic polyangiitis (MPA) or Churg-Strauss syndrome (CSS) were unavailable. In 2015, Raimundo et al. were able to identify nearly all AAV patients using an algorithm that locates MPA patients in administrative claims databases [6]. In the current study, we used a nationally representative database to identify the characteristics of TB in cases of AAV as well as the incidence and risk factors..
2. Materials and Methods
2.1. Data source
The Taiwan National Health Insurance (NHI) has covered more than 97% of the residents of Taiwan since 1996. The NHI Research Database (NHIRD) provides an enormous representative cohort with a long period of follow-up for the epidemiologic analysis of rare diseases. De-identified secondary data contains all registry and administrative claims information, ranging from demographic data to details pertaining to ambulatory and inpatient care. This study assembled nationwide hospitalization files based on the NHIRD. All historical diagnoses in the database were coded in accordance with the International Classification of Disease, Ninth Revision, Clinical Modification (ICD-9-CM). The Research Ethics Committee of China Medical University and Hospital in Taiwan approved this study (CMUH-104-REC2-115-(AR4)).
2.2. Study design
Our objective in this population-based, observational, retrospective cohort study was to characterize the association between AAV patients and incidental TB. We first identified all adult subjects (≥20 years) enrolled in 2000, and then extracted all relevant data pertaining to those subjects throughout the study period of January 2000 to December 2012. The resulting dataset included demographic characteristics, diagnosis and procedure codes, drug prescriptions, comorbidities, and information about outpatient visits and hospital admissions.
2.3. Study Population
We modified the algorithm developed by Raimundo et al. in 2016 to facilitate the identification of AAV patients (GPA & MPA)6 from the NHIRD.
2.4. Selection of patients with granulomatous polyangiitis
Adults (≥ 20 years) with GPA were identified as individuals with at least two medical claims related to a diagnosis of GPA (ICD-9-CM diagnosis code 446.4) and at least two outpatient visits or one inpatient visit between January 1, 2000, and December 31, 2012. Categorization as incidental GPA was based on the following criteria: (1) Continuous enrollment for at least 12 months prior to the first diagnosis of GPA; (2) No claims related to diagnosis with MPA in the 12 months prior to the index date.
2.5. Selection of patients with microscopic polyangiitis
Adults (≥ 20 years) with MPA were identified as individuals with at least two medical claims related to a diagnosis of unspecified arteritis (ICD-9-CM diagnosis code 447.6) and at least two outpatient visits or one inpatient visit between January 1, 2000, and December 31, 2012. Categorization as incidental GPA was based on the following criteria: (1) Continuous enrollment for at least 6 months prior to the index date (pre-period); (2) No diagnosis of GPA during the 6-month pre-period or 6-month post-period; (3) No diagnosis of hepatitis B (ICD-9 CM: 070.2, 070.3, and V02.61) or hepatitis C (ICD-9 CM: 070.41, 070.44, 070.51, 070.54, and V02.62); (4) No diagnosis of renal failure (ICD-9 CM: 639.3, 586, V56.8, and V45.1), glomerulonephritis (ICD-9 CM: 580-582, and 583.1-583.4), or hemoptysis (ICD-9 CM: 786.3) in the 6-month pre-period or 6-month post-period.
2.6. Selection of patients with incidental ANCA-associated vasculitis
AAV patients were categorized into subgroups based on a diagnosis of incidental GPA or incidental MPA. The exclusion criteria were as follows: (1) Diagnosis of AAV outside the study period (2000 to 2012); (2) History of tuberculosis prior to diagnosis of AAV; (3) Missing basic information; (4) Age < 20 years old.
2.7. Matched cohort selection
Propensity score matching was used to reduce bias in patient selection and generate matched pairs of patients, thereby making it possible to compare the outcomes of AAV patients and the matched cohort [7]. Variables associated with treatment selection (age, gender, monthly income, urbanization level, diabetes, hypertension, hyperlipidemia, atrial fibrillation, valvular heart disease, parkinsonism, and autoimmune disease) were used to generate propensity scores. Binary logistic regression was used to generate continuous propensity scores from 0 to 1. Subsequent patient analysis involved 1:4 nearest-neighbor matching (without replacement) using a caliper width of 0.01 standard deviation (SD) of the logit of the propensity score [8].
2.8. Variables and comorbidity
Baseline demographic characteristics included age, sex, monthly income, and urbanization level of the patients’ places of residence. The health status of patients was assessed systematically using the Charlson Comorbidity Index (CCI). Each increase in the CCI represents a stepwise increase in cumulative mortality. A score of 0 corresponds to a 99% 10-year survival rate, whereas a score of 5 corresponds to a 34% 10-year survival rate [9]. Instances of comorbidity were designated by at least two outpatient medical claims or one inpatient medical claim of diabetes mellitus (ICD-9-CM: 250, A181), hypertension (ICD-9-CM: 401-405, A260, A269), hyperlipidemia (ICD-9-CM: 272.0-272.4), atrial fibrillation (ICD-9-CM: 427.31), valvular heart disease (ICD-9-CM: 390-398, 424), parkinsonism (ICD-9-CM: 332, A221), or autoimmune disease (ICD-9-CM: 710, 714).
2.9. Outcome measures
The primary outcome was the risk of incidental TB after the index date. Patients who met the following two conditions were considered as having incidental TB: (1) At least two outpatient medical claims or one inpatient medical claim of TB (ICD-9-CM: 010-018, A02); (2) Continuous prescriptions of antibiotics for the treatment of TB for at least 28 days (ATC code: J04A).
2.10. Statistical analysis
The distributions of age, gender, and comorbidities in the AAV cohort and matched control cohort were indicated by numbers and percentages. Differences between two cohorts were tested using the chi-square and t-test respectively for categorical and continuous variables. Among patients without event occurrence, the length of follow-up (in person-years) was calculated from the index date to either the date of diagnosis for cardiovascular disease, death, or the last follow-up prior to December 31, 2013. Hazard ratios (HRs) and 95% confidence intervals (95% CI) were estimated using the Cox proportional hazard models in order to evaluate the association between AAV and incidental TB. Schoenfeld residuals were used to evaluate assumptions pertaining to the Cox proportion. The link between AAV and incidental TB was also evaluated using stratification analysis based on age, gender, CCI, and comorbidities. The multiple Cox proportional hazard model was used to estimate HRs after adjusting for age, gender, and comorbidities. Survival curves in the two cohorts were plotted using the Kaplan-Meier method and tested using the Log-Rank test. Interaction tests were used to determine interactions between subgroups and the risk of incidental TB. All statistical analysis was performed using SAS statistical software, version 9.4 (SAS Institute Inc., Cary, NC). The Kaplan-Meier plot was plotted using R software. Statistical significance was determined using two-tailed tests (P < 0.05).
3. Results
3.1. AAV cohort
Strict patient selection criteria yielded a study population of 23 GPA patients, 2,929 MPA patients, and 2,952 AAV patients in total. We excluded patients diagnosed with AAV outside the study period (n = 533) as well as those with TB prior to AAV diagnosis (n = 39) and those less than 20 years of age (n = 122). This resulted in a total of 2,257 AAV patients and 9,028 matched controls for analysis (Figure 1).
3.2. Baseline demographic data
As shown in Table 1, there were no significant differences between AAV patients and the matched cohort in terms of baseline demographic data. The mean ages in the AAV group and matched cohort group were 54.6 years (standard deviation [SD] = 17.5) and 53.1 years (SD = 17.0), respectively.
3.3. Risk of incidental TB in entire cohort
Table 2 shows that the risk of developing incidental TB was 1.48 times higher in the AAV cohort than in the matched cohort (adjusted HR: 1.48, 95% CI = 1.02 – 2.15). The risk of developing incidental TB was 2.49 times higher among male patients in the entire cohort than female patients in the entire cohort (adjusted HR: 2.49, 95% CI = 1.70 – 3.63). Compared to patients aged < 40 years, the risk of developing incidental TB was 2.75 times higher among patients aged 40-65 years old and 9.10 times higher among those aged ≥ 65 years (adjusted HR: 2.75, 95% CI = 1.26 – 6.02; adjusted HR 9.10, 95% CI = 4.12-20.06, respectively). Compared to patients with 0 CCI score, the risk of developing incidental TB was 1.92 times higher among patients with CCI score ≥ 2 in entire cohort. (adjusted HR: 1.92, 95% CI = 1.19 – 3.10). Figure 2 presents the Kaplan-Meier analysis of cumulative incidence of TB, wherein the incidence of TB was higher in the AAV cohort than in the control group (Log-Rank P = 0.0661). Schoenfeld residuals obtained during the study revealed that the proportional hazard might not be against the assumption (P = 0.99) in each model.
3.4. Risk of incidental TB: Stratification and interaction tests
As shown in Table 3, the risk of developing incidental TB was 3.24 times higher among female AAV patients than among females in the matched cohort (adjusted HR: 3.24, 95% CI = 1.85 – 5.67). The interaction test revealed a subgroup effect of sex on the risk of incidental TB (P for interaction = 0.001). The risk of contracting incidental TB was similar between the two groups when stratified in terms of age, CCI score, diabetes, hypertension, or hyperlipidemia. The interaction tests did not reveal significant subgroup effects of age, CCI score, diabetes, hypertension, or hyperlipidemia on the risk of contracting incidental TB (age: P for interaction = 0.707; CCI score: P for interaction = 0.597; diabetes: P for interaction = 0.514; hypertension: P for interaction = 0.435; hyperlipidemia: P for interaction = 0.286). As shown in Table 4, AAV patients who continued follow-up for less than two years were at a 1.91 times higher risk of contracting incidental TB than were those in the matched cohort (adjusted HR: 1.91, 95% CI = 1.01 – 3.60, P = 0.046).
4. Discussion
This nationwide population-based study using propensity score matching provided strong evidence that the risk of contracting incidental TB was nearly 2-fold higher among female AAV patients than among females without AAV (adjusted HR 3.24; 95% CI, 1.85-5.67; p < 0.001). We observed a subgroup effect (sex), wherein the risk of developing incidental TB was higher among females with AAV than among females without AAV [P for interaction = 0.001]). When compared with matched cohort, the risk of incidental TB was highest for the first 2 years after diagnosis of AAV, with nearly 1-fold increased risk (adjusted HR, 1.91; 95% CI, 1.01-3.60). In the overall cohort, patients with AAV, males, the elderly, and those with CCI scores exceeding 1 faced an elevated risk of developing incidental TB.
In our study cohort, patients with AAV are associated with increased nearly 50% risk of incidental TB, and with nearly 1-fold increased risk (adjusted HR, 1.91; 95% CI, 1.01-3.60) within the first 2 years after diagnosis of AAV. AAV is an inflammatory disease characterized by vascular inflammation, similar to systemic lupus erythematosus (SLE). In previous studies, SLE was linked to an elevated risk of developing incidental TB, compared to patients without SLE (OR=4.6) [10]. The susceptibility of AAV patients to TB could perhaps be explained by dysregulation of T cell responses and medications administered for the treatment of AAV. There has been a lack of research examining the immunity association of TB and AAV. One mechanism involved in immunity to TB is the delayed induction of TB-specific, Foxp3+ regulatory T (Treg) cells [11]. AAV patients have been linked to elevated numbers of circulatory T follicular helper cells (Tfh) and T follicular regulatory cells (Tfr) as well as an elevated Tfh2/Tfh1 ratio [12]. It is possible that an imbalance in the Treg reaction may play a role in the development of TB in AAV patients. According to the payment system of the NHI in Taiwan, the first line treatment for AAV focuses on steroids and cyclophosphamide. Rituximab is used in specific situations: (1) The patient fails to respond adequately to cyclophosphamide treatment over a period of four weeks following the onset of AAV; (2) The patient undergoes a recurrence of AAV after cyclophosphamide treatment; (3) The patient shows intolerance to cyclophosphamide. According to a population-based nested case-control study of nearly 6,000 TB patients in Taiwan, the current, recent, past, ever, and chronic use of corticosteroids were all associated with an elevated risk of developing incidental TB [13]. In a population-based nested case-control study in Canada, the current use of disease modifying anti-rheumatic drugs, including cyclophosphamide, azathioprine, and cyclosporin, was associated with an elevated risk of developing incidental TB (adjusted OR=23) [14]. The heavy burden imposed by immunosuppressant use following a diagnosis of AAV may explain the high risk of developing incidental TB within the first two years. Thus, we recommend the regular screening of AAV patients for incidental TB in endemic areas.
In the current study, the risk of developing incidental TB was nearly 2-fold higher among female AAV patients than among females in the matched cohort (adjusted HR 3.24; 95% CI, 1.85-5.67; P < 0.001). A number of studies have reported on the risk of infection among female AAV patients. Female sex was identified as a significant predictor of infection in 1-year (n=421) and 2-year studies (n=374) of AAV patients [4,5]. However, a population-based study on 186 AAV patients in Sweden reported that sex was not associated with the risk of severe infection [15]. We observed no sex differences pertaining to the imbalance of Treg regulation in AAV patients. Thus, there is a need for a well-designed study aimed at exploring the mechanism underlying the susceptibility of female AAV patients to TB.
This was the first study to explore the association between AAV and incidental TB, and our use of the Raimundo algorithm made it possible to overcome the limitations of ICD-9 coding, as they pertain to AAV [6]. Our results indicate that physicians in TB endemic areas should remain vigilant to the threat of incidental TB when treating AAV patients, particularly within the first two years.
Our study has three major limitations. First, there was a risk of misclassification in terms of GPA and MPA diagnosis, due to the lack of an ICD-9-CM diagnosis code specific to MPA. The accuracy of our MPA diagnosis algorithm relied on the manifestations of severe MPA and the integrity of administrative claim data. Alveolar hemorrhage was not included in this algorithm due to a lack of specific ICD-9-CM codes. We included hemoptysis as an alternative; however, this no doubt skewed the results. There was also the possibility that the administrative claim data obtained from the NHIRD were flawed, due to incomplete coding or misclassification. Nonetheless, we did not compare the outcomes of GPA and MPA separately; therefore, the effects of misclassification would no doubt be very small. Second, we identified far fewer cases of GPA than MPA, and we suspect that a portion of the GPA patients was misclassified as MPA. In this study, the AAV diagnostic criteria included criteria from the American College of Rheumatology (ACR), Chapel Hill Consensus Conference criteria (CHCC), and The European Medicines Agency (EMA) algorithm. None of these schemes reliably differentiate between GPA and MPA. Note that the critical pathological difference between GPA and MPA is the presence of granulomatous, which is easily missed due to sampling error. When using the CHCC approach, patients presenting with nasal disease or necrotizing vasculitis but no evidence of granulomatosis are labeled as MPA [16], thereby increasing the likelihood of a diagnosis of MPA. Nonetheless, the actual impact of misclassification is no doubt minimal. Third, the incidence of AAV in the current study was higher than in previous reports. In our overall cohort, the annual incidence of AAV was 13.90 - 35.83 per 100,000 patient years (Supplementary Table 1), whereas the AAV incidence reported in other studies showed far greater deviation. In Europe, the incidence of AAV has been estimated at 12.4, 15.16, 20.4, and 20.8 cases per million people in Germany, Spain, the United Kingdom, and Finland, respectively [17,18,19,20]. The incidence of AAV has been estimated at 33 cases per million people in the US, and 23 cases per million people in Argentina [21,22]. The reasons for this enormous range of variation can largely be attributed to diagnostic criteria. A longitudinal, retrospective, cohort study on kidney disease in Taiwan collected 6,675 patients with pathologies of the kidney between January 2015 and December 2019. In that study, AAV was involved in 4.1% of the cases of primary glomerulonephritis [23]. The NHIRD used in the current study was a longitudinal cohort with 1,000,000 patients, and our study period was from 2000 to 2012. During that period, there were 53,839 cases of glomerulonephritis in the NHIRD; 4.1% of those cases equates to 2,154 patients, which is close to the number of AAV cases in this study (2,257). The algorithm developed by Raimundo et al. was meant to overcome limitations on ICD-9 coding in order to facilitate analysis of AAV with a rare disease. Nonetheless, it appears that this algorithm also increases the likelihood of overestimating the number of AAV cases. Large-scale, multicenter, randomized-controlled trials will be needed to overcome the limitations of administrative claims-oriented databases.
5. Conclusions
In the overall cohort, patients with AAV, males, the elderly, and those with CCI scores exceeding 1 faced an elevated risk of developing incidental TB. Patients with AAV face an elevated risk of contracting incidental TB, particularly within the first two years. The risk of contracting TB is higher among female AAV patients than female patients without AAV.
Supplementary Materials
The following are available online at Preprints.org. Table S1: Annual AAV incidence rate during study period.
Author Contributions
Conception and design: S.-H.C., H.-Y.C.; Analysis and interpretation of data: M.-F.L., S.-H.O., M.-C.L., J.-H.W., and H.-Y.C.; Writing—Original Draft Preparation: S.-H.C. and H.-Y.C.; Writing—Review & Editing: S.-H.C., M.-F.L., P.-T.L., and H.-Y.C.; Supervision: H.-Y.C. All authors have read and agreed to the published version of the manuscript.
Funding
none.
Institutional Review Board Statement
The Research Ethics Committee of China Medical University and Hospital in Taiwan approved this study (CMUH-104-REC2-115-(AR4)).
Informed Consent Statement
Patient consent was waived due to the retrospective nature of this study.
Data Availability Statement
The data presented in this study are available on request from the corresponding author.
Conflicts of Interest
The authors declare no conflict of interest.
References
- Frieden TR, Brudney KF, Harries AD. Global tuberculosis: perspectives, prospects, and priorities. JAMA 2014;312:1393-4. 10.1001/jama.2014.11450.
- World Health Organization. Global tuberculosis report, 2013. WHO/HTM/TB/2013.11. Geneva, Switzerland: WHO, 2013.
- Taiwan Centers for Disease Control. Tuberculosis monitor data. [Internet. Accessed November 18, 2020.] Available from: https://daily.cdc.gov.tw/stoptb/Indicator.aspx.
- Flossmann O, Berden A, de Groot K, Hagen C, Harper L, Heijl C, et al. Long-term patient survival in ANCA-associated vasculitis. Ann Rheum Dis 2011;70:488-94. 10.1136/ard.2010.137778.
- McGregor JG, Negrete-Lopez R, Poulton CJ, Kidd JM, Katsanos SL, Goetz L, et al. Adverse events and infectious burden, microbes and temporal outline from immunosuppressive therapy in antineutrophil cytoplasmic antibody-associated vasculitis with native renal function. Nephrol Dial Transplant 2015;30 Suppl 1:i171-81. [CrossRef]
- Raimundo K, M. Farr A, Kim G, Duna G. Clinical and Economic Burden of Antineutrophil Cytoplasmic Antibody–associated Vasculitis in the United States. The Journal of Rheumatology 2015;42:2382-91. [CrossRef]
- D'Agostino RB Jr. Propensity score methods for bias reduction in the comparison of a treatment to a non-randomized control group. Stat Med 1998;17:2265-81. [CrossRef]
- Austin PC. Optimal caliper widths for propensity-score matching when estimating differences in means and differences in proportions in observational studies. Pharm Stat 2011;10:150-61. [CrossRef]
- Charlson ME, Pompei P, Ales KL, MacKenzie CR: A new method of classifying prognostic comorbidity in longitudinal studies: development and validation. J Chronic Dis 1987;40:373-83. [CrossRef]
- Yang Y, Thumboo J, Tan BH, Tan TT, Fong CHJ, Ng HS, et al. The risk of tuberculosis in SLE patients from an Asian tertiary hospital. Rheumatol Int 2017;37:1027-33. [CrossRef]
- Urdahl KB, Shafiani S, Ernst JD. Initiation and regulation of T-cell responses in tuberculosis. Mucosal Immunol 2011;4:288-93. [CrossRef]
- Xu Y, Xu H, Zhen Y, Sang X, Wu H, Hu C, et al. Imbalance of Circulatory T Follicular Helper and T Follicular Regulatory Cells in Patients with ANCA-Associated Vasculitis. Mediators Inflamm 2019;8421479. [CrossRef]
- Lai CC, Lee M-T G, Lee S-H, Lee S-H, Chang S-S, Lee C-C. Risk of incidental active tuberculosis and use of corticosteroids. Int J Tuberc Lung Dis 2015;19:936-42. [CrossRef]
- Brode SK, Jamieson FB, Ng R, Campitelli MA, Kwong JC, Paterson JM, et al. Increased risk of mycobacterial infections associated with anti-rheumatic medications. Thorax 2015;70:677-82. [CrossRef]
- Mohammad AJ, Segelmark M, Smith R, Englund M, Nilsson JA, Westman K, et al. Severe Infection in Antineutrophil Cytoplasmic Antibody-associated Vasculitis. The Journal of Rheumatology 2017;44:1468-75. [CrossRef]
- Nachman PH, Hogan SL, Jennette JC, Falk RJ. Treatment response and relapse in antineutrophil cytoplasmic autoantibody-associated microscopic polyangiitis and glomerulonephritis. J Am Soc Nephrol 1996;7:33. [CrossRef]
- Reinhold-Keller E, Herlyn K, Wagner-Bastmeyer R, Gross WL. Stable incidence of primary systemic vasculitides over five years: results from the German vasculitis register. Arthritis Rheum 2005;53:93-99. [CrossRef]
- Gonzalez-Gay MA, Garcia-Porrua C. Systemic vasculitis in adults in northwestern Spain, 1988-1997. Clinical and epidemiologic aspects. Medicine 1999;78:292-308. [CrossRef]
- Watts RA, Lane SE, Bentham G, Scott DG. Epidemiology of systemic vasculitis: a ten-year study in the United Kingdom. Arthritis Rheum 2000;43:414-9. [CrossRef]
- Takala JH, Kautiainen H, Malmberg H, Leirisalo- Repo M. Incidence of Wegener’s granulomatosis in Finland 1981-2000. Clin Exp Rheumatol 2008;26:S81-5.
- Berti A, Cornec D, Crowson CS, Specks U, Matteson EL. The epidemiology of antineutrophil cytoplasmic autoantibody-associated vasculitis in Olmsted County, Minnesota: a twenty-year US population-based study. Arthritis Rheumatol 2017;69:2338-50. [CrossRef]
- Pierini FS, Scolnik M, Scaglioni V, Mollerach F, Soriano ER. Incidence and prevalence of granulomatosis with polyangiitis and microscopic polyangiitis in health management organization in Argentina: a 15-year study. Clin Rheumatol 2019;38: 1935-40. [CrossRef]
- National Health Research Institutes. 2019 Annual Report on Kidney Disease in Taiwan. Taiwan, June 2020. Page 198-203. ISBN 9789865439439, GPN 1010900805.
Figure 1.
Study flow chart showing patient selection.
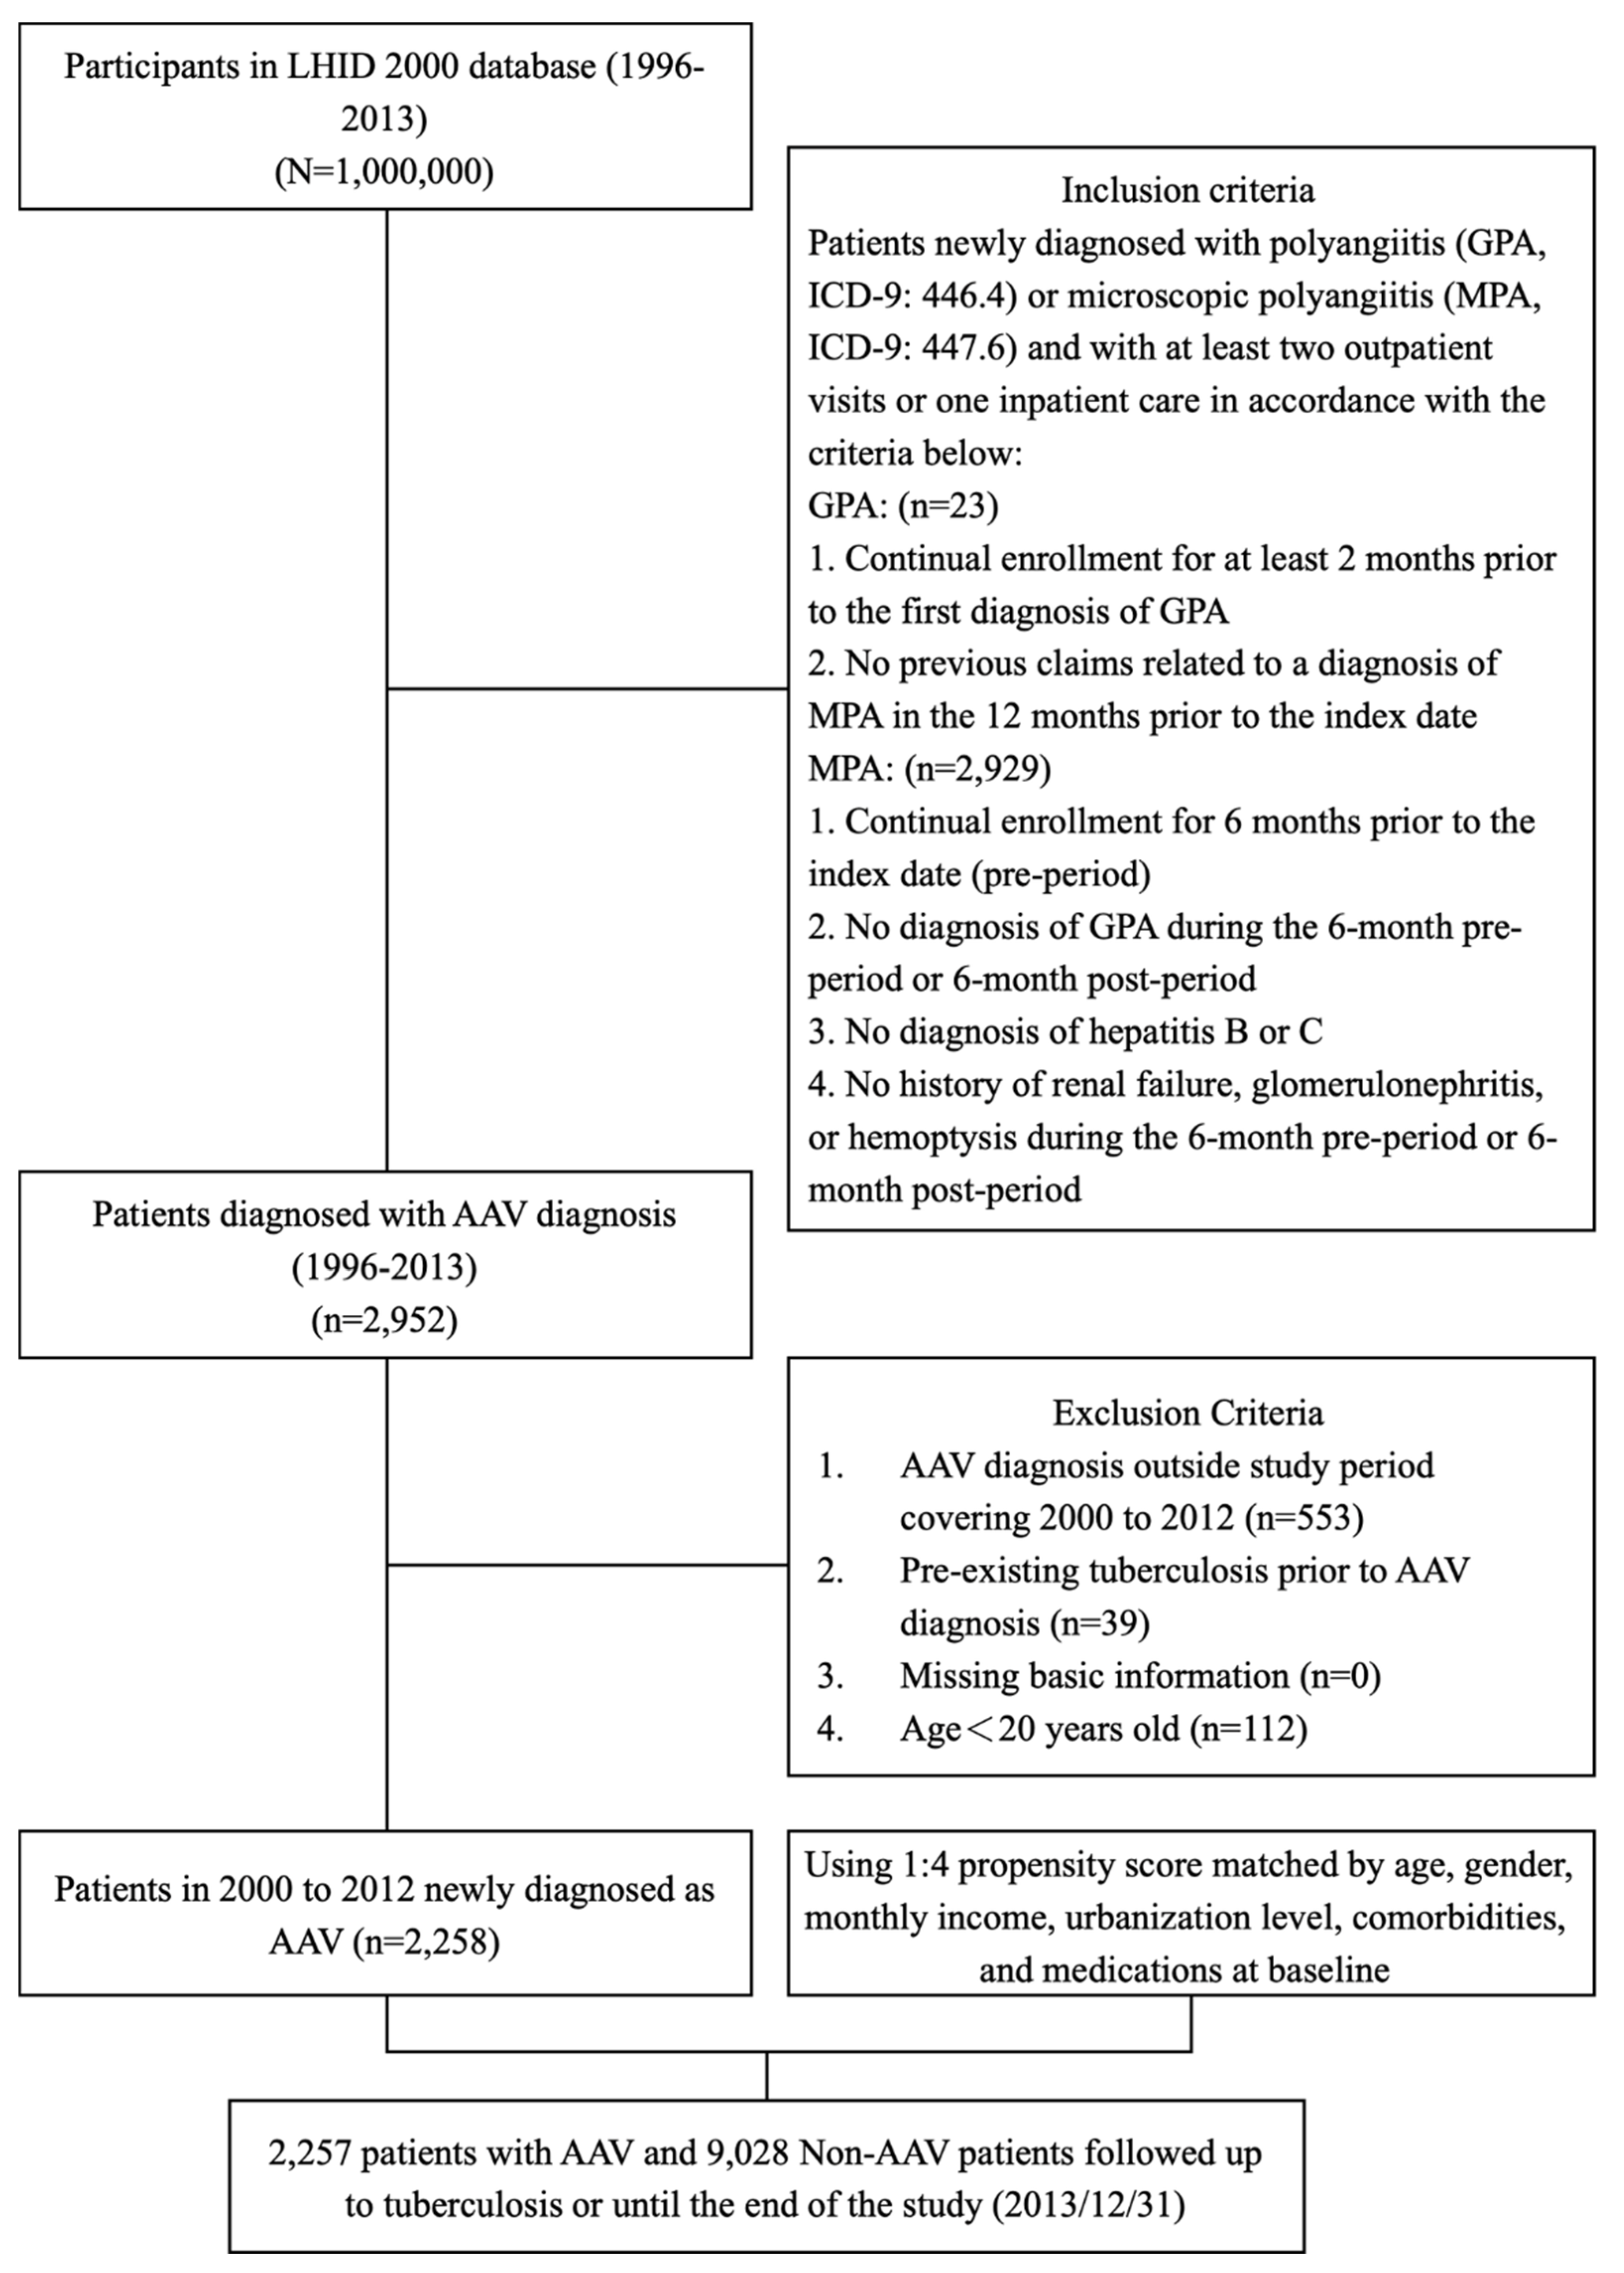
Figure 2.
Cumulative incidence of tuberculosis in all patients with AAV and matched cohort.
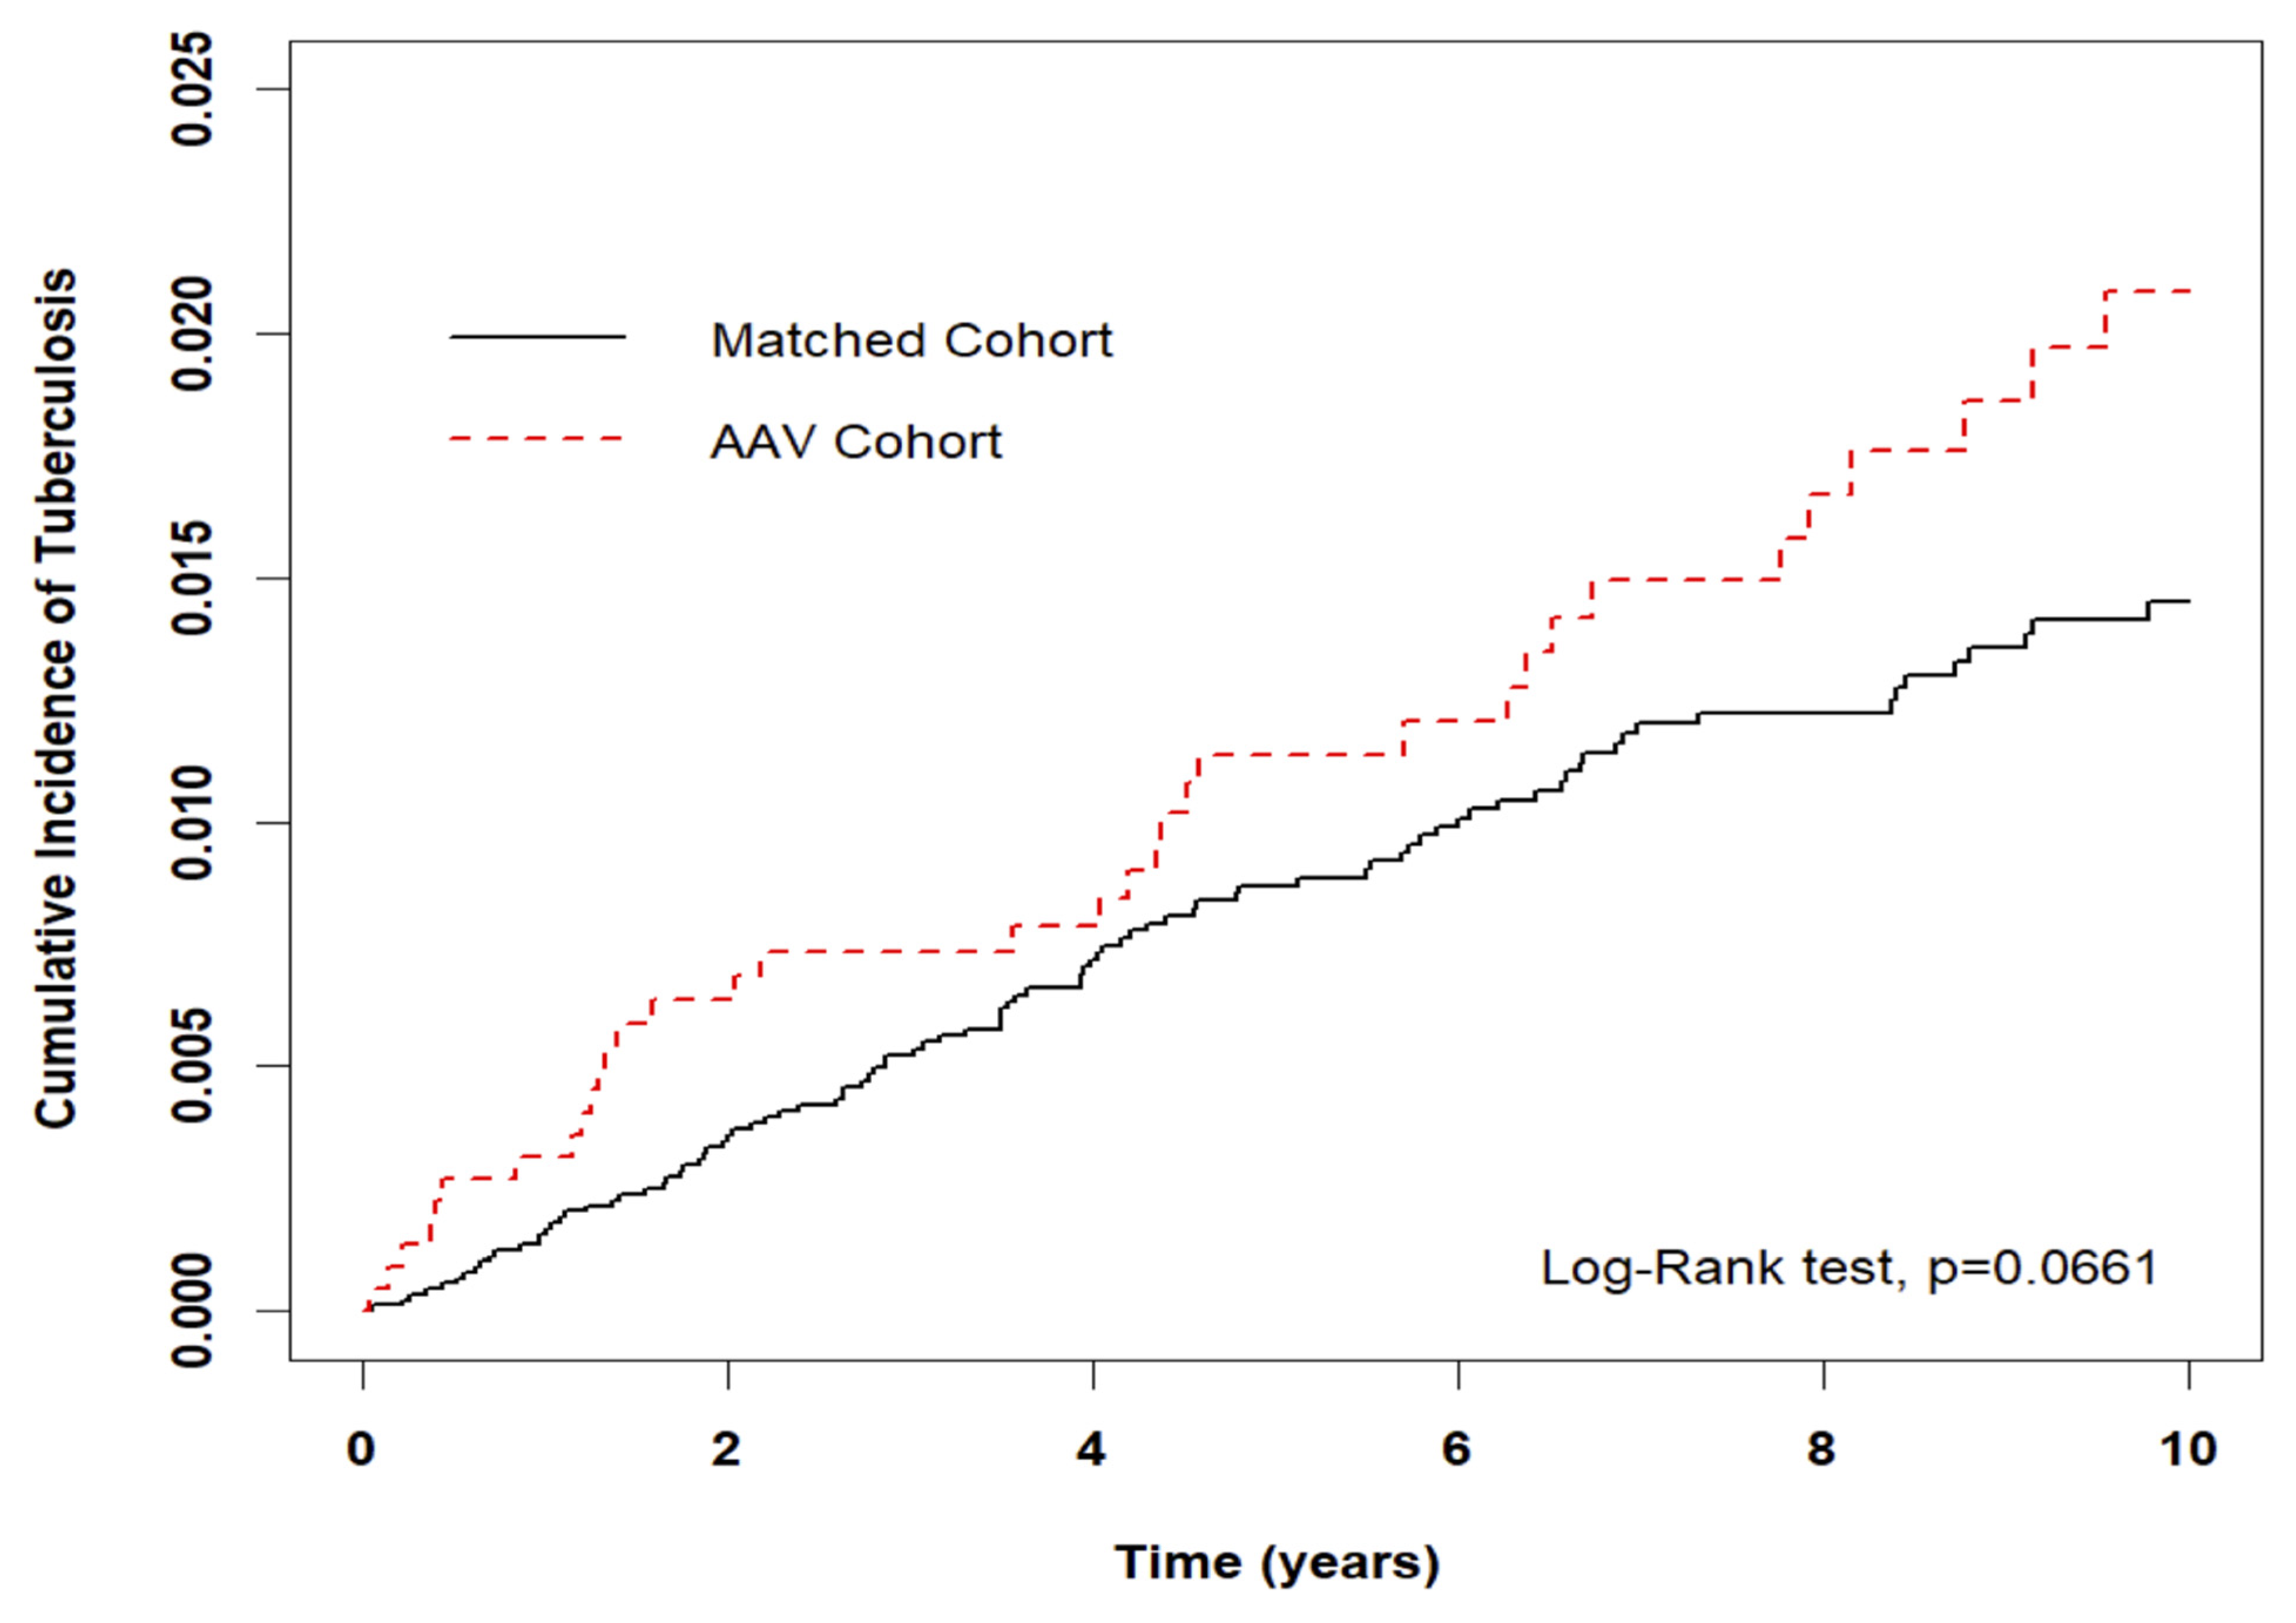

Table 1.
Demographic characteristics and comorbidities of AAV patients in Taiwan during 2000-2012.
| Variable | AAV | Standardize Mean Difference (SMD)§ | ||
|---|---|---|---|---|
| Total | No | Yes | ||
| N=11,285 | n=9,028 | n=2,257 | ||
| n | n (%) / mean (SD) | n (%) / mean (SD) | ||
| Sex | 0.030 | |||
| Female | 6,028 | 4,795 (53.1) | 1,233 (54.6) | |
| Male | 5,257 | 4,233 (46.9) | 1,024 (45.4) | |
| Age at baseline (years) | 0.081 | |||
| <40 | 2,631 | 2,055 (22.8) | 576 (25.5) | |
| 40-65 | 5,261 | 4,202 (46.5) | 1,059 (46.9) | |
| ≧65 | 3,393 | 2,771 (30.7) | 622 (27.6) | |
| Mean (SD) ‡ | 54.6 (17.5) | 53.1 (17.0) | 0.086 | |
| Monthly Income (NT$) | 0.072 | |||
| 0-15,840 | 4,450 | 3,540 (39.2) | 910 (40.3) | |
| 15,841-28800 | 4,939 | 3,937 (43.6) | 1,002 (44.4) | |
| 28,801-45800 | 1,389 | 1,121 (12.4) | 268 (11.9) | |
| >45,800 | 507 | 430 (4.8) | 77 (3.4) | |
| Urbanization | 0.081 | |||
| 1 (highest) | 3,540 | 2,808 (31.1) | 732 (32.4) | |
| 2 | 3,315 | 2,693 (29.8) | 622 (27.6) | |
| 3 | 1,954 | 1,520 (16.8) | 434 (19.2) | |
| 4 | 2,476 | 2,007 (22.2) | 469 (20.8) | |
| CCI score | 0.058 | |||
| 0 | 8,840 | 7,074 (78.4) | 1,766 (78.2) | |
| 1 | 1,258 | 981 (10.9) | 277 (12.3) | |
| ≧2 | 1,187 | 973 (10.8) | 214 (9.5) | |
| Baseline comorbidity | ||||
| Diabetes | 2,396 | 1,948 (21.6) | 448 (19.8) | 0.043 |
| Hypertension | 5,031 | 4,072 (45.1) | 959 (42.5) | 0.053 |
| Hyperlipidemia | 2,882 | 2,351 (26) | 531 (23.5) | 0.058 |
| Atrial Fibrillation | 230 | 189 (2.1) | 41 (1.8) | 0.020 |
| Valvular heart disease | 720 | 580 (6.4) | 140 (6.2) | 0.009 |
| Parkinsonism | 139 | 110 (1.2) | 29 (1.3) | 0.006 |
| Autoimmune disease | 239 | 179 (2) | 60 (2.7) | 0.045 |
§A standardized mean difference of ≤0.1 indicates a negligible difference. Abbreviation: SD, standard deviation.
Table 2.
Cox model measured hazard ratio and 95% confidence intervals of TB patients with and without AAV.
Table 2.
Cox model measured hazard ratio and 95% confidence intervals of TB patients with and without AAV.
| Characteristics | No. of Events | Crude | Adjusted | |||
|---|---|---|---|---|---|---|
| (n=142) | HR (95% CI) | P value | HR (95% CI) | P value | ||
| AAV | ||||||
| No | 104 | Ref. | Ref. | |||
| Yes | 38 | 1.41(0.98-2.05) | 0.067 | 1.48(1.02-2.15) | 0.041 | |
| Sex | ||||||
| Female | 51 | Ref. | Ref. | |||
| Male | 91 | 2.11(1.50-2.98) | <0.001 | 2.49(1.70-3.63) | <0.001 | |
| Age at baseline (years) | ||||||
| <40 | 8 | Ref. | Ref. | |||
| 40-65 | 41 | 2.57(1.20-5.47) | 0.015 | 2.75(1.26-6.02) | 0.012 | |
| ≧65 | 93 | 11.26(5.47-23.19) | <0.001 | 9.10(4.12-20.06) | <0.001 | |
| Monthly Income (NT$) | ||||||
| 0-15,840 | 65 | Ref. | Ref. | |||
| 15,841-28,800 | 64 | 0.82(0.58-1.16) | 0.256 | 0.82(0.57-1.20) | 0.308 | |
| 28,801-45,800 | 11 | 0.49(0.26-0.93) | 0.029 | 0.67(0.35-1.31) | 0.243 | |
| >45,800 | 2 | 0.24(0.06-0.98) | 0.047 | 0.34(0.08-1.43) | 0.141 | |
| Urbanization | ||||||
| 1 (highest) | 40 | Ref. | Ref. | |||
| 2 | 34 | 0.92(0.58-1.46) | 0.728 | 0.86(0.55-1.37) | 0.536 | |
| 3 | 27 | 1.23(0.75-2.00) | 0.410 | 1.14(0.69-1.87) | 0.610 | |
| 4 | 41 | 1.49(0.97-2.31) | 0.072 | 1.07(0.67-1.71) | 0.763 | |
| CCI score | ||||||
| 0 | 87 | Ref. | Ref. | |||
| 1 | 24 | 2.27(1.45-3.58) | <0.001 | 1.24(0.77-2.01) | 0.377 | |
| ≧2 | 31 | 3.96(2.62-5.98) | <0.001 | 1.92(1.19-3.10) | 0.007 | |
| Baseline comorbidity | ||||||
| Diabetes | 40 | 1.68(1.16-2.42) | 0.006 | 1.14(0.70-1.86) | 0.600 | |
| Hypertension | 88 | 2.37(1.69-3.32) | <0.001 | 0.91(0.54-1.55) | 0.735 | |
| Hyperlipidemia | 31 | 0.97(0.65-1.45) | 0.901 | 0.68(0.42-1.11) | 0.122 | |
| Atrial Fibrillation | 1 | 0.53(0.07-3.82) | 0.531 | 0.21(0.03-1.57) | 0.129 | |
| Valvular heart disease | 8 | 1.16(0.57-2.37) | 0.684 | 0.74(0.35-1.54) | 0.420 | |
| Parkinsonism | 2 | 1.67(0.41-6.77) | 0.470 | 0.65(0.16-2.64) | 0.543 | |
| Autoimmune disease | 2 | 0.80(0.20-3.22) | 0.752 | 1.02(0.25-4.17) | 0.981 | |
Abbreviations: HR, hazard ratio; CI, confidence interval. Adjusted HR: adjusted for sex, age, and all comorbidities in Cox proportional hazards regression.
Table 3.
Incidence rates, hazard ratio, and confidence intervals of TB in different stratification.
| Variables | Matched Cohort | AAV Cohort | |||||||||||
|---|---|---|---|---|---|---|---|---|---|---|---|---|---|
| n=9,028 | n=2,257 | Crude HR | P-value | Adjusted HR | P-value | P for interaction | |||||||
| Event | Person years | IR | Event | Person years | IR | (95% CI) | (95% CI) | ||||||
| Overall | 104 | 66,914 | 15.54 | 38 | 17,385 | 21.86 | 1.41(0.98-2.05) | 0.067 | 1.48(1.02-2.15) | 0.041 | |||
| Sex | 0.001 | ||||||||||||
| Female | 28 | 36,191 | 7.74 | 23 | 9,579 | 24.01 | 3.10(1.79-5.39) | <0.001 | 3.24(1.85-5.67) | <0.001 | |||
| Male | 76 | 30,722 | 24.74 | 15 | 7,806 | 19.22 | 0.78(0.45-1.36) | 0.385 | 0.78(0.45-1.36) | 0.384 | |||
| Age at baseline (years) | 0.707 | ||||||||||||
| <40 | 4 | 16,434 | 2.43 | 4 | 4,539 | 8.81 | 3.60(0.90-14.40) | 0.070 | 4.21(1.00-17.79) | 0.050 | |||
| 40-65 | 31 | 33,110 | 9.36 | 10 | 8,745 | 11.44 | 1.23(0.60-2.50) | 0.573 | 1.18(0.58-2.42) | 0.643 | |||
| ≧65 | 69 | 17,370 | 39.72 | 24 | 4,101 | 58.52 | 1.47(0.92-2.34) | 0.103 | 1.44(0.90-2.30) | 0.128 | |||
| CCI score | 0.597 | ||||||||||||
| 0 | 65 | 55,435 | 11.73 | 22 | 14,321 | 15.36 | 1.31(0.81-2.13) | 0.272 | 1.43(0.88-2.33) | 0.149 | |||
| 1 | 16 | 6,400 | 25.00 | 8 | 1,979 | 40.42 | 1.62(0.69-3.79) | 0.266 | 1.74(0.72-4.23) | 0.220 | |||
| ≧2 | 23 | 5,079 | 45.29 | 8 | 1,085 | 73.76 | 1.62(0.73-3.63) | 0.237 | 1.53(0.67-3.53) | 0.316 | |||
| Baseline comorbidity | |||||||||||||
| Diabetes | 0.514 | ||||||||||||
| No | 76 | 54,278 | 14.00 | 26 | 14,202 | 18.31 | 1.31(0.84-2.05) | 0.234 | 1.37(0.87-2.14) | 0.172 | |||
| Yes | 28 | 12,636 | 22.16 | 12 | 3,183 | 37.70 | 1.77(0.90-3.47) | 0.100 | 1.94(0.97-3.90) | 0.062 | |||
| Hypertension | 0.435 | ||||||||||||
| No | 41 | 39,553 | 10.37 | 13 | 10,602 | 12.26 | 1.18(0.63-2.21) | 0.599 | 1.22(0.65-2.29) | 0.538 | |||
| Yes | 63 | 27,361 | 23.03 | 25 | 6,783 | 36.86 | 1.62(1.02-2.58) | 0.041 | 1.75(1.10-2.79) | 0.019 | |||
| Hyperlipidemia | 0.286 | ||||||||||||
| No | 83 | 51,970 | 15.97 | 28 | 13,870 | 20.19 | 1.27(0.83-1.95) | 0.276 | 1.33(0.86-2.04) | 0.200 | |||
| Yes | 21 | 14,943 | 14.05 | 10 | 3,515 | 28.45 | 2.06(0.97-4.37) | 0.061 | 2.59(1.19-5.60) | 0.016 | |||
*Abbreviations: IR, incidence rates per 10,000 person-years; HR, hazard ratio; CI, confidence interval. *Adjusted HR: adjusted for gender, age, and all comorbidities in Cox proportional hazards regression.
Table 4.
Incidence rates, hazard ratio, and confidence intervals of TB in different stratification.
| Follow-up period, year | Matched Cohort | AAV Cohort | ||||||||||
|---|---|---|---|---|---|---|---|---|---|---|---|---|
| n=9,076 | n=2,269 | Crude HR | P-value | Adjusted HR | P-value | |||||||
| Event | Person years | IR | Event | Person years | IR | (95% CI) | (95% CI) | |||||
| Years of follow-up | ||||||||||||
| <2 | 31 | 17,415 | 17.80 | 14 | 4,355 | 32.15 | 1.81(0.96-3.39) | 0.067 | 1.91(1.01-3.60) | 0.046 | ||
| 2-5 | 37 | 21,473 | 17.23 | 9 | 5,467 | 16.46 | 0.96(0.46-1.98) | 0.900 | 1.03(0.49-2.14) | 0.941 | ||
| >5 | 36 | 28,027 | 12.84 | 15 | 7,564 | 19.83 | 1.55(0.85-2.83) | 0.153 | 1.63(0.88-2.99) | 0.118 | ||
Disclaimer/Publisher’s Note: The statements, opinions and data contained in all publications are solely those of the individual author(s) and contributor(s) and not of MDPI and/or the editor(s). MDPI and/or the editor(s) disclaim responsibility for any injury to people or property resulting from any ideas, methods, instructions or products referred to in the content. |
© 2023 by the authors. Licensee MDPI, Basel, Switzerland. This article is an open access article distributed under the terms and conditions of the Creative Commons Attribution (CC BY) license (http://creativecommons.org/licenses/by/4.0/).
Copyright: This open access article is published under a Creative Commons CC BY 4.0 license, which permit the free download, distribution, and reuse, provided that the author and preprint are cited in any reuse.


